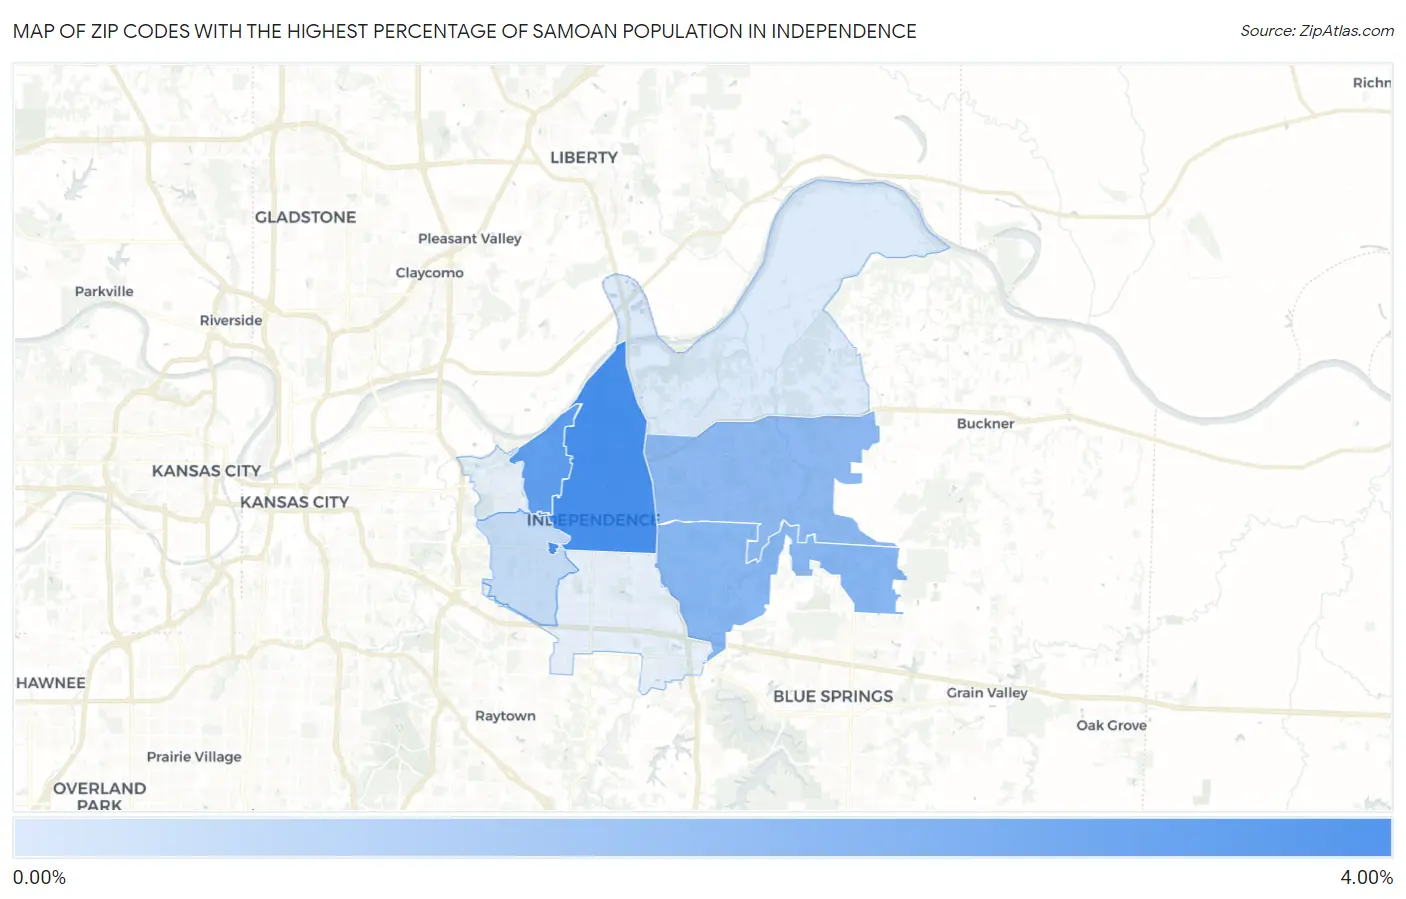
Zip Codes with the Highest Percentage of Samoan Population in Independence, MO
RELATED REPORTS & OPTIONS
Samoan
Independence
Compare Zip Codes
Map of Zip Codes with the Highest Percentage of Samoan Population in Independence
0.13%
3.22%
Zip Codes with the Highest Percentage of Samoan Population in Independence, MO
| Zip Code | Samoan | vs State | vs National | |
| 1. | 64050 | 3.22% | 0.069%(+3.15)#1 | 0.069%(+3.15)#43 |
| 2. | 64054 | 2.68% | 0.069%(+2.61)#2 | 0.069%(+2.61)#59 |
| 3. | 64057 | 1.86% | 0.069%(+1.79)#5 | 0.069%(+1.79)#101 |
| 4. | 64056 | 1.81% | 0.069%(+1.74)#6 | 0.069%(+1.74)#108 |
| 5. | 64052 | 0.61% | 0.069%(+0.542)#15 | 0.069%(+0.543)#453 |
| 6. | 64058 | 0.13% | 0.069%(+0.065)#44 | 0.069%(+0.066)#1,553 |
1
Common Questions
What are the Top 5 Zip Codes with the Highest Percentage of Samoan Population in Independence, MO?
Top 5 Zip Codes with the Highest Percentage of Samoan Population in Independence, MO are:
What zip code has the Highest Percentage of Samoan Population in Independence, MO?
64050 has the Highest Percentage of Samoan Population in Independence, MO with 3.22%.
What is the Percentage of Samoan Population in Independence, MO?
Percentage of Samoan Population in Independence is 1.17%.
What is the Percentage of Samoan Population in Missouri?
Percentage of Samoan Population in Missouri is 0.069%.
What is the Percentage of Samoan Population in the United States?
Percentage of Samoan Population in the United States is 0.069%.