Braymer, MO Map & Demographics
Braymer Map
Braymer Overview
$27,500
PER CAPITA INCOME
$58,125
AVG FAMILY INCOME
$54,750
AVG HOUSEHOLD INCOME
30.3%
WAGE / INCOME GAP [ % ]
69.7¢/ $1
WAGE / INCOME GAP [ $ ]
0.33
INEQUALITY / GINI INDEX
691
TOTAL POPULATION
347
MALE POPULATION
344
FEMALE POPULATION
100.87
MALES / 100 FEMALES
99.14
FEMALES / 100 MALES
47.6
MEDIAN AGE
2.7
AVG FAMILY SIZE
2.3
AVG HOUSEHOLD SIZE
344
LABOR FORCE [ PEOPLE ]
59.4%
PERCENT IN LABOR FORCE
2.0%
UNEMPLOYMENT RATE
Braymer Zip Codes
Braymer Area Codes
Income in Braymer
Income Overview in Braymer
Per Capita Income in Braymer is $27,500, while median incomes of families and households are $58,125 and $54,750 respectively.
| Characteristic | Number | Measure |
| Per Capita Income | 691 | $27,500 |
| Median Family Income | 180 | $58,125 |
| Mean Family Income | 180 | $64,437 |
| Median Household Income | 302 | $54,750 |
| Mean Household Income | 302 | $58,472 |
| Income Deficit | 180 | $0 |
| Wage / Income Gap (%) | 691 | 30.26% |
| Wage / Income Gap ($) | 691 | 69.74¢ per $1 |
| Gini / Inequality Index | 691 | 0.33 |
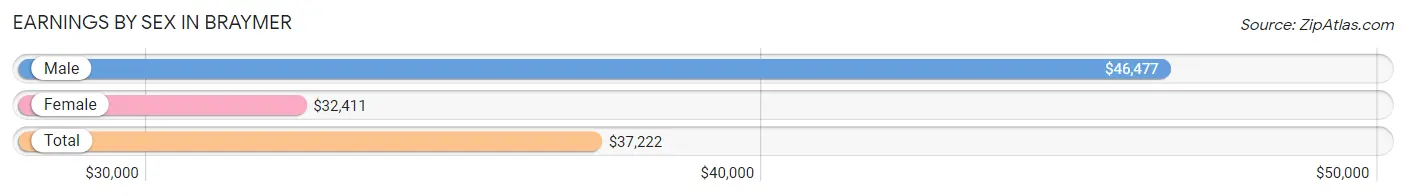
Earnings by Sex in Braymer
Average Earnings in Braymer are $37,222, $46,477 for men and $32,411 for women, a difference of 30.3%.
| Sex | Number | Average Earnings |
| Male | 167 (48.5%) | $46,477 |
| Female | 177 (51.4%) | $32,411 |
| Total | 344 (100.0%) | $37,222 |
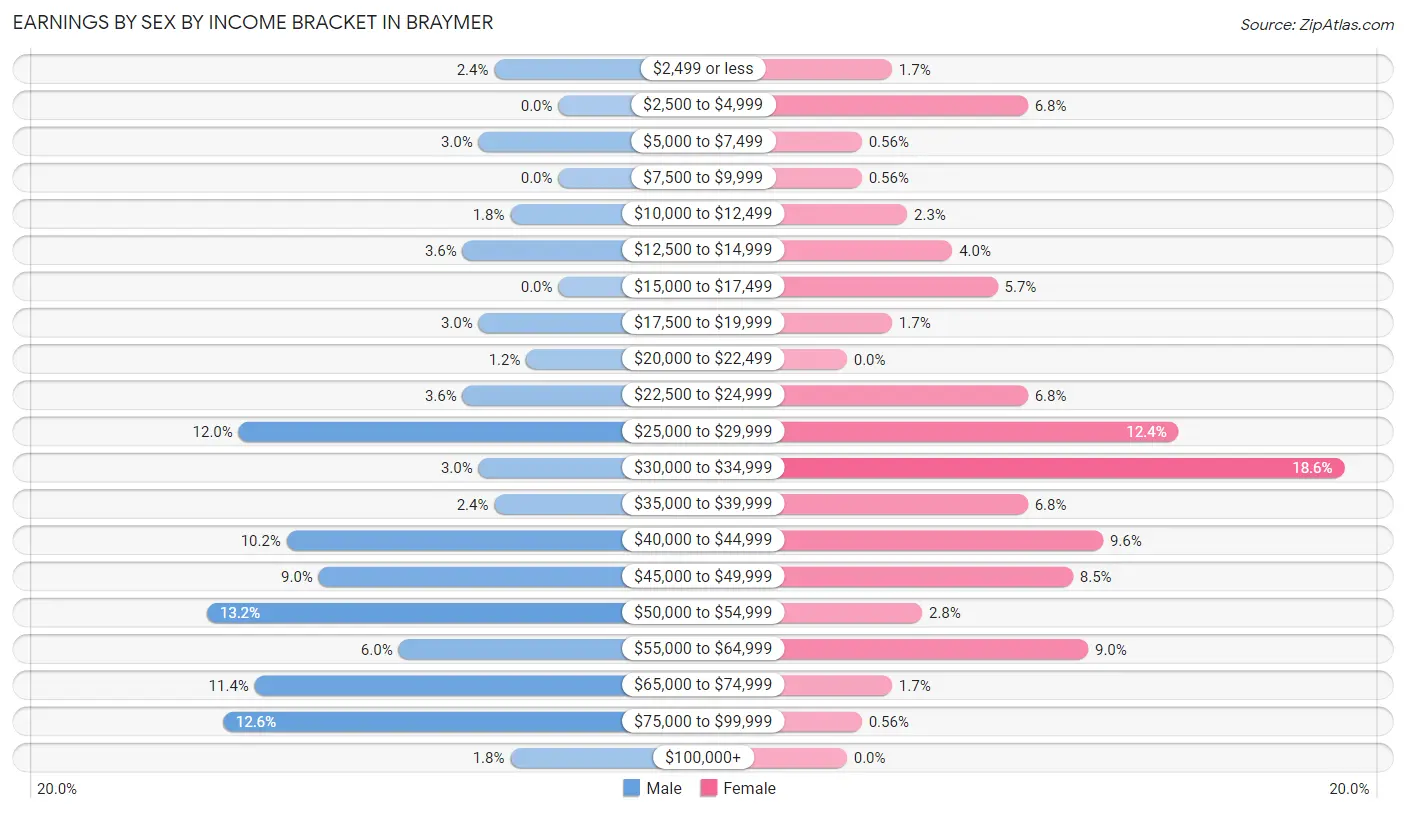
Earnings by Sex by Income Bracket in Braymer
The most common earnings brackets in Braymer are $50,000 to $54,999 for men (22 | 13.2%) and $30,000 to $34,999 for women (33 | 18.6%).
| Income | Male | Female |
| $2,499 or less | 4 (2.4%) | 3 (1.7%) |
| $2,500 to $4,999 | 0 (0.0%) | 12 (6.8%) |
| $5,000 to $7,499 | 5 (3.0%) | 1 (0.6%) |
| $7,500 to $9,999 | 0 (0.0%) | 1 (0.6%) |
| $10,000 to $12,499 | 3 (1.8%) | 4 (2.3%) |
| $12,500 to $14,999 | 6 (3.6%) | 7 (4.0%) |
| $15,000 to $17,499 | 0 (0.0%) | 10 (5.7%) |
| $17,500 to $19,999 | 5 (3.0%) | 3 (1.7%) |
| $20,000 to $22,499 | 2 (1.2%) | 0 (0.0%) |
| $22,500 to $24,999 | 6 (3.6%) | 12 (6.8%) |
| $25,000 to $29,999 | 20 (12.0%) | 22 (12.4%) |
| $30,000 to $34,999 | 5 (3.0%) | 33 (18.6%) |
| $35,000 to $39,999 | 4 (2.4%) | 12 (6.8%) |
| $40,000 to $44,999 | 17 (10.2%) | 17 (9.6%) |
| $45,000 to $49,999 | 15 (9.0%) | 15 (8.5%) |
| $50,000 to $54,999 | 22 (13.2%) | 5 (2.8%) |
| $55,000 to $64,999 | 10 (6.0%) | 16 (9.0%) |
| $65,000 to $74,999 | 19 (11.4%) | 3 (1.7%) |
| $75,000 to $99,999 | 21 (12.6%) | 1 (0.6%) |
| $100,000+ | 3 (1.8%) | 0 (0.0%) |
| Total | 167 (100.0%) | 177 (100.0%) |
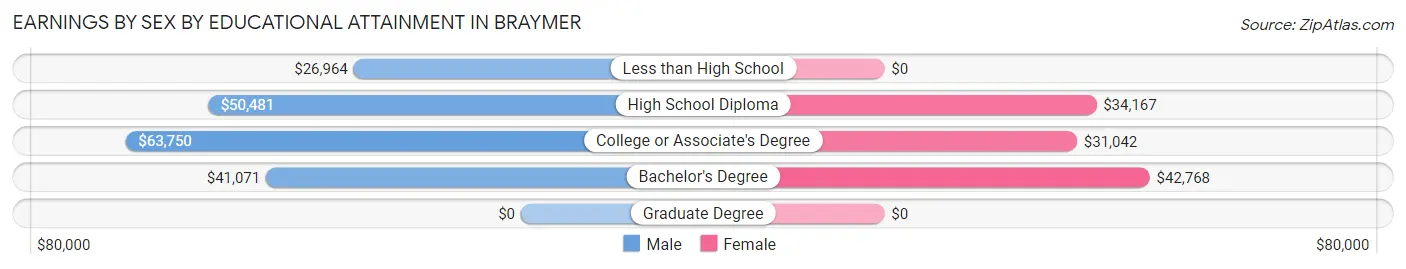
Earnings by Sex by Educational Attainment in Braymer
Average earnings in Braymer are $46,705 for men and $33,882 for women, a difference of 27.5%. Men with an educational attainment of college or associate's degree enjoy the highest average annual earnings of $63,750, while those with less than high school education earn the least with $26,964. Women with an educational attainment of bachelor's degree earn the most with the average annual earnings of $42,768, while those with college or associate's degree education have the smallest earnings of $31,042.
| Educational Attainment | Male Income | Female Income |
| Less than High School | $26,964 | $0 |
| High School Diploma | $50,481 | $34,167 |
| College or Associate's Degree | $63,750 | $31,042 |
| Bachelor's Degree | $41,071 | $42,768 |
| Graduate Degree | - | - |
| Total | $46,705 | $33,882 |
Family Income in Braymer
Family Income Brackets in Braymer
According to the Braymer family income data, there are 68 families falling into the $50,000 to $74,999 income range, which is the most common income bracket and makes up 37.8% of all families.
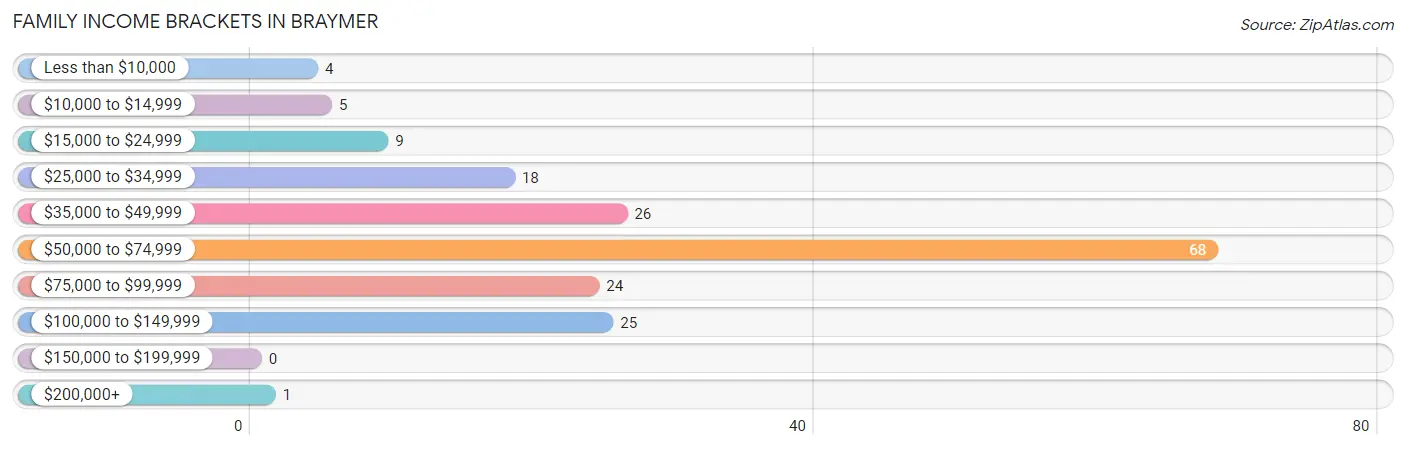
| Income Bracket | # Families | % Families |
| Less than $10,000 | 4 | 2.2% |
| $10,000 to $14,999 | 5 | 2.8% |
| $15,000 to $24,999 | 9 | 5.0% |
| $25,000 to $34,999 | 18 | 10.0% |
| $35,000 to $49,999 | 26 | 14.4% |
| $50,000 to $74,999 | 68 | 37.8% |
| $75,000 to $99,999 | 24 | 13.3% |
| $100,000 to $149,999 | 25 | 13.9% |
| $150,000 to $199,999 | 0 | 0.0% |
| $200,000+ | 1 | 0.6% |
Family Income by Famaliy Size in Braymer
3-person families (26 | 14.4%) account for the highest median family income in Braymer with $81,250 per family, while 2-person families (129 | 71.7%) have the highest median income of $29,010 per family member.
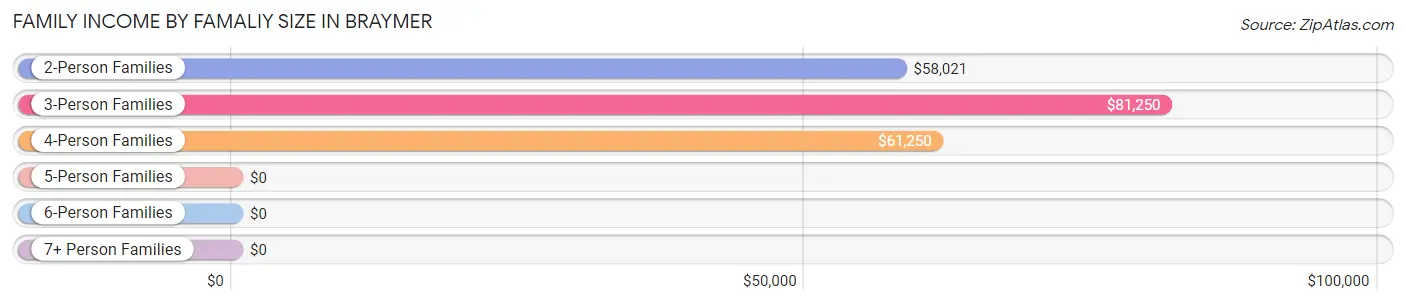
| Income Bracket | # Families | Median Income |
| 2-Person Families | 129 (71.7%) | $58,021 |
| 3-Person Families | 26 (14.4%) | $81,250 |
| 4-Person Families | 12 (6.7%) | $61,250 |
| 5-Person Families | 10 (5.6%) | $0 |
| 6-Person Families | 3 (1.7%) | $0 |
| 7+ Person Families | 0 (0.0%) | $0 |
| Total | 180 (100.0%) | $58,125 |
Family Income by Number of Earners in Braymer
The median family income in Braymer is $58,125, with families comprising 3+ earners (7) having the highest median family income of $104,375, while families with no earners (31) have the lowest median family income of $44,688, accounting for 3.9% and 17.2% of families, respectively.
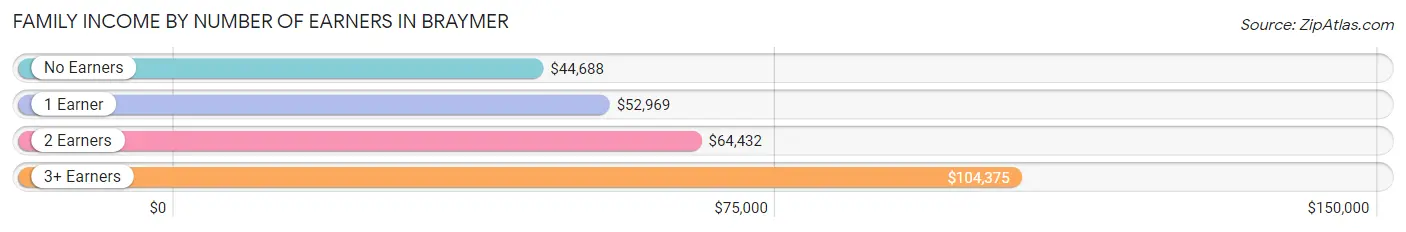
| Number of Earners | # Families | Median Income |
| No Earners | 31 (17.2%) | $44,688 |
| 1 Earner | 73 (40.6%) | $52,969 |
| 2 Earners | 69 (38.3%) | $64,432 |
| 3+ Earners | 7 (3.9%) | $104,375 |
| Total | 180 (100.0%) | $58,125 |
Household Income in Braymer
Household Income Brackets in Braymer
With 80 households falling in the category, the $50,000 to $74,999 income range is the most frequent in Braymer, accounting for 26.5% of all households.
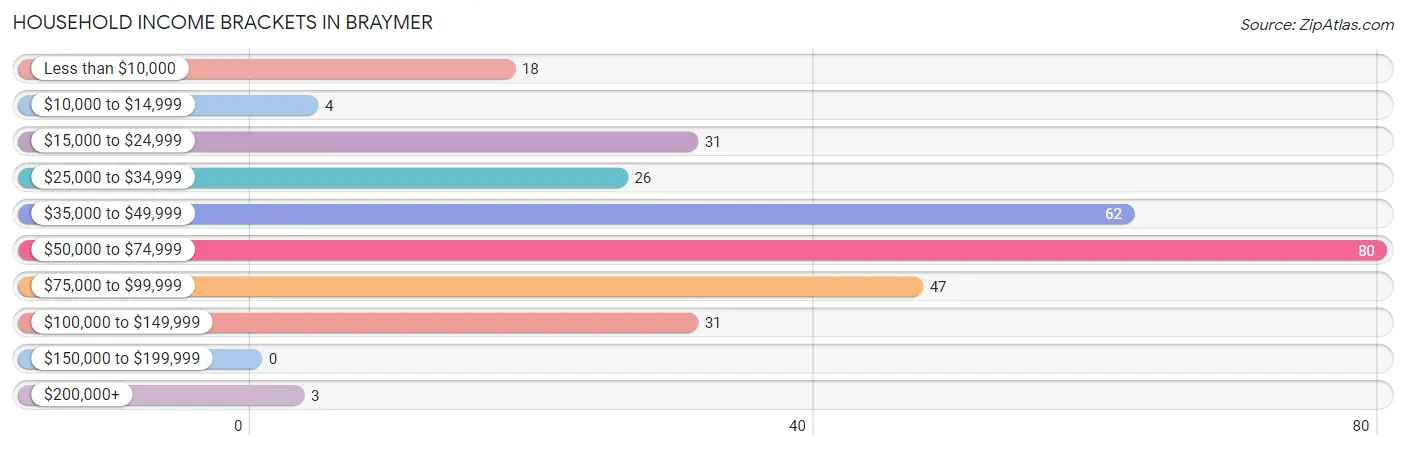
| Income Bracket | # Households | % Households |
| Less than $10,000 | 18 | 6.0% |
| $10,000 to $14,999 | 4 | 1.3% |
| $15,000 to $24,999 | 31 | 10.3% |
| $25,000 to $34,999 | 26 | 8.6% |
| $35,000 to $49,999 | 62 | 20.5% |
| $50,000 to $74,999 | 80 | 26.5% |
| $75,000 to $99,999 | 47 | 15.6% |
| $100,000 to $149,999 | 31 | 10.3% |
| $150,000 to $199,999 | 0 | 0.0% |
| $200,000+ | 3 | 1.0% |
Household Income by Householder Age in Braymer
The median household income in Braymer is $54,750, with the highest median household income of $64,167 found in the 15 to 24 years age bracket for the primary householder. A total of 26 households (8.6%) fall into this category. Meanwhile, the 65+ years age bracket for the primary householder has the lowest median household income of $37,708, with 110 households (36.4%) in this group.
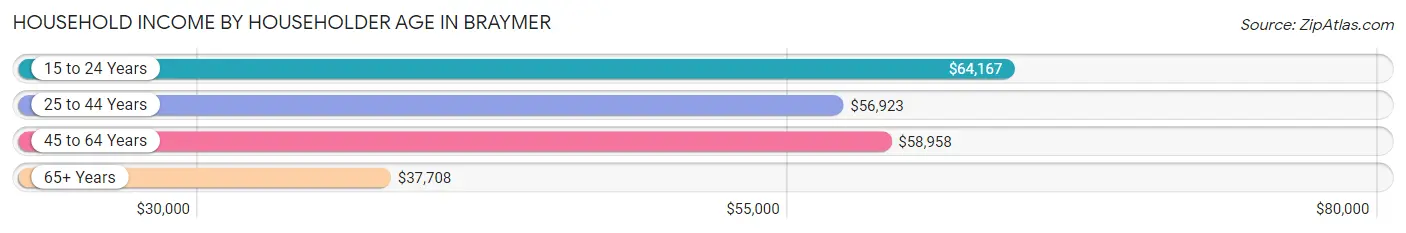
| Income Bracket | # Households | Median Income |
| 15 to 24 Years | 26 (8.6%) | $64,167 |
| 25 to 44 Years | 50 (16.6%) | $56,923 |
| 45 to 64 Years | 116 (38.4%) | $58,958 |
| 65+ Years | 110 (36.4%) | $37,708 |
| Total | 302 (100.0%) | $54,750 |
Poverty in Braymer
Income Below Poverty by Sex and Age in Braymer
With 4.9% poverty level for males and 18.9% for females among the residents of Braymer, under 5 year old males and under 5 year old females are the most vulnerable to poverty, with 5 males (15.6%) and 3 females (60.0%) in their respective age groups living below the poverty level.
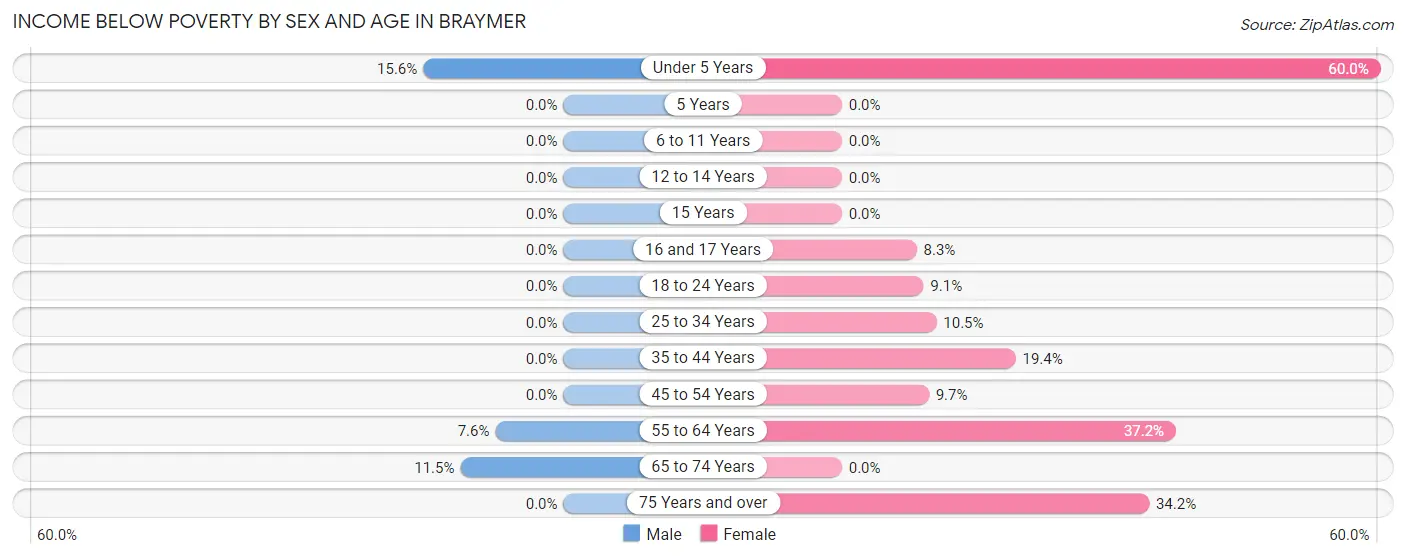
| Age Bracket | Male | Female |
| Under 5 Years | 5 (15.6%) | 3 (60.0%) |
| 5 Years | 0 (0.0%) | 0 (0.0%) |
| 6 to 11 Years | 0 (0.0%) | 0 (0.0%) |
| 12 to 14 Years | 0 (0.0%) | 0 (0.0%) |
| 15 Years | 0 (0.0%) | 0 (0.0%) |
| 16 and 17 Years | 0 (0.0%) | 1 (8.3%) |
| 18 to 24 Years | 0 (0.0%) | 3 (9.1%) |
| 25 to 34 Years | 0 (0.0%) | 4 (10.5%) |
| 35 to 44 Years | 0 (0.0%) | 6 (19.4%) |
| 45 to 54 Years | 0 (0.0%) | 3 (9.7%) |
| 55 to 64 Years | 5 (7.6%) | 32 (37.2%) |
| 65 to 74 Years | 7 (11.5%) | 0 (0.0%) |
| 75 Years and over | 0 (0.0%) | 13 (34.2%) |
| Total | 17 (4.9%) | 65 (18.9%) |
Income Above Poverty by Sex and Age in Braymer
According to the poverty statistics in Braymer, males aged 5 years and females aged 5 years are the age groups that are most secure financially, with 100.0% of males and 100.0% of females in these age groups living above the poverty line.
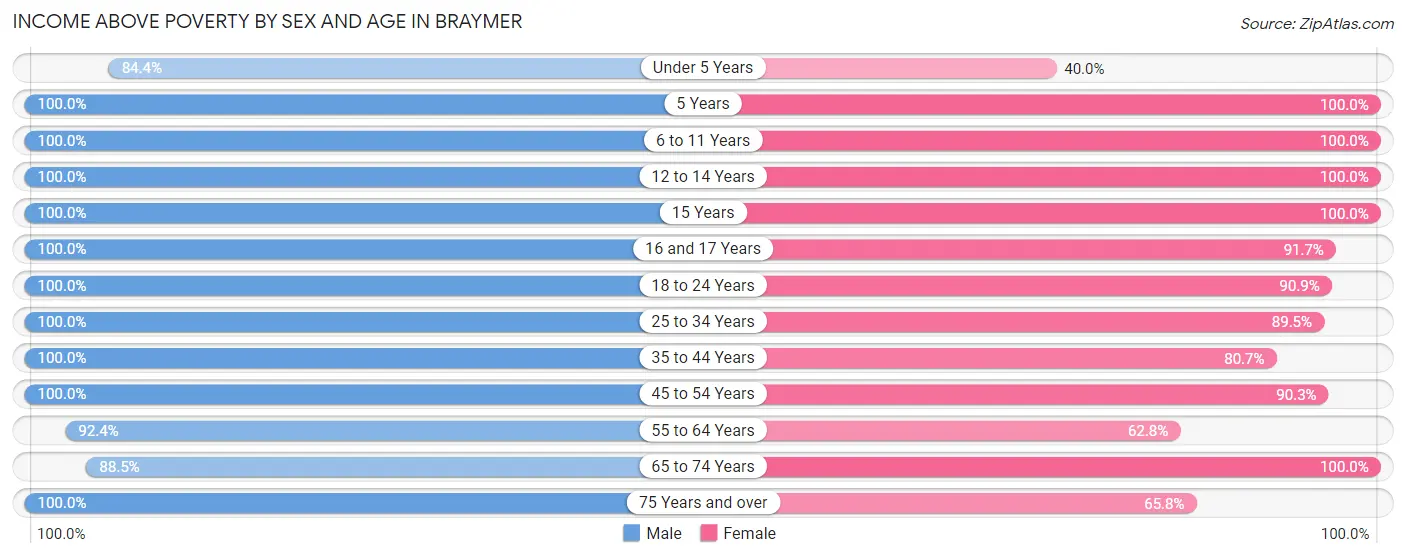
| Age Bracket | Male | Female |
| Under 5 Years | 27 (84.4%) | 2 (40.0%) |
| 5 Years | 3 (100.0%) | 1 (100.0%) |
| 6 to 11 Years | 20 (100.0%) | 28 (100.0%) |
| 12 to 14 Years | 13 (100.0%) | 4 (100.0%) |
| 15 Years | 3 (100.0%) | 3 (100.0%) |
| 16 and 17 Years | 1 (100.0%) | 11 (91.7%) |
| 18 to 24 Years | 39 (100.0%) | 30 (90.9%) |
| 25 to 34 Years | 27 (100.0%) | 34 (89.5%) |
| 35 to 44 Years | 26 (100.0%) | 25 (80.6%) |
| 45 to 54 Years | 44 (100.0%) | 28 (90.3%) |
| 55 to 64 Years | 61 (92.4%) | 54 (62.8%) |
| 65 to 74 Years | 54 (88.5%) | 34 (100.0%) |
| 75 Years and over | 12 (100.0%) | 25 (65.8%) |
| Total | 330 (95.1%) | 279 (81.1%) |
Income Below Poverty Among Married-Couple Families in Braymer
The poverty statistics for married-couple families in Braymer show that 2.4% or 3 of the total 123 families live below the poverty line. Families with 1 or 2 children have the highest poverty rate of 3.6%, comprising of 1 families. On the other hand, families with 3 or 4 children have the lowest poverty rate of 0.0%, which includes 0 families.
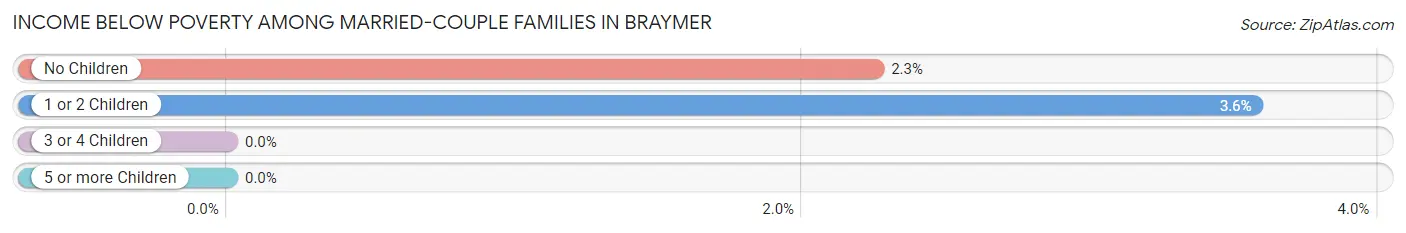
| Children | Above Poverty | Below Poverty |
| No Children | 87 (97.8%) | 2 (2.2%) |
| 1 or 2 Children | 27 (96.4%) | 1 (3.6%) |
| 3 or 4 Children | 6 (100.0%) | 0 (0.0%) |
| 5 or more Children | 0 (0.0%) | 0 (0.0%) |
| Total | 120 (97.6%) | 3 (2.4%) |
Income Below Poverty Among Single-Parent Households in Braymer
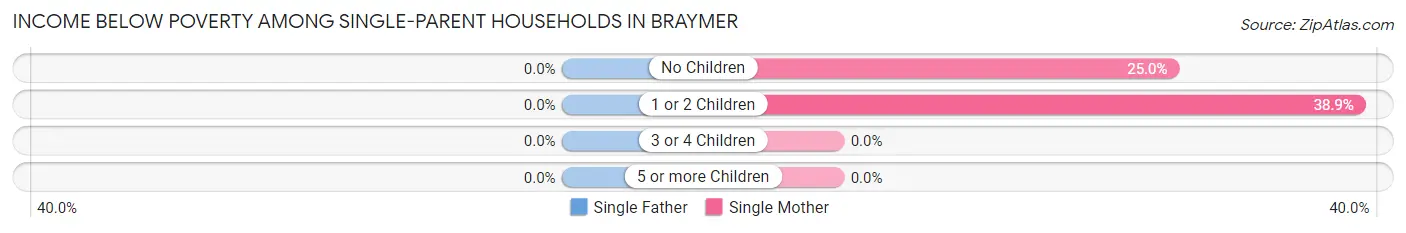
| Children | Single Father | Single Mother |
| No Children | 0 (0.0%) | 2 (25.0%) |
| 1 or 2 Children | 0 (0.0%) | 7 (38.9%) |
| 3 or 4 Children | 0 (0.0%) | 0 (0.0%) |
| 5 or more Children | 0 (0.0%) | 0 (0.0%) |
| Total | 0 (0.0%) | 9 (27.3%) |
Income Below Poverty Among Married-Couple vs Single-Parent Households in Braymer
The poverty data for Braymer shows that 3 of the married-couple family households (2.4%) and 9 of the single-parent households (15.8%) are living below the poverty level. Within the married-couple family households, those with 1 or 2 children have the highest poverty rate, with 1 households (3.6%) falling below the poverty line. Among the single-parent households, those with 1 or 2 children have the highest poverty rate, with 7 household (22.6%) living below poverty.
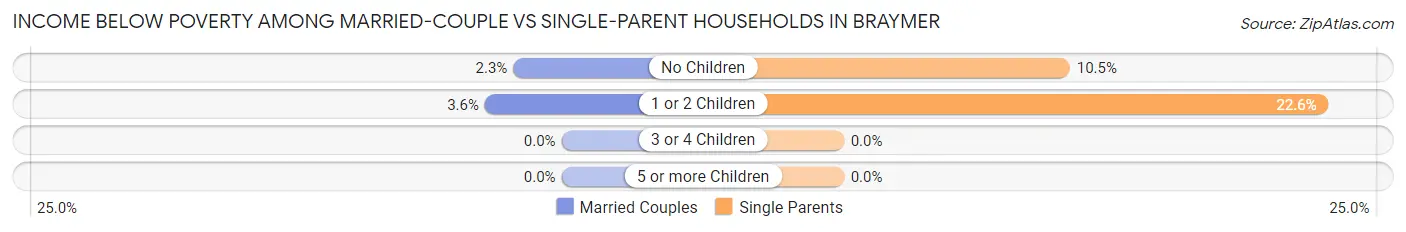
| Children | Married-Couple Families | Single-Parent Households |
| No Children | 2 (2.2%) | 2 (10.5%) |
| 1 or 2 Children | 1 (3.6%) | 7 (22.6%) |
| 3 or 4 Children | 0 (0.0%) | 0 (0.0%) |
| 5 or more Children | 0 (0.0%) | 0 (0.0%) |
| Total | 3 (2.4%) | 9 (15.8%) |
Race in Braymer
The most populous races in Braymer are White / Caucasian (666 | 96.4%), Two or more Races (22 | 3.2%), and Some other Race (3 | 0.4%).
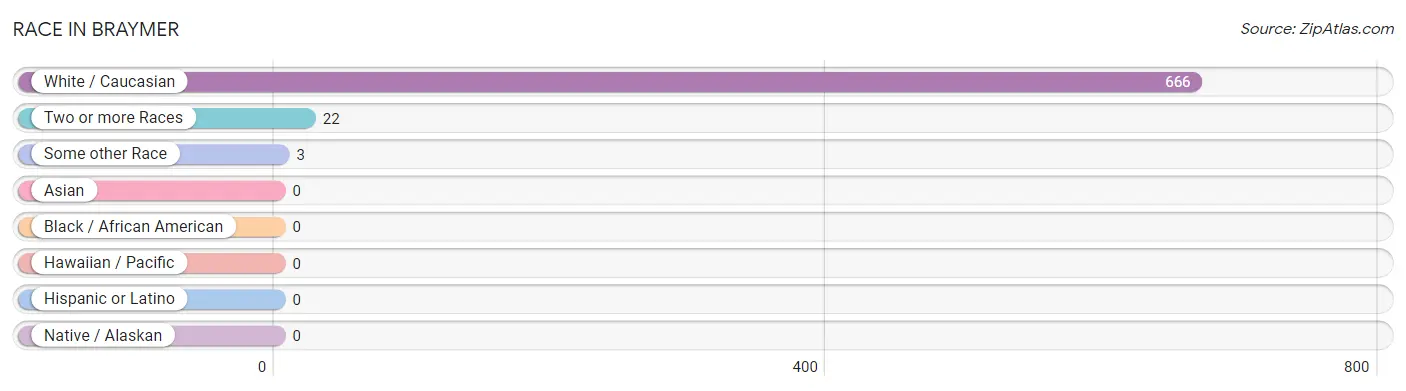
| Race | # Population | % Population |
| Asian | 0 | 0.0% |
| Black / African American | 0 | 0.0% |
| Hawaiian / Pacific | 0 | 0.0% |
| Hispanic or Latino | 0 | 0.0% |
| Native / Alaskan | 0 | 0.0% |
| White / Caucasian | 666 | 96.4% |
| Two or more Races | 22 | 3.2% |
| Some other Race | 3 | 0.4% |
| Total | 691 | 100.0% |
Ancestry in Braymer
The most populous ancestries reported in Braymer are English (101 | 14.6%), American (96 | 13.9%), German (64 | 9.3%), Irish (61 | 8.8%), and Welsh (23 | 3.3%), together accounting for 49.9% of all Braymer residents.
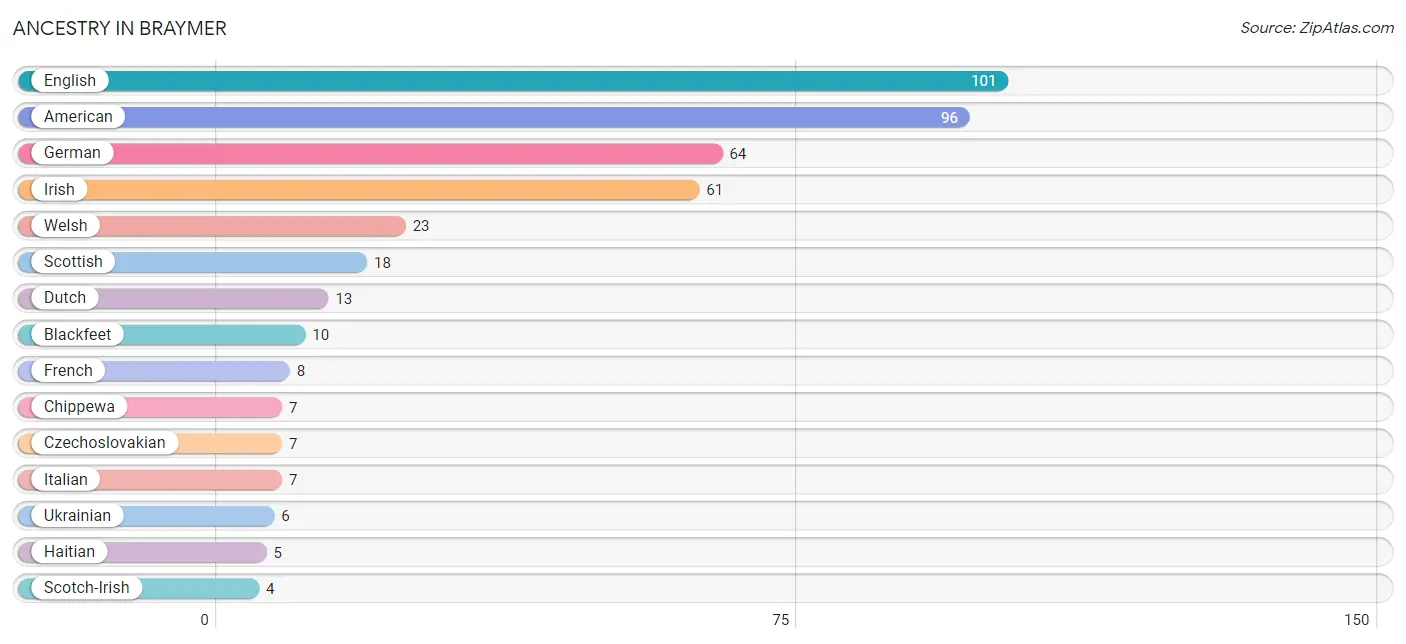
| Ancestry | # Population | % Population |
| American | 96 | 13.9% |
| Blackfeet | 10 | 1.5% |
| Canadian | 2 | 0.3% |
| Chippewa | 7 | 1.0% |
| Czechoslovakian | 7 | 1.0% |
| Danish | 3 | 0.4% |
| Dutch | 13 | 1.9% |
| English | 101 | 14.6% |
| French | 8 | 1.2% |
| German | 64 | 9.3% |
| Haitian | 5 | 0.7% |
| Irish | 61 | 8.8% |
| Italian | 7 | 1.0% |
| Polish | 2 | 0.3% |
| Scotch-Irish | 4 | 0.6% |
| Scottish | 18 | 2.6% |
| Swedish | 3 | 0.4% |
| Ukrainian | 6 | 0.9% |
| Welsh | 23 | 3.3% | View All 19 Rows |
Immigrants in Braymer

| Immigration Origin | # Population | % Population | View All 0 Rows |
Sex and Age in Braymer
Sex and Age in Braymer
The most populous age groups in Braymer are 55 to 59 Years (40 | 11.5%) for men and 60 to 64 Years (58 | 16.9%) for women.
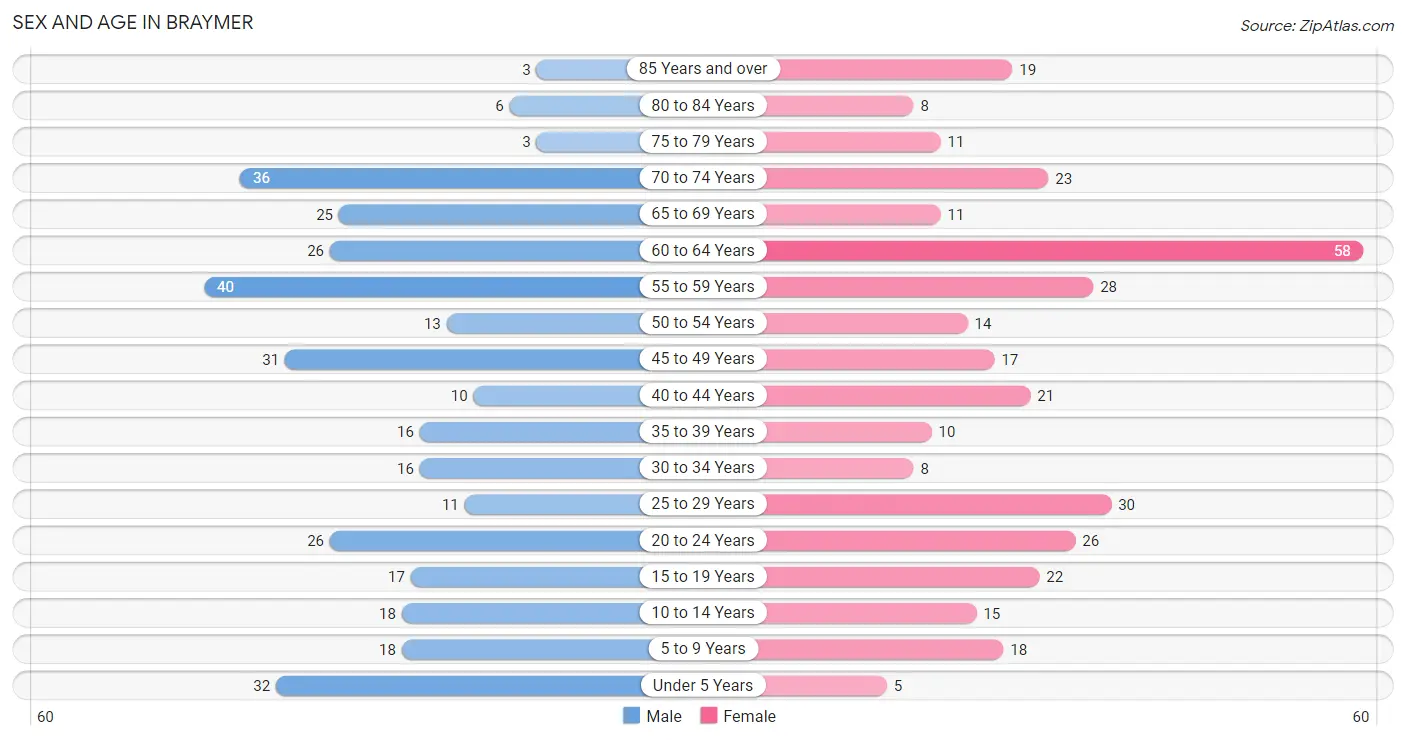
| Age Bracket | Male | Female |
| Under 5 Years | 32 (9.2%) | 5 (1.5%) |
| 5 to 9 Years | 18 (5.2%) | 18 (5.2%) |
| 10 to 14 Years | 18 (5.2%) | 15 (4.4%) |
| 15 to 19 Years | 17 (4.9%) | 22 (6.4%) |
| 20 to 24 Years | 26 (7.5%) | 26 (7.6%) |
| 25 to 29 Years | 11 (3.2%) | 30 (8.7%) |
| 30 to 34 Years | 16 (4.6%) | 8 (2.3%) |
| 35 to 39 Years | 16 (4.6%) | 10 (2.9%) |
| 40 to 44 Years | 10 (2.9%) | 21 (6.1%) |
| 45 to 49 Years | 31 (8.9%) | 17 (4.9%) |
| 50 to 54 Years | 13 (3.7%) | 14 (4.1%) |
| 55 to 59 Years | 40 (11.5%) | 28 (8.1%) |
| 60 to 64 Years | 26 (7.5%) | 58 (16.9%) |
| 65 to 69 Years | 25 (7.2%) | 11 (3.2%) |
| 70 to 74 Years | 36 (10.4%) | 23 (6.7%) |
| 75 to 79 Years | 3 (0.9%) | 11 (3.2%) |
| 80 to 84 Years | 6 (1.7%) | 8 (2.3%) |
| 85 Years and over | 3 (0.9%) | 19 (5.5%) |
| Total | 347 (100.0%) | 344 (100.0%) |
Families and Households in Braymer
Median Family Size in Braymer
The median family size in Braymer is 2.69 persons per family, with single female/mother families (33 | 18.3%) accounting for the largest median family size of 3.55 persons per family. On the other hand, single male/father families (24 | 13.3%) represent the smallest median family size with 2.42 persons per family.
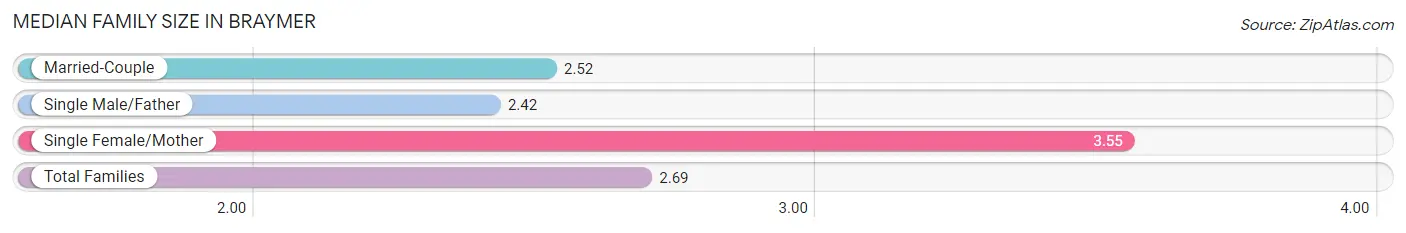
| Family Type | # Families | Family Size |
| Married-Couple | 123 (68.3%) | 2.52 |
| Single Male/Father | 24 (13.3%) | 2.42 |
| Single Female/Mother | 33 (18.3%) | 3.55 |
| Total Families | 180 (100.0%) | 2.69 |
Median Household Size in Braymer
The median household size in Braymer is 2.29 persons per household, with single female/mother households (33 | 10.9%) accounting for the largest median household size of 3.91 persons per household. non-family households (122 | 40.4%) represent the smallest median household size with 1.47 persons per household.
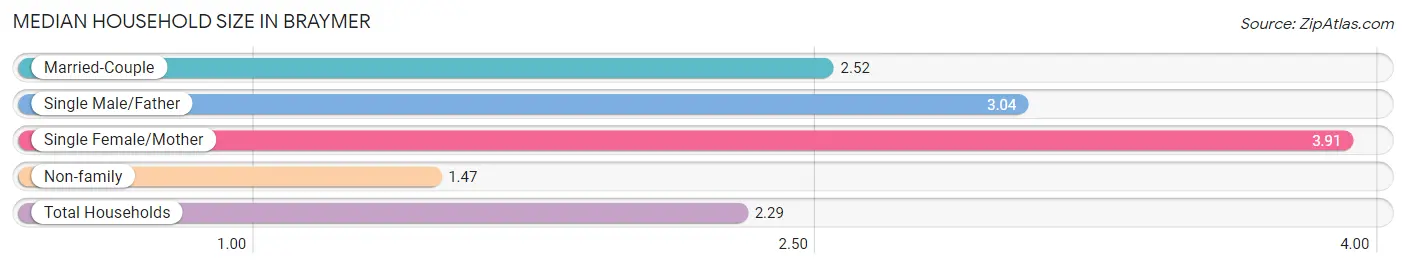
| Household Type | # Households | Household Size |
| Married-Couple | 123 (40.7%) | 2.52 |
| Single Male/Father | 24 (8.0%) | 3.04 |
| Single Female/Mother | 33 (10.9%) | 3.91 |
| Non-family | 122 (40.4%) | 1.47 |
| Total Households | 302 (100.0%) | 2.29 |
Household Size by Marriage Status in Braymer
Out of a total of 302 households in Braymer, 180 (59.6%) are family households, while 122 (40.4%) are nonfamily households. The most numerous type of family households are 2-person households, comprising 103, and the most common type of nonfamily households are 1-person households, comprising 90.
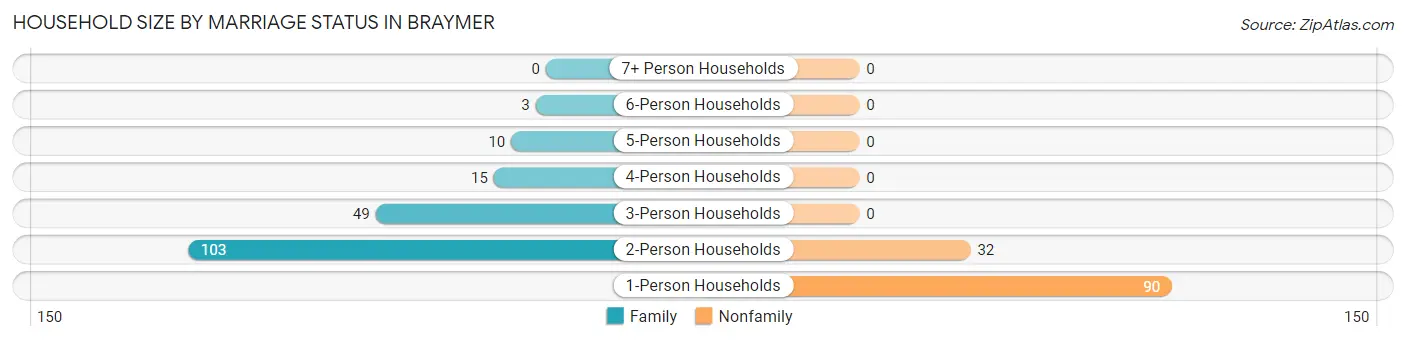
| Household Size | Family Households | Nonfamily Households |
| 1-Person Households | - | 90 (29.8%) |
| 2-Person Households | 103 (34.1%) | 32 (10.6%) |
| 3-Person Households | 49 (16.2%) | 0 (0.0%) |
| 4-Person Households | 15 (5.0%) | 0 (0.0%) |
| 5-Person Households | 10 (3.3%) | 0 (0.0%) |
| 6-Person Households | 3 (1.0%) | 0 (0.0%) |
| 7+ Person Households | 0 (0.0%) | 0 (0.0%) |
| Total | 180 (59.6%) | 122 (40.4%) |
Female Fertility in Braymer
Fertility by Age in Braymer
| Age Bracket | Women with Births | Births / 1,000 Women |
| 15 to 19 years | 0 (0.0%) | 0.0 |
| 20 to 34 years | 0 (0.0%) | 0.0 |
| 35 to 50 years | 0 (0.0%) | 0.0 |
| Total | 0 (0.0%) | 0.0 |
Fertility by Age by Marriage Status in Braymer
| Age Bracket | Married | Unmarried |
| 15 to 19 years | 0 (0.0%) | 0 (0.0%) |
| 20 to 34 years | 0 (0.0%) | 0 (0.0%) |
| 35 to 50 years | 0 (0.0%) | 0 (0.0%) |
| Total | 0 (0.0%) | 0 (0.0%) |
Fertility by Education in Braymer
| Educational Attainment | Women with Births | Births / 1,000 Women |
| Less than High School | 0 (0.0%) | 0.0 |
| High School Diploma | 0 (0.0%) | 0.0 |
| College or Associate's Degree | 0 (0.0%) | 0.0 |
| Bachelor's Degree | 0 (0.0%) | 0.0 |
| Graduate Degree | 0 (0.0%) | 0.0 |
| Total | 0 (0.0%) | 0.0 |
Fertility by Education by Marriage Status in Braymer
| Educational Attainment | Married | Unmarried |
| Less than High School | 0 (0.0%) | 0 (0.0%) |
| High School Diploma | 0 (0.0%) | 0 (0.0%) |
| College or Associate's Degree | 0 (0.0%) | 0 (0.0%) |
| Bachelor's Degree | 0 (0.0%) | 0 (0.0%) |
| Graduate Degree | 0 (0.0%) | 0 (0.0%) |
| Total | 0 (0.0%) | 0 (0.0%) |
Employment Characteristics in Braymer
Employment by Class of Employer in Braymer
Among the 337 employed individuals in Braymer, private company employees (197 | 58.5%), local government employees (54 | 16.0%), and self-employed (not incorporated) (49 | 14.5%) make up the most common classes of employment.

| Employer Class | # Employees | % Employees |
| Private Company Employees | 197 | 58.5% |
| Self-Employed (Incorporated) | 4 | 1.2% |
| Self-Employed (Not Incorporated) | 49 | 14.5% |
| Not-for-profit Organizations | 20 | 5.9% |
| Local Government Employees | 54 | 16.0% |
| State Government Employees | 11 | 3.3% |
| Federal Government Employees | 2 | 0.6% |
| Unpaid Family Workers | 0 | 0.0% |
| Total | 337 | 100.0% |
Employment Status by Age in Braymer
According to the labor force statistics for Braymer, out of the total population over 16 years of age (579), 59.4% or 344 individuals are in the labor force, with 2.0% or 7 of them unemployed. The age group with the highest labor force participation rate is 45 to 54 years, with 90.7% or 68 individuals in the labor force. Within the labor force, the 35 to 44 years age range has the highest percentage of unemployed individuals, with 6.3% or 3 of them being unemployed.
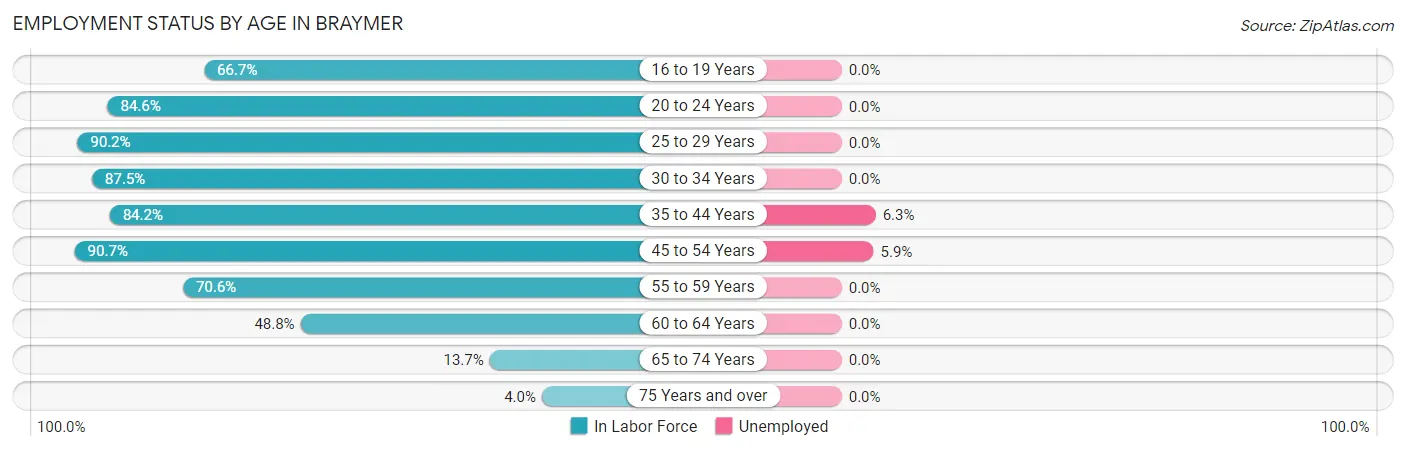
| Age Bracket | In Labor Force | Unemployed |
| 16 to 19 Years | 22 (66.7%) | 0 (0.0%) |
| 20 to 24 Years | 44 (84.6%) | 0 (0.0%) |
| 25 to 29 Years | 37 (90.2%) | 0 (0.0%) |
| 30 to 34 Years | 21 (87.5%) | 0 (0.0%) |
| 35 to 44 Years | 48 (84.2%) | 3 (6.3%) |
| 45 to 54 Years | 68 (90.7%) | 4 (5.9%) |
| 55 to 59 Years | 48 (70.6%) | 0 (0.0%) |
| 60 to 64 Years | 41 (48.8%) | 0 (0.0%) |
| 65 to 74 Years | 13 (13.7%) | 0 (0.0%) |
| 75 Years and over | 2 (4.0%) | 0 (0.0%) |
| Total | 344 (59.4%) | 7 (2.0%) |
Employment Status by Educational Attainment in Braymer
According to labor force statistics for Braymer, 75.4% of individuals (263) out of the total population between 25 and 64 years of age (349) are in the labor force, with 2.7% or 7 of them being unemployed. The group with the highest labor force participation rate are those with the educational attainment of bachelor's degree or higher, with 93.2% or 41 individuals in the labor force. Within the labor force, individuals with college / associate degree education have the highest percentage of unemployment, with 4.5% or 3 of them being unemployed.
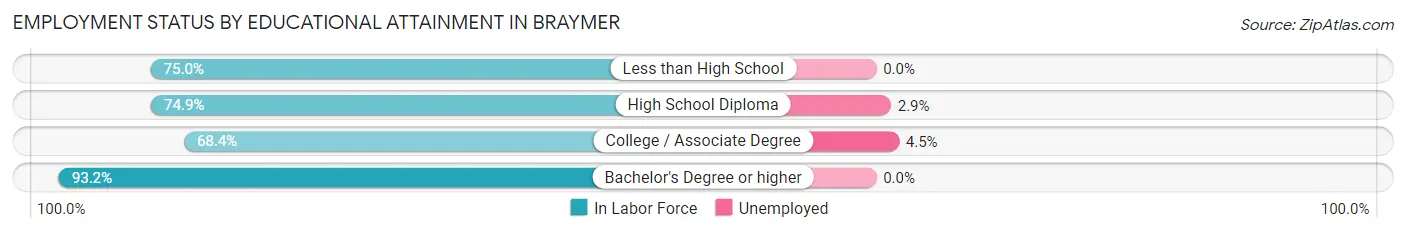
| Educational Attainment | In Labor Force | Unemployed |
| Less than High School | 18 (75.0%) | 0 (0.0%) |
| High School Diploma | 137 (74.9%) | 5 (2.9%) |
| College / Associate Degree | 67 (68.4%) | 4 (4.5%) |
| Bachelor's Degree or higher | 41 (93.2%) | 0 (0.0%) |
| Total | 263 (75.4%) | 9 (2.7%) |
Employment Occupations by Sex in Braymer
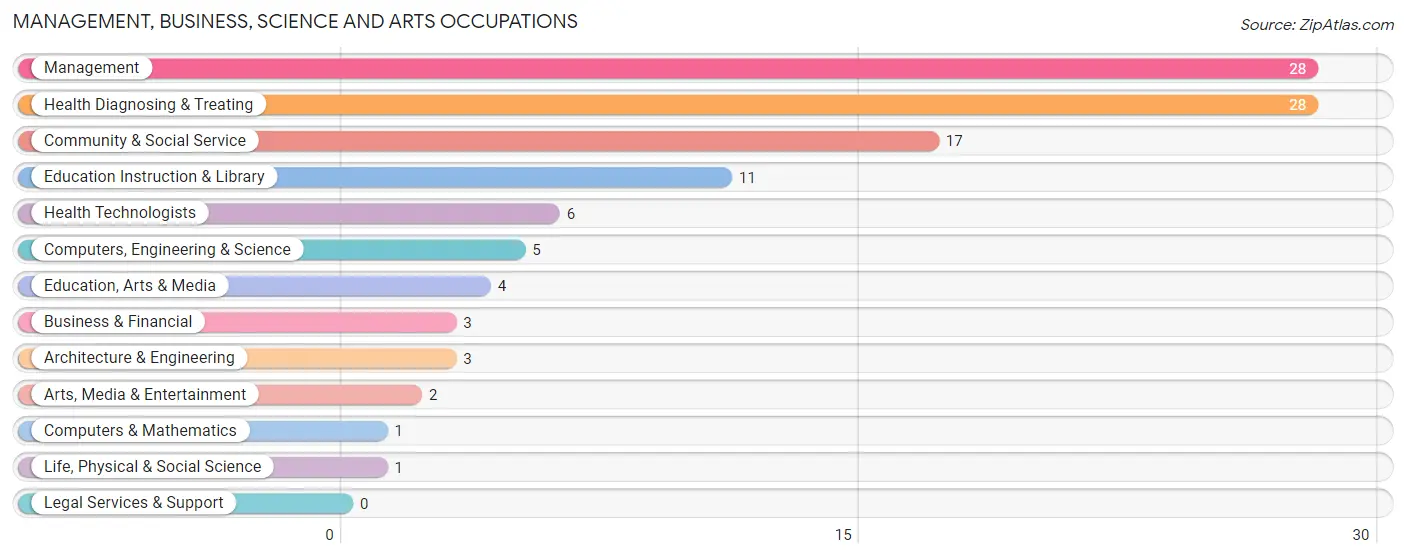
Management, Business, Science and Arts Occupations
The most common Management, Business, Science and Arts occupations in Braymer are Management (28 | 8.3%), Health Diagnosing & Treating (28 | 8.3%), Community & Social Service (17 | 5.0%), Education Instruction & Library (11 | 3.3%), and Health Technologists (6 | 1.8%).
Management, Business, Science and Arts Occupations by Sex
Within the Management, Business, Science and Arts occupations in Braymer, the most male-oriented occupations are Life, Physical & Social Science (100.0%), Management (64.3%), and Education, Arts & Media (50.0%), while the most female-oriented occupations are Business & Financial (100.0%), Computers & Mathematics (100.0%), and Education Instruction & Library (100.0%).
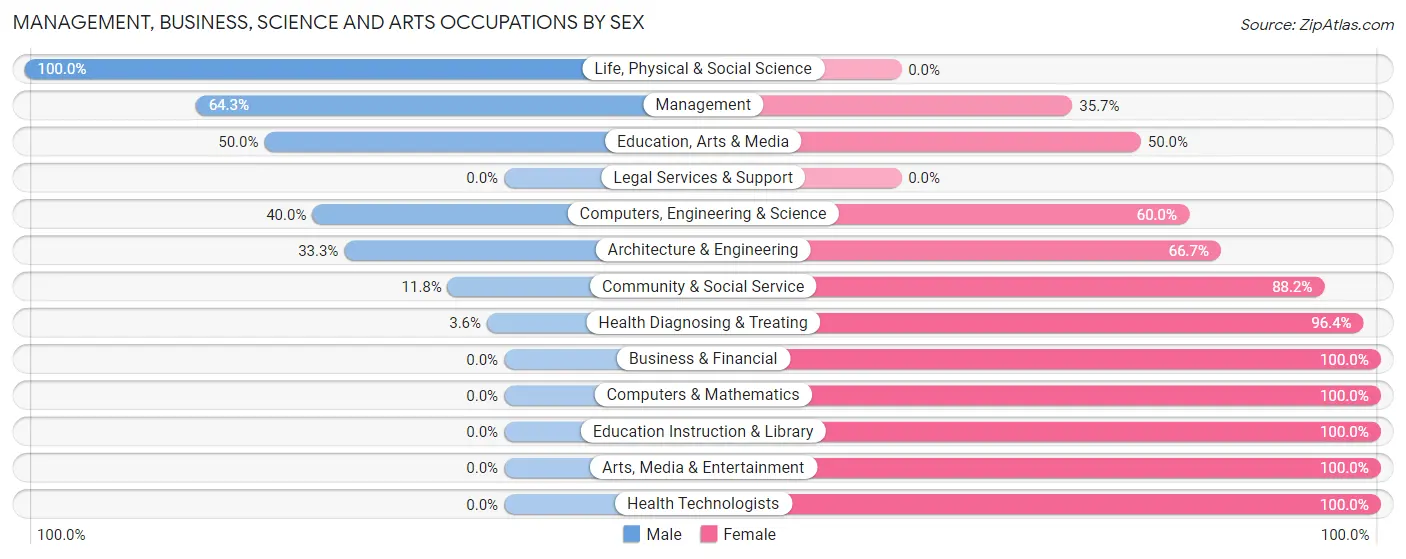
| Occupation | Male | Female |
| Management | 18 (64.3%) | 10 (35.7%) |
| Business & Financial | 0 (0.0%) | 3 (100.0%) |
| Computers, Engineering & Science | 2 (40.0%) | 3 (60.0%) |
| Computers & Mathematics | 0 (0.0%) | 1 (100.0%) |
| Architecture & Engineering | 1 (33.3%) | 2 (66.7%) |
| Life, Physical & Social Science | 1 (100.0%) | 0 (0.0%) |
| Community & Social Service | 2 (11.8%) | 15 (88.2%) |
| Education, Arts & Media | 2 (50.0%) | 2 (50.0%) |
| Legal Services & Support | 0 (0.0%) | 0 (0.0%) |
| Education Instruction & Library | 0 (0.0%) | 11 (100.0%) |
| Arts, Media & Entertainment | 0 (0.0%) | 2 (100.0%) |
| Health Diagnosing & Treating | 1 (3.6%) | 27 (96.4%) |
| Health Technologists | 0 (0.0%) | 6 (100.0%) |
| Total (Category) | 23 (28.4%) | 58 (71.6%) |
| Total (Overall) | 162 (48.1%) | 175 (51.9%) |
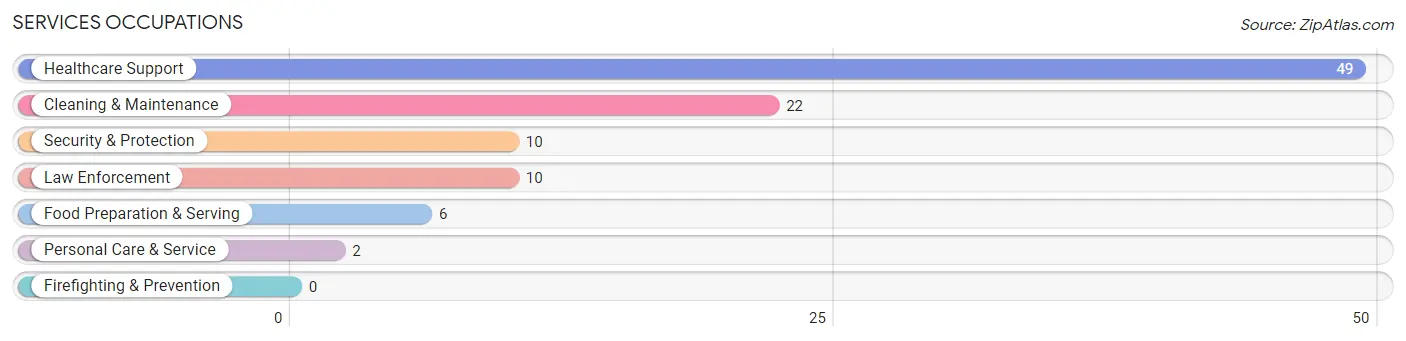
Services Occupations
The most common Services occupations in Braymer are Healthcare Support (49 | 14.5%), Cleaning & Maintenance (22 | 6.5%), Security & Protection (10 | 3.0%), Law Enforcement (10 | 3.0%), and Food Preparation & Serving (6 | 1.8%).
Services Occupations by Sex
Within the Services occupations in Braymer, the most male-oriented occupations are Personal Care & Service (100.0%), Food Preparation & Serving (50.0%), and Healthcare Support (10.2%), while the most female-oriented occupations are Security & Protection (100.0%), Law Enforcement (100.0%), and Cleaning & Maintenance (100.0%).
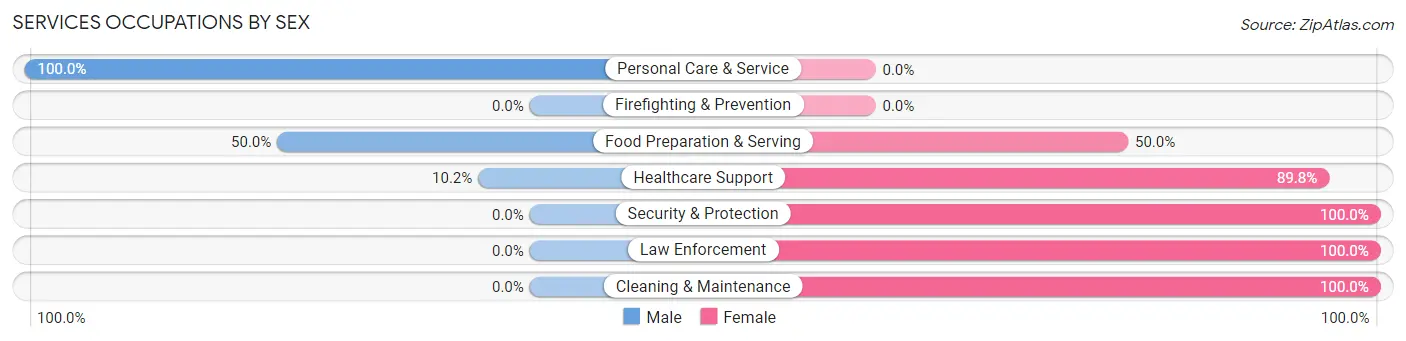
| Occupation | Male | Female |
| Healthcare Support | 5 (10.2%) | 44 (89.8%) |
| Security & Protection | 0 (0.0%) | 10 (100.0%) |
| Firefighting & Prevention | 0 (0.0%) | 0 (0.0%) |
| Law Enforcement | 0 (0.0%) | 10 (100.0%) |
| Food Preparation & Serving | 3 (50.0%) | 3 (50.0%) |
| Cleaning & Maintenance | 0 (0.0%) | 22 (100.0%) |
| Personal Care & Service | 2 (100.0%) | 0 (0.0%) |
| Total (Category) | 10 (11.2%) | 79 (88.8%) |
| Total (Overall) | 162 (48.1%) | 175 (51.9%) |
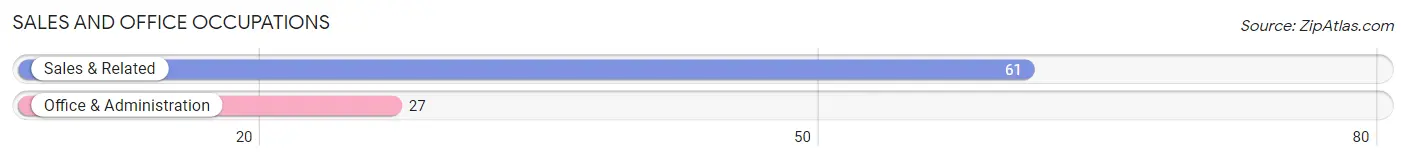
Sales and Office Occupations
The most common Sales and Office occupations in Braymer are Sales & Related (61 | 18.1%), and Office & Administration (27 | 8.0%).
Sales and Office Occupations by Sex
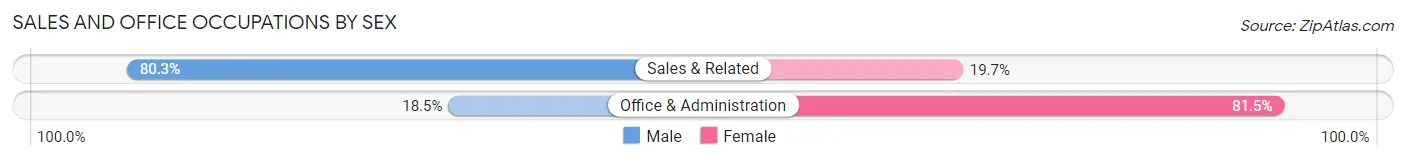
| Occupation | Male | Female |
| Sales & Related | 49 (80.3%) | 12 (19.7%) |
| Office & Administration | 5 (18.5%) | 22 (81.5%) |
| Total (Category) | 54 (61.4%) | 34 (38.6%) |
| Total (Overall) | 162 (48.1%) | 175 (51.9%) |
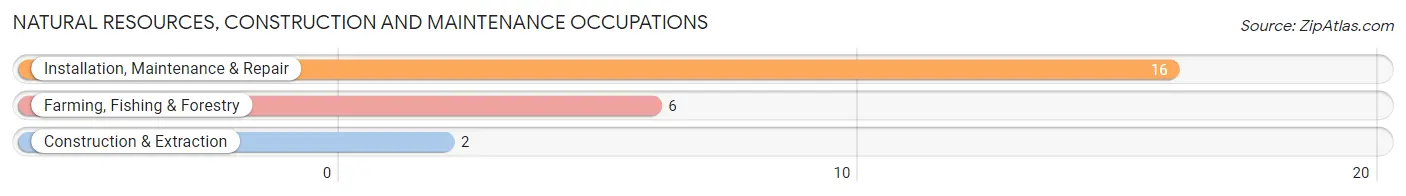
Natural Resources, Construction and Maintenance Occupations
The most common Natural Resources, Construction and Maintenance occupations in Braymer are Installation, Maintenance & Repair (16 | 4.8%), Farming, Fishing & Forestry (6 | 1.8%), and Construction & Extraction (2 | 0.6%).
Natural Resources, Construction and Maintenance Occupations by Sex
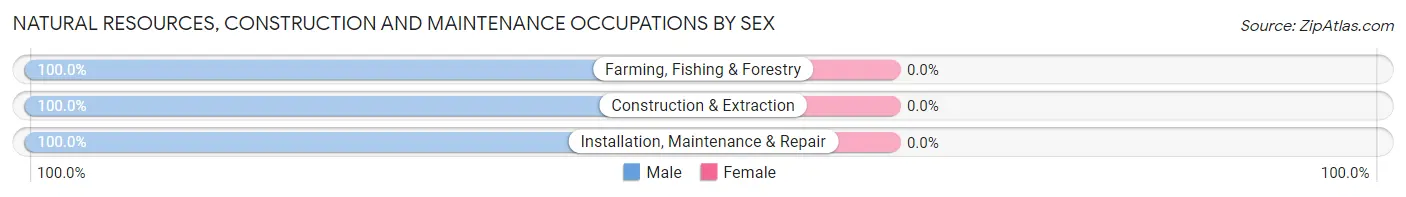
| Occupation | Male | Female |
| Farming, Fishing & Forestry | 6 (100.0%) | 0 (0.0%) |
| Construction & Extraction | 2 (100.0%) | 0 (0.0%) |
| Installation, Maintenance & Repair | 16 (100.0%) | 0 (0.0%) |
| Total (Category) | 24 (100.0%) | 0 (0.0%) |
| Total (Overall) | 162 (48.1%) | 175 (51.9%) |
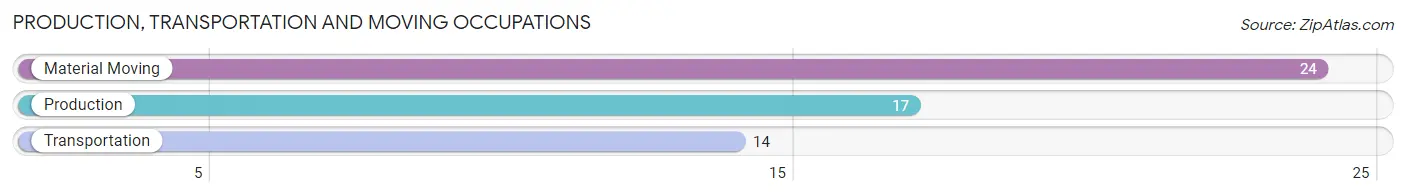
Production, Transportation and Moving Occupations
The most common Production, Transportation and Moving occupations in Braymer are Material Moving (24 | 7.1%), Production (17 | 5.0%), and Transportation (14 | 4.2%).
Production, Transportation and Moving Occupations by Sex
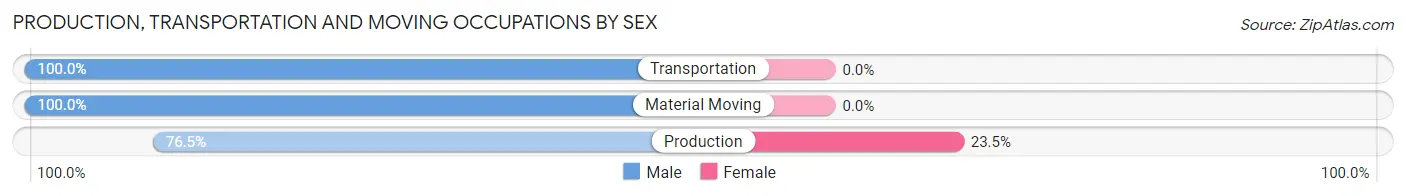
| Occupation | Male | Female |
| Production | 13 (76.5%) | 4 (23.5%) |
| Transportation | 14 (100.0%) | 0 (0.0%) |
| Material Moving | 24 (100.0%) | 0 (0.0%) |
| Total (Category) | 51 (92.7%) | 4 (7.3%) |
| Total (Overall) | 162 (48.1%) | 175 (51.9%) |
Employment Industries by Sex in Braymer
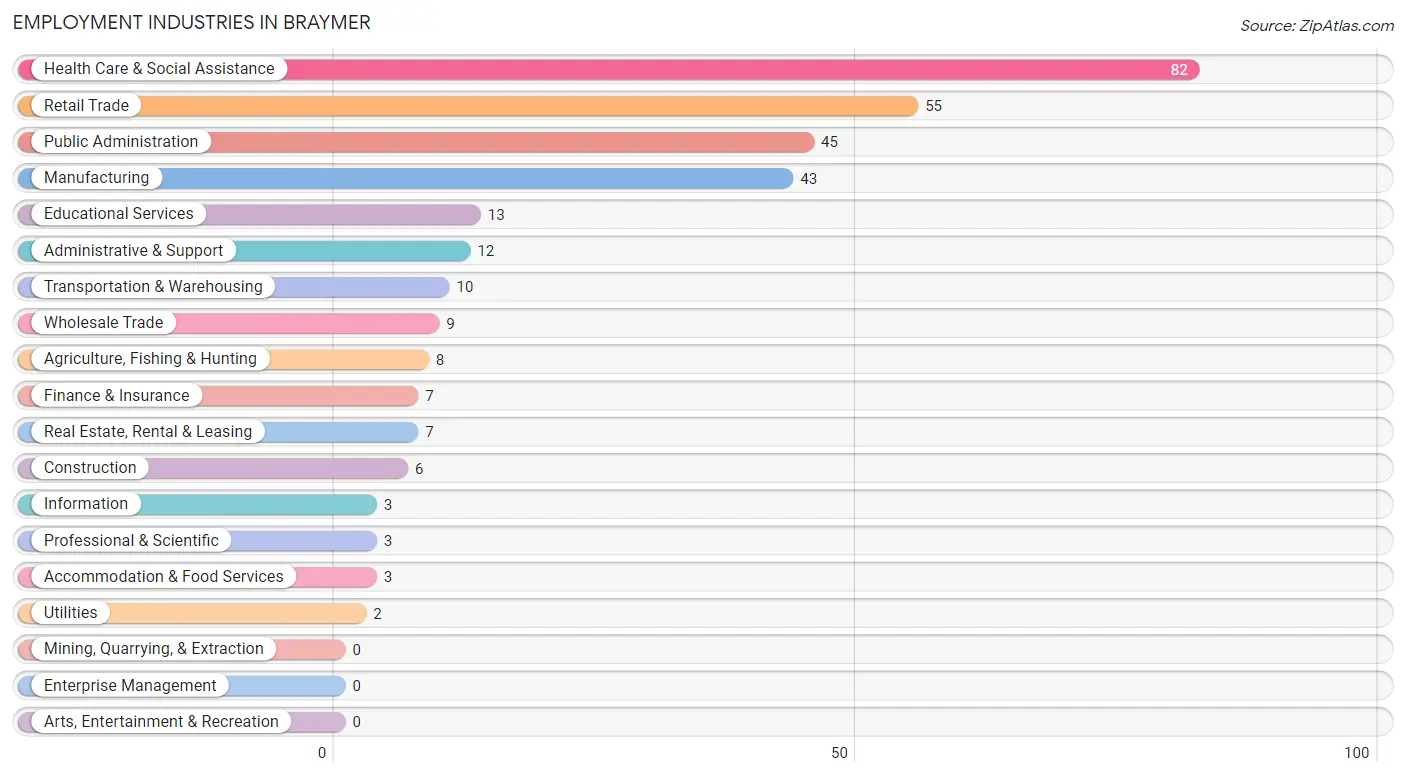
Employment Industries in Braymer
The major employment industries in Braymer include Health Care & Social Assistance (82 | 24.3%), Retail Trade (55 | 16.3%), Public Administration (45 | 13.4%), Manufacturing (43 | 12.8%), and Educational Services (13 | 3.9%).
Employment Industries by Sex in Braymer
The Braymer industries that see more men than women are Agriculture, Fishing & Hunting (100.0%), Construction (100.0%), and Utilities (100.0%), whereas the industries that tend to have a higher number of women are Educational Services (100.0%), Public Administration (100.0%), and Administrative & Support (83.3%).
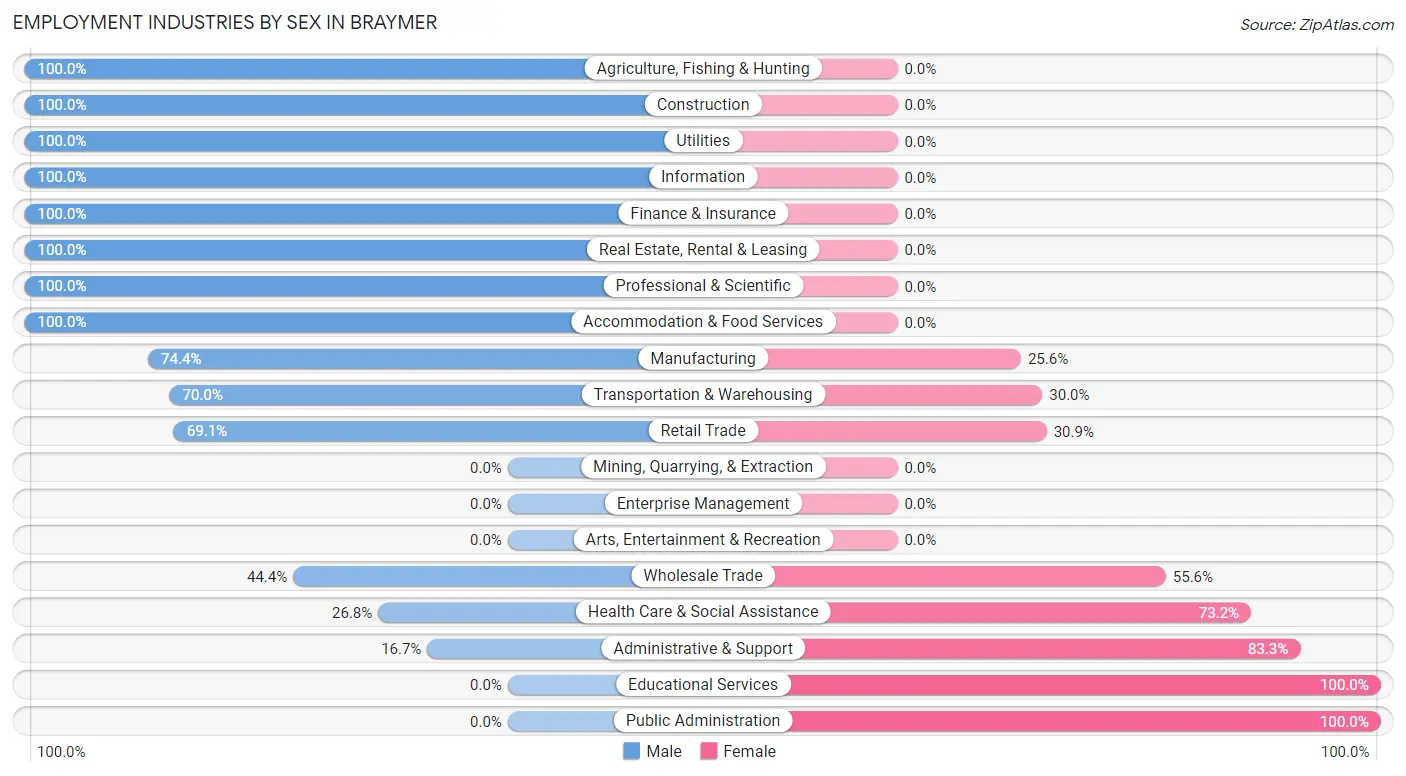
| Industry | Male | Female |
| Agriculture, Fishing & Hunting | 8 (100.0%) | 0 (0.0%) |
| Mining, Quarrying, & Extraction | 0 (0.0%) | 0 (0.0%) |
| Construction | 6 (100.0%) | 0 (0.0%) |
| Manufacturing | 32 (74.4%) | 11 (25.6%) |
| Wholesale Trade | 4 (44.4%) | 5 (55.6%) |
| Retail Trade | 38 (69.1%) | 17 (30.9%) |
| Transportation & Warehousing | 7 (70.0%) | 3 (30.0%) |
| Utilities | 2 (100.0%) | 0 (0.0%) |
| Information | 3 (100.0%) | 0 (0.0%) |
| Finance & Insurance | 7 (100.0%) | 0 (0.0%) |
| Real Estate, Rental & Leasing | 7 (100.0%) | 0 (0.0%) |
| Professional & Scientific | 3 (100.0%) | 0 (0.0%) |
| Enterprise Management | 0 (0.0%) | 0 (0.0%) |
| Administrative & Support | 2 (16.7%) | 10 (83.3%) |
| Educational Services | 0 (0.0%) | 13 (100.0%) |
| Health Care & Social Assistance | 22 (26.8%) | 60 (73.2%) |
| Arts, Entertainment & Recreation | 0 (0.0%) | 0 (0.0%) |
| Accommodation & Food Services | 3 (100.0%) | 0 (0.0%) |
| Public Administration | 0 (0.0%) | 45 (100.0%) |
| Total | 162 (48.1%) | 175 (51.9%) |
Education in Braymer
School Enrollment in Braymer
The most common levels of schooling among the 125 students in Braymer are college / undergraduate (36 | 28.8%), elementary school (32 | 25.6%), and middle school (30 | 24.0%).
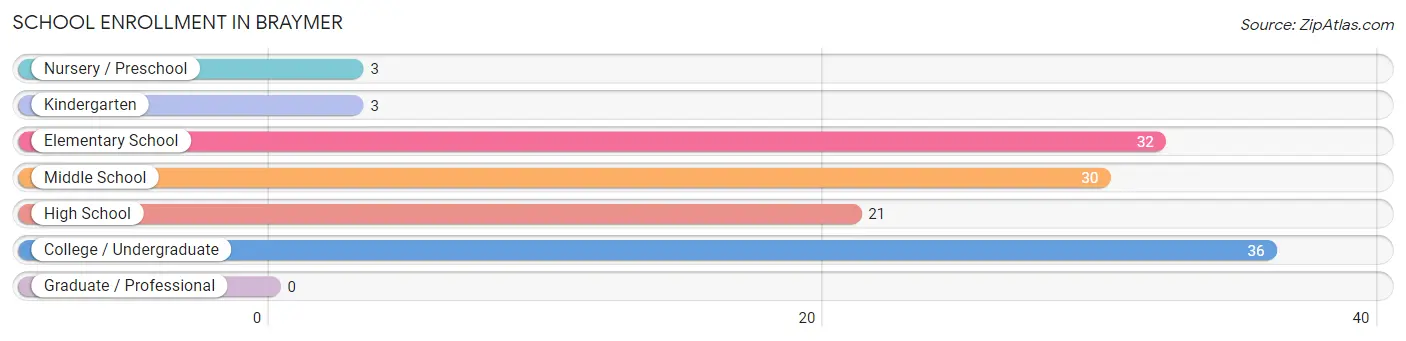
| School Level | # Students | % Students |
| Nursery / Preschool | 3 | 2.4% |
| Kindergarten | 3 | 2.4% |
| Elementary School | 32 | 25.6% |
| Middle School | 30 | 24.0% |
| High School | 21 | 16.8% |
| College / Undergraduate | 36 | 28.8% |
| Graduate / Professional | 0 | 0.0% |
| Total | 125 | 100.0% |
School Enrollment by Age by Funding Source in Braymer
Out of a total of 125 students who are enrolled in schools in Braymer, 15 (12.0%) attend a private institution, while the remaining 110 (88.0%) are enrolled in public schools. The age group of 20 to 24 year olds has the highest likelihood of being enrolled in private schools, with 12 (63.2% in the age bracket) enrolled. Conversely, the age group of 3 to 4 year olds has the lowest likelihood of being enrolled in a private school, with 2 (100.0% in the age bracket) attending a public institution.
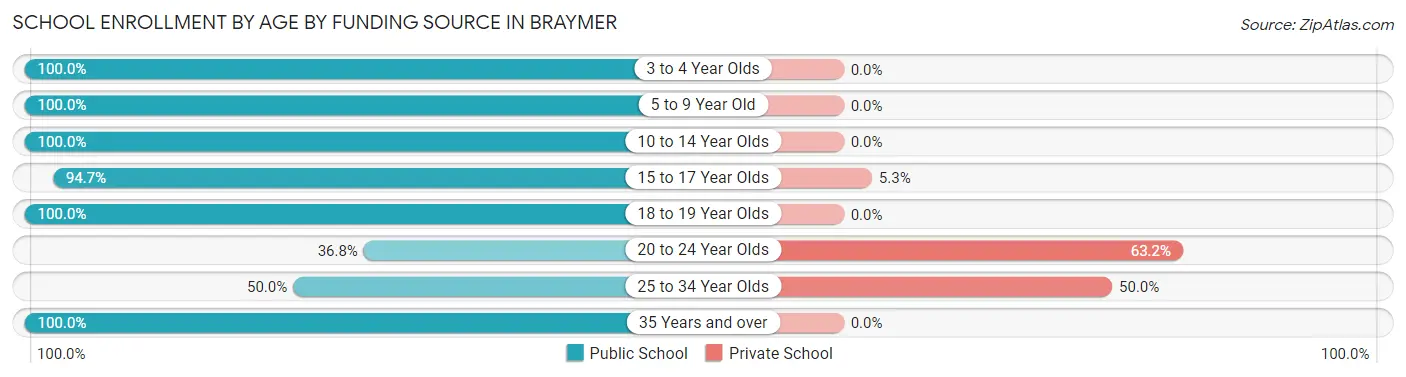
| Age Bracket | Public School | Private School |
| 3 to 4 Year Olds | 2 (100.0%) | 0 (0.0%) |
| 5 to 9 Year Old | 34 (100.0%) | 0 (0.0%) |
| 10 to 14 Year Olds | 33 (100.0%) | 0 (0.0%) |
| 15 to 17 Year Olds | 18 (94.7%) | 1 (5.3%) |
| 18 to 19 Year Olds | 5 (100.0%) | 0 (0.0%) |
| 20 to 24 Year Olds | 7 (36.8%) | 12 (63.2%) |
| 25 to 34 Year Olds | 2 (50.0%) | 2 (50.0%) |
| 35 Years and over | 9 (100.0%) | 0 (0.0%) |
| Total | 110 (88.0%) | 15 (12.0%) |
Educational Attainment by Field of Study in Braymer
Business (22 | 32.8%), education (13 | 19.4%), social sciences (8 | 11.9%), science & technology (8 | 11.9%), and liberal arts & history (5 | 7.5%) are the most common fields of study among 67 individuals in Braymer who have obtained a bachelor's degree or higher.
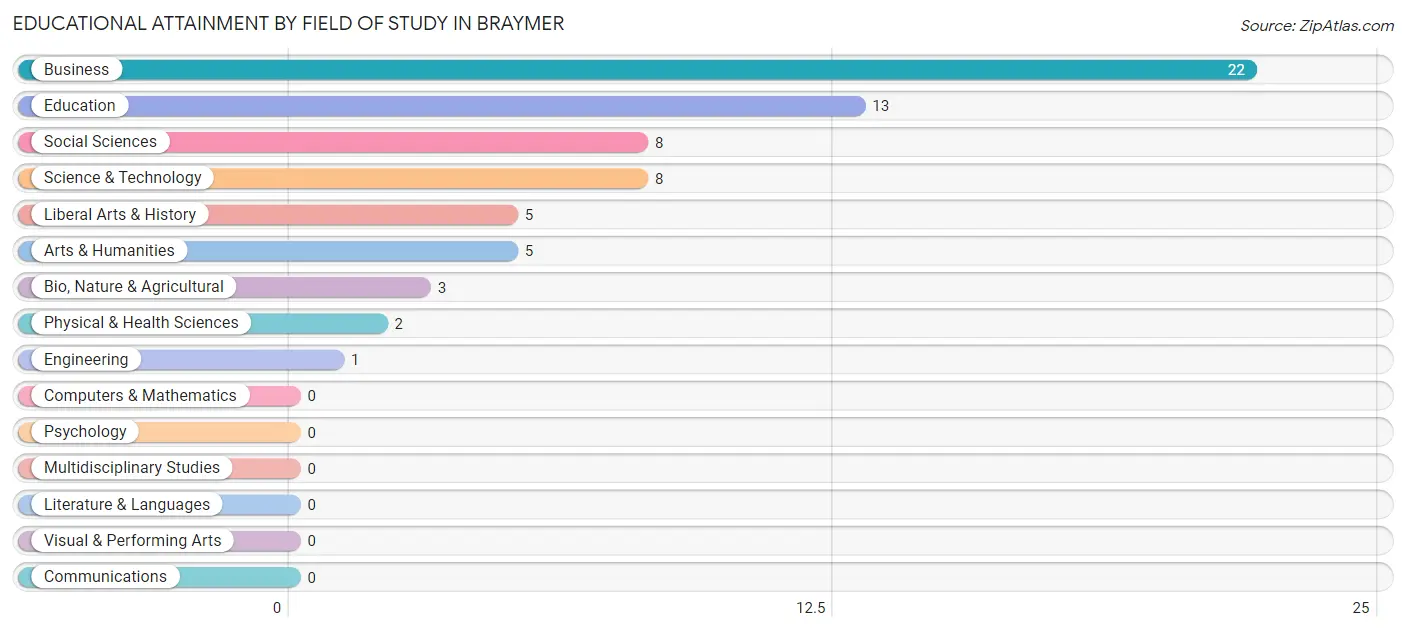
| Field of Study | # Graduates | % Graduates |
| Computers & Mathematics | 0 | 0.0% |
| Bio, Nature & Agricultural | 3 | 4.5% |
| Physical & Health Sciences | 2 | 3.0% |
| Psychology | 0 | 0.0% |
| Social Sciences | 8 | 11.9% |
| Engineering | 1 | 1.5% |
| Multidisciplinary Studies | 0 | 0.0% |
| Science & Technology | 8 | 11.9% |
| Business | 22 | 32.8% |
| Education | 13 | 19.4% |
| Literature & Languages | 0 | 0.0% |
| Liberal Arts & History | 5 | 7.5% |
| Visual & Performing Arts | 0 | 0.0% |
| Communications | 0 | 0.0% |
| Arts & Humanities | 5 | 7.5% |
| Total | 67 | 100.0% |
Transportation & Commute in Braymer
Vehicle Availability by Sex in Braymer
The most prevalent vehicle ownership categories in Braymer are males with 2 vehicles (87, accounting for 53.7%) and females with 2 vehicles (103, making up 49.7%).
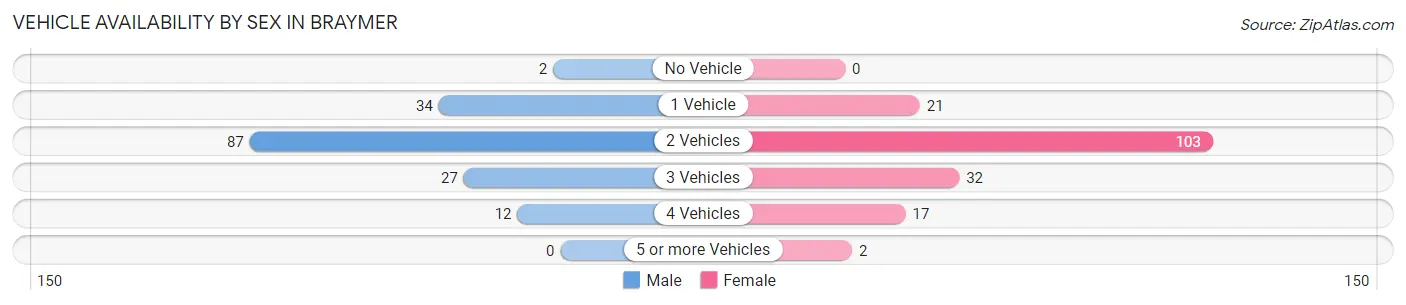
| Vehicles Available | Male | Female |
| No Vehicle | 2 (1.2%) | 0 (0.0%) |
| 1 Vehicle | 34 (21.0%) | 21 (12.0%) |
| 2 Vehicles | 87 (53.7%) | 103 (58.9%) |
| 3 Vehicles | 27 (16.7%) | 32 (18.3%) |
| 4 Vehicles | 12 (7.4%) | 17 (9.7%) |
| 5 or more Vehicles | 0 (0.0%) | 2 (1.1%) |
| Total | 162 (100.0%) | 175 (100.0%) |
Commute Time in Braymer
The most frequently occuring commute durations in Braymer are less than 5 minutes (58 commuters, 18.3%), 60 to 89 minutes (53 commuters, 16.8%), and 5 to 9 minutes (50 commuters, 15.8%).
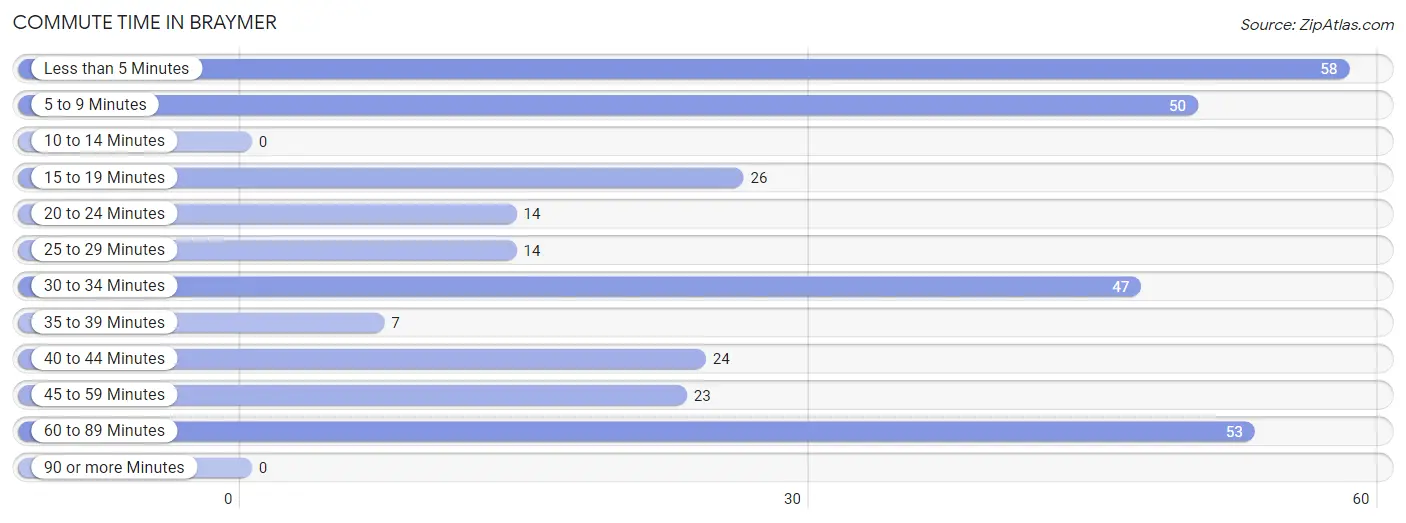
| Commute Time | # Commuters | % Commuters |
| Less than 5 Minutes | 58 | 18.3% |
| 5 to 9 Minutes | 50 | 15.8% |
| 10 to 14 Minutes | 0 | 0.0% |
| 15 to 19 Minutes | 26 | 8.2% |
| 20 to 24 Minutes | 14 | 4.4% |
| 25 to 29 Minutes | 14 | 4.4% |
| 30 to 34 Minutes | 47 | 14.9% |
| 35 to 39 Minutes | 7 | 2.2% |
| 40 to 44 Minutes | 24 | 7.6% |
| 45 to 59 Minutes | 23 | 7.3% |
| 60 to 89 Minutes | 53 | 16.8% |
| 90 or more Minutes | 0 | 0.0% |
Commute Time by Sex in Braymer
The most common commute times in Braymer are 60 to 89 minutes (47 commuters, 30.9%) for males and 5 to 9 minutes (38 commuters, 23.2%) for females.
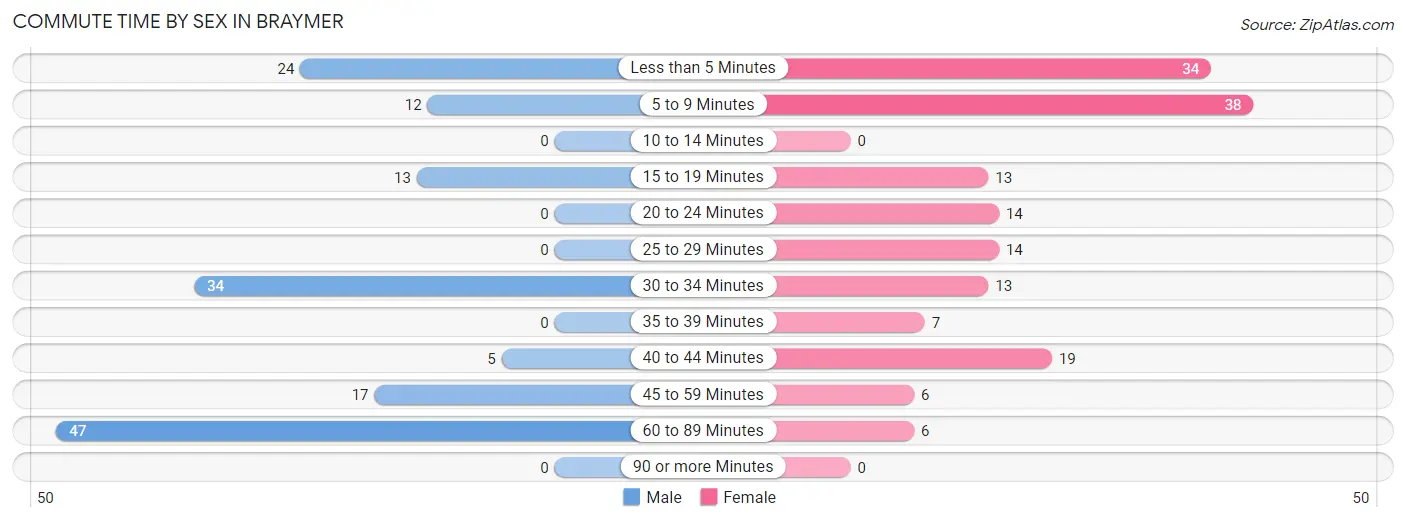
| Commute Time | Male | Female |
| Less than 5 Minutes | 24 (15.8%) | 34 (20.7%) |
| 5 to 9 Minutes | 12 (7.9%) | 38 (23.2%) |
| 10 to 14 Minutes | 0 (0.0%) | 0 (0.0%) |
| 15 to 19 Minutes | 13 (8.6%) | 13 (7.9%) |
| 20 to 24 Minutes | 0 (0.0%) | 14 (8.5%) |
| 25 to 29 Minutes | 0 (0.0%) | 14 (8.5%) |
| 30 to 34 Minutes | 34 (22.4%) | 13 (7.9%) |
| 35 to 39 Minutes | 0 (0.0%) | 7 (4.3%) |
| 40 to 44 Minutes | 5 (3.3%) | 19 (11.6%) |
| 45 to 59 Minutes | 17 (11.2%) | 6 (3.7%) |
| 60 to 89 Minutes | 47 (30.9%) | 6 (3.7%) |
| 90 or more Minutes | 0 (0.0%) | 0 (0.0%) |
Time of Departure to Work by Sex in Braymer
The most frequent times of departure to work in Braymer are 7:00 AM to 7:29 AM (37, 24.3%) for males and 6:30 AM to 6:59 AM (36, 22.0%) for females.
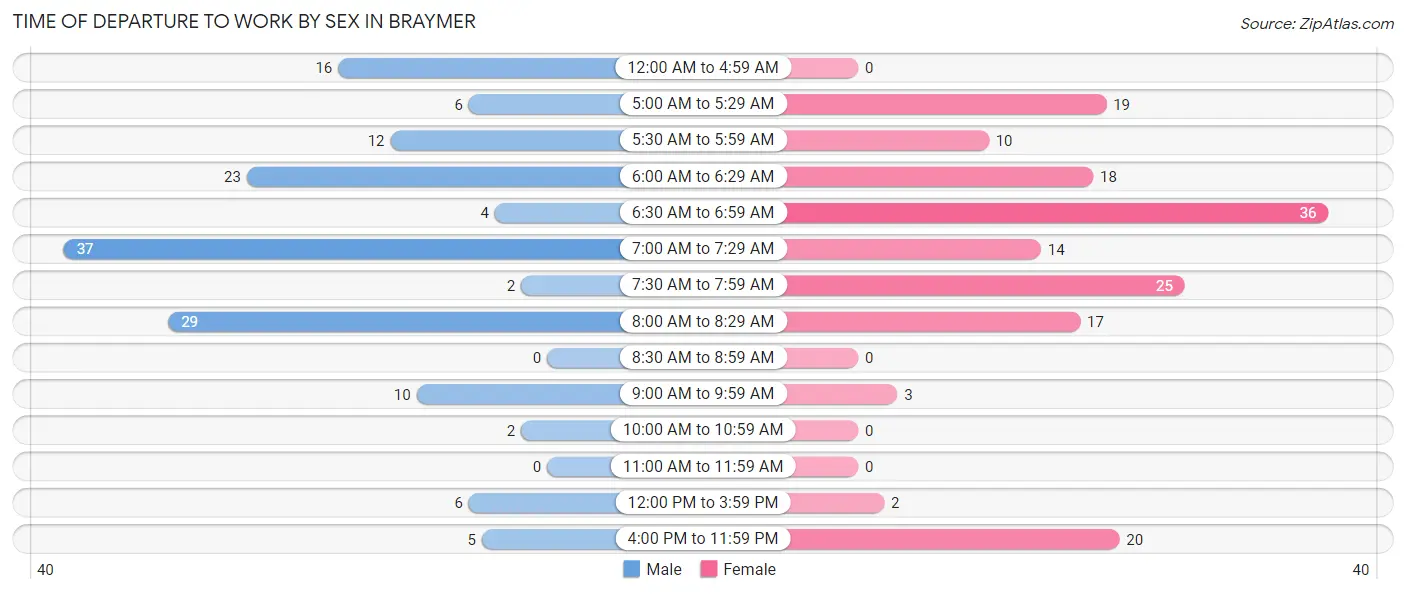
| Time of Departure | Male | Female |
| 12:00 AM to 4:59 AM | 16 (10.5%) | 0 (0.0%) |
| 5:00 AM to 5:29 AM | 6 (4.0%) | 19 (11.6%) |
| 5:30 AM to 5:59 AM | 12 (7.9%) | 10 (6.1%) |
| 6:00 AM to 6:29 AM | 23 (15.1%) | 18 (11.0%) |
| 6:30 AM to 6:59 AM | 4 (2.6%) | 36 (22.0%) |
| 7:00 AM to 7:29 AM | 37 (24.3%) | 14 (8.5%) |
| 7:30 AM to 7:59 AM | 2 (1.3%) | 25 (15.2%) |
| 8:00 AM to 8:29 AM | 29 (19.1%) | 17 (10.4%) |
| 8:30 AM to 8:59 AM | 0 (0.0%) | 0 (0.0%) |
| 9:00 AM to 9:59 AM | 10 (6.6%) | 3 (1.8%) |
| 10:00 AM to 10:59 AM | 2 (1.3%) | 0 (0.0%) |
| 11:00 AM to 11:59 AM | 0 (0.0%) | 0 (0.0%) |
| 12:00 PM to 3:59 PM | 6 (4.0%) | 2 (1.2%) |
| 4:00 PM to 11:59 PM | 5 (3.3%) | 20 (12.2%) |
| Total | 152 (100.0%) | 164 (100.0%) |
Housing Occupancy in Braymer
Occupancy by Ownership in Braymer
Of the total 302 dwellings in Braymer, owner-occupied units account for 232 (76.8%), while renter-occupied units make up 70 (23.2%).
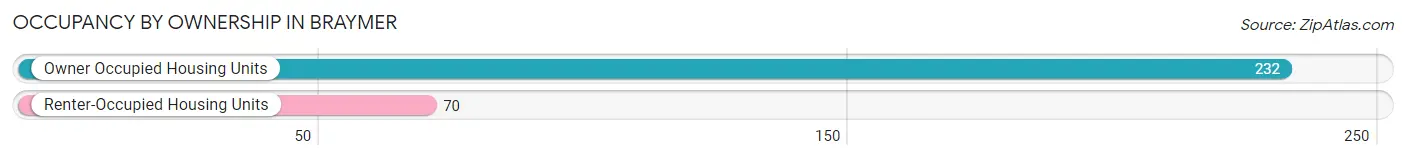
| Occupancy | # Housing Units | % Housing Units |
| Owner Occupied Housing Units | 232 | 76.8% |
| Renter-Occupied Housing Units | 70 | 23.2% |
| Total Occupied Housing Units | 302 | 100.0% |
Occupancy by Household Size in Braymer
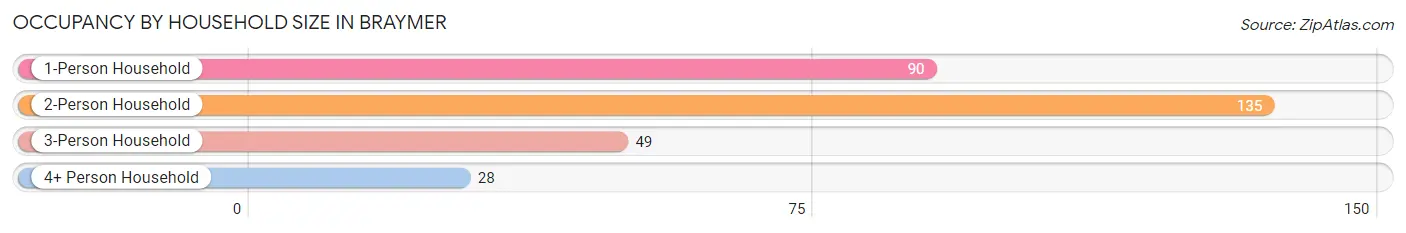
| Household Size | # Housing Units | % Housing Units |
| 1-Person Household | 90 | 29.8% |
| 2-Person Household | 135 | 44.7% |
| 3-Person Household | 49 | 16.2% |
| 4+ Person Household | 28 | 9.3% |
| Total Housing Units | 302 | 100.0% |
Occupancy by Ownership by Household Size in Braymer
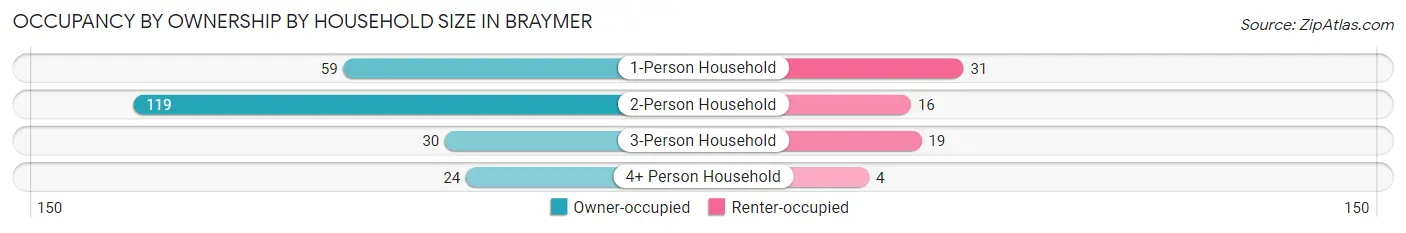
| Household Size | Owner-occupied | Renter-occupied |
| 1-Person Household | 59 (65.6%) | 31 (34.4%) |
| 2-Person Household | 119 (88.1%) | 16 (11.8%) |
| 3-Person Household | 30 (61.2%) | 19 (38.8%) |
| 4+ Person Household | 24 (85.7%) | 4 (14.3%) |
| Total Housing Units | 232 (76.8%) | 70 (23.2%) |
Occupancy by Educational Attainment in Braymer
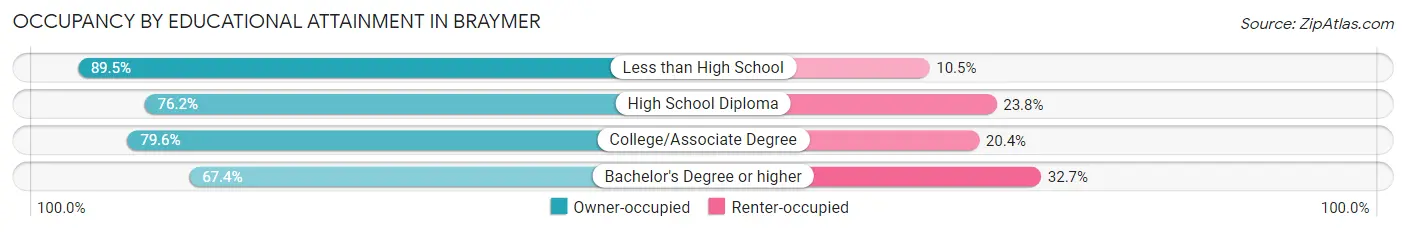
| Household Size | Owner-occupied | Renter-occupied |
| Less than High School | 17 (89.5%) | 2 (10.5%) |
| High School Diploma | 96 (76.2%) | 30 (23.8%) |
| College/Associate Degree | 86 (79.6%) | 22 (20.4%) |
| Bachelor's Degree or higher | 33 (67.3%) | 16 (32.7%) |
Occupancy by Age of Householder in Braymer
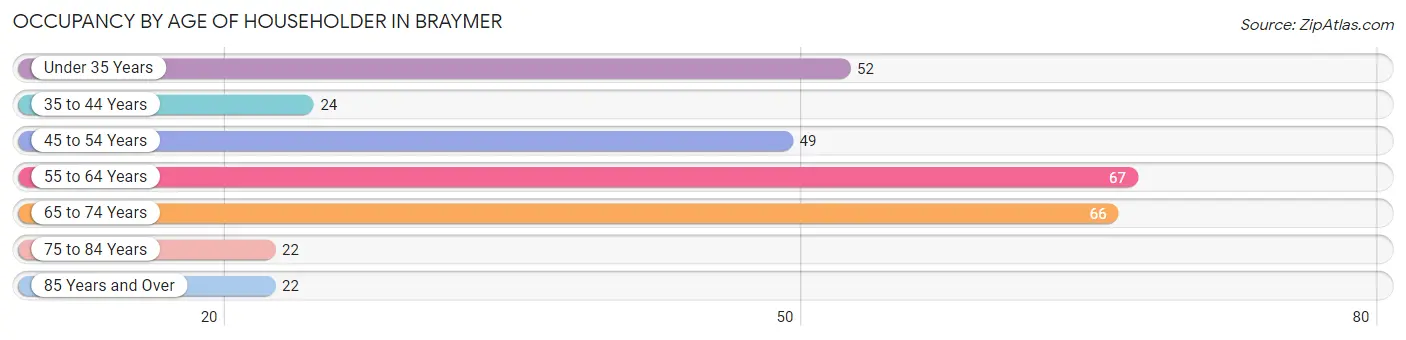
| Age Bracket | # Households | % Households |
| Under 35 Years | 52 | 17.2% |
| 35 to 44 Years | 24 | 8.0% |
| 45 to 54 Years | 49 | 16.2% |
| 55 to 64 Years | 67 | 22.2% |
| 65 to 74 Years | 66 | 21.8% |
| 75 to 84 Years | 22 | 7.3% |
| 85 Years and Over | 22 | 7.3% |
| Total | 302 | 100.0% |
Housing Finances in Braymer
Median Income by Occupancy in Braymer
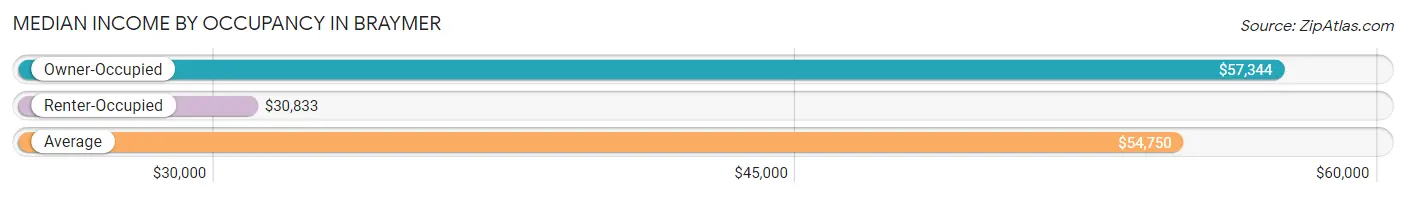
| Occupancy Type | # Households | Median Income |
| Owner-Occupied | 232 (76.8%) | $57,344 |
| Renter-Occupied | 70 (23.2%) | $30,833 |
| Average | 302 (100.0%) | $54,750 |
Occupancy by Householder Income Bracket in Braymer
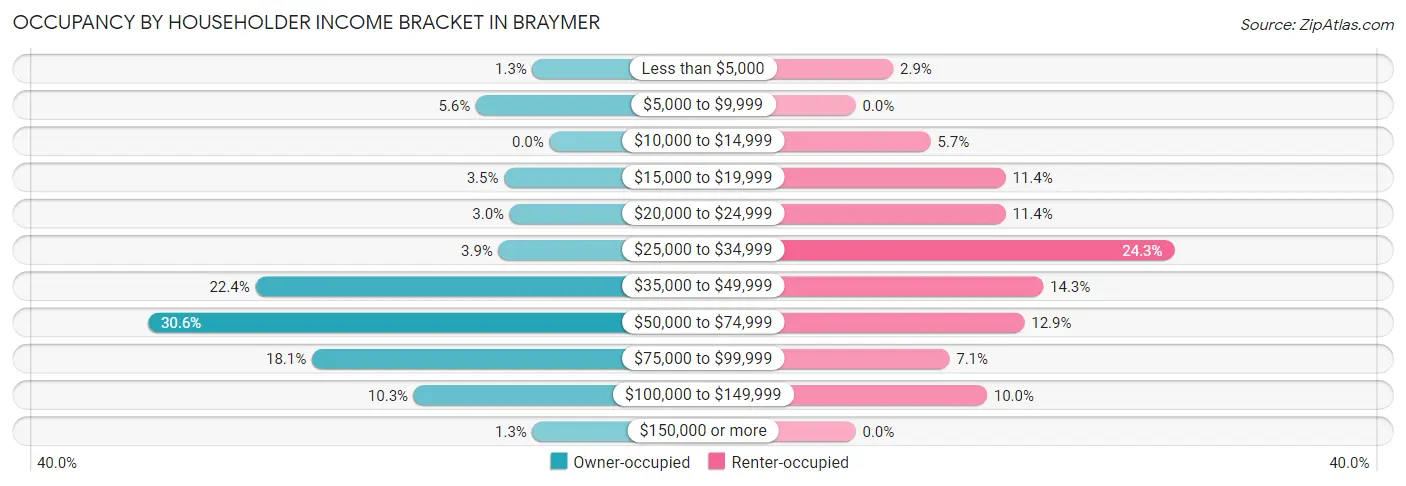
| Income Bracket | Owner-occupied | Renter-occupied |
| Less than $5,000 | 3 (1.3%) | 2 (2.9%) |
| $5,000 to $9,999 | 13 (5.6%) | 0 (0.0%) |
| $10,000 to $14,999 | 0 (0.0%) | 4 (5.7%) |
| $15,000 to $19,999 | 8 (3.5%) | 8 (11.4%) |
| $20,000 to $24,999 | 7 (3.0%) | 8 (11.4%) |
| $25,000 to $34,999 | 9 (3.9%) | 17 (24.3%) |
| $35,000 to $49,999 | 52 (22.4%) | 10 (14.3%) |
| $50,000 to $74,999 | 71 (30.6%) | 9 (12.9%) |
| $75,000 to $99,999 | 42 (18.1%) | 5 (7.1%) |
| $100,000 to $149,999 | 24 (10.3%) | 7 (10.0%) |
| $150,000 or more | 3 (1.3%) | 0 (0.0%) |
| Total | 232 (100.0%) | 70 (100.0%) |
Monthly Housing Cost Tiers in Braymer
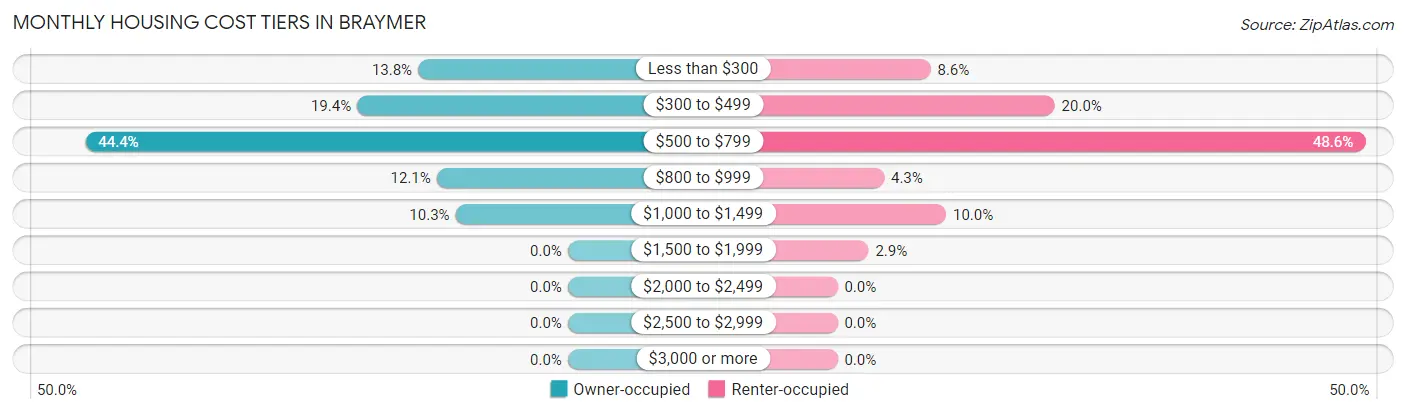
| Monthly Cost | Owner-occupied | Renter-occupied |
| Less than $300 | 32 (13.8%) | 6 (8.6%) |
| $300 to $499 | 45 (19.4%) | 14 (20.0%) |
| $500 to $799 | 103 (44.4%) | 34 (48.6%) |
| $800 to $999 | 28 (12.1%) | 3 (4.3%) |
| $1,000 to $1,499 | 24 (10.3%) | 7 (10.0%) |
| $1,500 to $1,999 | 0 (0.0%) | 2 (2.9%) |
| $2,000 to $2,499 | 0 (0.0%) | 0 (0.0%) |
| $2,500 to $2,999 | 0 (0.0%) | 0 (0.0%) |
| $3,000 or more | 0 (0.0%) | 0 (0.0%) |
| Total | 232 (100.0%) | 70 (100.0%) |
Physical Housing Characteristics in Braymer
Housing Structures in Braymer
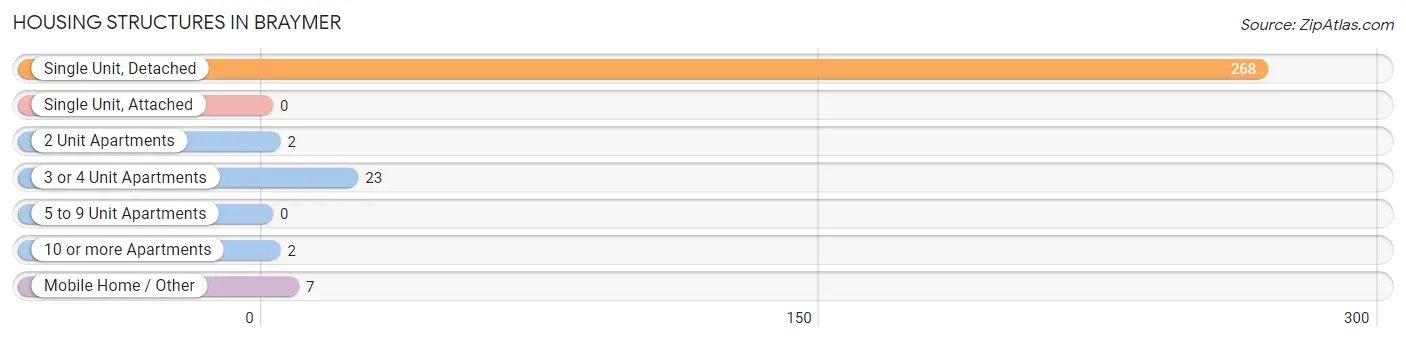
| Structure Type | # Housing Units | % Housing Units |
| Single Unit, Detached | 268 | 88.7% |
| Single Unit, Attached | 0 | 0.0% |
| 2 Unit Apartments | 2 | 0.7% |
| 3 or 4 Unit Apartments | 23 | 7.6% |
| 5 to 9 Unit Apartments | 0 | 0.0% |
| 10 or more Apartments | 2 | 0.7% |
| Mobile Home / Other | 7 | 2.3% |
| Total | 302 | 100.0% |
Housing Structures by Occupancy in Braymer
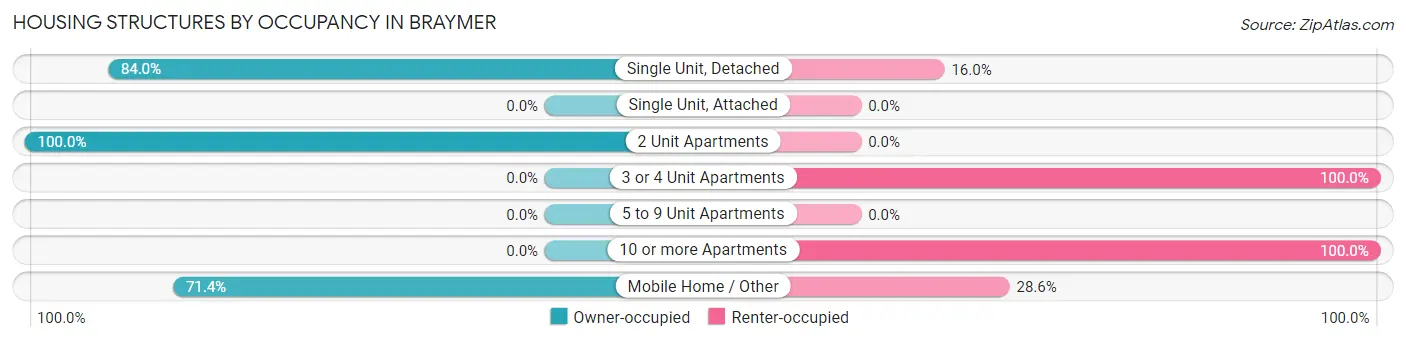
| Structure Type | Owner-occupied | Renter-occupied |
| Single Unit, Detached | 225 (84.0%) | 43 (16.0%) |
| Single Unit, Attached | 0 (0.0%) | 0 (0.0%) |
| 2 Unit Apartments | 2 (100.0%) | 0 (0.0%) |
| 3 or 4 Unit Apartments | 0 (0.0%) | 23 (100.0%) |
| 5 to 9 Unit Apartments | 0 (0.0%) | 0 (0.0%) |
| 10 or more Apartments | 0 (0.0%) | 2 (100.0%) |
| Mobile Home / Other | 5 (71.4%) | 2 (28.6%) |
| Total | 232 (76.8%) | 70 (23.2%) |
Housing Structures by Number of Rooms in Braymer
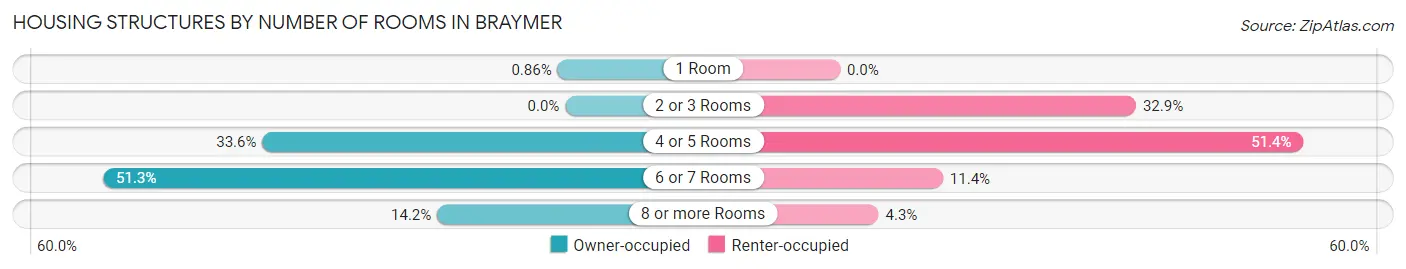
| Number of Rooms | Owner-occupied | Renter-occupied |
| 1 Room | 2 (0.9%) | 0 (0.0%) |
| 2 or 3 Rooms | 0 (0.0%) | 23 (32.9%) |
| 4 or 5 Rooms | 78 (33.6%) | 36 (51.4%) |
| 6 or 7 Rooms | 119 (51.3%) | 8 (11.4%) |
| 8 or more Rooms | 33 (14.2%) | 3 (4.3%) |
| Total | 232 (100.0%) | 70 (100.0%) |
Housing Structure by Heating Type in Braymer
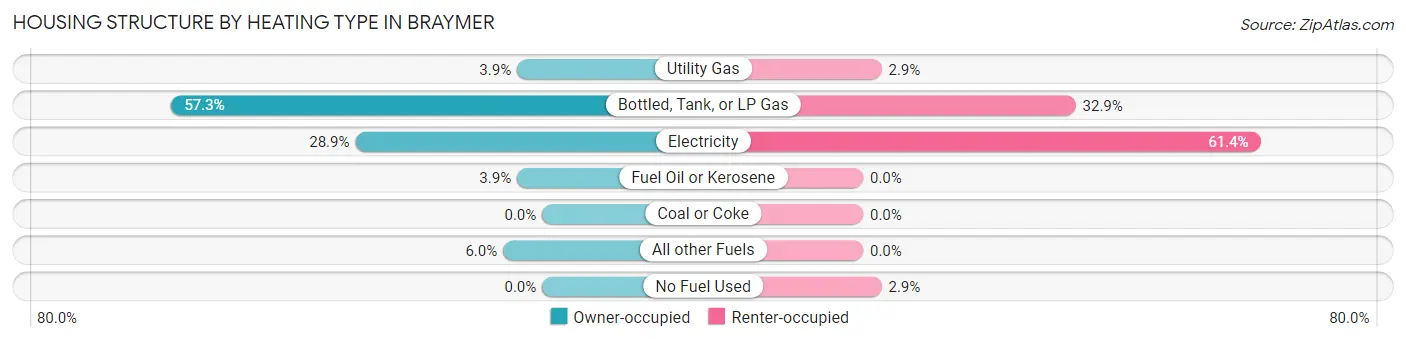
| Heating Type | Owner-occupied | Renter-occupied |
| Utility Gas | 9 (3.9%) | 2 (2.9%) |
| Bottled, Tank, or LP Gas | 133 (57.3%) | 23 (32.9%) |
| Electricity | 67 (28.9%) | 43 (61.4%) |
| Fuel Oil or Kerosene | 9 (3.9%) | 0 (0.0%) |
| Coal or Coke | 0 (0.0%) | 0 (0.0%) |
| All other Fuels | 14 (6.0%) | 0 (0.0%) |
| No Fuel Used | 0 (0.0%) | 2 (2.9%) |
| Total | 232 (100.0%) | 70 (100.0%) |
Household Vehicle Usage in Braymer
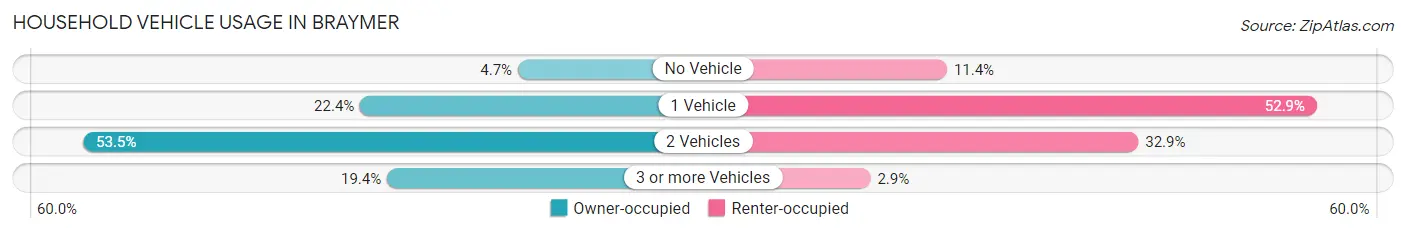
| Vehicles per Household | Owner-occupied | Renter-occupied |
| No Vehicle | 11 (4.7%) | 8 (11.4%) |
| 1 Vehicle | 52 (22.4%) | 37 (52.9%) |
| 2 Vehicles | 124 (53.4%) | 23 (32.9%) |
| 3 or more Vehicles | 45 (19.4%) | 2 (2.9%) |
| Total | 232 (100.0%) | 70 (100.0%) |
Real Estate & Mortgages in Braymer
Real Estate and Mortgage Overview in Braymer
| Characteristic | Without Mortgage | With Mortgage |
| Housing Units | 138 | 94 |
| Median Property Value | $74,800 | $70,000 |
| Median Household Income | $48,125 | $0 |
| Monthly Housing Costs | $468 | $0 |
| Real Estate Taxes | $512 | $2 |
Property Value by Mortgage Status in Braymer
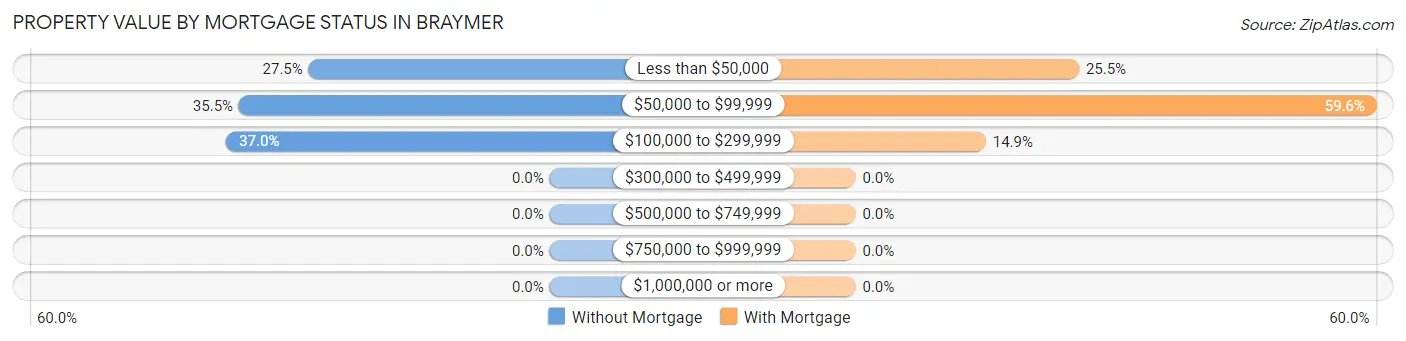
| Property Value | Without Mortgage | With Mortgage |
| Less than $50,000 | 38 (27.5%) | 24 (25.5%) |
| $50,000 to $99,999 | 49 (35.5%) | 56 (59.6%) |
| $100,000 to $299,999 | 51 (37.0%) | 14 (14.9%) |
| $300,000 to $499,999 | 0 (0.0%) | 0 (0.0%) |
| $500,000 to $749,999 | 0 (0.0%) | 0 (0.0%) |
| $750,000 to $999,999 | 0 (0.0%) | 0 (0.0%) |
| $1,000,000 or more | 0 (0.0%) | 0 (0.0%) |
| Total | 138 (100.0%) | 94 (100.0%) |
Household Income by Mortgage Status in Braymer
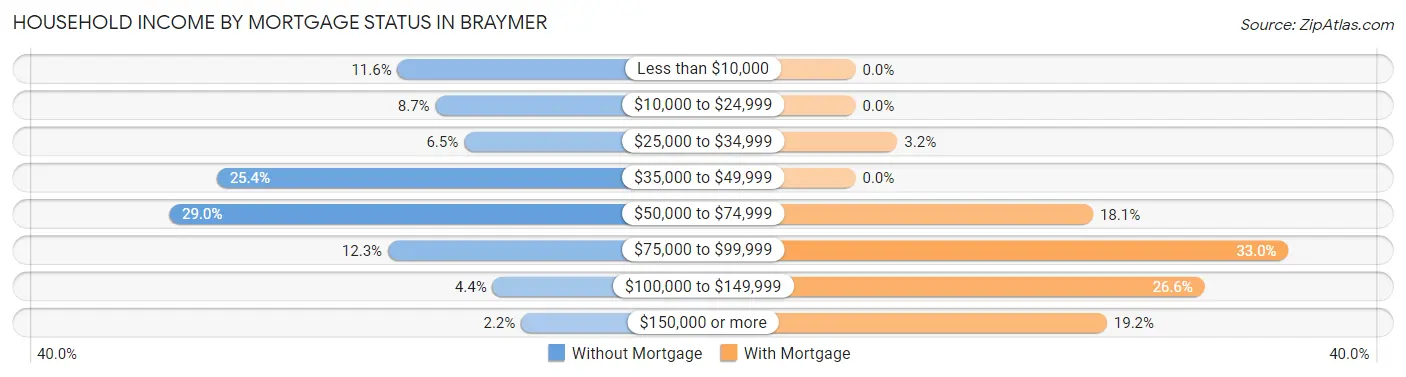
| Household Income | Without Mortgage | With Mortgage |
| Less than $10,000 | 16 (11.6%) | 0 (0.0%) |
| $10,000 to $24,999 | 12 (8.7%) | 0 (0.0%) |
| $25,000 to $34,999 | 9 (6.5%) | 3 (3.2%) |
| $35,000 to $49,999 | 35 (25.4%) | 0 (0.0%) |
| $50,000 to $74,999 | 40 (29.0%) | 17 (18.1%) |
| $75,000 to $99,999 | 17 (12.3%) | 31 (33.0%) |
| $100,000 to $149,999 | 6 (4.3%) | 25 (26.6%) |
| $150,000 or more | 3 (2.2%) | 18 (19.2%) |
| Total | 138 (100.0%) | 94 (100.0%) |
Property Value to Household Income Ratio in Braymer
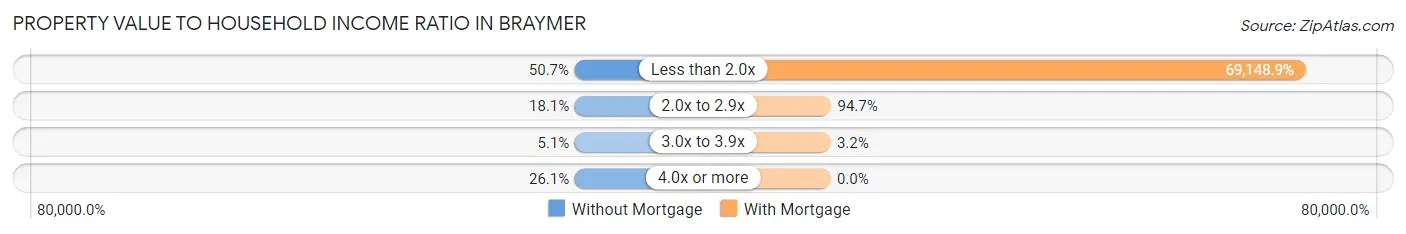
| Value-to-Income Ratio | Without Mortgage | With Mortgage |
| Less than 2.0x | 70 (50.7%) | 65,000 (69,148.9%) |
| 2.0x to 2.9x | 25 (18.1%) | 89 (94.7%) |
| 3.0x to 3.9x | 7 (5.1%) | 3 (3.2%) |
| 4.0x or more | 36 (26.1%) | 0 (0.0%) |
| Total | 138 (100.0%) | 94 (100.0%) |
Real Estate Taxes by Mortgage Status in Braymer
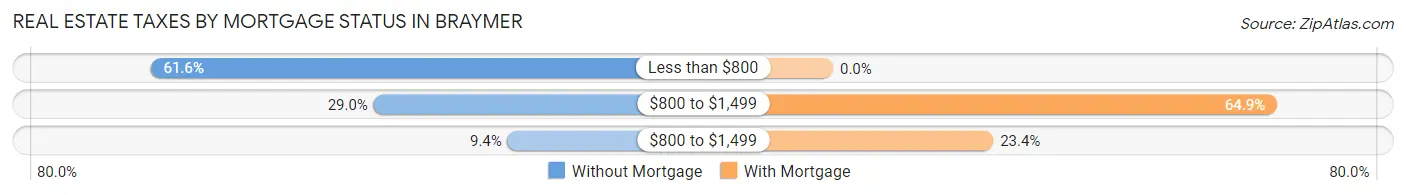
| Property Taxes | Without Mortgage | With Mortgage |
| Less than $800 | 85 (61.6%) | 0 (0.0%) |
| $800 to $1,499 | 40 (29.0%) | 61 (64.9%) |
| $800 to $1,499 | 13 (9.4%) | 22 (23.4%) |
| Total | 138 (100.0%) | 94 (100.0%) |
Health & Disability in Braymer
Health Insurance Coverage by Age in Braymer
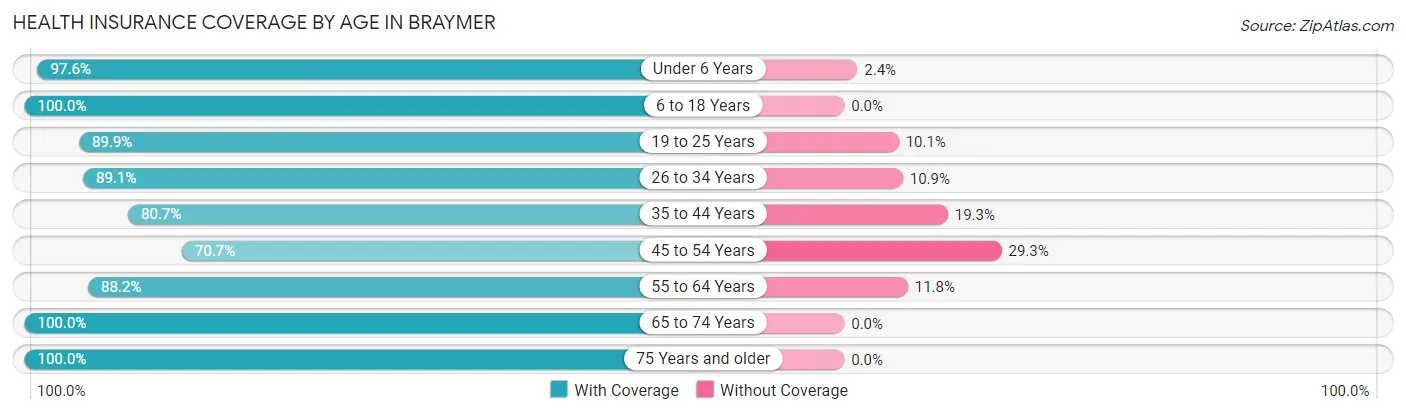
| Age Bracket | With Coverage | Without Coverage |
| Under 6 Years | 40 (97.6%) | 1 (2.4%) |
| 6 to 18 Years | 97 (100.0%) | 0 (0.0%) |
| 19 to 25 Years | 62 (89.9%) | 7 (10.1%) |
| 26 to 34 Years | 49 (89.1%) | 6 (10.9%) |
| 35 to 44 Years | 46 (80.7%) | 11 (19.3%) |
| 45 to 54 Years | 53 (70.7%) | 22 (29.3%) |
| 55 to 64 Years | 134 (88.2%) | 18 (11.8%) |
| 65 to 74 Years | 95 (100.0%) | 0 (0.0%) |
| 75 Years and older | 50 (100.0%) | 0 (0.0%) |
| Total | 626 (90.6%) | 65 (9.4%) |
Health Insurance Coverage by Citizenship Status in Braymer
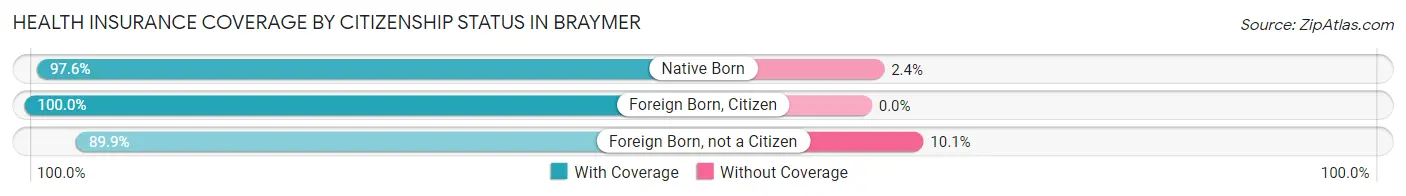
| Citizenship Status | With Coverage | Without Coverage |
| Native Born | 40 (97.6%) | 1 (2.4%) |
| Foreign Born, Citizen | 97 (100.0%) | 0 (0.0%) |
| Foreign Born, not a Citizen | 62 (89.9%) | 7 (10.1%) |
Health Insurance Coverage by Household Income in Braymer
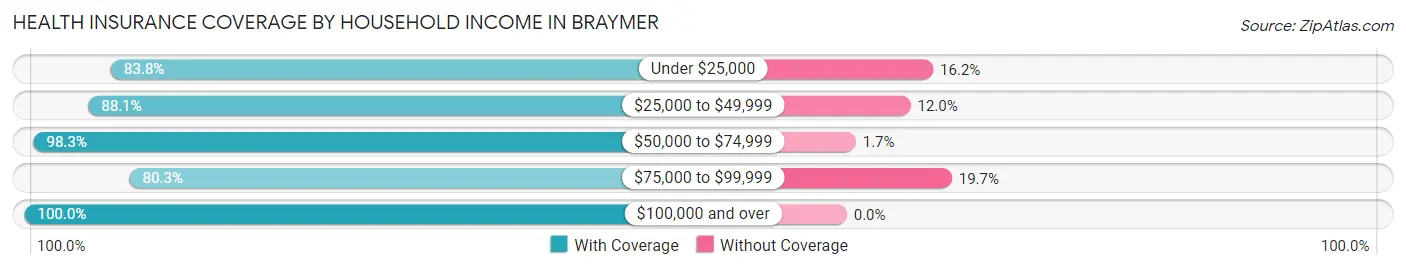
| Household Income | With Coverage | Without Coverage |
| Under $25,000 | 57 (83.8%) | 11 (16.2%) |
| $25,000 to $49,999 | 199 (88.0%) | 27 (11.9%) |
| $50,000 to $74,999 | 174 (98.3%) | 3 (1.7%) |
| $75,000 to $99,999 | 98 (80.3%) | 24 (19.7%) |
| $100,000 and over | 98 (100.0%) | 0 (0.0%) |
Public vs Private Health Insurance Coverage by Age in Braymer
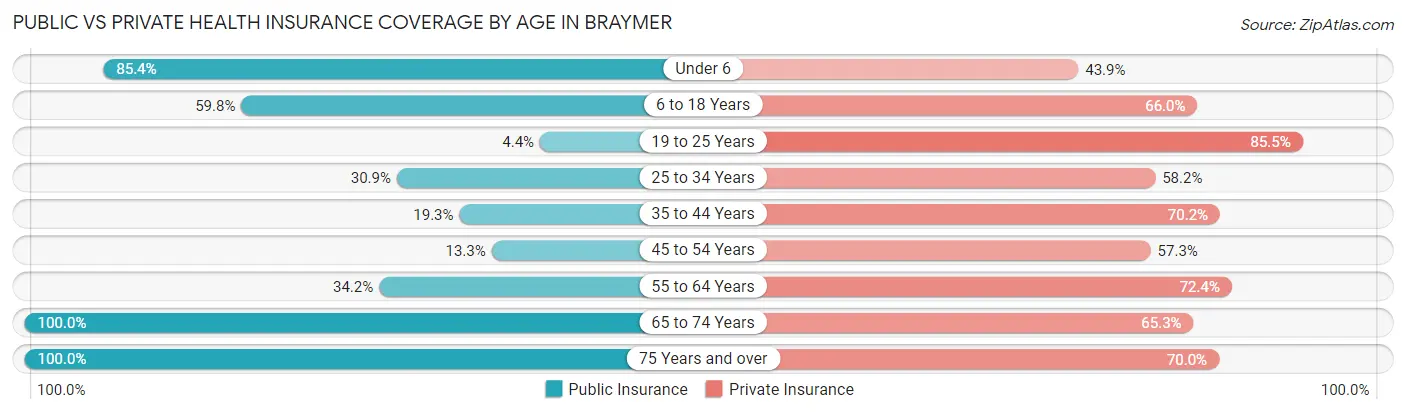
| Age Bracket | Public Insurance | Private Insurance |
| Under 6 | 35 (85.4%) | 18 (43.9%) |
| 6 to 18 Years | 58 (59.8%) | 64 (66.0%) |
| 19 to 25 Years | 3 (4.3%) | 59 (85.5%) |
| 25 to 34 Years | 17 (30.9%) | 32 (58.2%) |
| 35 to 44 Years | 11 (19.3%) | 40 (70.2%) |
| 45 to 54 Years | 10 (13.3%) | 43 (57.3%) |
| 55 to 64 Years | 52 (34.2%) | 110 (72.4%) |
| 65 to 74 Years | 95 (100.0%) | 62 (65.3%) |
| 75 Years and over | 50 (100.0%) | 35 (70.0%) |
| Total | 331 (47.9%) | 463 (67.0%) |
Disability Status by Sex by Age in Braymer
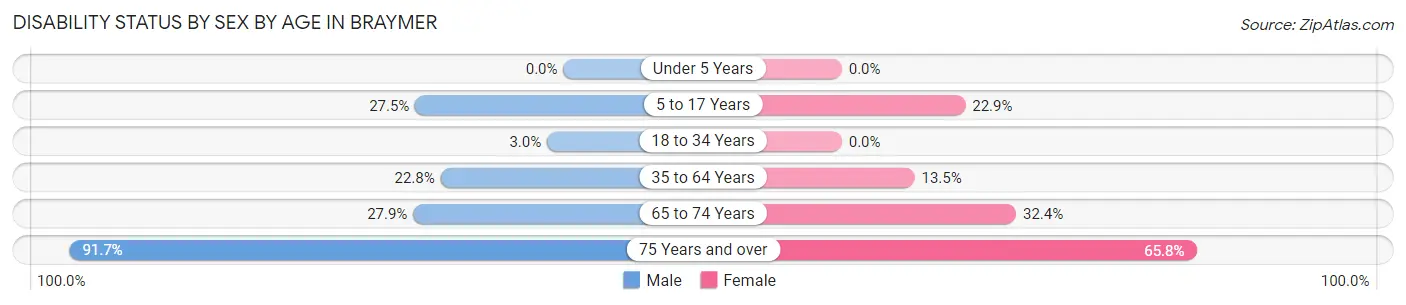
| Age Bracket | Male | Female |
| Under 5 Years | 0 (0.0%) | 0 (0.0%) |
| 5 to 17 Years | 11 (27.5%) | 11 (22.9%) |
| 18 to 34 Years | 2 (3.0%) | 0 (0.0%) |
| 35 to 64 Years | 31 (22.8%) | 20 (13.5%) |
| 65 to 74 Years | 17 (27.9%) | 11 (32.4%) |
| 75 Years and over | 11 (91.7%) | 25 (65.8%) |
Disability Class by Sex by Age in Braymer
Disability Class: Hearing Difficulty
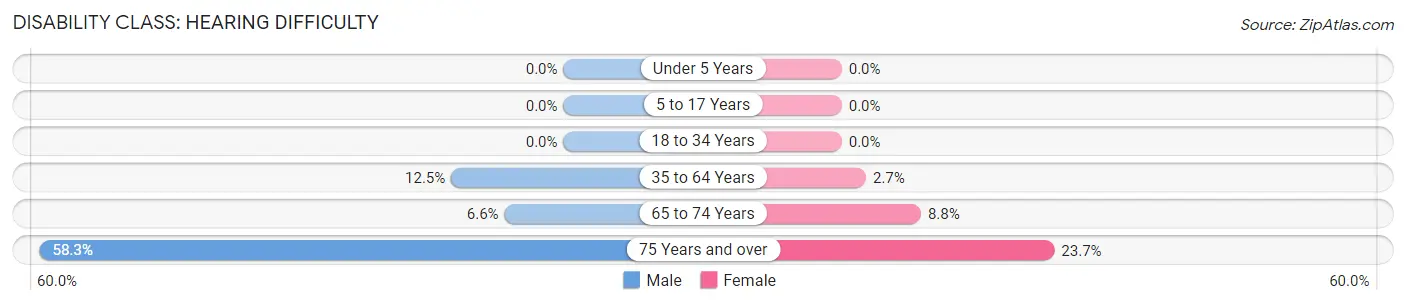
| Age Bracket | Male | Female |
| Under 5 Years | 0 (0.0%) | 0 (0.0%) |
| 5 to 17 Years | 0 (0.0%) | 0 (0.0%) |
| 18 to 34 Years | 0 (0.0%) | 0 (0.0%) |
| 35 to 64 Years | 17 (12.5%) | 4 (2.7%) |
| 65 to 74 Years | 4 (6.6%) | 3 (8.8%) |
| 75 Years and over | 7 (58.3%) | 9 (23.7%) |
Disability Class: Vision Difficulty
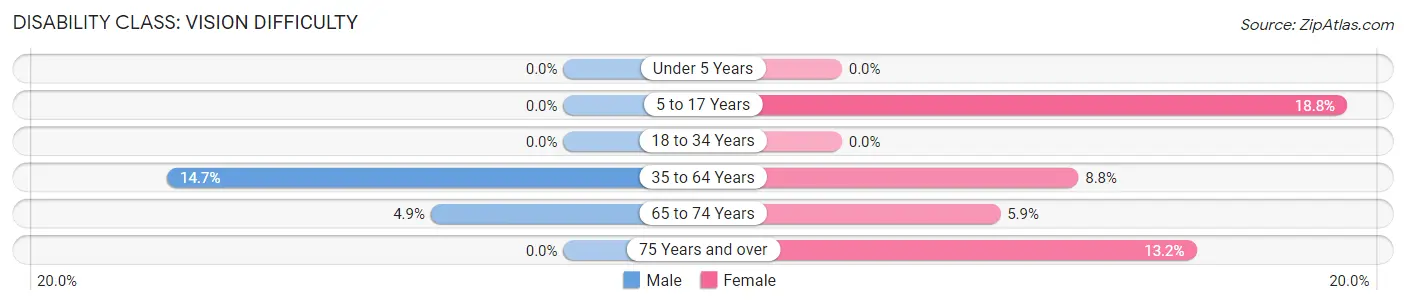
| Age Bracket | Male | Female |
| Under 5 Years | 0 (0.0%) | 0 (0.0%) |
| 5 to 17 Years | 0 (0.0%) | 9 (18.8%) |
| 18 to 34 Years | 0 (0.0%) | 0 (0.0%) |
| 35 to 64 Years | 20 (14.7%) | 13 (8.8%) |
| 65 to 74 Years | 3 (4.9%) | 2 (5.9%) |
| 75 Years and over | 0 (0.0%) | 5 (13.2%) |
Disability Class: Cognitive Difficulty
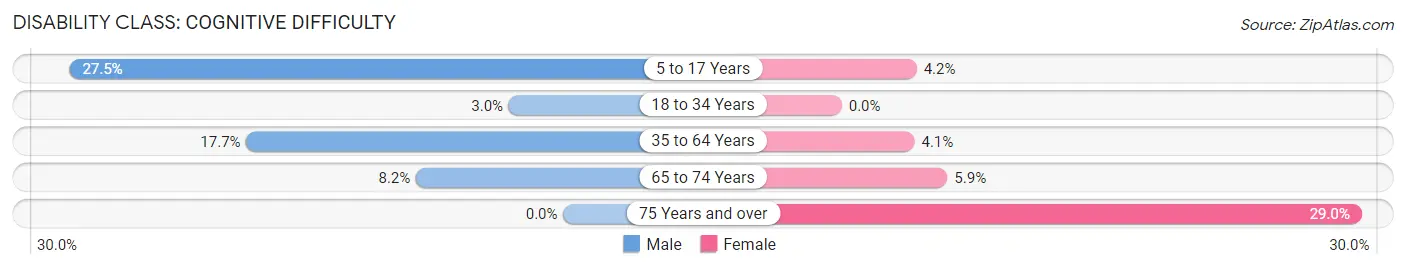
| Age Bracket | Male | Female |
| 5 to 17 Years | 11 (27.5%) | 2 (4.2%) |
| 18 to 34 Years | 2 (3.0%) | 0 (0.0%) |
| 35 to 64 Years | 24 (17.6%) | 6 (4.1%) |
| 65 to 74 Years | 5 (8.2%) | 2 (5.9%) |
| 75 Years and over | 0 (0.0%) | 11 (28.9%) |
Disability Class: Ambulatory Difficulty
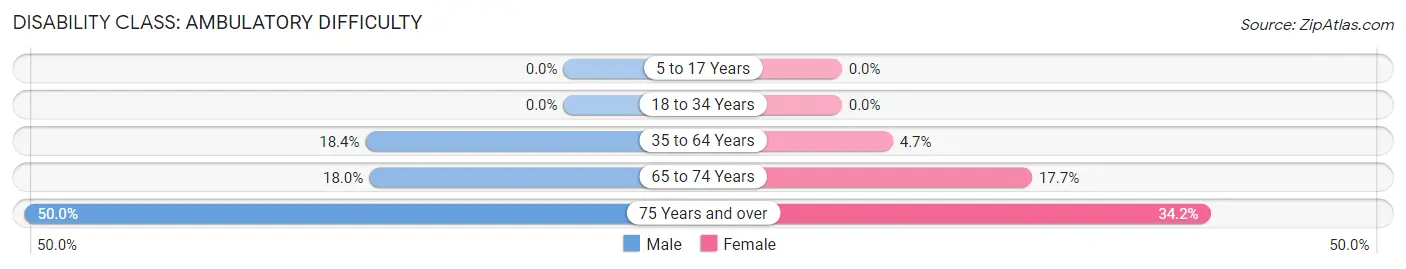
| Age Bracket | Male | Female |
| 5 to 17 Years | 0 (0.0%) | 0 (0.0%) |
| 18 to 34 Years | 0 (0.0%) | 0 (0.0%) |
| 35 to 64 Years | 25 (18.4%) | 7 (4.7%) |
| 65 to 74 Years | 11 (18.0%) | 6 (17.6%) |
| 75 Years and over | 6 (50.0%) | 13 (34.2%) |
Disability Class: Self-Care Difficulty
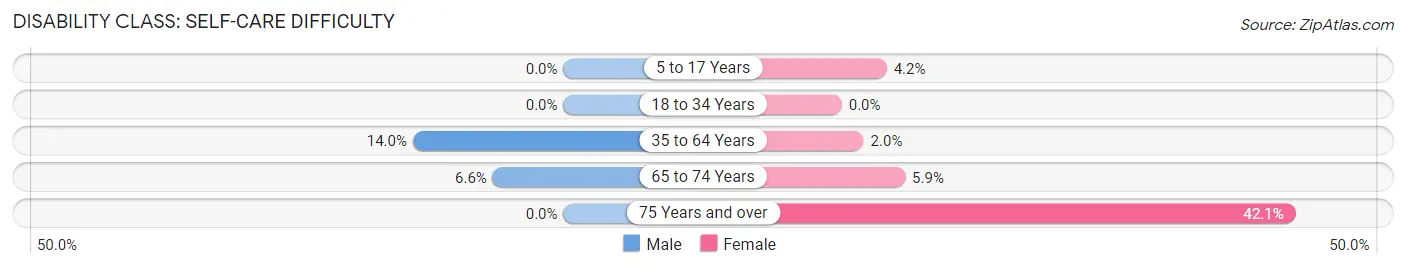
| Age Bracket | Male | Female |
| 5 to 17 Years | 0 (0.0%) | 2 (4.2%) |
| 18 to 34 Years | 0 (0.0%) | 0 (0.0%) |
| 35 to 64 Years | 19 (14.0%) | 3 (2.0%) |
| 65 to 74 Years | 4 (6.6%) | 2 (5.9%) |
| 75 Years and over | 0 (0.0%) | 16 (42.1%) |
Technology Access in Braymer
Computing Device Access in Braymer
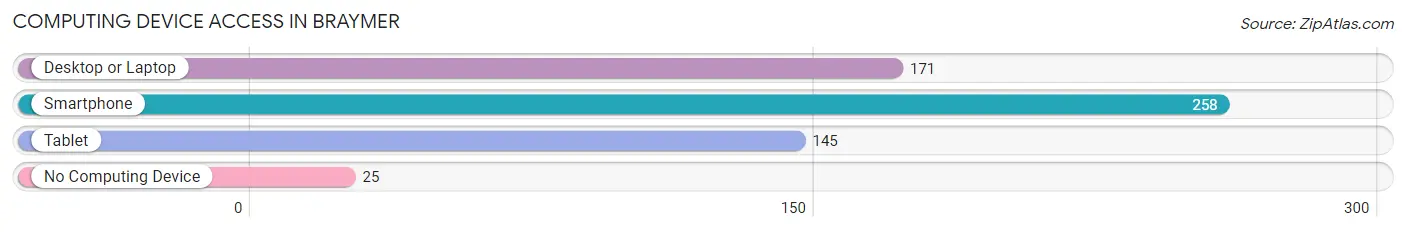
| Device Type | # Households | % Households |
| Desktop or Laptop | 171 | 56.6% |
| Smartphone | 258 | 85.4% |
| Tablet | 145 | 48.0% |
| No Computing Device | 25 | 8.3% |
| Total | 302 | 100.0% |
Internet Access in Braymer
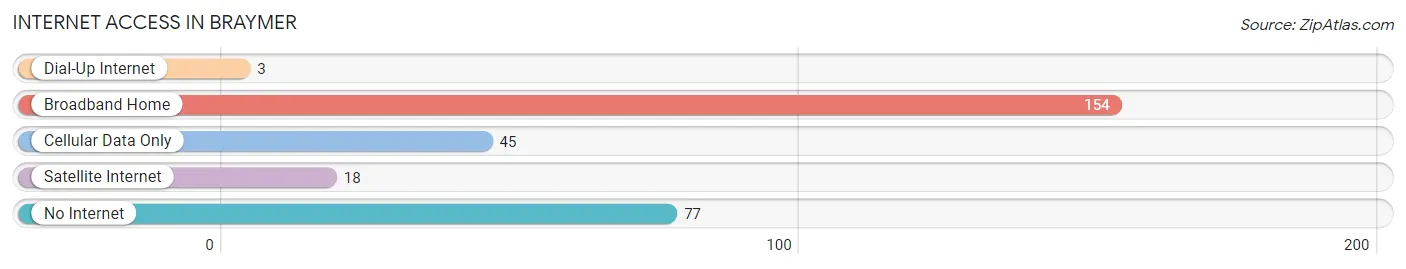
| Internet Type | # Households | % Households |
| Dial-Up Internet | 3 | 1.0% |
| Broadband Home | 154 | 51.0% |
| Cellular Data Only | 45 | 14.9% |
| Satellite Internet | 18 | 6.0% |
| No Internet | 77 | 25.5% |
| Total | 302 | 100.0% |
Braymer Summary
Braymer is a small town located in Caldwell County, Missouri. It is situated in the northwest corner of the state, approximately 50 miles northeast of Kansas City. The town was founded in 1871 and has a population of approximately 1,000 people.
History
Braymer was founded in 1871 by William Braymer, a former Union soldier who had served in the Civil War. He purchased the land from the government and began to develop the town. The first post office was established in 1872 and the town was officially incorporated in 1876.
The town grew slowly but steadily over the years, and by the early 1900s it had become a thriving agricultural community. The town was home to several businesses, including a bank, a hotel, a general store, and a blacksmith shop.
In the 1920s, Braymer began to experience a period of growth and prosperity. The town was home to several factories, including a canning factory, a flour mill, and a furniture factory. The town also had a movie theater, a bowling alley, and a library.
In the 1950s, Braymer experienced a decline in population as many of its residents moved away in search of better job opportunities. The town’s economy suffered as a result, and many of its businesses closed.
In the late 1970s, the town began to experience a resurgence in population and economic activity. The town was home to several new businesses, including a grocery store, a hardware store, and a restaurant.
Geography
Braymer is located in the northwest corner of Missouri, approximately 50 miles northeast of Kansas City. The town is situated in a rural area, surrounded by rolling hills and farmland. The town is located near the Grand River, which provides a source of recreation for the town’s residents.
The town has a total area of 1.2 square miles, all of which is land. The town has a humid continental climate, with hot summers and cold winters.
Economy
Braymer’s economy is largely based on agriculture. The town is home to several farms, which produce a variety of crops, including corn, soybeans, and wheat. The town is also home to several small businesses, including a grocery store, a hardware store, and a restaurant.
Demographics
As of the 2010 census, Braymer had a population of 1,000 people. The town is predominantly white, with approximately 95% of the population identifying as such. The town also has a small Hispanic population, with approximately 3% of the population identifying as such. The median household income in Braymer is $37,000, and the median home value is $90,000.
Common Questions
What is Per Capita Income in Braymer?
Per Capita income in Braymer is $27,500.
What is the Median Family Income in Braymer?
Median Family Income in Braymer is $58,125.
What is the Median Household income in Braymer?
Median Household Income in Braymer is $54,750.
What is Income or Wage Gap in Braymer?
Income or Wage Gap in Braymer is 30.3%.
Women in Braymer earn 69.7 cents for every dollar earned by a man.
What is Inequality or Gini Index in Braymer?
Inequality or Gini Index in Braymer is 0.33.
What is the Total Population of Braymer?
Total Population of Braymer is 691.
What is the Total Male Population of Braymer?
Total Male Population of Braymer is 347.
What is the Total Female Population of Braymer?
Total Female Population of Braymer is 344.
What is the Ratio of Males per 100 Females in Braymer?
There are 100.87 Males per 100 Females in Braymer.
What is the Ratio of Females per 100 Males in Braymer?
There are 99.14 Females per 100 Males in Braymer.
What is the Median Population Age in Braymer?
Median Population Age in Braymer is 47.6 Years.
What is the Average Family Size in Braymer
Average Family Size in Braymer is 2.7 People.
What is the Average Household Size in Braymer
Average Household Size in Braymer is 2.3 People.
How Large is the Labor Force in Braymer?
There are 344 People in the Labor Forcein in Braymer.
What is the Percentage of People in the Labor Force in Braymer?
59.4% of People are in the Labor Force in Braymer.
What is the Unemployment Rate in Braymer?
Unemployment Rate in Braymer is 2.0%.