Zip Codes with the Highest Percentage of Population Employed in Security & Protection in Covington, LA
RELATED REPORTS & OPTIONS
Security & Protection
Covington
Compare Zip Codes
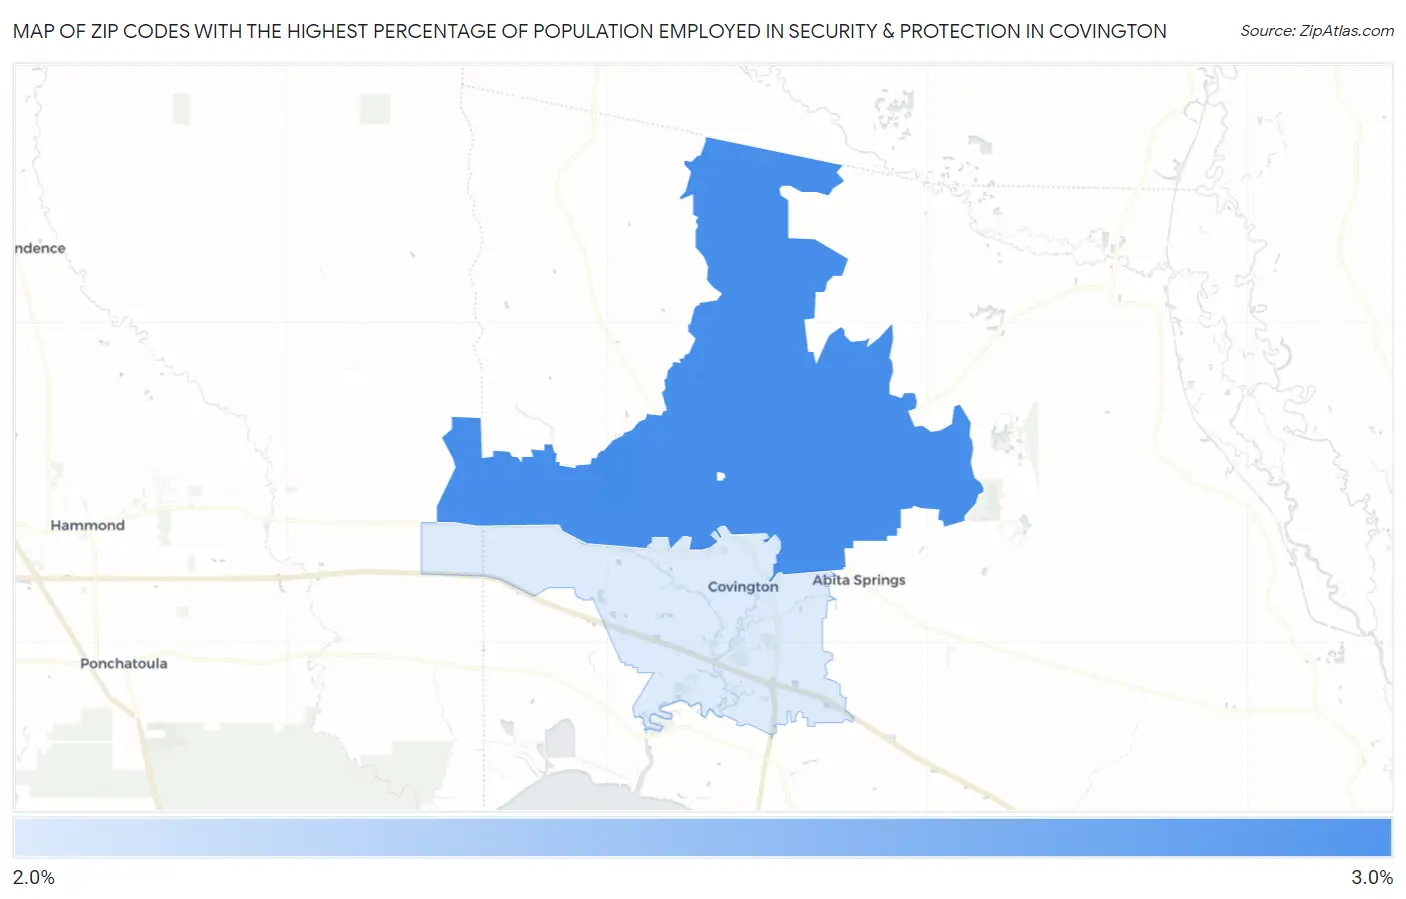
Map of Zip Codes with the Highest Percentage of Population Employed in Security & Protection in Covington
2.2%
3.0%
Zip Codes with the Highest Percentage of Population Employed in Security & Protection in Covington, LA
| Zip Code | % Employed | vs State | vs National | |
| 1. | 70435 | 3.0% | 2.6%(+0.363)#201 | 2.1%(+0.822)#7,339 |
| 2. | 70433 | 2.2% | 2.6%(-0.416)#256 | 2.1%(+0.042)#11,315 |
1
Common Questions
What are the Top Zip Codes with the Highest Percentage of Population Employed in Security & Protection in Covington, LA?
Top Zip Codes with the Highest Percentage of Population Employed in Security & Protection in Covington, LA are:
What zip code has the Highest Percentage of Population Employed in Security & Protection in Covington, LA?
70435 has the Highest Percentage of Population Employed in Security & Protection in Covington, LA with 3.0%.
What is the Percentage of Population Employed in Security & Protection in Covington, LA?
Percentage of Population Employed in Security & Protection in Covington is 1.9%.
What is the Percentage of Population Employed in Security & Protection in Louisiana?
Percentage of Population Employed in Security & Protection in Louisiana is 2.6%.
What is the Percentage of Population Employed in Security & Protection in the United States?
Percentage of Population Employed in Security & Protection in the United States is 2.1%.