Wilson, LA Map & Demographics
Wilson Map
Wilson Overview
$16,322
PER CAPITA INCOME
$33,824
AVG FAMILY INCOME
$32,868
AVG HOUSEHOLD INCOME
4.7%
WAGE / INCOME GAP [ % ]
95.3¢/ $1
WAGE / INCOME GAP [ $ ]
0.45
INEQUALITY / GINI INDEX
715
TOTAL POPULATION
250
MALE POPULATION
465
FEMALE POPULATION
53.76
MALES / 100 FEMALES
186.00
FEMALES / 100 MALES
47.7
MEDIAN AGE
2.9
AVG FAMILY SIZE
2.5
AVG HOUSEHOLD SIZE
178
LABOR FORCE [ PEOPLE ]
30.6%
PERCENT IN LABOR FORCE
Wilson Zip Codes
Wilson Area Codes
Income in Wilson
Income Overview in Wilson
Per Capita Income in Wilson is $16,322, while median incomes of families and households are $33,824 and $32,868 respectively.
| Characteristic | Number | Measure |
| Per Capita Income | 715 | $16,322 |
| Median Family Income | 222 | $33,824 |
| Mean Family Income | 222 | $43,635 |
| Median Household Income | 284 | $32,868 |
| Mean Household Income | 284 | $38,088 |
| Income Deficit | 222 | $0 |
| Wage / Income Gap (%) | 715 | 4.72% |
| Wage / Income Gap ($) | 715 | 95.28¢ per $1 |
| Gini / Inequality Index | 715 | 0.45 |
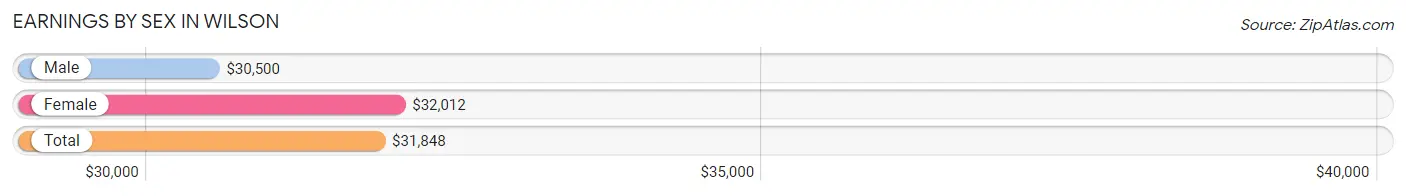
Earnings by Sex in Wilson
Average Earnings in Wilson are $31,848, $30,500 for men and $32,012 for women, a difference of 4.7%.
| Sex | Number | Average Earnings |
| Male | 64 (35.2%) | $30,500 |
| Female | 118 (64.8%) | $32,012 |
| Total | 182 (100.0%) | $31,848 |
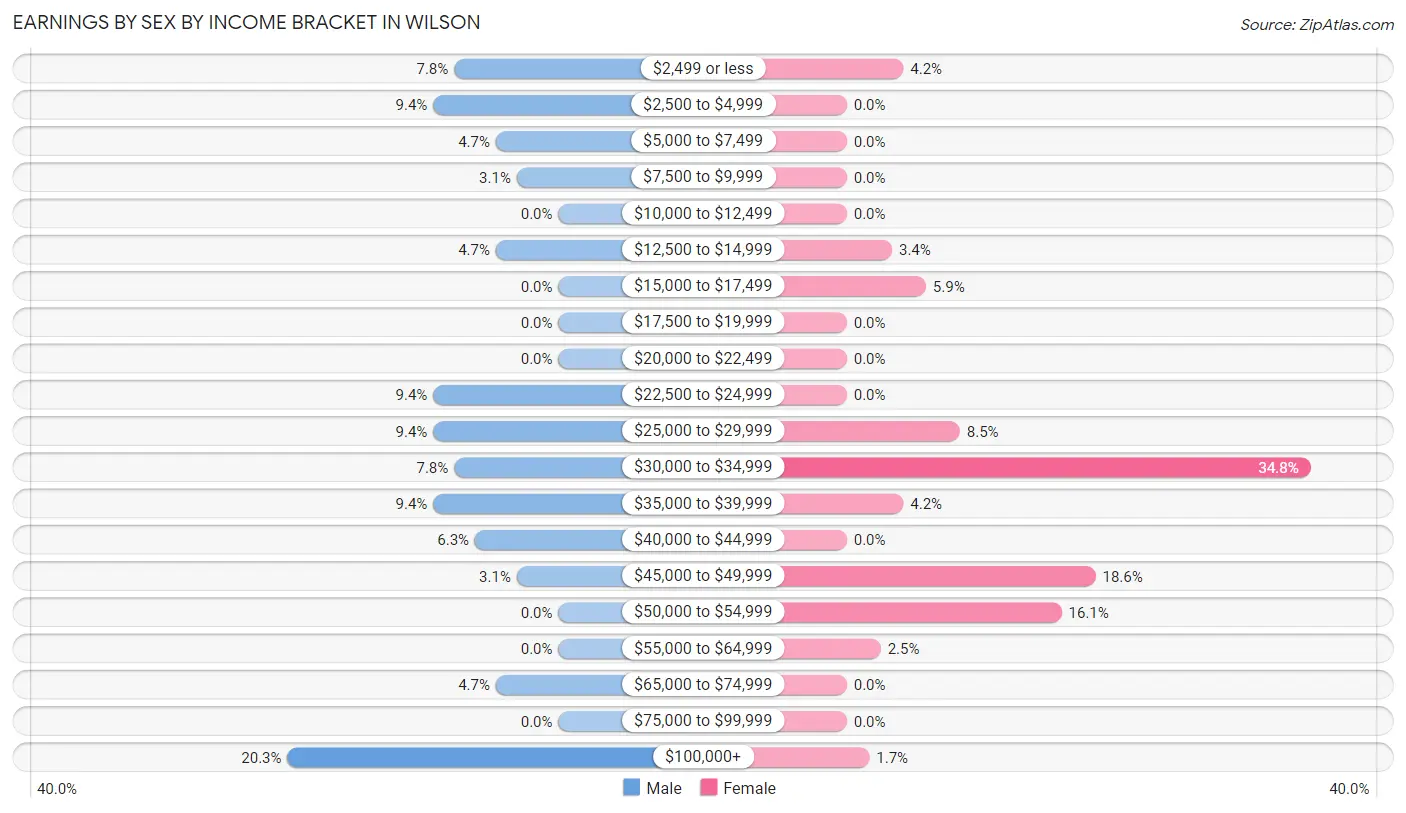
Earnings by Sex by Income Bracket in Wilson
The most common earnings brackets in Wilson are $100,000+ for men (13 | 20.3%) and $30,000 to $34,999 for women (41 | 34.7%).
| Income | Male | Female |
| $2,499 or less | 5 (7.8%) | 5 (4.2%) |
| $2,500 to $4,999 | 6 (9.4%) | 0 (0.0%) |
| $5,000 to $7,499 | 3 (4.7%) | 0 (0.0%) |
| $7,500 to $9,999 | 2 (3.1%) | 0 (0.0%) |
| $10,000 to $12,499 | 0 (0.0%) | 0 (0.0%) |
| $12,500 to $14,999 | 3 (4.7%) | 4 (3.4%) |
| $15,000 to $17,499 | 0 (0.0%) | 7 (5.9%) |
| $17,500 to $19,999 | 0 (0.0%) | 0 (0.0%) |
| $20,000 to $22,499 | 0 (0.0%) | 0 (0.0%) |
| $22,500 to $24,999 | 6 (9.4%) | 0 (0.0%) |
| $25,000 to $29,999 | 6 (9.4%) | 10 (8.5%) |
| $30,000 to $34,999 | 5 (7.8%) | 41 (34.7%) |
| $35,000 to $39,999 | 6 (9.4%) | 5 (4.2%) |
| $40,000 to $44,999 | 4 (6.2%) | 0 (0.0%) |
| $45,000 to $49,999 | 2 (3.1%) | 22 (18.6%) |
| $50,000 to $54,999 | 0 (0.0%) | 19 (16.1%) |
| $55,000 to $64,999 | 0 (0.0%) | 3 (2.5%) |
| $65,000 to $74,999 | 3 (4.7%) | 0 (0.0%) |
| $75,000 to $99,999 | 0 (0.0%) | 0 (0.0%) |
| $100,000+ | 13 (20.3%) | 2 (1.7%) |
| Total | 64 (100.0%) | 118 (100.0%) |
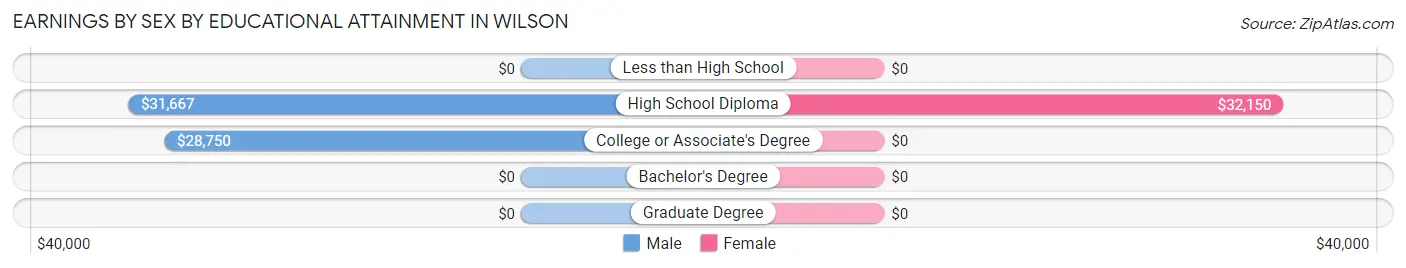
Earnings by Sex by Educational Attainment in Wilson
Average earnings in Wilson are $32,000 for men and $35,250 for women, a difference of 9.2%. Men with an educational attainment of high school diploma enjoy the highest average annual earnings of $31,667, while those with college or associate's degree education earn the least with $28,750. Women with an educational attainment of high school diploma earn the most with the average annual earnings of $32,150, while those with high school diploma education have the smallest earnings of $32,150.
| Educational Attainment | Male Income | Female Income |
| Less than High School | - | - |
| High School Diploma | $31,667 | $32,150 |
| College or Associate's Degree | $28,750 | $0 |
| Bachelor's Degree | - | - |
| Graduate Degree | - | - |
| Total | $32,000 | $35,250 |
Family Income in Wilson
Family Income Brackets in Wilson
According to the Wilson family income data, there are 68 families falling into the $25,000 to $34,999 income range, which is the most common income bracket and makes up 30.6% of all families.
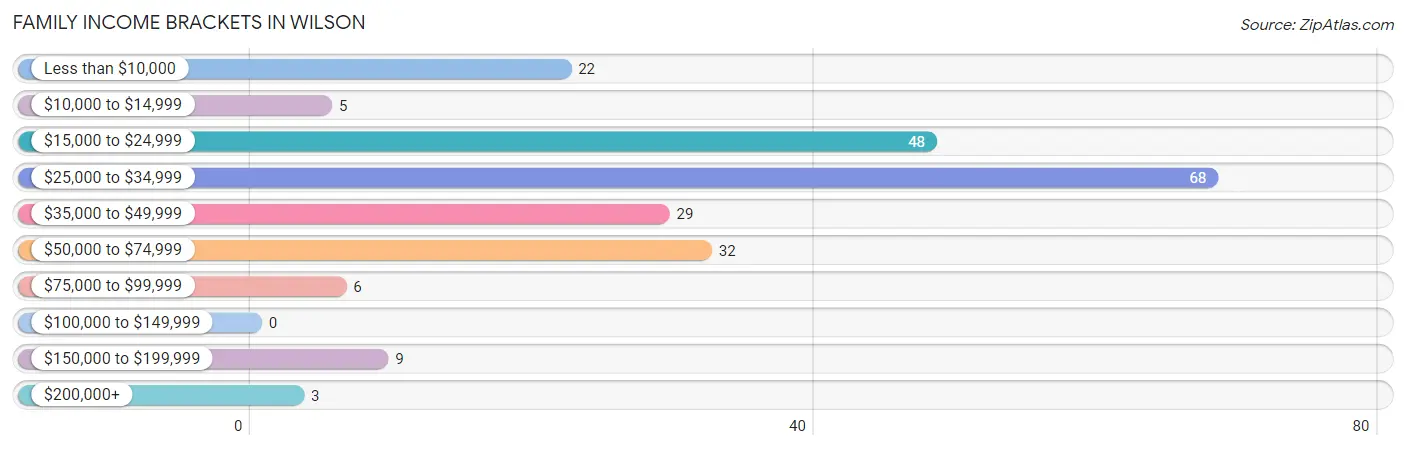
| Income Bracket | # Families | % Families |
| Less than $10,000 | 22 | 9.9% |
| $10,000 to $14,999 | 5 | 2.3% |
| $15,000 to $24,999 | 48 | 21.6% |
| $25,000 to $34,999 | 68 | 30.6% |
| $35,000 to $49,999 | 29 | 13.1% |
| $50,000 to $74,999 | 32 | 14.4% |
| $75,000 to $99,999 | 6 | 2.7% |
| $100,000 to $149,999 | 0 | 0.0% |
| $150,000 to $199,999 | 9 | 4.1% |
| $200,000+ | 3 | 1.4% |
Family Income by Famaliy Size in Wilson
4-person families (34 | 15.3%) account for the highest median family income in Wilson with $67,763 per family, while 4-person families (34 | 15.3%) have the highest median income of $16,941 per family member.
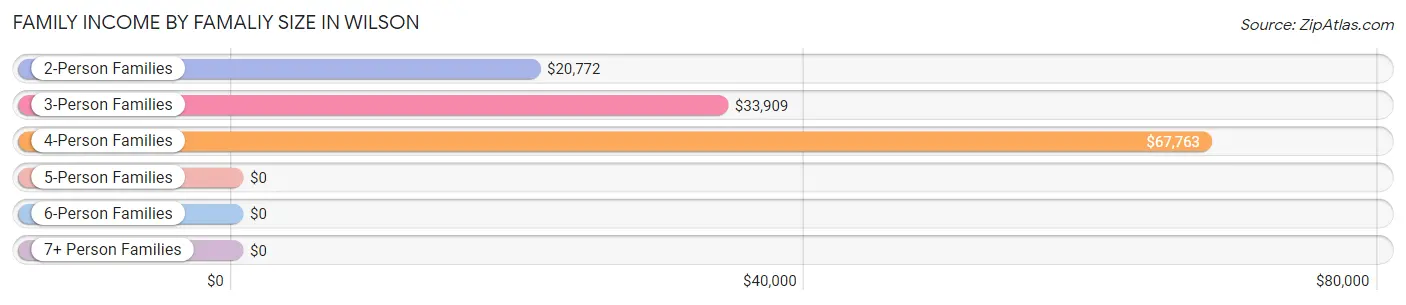
| Income Bracket | # Families | Median Income |
| 2-Person Families | 87 (39.2%) | $20,772 |
| 3-Person Families | 85 (38.3%) | $33,909 |
| 4-Person Families | 34 (15.3%) | $67,763 |
| 5-Person Families | 0 (0.0%) | $0 |
| 6-Person Families | 16 (7.2%) | $0 |
| 7+ Person Families | 0 (0.0%) | $0 |
| Total | 222 (100.0%) | $33,824 |
Family Income by Number of Earners in Wilson
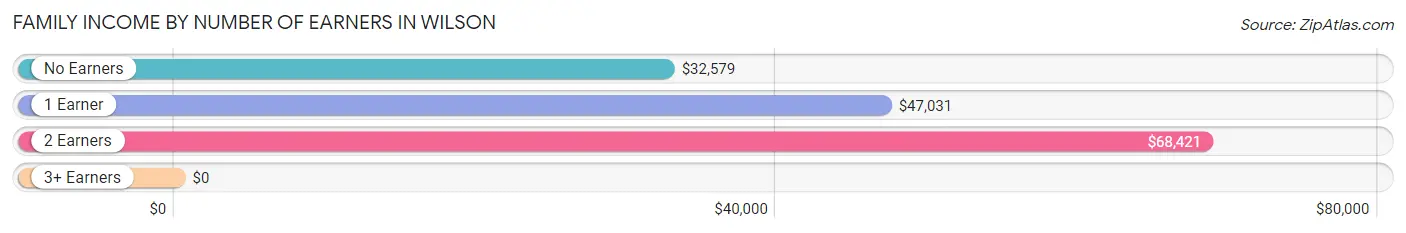
| Number of Earners | # Families | Median Income |
| No Earners | 130 (58.6%) | $32,579 |
| 1 Earner | 54 (24.3%) | $47,031 |
| 2 Earners | 30 (13.5%) | $68,421 |
| 3+ Earners | 8 (3.6%) | $0 |
| Total | 222 (100.0%) | $33,824 |
Household Income in Wilson
Household Income Brackets in Wilson
With 81 households falling in the category, the $25,000 to $34,999 income range is the most frequent in Wilson, accounting for 28.5% of all households. In contrast, only 2 households (0.7%) fall into the $100,000 to $149,999 income bracket, making it the least populous group.
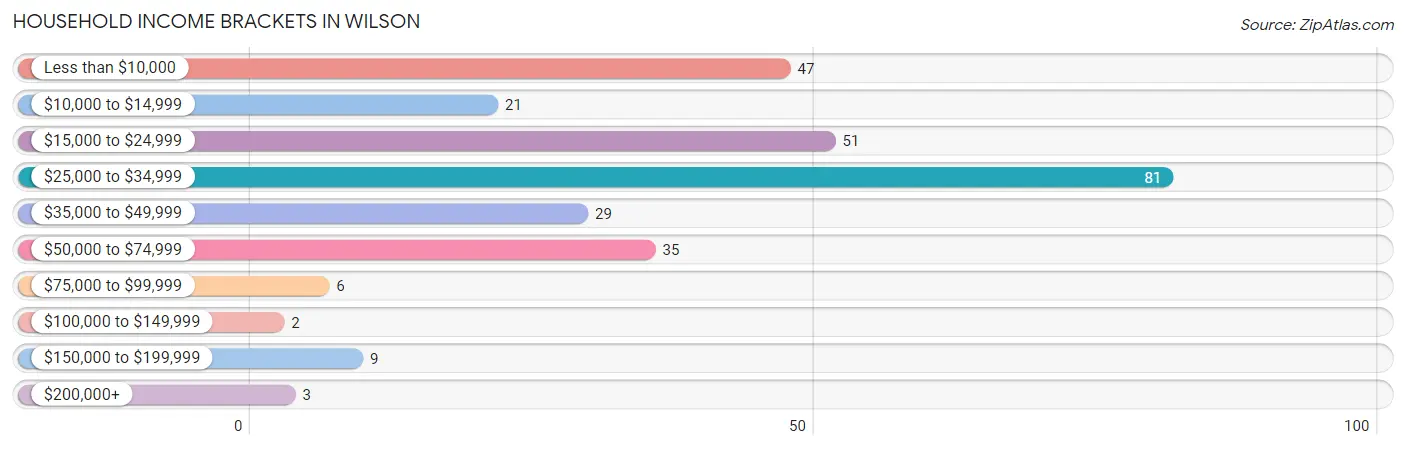
| Income Bracket | # Households | % Households |
| Less than $10,000 | 47 | 16.5% |
| $10,000 to $14,999 | 21 | 7.4% |
| $15,000 to $24,999 | 51 | 18.0% |
| $25,000 to $34,999 | 81 | 28.5% |
| $35,000 to $49,999 | 29 | 10.2% |
| $50,000 to $74,999 | 35 | 12.3% |
| $75,000 to $99,999 | 6 | 2.1% |
| $100,000 to $149,999 | 2 | 0.7% |
| $150,000 to $199,999 | 9 | 3.2% |
| $200,000+ | 3 | 1.1% |
Household Income by Householder Age in Wilson
The median household income in Wilson is $32,868, with the highest median household income of $47,344 found in the 25 to 44 years age bracket for the primary householder. A total of 48 households (16.9%) fall into this category. Meanwhile, the 15 to 24 years age bracket for the primary householder has the lowest median household income of $0, with 4 households (1.4%) in this group.
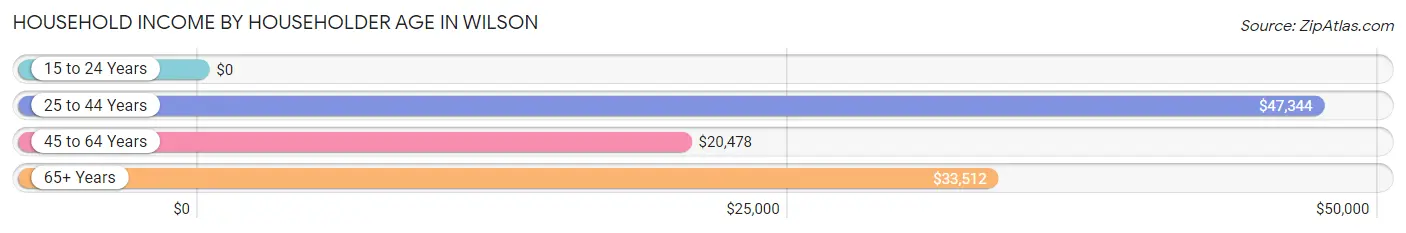
| Income Bracket | # Households | Median Income |
| 15 to 24 Years | 4 (1.4%) | $0 |
| 25 to 44 Years | 48 (16.9%) | $47,344 |
| 45 to 64 Years | 129 (45.4%) | $20,478 |
| 65+ Years | 103 (36.3%) | $33,512 |
| Total | 284 (100.0%) | $32,868 |
Poverty in Wilson
Income Below Poverty by Sex and Age in Wilson
With 28.8% poverty level for males and 11.6% for females among the residents of Wilson, 75 year old and over males and 75 year old and over females are the most vulnerable to poverty, with 8 males (72.7%) and 2 females (66.7%) in their respective age groups living below the poverty level.
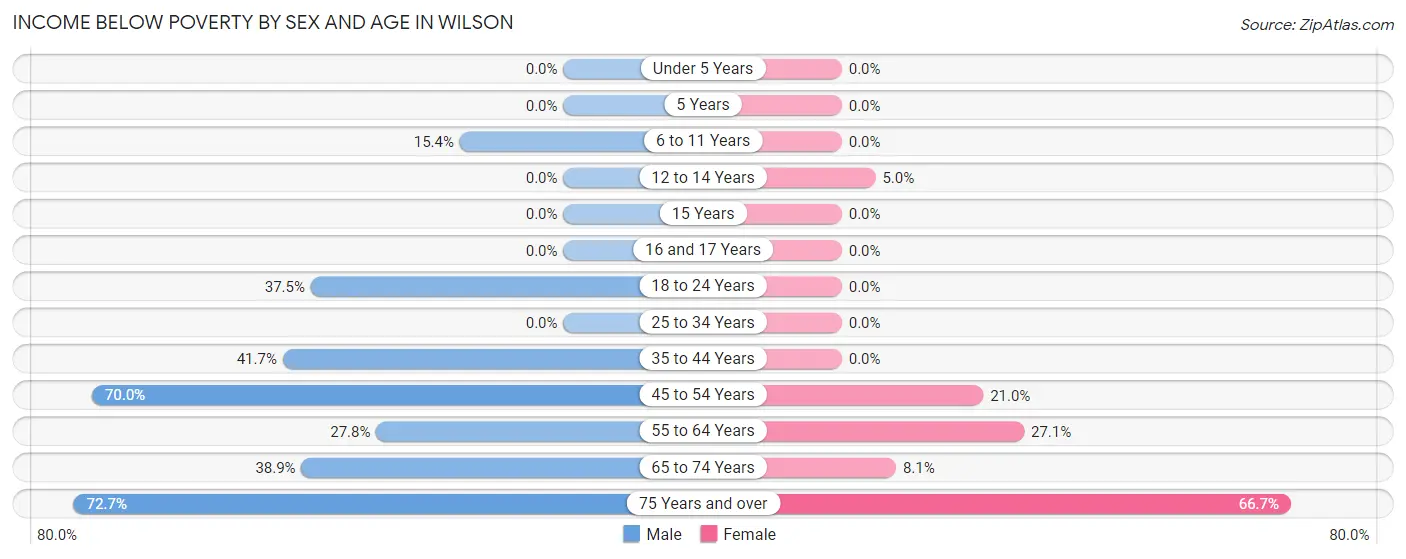
| Age Bracket | Male | Female |
| Under 5 Years | 0 (0.0%) | 0 (0.0%) |
| 5 Years | 0 (0.0%) | 0 (0.0%) |
| 6 to 11 Years | 4 (15.4%) | 0 (0.0%) |
| 12 to 14 Years | 0 (0.0%) | 1 (5.0%) |
| 15 Years | 0 (0.0%) | 0 (0.0%) |
| 16 and 17 Years | 0 (0.0%) | 0 (0.0%) |
| 18 to 24 Years | 6 (37.5%) | 0 (0.0%) |
| 25 to 34 Years | 0 (0.0%) | 0 (0.0%) |
| 35 to 44 Years | 20 (41.7%) | 0 (0.0%) |
| 45 to 54 Years | 7 (70.0%) | 21 (21.0%) |
| 55 to 64 Years | 20 (27.8%) | 23 (27.1%) |
| 65 to 74 Years | 7 (38.9%) | 7 (8.1%) |
| 75 Years and over | 8 (72.7%) | 2 (66.7%) |
| Total | 72 (28.8%) | 54 (11.6%) |
Income Above Poverty by Sex and Age in Wilson
According to the poverty statistics in Wilson, males aged under 5 years and females aged under 5 years are the age groups that are most secure financially, with 100.0% of males and 100.0% of females in these age groups living above the poverty line.
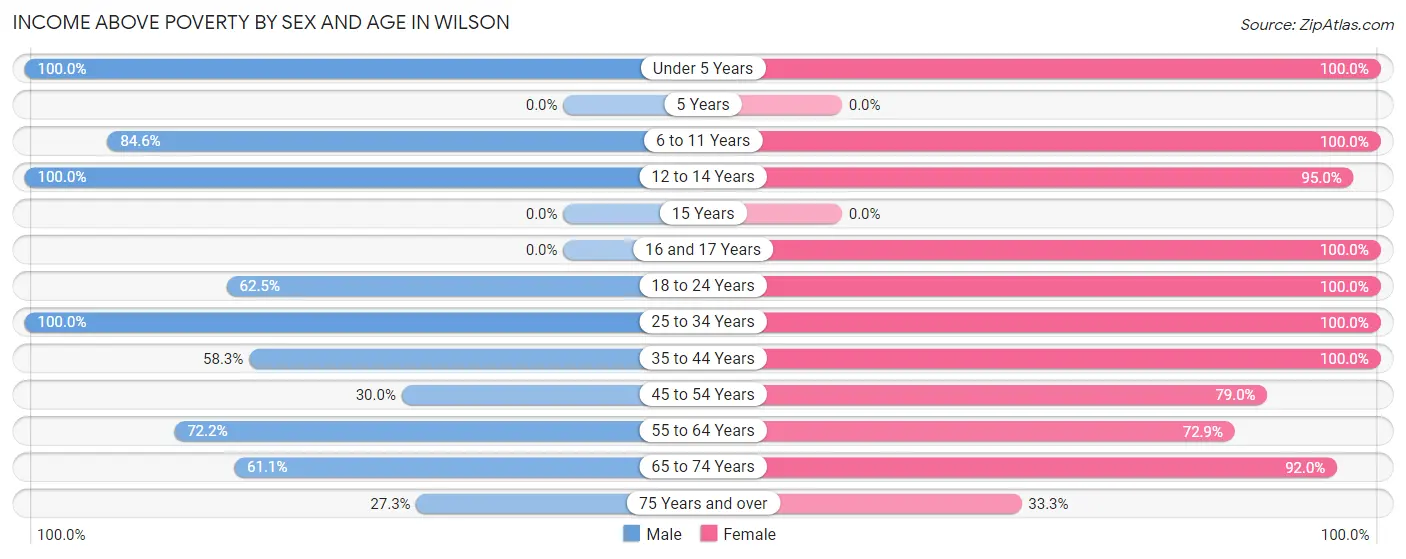
| Age Bracket | Male | Female |
| Under 5 Years | 13 (100.0%) | 12 (100.0%) |
| 5 Years | 0 (0.0%) | 0 (0.0%) |
| 6 to 11 Years | 22 (84.6%) | 33 (100.0%) |
| 12 to 14 Years | 30 (100.0%) | 19 (95.0%) |
| 15 Years | 0 (0.0%) | 0 (0.0%) |
| 16 and 17 Years | 0 (0.0%) | 6 (100.0%) |
| 18 to 24 Years | 10 (62.5%) | 17 (100.0%) |
| 25 to 34 Years | 6 (100.0%) | 25 (100.0%) |
| 35 to 44 Years | 28 (58.3%) | 77 (100.0%) |
| 45 to 54 Years | 3 (30.0%) | 79 (79.0%) |
| 55 to 64 Years | 52 (72.2%) | 62 (72.9%) |
| 65 to 74 Years | 11 (61.1%) | 80 (91.9%) |
| 75 Years and over | 3 (27.3%) | 1 (33.3%) |
| Total | 178 (71.2%) | 411 (88.4%) |
Income Below Poverty Among Married-Couple Families in Wilson
The poverty statistics for married-couple families in Wilson show that 27.6% or 29 of the total 105 families live below the poverty line. Families with no children have the highest poverty rate of 34.6%, comprising of 28 families. On the other hand, families with 3 or 4 children have the lowest poverty rate of 0.0%, which includes 0 families.
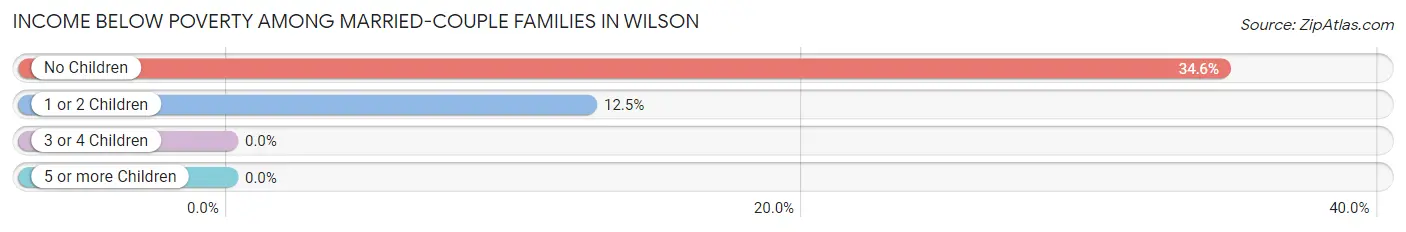
| Children | Above Poverty | Below Poverty |
| No Children | 53 (65.4%) | 28 (34.6%) |
| 1 or 2 Children | 7 (87.5%) | 1 (12.5%) |
| 3 or 4 Children | 16 (100.0%) | 0 (0.0%) |
| 5 or more Children | 0 (0.0%) | 0 (0.0%) |
| Total | 76 (72.4%) | 29 (27.6%) |
Income Below Poverty Among Single-Parent Households in Wilson
According to the poverty data in Wilson, 9.1% or 1 single-father households and 3.8% or 4 single-mother households are living below the poverty line. Among single-father households, those with 1 or 2 children have the highest poverty rate, with 1 households (12.5%) experiencing poverty. Likewise, among single-mother households, those with no children have the highest poverty rate, with 4 households (5.3%) falling below the poverty line.
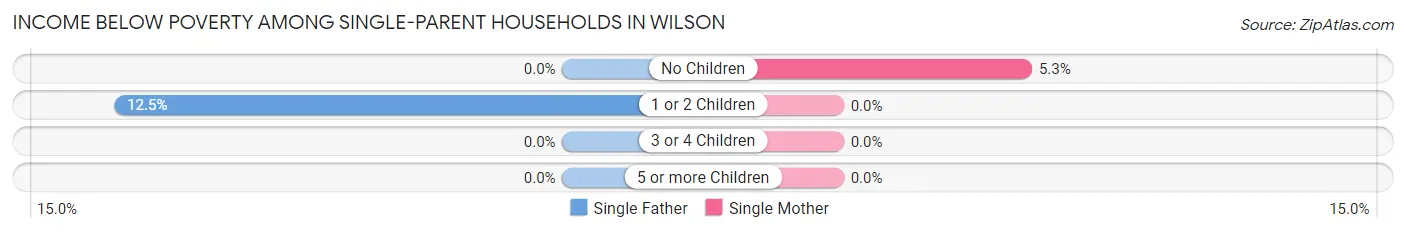
| Children | Single Father | Single Mother |
| No Children | 0 (0.0%) | 4 (5.3%) |
| 1 or 2 Children | 1 (12.5%) | 0 (0.0%) |
| 3 or 4 Children | 0 (0.0%) | 0 (0.0%) |
| 5 or more Children | 0 (0.0%) | 0 (0.0%) |
| Total | 1 (9.1%) | 4 (3.8%) |
Income Below Poverty Among Married-Couple vs Single-Parent Households in Wilson
The poverty data for Wilson shows that 29 of the married-couple family households (27.6%) and 5 of the single-parent households (4.3%) are living below the poverty level. Within the married-couple family households, those with no children have the highest poverty rate, with 28 households (34.6%) falling below the poverty line. Among the single-parent households, those with no children have the highest poverty rate, with 4 household (5.1%) living below poverty.
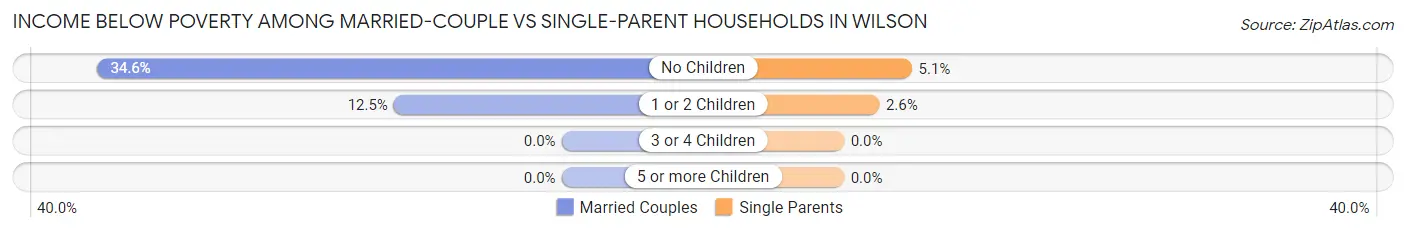
| Children | Married-Couple Families | Single-Parent Households |
| No Children | 28 (34.6%) | 4 (5.1%) |
| 1 or 2 Children | 1 (12.5%) | 1 (2.6%) |
| 3 or 4 Children | 0 (0.0%) | 0 (0.0%) |
| 5 or more Children | 0 (0.0%) | 0 (0.0%) |
| Total | 29 (27.6%) | 5 (4.3%) |
Race in Wilson
The most populous races in Wilson are Black / African American (595 | 83.2%), White / Caucasian (98 | 13.7%), and Two or more Races (12 | 1.7%).
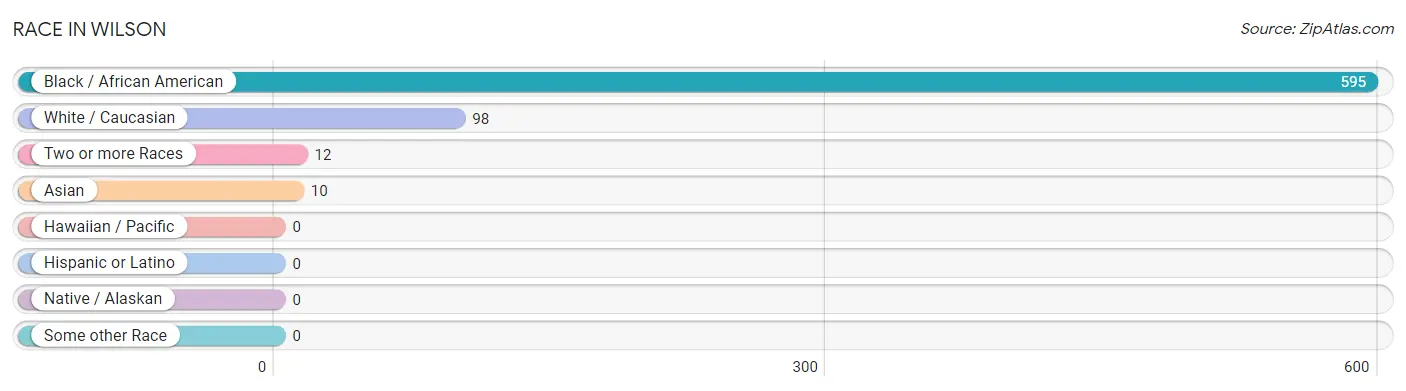
| Race | # Population | % Population |
| Asian | 10 | 1.4% |
| Black / African American | 595 | 83.2% |
| Hawaiian / Pacific | 0 | 0.0% |
| Hispanic or Latino | 0 | 0.0% |
| Native / Alaskan | 0 | 0.0% |
| White / Caucasian | 98 | 13.7% |
| Two or more Races | 12 | 1.7% |
| Some other Race | 0 | 0.0% |
| Total | 715 | 100.0% |
Ancestry in Wilson
The most populous ancestries reported in Wilson are American (27 | 3.8%), French (13 | 1.8%), English (11 | 1.5%), Czech (10 | 1.4%), and Korean (10 | 1.4%), together accounting for 9.9% of all Wilson residents.
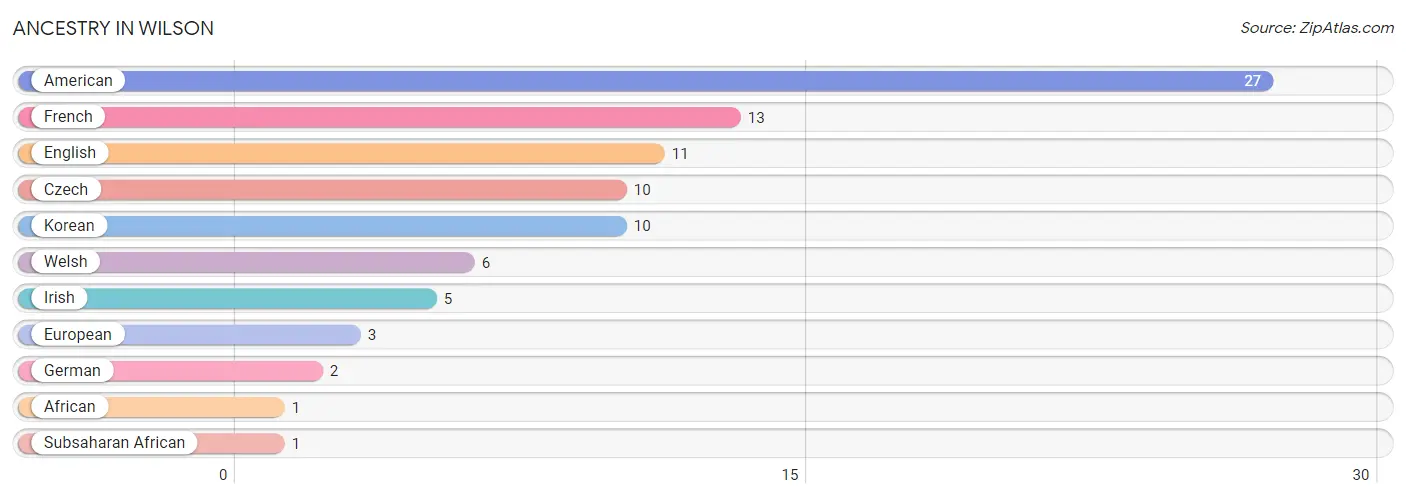
| Ancestry | # Population | % Population |
| African | 1 | 0.1% |
| American | 27 | 3.8% |
| Czech | 10 | 1.4% |
| English | 11 | 1.5% |
| European | 3 | 0.4% |
| French | 13 | 1.8% |
| German | 2 | 0.3% |
| Irish | 5 | 0.7% |
| Korean | 10 | 1.4% |
| Subsaharan African | 1 | 0.1% |
| Welsh | 6 | 0.8% | View All 11 Rows |
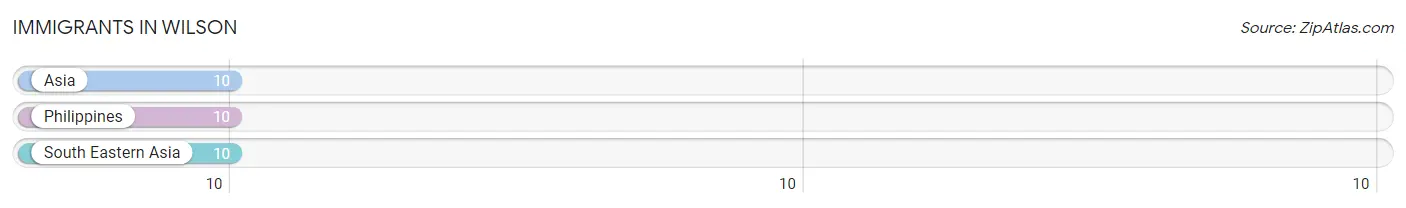
Immigrants in Wilson
The most numerous immigrant groups reported in Wilson came from Asia (10 | 1.4%), Philippines (10 | 1.4%), and South Eastern Asia (10 | 1.4%), together accounting for 4.2% of all Wilson residents.
| Immigration Origin | # Population | % Population |
| Asia | 10 | 1.4% |
| Philippines | 10 | 1.4% |
| South Eastern Asia | 10 | 1.4% | View All 3 Rows |
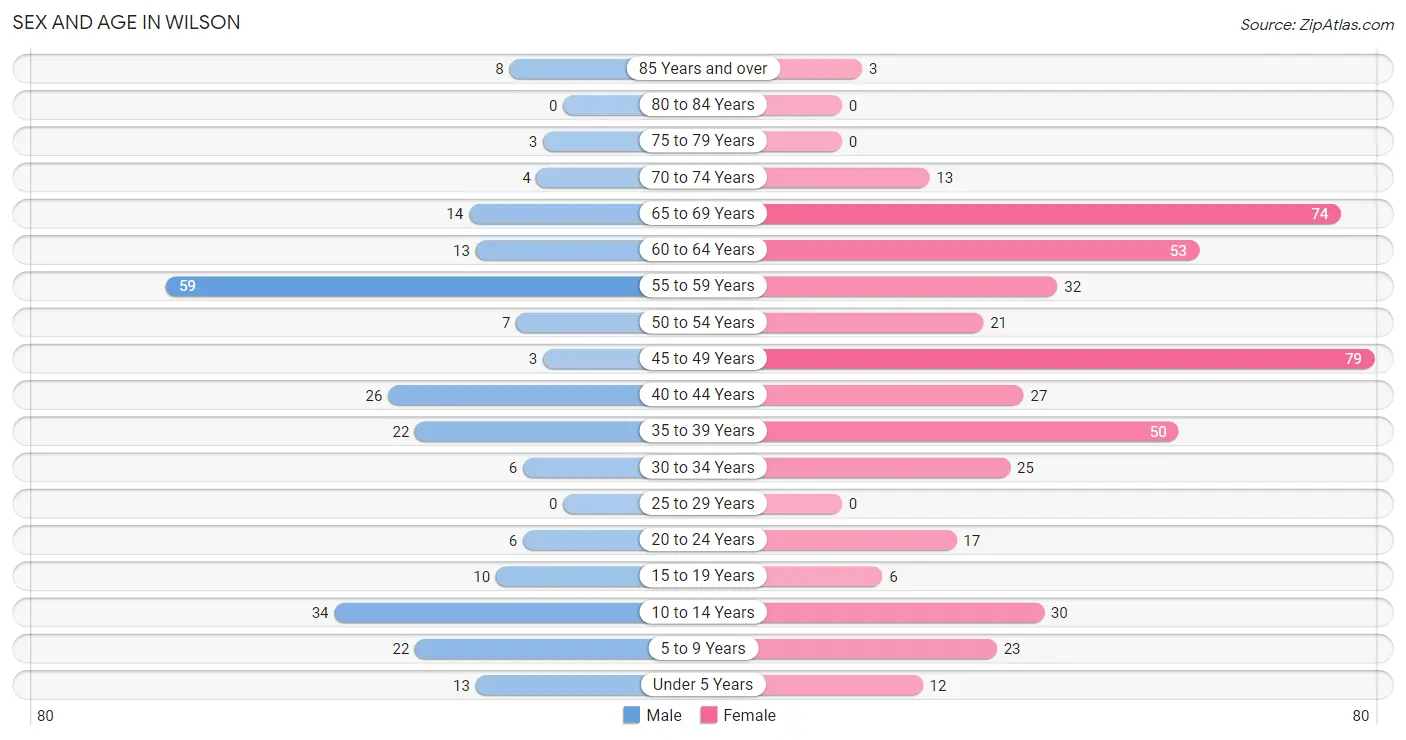
Sex and Age in Wilson
Sex and Age in Wilson
The most populous age groups in Wilson are 55 to 59 Years (59 | 23.6%) for men and 45 to 49 Years (79 | 17.0%) for women.
| Age Bracket | Male | Female |
| Under 5 Years | 13 (5.2%) | 12 (2.6%) |
| 5 to 9 Years | 22 (8.8%) | 23 (5.0%) |
| 10 to 14 Years | 34 (13.6%) | 30 (6.5%) |
| 15 to 19 Years | 10 (4.0%) | 6 (1.3%) |
| 20 to 24 Years | 6 (2.4%) | 17 (3.7%) |
| 25 to 29 Years | 0 (0.0%) | 0 (0.0%) |
| 30 to 34 Years | 6 (2.4%) | 25 (5.4%) |
| 35 to 39 Years | 22 (8.8%) | 50 (10.7%) |
| 40 to 44 Years | 26 (10.4%) | 27 (5.8%) |
| 45 to 49 Years | 3 (1.2%) | 79 (17.0%) |
| 50 to 54 Years | 7 (2.8%) | 21 (4.5%) |
| 55 to 59 Years | 59 (23.6%) | 32 (6.9%) |
| 60 to 64 Years | 13 (5.2%) | 53 (11.4%) |
| 65 to 69 Years | 14 (5.6%) | 74 (15.9%) |
| 70 to 74 Years | 4 (1.6%) | 13 (2.8%) |
| 75 to 79 Years | 3 (1.2%) | 0 (0.0%) |
| 80 to 84 Years | 0 (0.0%) | 0 (0.0%) |
| 85 Years and over | 8 (3.2%) | 3 (0.6%) |
| Total | 250 (100.0%) | 465 (100.0%) |
Families and Households in Wilson
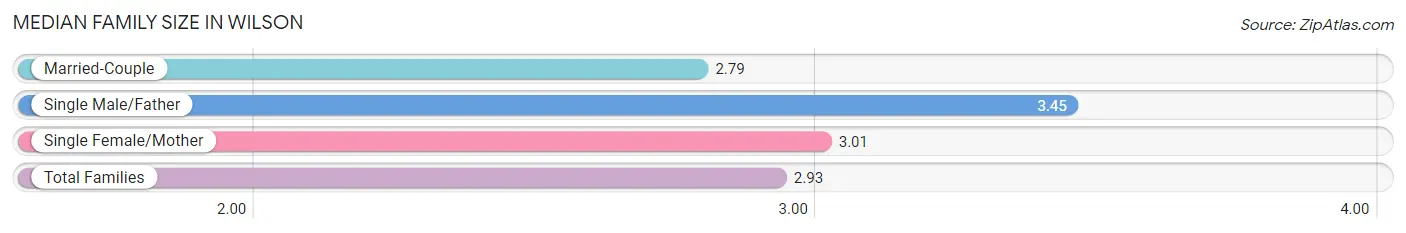
Median Family Size in Wilson
The median family size in Wilson is 2.93 persons per family, with single male/father families (11 | 5.0%) accounting for the largest median family size of 3.45 persons per family. On the other hand, married-couple families (105 | 47.3%) represent the smallest median family size with 2.79 persons per family.
| Family Type | # Families | Family Size |
| Married-Couple | 105 (47.3%) | 2.79 |
| Single Male/Father | 11 (5.0%) | 3.45 |
| Single Female/Mother | 106 (47.7%) | 3.01 |
| Total Families | 222 (100.0%) | 2.93 |
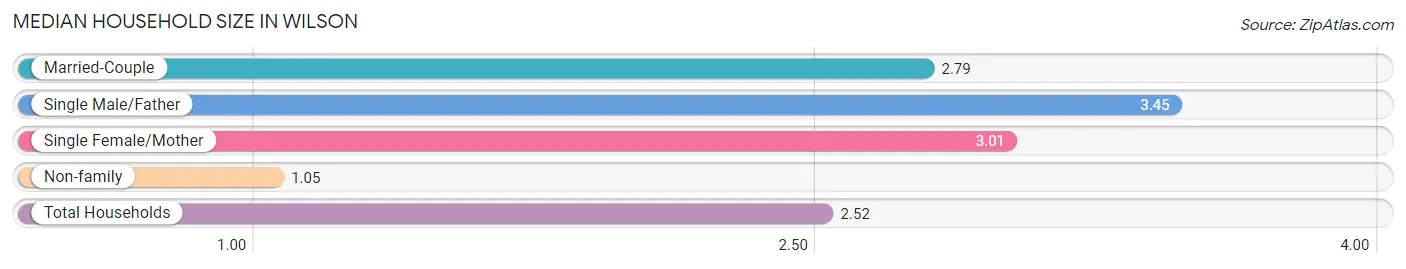
Median Household Size in Wilson
The median household size in Wilson is 2.52 persons per household, with single male/father households (11 | 3.9%) accounting for the largest median household size of 3.45 persons per household. non-family households (62 | 21.8%) represent the smallest median household size with 1.05 persons per household.
| Household Type | # Households | Household Size |
| Married-Couple | 105 (37.0%) | 2.79 |
| Single Male/Father | 11 (3.9%) | 3.45 |
| Single Female/Mother | 106 (37.3%) | 3.01 |
| Non-family | 62 (21.8%) | 1.05 |
| Total Households | 284 (100.0%) | 2.52 |
Household Size by Marriage Status in Wilson
Out of a total of 284 households in Wilson, 222 (78.2%) are family households, while 62 (21.8%) are nonfamily households. The most numerous type of family households are 2-person households, comprising 87, and the most common type of nonfamily households are 1-person households, comprising 59.
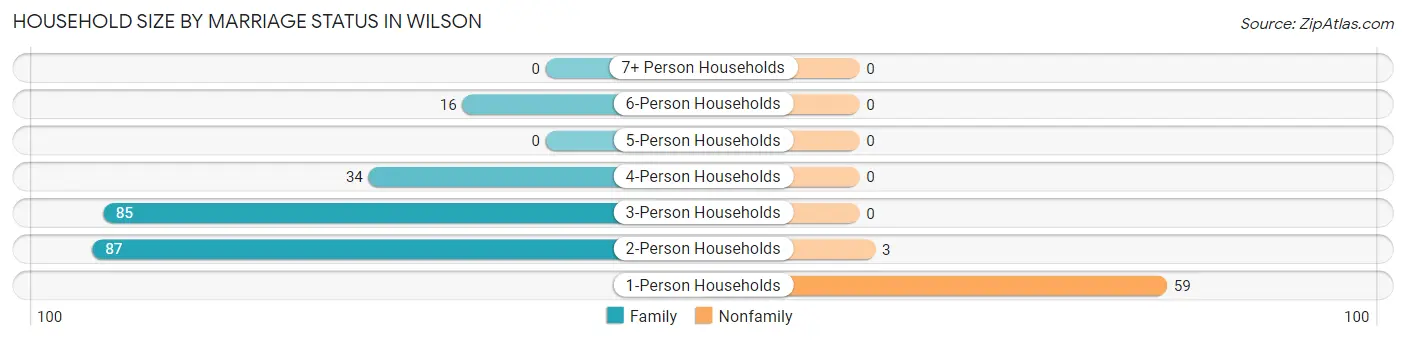
| Household Size | Family Households | Nonfamily Households |
| 1-Person Households | - | 59 (20.8%) |
| 2-Person Households | 87 (30.6%) | 3 (1.1%) |
| 3-Person Households | 85 (29.9%) | 0 (0.0%) |
| 4-Person Households | 34 (12.0%) | 0 (0.0%) |
| 5-Person Households | 0 (0.0%) | 0 (0.0%) |
| 6-Person Households | 16 (5.6%) | 0 (0.0%) |
| 7+ Person Households | 0 (0.0%) | 0 (0.0%) |
| Total | 222 (78.2%) | 62 (21.8%) |
Female Fertility in Wilson
Fertility by Age in Wilson
| Age Bracket | Women with Births | Births / 1,000 Women |
| 15 to 19 years | 0 (0.0%) | 0.0 |
| 20 to 34 years | 0 (0.0%) | 0.0 |
| 35 to 50 years | 0 (0.0%) | 0.0 |
| Total | 0 (0.0%) | 0.0 |
Fertility by Age by Marriage Status in Wilson
| Age Bracket | Married | Unmarried |
| 15 to 19 years | 0 (0.0%) | 0 (0.0%) |
| 20 to 34 years | 0 (0.0%) | 0 (0.0%) |
| 35 to 50 years | 0 (0.0%) | 0 (0.0%) |
| Total | 0 (0.0%) | 0 (0.0%) |
Fertility by Education in Wilson
| Educational Attainment | Women with Births | Births / 1,000 Women |
| Less than High School | 0 (0.0%) | 0.0 |
| High School Diploma | 0 (0.0%) | 0.0 |
| College or Associate's Degree | 0 (0.0%) | 0.0 |
| Bachelor's Degree | 0 (0.0%) | 0.0 |
| Graduate Degree | 0 (0.0%) | 0.0 |
| Total | 0 (0.0%) | 0.0 |
Fertility by Education by Marriage Status in Wilson
| Educational Attainment | Married | Unmarried |
| Less than High School | 0 (0.0%) | 0 (0.0%) |
| High School Diploma | 0 (0.0%) | 0 (0.0%) |
| College or Associate's Degree | 0 (0.0%) | 0 (0.0%) |
| Bachelor's Degree | 0 (0.0%) | 0 (0.0%) |
| Graduate Degree | 0 (0.0%) | 0 (0.0%) |
| Total | 0 (0.0%) | 0 (0.0%) |
Employment Characteristics in Wilson
Employment by Class of Employer in Wilson
Among the 174 employed individuals in Wilson, private company employees (64 | 36.8%), state government employees (53 | 30.5%), and local government employees (51 | 29.3%) make up the most common classes of employment.
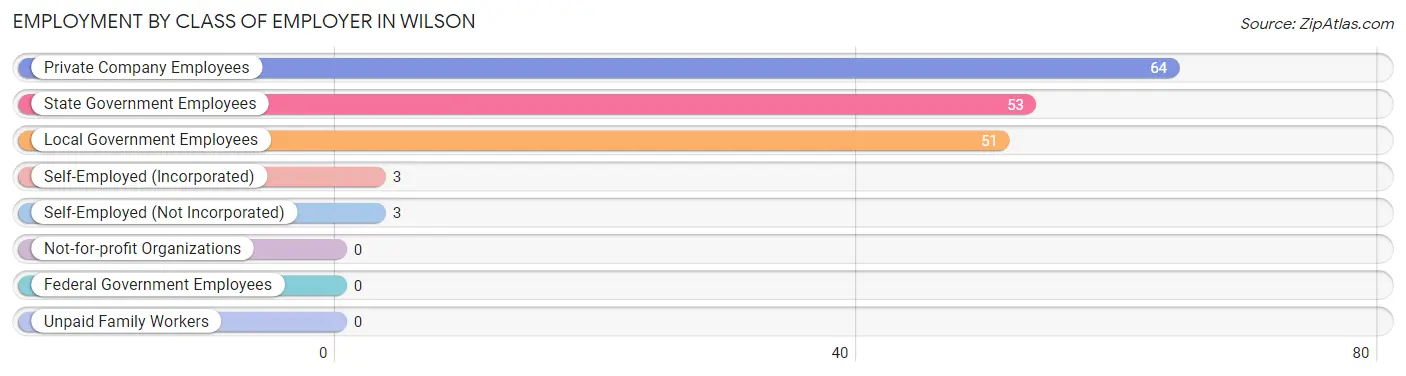
| Employer Class | # Employees | % Employees |
| Private Company Employees | 64 | 36.8% |
| Self-Employed (Incorporated) | 3 | 1.7% |
| Self-Employed (Not Incorporated) | 3 | 1.7% |
| Not-for-profit Organizations | 0 | 0.0% |
| Local Government Employees | 51 | 29.3% |
| State Government Employees | 53 | 30.5% |
| Federal Government Employees | 0 | 0.0% |
| Unpaid Family Workers | 0 | 0.0% |
| Total | 174 | 100.0% |
Employment Status by Age in Wilson
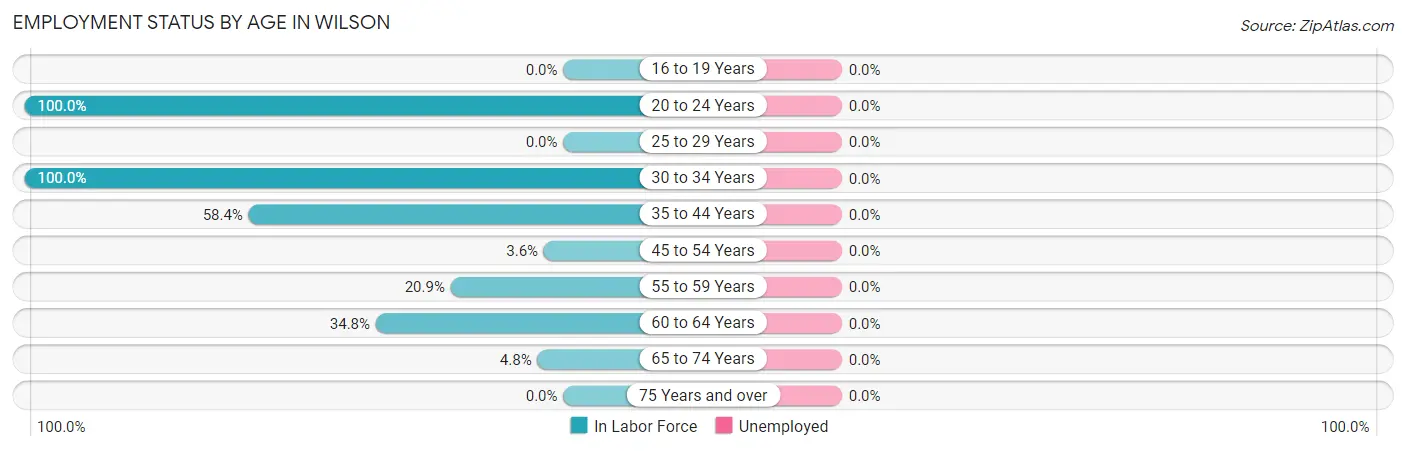
| Age Bracket | In Labor Force | Unemployed |
| 16 to 19 Years | 0 (0.0%) | 0 (0.0%) |
| 20 to 24 Years | 23 (100.0%) | 0 (0.0%) |
| 25 to 29 Years | 0 (0.0%) | 0 (0.0%) |
| 30 to 34 Years | 31 (100.0%) | 0 (0.0%) |
| 35 to 44 Years | 73 (58.4%) | 0 (0.0%) |
| 45 to 54 Years | 4 (3.6%) | 0 (0.0%) |
| 55 to 59 Years | 19 (20.9%) | 0 (0.0%) |
| 60 to 64 Years | 23 (34.8%) | 0 (0.0%) |
| 65 to 74 Years | 5 (4.8%) | 0 (0.0%) |
| 75 Years and over | 0 (0.0%) | 0 (0.0%) |
| Total | 178 (30.6%) | 0 (0.0%) |
Employment Status by Educational Attainment in Wilson
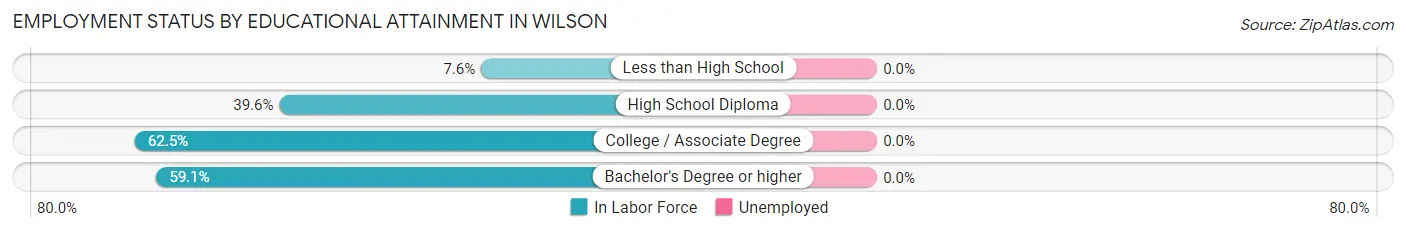
| Educational Attainment | In Labor Force | Unemployed |
| Less than High School | 10 (7.6%) | 0 (0.0%) |
| High School Diploma | 72 (39.6%) | 0 (0.0%) |
| College / Associate Degree | 55 (62.5%) | 0 (0.0%) |
| Bachelor's Degree or higher | 13 (59.1%) | 0 (0.0%) |
| Total | 150 (35.5%) | 0 (0.0%) |
Employment Occupations by Sex in Wilson
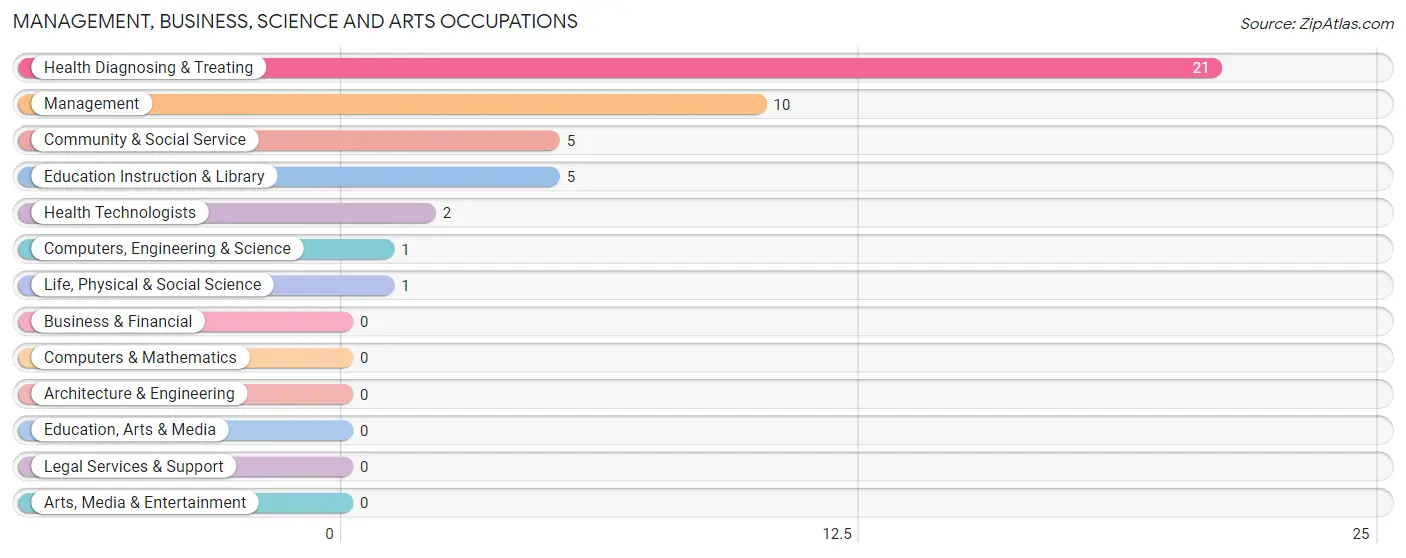
Management, Business, Science and Arts Occupations
The most common Management, Business, Science and Arts occupations in Wilson are Health Diagnosing & Treating (21 | 11.8%), Management (10 | 5.6%), Community & Social Service (5 | 2.8%), Education Instruction & Library (5 | 2.8%), and Health Technologists (2 | 1.1%).
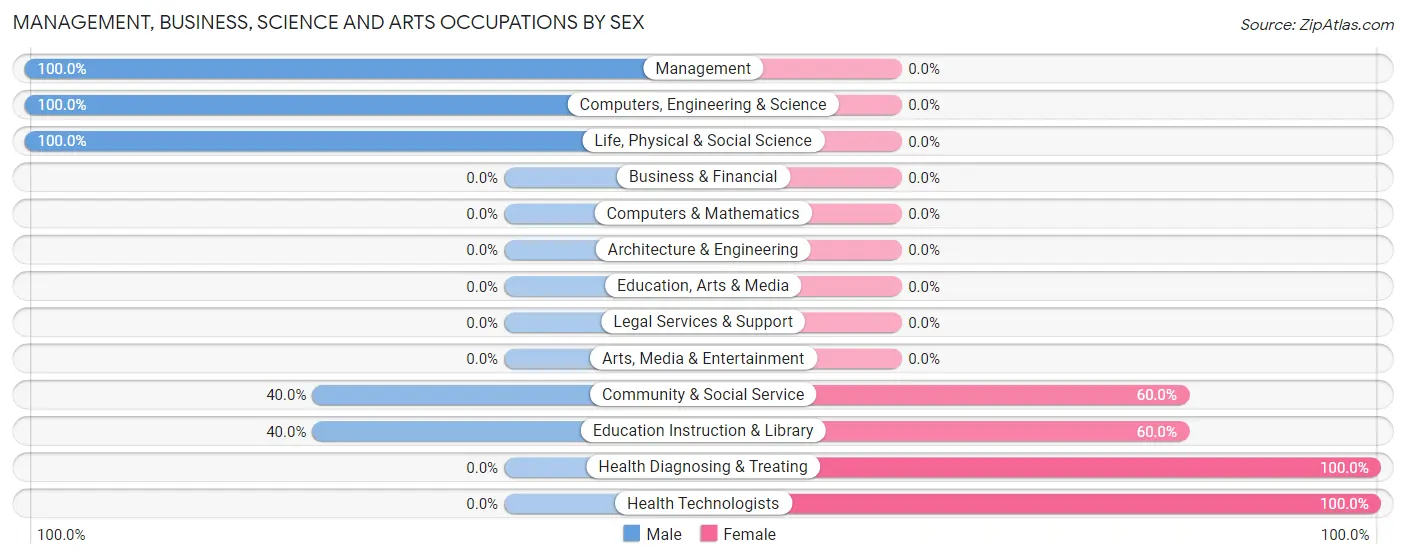
Management, Business, Science and Arts Occupations by Sex
Within the Management, Business, Science and Arts occupations in Wilson, the most male-oriented occupations are Management (100.0%), Computers, Engineering & Science (100.0%), and Life, Physical & Social Science (100.0%), while the most female-oriented occupations are Health Diagnosing & Treating (100.0%), Health Technologists (100.0%), and Community & Social Service (60.0%).
| Occupation | Male | Female |
| Management | 10 (100.0%) | 0 (0.0%) |
| Business & Financial | 0 (0.0%) | 0 (0.0%) |
| Computers, Engineering & Science | 1 (100.0%) | 0 (0.0%) |
| Computers & Mathematics | 0 (0.0%) | 0 (0.0%) |
| Architecture & Engineering | 0 (0.0%) | 0 (0.0%) |
| Life, Physical & Social Science | 1 (100.0%) | 0 (0.0%) |
| Community & Social Service | 2 (40.0%) | 3 (60.0%) |
| Education, Arts & Media | 0 (0.0%) | 0 (0.0%) |
| Legal Services & Support | 0 (0.0%) | 0 (0.0%) |
| Education Instruction & Library | 2 (40.0%) | 3 (60.0%) |
| Arts, Media & Entertainment | 0 (0.0%) | 0 (0.0%) |
| Health Diagnosing & Treating | 0 (0.0%) | 21 (100.0%) |
| Health Technologists | 0 (0.0%) | 2 (100.0%) |
| Total (Category) | 13 (35.1%) | 24 (64.9%) |
| Total (Overall) | 60 (33.7%) | 118 (66.3%) |
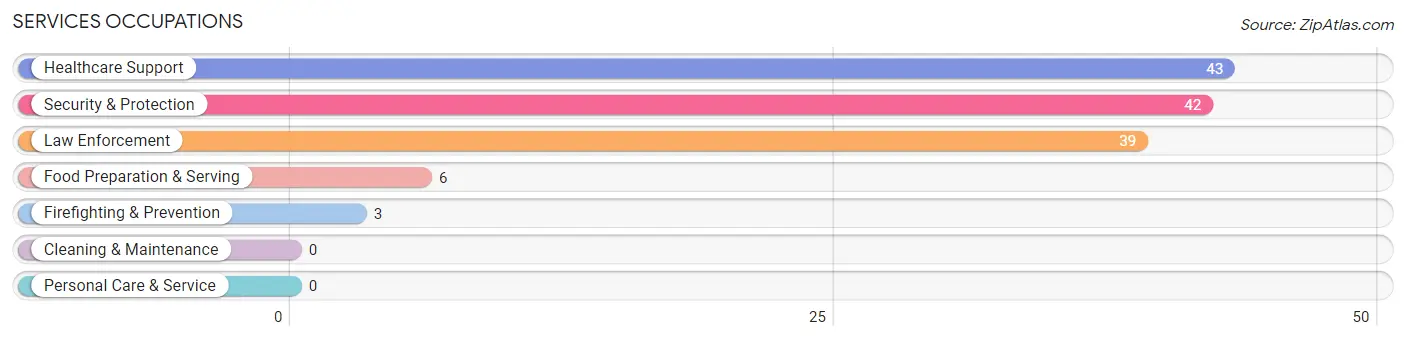
Services Occupations
The most common Services occupations in Wilson are Healthcare Support (43 | 24.2%), Security & Protection (42 | 23.6%), Law Enforcement (39 | 21.9%), Food Preparation & Serving (6 | 3.4%), and Firefighting & Prevention (3 | 1.7%).
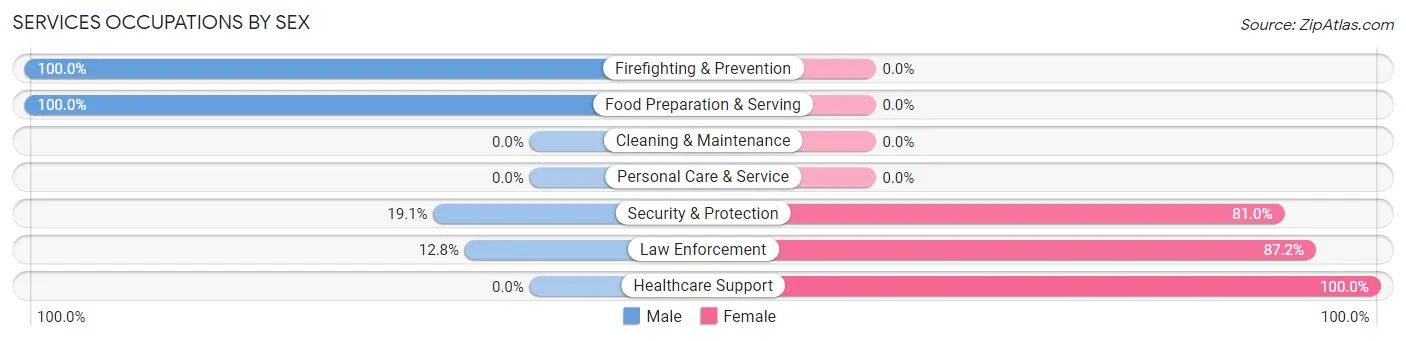
Services Occupations by Sex
Within the Services occupations in Wilson, the most male-oriented occupations are Firefighting & Prevention (100.0%), Food Preparation & Serving (100.0%), and Security & Protection (19.1%), while the most female-oriented occupations are Healthcare Support (100.0%), Law Enforcement (87.2%), and Security & Protection (80.9%).
| Occupation | Male | Female |
| Healthcare Support | 0 (0.0%) | 43 (100.0%) |
| Security & Protection | 8 (19.1%) | 34 (80.9%) |
| Firefighting & Prevention | 3 (100.0%) | 0 (0.0%) |
| Law Enforcement | 5 (12.8%) | 34 (87.2%) |
| Food Preparation & Serving | 6 (100.0%) | 0 (0.0%) |
| Cleaning & Maintenance | 0 (0.0%) | 0 (0.0%) |
| Personal Care & Service | 0 (0.0%) | 0 (0.0%) |
| Total (Category) | 14 (15.4%) | 77 (84.6%) |
| Total (Overall) | 60 (33.7%) | 118 (66.3%) |
Sales and Office Occupations
The most common Sales and Office occupations in Wilson are Sales & Related (12 | 6.7%), and Office & Administration (6 | 3.4%).
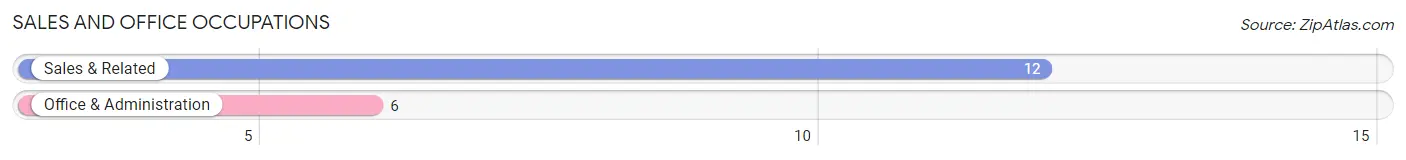
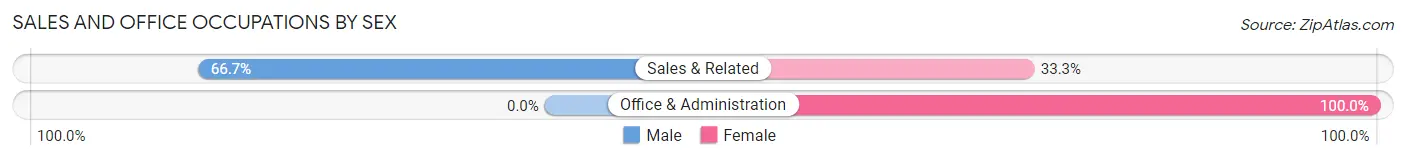
Sales and Office Occupations by Sex
| Occupation | Male | Female |
| Sales & Related | 8 (66.7%) | 4 (33.3%) |
| Office & Administration | 0 (0.0%) | 6 (100.0%) |
| Total (Category) | 8 (44.4%) | 10 (55.6%) |
| Total (Overall) | 60 (33.7%) | 118 (66.3%) |
Natural Resources, Construction and Maintenance Occupations
The most common Natural Resources, Construction and Maintenance occupations in Wilson are , and Construction & Extraction (6 | 3.4%).
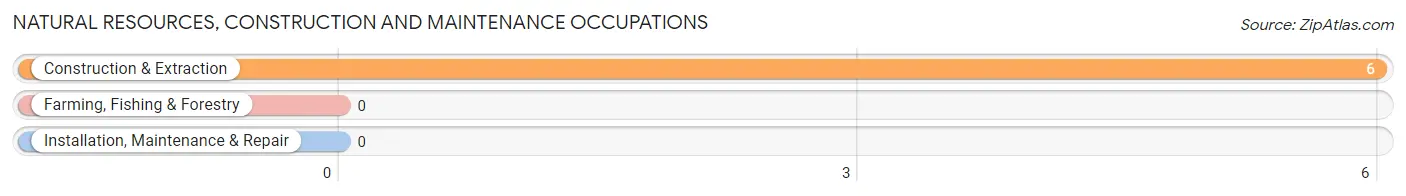
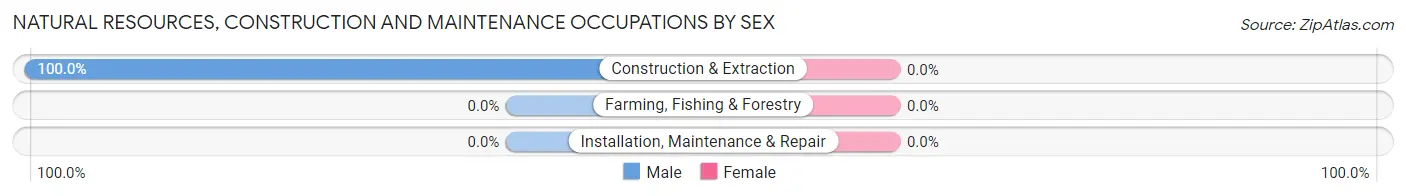
Natural Resources, Construction and Maintenance Occupations by Sex
| Occupation | Male | Female |
| Farming, Fishing & Forestry | 0 (0.0%) | 0 (0.0%) |
| Construction & Extraction | 6 (100.0%) | 0 (0.0%) |
| Installation, Maintenance & Repair | 0 (0.0%) | 0 (0.0%) |
| Total (Category) | 6 (100.0%) | 0 (0.0%) |
| Total (Overall) | 60 (33.7%) | 118 (66.3%) |
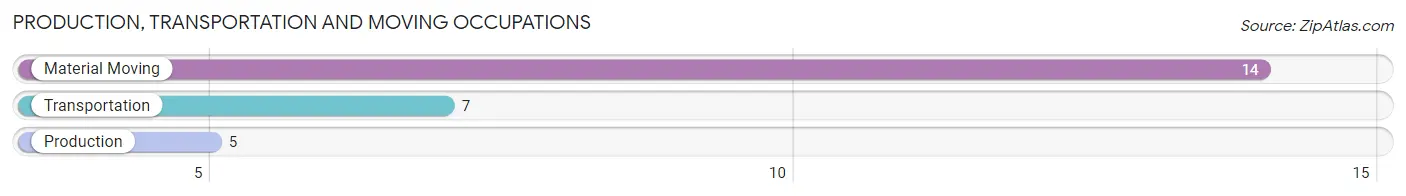
Production, Transportation and Moving Occupations
The most common Production, Transportation and Moving occupations in Wilson are Material Moving (14 | 7.9%), Transportation (7 | 3.9%), and Production (5 | 2.8%).
Production, Transportation and Moving Occupations by Sex
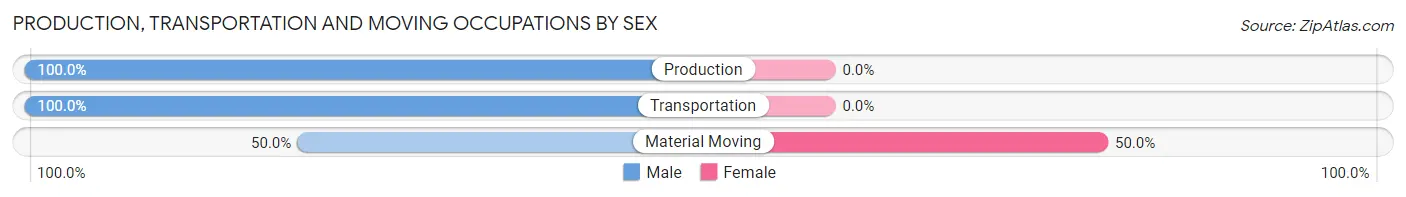
| Occupation | Male | Female |
| Production | 5 (100.0%) | 0 (0.0%) |
| Transportation | 7 (100.0%) | 0 (0.0%) |
| Material Moving | 7 (50.0%) | 7 (50.0%) |
| Total (Category) | 19 (73.1%) | 7 (26.9%) |
| Total (Overall) | 60 (33.7%) | 118 (66.3%) |
Employment Industries by Sex in Wilson
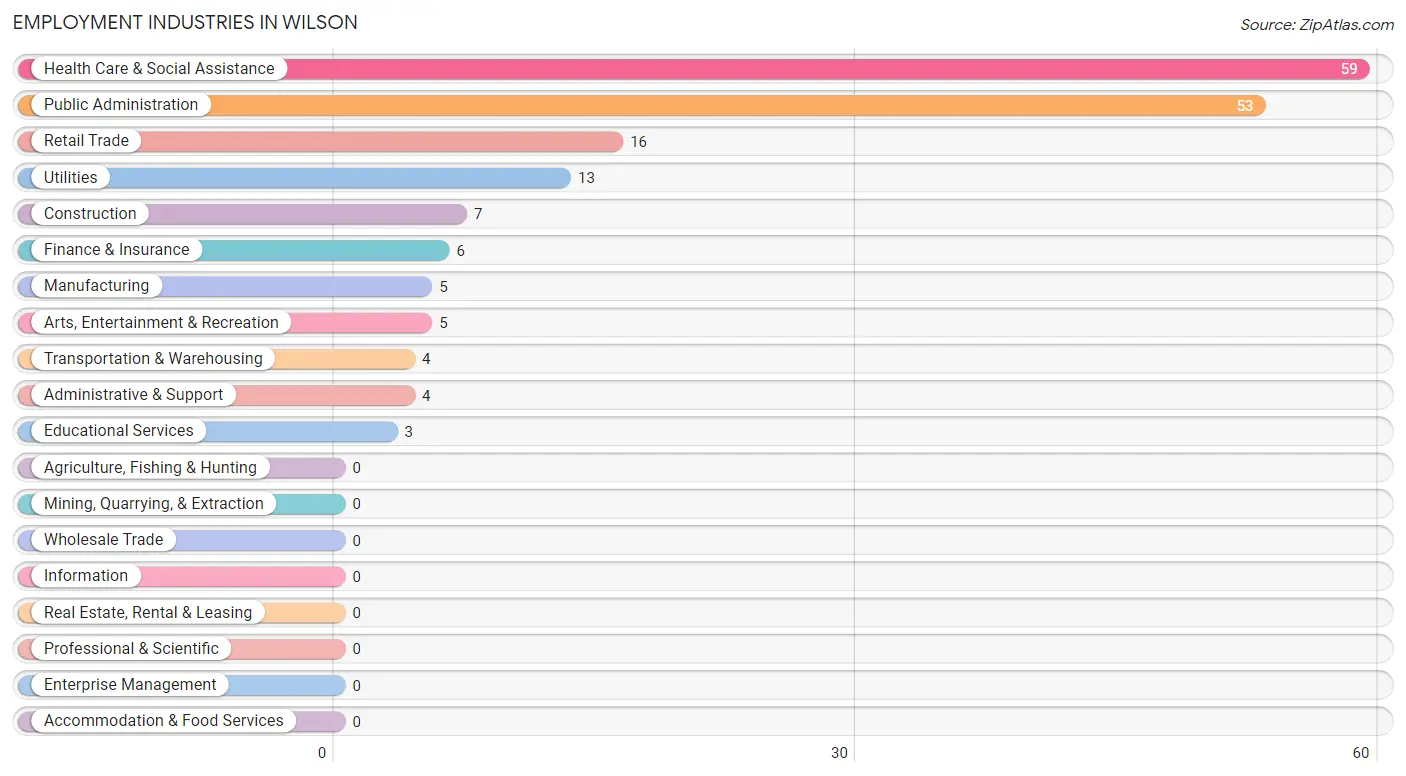
Employment Industries in Wilson
The major employment industries in Wilson include Health Care & Social Assistance (59 | 33.2%), Public Administration (53 | 29.8%), Retail Trade (16 | 9.0%), Utilities (13 | 7.3%), and Construction (7 | 3.9%).
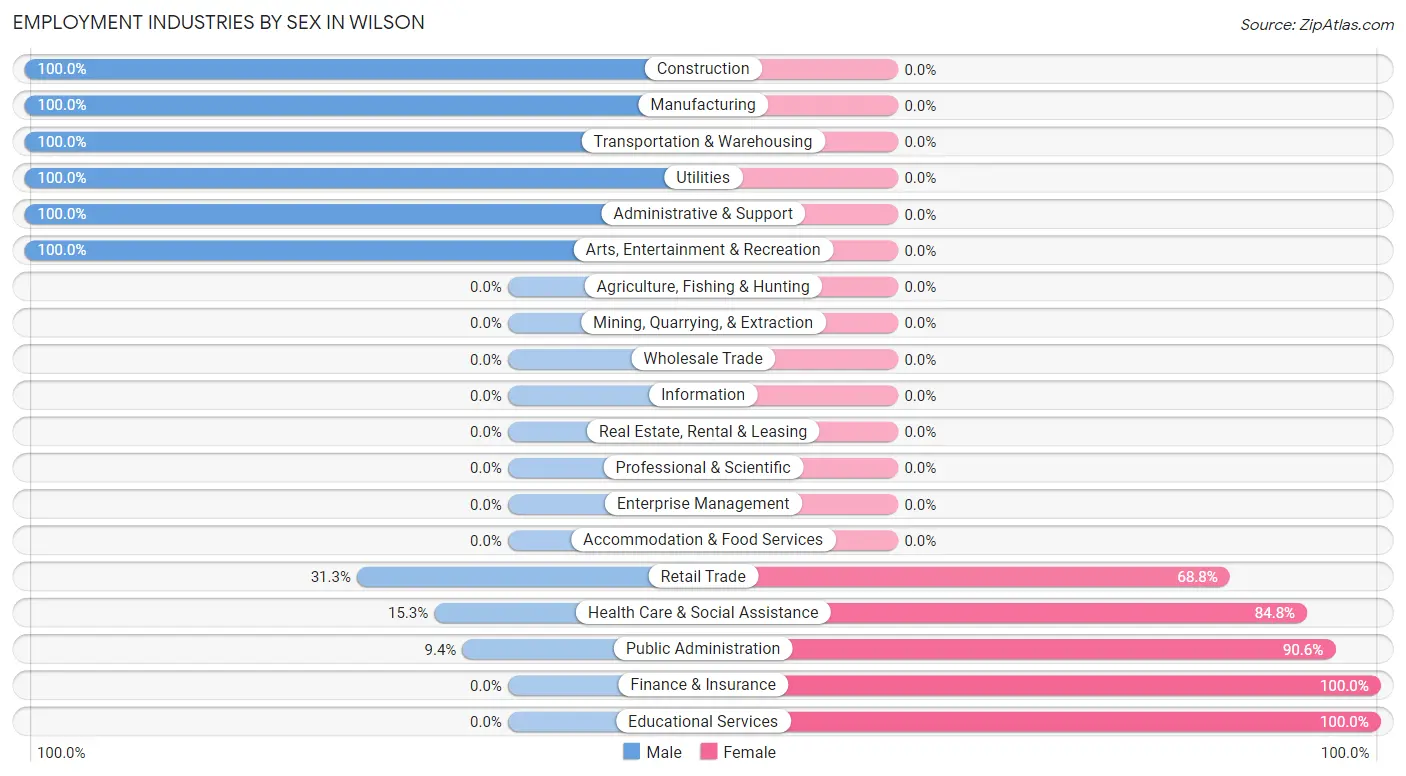
Employment Industries by Sex in Wilson
The Wilson industries that see more men than women are Construction (100.0%), Manufacturing (100.0%), and Transportation & Warehousing (100.0%), whereas the industries that tend to have a higher number of women are Finance & Insurance (100.0%), Educational Services (100.0%), and Public Administration (90.6%).
| Industry | Male | Female |
| Agriculture, Fishing & Hunting | 0 (0.0%) | 0 (0.0%) |
| Mining, Quarrying, & Extraction | 0 (0.0%) | 0 (0.0%) |
| Construction | 7 (100.0%) | 0 (0.0%) |
| Manufacturing | 5 (100.0%) | 0 (0.0%) |
| Wholesale Trade | 0 (0.0%) | 0 (0.0%) |
| Retail Trade | 5 (31.2%) | 11 (68.8%) |
| Transportation & Warehousing | 4 (100.0%) | 0 (0.0%) |
| Utilities | 13 (100.0%) | 0 (0.0%) |
| Information | 0 (0.0%) | 0 (0.0%) |
| Finance & Insurance | 0 (0.0%) | 6 (100.0%) |
| Real Estate, Rental & Leasing | 0 (0.0%) | 0 (0.0%) |
| Professional & Scientific | 0 (0.0%) | 0 (0.0%) |
| Enterprise Management | 0 (0.0%) | 0 (0.0%) |
| Administrative & Support | 4 (100.0%) | 0 (0.0%) |
| Educational Services | 0 (0.0%) | 3 (100.0%) |
| Health Care & Social Assistance | 9 (15.2%) | 50 (84.8%) |
| Arts, Entertainment & Recreation | 5 (100.0%) | 0 (0.0%) |
| Accommodation & Food Services | 0 (0.0%) | 0 (0.0%) |
| Public Administration | 5 (9.4%) | 48 (90.6%) |
| Total | 60 (33.7%) | 118 (66.3%) |
Education in Wilson
School Enrollment in Wilson
The most common levels of schooling among the 173 students in Wilson are middle school (64 | 37.0%), elementary school (45 | 26.0%), and nursery / preschool (25 | 14.4%).
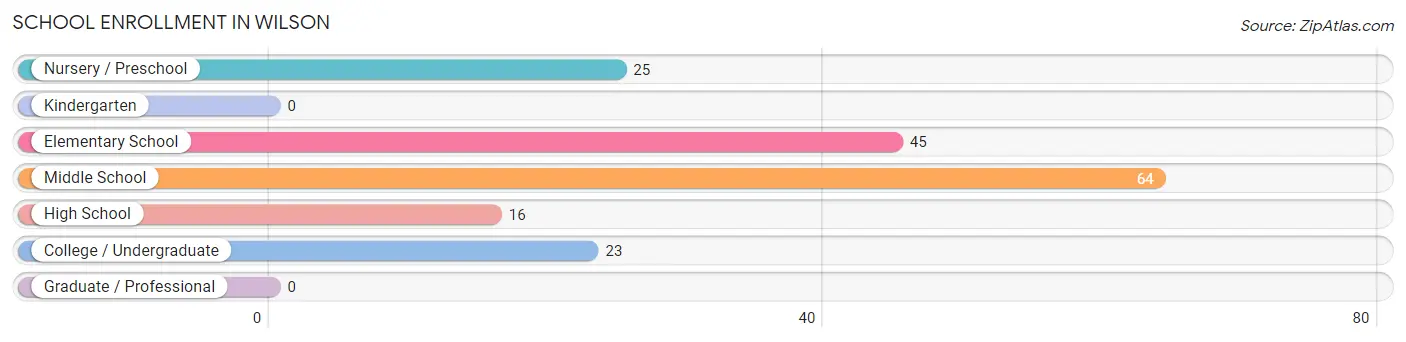
| School Level | # Students | % Students |
| Nursery / Preschool | 25 | 14.4% |
| Kindergarten | 0 | 0.0% |
| Elementary School | 45 | 26.0% |
| Middle School | 64 | 37.0% |
| High School | 16 | 9.2% |
| College / Undergraduate | 23 | 13.3% |
| Graduate / Professional | 0 | 0.0% |
| Total | 173 | 100.0% |
School Enrollment by Age by Funding Source in Wilson
Out of a total of 173 students who are enrolled in schools in Wilson, 26 (15.0%) attend a private institution, while the remaining 147 (85.0%) are enrolled in public schools. The age group of 35 years and over has the highest likelihood of being enrolled in private schools, with 16 (100.0% in the age bracket) enrolled. Conversely, the age group of 3 to 4 year olds has the lowest likelihood of being enrolled in a private school, with 25 (100.0% in the age bracket) attending a public institution.
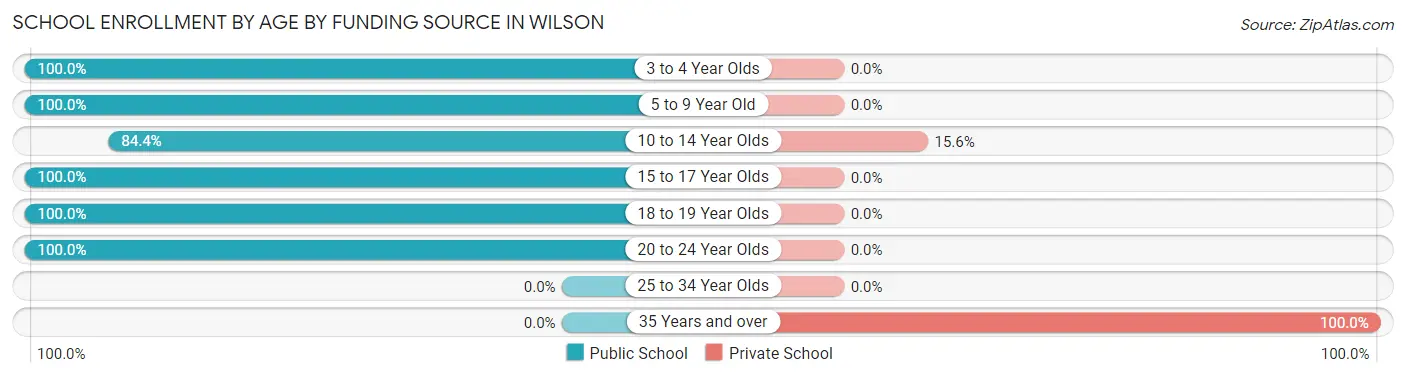
| Age Bracket | Public School | Private School |
| 3 to 4 Year Olds | 25 (100.0%) | 0 (0.0%) |
| 5 to 9 Year Old | 45 (100.0%) | 0 (0.0%) |
| 10 to 14 Year Olds | 54 (84.4%) | 10 (15.6%) |
| 15 to 17 Year Olds | 6 (100.0%) | 0 (0.0%) |
| 18 to 19 Year Olds | 10 (100.0%) | 0 (0.0%) |
| 20 to 24 Year Olds | 7 (100.0%) | 0 (0.0%) |
| 25 to 34 Year Olds | 0 (0.0%) | 0 (0.0%) |
| 35 Years and over | 0 (0.0%) | 16 (100.0%) |
| Total | 147 (85.0%) | 26 (15.0%) |
Educational Attainment by Field of Study in Wilson
Computers & mathematics (10 | 34.5%), business (5 | 17.2%), psychology (4 | 13.8%), education (3 | 10.3%), and literature & languages (3 | 10.3%) are the most common fields of study among 29 individuals in Wilson who have obtained a bachelor's degree or higher.
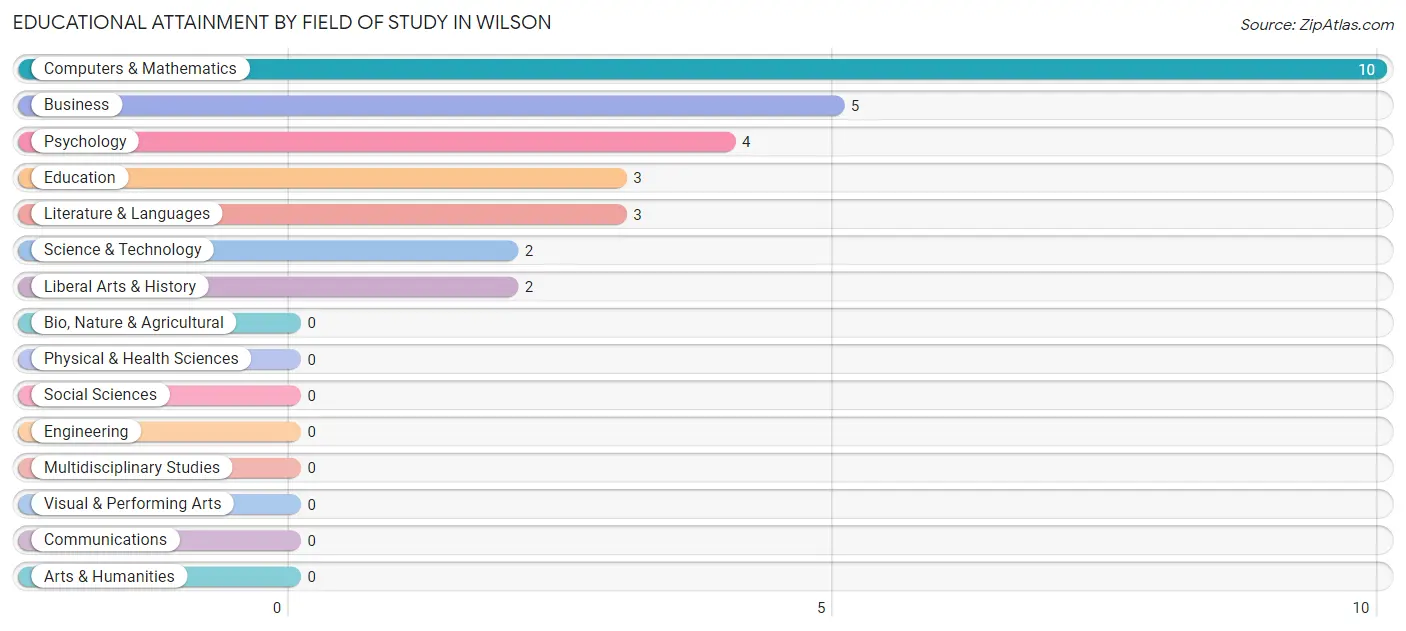
| Field of Study | # Graduates | % Graduates |
| Computers & Mathematics | 10 | 34.5% |
| Bio, Nature & Agricultural | 0 | 0.0% |
| Physical & Health Sciences | 0 | 0.0% |
| Psychology | 4 | 13.8% |
| Social Sciences | 0 | 0.0% |
| Engineering | 0 | 0.0% |
| Multidisciplinary Studies | 0 | 0.0% |
| Science & Technology | 2 | 6.9% |
| Business | 5 | 17.2% |
| Education | 3 | 10.3% |
| Literature & Languages | 3 | 10.3% |
| Liberal Arts & History | 2 | 6.9% |
| Visual & Performing Arts | 0 | 0.0% |
| Communications | 0 | 0.0% |
| Arts & Humanities | 0 | 0.0% |
| Total | 29 | 100.0% |
Transportation & Commute in Wilson
Vehicle Availability by Sex in Wilson
The most prevalent vehicle ownership categories in Wilson are males with 2 vehicles (34, accounting for 60.7%) and females with 2 vehicles (74, making up 28.8%).
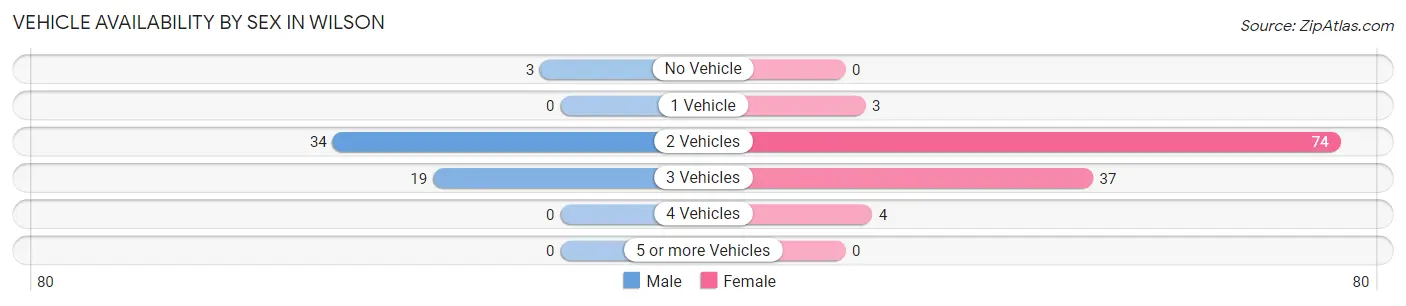
| Vehicles Available | Male | Female |
| No Vehicle | 3 (5.4%) | 0 (0.0%) |
| 1 Vehicle | 0 (0.0%) | 3 (2.5%) |
| 2 Vehicles | 34 (60.7%) | 74 (62.7%) |
| 3 Vehicles | 19 (33.9%) | 37 (31.4%) |
| 4 Vehicles | 0 (0.0%) | 4 (3.4%) |
| 5 or more Vehicles | 0 (0.0%) | 0 (0.0%) |
| Total | 56 (100.0%) | 118 (100.0%) |
Commute Time in Wilson
The most frequently occuring commute durations in Wilson are 30 to 34 minutes (57 commuters, 32.8%), 15 to 19 minutes (41 commuters, 23.6%), and 20 to 24 minutes (34 commuters, 19.5%).
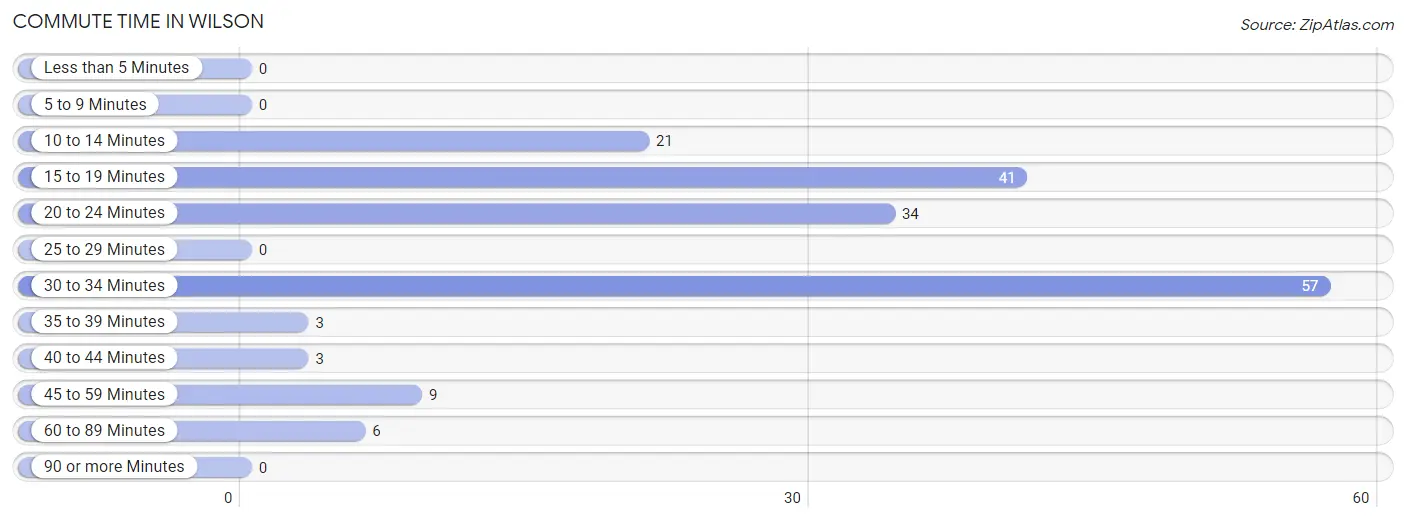
| Commute Time | # Commuters | % Commuters |
| Less than 5 Minutes | 0 | 0.0% |
| 5 to 9 Minutes | 0 | 0.0% |
| 10 to 14 Minutes | 21 | 12.1% |
| 15 to 19 Minutes | 41 | 23.6% |
| 20 to 24 Minutes | 34 | 19.5% |
| 25 to 29 Minutes | 0 | 0.0% |
| 30 to 34 Minutes | 57 | 32.8% |
| 35 to 39 Minutes | 3 | 1.7% |
| 40 to 44 Minutes | 3 | 1.7% |
| 45 to 59 Minutes | 9 | 5.2% |
| 60 to 89 Minutes | 6 | 3.5% |
| 90 or more Minutes | 0 | 0.0% |
Commute Time by Sex in Wilson
The most common commute times in Wilson are 10 to 14 minutes (17 commuters, 30.4%) for males and 30 to 34 minutes (42 commuters, 35.6%) for females.
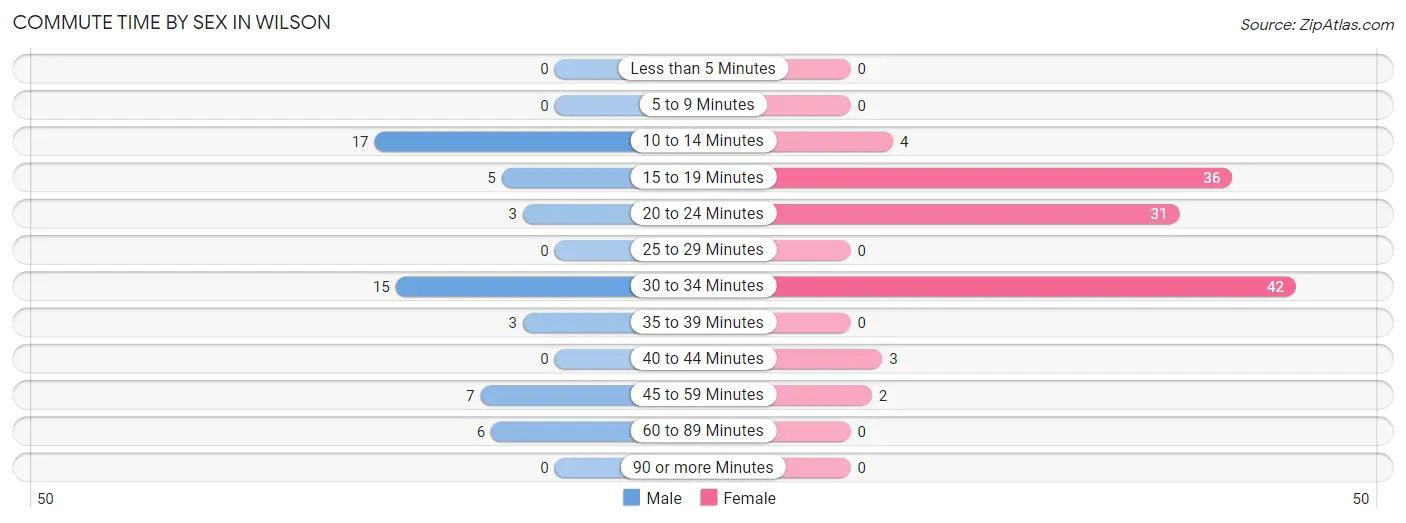
| Commute Time | Male | Female |
| Less than 5 Minutes | 0 (0.0%) | 0 (0.0%) |
| 5 to 9 Minutes | 0 (0.0%) | 0 (0.0%) |
| 10 to 14 Minutes | 17 (30.4%) | 4 (3.4%) |
| 15 to 19 Minutes | 5 (8.9%) | 36 (30.5%) |
| 20 to 24 Minutes | 3 (5.4%) | 31 (26.3%) |
| 25 to 29 Minutes | 0 (0.0%) | 0 (0.0%) |
| 30 to 34 Minutes | 15 (26.8%) | 42 (35.6%) |
| 35 to 39 Minutes | 3 (5.4%) | 0 (0.0%) |
| 40 to 44 Minutes | 0 (0.0%) | 3 (2.5%) |
| 45 to 59 Minutes | 7 (12.5%) | 2 (1.7%) |
| 60 to 89 Minutes | 6 (10.7%) | 0 (0.0%) |
| 90 or more Minutes | 0 (0.0%) | 0 (0.0%) |
Time of Departure to Work by Sex in Wilson
The most frequent times of departure to work in Wilson are 12:00 AM to 4:59 AM (18, 32.1%) for males and 5:00 AM to 5:29 AM (37, 31.4%) for females.
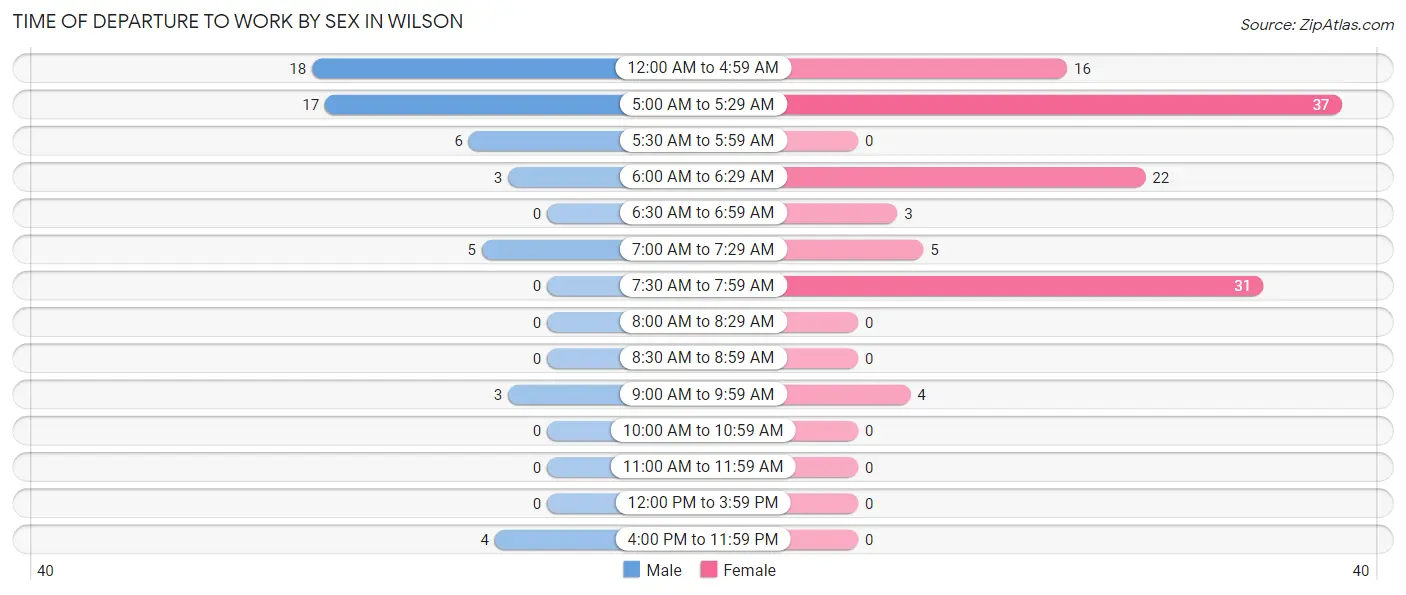
| Time of Departure | Male | Female |
| 12:00 AM to 4:59 AM | 18 (32.1%) | 16 (13.6%) |
| 5:00 AM to 5:29 AM | 17 (30.4%) | 37 (31.4%) |
| 5:30 AM to 5:59 AM | 6 (10.7%) | 0 (0.0%) |
| 6:00 AM to 6:29 AM | 3 (5.4%) | 22 (18.6%) |
| 6:30 AM to 6:59 AM | 0 (0.0%) | 3 (2.5%) |
| 7:00 AM to 7:29 AM | 5 (8.9%) | 5 (4.2%) |
| 7:30 AM to 7:59 AM | 0 (0.0%) | 31 (26.3%) |
| 8:00 AM to 8:29 AM | 0 (0.0%) | 0 (0.0%) |
| 8:30 AM to 8:59 AM | 0 (0.0%) | 0 (0.0%) |
| 9:00 AM to 9:59 AM | 3 (5.4%) | 4 (3.4%) |
| 10:00 AM to 10:59 AM | 0 (0.0%) | 0 (0.0%) |
| 11:00 AM to 11:59 AM | 0 (0.0%) | 0 (0.0%) |
| 12:00 PM to 3:59 PM | 0 (0.0%) | 0 (0.0%) |
| 4:00 PM to 11:59 PM | 4 (7.1%) | 0 (0.0%) |
| Total | 56 (100.0%) | 118 (100.0%) |
Housing Occupancy in Wilson
Occupancy by Ownership in Wilson
Of the total 284 dwellings in Wilson, owner-occupied units account for 214 (75.3%), while renter-occupied units make up 70 (24.6%).
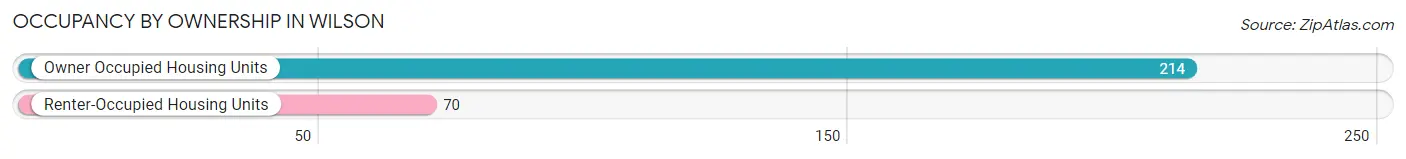
| Occupancy | # Housing Units | % Housing Units |
| Owner Occupied Housing Units | 214 | 75.3% |
| Renter-Occupied Housing Units | 70 | 24.6% |
| Total Occupied Housing Units | 284 | 100.0% |
Occupancy by Household Size in Wilson
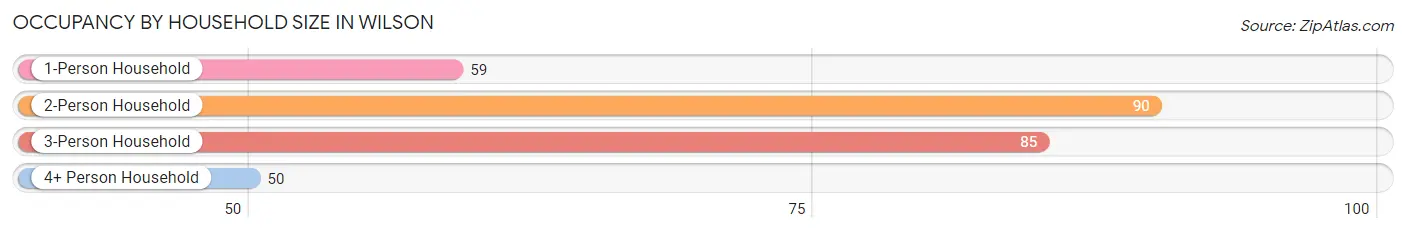
| Household Size | # Housing Units | % Housing Units |
| 1-Person Household | 59 | 20.8% |
| 2-Person Household | 90 | 31.7% |
| 3-Person Household | 85 | 29.9% |
| 4+ Person Household | 50 | 17.6% |
| Total Housing Units | 284 | 100.0% |
Occupancy by Ownership by Household Size in Wilson
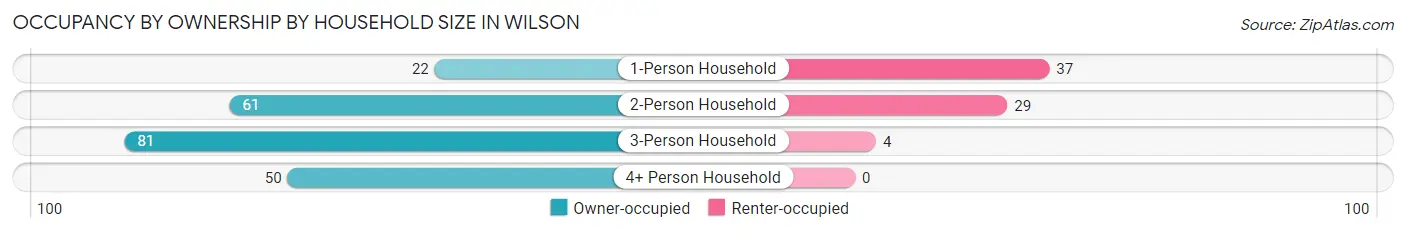
| Household Size | Owner-occupied | Renter-occupied |
| 1-Person Household | 22 (37.3%) | 37 (62.7%) |
| 2-Person Household | 61 (67.8%) | 29 (32.2%) |
| 3-Person Household | 81 (95.3%) | 4 (4.7%) |
| 4+ Person Household | 50 (100.0%) | 0 (0.0%) |
| Total Housing Units | 214 (75.3%) | 70 (24.6%) |
Occupancy by Educational Attainment in Wilson
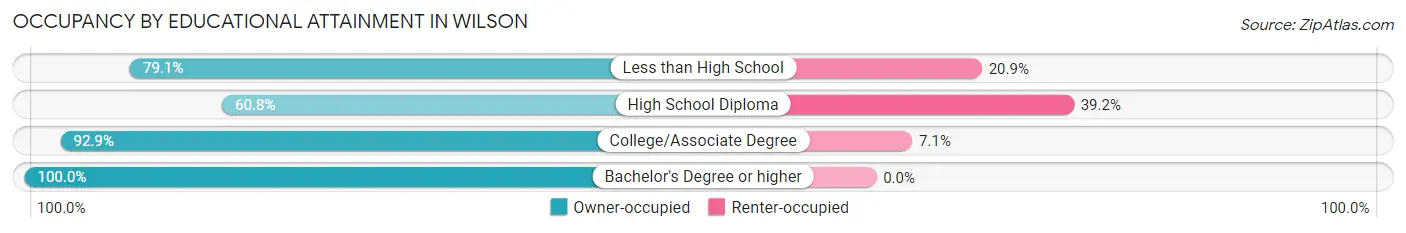
| Household Size | Owner-occupied | Renter-occupied |
| Less than High School | 68 (79.1%) | 18 (20.9%) |
| High School Diploma | 73 (60.8%) | 47 (39.2%) |
| College/Associate Degree | 65 (92.9%) | 5 (7.1%) |
| Bachelor's Degree or higher | 8 (100.0%) | 0 (0.0%) |
Occupancy by Age of Householder in Wilson
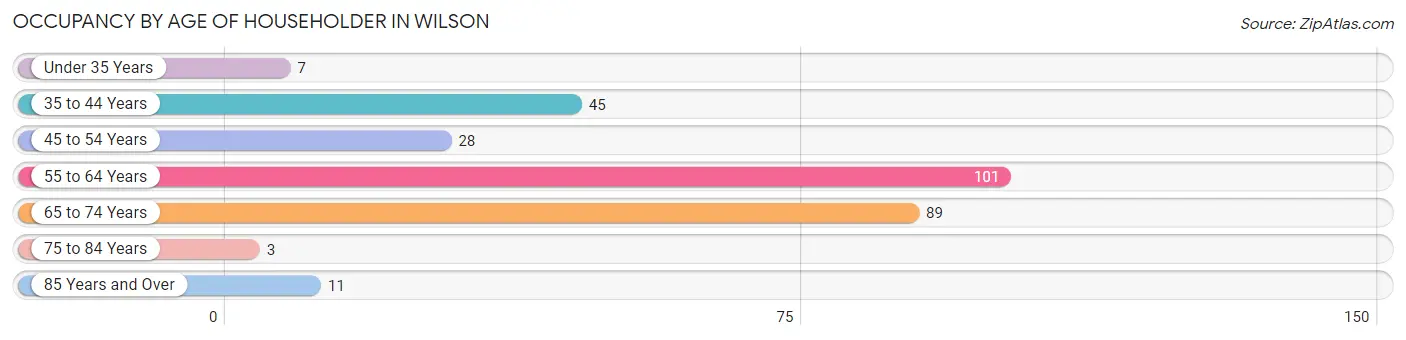
| Age Bracket | # Households | % Households |
| Under 35 Years | 7 | 2.5% |
| 35 to 44 Years | 45 | 15.9% |
| 45 to 54 Years | 28 | 9.9% |
| 55 to 64 Years | 101 | 35.6% |
| 65 to 74 Years | 89 | 31.3% |
| 75 to 84 Years | 3 | 1.1% |
| 85 Years and Over | 11 | 3.9% |
| Total | 284 | 100.0% |
Housing Finances in Wilson
Median Income by Occupancy in Wilson
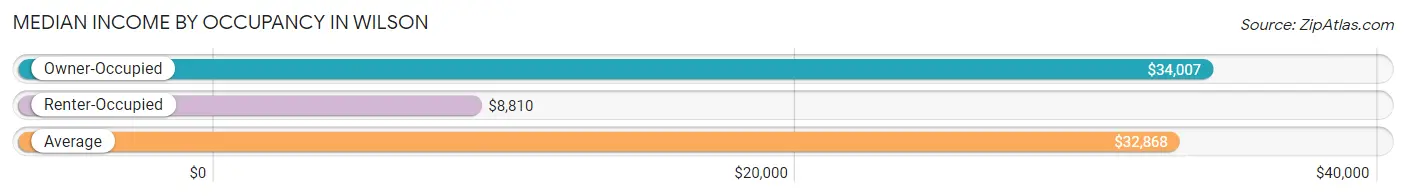
| Occupancy Type | # Households | Median Income |
| Owner-Occupied | 214 (75.3%) | $34,007 |
| Renter-Occupied | 70 (24.6%) | $8,810 |
| Average | 284 (100.0%) | $32,868 |
Occupancy by Householder Income Bracket in Wilson
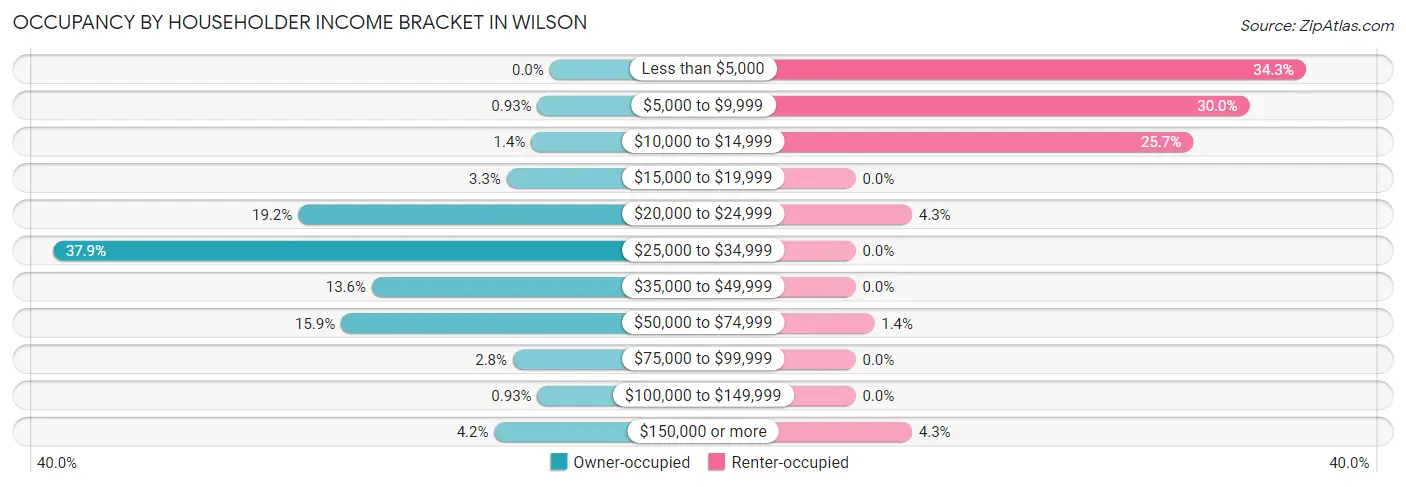
| Income Bracket | Owner-occupied | Renter-occupied |
| Less than $5,000 | 0 (0.0%) | 24 (34.3%) |
| $5,000 to $9,999 | 2 (0.9%) | 21 (30.0%) |
| $10,000 to $14,999 | 3 (1.4%) | 18 (25.7%) |
| $15,000 to $19,999 | 7 (3.3%) | 0 (0.0%) |
| $20,000 to $24,999 | 41 (19.2%) | 3 (4.3%) |
| $25,000 to $34,999 | 81 (37.9%) | 0 (0.0%) |
| $35,000 to $49,999 | 29 (13.6%) | 0 (0.0%) |
| $50,000 to $74,999 | 34 (15.9%) | 1 (1.4%) |
| $75,000 to $99,999 | 6 (2.8%) | 0 (0.0%) |
| $100,000 to $149,999 | 2 (0.9%) | 0 (0.0%) |
| $150,000 or more | 9 (4.2%) | 3 (4.3%) |
| Total | 214 (100.0%) | 70 (100.0%) |
Monthly Housing Cost Tiers in Wilson
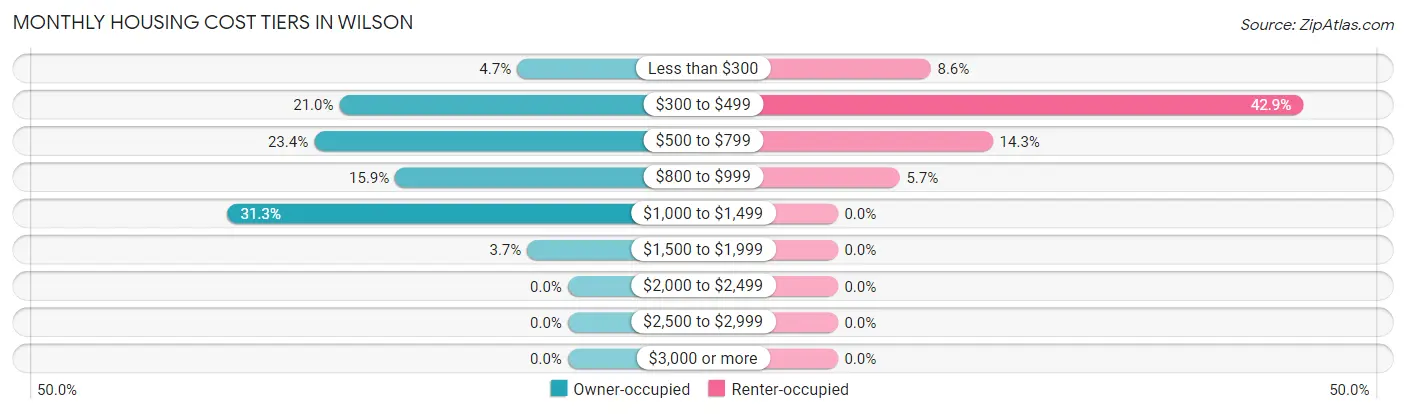
| Monthly Cost | Owner-occupied | Renter-occupied |
| Less than $300 | 10 (4.7%) | 6 (8.6%) |
| $300 to $499 | 45 (21.0%) | 30 (42.9%) |
| $500 to $799 | 50 (23.4%) | 10 (14.3%) |
| $800 to $999 | 34 (15.9%) | 4 (5.7%) |
| $1,000 to $1,499 | 67 (31.3%) | 0 (0.0%) |
| $1,500 to $1,999 | 8 (3.7%) | 0 (0.0%) |
| $2,000 to $2,499 | 0 (0.0%) | 0 (0.0%) |
| $2,500 to $2,999 | 0 (0.0%) | 0 (0.0%) |
| $3,000 or more | 0 (0.0%) | 0 (0.0%) |
| Total | 214 (100.0%) | 70 (100.0%) |
Physical Housing Characteristics in Wilson
Housing Structures in Wilson
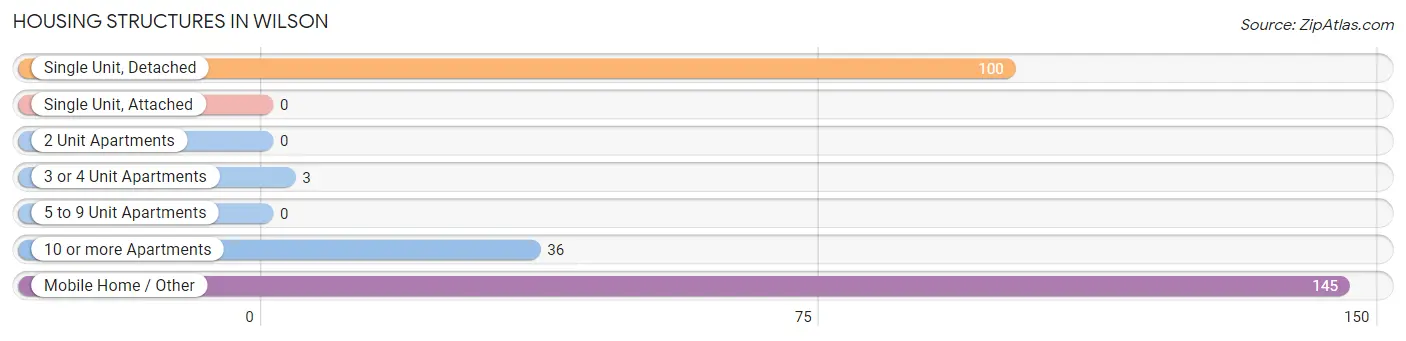
| Structure Type | # Housing Units | % Housing Units |
| Single Unit, Detached | 100 | 35.2% |
| Single Unit, Attached | 0 | 0.0% |
| 2 Unit Apartments | 0 | 0.0% |
| 3 or 4 Unit Apartments | 3 | 1.1% |
| 5 to 9 Unit Apartments | 0 | 0.0% |
| 10 or more Apartments | 36 | 12.7% |
| Mobile Home / Other | 145 | 51.1% |
| Total | 284 | 100.0% |
Housing Structures by Occupancy in Wilson
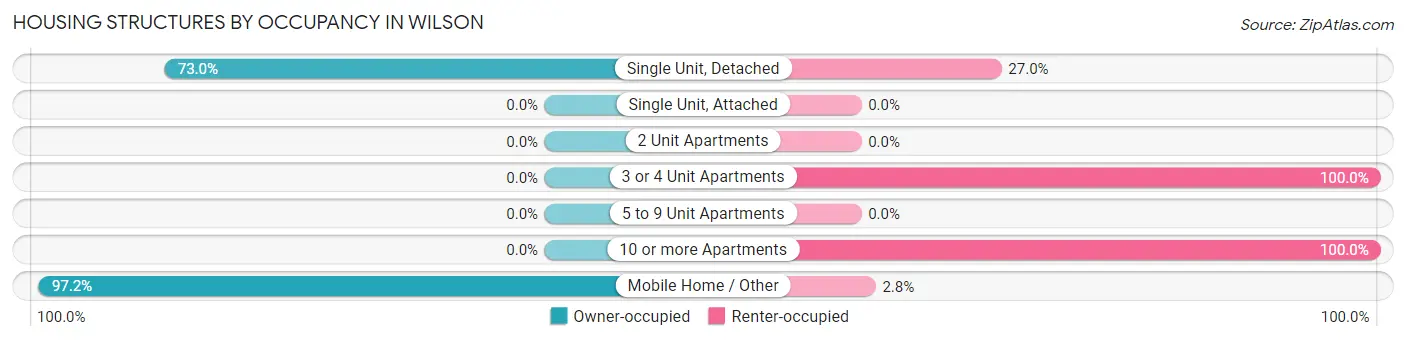
| Structure Type | Owner-occupied | Renter-occupied |
| Single Unit, Detached | 73 (73.0%) | 27 (27.0%) |
| Single Unit, Attached | 0 (0.0%) | 0 (0.0%) |
| 2 Unit Apartments | 0 (0.0%) | 0 (0.0%) |
| 3 or 4 Unit Apartments | 0 (0.0%) | 3 (100.0%) |
| 5 to 9 Unit Apartments | 0 (0.0%) | 0 (0.0%) |
| 10 or more Apartments | 0 (0.0%) | 36 (100.0%) |
| Mobile Home / Other | 141 (97.2%) | 4 (2.8%) |
| Total | 214 (75.3%) | 70 (24.6%) |
Housing Structures by Number of Rooms in Wilson
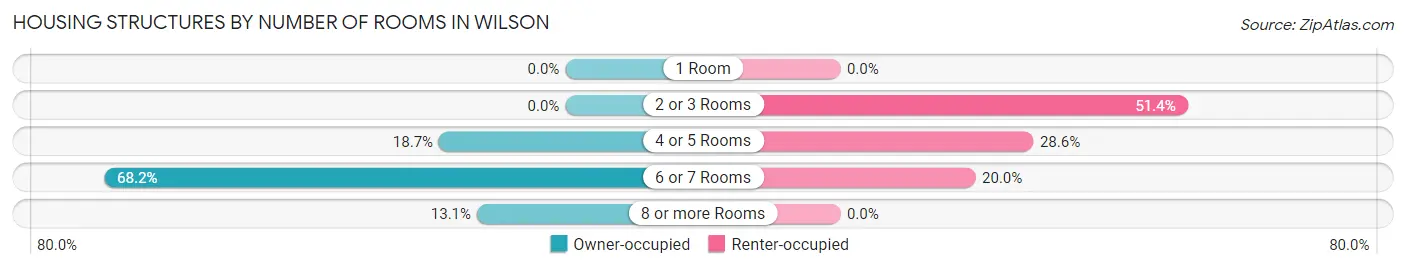
| Number of Rooms | Owner-occupied | Renter-occupied |
| 1 Room | 0 (0.0%) | 0 (0.0%) |
| 2 or 3 Rooms | 0 (0.0%) | 36 (51.4%) |
| 4 or 5 Rooms | 40 (18.7%) | 20 (28.6%) |
| 6 or 7 Rooms | 146 (68.2%) | 14 (20.0%) |
| 8 or more Rooms | 28 (13.1%) | 0 (0.0%) |
| Total | 214 (100.0%) | 70 (100.0%) |
Housing Structure by Heating Type in Wilson
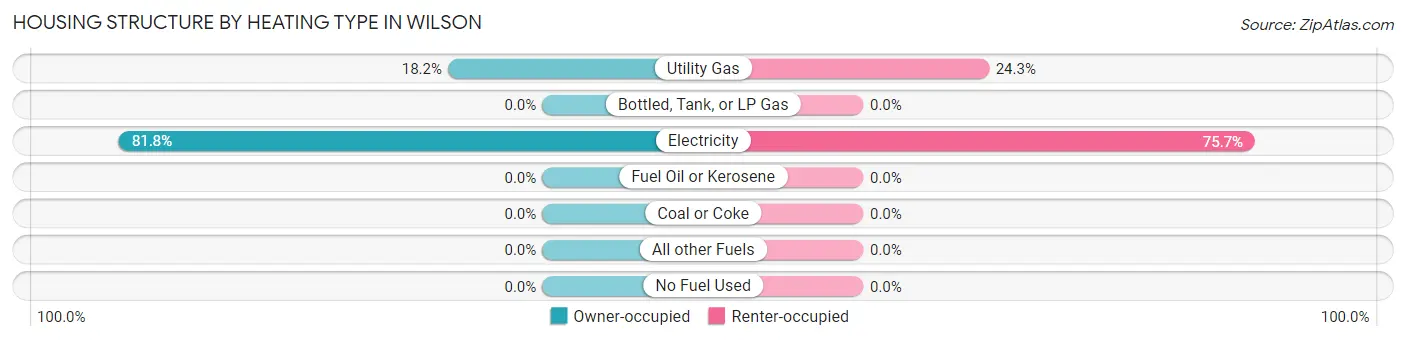
| Heating Type | Owner-occupied | Renter-occupied |
| Utility Gas | 39 (18.2%) | 17 (24.3%) |
| Bottled, Tank, or LP Gas | 0 (0.0%) | 0 (0.0%) |
| Electricity | 175 (81.8%) | 53 (75.7%) |
| Fuel Oil or Kerosene | 0 (0.0%) | 0 (0.0%) |
| Coal or Coke | 0 (0.0%) | 0 (0.0%) |
| All other Fuels | 0 (0.0%) | 0 (0.0%) |
| No Fuel Used | 0 (0.0%) | 0 (0.0%) |
| Total | 214 (100.0%) | 70 (100.0%) |
Household Vehicle Usage in Wilson
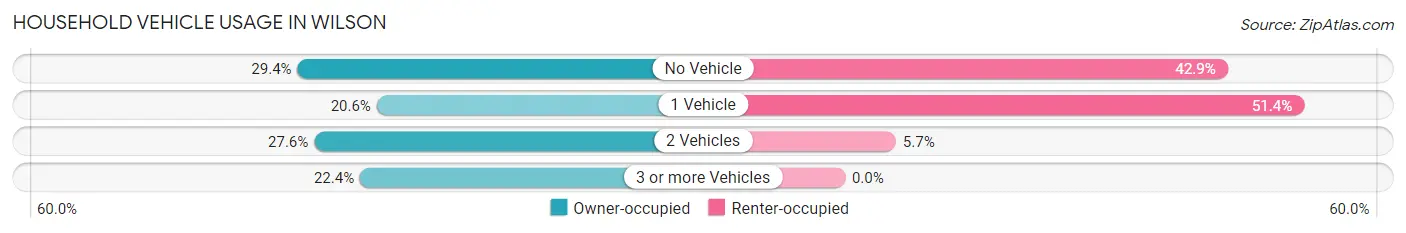
| Vehicles per Household | Owner-occupied | Renter-occupied |
| No Vehicle | 63 (29.4%) | 30 (42.9%) |
| 1 Vehicle | 44 (20.6%) | 36 (51.4%) |
| 2 Vehicles | 59 (27.6%) | 4 (5.7%) |
| 3 or more Vehicles | 48 (22.4%) | 0 (0.0%) |
| Total | 214 (100.0%) | 70 (100.0%) |
Real Estate & Mortgages in Wilson
Real Estate and Mortgage Overview in Wilson
| Characteristic | Without Mortgage | With Mortgage |
| Housing Units | 55 | 159 |
| Median Property Value | $117,500 | $115,900 |
| Median Household Income | $42,292 | $0 |
| Monthly Housing Costs | $393 | $0 |
| Real Estate Taxes | $199 | $19 |
Property Value by Mortgage Status in Wilson
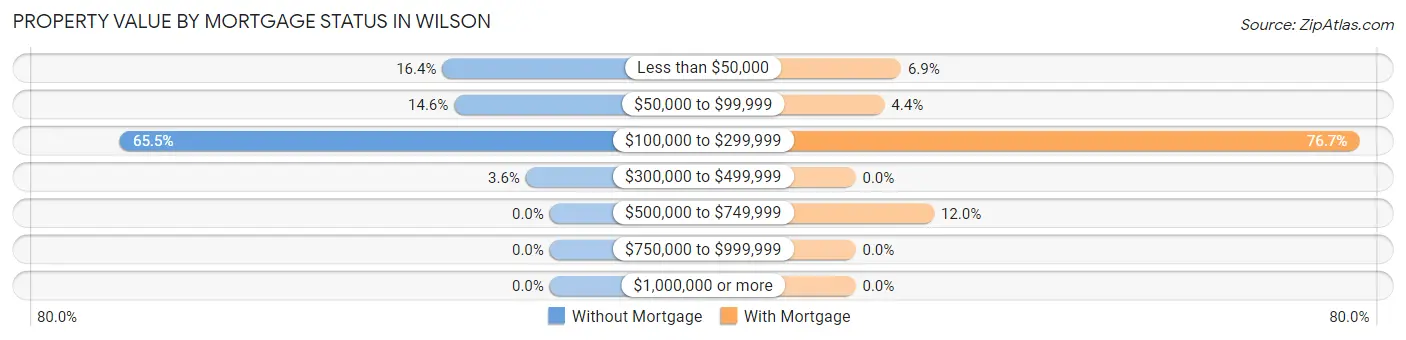
| Property Value | Without Mortgage | With Mortgage |
| Less than $50,000 | 9 (16.4%) | 11 (6.9%) |
| $50,000 to $99,999 | 8 (14.5%) | 7 (4.4%) |
| $100,000 to $299,999 | 36 (65.4%) | 122 (76.7%) |
| $300,000 to $499,999 | 2 (3.6%) | 0 (0.0%) |
| $500,000 to $749,999 | 0 (0.0%) | 19 (11.9%) |
| $750,000 to $999,999 | 0 (0.0%) | 0 (0.0%) |
| $1,000,000 or more | 0 (0.0%) | 0 (0.0%) |
| Total | 55 (100.0%) | 159 (100.0%) |
Household Income by Mortgage Status in Wilson
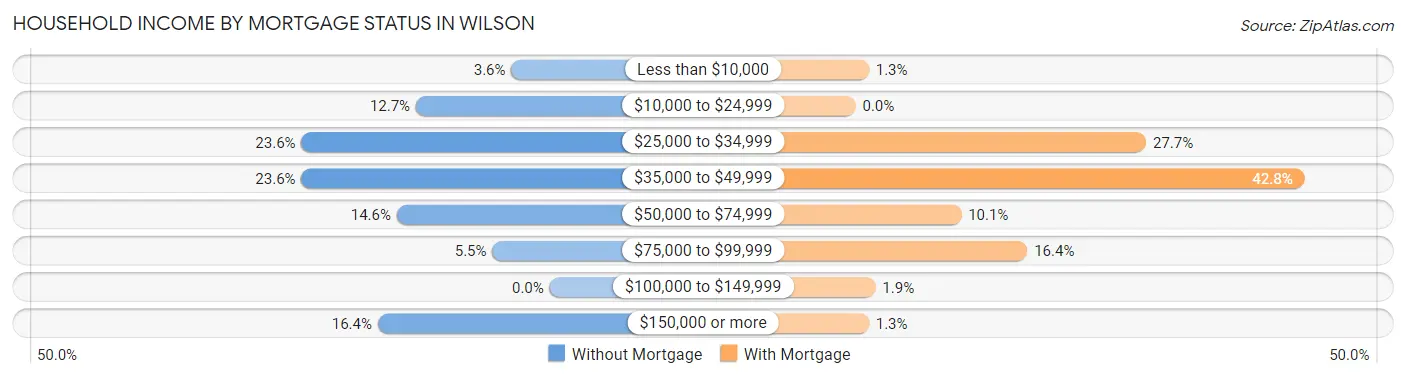
| Household Income | Without Mortgage | With Mortgage |
| Less than $10,000 | 2 (3.6%) | 2 (1.3%) |
| $10,000 to $24,999 | 7 (12.7%) | 0 (0.0%) |
| $25,000 to $34,999 | 13 (23.6%) | 44 (27.7%) |
| $35,000 to $49,999 | 13 (23.6%) | 68 (42.8%) |
| $50,000 to $74,999 | 8 (14.5%) | 16 (10.1%) |
| $75,000 to $99,999 | 3 (5.4%) | 26 (16.4%) |
| $100,000 to $149,999 | 0 (0.0%) | 3 (1.9%) |
| $150,000 or more | 9 (16.4%) | 2 (1.3%) |
| Total | 55 (100.0%) | 159 (100.0%) |
Property Value to Household Income Ratio in Wilson
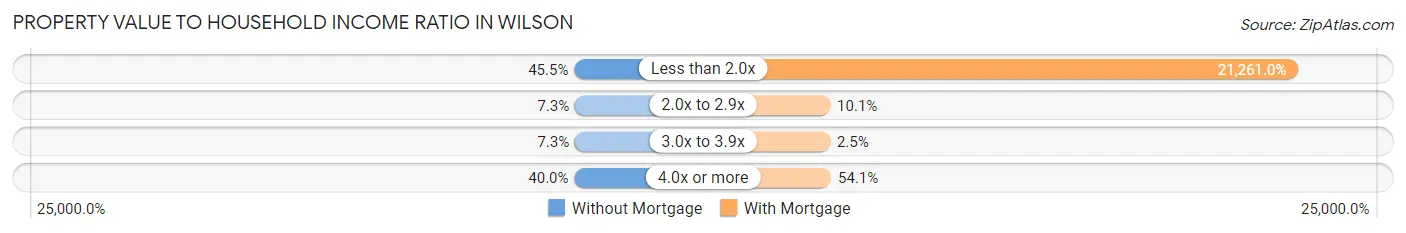
| Value-to-Income Ratio | Without Mortgage | With Mortgage |
| Less than 2.0x | 25 (45.5%) | 33,805 (21,261.0%) |
| 2.0x to 2.9x | 4 (7.3%) | 16 (10.1%) |
| 3.0x to 3.9x | 4 (7.3%) | 4 (2.5%) |
| 4.0x or more | 22 (40.0%) | 86 (54.1%) |
| Total | 55 (100.0%) | 159 (100.0%) |
Real Estate Taxes by Mortgage Status in Wilson
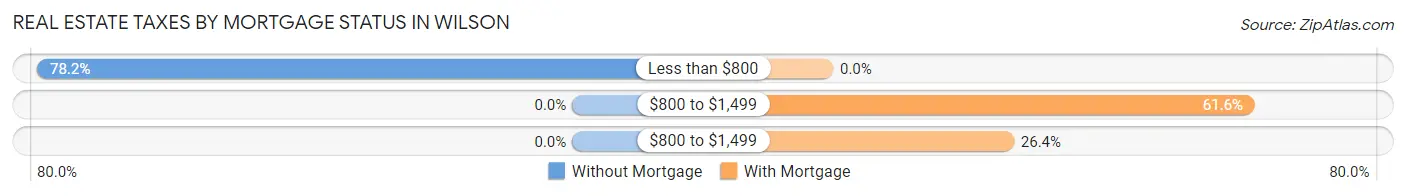
| Property Taxes | Without Mortgage | With Mortgage |
| Less than $800 | 43 (78.2%) | 0 (0.0%) |
| $800 to $1,499 | 0 (0.0%) | 98 (61.6%) |
| $800 to $1,499 | 0 (0.0%) | 42 (26.4%) |
| Total | 55 (100.0%) | 159 (100.0%) |
Health & Disability in Wilson
Health Insurance Coverage by Age in Wilson
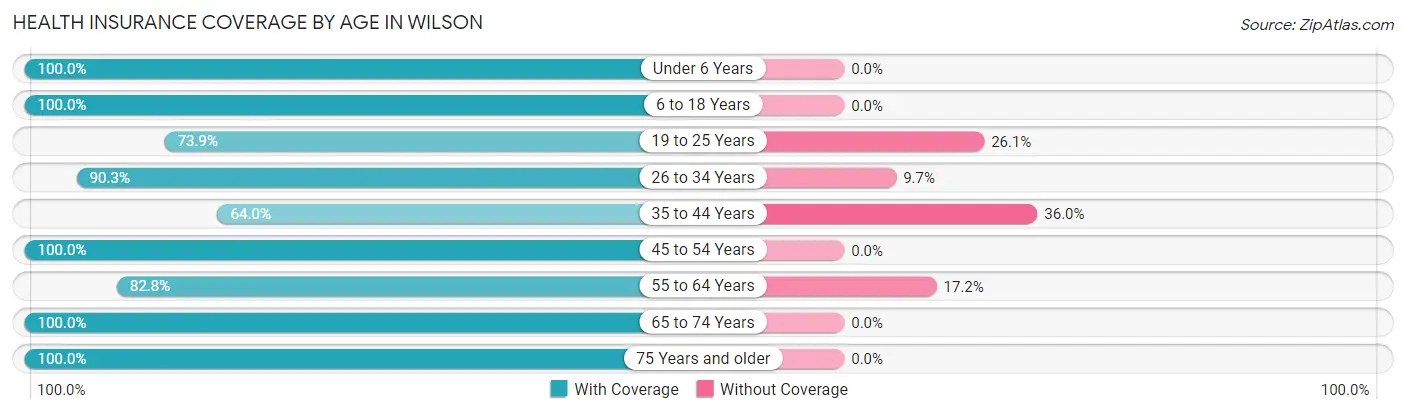
| Age Bracket | With Coverage | Without Coverage |
| Under 6 Years | 25 (100.0%) | 0 (0.0%) |
| 6 to 18 Years | 125 (100.0%) | 0 (0.0%) |
| 19 to 25 Years | 17 (73.9%) | 6 (26.1%) |
| 26 to 34 Years | 28 (90.3%) | 3 (9.7%) |
| 35 to 44 Years | 80 (64.0%) | 45 (36.0%) |
| 45 to 54 Years | 110 (100.0%) | 0 (0.0%) |
| 55 to 64 Years | 130 (82.8%) | 27 (17.2%) |
| 65 to 74 Years | 105 (100.0%) | 0 (0.0%) |
| 75 Years and older | 14 (100.0%) | 0 (0.0%) |
| Total | 634 (88.7%) | 81 (11.3%) |
Health Insurance Coverage by Citizenship Status in Wilson
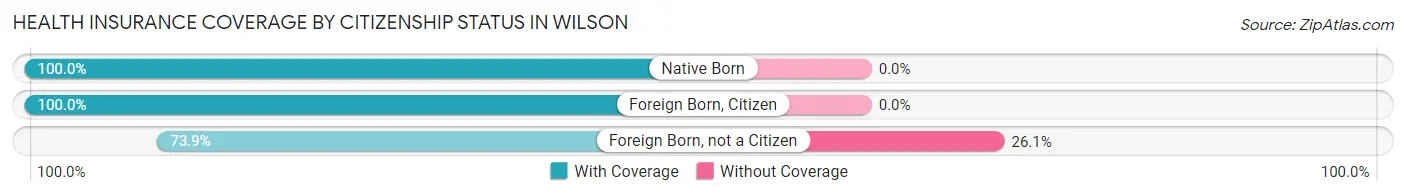
| Citizenship Status | With Coverage | Without Coverage |
| Native Born | 25 (100.0%) | 0 (0.0%) |
| Foreign Born, Citizen | 125 (100.0%) | 0 (0.0%) |
| Foreign Born, not a Citizen | 17 (73.9%) | 6 (26.1%) |
Health Insurance Coverage by Household Income in Wilson
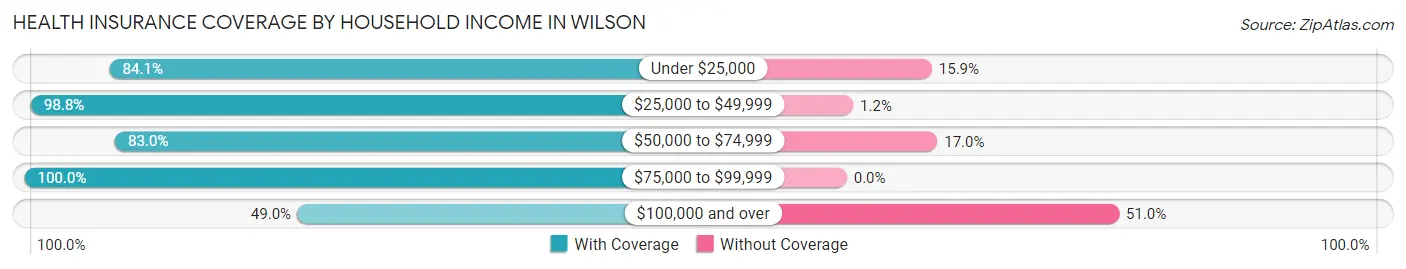
| Household Income | With Coverage | Without Coverage |
| Under $25,000 | 174 (84.1%) | 33 (15.9%) |
| $25,000 to $49,999 | 331 (98.8%) | 4 (1.2%) |
| $50,000 to $74,999 | 93 (83.0%) | 19 (17.0%) |
| $75,000 to $99,999 | 12 (100.0%) | 0 (0.0%) |
| $100,000 and over | 24 (49.0%) | 25 (51.0%) |
Public vs Private Health Insurance Coverage by Age in Wilson
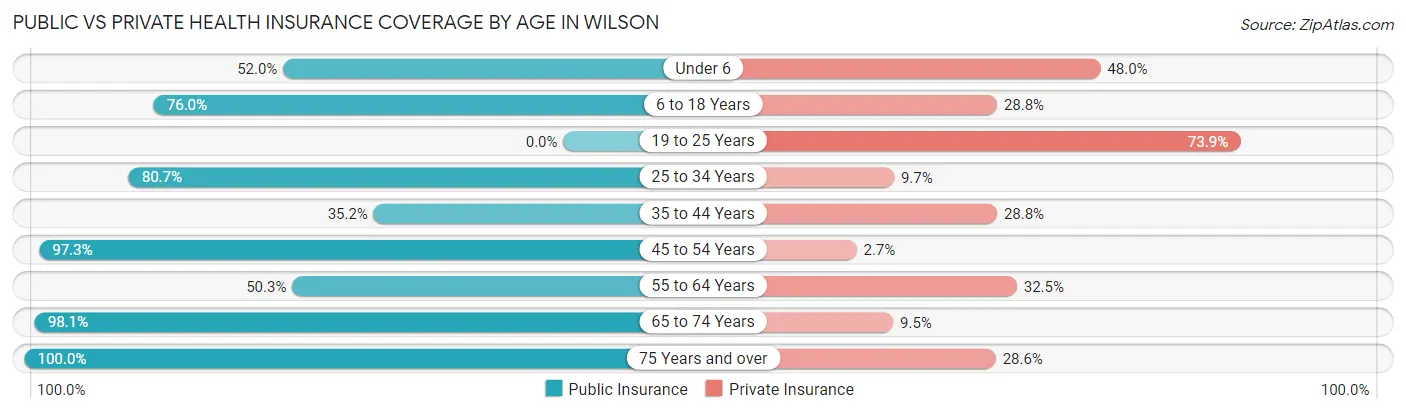
| Age Bracket | Public Insurance | Private Insurance |
| Under 6 | 13 (52.0%) | 12 (48.0%) |
| 6 to 18 Years | 95 (76.0%) | 36 (28.8%) |
| 19 to 25 Years | 0 (0.0%) | 17 (73.9%) |
| 25 to 34 Years | 25 (80.6%) | 3 (9.7%) |
| 35 to 44 Years | 44 (35.2%) | 36 (28.8%) |
| 45 to 54 Years | 107 (97.3%) | 3 (2.7%) |
| 55 to 64 Years | 79 (50.3%) | 51 (32.5%) |
| 65 to 74 Years | 103 (98.1%) | 10 (9.5%) |
| 75 Years and over | 14 (100.0%) | 4 (28.6%) |
| Total | 480 (67.1%) | 172 (24.1%) |
Disability Status by Sex by Age in Wilson
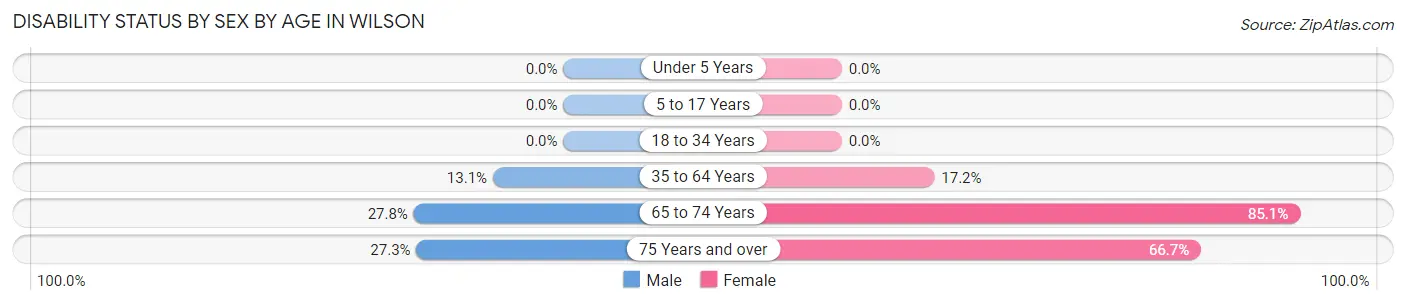
| Age Bracket | Male | Female |
| Under 5 Years | 0 (0.0%) | 0 (0.0%) |
| 5 to 17 Years | 0 (0.0%) | 0 (0.0%) |
| 18 to 34 Years | 0 (0.0%) | 0 (0.0%) |
| 35 to 64 Years | 17 (13.1%) | 45 (17.2%) |
| 65 to 74 Years | 5 (27.8%) | 74 (85.1%) |
| 75 Years and over | 3 (27.3%) | 2 (66.7%) |
Disability Class by Sex by Age in Wilson
Disability Class: Hearing Difficulty
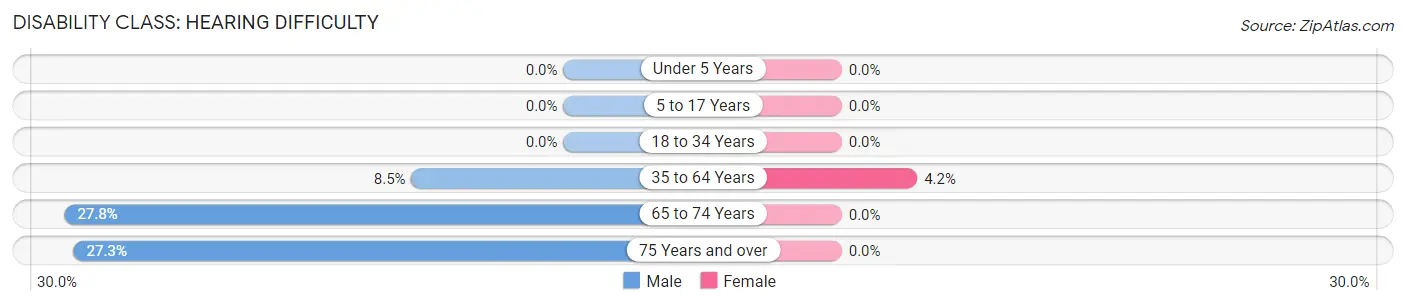
| Age Bracket | Male | Female |
| Under 5 Years | 0 (0.0%) | 0 (0.0%) |
| 5 to 17 Years | 0 (0.0%) | 0 (0.0%) |
| 18 to 34 Years | 0 (0.0%) | 0 (0.0%) |
| 35 to 64 Years | 11 (8.5%) | 11 (4.2%) |
| 65 to 74 Years | 5 (27.8%) | 0 (0.0%) |
| 75 Years and over | 3 (27.3%) | 0 (0.0%) |
Disability Class: Vision Difficulty
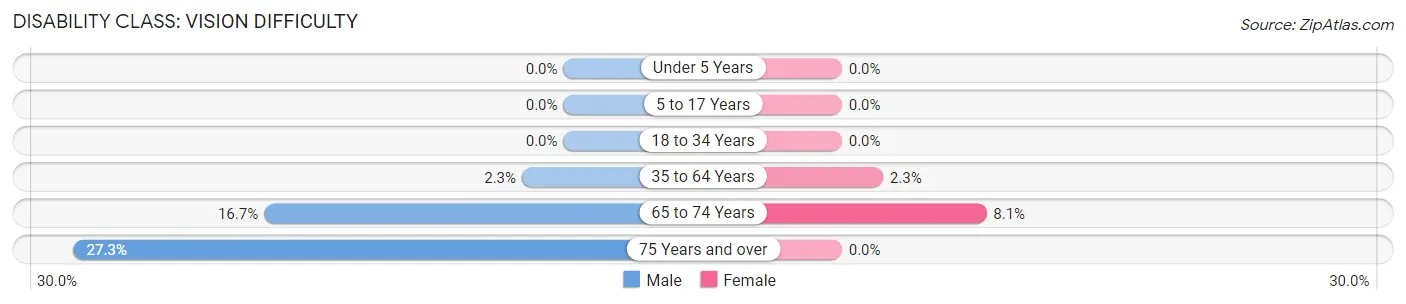
| Age Bracket | Male | Female |
| Under 5 Years | 0 (0.0%) | 0 (0.0%) |
| 5 to 17 Years | 0 (0.0%) | 0 (0.0%) |
| 18 to 34 Years | 0 (0.0%) | 0 (0.0%) |
| 35 to 64 Years | 3 (2.3%) | 6 (2.3%) |
| 65 to 74 Years | 3 (16.7%) | 7 (8.1%) |
| 75 Years and over | 3 (27.3%) | 0 (0.0%) |
Disability Class: Cognitive Difficulty
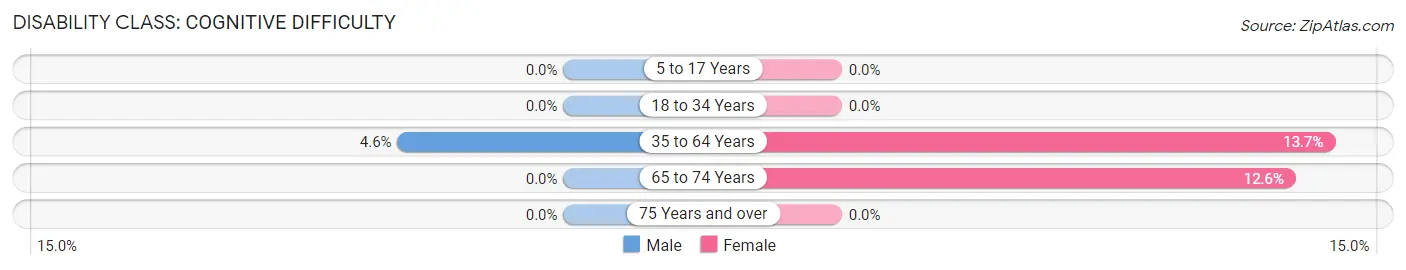
| Age Bracket | Male | Female |
| 5 to 17 Years | 0 (0.0%) | 0 (0.0%) |
| 18 to 34 Years | 0 (0.0%) | 0 (0.0%) |
| 35 to 64 Years | 6 (4.6%) | 36 (13.7%) |
| 65 to 74 Years | 0 (0.0%) | 11 (12.6%) |
| 75 Years and over | 0 (0.0%) | 0 (0.0%) |
Disability Class: Ambulatory Difficulty
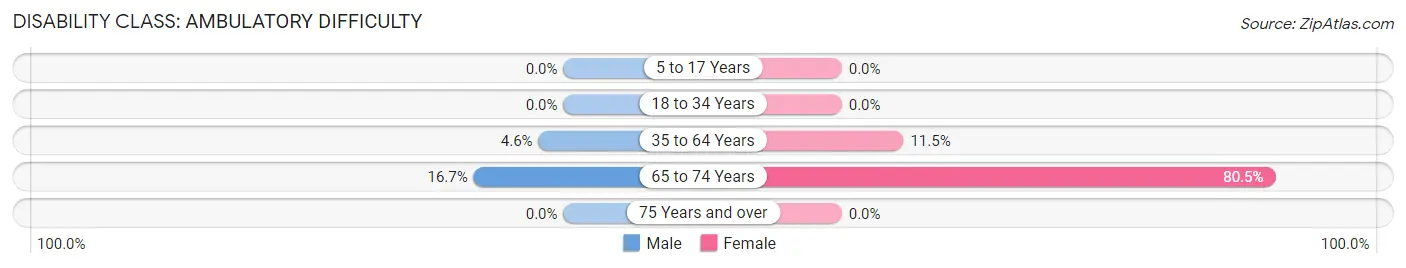
| Age Bracket | Male | Female |
| 5 to 17 Years | 0 (0.0%) | 0 (0.0%) |
| 18 to 34 Years | 0 (0.0%) | 0 (0.0%) |
| 35 to 64 Years | 6 (4.6%) | 30 (11.5%) |
| 65 to 74 Years | 3 (16.7%) | 70 (80.5%) |
| 75 Years and over | 0 (0.0%) | 0 (0.0%) |
Disability Class: Self-Care Difficulty
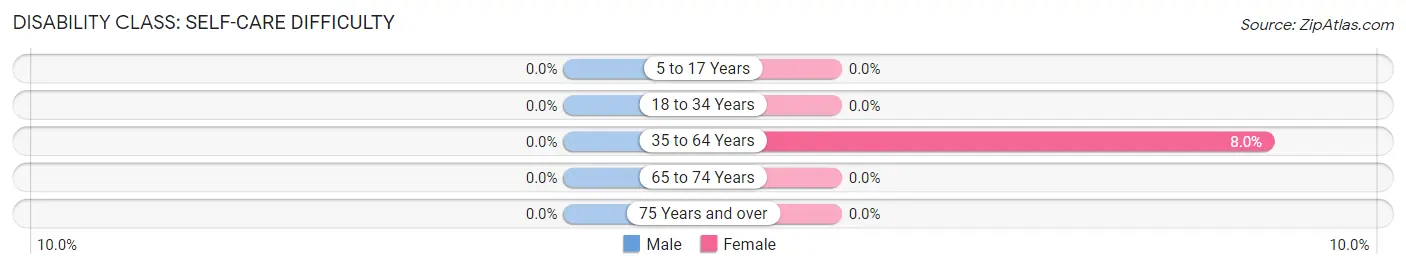
| Age Bracket | Male | Female |
| 5 to 17 Years | 0 (0.0%) | 0 (0.0%) |
| 18 to 34 Years | 0 (0.0%) | 0 (0.0%) |
| 35 to 64 Years | 0 (0.0%) | 21 (8.0%) |
| 65 to 74 Years | 0 (0.0%) | 0 (0.0%) |
| 75 Years and over | 0 (0.0%) | 0 (0.0%) |
Technology Access in Wilson
Computing Device Access in Wilson
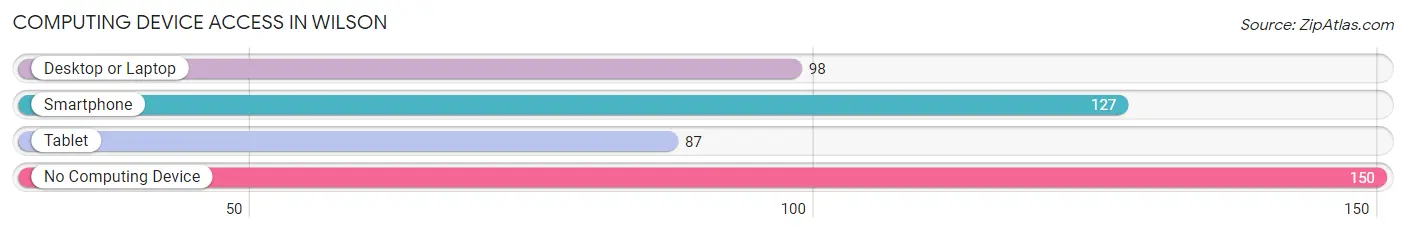
| Device Type | # Households | % Households |
| Desktop or Laptop | 98 | 34.5% |
| Smartphone | 127 | 44.7% |
| Tablet | 87 | 30.6% |
| No Computing Device | 150 | 52.8% |
| Total | 284 | 100.0% |
Internet Access in Wilson
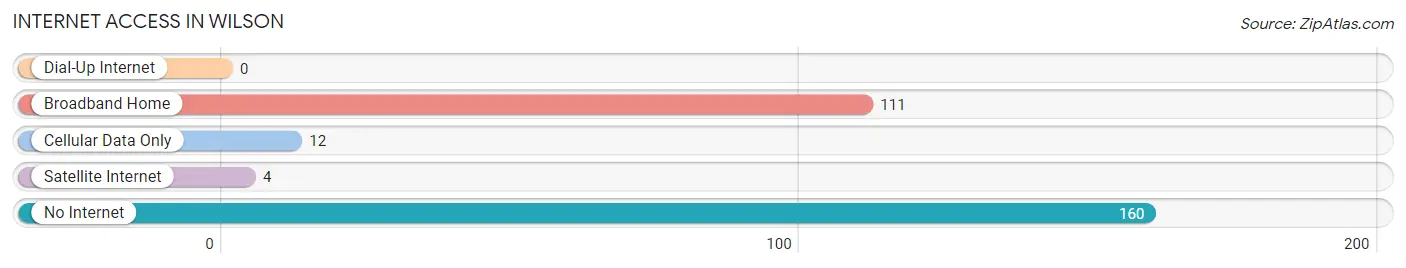
| Internet Type | # Households | % Households |
| Dial-Up Internet | 0 | 0.0% |
| Broadband Home | 111 | 39.1% |
| Cellular Data Only | 12 | 4.2% |
| Satellite Internet | 4 | 1.4% |
| No Internet | 160 | 56.3% |
| Total | 284 | 100.0% |
Wilson Summary
LA History
Los Angeles, or LA, is the second-largest city in the United States and the largest city in California. It is located in the southern part of the state, along the Pacific Ocean. The city was founded in 1781 by Spanish settlers, and it has a long and rich history.
The area that is now Los Angeles was originally inhabited by the Tongva people, who were hunter-gatherers. The Spanish arrived in the area in 1769, and they established the first mission in the area in 1771. The mission was called San Gabriel Arcangel, and it was the first of 21 missions that were established in California.
In 1781, the Spanish founded the city of Los Angeles. The city was named after the Virgin Mary, and it was the first city in California. The city grew quickly, and by the mid-1800s, it was the largest city in California.
In 1848, the United States acquired California from Mexico, and Los Angeles became part of the United States. The city continued to grow, and by the early 1900s, it was the largest city in the state.
In the early 1900s, Los Angeles was a major center of the film industry. The city was home to many of the major studios, and it was the birthplace of the Hollywood movie industry.
In the 1950s and 1960s, Los Angeles experienced a period of rapid growth. The city was transformed from a small city to a major metropolis. The population of the city grew from 1 million in 1950 to 3 million in 1970.
LA Geography
Los Angeles is located in the southern part of California, along the Pacific Ocean. The city is bordered by the San Gabriel Mountains to the north and the Santa Monica Mountains to the south. The city is divided into four main regions: Downtown, Hollywood, the San Fernando Valley, and the South Bay.
The city is home to many different types of terrain, including mountains, hills, valleys, and beaches. The city is also home to many parks and open spaces, including Griffith Park, Elysian Park, and the Santa Monica Mountains National Recreation Area.
The climate in Los Angeles is Mediterranean, with mild, wet winters and hot, dry summers. The average temperature in the city is around 70 degrees Fahrenheit.
LA Economy
Los Angeles is a major economic center in the United States. The city is home to many large corporations, including the Walt Disney Company, Warner Bros., and Universal Studios. The city is also home to many technology companies, including Google, Apple, and Microsoft.
The city is a major center of international trade, and it is home to the Port of Los Angeles, the largest port in the United States. The port is a major hub for international trade, and it is the busiest port in the United States.
The city is also a major center of tourism. The city is home to many popular attractions, including the Hollywood Walk of Fame, Universal Studios, and the Santa Monica Pier.
LA Demographics
Los Angeles is a diverse city, and it is home to people from all over the world. The city has a population of over 4 million people, and it is the second-largest city in the United States.
The city is home to many different ethnic and racial groups. The largest ethnic group in the city is Hispanic or Latino, which makes up 48.5% of the population. The second-largest ethnic group is White, which makes up 28.7% of the population. Other ethnic groups in the city include African American (9.8%), Asian (10.8%), and Native American (0.5%).
The city is also home to many different religions. The largest religious group in the city is Christian, which makes up 57.2% of the population. Other religious groups in the city include Jewish (2.2%), Muslim (1.7%), and Buddhist (1.2%).
Common Questions
What is Per Capita Income in Wilson?
Per Capita income in Wilson is $16,322.
What is the Median Family Income in Wilson?
Median Family Income in Wilson is $33,824.
What is the Median Household income in Wilson?
Median Household Income in Wilson is $32,868.
What is Income or Wage Gap in Wilson?
Income or Wage Gap in Wilson is 4.7%.
Women in Wilson earn 95.3 cents for every dollar earned by a man.
What is Inequality or Gini Index in Wilson?
Inequality or Gini Index in Wilson is 0.45.
What is the Total Population of Wilson?
Total Population of Wilson is 715.
What is the Total Male Population of Wilson?
Total Male Population of Wilson is 250.
What is the Total Female Population of Wilson?
Total Female Population of Wilson is 465.
What is the Ratio of Males per 100 Females in Wilson?
There are 53.76 Males per 100 Females in Wilson.
What is the Ratio of Females per 100 Males in Wilson?
There are 186.00 Females per 100 Males in Wilson.
What is the Median Population Age in Wilson?
Median Population Age in Wilson is 47.7 Years.
What is the Average Family Size in Wilson
Average Family Size in Wilson is 2.9 People.
What is the Average Household Size in Wilson
Average Household Size in Wilson is 2.5 People.
How Large is the Labor Force in Wilson?
There are 178 People in the Labor Forcein in Wilson.
What is the Percentage of People in the Labor Force in Wilson?
30.6% of People are in the Labor Force in Wilson.