Longstreet, LA Map & Demographics
Longstreet Map
Longstreet Overview
$31,274
PER CAPITA INCOME
$86,406
AVG FAMILY INCOME
$85,469
AVG HOUSEHOLD INCOME
0.28
INEQUALITY / GINI INDEX
111
TOTAL POPULATION
63
MALE POPULATION
48
FEMALE POPULATION
131.25
MALES / 100 FEMALES
76.19
FEMALES / 100 MALES
57.6
MEDIAN AGE
2.7
AVG FAMILY SIZE
2.5
AVG HOUSEHOLD SIZE
31
LABOR FORCE [ PEOPLE ]
31.3%
PERCENT IN LABOR FORCE
12.9%
UNEMPLOYMENT RATE
Longstreet Area Codes
Income in Longstreet
Income Overview in Longstreet
Per Capita Income in Longstreet is $31,274, while median incomes of families and households are $86,406 and $85,469 respectively.
| Characteristic | Number | Measure |
| Per Capita Income | 111 | $31,274 |
| Median Family Income | 39 | $86,406 |
| Mean Family Income | 39 | $90,436 |
| Median Household Income | 45 | $85,469 |
| Mean Household Income | 45 | $81,307 |
| Income Deficit | 39 | $0 |
| Wage / Income Gap (%) | 111 | 0.00% |
| Wage / Income Gap ($) | 111 | 100.00¢ per $1 |
| Gini / Inequality Index | 111 | 0.28 |
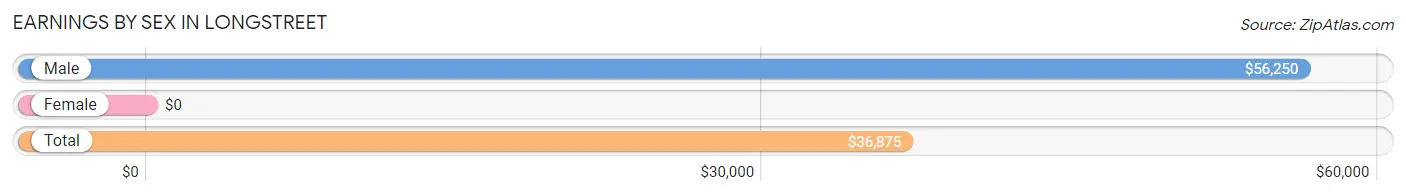
Earnings by Sex in Longstreet
| Sex | Number | Average Earnings |
| Male | 30 (73.2%) | $56,250 |
| Female | 11 (26.8%) | $0 |
| Total | 41 (100.0%) | $36,875 |
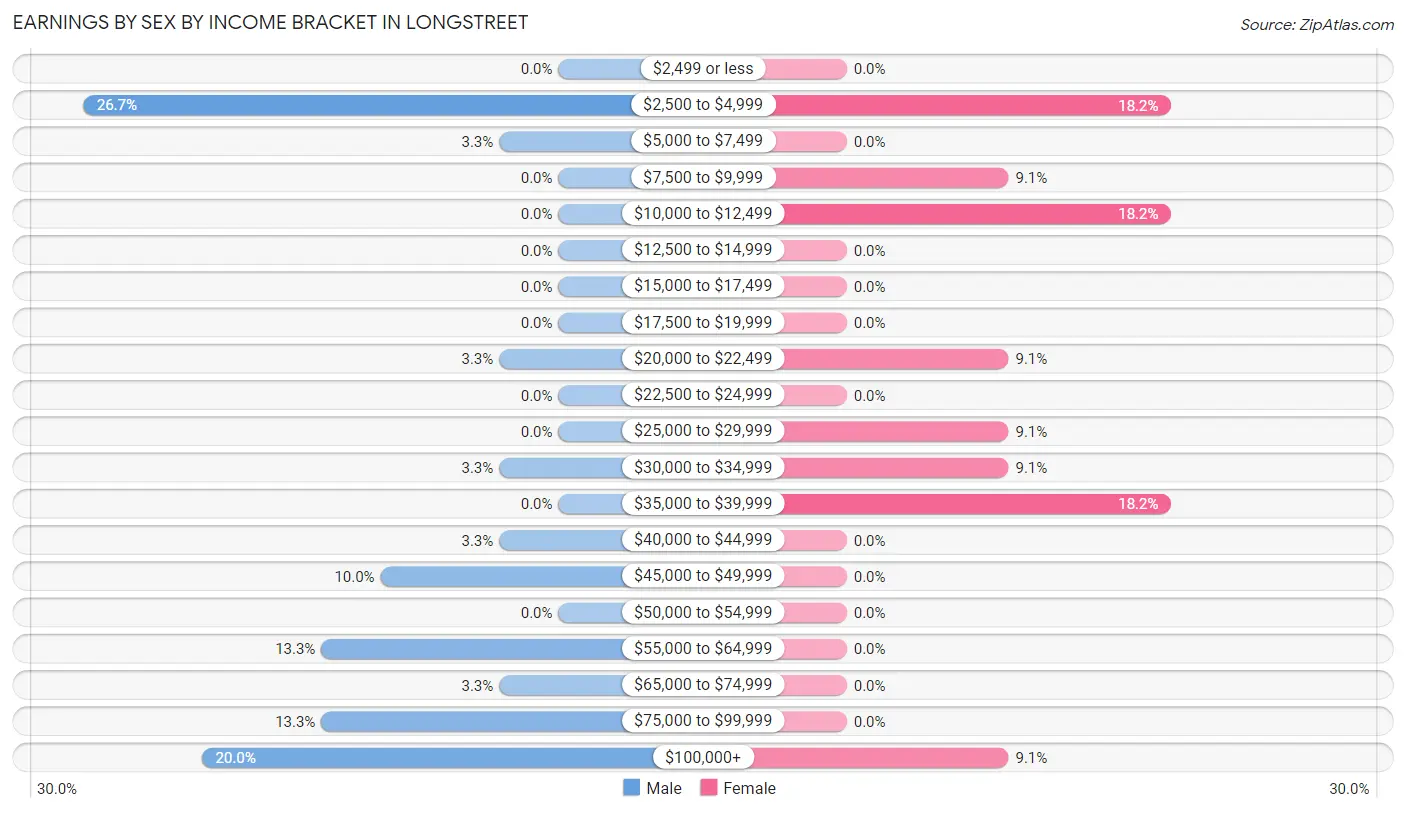
Earnings by Sex by Income Bracket in Longstreet
The most common earnings brackets in Longstreet are $2,500 to $4,999 for men (8 | 26.7%) and $2,500 to $4,999 for women (2 | 18.2%).
| Income | Male | Female |
| $2,499 or less | 0 (0.0%) | 0 (0.0%) |
| $2,500 to $4,999 | 8 (26.7%) | 2 (18.2%) |
| $5,000 to $7,499 | 1 (3.3%) | 0 (0.0%) |
| $7,500 to $9,999 | 0 (0.0%) | 1 (9.1%) |
| $10,000 to $12,499 | 0 (0.0%) | 2 (18.2%) |
| $12,500 to $14,999 | 0 (0.0%) | 0 (0.0%) |
| $15,000 to $17,499 | 0 (0.0%) | 0 (0.0%) |
| $17,500 to $19,999 | 0 (0.0%) | 0 (0.0%) |
| $20,000 to $22,499 | 1 (3.3%) | 1 (9.1%) |
| $22,500 to $24,999 | 0 (0.0%) | 0 (0.0%) |
| $25,000 to $29,999 | 0 (0.0%) | 1 (9.1%) |
| $30,000 to $34,999 | 1 (3.3%) | 1 (9.1%) |
| $35,000 to $39,999 | 0 (0.0%) | 2 (18.2%) |
| $40,000 to $44,999 | 1 (3.3%) | 0 (0.0%) |
| $45,000 to $49,999 | 3 (10.0%) | 0 (0.0%) |
| $50,000 to $54,999 | 0 (0.0%) | 0 (0.0%) |
| $55,000 to $64,999 | 4 (13.3%) | 0 (0.0%) |
| $65,000 to $74,999 | 1 (3.3%) | 0 (0.0%) |
| $75,000 to $99,999 | 4 (13.3%) | 0 (0.0%) |
| $100,000+ | 6 (20.0%) | 1 (9.1%) |
| Total | 30 (100.0%) | 11 (100.0%) |
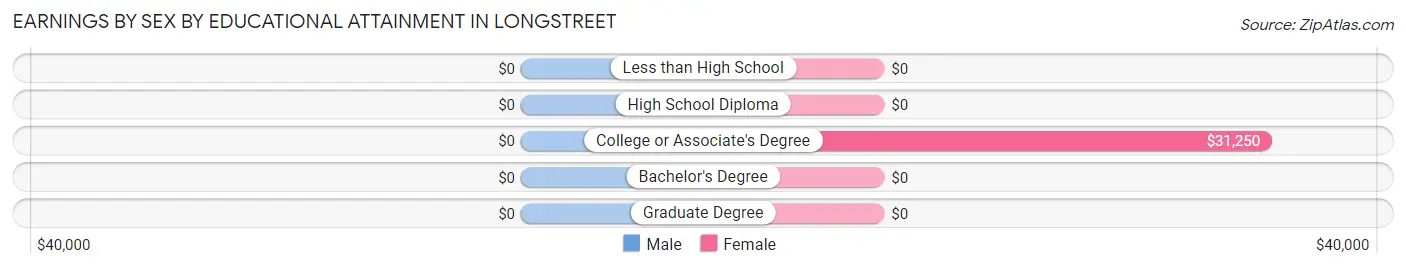
Earnings by Sex by Educational Attainment in Longstreet
| Educational Attainment | Male Income | Female Income |
| Less than High School | - | - |
| High School Diploma | - | - |
| College or Associate's Degree | - | - |
| Bachelor's Degree | - | - |
| Graduate Degree | - | - |
| Total | $62,813 | $0 |
Family Income in Longstreet
Family Income Brackets in Longstreet
According to the Longstreet family income data, there are 14 families falling into the $75,000 to $99,999 income range, which is the most common income bracket and makes up 35.9% of all families.
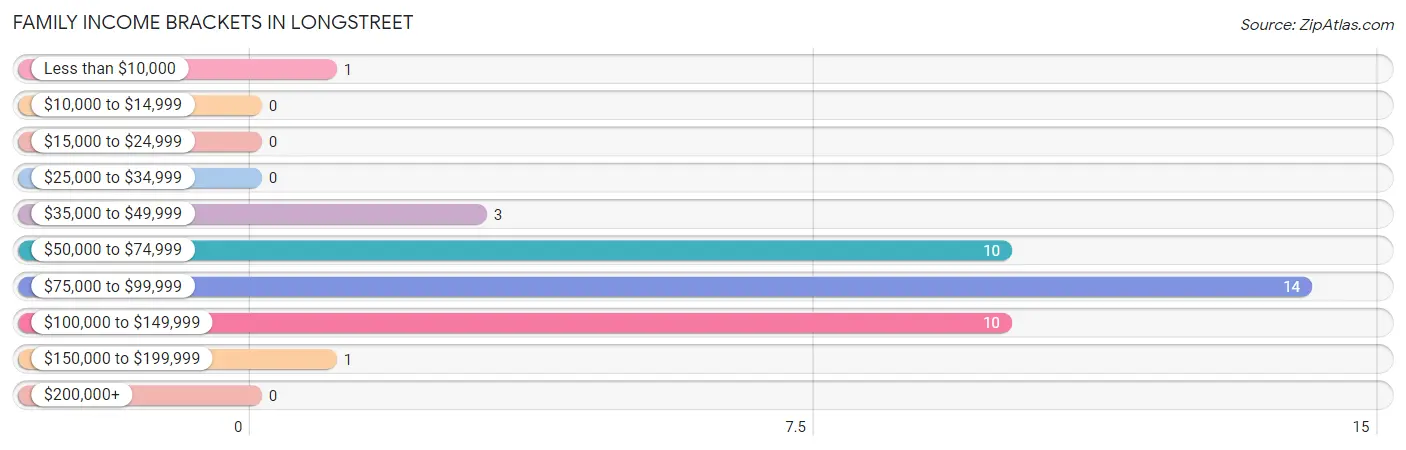
| Income Bracket | # Families | % Families |
| Less than $10,000 | 1 | 2.6% |
| $10,000 to $14,999 | 0 | 0.0% |
| $15,000 to $24,999 | 0 | 0.0% |
| $25,000 to $34,999 | 0 | 0.0% |
| $35,000 to $49,999 | 3 | 7.7% |
| $50,000 to $74,999 | 10 | 25.6% |
| $75,000 to $99,999 | 14 | 35.9% |
| $100,000 to $149,999 | 10 | 25.6% |
| $150,000 to $199,999 | 1 | 2.6% |
| $200,000+ | 0 | 0.0% |
Family Income by Famaliy Size in Longstreet
2-person families (23 | 59.0%) account for the highest median family income in Longstreet with $95,417 per family, while 2-person families (23 | 59.0%) have the highest median income of $47,708 per family member.
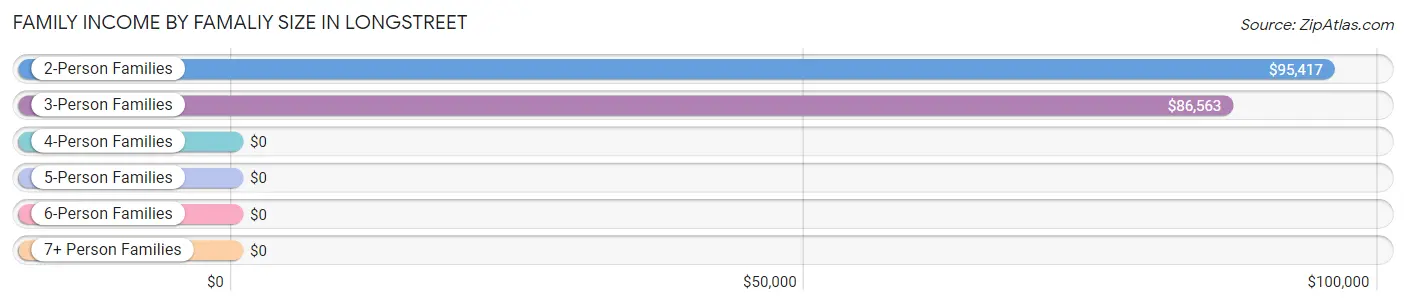
| Income Bracket | # Families | Median Income |
| 2-Person Families | 23 (59.0%) | $95,417 |
| 3-Person Families | 10 (25.6%) | $86,563 |
| 4-Person Families | 1 (2.6%) | $0 |
| 5-Person Families | 5 (12.8%) | $0 |
| 6-Person Families | 0 (0.0%) | $0 |
| 7+ Person Families | 0 (0.0%) | $0 |
| Total | 39 (100.0%) | $86,406 |
Family Income by Number of Earners in Longstreet
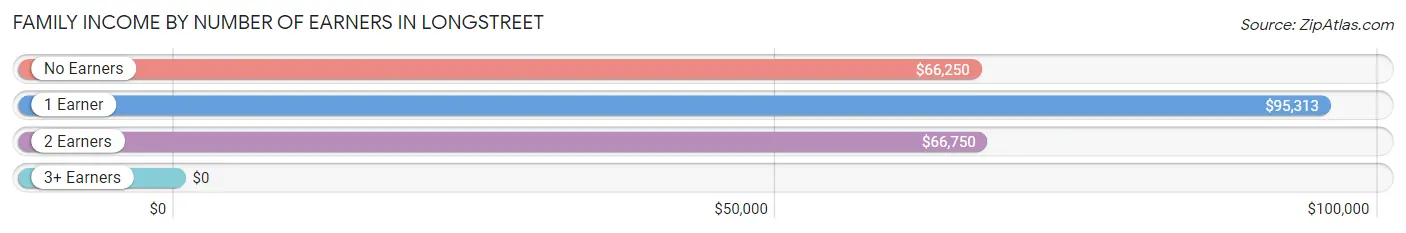
| Number of Earners | # Families | Median Income |
| No Earners | 5 (12.8%) | $66,250 |
| 1 Earner | 23 (59.0%) | $95,313 |
| 2 Earners | 11 (28.2%) | $66,750 |
| 3+ Earners | 0 (0.0%) | $0 |
| Total | 39 (100.0%) | $86,406 |
Household Income in Longstreet
Household Income Brackets in Longstreet
With 14 households falling in the category, the $75,000 to $99,999 income range is the most frequent in Longstreet, accounting for 31.1% of all households.
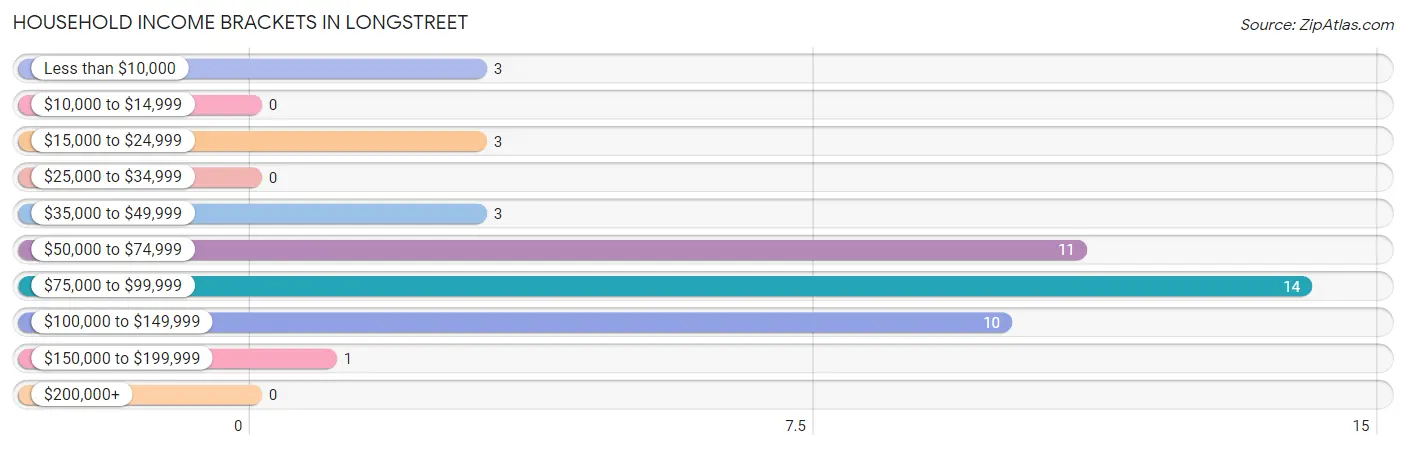
| Income Bracket | # Households | % Households |
| Less than $10,000 | 3 | 6.7% |
| $10,000 to $14,999 | 0 | 0.0% |
| $15,000 to $24,999 | 3 | 6.7% |
| $25,000 to $34,999 | 0 | 0.0% |
| $35,000 to $49,999 | 3 | 6.7% |
| $50,000 to $74,999 | 11 | 24.4% |
| $75,000 to $99,999 | 14 | 31.1% |
| $100,000 to $149,999 | 10 | 22.2% |
| $150,000 to $199,999 | 1 | 2.2% |
| $200,000+ | 0 | 0.0% |
Household Income by Householder Age in Longstreet
The median household income in Longstreet is $85,469, with the highest median household income of $113,750 found in the 45 to 64 years age bracket for the primary householder. A total of 14 households (31.1%) fall into this category.
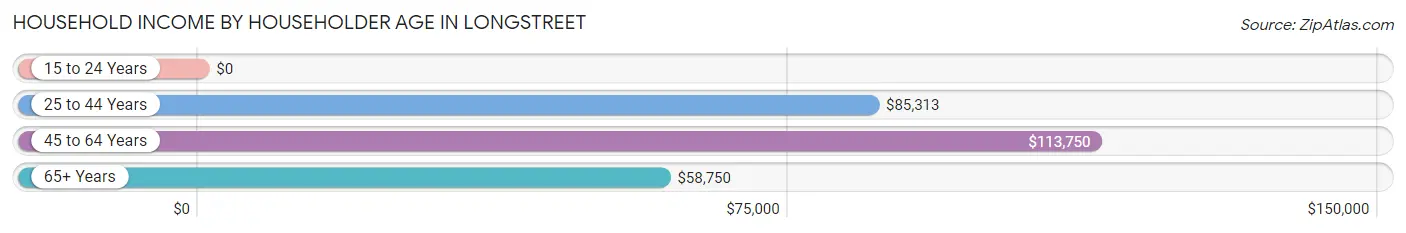
| Income Bracket | # Households | Median Income |
| 15 to 24 Years | 0 (0.0%) | $0 |
| 25 to 44 Years | 16 (35.6%) | $85,313 |
| 45 to 64 Years | 14 (31.1%) | $113,750 |
| 65+ Years | 15 (33.3%) | $58,750 |
| Total | 45 (100.0%) | $85,469 |
Poverty in Longstreet
Income Below Poverty by Sex and Age in Longstreet
With 1.6% poverty level for males and 6.2% for females among the residents of Longstreet, 45 to 54 year old males and 65 to 74 year old females are the most vulnerable to poverty, with 1 males (33.3%) and 2 females (14.3%) in their respective age groups living below the poverty level.
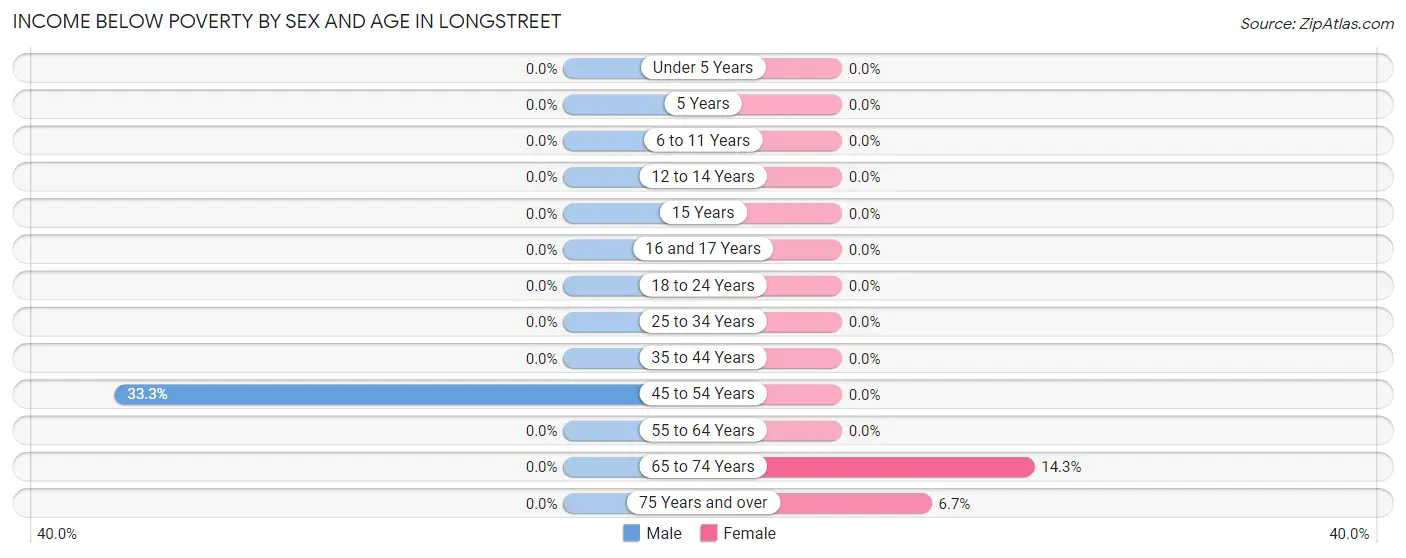
| Age Bracket | Male | Female |
| Under 5 Years | 0 (0.0%) | 0 (0.0%) |
| 5 Years | 0 (0.0%) | 0 (0.0%) |
| 6 to 11 Years | 0 (0.0%) | 0 (0.0%) |
| 12 to 14 Years | 0 (0.0%) | 0 (0.0%) |
| 15 Years | 0 (0.0%) | 0 (0.0%) |
| 16 and 17 Years | 0 (0.0%) | 0 (0.0%) |
| 18 to 24 Years | 0 (0.0%) | 0 (0.0%) |
| 25 to 34 Years | 0 (0.0%) | 0 (0.0%) |
| 35 to 44 Years | 0 (0.0%) | 0 (0.0%) |
| 45 to 54 Years | 1 (33.3%) | 0 (0.0%) |
| 55 to 64 Years | 0 (0.0%) | 0 (0.0%) |
| 65 to 74 Years | 0 (0.0%) | 2 (14.3%) |
| 75 Years and over | 0 (0.0%) | 1 (6.7%) |
| Total | 1 (1.6%) | 3 (6.2%) |
Income Above Poverty by Sex and Age in Longstreet
According to the poverty statistics in Longstreet, males aged under 5 years and females aged 18 to 24 years are the age groups that are most secure financially, with 100.0% of males and 100.0% of females in these age groups living above the poverty line.
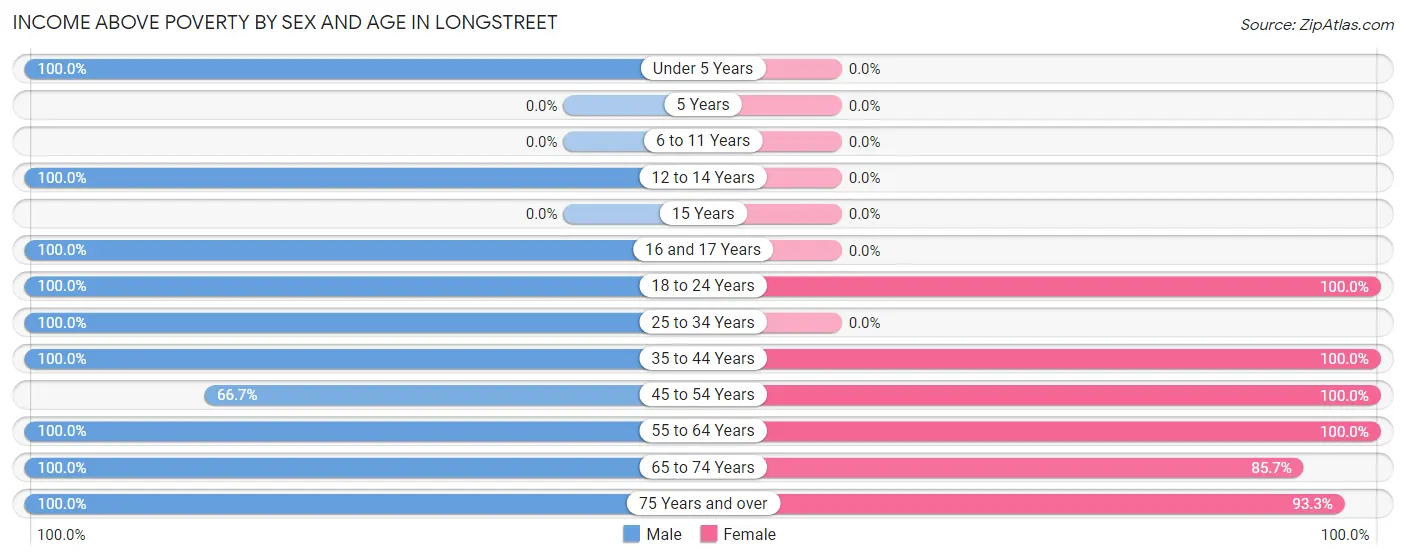
| Age Bracket | Male | Female |
| Under 5 Years | 6 (100.0%) | 0 (0.0%) |
| 5 Years | 0 (0.0%) | 0 (0.0%) |
| 6 to 11 Years | 0 (0.0%) | 0 (0.0%) |
| 12 to 14 Years | 6 (100.0%) | 0 (0.0%) |
| 15 Years | 0 (0.0%) | 0 (0.0%) |
| 16 and 17 Years | 4 (100.0%) | 0 (0.0%) |
| 18 to 24 Years | 3 (100.0%) | 2 (100.0%) |
| 25 to 34 Years | 8 (100.0%) | 0 (0.0%) |
| 35 to 44 Years | 6 (100.0%) | 8 (100.0%) |
| 45 to 54 Years | 2 (66.7%) | 2 (100.0%) |
| 55 to 64 Years | 12 (100.0%) | 7 (100.0%) |
| 65 to 74 Years | 12 (100.0%) | 12 (85.7%) |
| 75 Years and over | 3 (100.0%) | 14 (93.3%) |
| Total | 62 (98.4%) | 45 (93.8%) |
Income Below Poverty Among Married-Couple Families in Longstreet
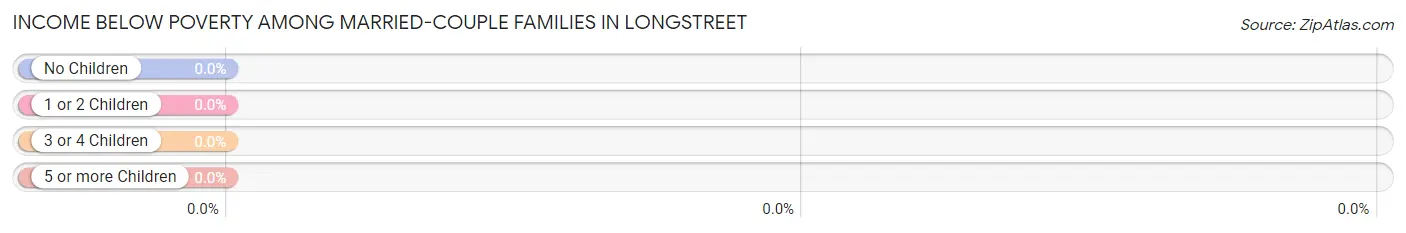
| Children | Above Poverty | Below Poverty |
| No Children | 18 (100.0%) | 0 (0.0%) |
| 1 or 2 Children | 6 (100.0%) | 0 (0.0%) |
| 3 or 4 Children | 0 (0.0%) | 0 (0.0%) |
| 5 or more Children | 0 (0.0%) | 0 (0.0%) |
| Total | 24 (100.0%) | 0 (0.0%) |
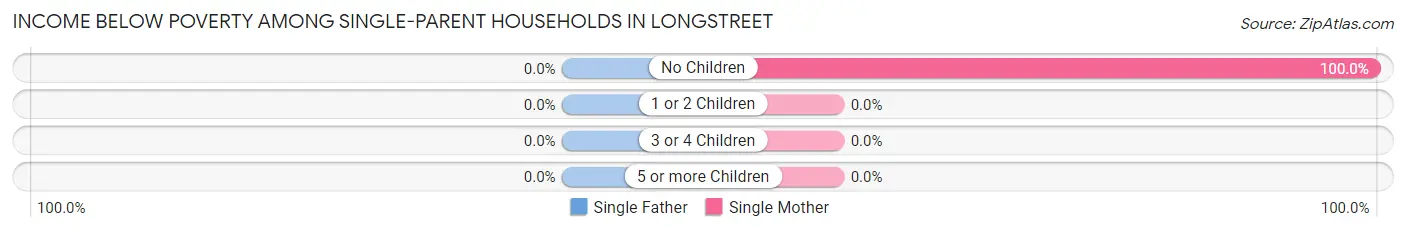
Income Below Poverty Among Single-Parent Households in Longstreet
| Children | Single Father | Single Mother |
| No Children | 0 (0.0%) | 1 (100.0%) |
| 1 or 2 Children | 0 (0.0%) | 0 (0.0%) |
| 3 or 4 Children | 0 (0.0%) | 0 (0.0%) |
| 5 or more Children | 0 (0.0%) | 0 (0.0%) |
| Total | 0 (0.0%) | 1 (50.0%) |
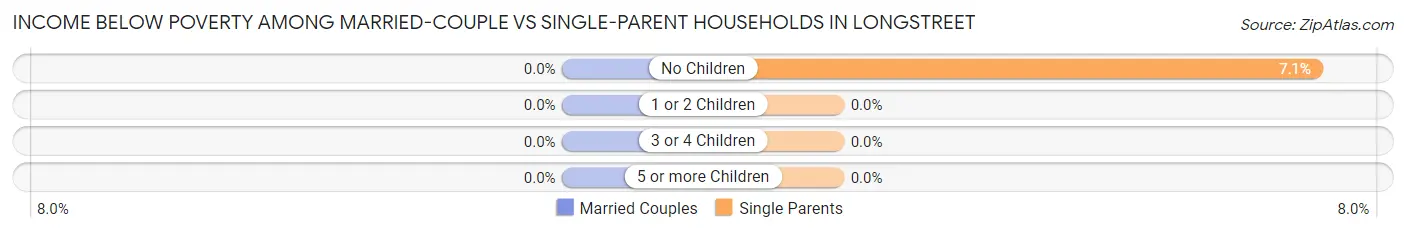
Income Below Poverty Among Married-Couple vs Single-Parent Households in Longstreet
| Children | Married-Couple Families | Single-Parent Households |
| No Children | 0 (0.0%) | 1 (7.1%) |
| 1 or 2 Children | 0 (0.0%) | 0 (0.0%) |
| 3 or 4 Children | 0 (0.0%) | 0 (0.0%) |
| 5 or more Children | 0 (0.0%) | 0 (0.0%) |
| Total | 0 (0.0%) | 1 (6.7%) |
Race in Longstreet
The most populous races in Longstreet are White / Caucasian (101 | 91.0%), Two or more Races (7 | 6.3%), and Hispanic or Latino (5 | 4.5%).
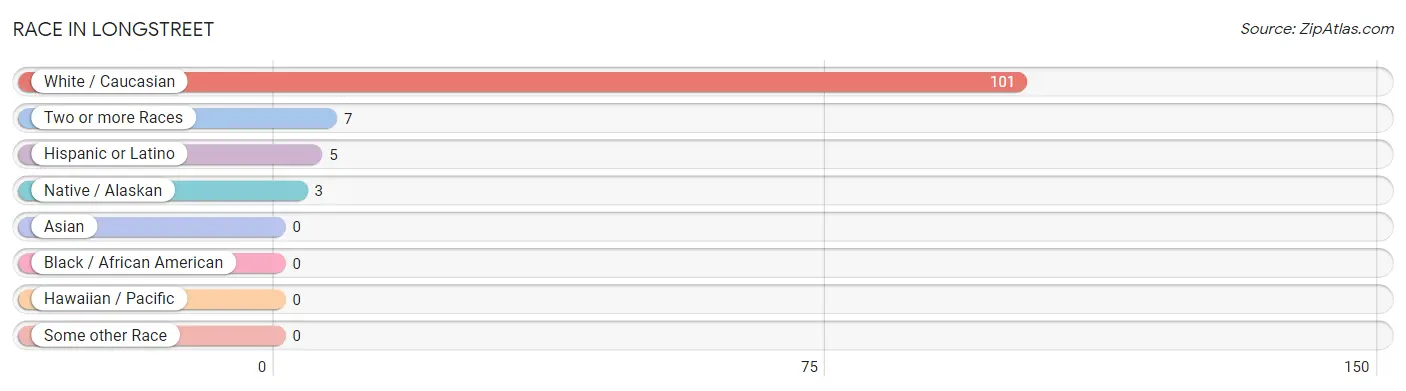
| Race | # Population | % Population |
| Asian | 0 | 0.0% |
| Black / African American | 0 | 0.0% |
| Hawaiian / Pacific | 0 | 0.0% |
| Hispanic or Latino | 5 | 4.5% |
| Native / Alaskan | 3 | 2.7% |
| White / Caucasian | 101 | 91.0% |
| Two or more Races | 7 | 6.3% |
| Some other Race | 0 | 0.0% |
| Total | 111 | 100.0% |
Ancestry in Longstreet
The most populous ancestries reported in Longstreet are English (38 | 34.2%), Irish (29 | 26.1%), Scotch-Irish (14 | 12.6%), American (7 | 6.3%), and German (6 | 5.4%), together accounting for 84.7% of all Longstreet residents.
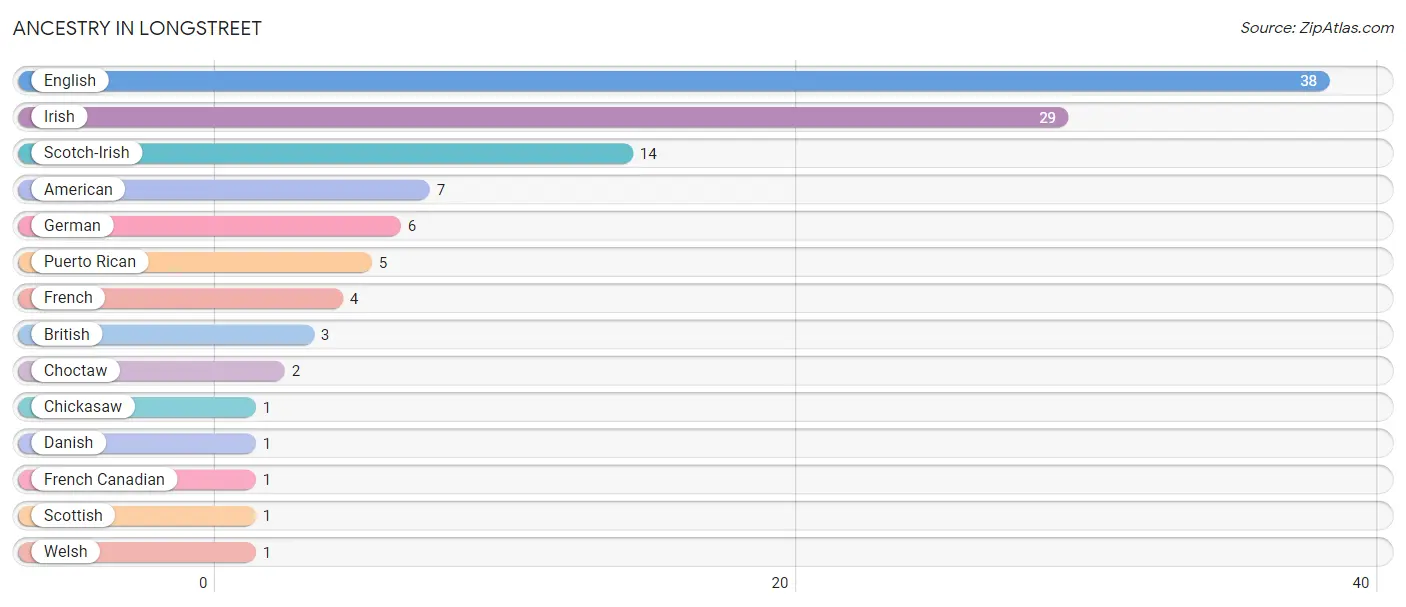
| Ancestry | # Population | % Population |
| American | 7 | 6.3% |
| British | 3 | 2.7% |
| Chickasaw | 1 | 0.9% |
| Choctaw | 2 | 1.8% |
| Danish | 1 | 0.9% |
| English | 38 | 34.2% |
| French | 4 | 3.6% |
| French Canadian | 1 | 0.9% |
| German | 6 | 5.4% |
| Irish | 29 | 26.1% |
| Puerto Rican | 5 | 4.5% |
| Scotch-Irish | 14 | 12.6% |
| Scottish | 1 | 0.9% |
| Welsh | 1 | 0.9% | View All 14 Rows |
Immigrants in Longstreet

| Immigration Origin | # Population | % Population | View All 0 Rows |
Sex and Age in Longstreet
Sex and Age in Longstreet
The most populous age groups in Longstreet are 70 to 74 Years (12 | 19.1%) for men and 70 to 74 Years (8 | 16.7%) for women.
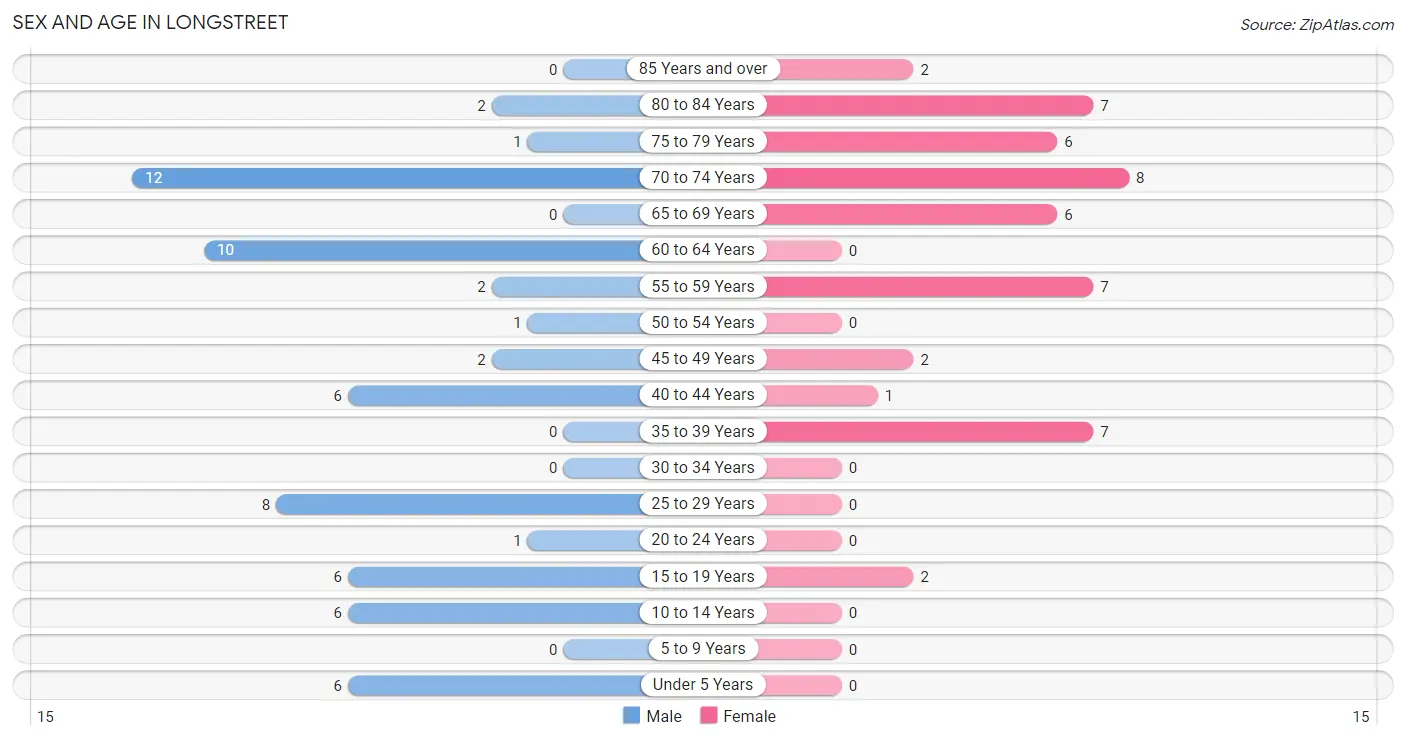
| Age Bracket | Male | Female |
| Under 5 Years | 6 (9.5%) | 0 (0.0%) |
| 5 to 9 Years | 0 (0.0%) | 0 (0.0%) |
| 10 to 14 Years | 6 (9.5%) | 0 (0.0%) |
| 15 to 19 Years | 6 (9.5%) | 2 (4.2%) |
| 20 to 24 Years | 1 (1.6%) | 0 (0.0%) |
| 25 to 29 Years | 8 (12.7%) | 0 (0.0%) |
| 30 to 34 Years | 0 (0.0%) | 0 (0.0%) |
| 35 to 39 Years | 0 (0.0%) | 7 (14.6%) |
| 40 to 44 Years | 6 (9.5%) | 1 (2.1%) |
| 45 to 49 Years | 2 (3.2%) | 2 (4.2%) |
| 50 to 54 Years | 1 (1.6%) | 0 (0.0%) |
| 55 to 59 Years | 2 (3.2%) | 7 (14.6%) |
| 60 to 64 Years | 10 (15.9%) | 0 (0.0%) |
| 65 to 69 Years | 0 (0.0%) | 6 (12.5%) |
| 70 to 74 Years | 12 (19.1%) | 8 (16.7%) |
| 75 to 79 Years | 1 (1.6%) | 6 (12.5%) |
| 80 to 84 Years | 2 (3.2%) | 7 (14.6%) |
| 85 Years and over | 0 (0.0%) | 2 (4.2%) |
| Total | 63 (100.0%) | 48 (100.0%) |
Families and Households in Longstreet
Median Family Size in Longstreet
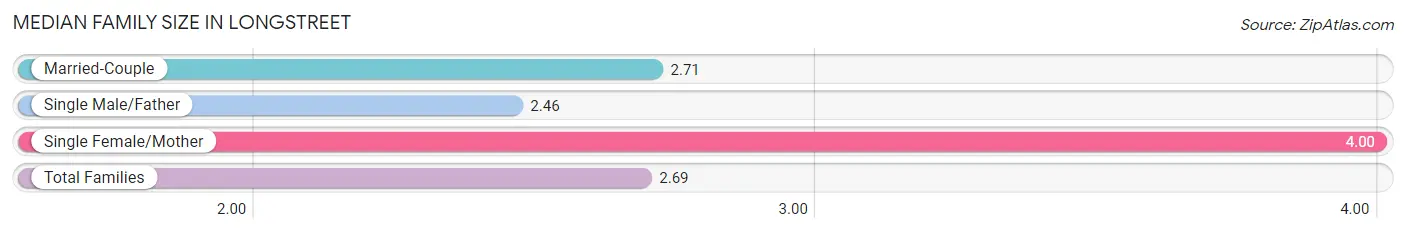
The median family size in Longstreet is 2.69 persons per family, with single female/mother families (2 | 5.1%) accounting for the largest median family size of 4 persons per family. On the other hand, single male/father families (13 | 33.3%) represent the smallest median family size with 2.46 persons per family.
| Family Type | # Families | Family Size |
| Married-Couple | 24 (61.5%) | 2.71 |
| Single Male/Father | 13 (33.3%) | 2.46 |
| Single Female/Mother | 2 (5.1%) | 4.00 |
| Total Families | 39 (100.0%) | 2.69 |
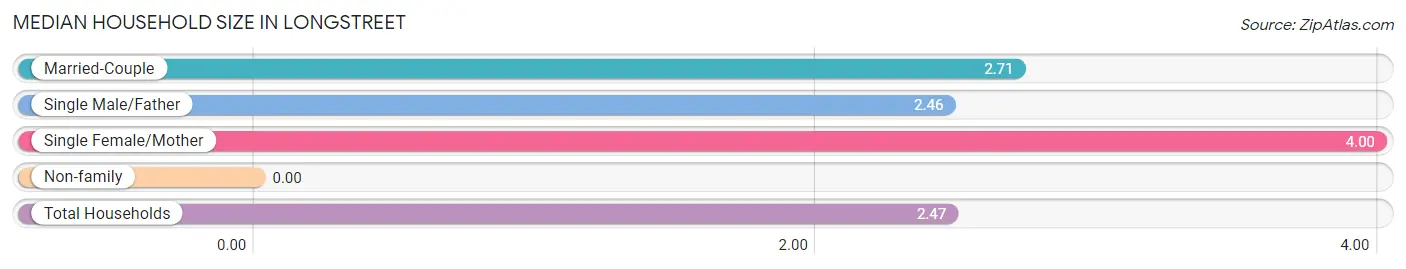
Median Household Size in Longstreet
| Household Type | # Households | Household Size |
| Married-Couple | 24 (53.3%) | 2.71 |
| Single Male/Father | 13 (28.9%) | 2.46 |
| Single Female/Mother | 2 (4.4%) | 4.00 |
| Non-family | 6 (13.3%) | - |
| Total Households | 45 (100.0%) | 2.47 |
Household Size by Marriage Status in Longstreet
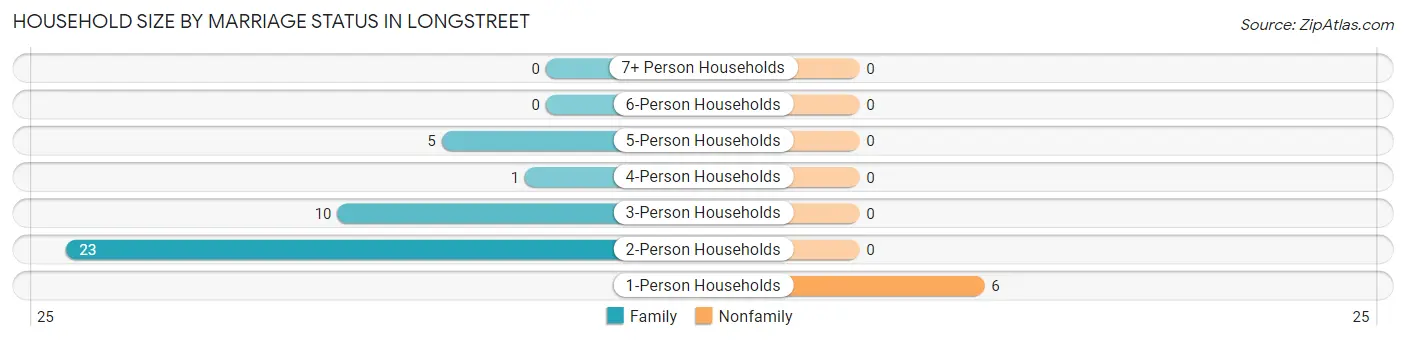
Out of a total of 45 households in Longstreet, 39 (86.7%) are family households, while 6 (13.3%) are nonfamily households. The most numerous type of family households are 2-person households, comprising 23, and the most common type of nonfamily households are 1-person households, comprising 6.
| Household Size | Family Households | Nonfamily Households |
| 1-Person Households | - | 6 (13.3%) |
| 2-Person Households | 23 (51.1%) | 0 (0.0%) |
| 3-Person Households | 10 (22.2%) | 0 (0.0%) |
| 4-Person Households | 1 (2.2%) | 0 (0.0%) |
| 5-Person Households | 5 (11.1%) | 0 (0.0%) |
| 6-Person Households | 0 (0.0%) | 0 (0.0%) |
| 7+ Person Households | 0 (0.0%) | 0 (0.0%) |
| Total | 39 (86.7%) | 6 (13.3%) |
Female Fertility in Longstreet
Fertility by Age in Longstreet
| Age Bracket | Women with Births | Births / 1,000 Women |
| 15 to 19 years | 0 (0.0%) | 0.0 |
| 20 to 34 years | 0 (0.0%) | 0.0 |
| 35 to 50 years | 0 (0.0%) | 0.0 |
| Total | 0 (0.0%) | 0.0 |
Fertility by Age by Marriage Status in Longstreet
| Age Bracket | Married | Unmarried |
| 15 to 19 years | 0 (0.0%) | 0 (0.0%) |
| 20 to 34 years | 0 (0.0%) | 0 (0.0%) |
| 35 to 50 years | 0 (0.0%) | 0 (0.0%) |
| Total | 0 (0.0%) | 0 (0.0%) |
Fertility by Education in Longstreet
| Educational Attainment | Women with Births | Births / 1,000 Women |
| Less than High School | 0 (0.0%) | 0.0 |
| High School Diploma | 0 (0.0%) | 0.0 |
| College or Associate's Degree | 0 (0.0%) | 0.0 |
| Bachelor's Degree | 0 (0.0%) | 0.0 |
| Graduate Degree | 0 (0.0%) | 0.0 |
| Total | 0 (0.0%) | 0.0 |
Fertility by Education by Marriage Status in Longstreet
| Educational Attainment | Married | Unmarried |
| Less than High School | 0 (0.0%) | 0 (0.0%) |
| High School Diploma | 0 (0.0%) | 0 (0.0%) |
| College or Associate's Degree | 0 (0.0%) | 0 (0.0%) |
| Bachelor's Degree | 0 (0.0%) | 0 (0.0%) |
| Graduate Degree | 0 (0.0%) | 0 (0.0%) |
| Total | 0 (0.0%) | 0 (0.0%) |
Employment Characteristics in Longstreet
Employment by Class of Employer in Longstreet
Among the 27 employed individuals in Longstreet, private company employees (23 | 85.2%), and state government employees (4 | 14.8%) make up the most common classes of employment.
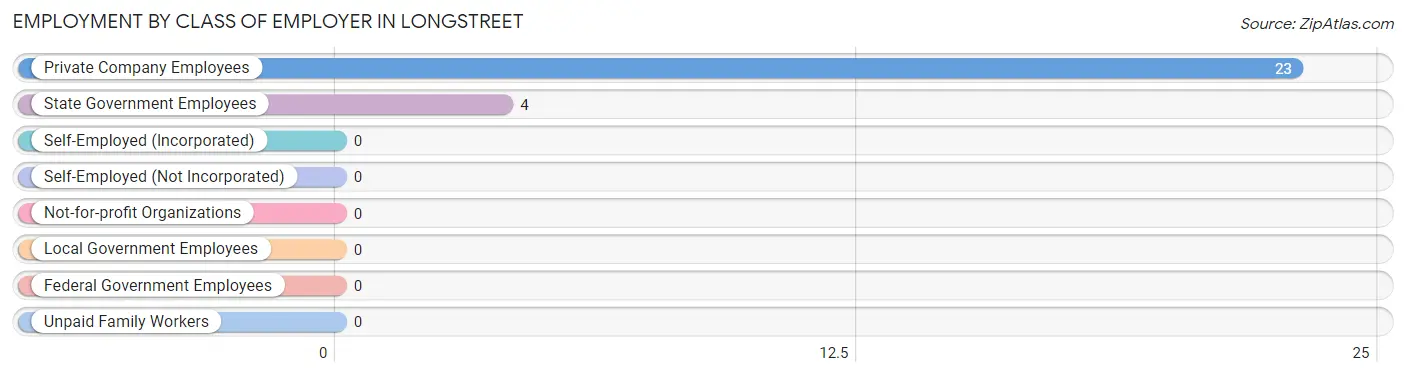
| Employer Class | # Employees | % Employees |
| Private Company Employees | 23 | 85.2% |
| Self-Employed (Incorporated) | 0 | 0.0% |
| Self-Employed (Not Incorporated) | 0 | 0.0% |
| Not-for-profit Organizations | 0 | 0.0% |
| Local Government Employees | 0 | 0.0% |
| State Government Employees | 4 | 14.8% |
| Federal Government Employees | 0 | 0.0% |
| Unpaid Family Workers | 0 | 0.0% |
| Total | 27 | 100.0% |
Employment Status by Age in Longstreet
According to the labor force statistics for Longstreet, out of the total population over 16 years of age (99), 31.3% or 31 individuals are in the labor force, with 12.9% or 4 of them unemployed. The age group with the highest labor force participation rate is 20 to 24 years, with 100.0% or 1 individuals in the labor force. Within the labor force, the 20 to 24 years age range has the highest percentage of unemployed individuals, with 100.0% or 1 of them being unemployed.
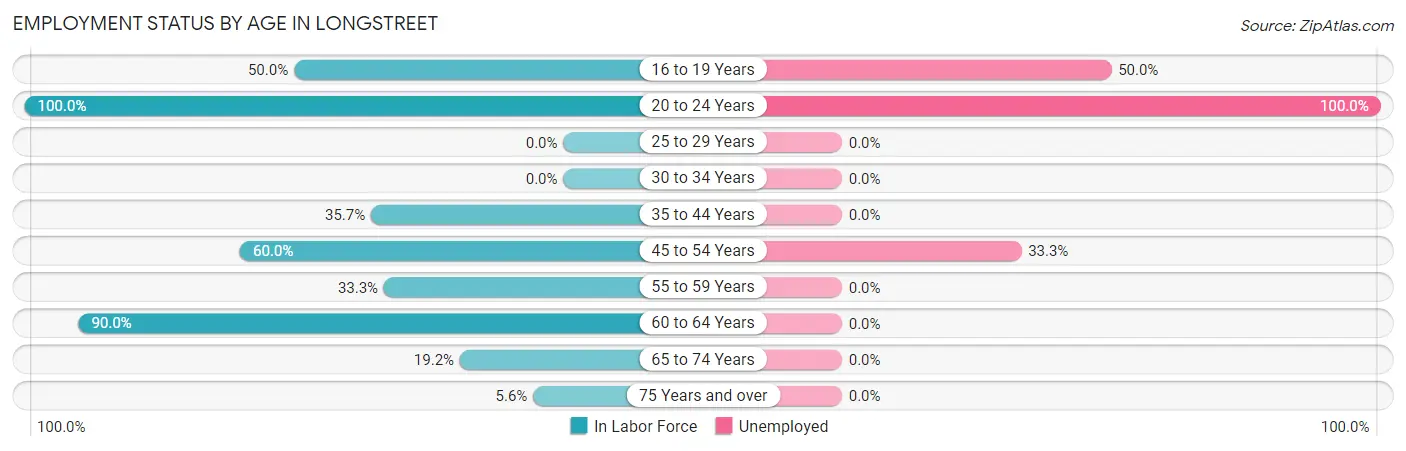
| Age Bracket | In Labor Force | Unemployed |
| 16 to 19 Years | 4 (50.0%) | 2 (50.0%) |
| 20 to 24 Years | 1 (100.0%) | 1 (100.0%) |
| 25 to 29 Years | 0 (0.0%) | 0 (0.0%) |
| 30 to 34 Years | 0 (0.0%) | 0 (0.0%) |
| 35 to 44 Years | 5 (35.7%) | 0 (0.0%) |
| 45 to 54 Years | 3 (60.0%) | 1 (33.3%) |
| 55 to 59 Years | 3 (33.3%) | 0 (0.0%) |
| 60 to 64 Years | 9 (90.0%) | 0 (0.0%) |
| 65 to 74 Years | 5 (19.2%) | 0 (0.0%) |
| 75 Years and over | 1 (5.6%) | 0 (0.0%) |
| Total | 31 (31.3%) | 4 (12.9%) |
Employment Status by Educational Attainment in Longstreet
According to labor force statistics for Longstreet, 43.5% of individuals (20) out of the total population between 25 and 64 years of age (46) are in the labor force, with 5.0% or 1 of them being unemployed. The group with the highest labor force participation rate are those with the educational attainment of bachelor's degree or higher, with 100.0% or 2 individuals in the labor force. Within the labor force, individuals with high school diploma education have the highest percentage of unemployment, with 11.1% or 1 of them being unemployed.
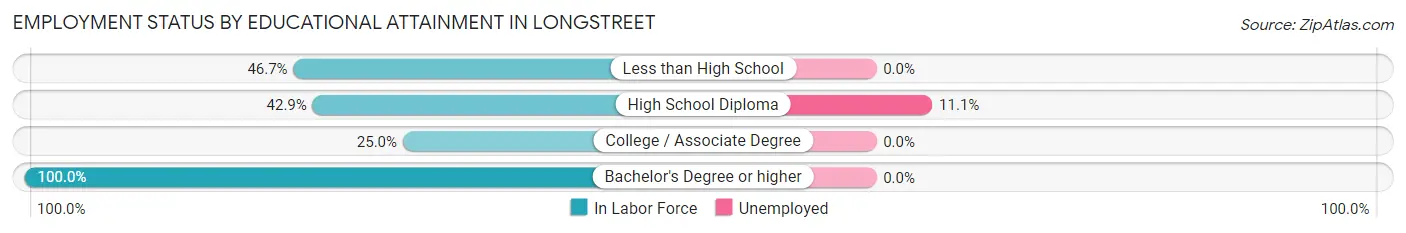
| Educational Attainment | In Labor Force | Unemployed |
| Less than High School | 7 (46.7%) | 0 (0.0%) |
| High School Diploma | 9 (42.9%) | 2 (11.1%) |
| College / Associate Degree | 2 (25.0%) | 0 (0.0%) |
| Bachelor's Degree or higher | 2 (100.0%) | 0 (0.0%) |
| Total | 20 (43.5%) | 2 (5.0%) |
Employment Occupations by Sex in Longstreet
Management, Business, Science and Arts Occupations
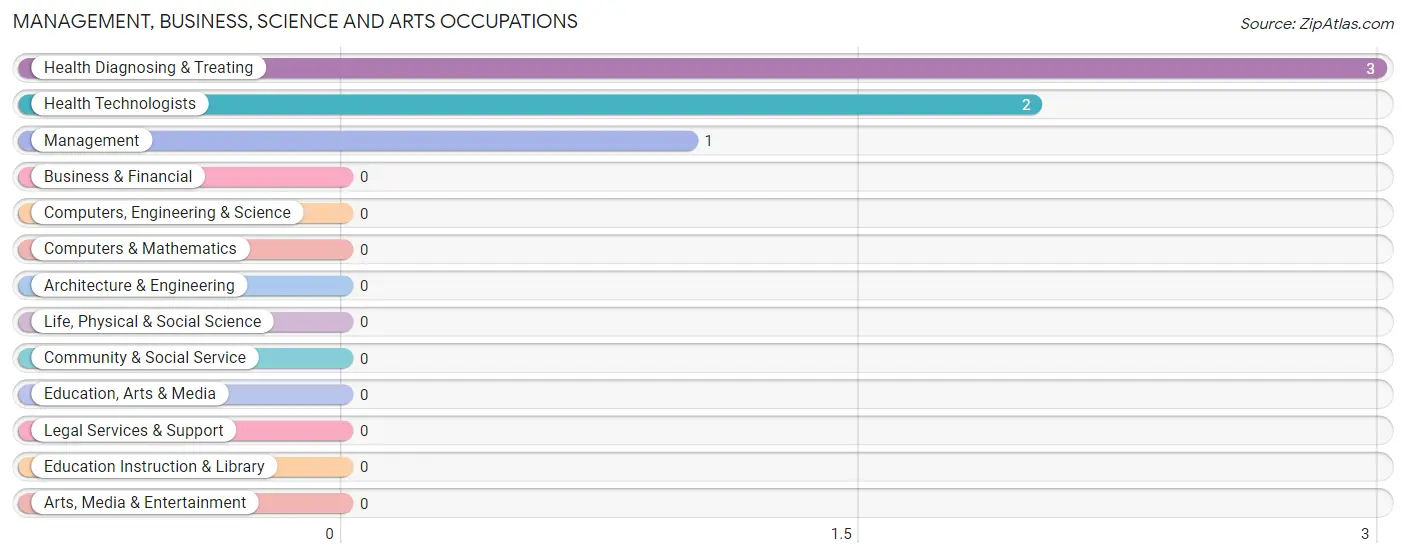
The most common Management, Business, Science and Arts occupations in Longstreet are Health Diagnosing & Treating (3 | 11.1%), Health Technologists (2 | 7.4%), and Management (1 | 3.7%).
Management, Business, Science and Arts Occupations by Sex
Within the Management, Business, Science and Arts occupations in Longstreet, the most male-oriented occupations are Health Technologists (50.0%), and Health Diagnosing & Treating (33.3%), while the most female-oriented occupations are Management (100.0%), Health Diagnosing & Treating (66.7%), and Health Technologists (50.0%).
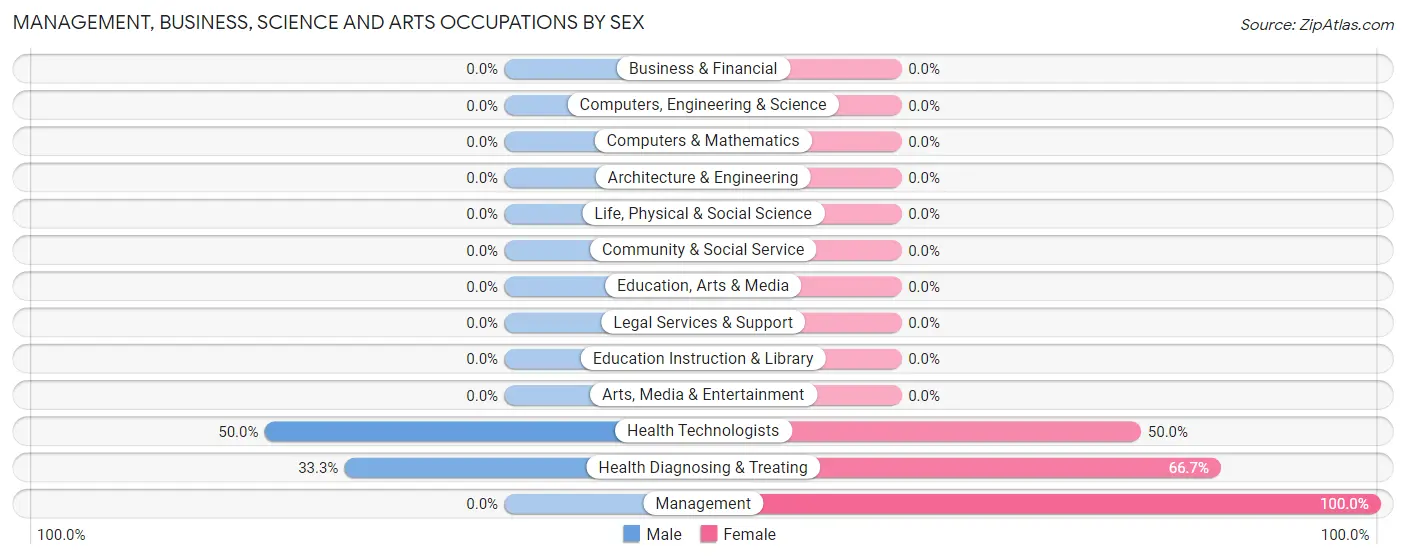
| Occupation | Male | Female |
| Management | 0 (0.0%) | 1 (100.0%) |
| Business & Financial | 0 (0.0%) | 0 (0.0%) |
| Computers, Engineering & Science | 0 (0.0%) | 0 (0.0%) |
| Computers & Mathematics | 0 (0.0%) | 0 (0.0%) |
| Architecture & Engineering | 0 (0.0%) | 0 (0.0%) |
| Life, Physical & Social Science | 0 (0.0%) | 0 (0.0%) |
| Community & Social Service | 0 (0.0%) | 0 (0.0%) |
| Education, Arts & Media | 0 (0.0%) | 0 (0.0%) |
| Legal Services & Support | 0 (0.0%) | 0 (0.0%) |
| Education Instruction & Library | 0 (0.0%) | 0 (0.0%) |
| Arts, Media & Entertainment | 0 (0.0%) | 0 (0.0%) |
| Health Diagnosing & Treating | 1 (33.3%) | 2 (66.7%) |
| Health Technologists | 1 (50.0%) | 1 (50.0%) |
| Total (Category) | 1 (25.0%) | 3 (75.0%) |
| Total (Overall) | 19 (70.4%) | 8 (29.6%) |
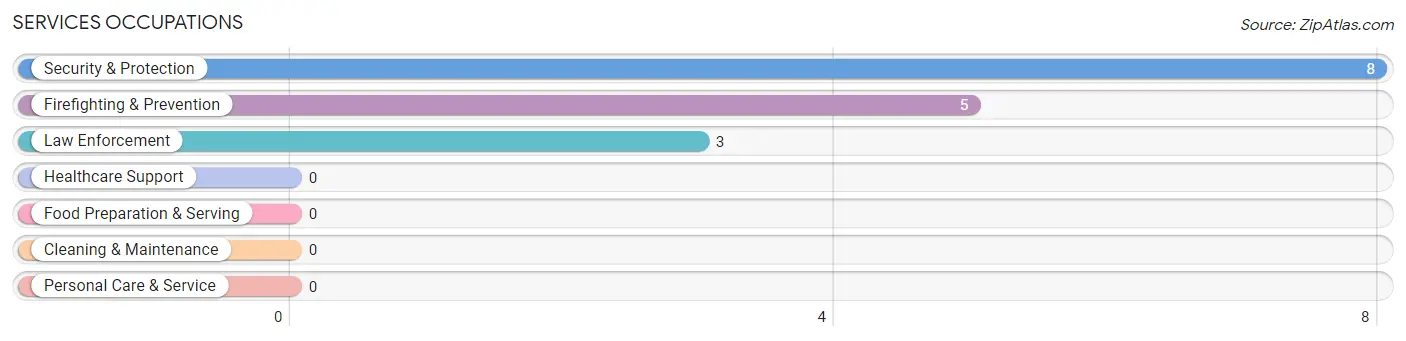
Services Occupations
The most common Services occupations in Longstreet are Security & Protection (8 | 29.6%), Firefighting & Prevention (5 | 18.5%), and Law Enforcement (3 | 11.1%).
Services Occupations by Sex
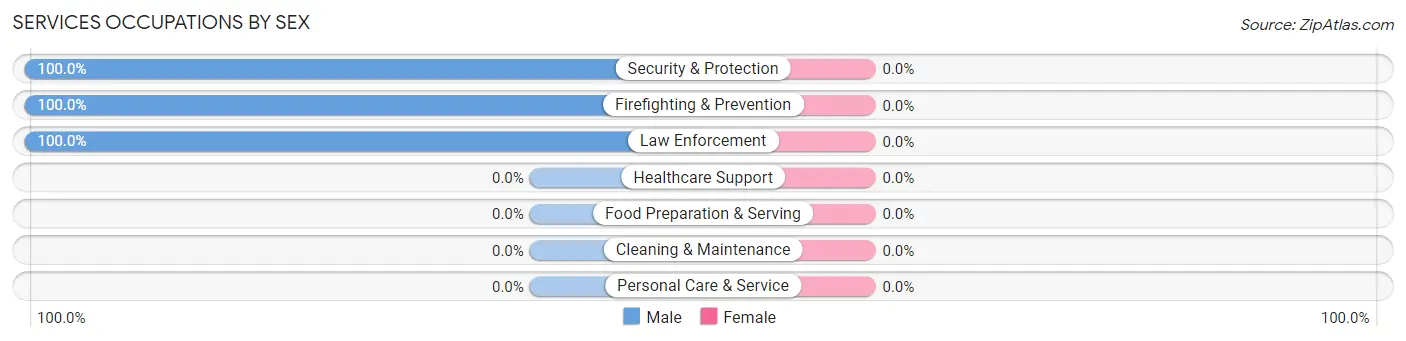
| Occupation | Male | Female |
| Healthcare Support | 0 (0.0%) | 0 (0.0%) |
| Security & Protection | 8 (100.0%) | 0 (0.0%) |
| Firefighting & Prevention | 5 (100.0%) | 0 (0.0%) |
| Law Enforcement | 3 (100.0%) | 0 (0.0%) |
| Food Preparation & Serving | 0 (0.0%) | 0 (0.0%) |
| Cleaning & Maintenance | 0 (0.0%) | 0 (0.0%) |
| Personal Care & Service | 0 (0.0%) | 0 (0.0%) |
| Total (Category) | 8 (100.0%) | 0 (0.0%) |
| Total (Overall) | 19 (70.4%) | 8 (29.6%) |
Sales and Office Occupations
The most common Sales and Office occupations in Longstreet are Office & Administration (3 | 11.1%), and Sales & Related (2 | 7.4%).
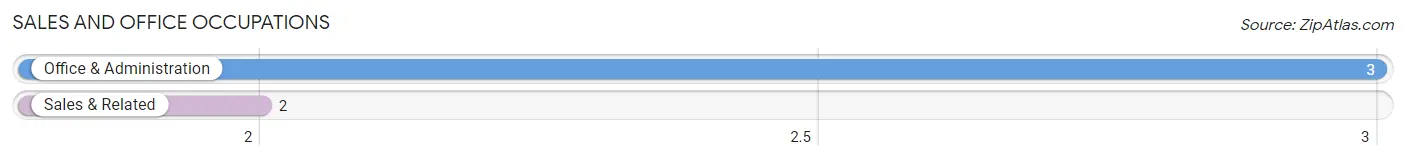
Sales and Office Occupations by Sex
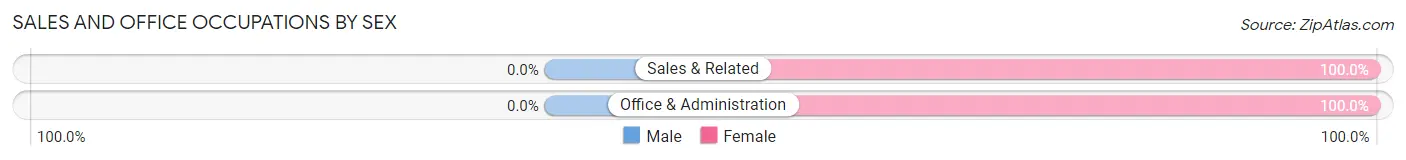
| Occupation | Male | Female |
| Sales & Related | 0 (0.0%) | 2 (100.0%) |
| Office & Administration | 0 (0.0%) | 3 (100.0%) |
| Total (Category) | 0 (0.0%) | 5 (100.0%) |
| Total (Overall) | 19 (70.4%) | 8 (29.6%) |
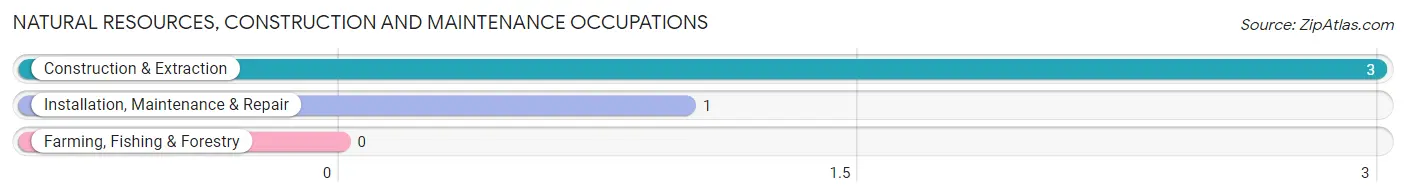
Natural Resources, Construction and Maintenance Occupations
The most common Natural Resources, Construction and Maintenance occupations in Longstreet are Construction & Extraction (3 | 11.1%), and Installation, Maintenance & Repair (1 | 3.7%).
Natural Resources, Construction and Maintenance Occupations by Sex
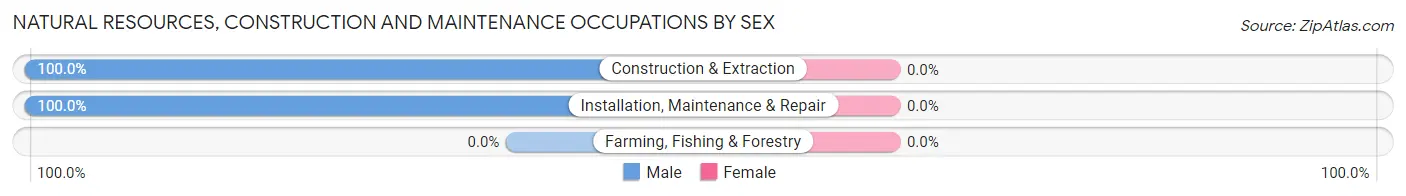
| Occupation | Male | Female |
| Farming, Fishing & Forestry | 0 (0.0%) | 0 (0.0%) |
| Construction & Extraction | 3 (100.0%) | 0 (0.0%) |
| Installation, Maintenance & Repair | 1 (100.0%) | 0 (0.0%) |
| Total (Category) | 4 (100.0%) | 0 (0.0%) |
| Total (Overall) | 19 (70.4%) | 8 (29.6%) |
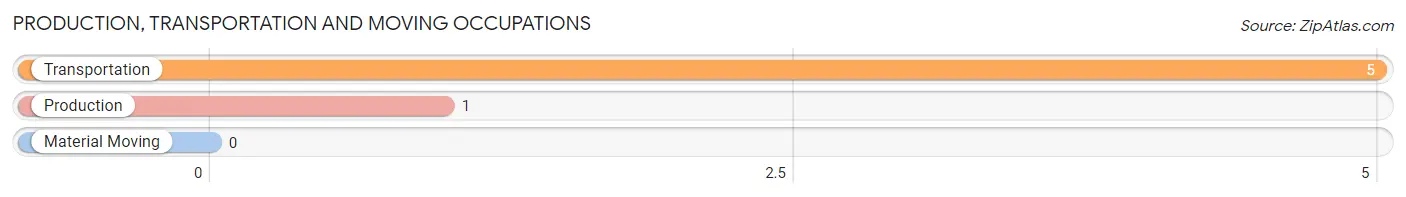
Production, Transportation and Moving Occupations
The most common Production, Transportation and Moving occupations in Longstreet are Transportation (5 | 18.5%), and Production (1 | 3.7%).
Production, Transportation and Moving Occupations by Sex
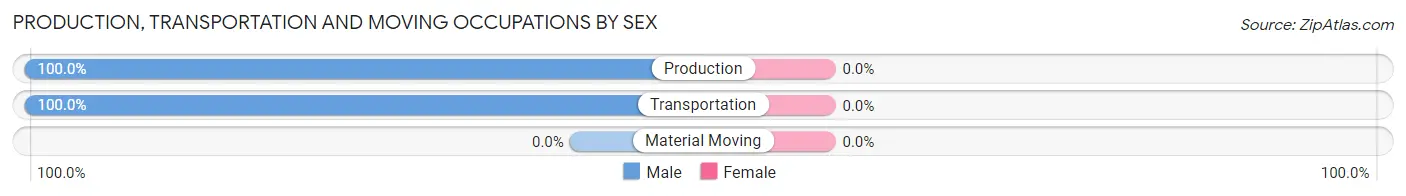
| Occupation | Male | Female |
| Production | 1 (100.0%) | 0 (0.0%) |
| Transportation | 5 (100.0%) | 0 (0.0%) |
| Material Moving | 0 (0.0%) | 0 (0.0%) |
| Total (Category) | 6 (100.0%) | 0 (0.0%) |
| Total (Overall) | 19 (70.4%) | 8 (29.6%) |
Employment Industries by Sex in Longstreet
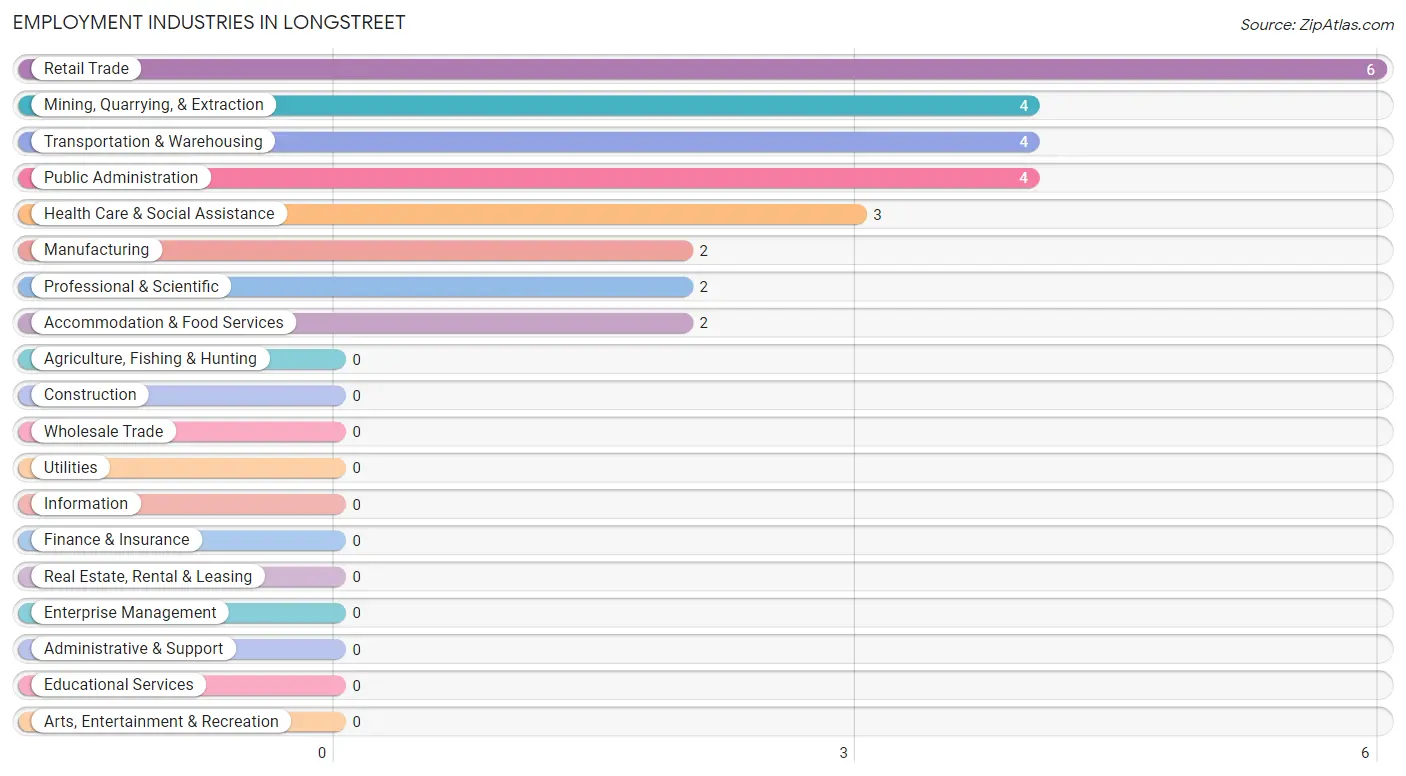
Employment Industries in Longstreet
The major employment industries in Longstreet include Retail Trade (6 | 22.2%), Mining, Quarrying, & Extraction (4 | 14.8%), Transportation & Warehousing (4 | 14.8%), Public Administration (4 | 14.8%), and Health Care & Social Assistance (3 | 11.1%).
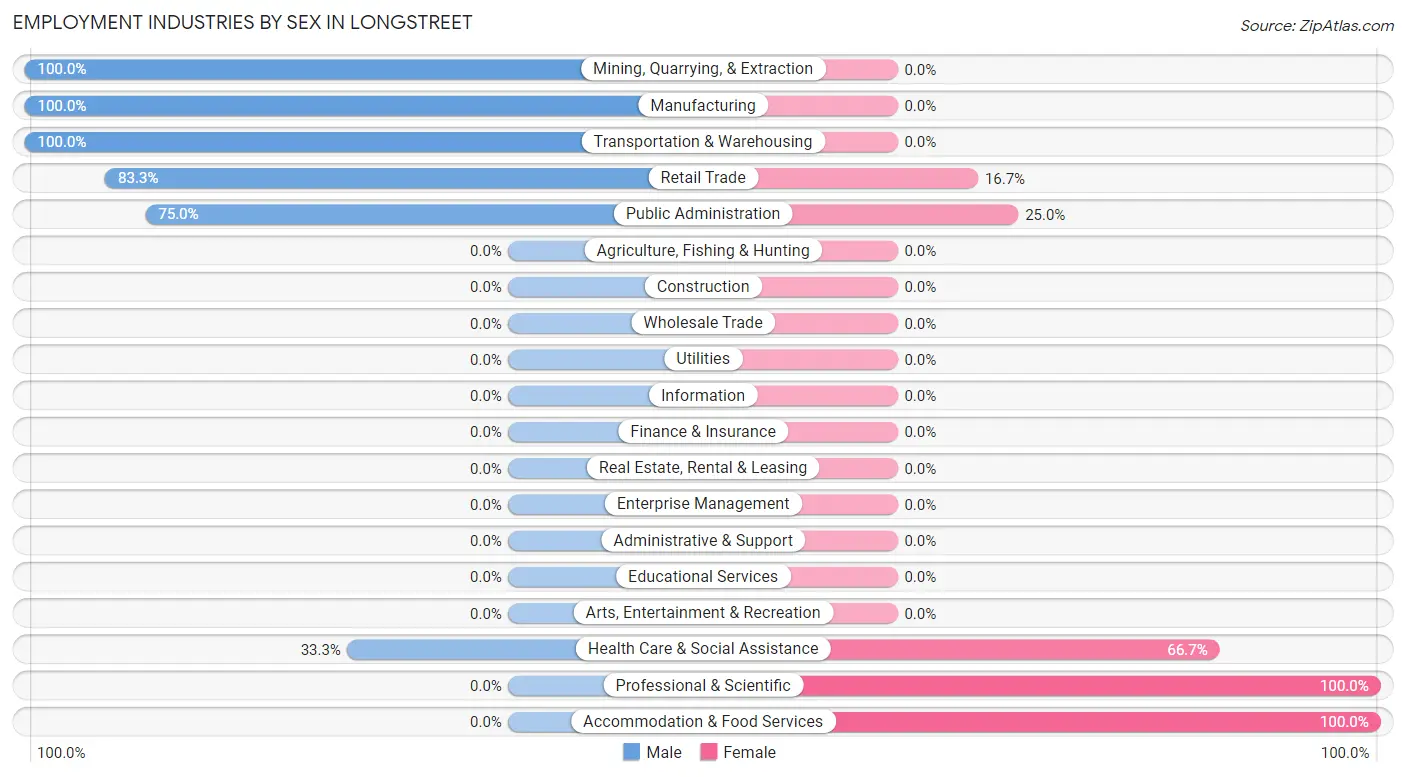
Employment Industries by Sex in Longstreet
The Longstreet industries that see more men than women are Mining, Quarrying, & Extraction (100.0%), Manufacturing (100.0%), and Transportation & Warehousing (100.0%), whereas the industries that tend to have a higher number of women are Professional & Scientific (100.0%), Accommodation & Food Services (100.0%), and Health Care & Social Assistance (66.7%).
| Industry | Male | Female |
| Agriculture, Fishing & Hunting | 0 (0.0%) | 0 (0.0%) |
| Mining, Quarrying, & Extraction | 4 (100.0%) | 0 (0.0%) |
| Construction | 0 (0.0%) | 0 (0.0%) |
| Manufacturing | 2 (100.0%) | 0 (0.0%) |
| Wholesale Trade | 0 (0.0%) | 0 (0.0%) |
| Retail Trade | 5 (83.3%) | 1 (16.7%) |
| Transportation & Warehousing | 4 (100.0%) | 0 (0.0%) |
| Utilities | 0 (0.0%) | 0 (0.0%) |
| Information | 0 (0.0%) | 0 (0.0%) |
| Finance & Insurance | 0 (0.0%) | 0 (0.0%) |
| Real Estate, Rental & Leasing | 0 (0.0%) | 0 (0.0%) |
| Professional & Scientific | 0 (0.0%) | 2 (100.0%) |
| Enterprise Management | 0 (0.0%) | 0 (0.0%) |
| Administrative & Support | 0 (0.0%) | 0 (0.0%) |
| Educational Services | 0 (0.0%) | 0 (0.0%) |
| Health Care & Social Assistance | 1 (33.3%) | 2 (66.7%) |
| Arts, Entertainment & Recreation | 0 (0.0%) | 0 (0.0%) |
| Accommodation & Food Services | 0 (0.0%) | 2 (100.0%) |
| Public Administration | 3 (75.0%) | 1 (25.0%) |
| Total | 19 (70.4%) | 8 (29.6%) |
Education in Longstreet
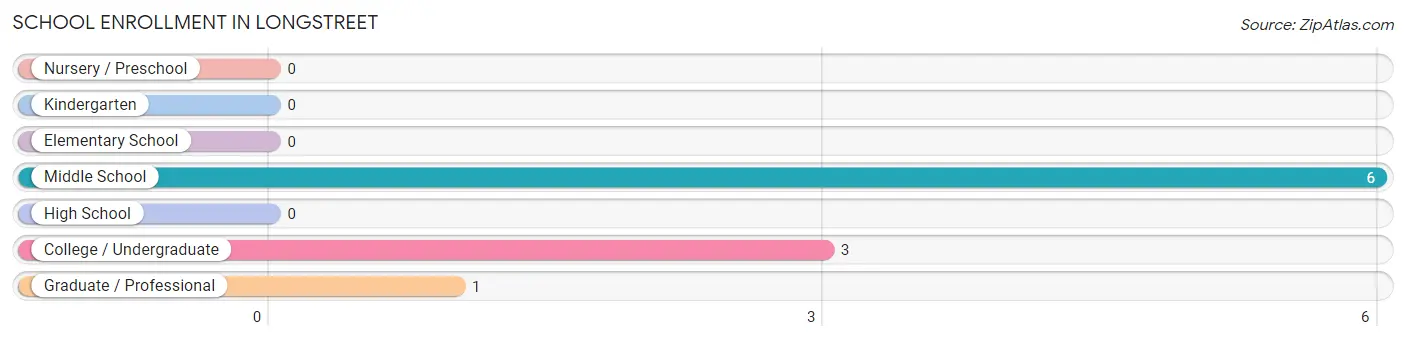
School Enrollment in Longstreet
The most common levels of schooling among the 10 students in Longstreet are middle school (6 | 60.0%), college / undergraduate (3 | 30.0%), and graduate / professional (1 | 10.0%).
| School Level | # Students | % Students |
| Nursery / Preschool | 0 | 0.0% |
| Kindergarten | 0 | 0.0% |
| Elementary School | 0 | 0.0% |
| Middle School | 6 | 60.0% |
| High School | 0 | 0.0% |
| College / Undergraduate | 3 | 30.0% |
| Graduate / Professional | 1 | 10.0% |
| Total | 10 | 100.0% |
School Enrollment by Age by Funding Source in Longstreet
Out of a total of 10 students who are enrolled in schools in Longstreet, 7 (70.0%) attend a private institution, while the remaining 3 (30.0%) are enrolled in public schools. The age group of 10 to 14 year olds has the highest likelihood of being enrolled in private schools, with 6 (100.0% in the age bracket) enrolled. Conversely, the age group of 18 to 19 year olds has the lowest likelihood of being enrolled in a private school, with 2 (100.0% in the age bracket) attending a public institution.
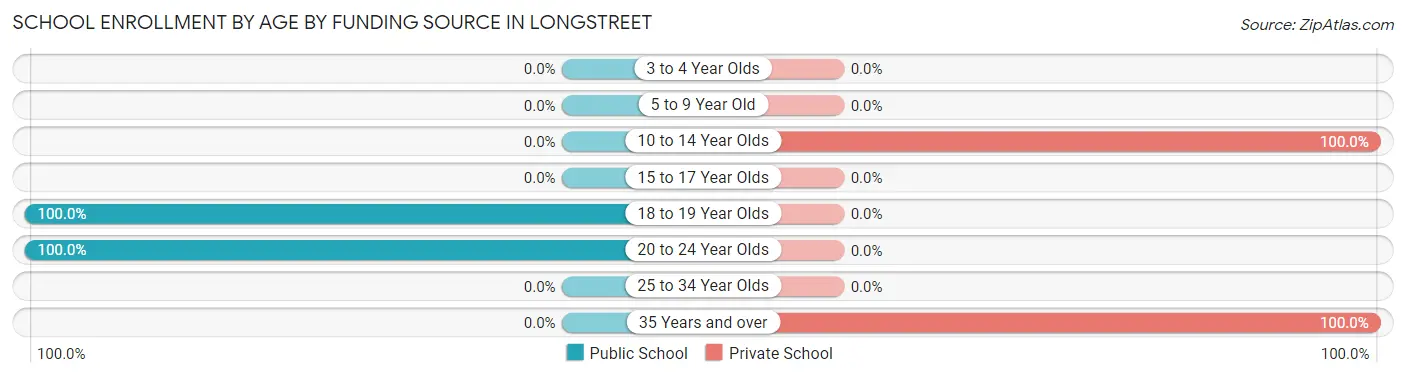
| Age Bracket | Public School | Private School |
| 3 to 4 Year Olds | 0 (0.0%) | 0 (0.0%) |
| 5 to 9 Year Old | 0 (0.0%) | 0 (0.0%) |
| 10 to 14 Year Olds | 0 (0.0%) | 6 (100.0%) |
| 15 to 17 Year Olds | 0 (0.0%) | 0 (0.0%) |
| 18 to 19 Year Olds | 2 (100.0%) | 0 (0.0%) |
| 20 to 24 Year Olds | 1 (100.0%) | 0 (0.0%) |
| 25 to 34 Year Olds | 0 (0.0%) | 0 (0.0%) |
| 35 Years and over | 0 (0.0%) | 1 (100.0%) |
| Total | 3 (30.0%) | 7 (70.0%) |
Educational Attainment by Field of Study in Longstreet
Science & technology (2 | 33.3%), bio, nature & agricultural (1 | 16.7%), business (1 | 16.7%), education (1 | 16.7%), and arts & humanities (1 | 16.7%) are the most common fields of study among 6 individuals in Longstreet who have obtained a bachelor's degree or higher.
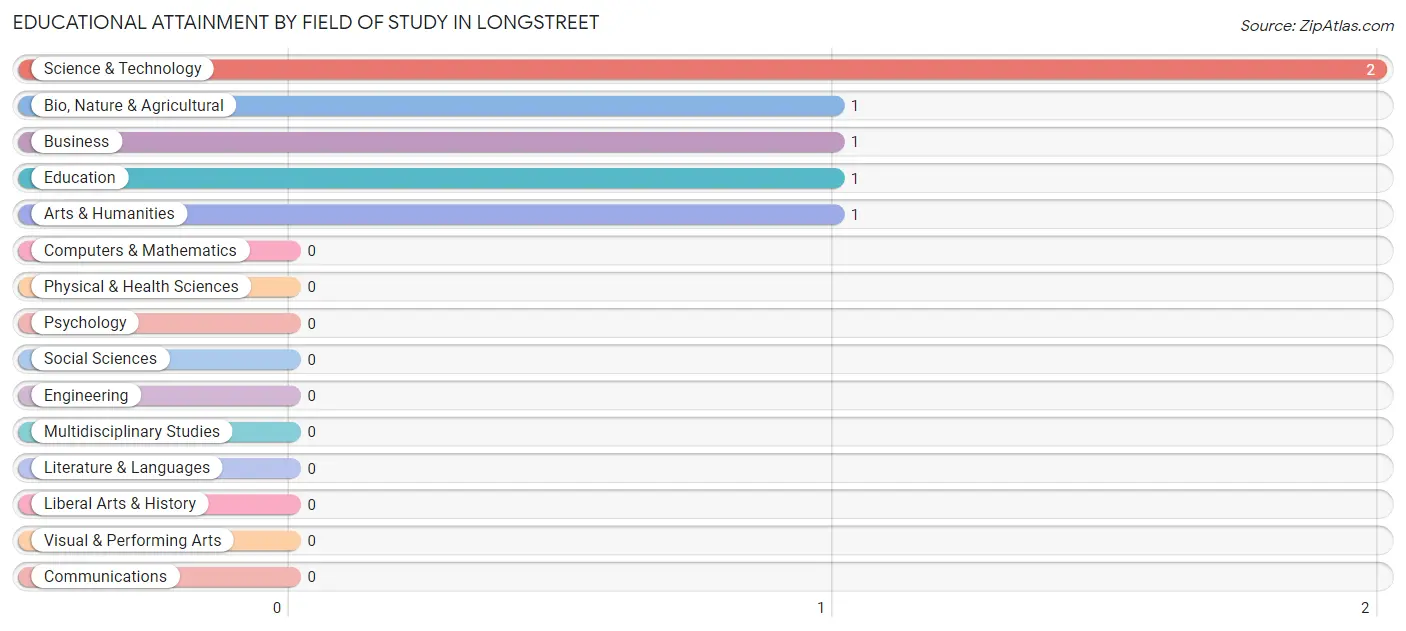
| Field of Study | # Graduates | % Graduates |
| Computers & Mathematics | 0 | 0.0% |
| Bio, Nature & Agricultural | 1 | 16.7% |
| Physical & Health Sciences | 0 | 0.0% |
| Psychology | 0 | 0.0% |
| Social Sciences | 0 | 0.0% |
| Engineering | 0 | 0.0% |
| Multidisciplinary Studies | 0 | 0.0% |
| Science & Technology | 2 | 33.3% |
| Business | 1 | 16.7% |
| Education | 1 | 16.7% |
| Literature & Languages | 0 | 0.0% |
| Liberal Arts & History | 0 | 0.0% |
| Visual & Performing Arts | 0 | 0.0% |
| Communications | 0 | 0.0% |
| Arts & Humanities | 1 | 16.7% |
| Total | 6 | 100.0% |
Transportation & Commute in Longstreet
Vehicle Availability by Sex in Longstreet
The most prevalent vehicle ownership categories in Longstreet are males with 2 vehicles (8, accounting for 42.1%) and females with 2 vehicles (7, making up 100.0%).
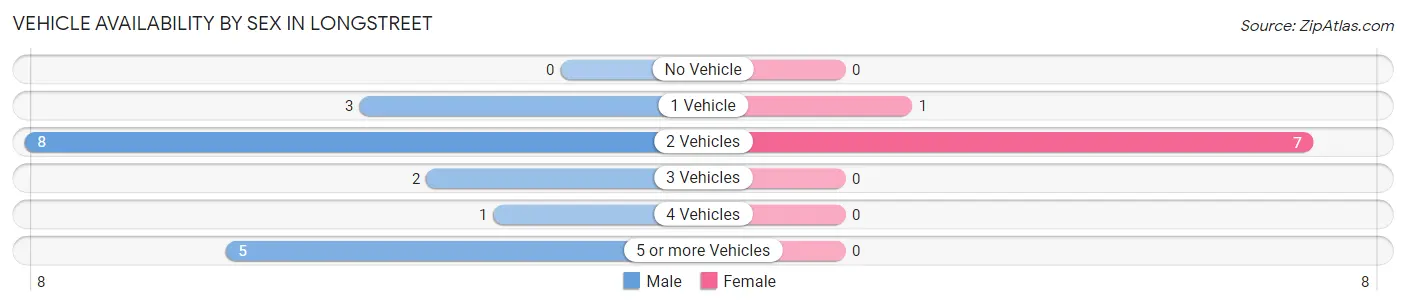
| Vehicles Available | Male | Female |
| No Vehicle | 0 (0.0%) | 0 (0.0%) |
| 1 Vehicle | 3 (15.8%) | 1 (12.5%) |
| 2 Vehicles | 8 (42.1%) | 7 (87.5%) |
| 3 Vehicles | 2 (10.5%) | 0 (0.0%) |
| 4 Vehicles | 1 (5.3%) | 0 (0.0%) |
| 5 or more Vehicles | 5 (26.3%) | 0 (0.0%) |
| Total | 19 (100.0%) | 8 (100.0%) |
Commute Time in Longstreet
The most frequently occuring commute durations in Longstreet are 40 to 44 minutes (6 commuters, 22.2%), 35 to 39 minutes (5 commuters, 18.5%), and 60 to 89 minutes (5 commuters, 18.5%).
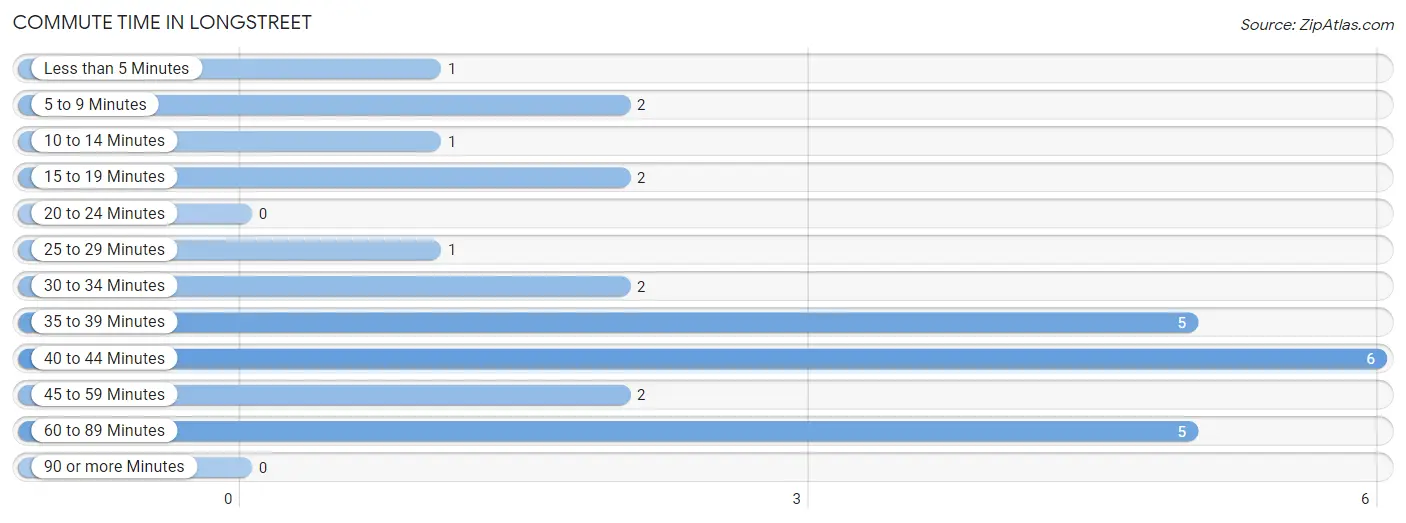
| Commute Time | # Commuters | % Commuters |
| Less than 5 Minutes | 1 | 3.7% |
| 5 to 9 Minutes | 2 | 7.4% |
| 10 to 14 Minutes | 1 | 3.7% |
| 15 to 19 Minutes | 2 | 7.4% |
| 20 to 24 Minutes | 0 | 0.0% |
| 25 to 29 Minutes | 1 | 3.7% |
| 30 to 34 Minutes | 2 | 7.4% |
| 35 to 39 Minutes | 5 | 18.5% |
| 40 to 44 Minutes | 6 | 22.2% |
| 45 to 59 Minutes | 2 | 7.4% |
| 60 to 89 Minutes | 5 | 18.5% |
| 90 or more Minutes | 0 | 0.0% |
Commute Time by Sex in Longstreet
The most common commute times in Longstreet are 35 to 39 minutes (5 commuters, 26.3%) for males and 15 to 19 minutes (2 commuters, 25.0%) for females.
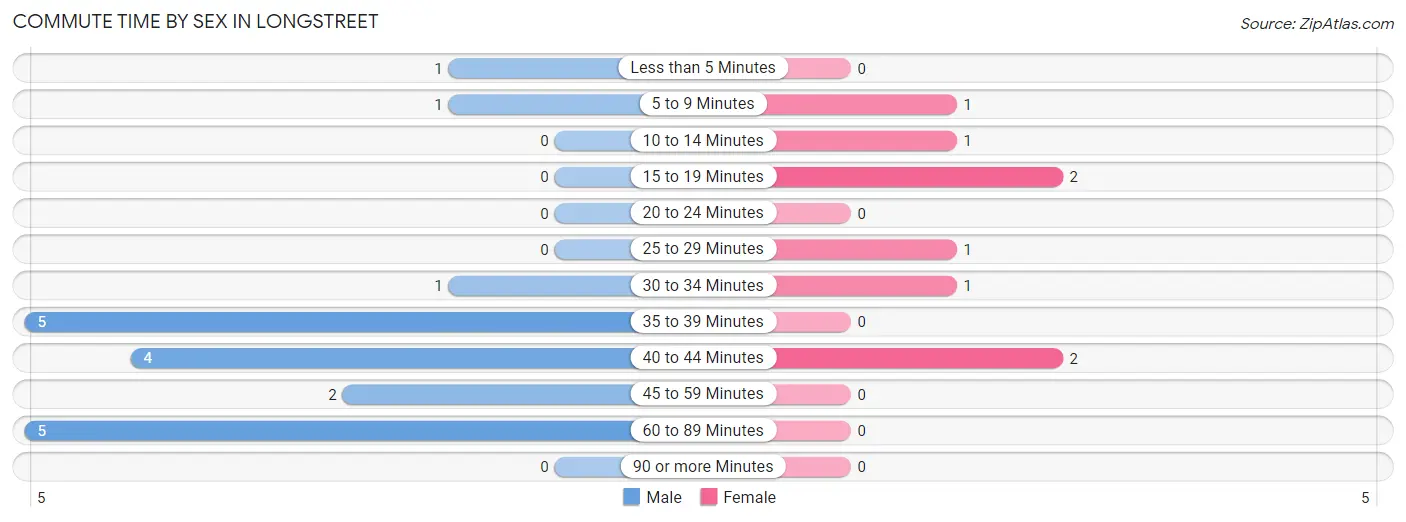
| Commute Time | Male | Female |
| Less than 5 Minutes | 1 (5.3%) | 0 (0.0%) |
| 5 to 9 Minutes | 1 (5.3%) | 1 (12.5%) |
| 10 to 14 Minutes | 0 (0.0%) | 1 (12.5%) |
| 15 to 19 Minutes | 0 (0.0%) | 2 (25.0%) |
| 20 to 24 Minutes | 0 (0.0%) | 0 (0.0%) |
| 25 to 29 Minutes | 0 (0.0%) | 1 (12.5%) |
| 30 to 34 Minutes | 1 (5.3%) | 1 (12.5%) |
| 35 to 39 Minutes | 5 (26.3%) | 0 (0.0%) |
| 40 to 44 Minutes | 4 (21.0%) | 2 (25.0%) |
| 45 to 59 Minutes | 2 (10.5%) | 0 (0.0%) |
| 60 to 89 Minutes | 5 (26.3%) | 0 (0.0%) |
| 90 or more Minutes | 0 (0.0%) | 0 (0.0%) |
Time of Departure to Work by Sex in Longstreet
The most frequent times of departure to work in Longstreet are 7:00 AM to 7:29 AM (5, 26.3%) for males and 7:00 AM to 7:29 AM (2, 25.0%) for females.
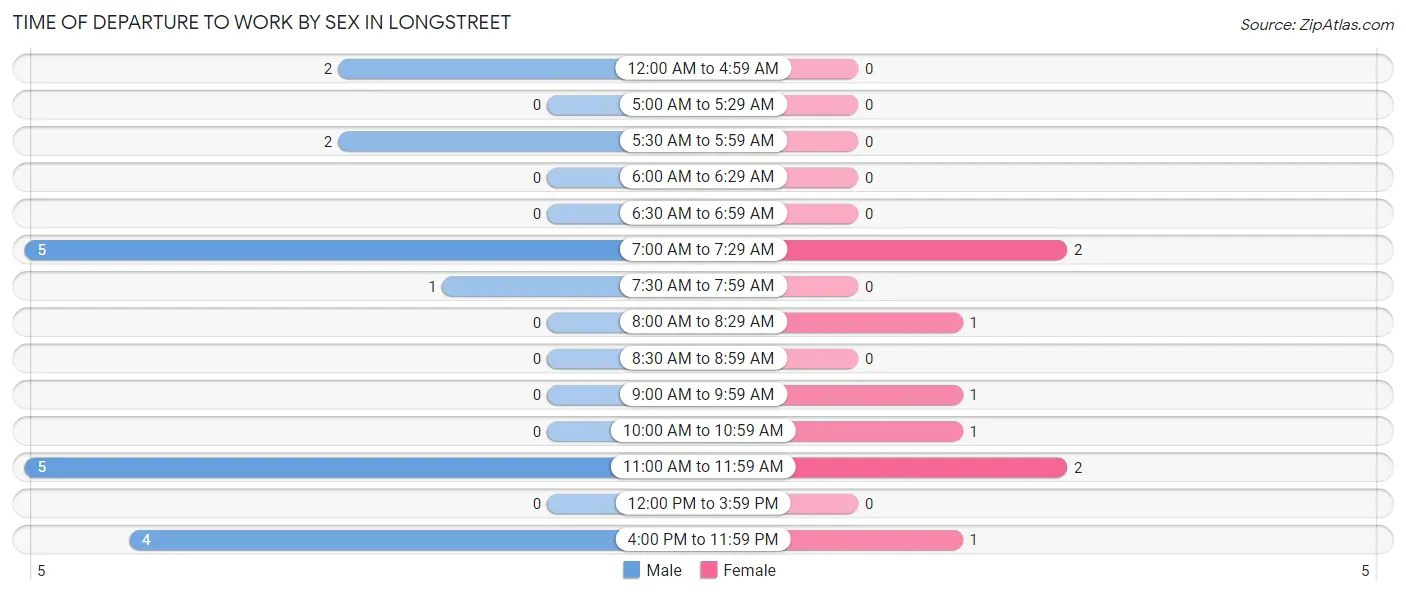
| Time of Departure | Male | Female |
| 12:00 AM to 4:59 AM | 2 (10.5%) | 0 (0.0%) |
| 5:00 AM to 5:29 AM | 0 (0.0%) | 0 (0.0%) |
| 5:30 AM to 5:59 AM | 2 (10.5%) | 0 (0.0%) |
| 6:00 AM to 6:29 AM | 0 (0.0%) | 0 (0.0%) |
| 6:30 AM to 6:59 AM | 0 (0.0%) | 0 (0.0%) |
| 7:00 AM to 7:29 AM | 5 (26.3%) | 2 (25.0%) |
| 7:30 AM to 7:59 AM | 1 (5.3%) | 0 (0.0%) |
| 8:00 AM to 8:29 AM | 0 (0.0%) | 1 (12.5%) |
| 8:30 AM to 8:59 AM | 0 (0.0%) | 0 (0.0%) |
| 9:00 AM to 9:59 AM | 0 (0.0%) | 1 (12.5%) |
| 10:00 AM to 10:59 AM | 0 (0.0%) | 1 (12.5%) |
| 11:00 AM to 11:59 AM | 5 (26.3%) | 2 (25.0%) |
| 12:00 PM to 3:59 PM | 0 (0.0%) | 0 (0.0%) |
| 4:00 PM to 11:59 PM | 4 (21.0%) | 1 (12.5%) |
| Total | 19 (100.0%) | 8 (100.0%) |
Housing Occupancy in Longstreet
Occupancy by Ownership in Longstreet
Of the total 45 dwellings in Longstreet, owner-occupied units account for 44 (97.8%), while renter-occupied units make up 1 (2.2%).
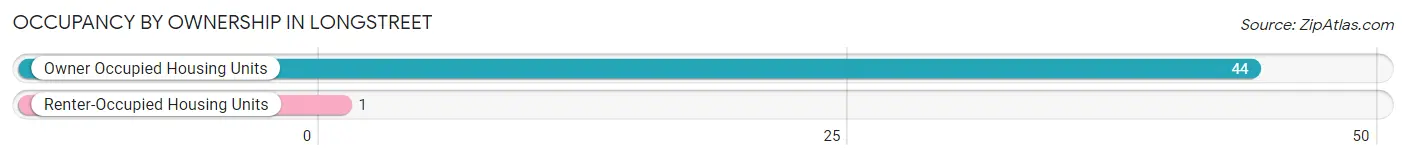
| Occupancy | # Housing Units | % Housing Units |
| Owner Occupied Housing Units | 44 | 97.8% |
| Renter-Occupied Housing Units | 1 | 2.2% |
| Total Occupied Housing Units | 45 | 100.0% |
Occupancy by Household Size in Longstreet
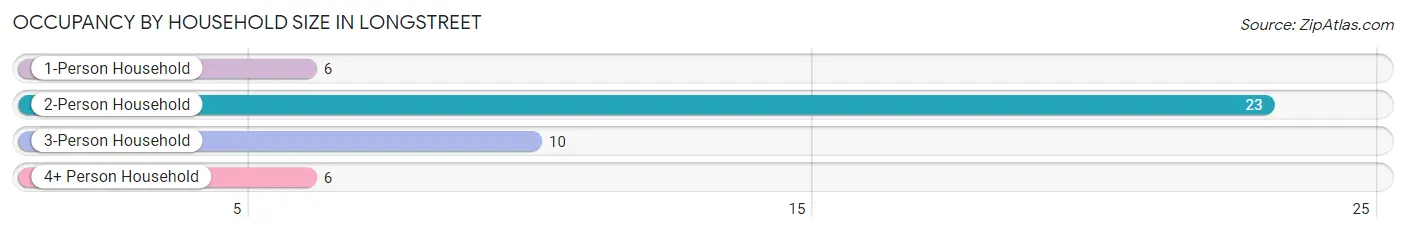
| Household Size | # Housing Units | % Housing Units |
| 1-Person Household | 6 | 13.3% |
| 2-Person Household | 23 | 51.1% |
| 3-Person Household | 10 | 22.2% |
| 4+ Person Household | 6 | 13.3% |
| Total Housing Units | 45 | 100.0% |
Occupancy by Ownership by Household Size in Longstreet
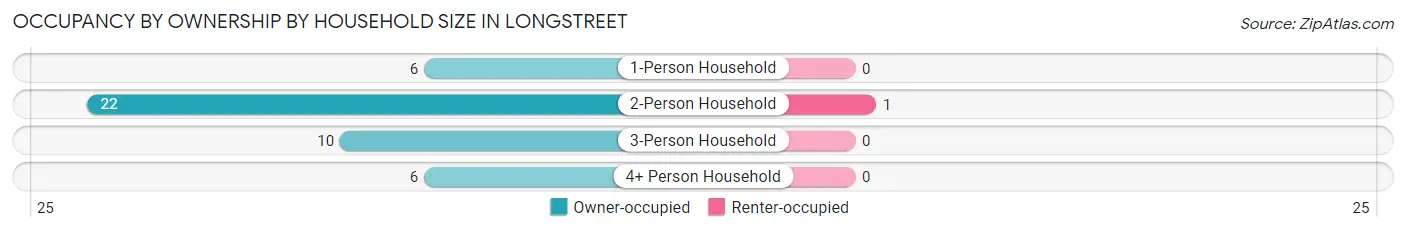
| Household Size | Owner-occupied | Renter-occupied |
| 1-Person Household | 6 (100.0%) | 0 (0.0%) |
| 2-Person Household | 22 (95.7%) | 1 (4.3%) |
| 3-Person Household | 10 (100.0%) | 0 (0.0%) |
| 4+ Person Household | 6 (100.0%) | 0 (0.0%) |
| Total Housing Units | 44 (97.8%) | 1 (2.2%) |
Occupancy by Educational Attainment in Longstreet
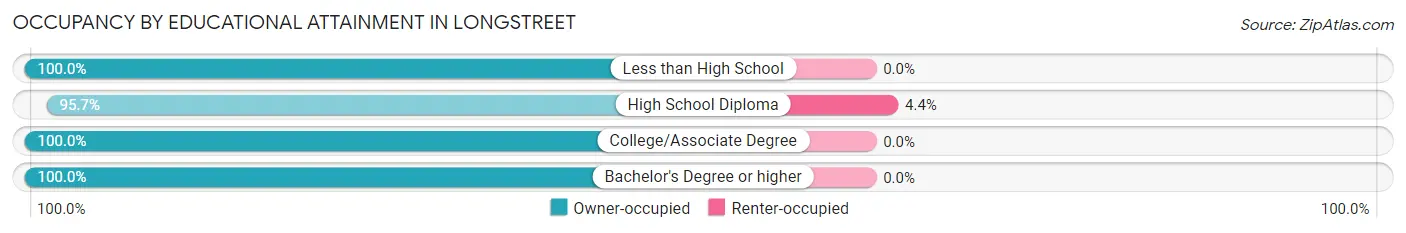
| Household Size | Owner-occupied | Renter-occupied |
| Less than High School | 9 (100.0%) | 0 (0.0%) |
| High School Diploma | 22 (95.7%) | 1 (4.3%) |
| College/Associate Degree | 8 (100.0%) | 0 (0.0%) |
| Bachelor's Degree or higher | 5 (100.0%) | 0 (0.0%) |
Occupancy by Age of Householder in Longstreet
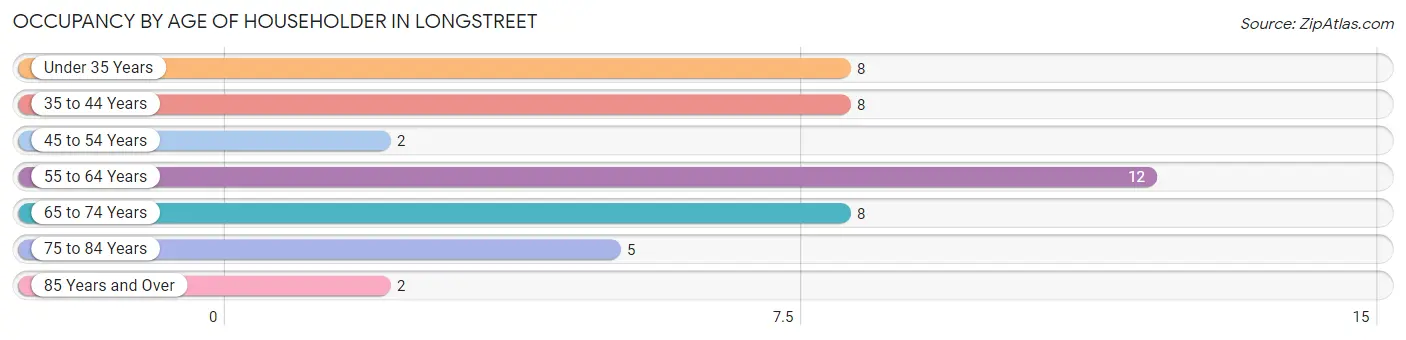
| Age Bracket | # Households | % Households |
| Under 35 Years | 8 | 17.8% |
| 35 to 44 Years | 8 | 17.8% |
| 45 to 54 Years | 2 | 4.4% |
| 55 to 64 Years | 12 | 26.7% |
| 65 to 74 Years | 8 | 17.8% |
| 75 to 84 Years | 5 | 11.1% |
| 85 Years and Over | 2 | 4.4% |
| Total | 45 | 100.0% |
Housing Finances in Longstreet
Median Income by Occupancy in Longstreet
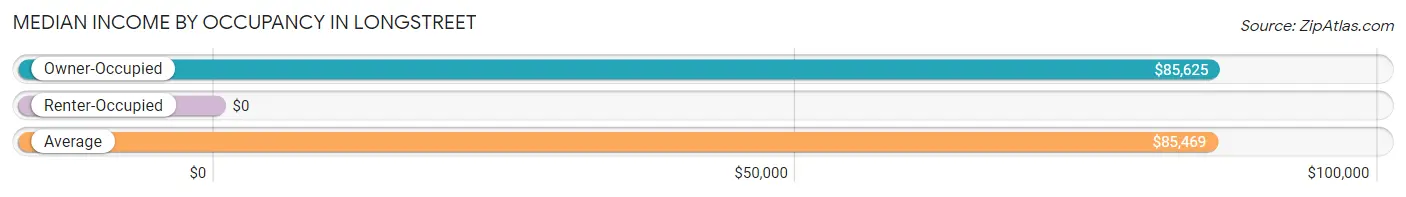
| Occupancy Type | # Households | Median Income |
| Owner-Occupied | 44 (97.8%) | $85,625 |
| Renter-Occupied | 1 (2.2%) | $0 |
| Average | 45 (100.0%) | $85,469 |
Occupancy by Householder Income Bracket in Longstreet
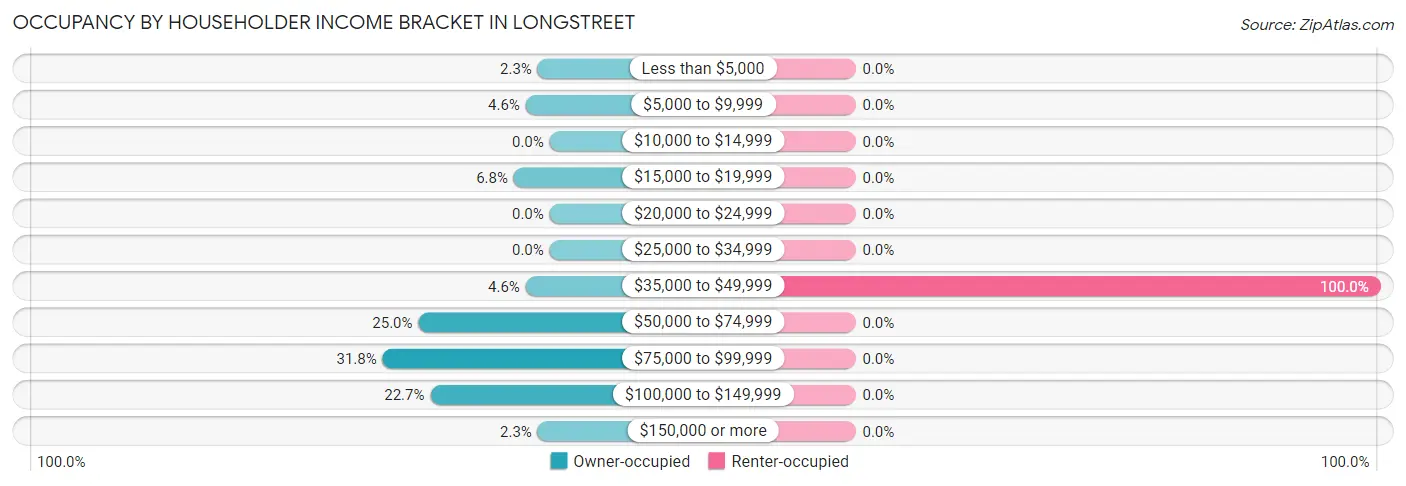
| Income Bracket | Owner-occupied | Renter-occupied |
| Less than $5,000 | 1 (2.3%) | 0 (0.0%) |
| $5,000 to $9,999 | 2 (4.5%) | 0 (0.0%) |
| $10,000 to $14,999 | 0 (0.0%) | 0 (0.0%) |
| $15,000 to $19,999 | 3 (6.8%) | 0 (0.0%) |
| $20,000 to $24,999 | 0 (0.0%) | 0 (0.0%) |
| $25,000 to $34,999 | 0 (0.0%) | 0 (0.0%) |
| $35,000 to $49,999 | 2 (4.5%) | 1 (100.0%) |
| $50,000 to $74,999 | 11 (25.0%) | 0 (0.0%) |
| $75,000 to $99,999 | 14 (31.8%) | 0 (0.0%) |
| $100,000 to $149,999 | 10 (22.7%) | 0 (0.0%) |
| $150,000 or more | 1 (2.3%) | 0 (0.0%) |
| Total | 44 (100.0%) | 1 (100.0%) |
Monthly Housing Cost Tiers in Longstreet
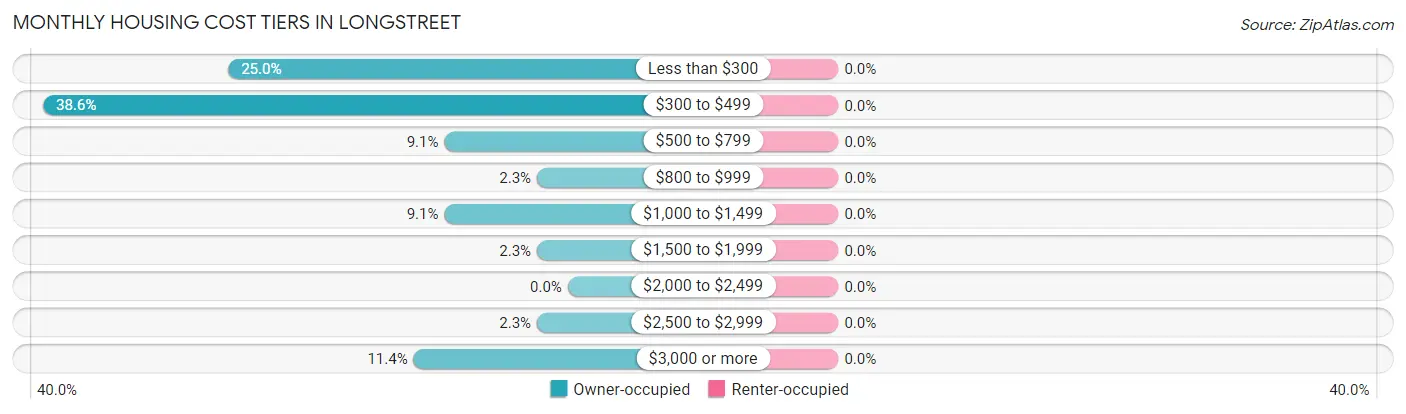
| Monthly Cost | Owner-occupied | Renter-occupied |
| Less than $300 | 11 (25.0%) | 0 (0.0%) |
| $300 to $499 | 17 (38.6%) | 0 (0.0%) |
| $500 to $799 | 4 (9.1%) | 0 (0.0%) |
| $800 to $999 | 1 (2.3%) | 0 (0.0%) |
| $1,000 to $1,499 | 4 (9.1%) | 0 (0.0%) |
| $1,500 to $1,999 | 1 (2.3%) | 0 (0.0%) |
| $2,000 to $2,499 | 0 (0.0%) | 0 (0.0%) |
| $2,500 to $2,999 | 1 (2.3%) | 0 (0.0%) |
| $3,000 or more | 5 (11.4%) | 0 (0.0%) |
| Total | 44 (100.0%) | 1 (100.0%) |
Physical Housing Characteristics in Longstreet
Housing Structures in Longstreet
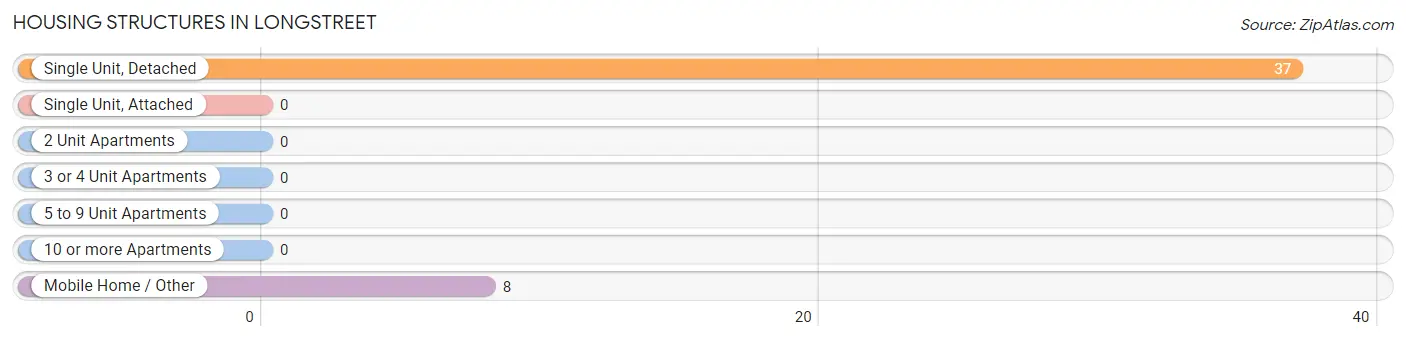
| Structure Type | # Housing Units | % Housing Units |
| Single Unit, Detached | 37 | 82.2% |
| Single Unit, Attached | 0 | 0.0% |
| 2 Unit Apartments | 0 | 0.0% |
| 3 or 4 Unit Apartments | 0 | 0.0% |
| 5 to 9 Unit Apartments | 0 | 0.0% |
| 10 or more Apartments | 0 | 0.0% |
| Mobile Home / Other | 8 | 17.8% |
| Total | 45 | 100.0% |
Housing Structures by Occupancy in Longstreet
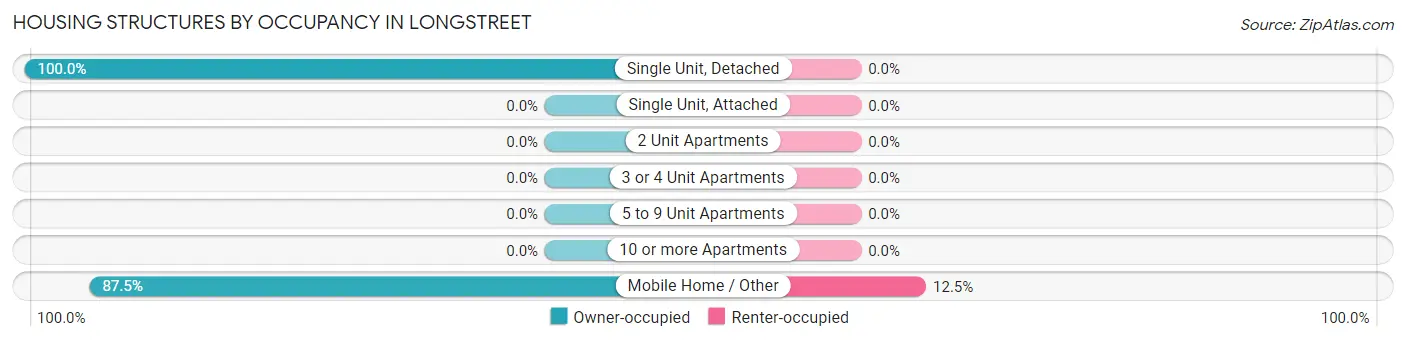
| Structure Type | Owner-occupied | Renter-occupied |
| Single Unit, Detached | 37 (100.0%) | 0 (0.0%) |
| Single Unit, Attached | 0 (0.0%) | 0 (0.0%) |
| 2 Unit Apartments | 0 (0.0%) | 0 (0.0%) |
| 3 or 4 Unit Apartments | 0 (0.0%) | 0 (0.0%) |
| 5 to 9 Unit Apartments | 0 (0.0%) | 0 (0.0%) |
| 10 or more Apartments | 0 (0.0%) | 0 (0.0%) |
| Mobile Home / Other | 7 (87.5%) | 1 (12.5%) |
| Total | 44 (97.8%) | 1 (2.2%) |
Housing Structures by Number of Rooms in Longstreet
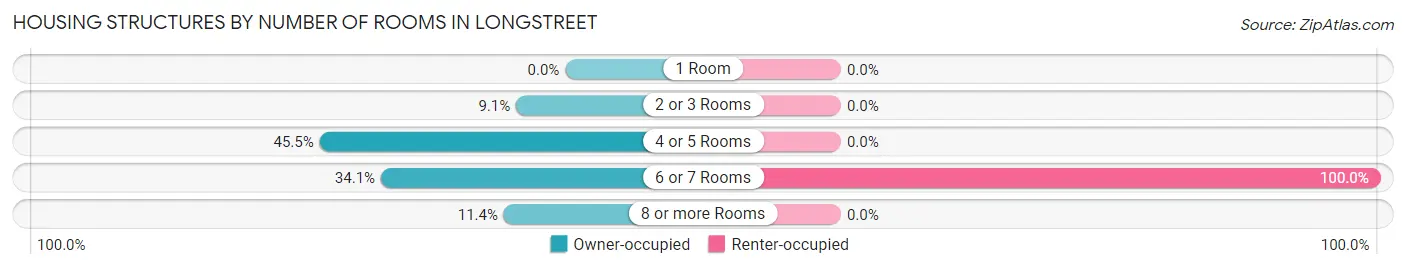
| Number of Rooms | Owner-occupied | Renter-occupied |
| 1 Room | 0 (0.0%) | 0 (0.0%) |
| 2 or 3 Rooms | 4 (9.1%) | 0 (0.0%) |
| 4 or 5 Rooms | 20 (45.5%) | 0 (0.0%) |
| 6 or 7 Rooms | 15 (34.1%) | 1 (100.0%) |
| 8 or more Rooms | 5 (11.4%) | 0 (0.0%) |
| Total | 44 (100.0%) | 1 (100.0%) |
Housing Structure by Heating Type in Longstreet
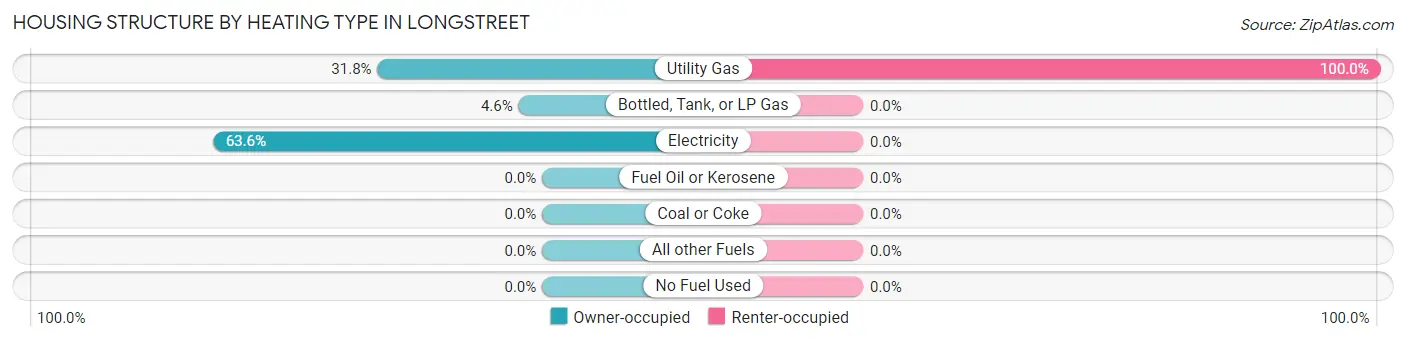
| Heating Type | Owner-occupied | Renter-occupied |
| Utility Gas | 14 (31.8%) | 1 (100.0%) |
| Bottled, Tank, or LP Gas | 2 (4.5%) | 0 (0.0%) |
| Electricity | 28 (63.6%) | 0 (0.0%) |
| Fuel Oil or Kerosene | 0 (0.0%) | 0 (0.0%) |
| Coal or Coke | 0 (0.0%) | 0 (0.0%) |
| All other Fuels | 0 (0.0%) | 0 (0.0%) |
| No Fuel Used | 0 (0.0%) | 0 (0.0%) |
| Total | 44 (100.0%) | 1 (100.0%) |
Household Vehicle Usage in Longstreet
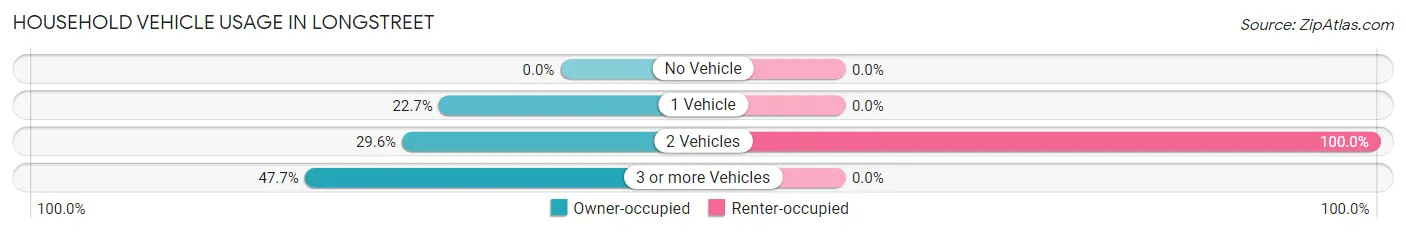
| Vehicles per Household | Owner-occupied | Renter-occupied |
| No Vehicle | 0 (0.0%) | 0 (0.0%) |
| 1 Vehicle | 10 (22.7%) | 0 (0.0%) |
| 2 Vehicles | 13 (29.5%) | 1 (100.0%) |
| 3 or more Vehicles | 21 (47.7%) | 0 (0.0%) |
| Total | 44 (100.0%) | 1 (100.0%) |
Real Estate & Mortgages in Longstreet
Real Estate and Mortgage Overview in Longstreet
| Characteristic | Without Mortgage | With Mortgage |
| Housing Units | 30 | 14 |
| Median Property Value | $250,000 | $157,100 |
| Median Household Income | $82,500 | $0 |
| Monthly Housing Costs | $371 | $5 |
| Real Estate Taxes | $478 | $4 |
Property Value by Mortgage Status in Longstreet
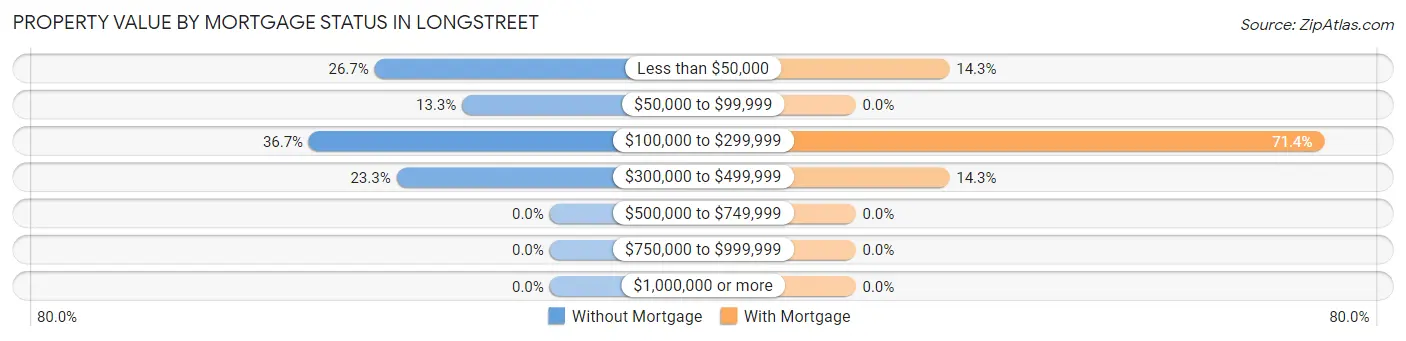
| Property Value | Without Mortgage | With Mortgage |
| Less than $50,000 | 8 (26.7%) | 2 (14.3%) |
| $50,000 to $99,999 | 4 (13.3%) | 0 (0.0%) |
| $100,000 to $299,999 | 11 (36.7%) | 10 (71.4%) |
| $300,000 to $499,999 | 7 (23.3%) | 2 (14.3%) |
| $500,000 to $749,999 | 0 (0.0%) | 0 (0.0%) |
| $750,000 to $999,999 | 0 (0.0%) | 0 (0.0%) |
| $1,000,000 or more | 0 (0.0%) | 0 (0.0%) |
| Total | 30 (100.0%) | 14 (100.0%) |
Household Income by Mortgage Status in Longstreet
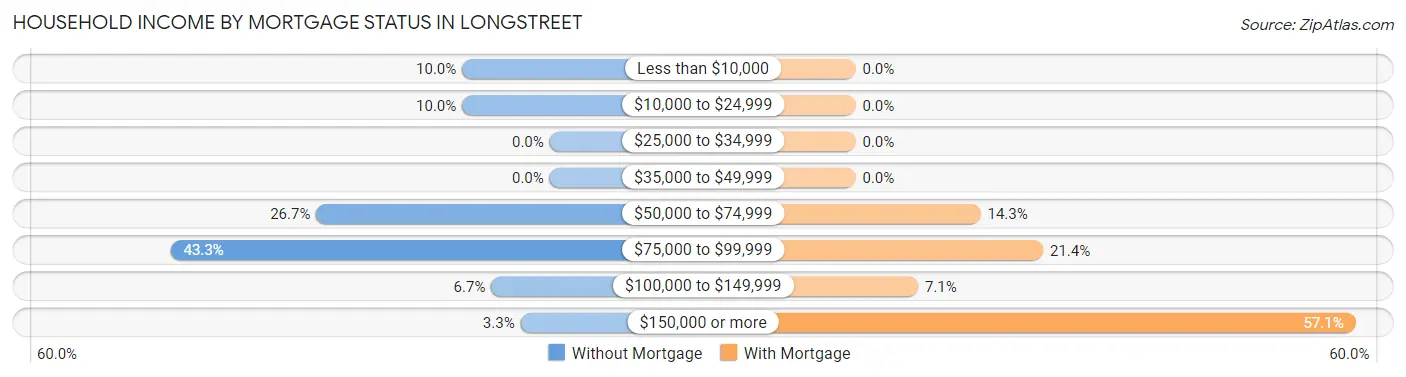
| Household Income | Without Mortgage | With Mortgage |
| Less than $10,000 | 3 (10.0%) | 0 (0.0%) |
| $10,000 to $24,999 | 3 (10.0%) | 0 (0.0%) |
| $25,000 to $34,999 | 0 (0.0%) | 0 (0.0%) |
| $35,000 to $49,999 | 0 (0.0%) | 0 (0.0%) |
| $50,000 to $74,999 | 8 (26.7%) | 2 (14.3%) |
| $75,000 to $99,999 | 13 (43.3%) | 3 (21.4%) |
| $100,000 to $149,999 | 2 (6.7%) | 1 (7.1%) |
| $150,000 or more | 1 (3.3%) | 8 (57.1%) |
| Total | 30 (100.0%) | 14 (100.0%) |
Property Value to Household Income Ratio in Longstreet
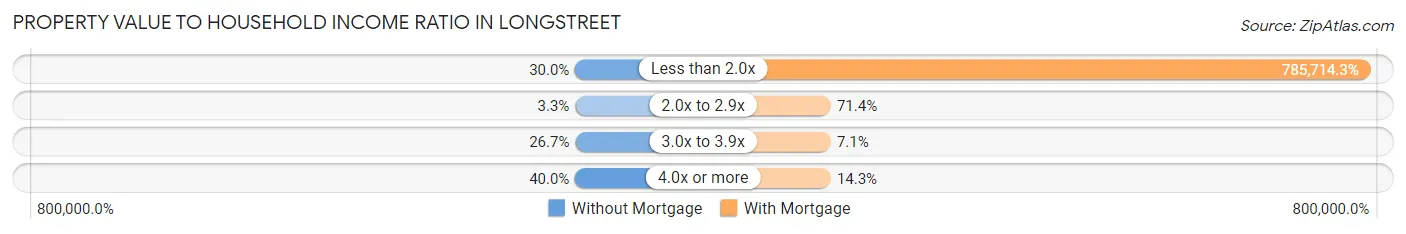
| Value-to-Income Ratio | Without Mortgage | With Mortgage |
| Less than 2.0x | 9 (30.0%) | 110,000 (785,714.3%) |
| 2.0x to 2.9x | 1 (3.3%) | 10 (71.4%) |
| 3.0x to 3.9x | 8 (26.7%) | 1 (7.1%) |
| 4.0x or more | 12 (40.0%) | 2 (14.3%) |
| Total | 30 (100.0%) | 14 (100.0%) |
Real Estate Taxes by Mortgage Status in Longstreet
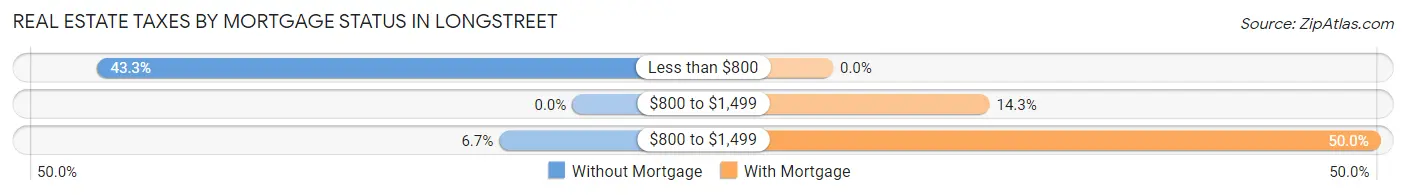
| Property Taxes | Without Mortgage | With Mortgage |
| Less than $800 | 13 (43.3%) | 0 (0.0%) |
| $800 to $1,499 | 0 (0.0%) | 2 (14.3%) |
| $800 to $1,499 | 2 (6.7%) | 7 (50.0%) |
| Total | 30 (100.0%) | 14 (100.0%) |
Health & Disability in Longstreet
Health Insurance Coverage by Age in Longstreet
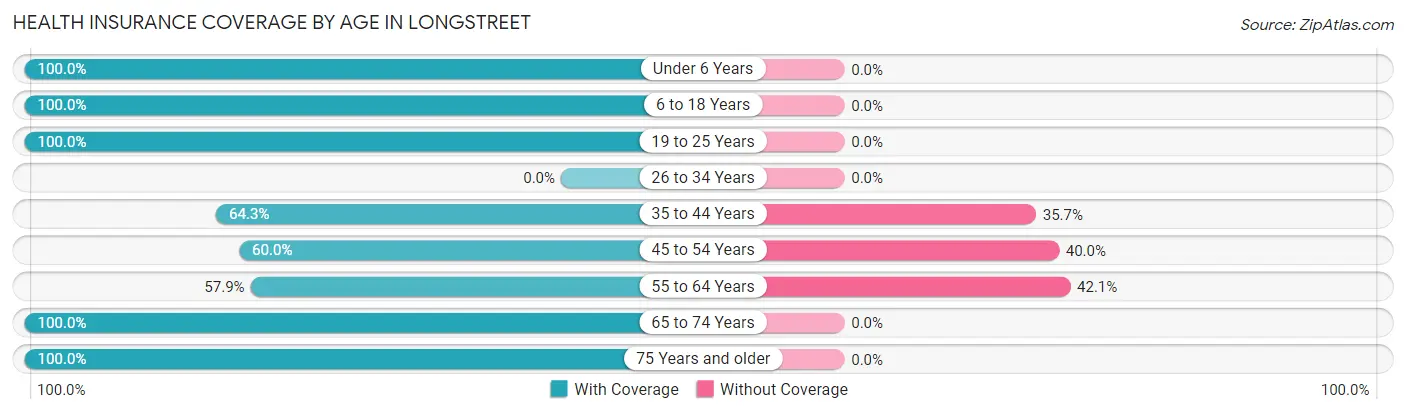
| Age Bracket | With Coverage | Without Coverage |
| Under 6 Years | 6 (100.0%) | 0 (0.0%) |
| 6 to 18 Years | 14 (100.0%) | 0 (0.0%) |
| 19 to 25 Years | 9 (100.0%) | 0 (0.0%) |
| 26 to 34 Years | 0 (0.0%) | 0 (0.0%) |
| 35 to 44 Years | 9 (64.3%) | 5 (35.7%) |
| 45 to 54 Years | 3 (60.0%) | 2 (40.0%) |
| 55 to 64 Years | 11 (57.9%) | 8 (42.1%) |
| 65 to 74 Years | 26 (100.0%) | 0 (0.0%) |
| 75 Years and older | 18 (100.0%) | 0 (0.0%) |
| Total | 96 (86.5%) | 15 (13.5%) |
Health Insurance Coverage by Citizenship Status in Longstreet
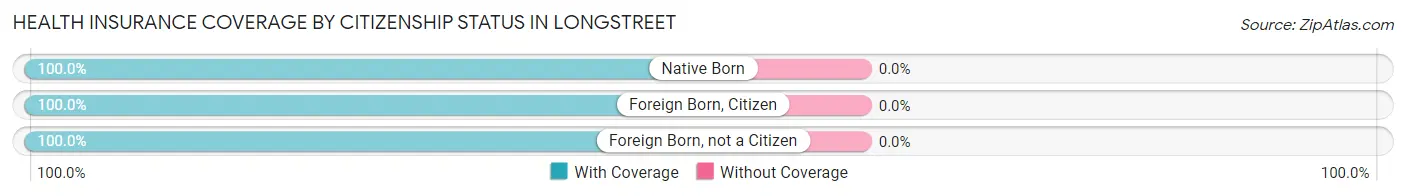
| Citizenship Status | With Coverage | Without Coverage |
| Native Born | 6 (100.0%) | 0 (0.0%) |
| Foreign Born, Citizen | 14 (100.0%) | 0 (0.0%) |
| Foreign Born, not a Citizen | 9 (100.0%) | 0 (0.0%) |
Health Insurance Coverage by Household Income in Longstreet
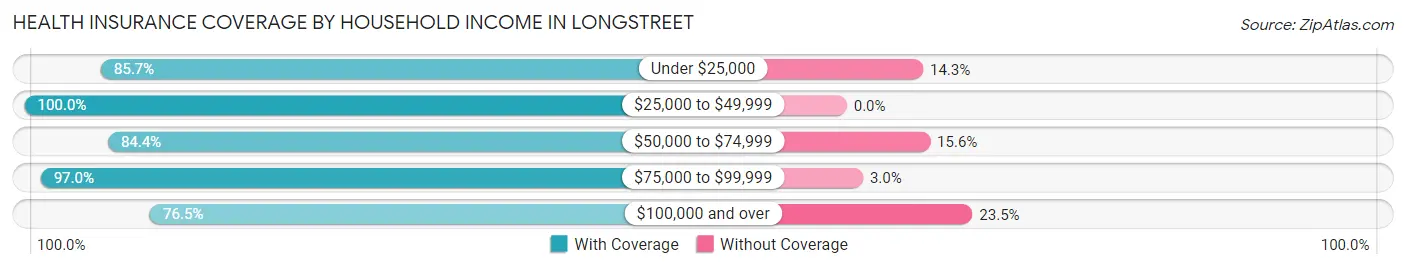
| Household Income | With Coverage | Without Coverage |
| Under $25,000 | 6 (85.7%) | 1 (14.3%) |
| $25,000 to $49,999 | 5 (100.0%) | 0 (0.0%) |
| $50,000 to $74,999 | 27 (84.4%) | 5 (15.6%) |
| $75,000 to $99,999 | 32 (97.0%) | 1 (3.0%) |
| $100,000 and over | 26 (76.5%) | 8 (23.5%) |
Public vs Private Health Insurance Coverage by Age in Longstreet
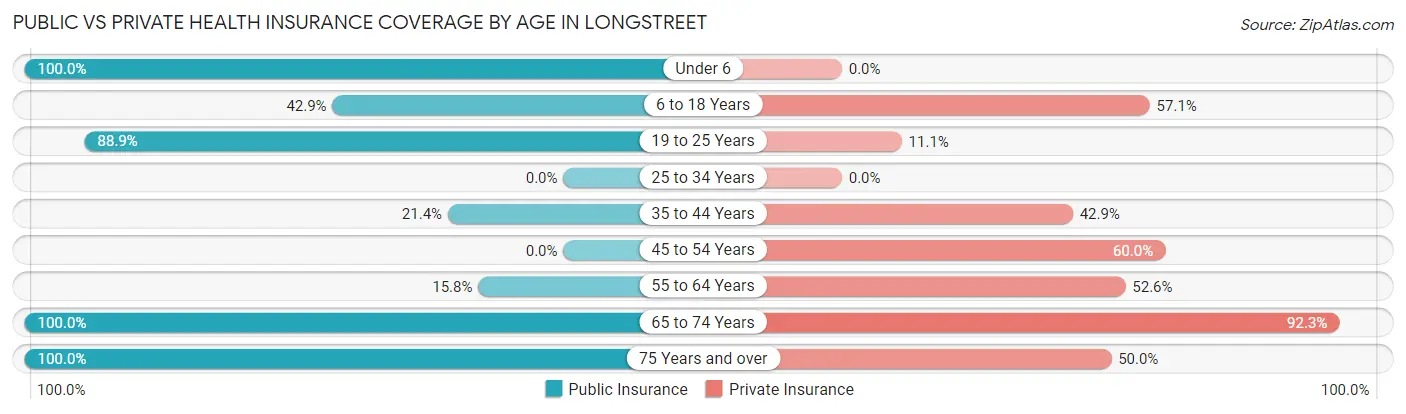
| Age Bracket | Public Insurance | Private Insurance |
| Under 6 | 6 (100.0%) | 0 (0.0%) |
| 6 to 18 Years | 6 (42.9%) | 8 (57.1%) |
| 19 to 25 Years | 8 (88.9%) | 1 (11.1%) |
| 25 to 34 Years | 0 (0.0%) | 0 (0.0%) |
| 35 to 44 Years | 3 (21.4%) | 6 (42.9%) |
| 45 to 54 Years | 0 (0.0%) | 3 (60.0%) |
| 55 to 64 Years | 3 (15.8%) | 10 (52.6%) |
| 65 to 74 Years | 26 (100.0%) | 24 (92.3%) |
| 75 Years and over | 18 (100.0%) | 9 (50.0%) |
| Total | 70 (63.1%) | 61 (54.9%) |
Disability Status by Sex by Age in Longstreet
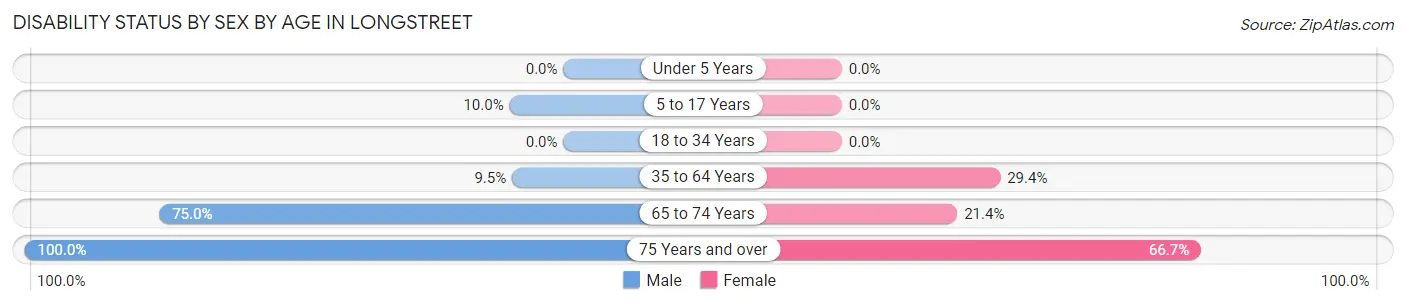
| Age Bracket | Male | Female |
| Under 5 Years | 0 (0.0%) | 0 (0.0%) |
| 5 to 17 Years | 1 (10.0%) | 0 (0.0%) |
| 18 to 34 Years | 0 (0.0%) | 0 (0.0%) |
| 35 to 64 Years | 2 (9.5%) | 5 (29.4%) |
| 65 to 74 Years | 9 (75.0%) | 3 (21.4%) |
| 75 Years and over | 3 (100.0%) | 10 (66.7%) |
Disability Class by Sex by Age in Longstreet
Disability Class: Hearing Difficulty
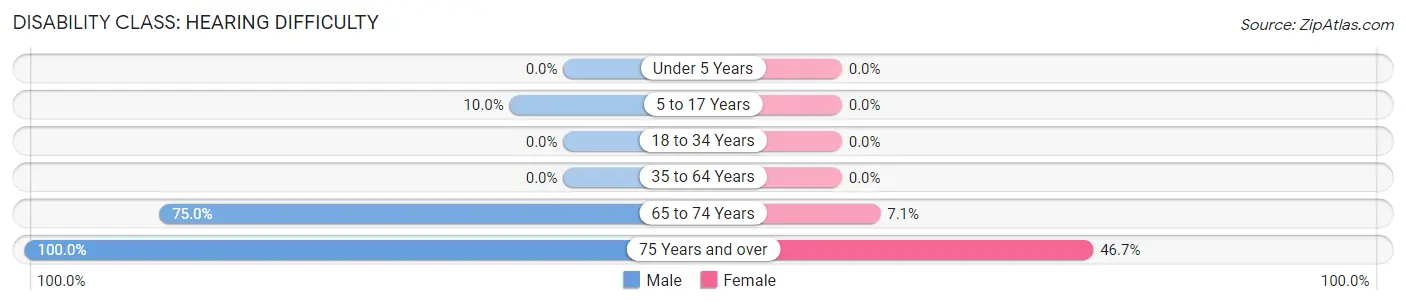
| Age Bracket | Male | Female |
| Under 5 Years | 0 (0.0%) | 0 (0.0%) |
| 5 to 17 Years | 1 (10.0%) | 0 (0.0%) |
| 18 to 34 Years | 0 (0.0%) | 0 (0.0%) |
| 35 to 64 Years | 0 (0.0%) | 0 (0.0%) |
| 65 to 74 Years | 9 (75.0%) | 1 (7.1%) |
| 75 Years and over | 3 (100.0%) | 7 (46.7%) |
Disability Class: Vision Difficulty
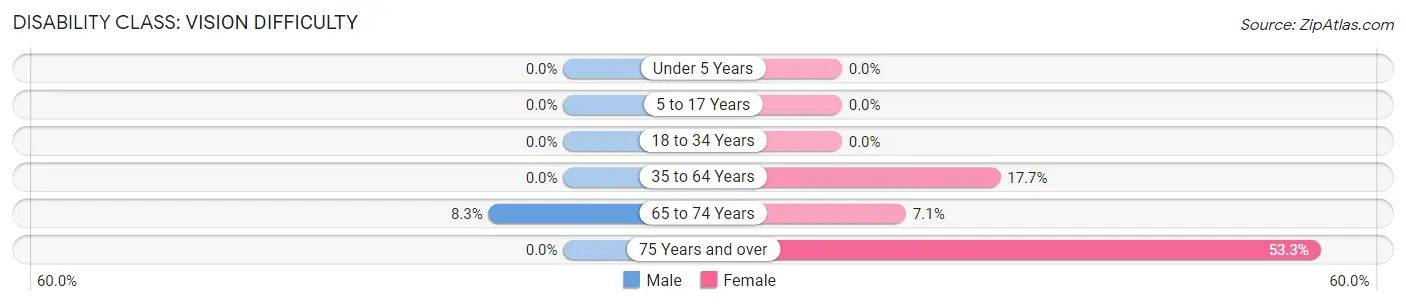
| Age Bracket | Male | Female |
| Under 5 Years | 0 (0.0%) | 0 (0.0%) |
| 5 to 17 Years | 0 (0.0%) | 0 (0.0%) |
| 18 to 34 Years | 0 (0.0%) | 0 (0.0%) |
| 35 to 64 Years | 0 (0.0%) | 3 (17.6%) |
| 65 to 74 Years | 1 (8.3%) | 1 (7.1%) |
| 75 Years and over | 0 (0.0%) | 8 (53.3%) |
Disability Class: Cognitive Difficulty
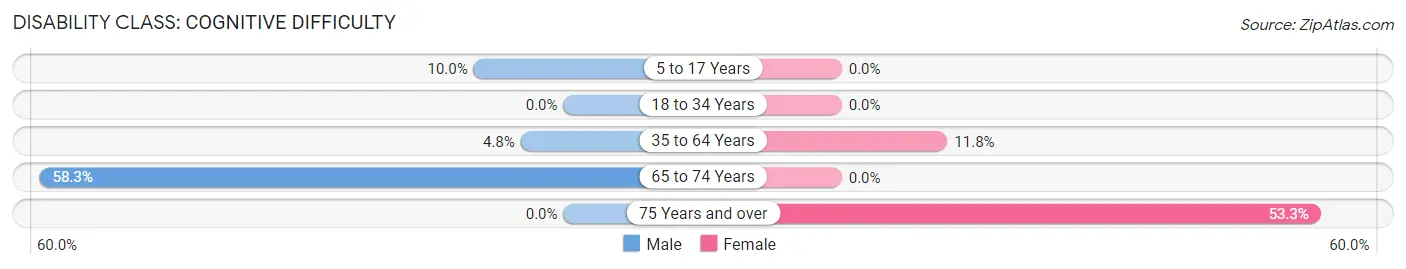
| Age Bracket | Male | Female |
| 5 to 17 Years | 1 (10.0%) | 0 (0.0%) |
| 18 to 34 Years | 0 (0.0%) | 0 (0.0%) |
| 35 to 64 Years | 1 (4.8%) | 2 (11.8%) |
| 65 to 74 Years | 7 (58.3%) | 0 (0.0%) |
| 75 Years and over | 0 (0.0%) | 8 (53.3%) |
Disability Class: Ambulatory Difficulty
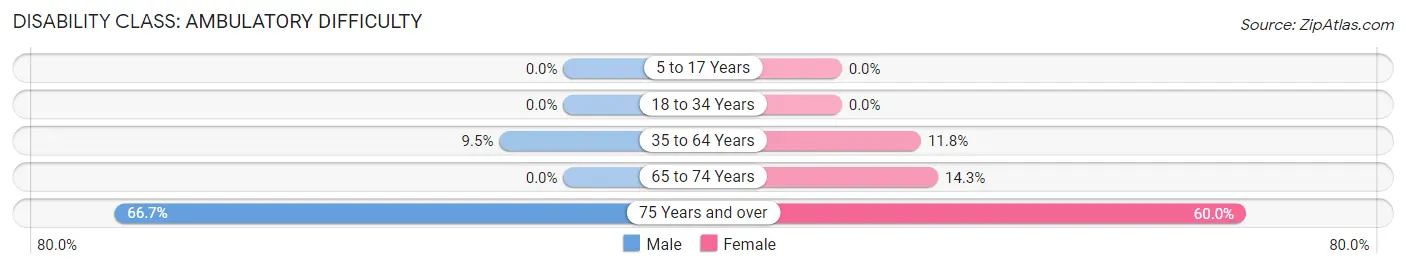
| Age Bracket | Male | Female |
| 5 to 17 Years | 0 (0.0%) | 0 (0.0%) |
| 18 to 34 Years | 0 (0.0%) | 0 (0.0%) |
| 35 to 64 Years | 2 (9.5%) | 2 (11.8%) |
| 65 to 74 Years | 0 (0.0%) | 2 (14.3%) |
| 75 Years and over | 2 (66.7%) | 9 (60.0%) |
Disability Class: Self-Care Difficulty
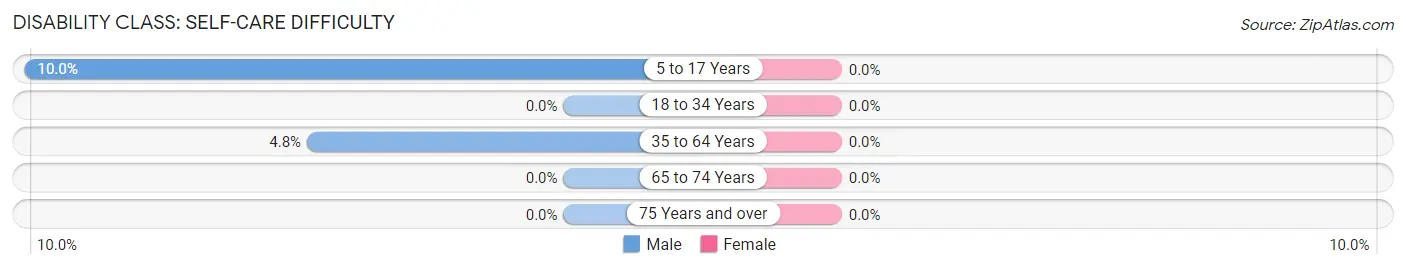
| Age Bracket | Male | Female |
| 5 to 17 Years | 1 (10.0%) | 0 (0.0%) |
| 18 to 34 Years | 0 (0.0%) | 0 (0.0%) |
| 35 to 64 Years | 1 (4.8%) | 0 (0.0%) |
| 65 to 74 Years | 0 (0.0%) | 0 (0.0%) |
| 75 Years and over | 0 (0.0%) | 0 (0.0%) |
Technology Access in Longstreet
Computing Device Access in Longstreet
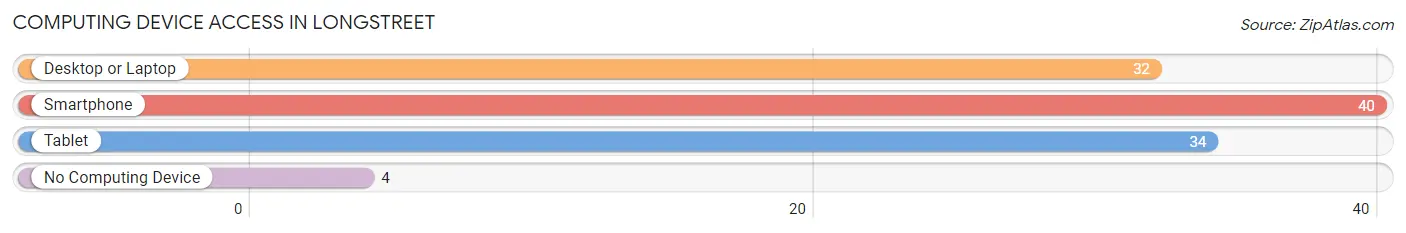
| Device Type | # Households | % Households |
| Desktop or Laptop | 32 | 71.1% |
| Smartphone | 40 | 88.9% |
| Tablet | 34 | 75.6% |
| No Computing Device | 4 | 8.9% |
| Total | 45 | 100.0% |
Internet Access in Longstreet
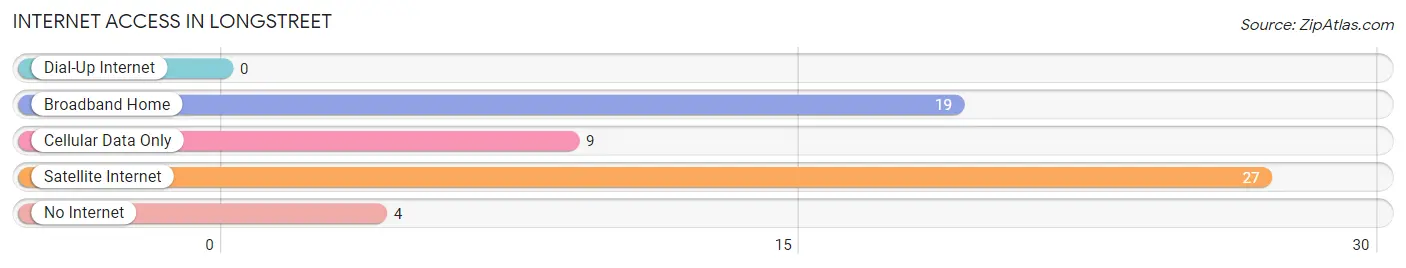
| Internet Type | # Households | % Households |
| Dial-Up Internet | 0 | 0.0% |
| Broadband Home | 19 | 42.2% |
| Cellular Data Only | 9 | 20.0% |
| Satellite Internet | 27 | 60.0% |
| No Internet | 4 | 8.9% |
| Total | 45 | 100.0% |
Longstreet Summary
Longstreet is a small town located in the state of Louisiana, in the United States of America. It is situated in the northern part of the state, in the parish of DeSoto. The town has a population of around 1,000 people, and is part of the Shreveport-Bossier City metropolitan area.
History
Longstreet was founded in 1845 by a group of settlers from the nearby town of Logansport. The town was named after General James Longstreet, a Confederate general who fought in the Civil War. The town was originally a farming community, and the main crops grown were cotton, corn, and sweet potatoes. The town also had a sawmill and a gristmill.
In the late 19th century, the town began to grow and develop. The railroad was extended to Longstreet in 1887, and this allowed the town to become a major shipping center for the surrounding area. The town also had a number of stores, churches, and other businesses.
In the early 20th century, Longstreet began to decline. The railroad was abandoned in the 1920s, and the town's economy suffered as a result. The population of the town began to decline, and by the 1950s, the town had become a virtual ghost town.
In the late 20th century, the town began to experience a revival. The railroad was restored in the 1980s, and the town began to attract new businesses and residents. Today, Longstreet is a small but vibrant community.
Geography
Longstreet is located in the northern part of Louisiana, in the parish of DeSoto. The town is situated on the banks of the Red River, and is surrounded by rolling hills and forests. The town is located about 30 miles south of Shreveport, and about 50 miles north of Alexandria.
The climate in Longstreet is humid subtropical, with hot summers and mild winters. The average annual temperature is around 70 degrees Fahrenheit, and the average annual precipitation is around 50 inches.
Economy
The economy of Longstreet is largely based on agriculture and tourism. The town is home to a number of farms, which produce a variety of crops, including cotton, corn, and sweet potatoes. The town is also home to a number of tourist attractions, including the Longstreet Museum and the Longstreet Historic District.
The town is also home to a number of small businesses, including restaurants, shops, and other services. The town is served by the DeSoto Parish School District, and there are a number of schools in the area.
Demographics
As of the 2010 census, the population of Longstreet was 1,000 people. The racial makeup of the town was 95.2% White, 2.2% African American, 0.7% Native American, 0.3% Asian, and 1.6% from other races. The median household income was $31,250, and the median family income was $37,500.
Conclusion
Longstreet is a small town located in the northern part of Louisiana. The town has a population of around 1,000 people, and is part of the Shreveport-Bossier City metropolitan area. The town was founded in 1845, and was originally a farming community. Today, the town is a small but vibrant community, with a largely agricultural economy and a number of tourist attractions. The population of the town is mostly White, with a small percentage of African Americans, Native Americans, and Asians.
Common Questions
What is Per Capita Income in Longstreet?
Per Capita income in Longstreet is $31,274.
What is the Median Family Income in Longstreet?
Median Family Income in Longstreet is $86,406.
What is the Median Household income in Longstreet?
Median Household Income in Longstreet is $85,469.
What is Inequality or Gini Index in Longstreet?
Inequality or Gini Index in Longstreet is 0.28.
What is the Total Population of Longstreet?
Total Population of Longstreet is 111.
What is the Total Male Population of Longstreet?
Total Male Population of Longstreet is 63.
What is the Total Female Population of Longstreet?
Total Female Population of Longstreet is 48.
What is the Ratio of Males per 100 Females in Longstreet?
There are 131.25 Males per 100 Females in Longstreet.
What is the Ratio of Females per 100 Males in Longstreet?
There are 76.19 Females per 100 Males in Longstreet.
What is the Median Population Age in Longstreet?
Median Population Age in Longstreet is 57.6 Years.
What is the Average Family Size in Longstreet
Average Family Size in Longstreet is 2.7 People.
What is the Average Household Size in Longstreet
Average Household Size in Longstreet is 2.5 People.
How Large is the Labor Force in Longstreet?
There are 31 People in the Labor Forcein in Longstreet.
What is the Percentage of People in the Labor Force in Longstreet?
31.3% of People are in the Labor Force in Longstreet.
What is the Unemployment Rate in Longstreet?
Unemployment Rate in Longstreet is 12.9%.