Ashland, LA Map & Demographics
Ashland Map
Ashland Overview
$33,659
PER CAPITA INCOME
$41,827
AVG HOUSEHOLD INCOME
15.9%
WAGE / INCOME GAP [ % ]
84.1¢/ $1
WAGE / INCOME GAP [ $ ]
0.40
INEQUALITY / GINI INDEX
155
TOTAL POPULATION
87
MALE POPULATION
68
FEMALE POPULATION
127.94
MALES / 100 FEMALES
78.16
FEMALES / 100 MALES
54.9
MEDIAN AGE
2.2
AVG FAMILY SIZE
1.7
AVG HOUSEHOLD SIZE
72
LABOR FORCE [ PEOPLE ]
51.4%
PERCENT IN LABOR FORCE
5.6%
UNEMPLOYMENT RATE
Ashland Zip Codes
Ashland Area Codes
Income in Ashland
Income Overview in Ashland
| Characteristic | Number | Measure |
| Per Capita Income | 155 | $33,659 |
| Median Family Income | 51 | $0 |
| Mean Family Income | 51 | $92,325 |
| Median Household Income | 89 | $41,827 |
| Mean Household Income | 89 | $67,200 |
| Income Deficit | 51 | $0 |
| Wage / Income Gap (%) | 155 | 15.90% |
| Wage / Income Gap ($) | 155 | 84.10¢ per $1 |
| Gini / Inequality Index | 155 | 0.40 |
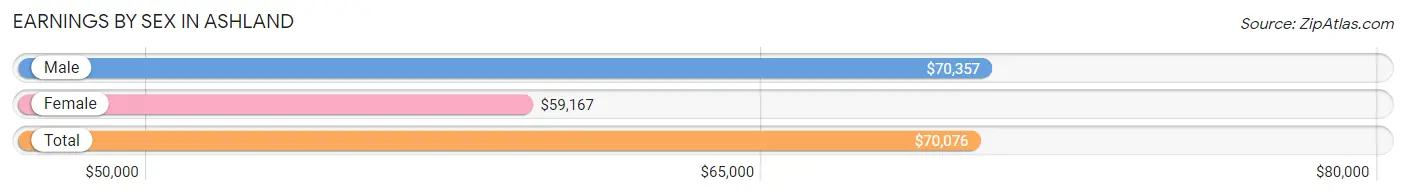
Earnings by Sex in Ashland
Average Earnings in Ashland are $70,076, $70,357 for men and $59,167 for women, a difference of 15.9%.
| Sex | Number | Average Earnings |
| Male | 42 (60.0%) | $70,357 |
| Female | 28 (40.0%) | $59,167 |
| Total | 70 (100.0%) | $70,076 |
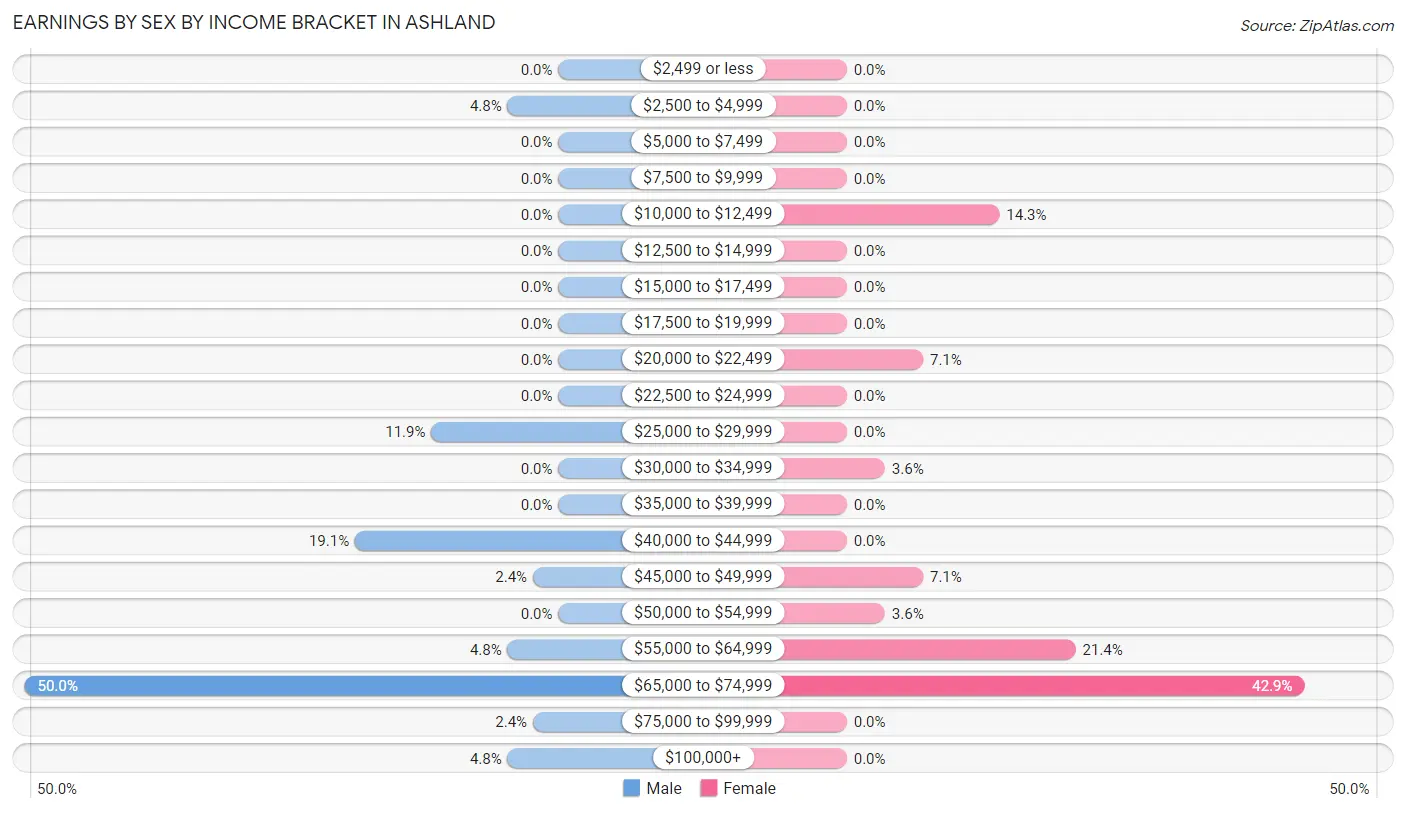
Earnings by Sex by Income Bracket in Ashland
The most common earnings brackets in Ashland are $65,000 to $74,999 for men (21 | 50.0%) and $65,000 to $74,999 for women (12 | 42.9%).
| Income | Male | Female |
| $2,499 or less | 0 (0.0%) | 0 (0.0%) |
| $2,500 to $4,999 | 2 (4.8%) | 0 (0.0%) |
| $5,000 to $7,499 | 0 (0.0%) | 0 (0.0%) |
| $7,500 to $9,999 | 0 (0.0%) | 0 (0.0%) |
| $10,000 to $12,499 | 0 (0.0%) | 4 (14.3%) |
| $12,500 to $14,999 | 0 (0.0%) | 0 (0.0%) |
| $15,000 to $17,499 | 0 (0.0%) | 0 (0.0%) |
| $17,500 to $19,999 | 0 (0.0%) | 0 (0.0%) |
| $20,000 to $22,499 | 0 (0.0%) | 2 (7.1%) |
| $22,500 to $24,999 | 0 (0.0%) | 0 (0.0%) |
| $25,000 to $29,999 | 5 (11.9%) | 0 (0.0%) |
| $30,000 to $34,999 | 0 (0.0%) | 1 (3.6%) |
| $35,000 to $39,999 | 0 (0.0%) | 0 (0.0%) |
| $40,000 to $44,999 | 8 (19.1%) | 0 (0.0%) |
| $45,000 to $49,999 | 1 (2.4%) | 2 (7.1%) |
| $50,000 to $54,999 | 0 (0.0%) | 1 (3.6%) |
| $55,000 to $64,999 | 2 (4.8%) | 6 (21.4%) |
| $65,000 to $74,999 | 21 (50.0%) | 12 (42.9%) |
| $75,000 to $99,999 | 1 (2.4%) | 0 (0.0%) |
| $100,000+ | 2 (4.8%) | 0 (0.0%) |
| Total | 42 (100.0%) | 28 (100.0%) |
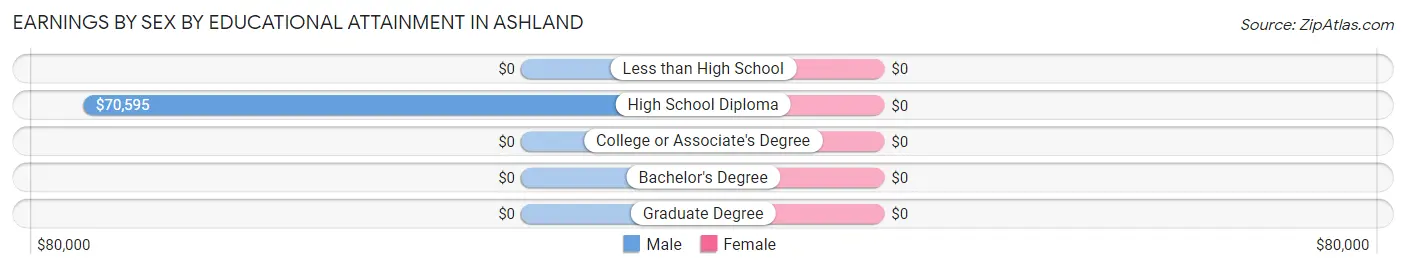
Earnings by Sex by Educational Attainment in Ashland
| Educational Attainment | Male Income | Female Income |
| Less than High School | - | - |
| High School Diploma | $70,595 | $0 |
| College or Associate's Degree | - | - |
| Bachelor's Degree | - | - |
| Graduate Degree | - | - |
| Total | $70,357 | $59,167 |
Family Income in Ashland
Family Income Brackets in Ashland
According to the Ashland family income data, there are 23 families falling into the $100,000 to $149,999 income range, which is the most common income bracket and makes up 45.1% of all families.
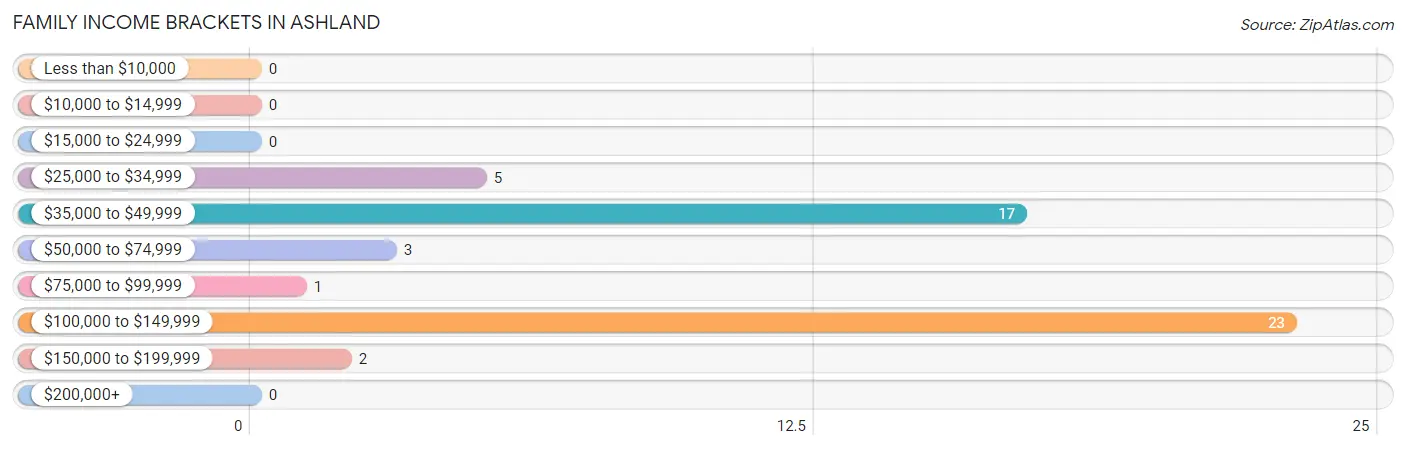
| Income Bracket | # Families | % Families |
| Less than $10,000 | 0 | 0.0% |
| $10,000 to $14,999 | 0 | 0.0% |
| $15,000 to $24,999 | 0 | 0.0% |
| $25,000 to $34,999 | 5 | 9.8% |
| $35,000 to $49,999 | 17 | 33.3% |
| $50,000 to $74,999 | 3 | 5.9% |
| $75,000 to $99,999 | 1 | 2.0% |
| $100,000 to $149,999 | 23 | 45.1% |
| $150,000 to $199,999 | 2 | 3.9% |
| $200,000+ | 0 | 0.0% |
Family Income by Famaliy Size in Ashland
3-person families (27 | 52.9%) account for the highest median family income in Ashland with $143,393 per family, while 3-person families (27 | 52.9%) have the highest median income of $47,798 per family member.
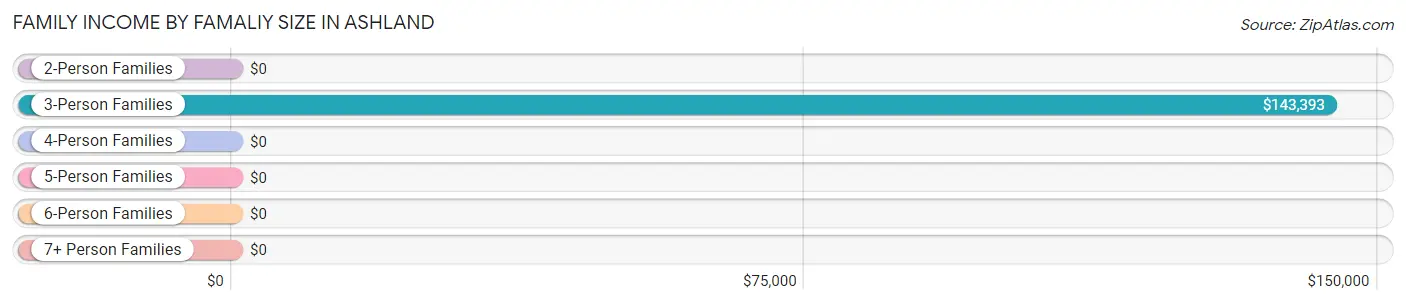
| Income Bracket | # Families | Median Income |
| 2-Person Families | 24 (47.1%) | $0 |
| 3-Person Families | 27 (52.9%) | $143,393 |
| 4-Person Families | 0 (0.0%) | $0 |
| 5-Person Families | 0 (0.0%) | $0 |
| 6-Person Families | 0 (0.0%) | $0 |
| 7+ Person Families | 0 (0.0%) | $0 |
| Total | 51 (100.0%) | $0 |
Family Income by Number of Earners in Ashland
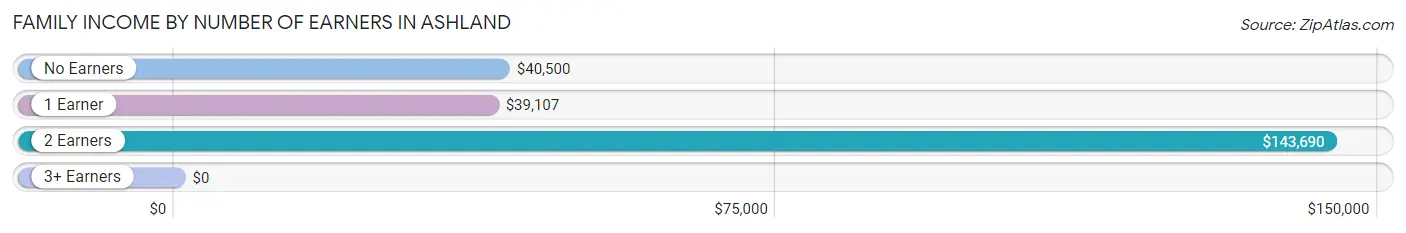
| Number of Earners | # Families | Median Income |
| No Earners | 16 (31.4%) | $40,500 |
| 1 Earner | 9 (17.6%) | $39,107 |
| 2 Earners | 26 (51.0%) | $143,690 |
| 3+ Earners | 0 (0.0%) | $0 |
| Total | 51 (100.0%) | $0 |
Household Income in Ashland
Household Income Brackets in Ashland
With 24 households falling in the category, the $35,000 to $49,999 income range is the most frequent in Ashland, accounting for 27.0% of all households.
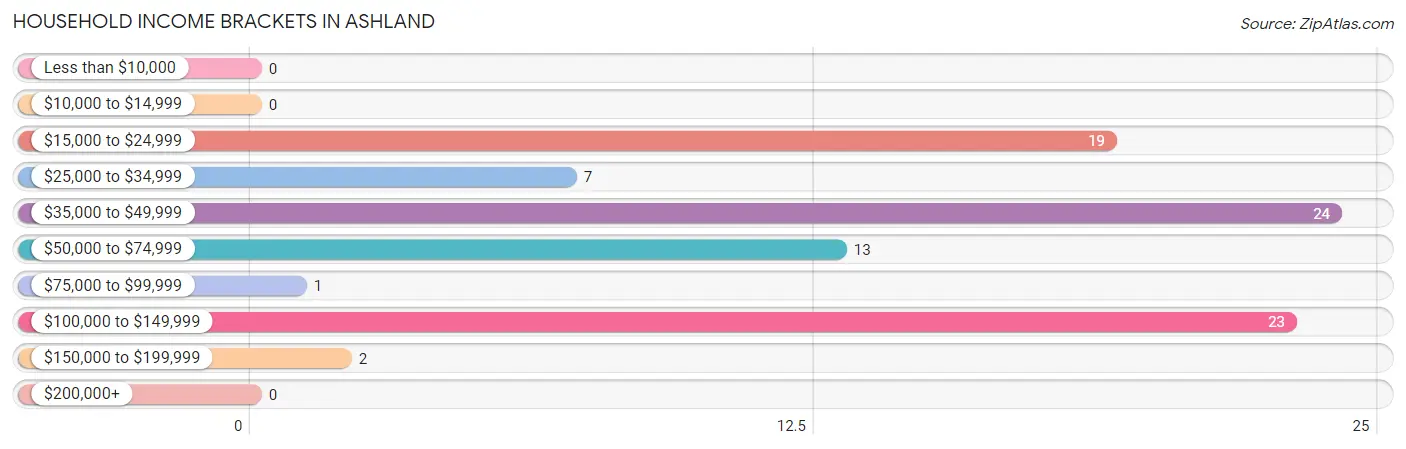
| Income Bracket | # Households | % Households |
| Less than $10,000 | 0 | 0.0% |
| $10,000 to $14,999 | 0 | 0.0% |
| $15,000 to $24,999 | 19 | 21.3% |
| $25,000 to $34,999 | 7 | 7.9% |
| $35,000 to $49,999 | 24 | 27.0% |
| $50,000 to $74,999 | 13 | 14.6% |
| $75,000 to $99,999 | 1 | 1.1% |
| $100,000 to $149,999 | 23 | 25.8% |
| $150,000 to $199,999 | 2 | 2.2% |
| $200,000+ | 0 | 0.0% |
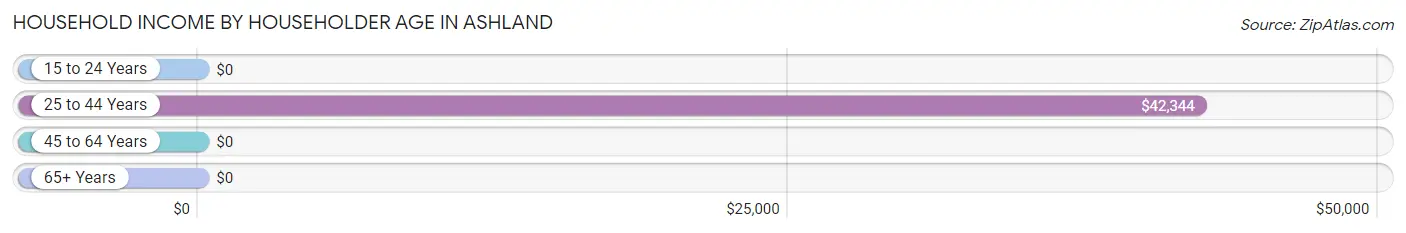
Household Income by Householder Age in Ashland
The median household income in Ashland is $41,827, with the highest median household income of $42,344 found in the 25 to 44 years age bracket for the primary householder. A total of 15 households (16.9%) fall into this category.
| Income Bracket | # Households | Median Income |
| 15 to 24 Years | 0 (0.0%) | $0 |
| 25 to 44 Years | 15 (16.9%) | $42,344 |
| 45 to 64 Years | 50 (56.2%) | $0 |
| 65+ Years | 24 (27.0%) | $0 |
| Total | 89 (100.0%) | $41,827 |
Poverty in Ashland
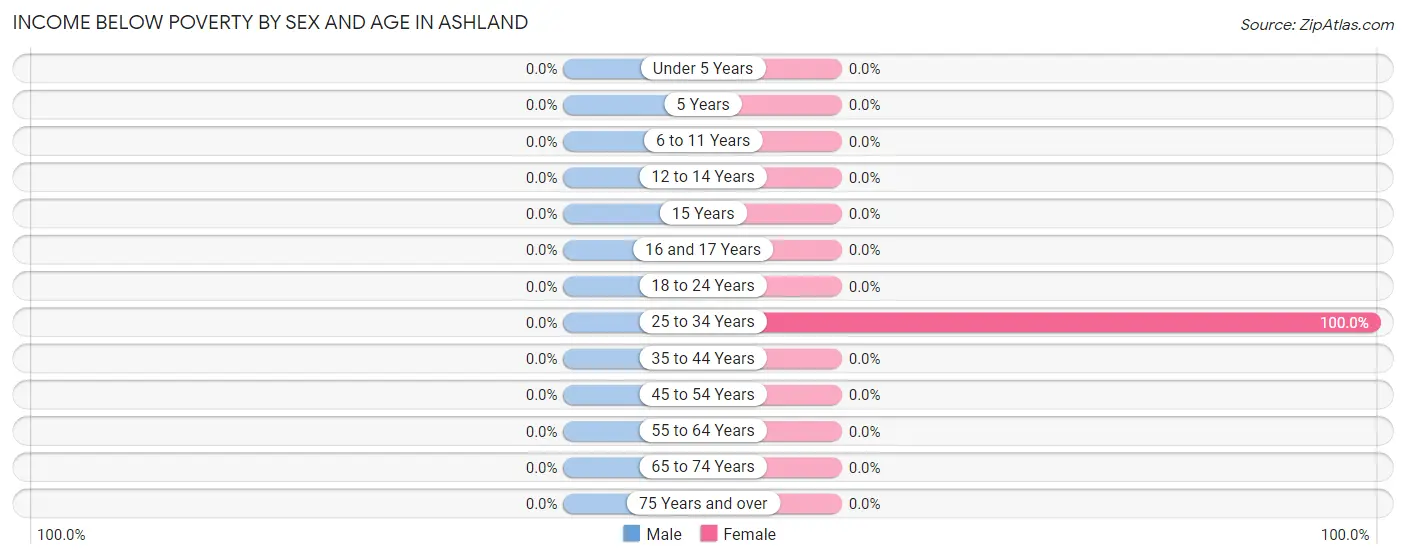
Income Below Poverty by Sex and Age in Ashland
| Age Bracket | Male | Female |
| Under 5 Years | 0 (0.0%) | 0 (0.0%) |
| 5 Years | 0 (0.0%) | 0 (0.0%) |
| 6 to 11 Years | 0 (0.0%) | 0 (0.0%) |
| 12 to 14 Years | 0 (0.0%) | 0 (0.0%) |
| 15 Years | 0 (0.0%) | 0 (0.0%) |
| 16 and 17 Years | 0 (0.0%) | 0 (0.0%) |
| 18 to 24 Years | 0 (0.0%) | 0 (0.0%) |
| 25 to 34 Years | 0 (0.0%) | 4 (100.0%) |
| 35 to 44 Years | 0 (0.0%) | 0 (0.0%) |
| 45 to 54 Years | 0 (0.0%) | 0 (0.0%) |
| 55 to 64 Years | 0 (0.0%) | 0 (0.0%) |
| 65 to 74 Years | 0 (0.0%) | 0 (0.0%) |
| 75 Years and over | 0 (0.0%) | 0 (0.0%) |
| Total | 0 (0.0%) | 4 (5.9%) |
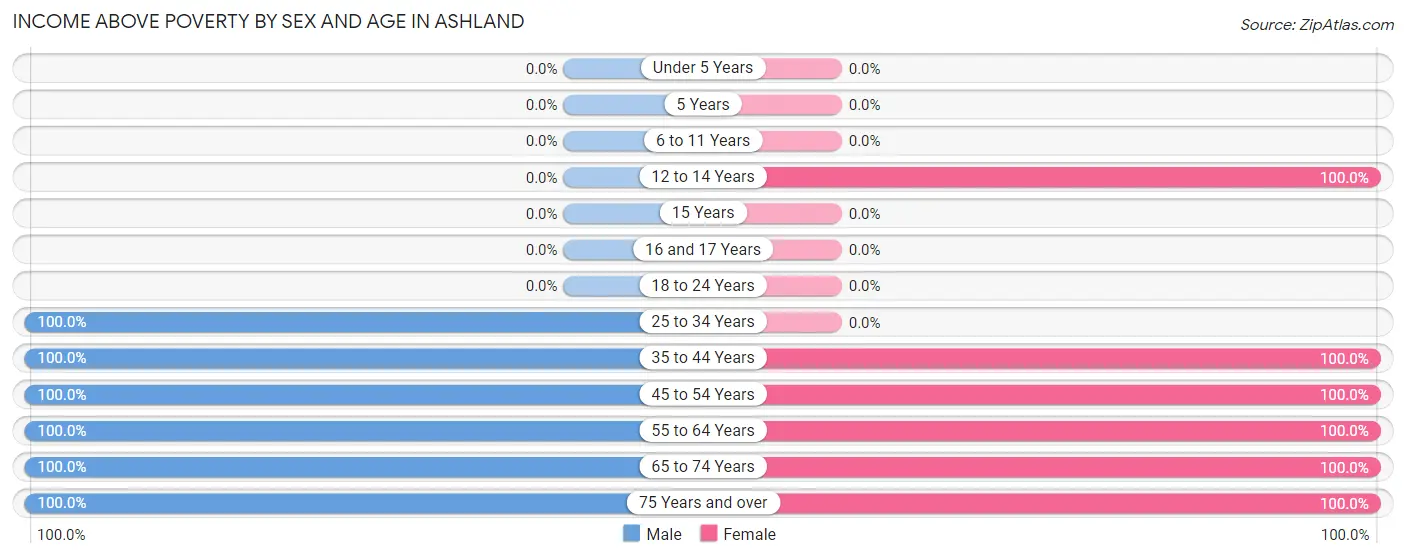
Income Above Poverty by Sex and Age in Ashland
According to the poverty statistics in Ashland, males aged 25 to 34 years and females aged 12 to 14 years are the age groups that are most secure financially, with 100.0% of males and 100.0% of females in these age groups living above the poverty line.
| Age Bracket | Male | Female |
| Under 5 Years | 0 (0.0%) | 0 (0.0%) |
| 5 Years | 0 (0.0%) | 0 (0.0%) |
| 6 to 11 Years | 0 (0.0%) | 0 (0.0%) |
| 12 to 14 Years | 0 (0.0%) | 15 (100.0%) |
| 15 Years | 0 (0.0%) | 0 (0.0%) |
| 16 and 17 Years | 0 (0.0%) | 0 (0.0%) |
| 18 to 24 Years | 0 (0.0%) | 0 (0.0%) |
| 25 to 34 Years | 12 (100.0%) | 0 (0.0%) |
| 35 to 44 Years | 1 (100.0%) | 8 (100.0%) |
| 45 to 54 Years | 27 (100.0%) | 12 (100.0%) |
| 55 to 64 Years | 19 (100.0%) | 17 (100.0%) |
| 65 to 74 Years | 9 (100.0%) | 7 (100.0%) |
| 75 Years and over | 19 (100.0%) | 5 (100.0%) |
| Total | 87 (100.0%) | 64 (94.1%) |
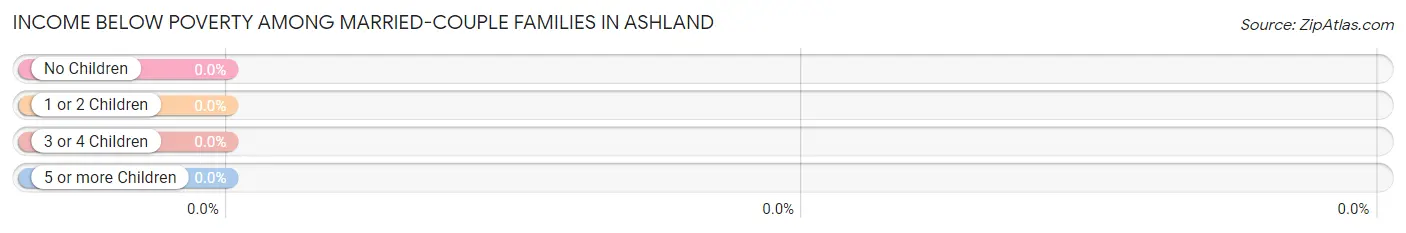
Income Below Poverty Among Married-Couple Families in Ashland
| Children | Above Poverty | Below Poverty |
| No Children | 30 (100.0%) | 0 (0.0%) |
| 1 or 2 Children | 21 (100.0%) | 0 (0.0%) |
| 3 or 4 Children | 0 (0.0%) | 0 (0.0%) |
| 5 or more Children | 0 (0.0%) | 0 (0.0%) |
| Total | 51 (100.0%) | 0 (0.0%) |
Income Below Poverty Among Single-Parent Households in Ashland
| Children | Single Father | Single Mother |
| No Children | 0 (0.0%) | 0 (0.0%) |
| 1 or 2 Children | 0 (0.0%) | 0 (0.0%) |
| 3 or 4 Children | 0 (0.0%) | 0 (0.0%) |
| 5 or more Children | 0 (0.0%) | 0 (0.0%) |
| Total | 0 (0.0%) | 0 (0.0%) |
Income Below Poverty Among Married-Couple vs Single-Parent Households in Ashland
| Children | Married-Couple Families | Single-Parent Households |
| No Children | 0 (0.0%) | 0 (0.0%) |
| 1 or 2 Children | 0 (0.0%) | 0 (0.0%) |
| 3 or 4 Children | 0 (0.0%) | 0 (0.0%) |
| 5 or more Children | 0 (0.0%) | 0 (0.0%) |
| Total | 0 (0.0%) | 0 (0.0%) |
Race in Ashland
The most populous races in Ashland are White / Caucasian (112 | 72.3%), Black / African American (16 | 10.3%), and Two or more Races (15 | 9.7%).
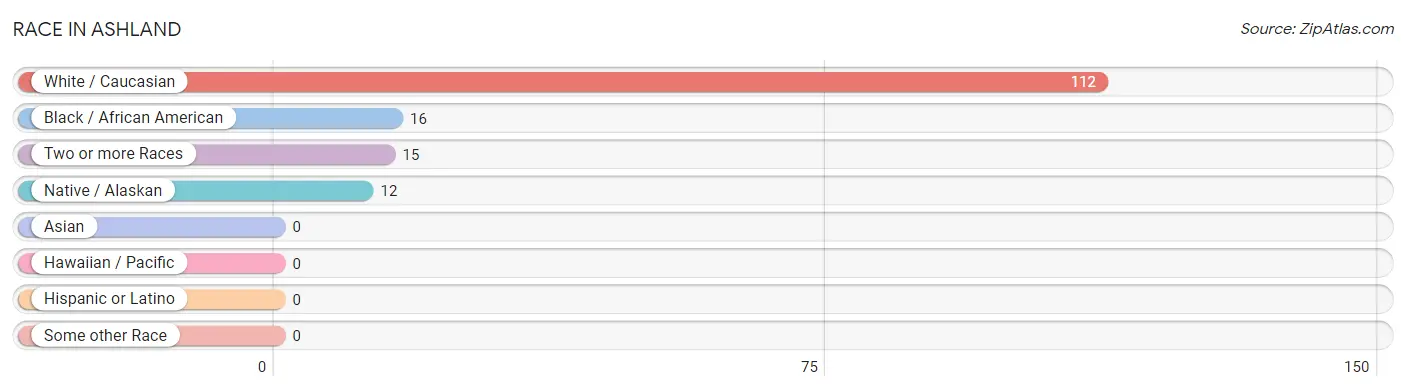
| Race | # Population | % Population |
| Asian | 0 | 0.0% |
| Black / African American | 16 | 10.3% |
| Hawaiian / Pacific | 0 | 0.0% |
| Hispanic or Latino | 0 | 0.0% |
| Native / Alaskan | 12 | 7.7% |
| White / Caucasian | 112 | 72.3% |
| Two or more Races | 15 | 9.7% |
| Some other Race | 0 | 0.0% |
| Total | 155 | 100.0% |
Ancestry in Ashland
The most populous ancestries reported in Ashland are Irish (41 | 26.5%), Pueblo (27 | 17.4%), Italian (21 | 13.6%), Scottish (21 | 13.6%), and French (13 | 8.4%), together accounting for 79.4% of all Ashland residents.
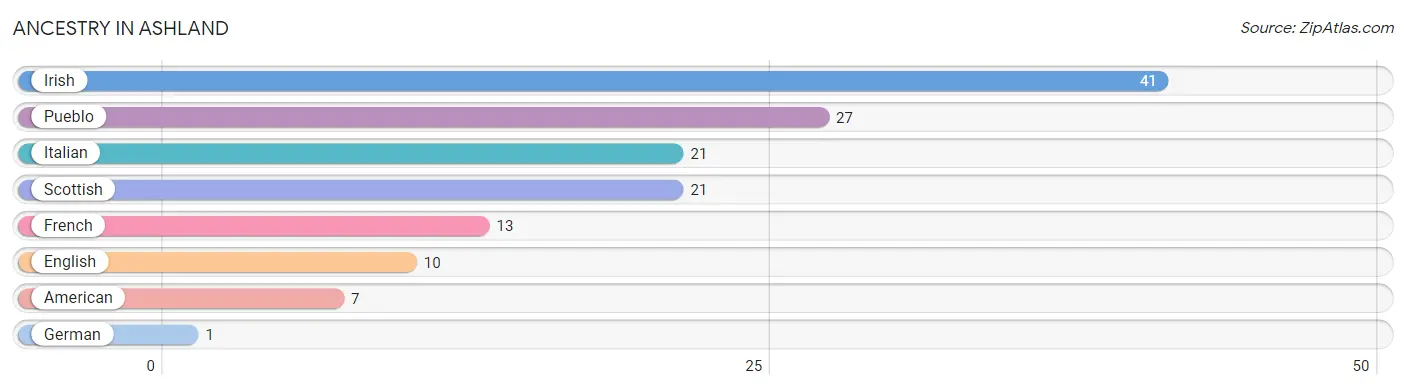
| Ancestry | # Population | % Population |
| American | 7 | 4.5% |
| English | 10 | 6.5% |
| French | 13 | 8.4% |
| German | 1 | 0.6% |
| Irish | 41 | 26.5% |
| Italian | 21 | 13.6% |
| Pueblo | 27 | 17.4% |
| Scottish | 21 | 13.6% | View All 8 Rows |
Immigrants in Ashland

| Immigration Origin | # Population | % Population | View All 0 Rows |
Sex and Age in Ashland
Sex and Age in Ashland
The most populous age groups in Ashland are 50 to 54 Years (25 | 28.7%) for men and 55 to 59 Years (17 | 25.0%) for women.
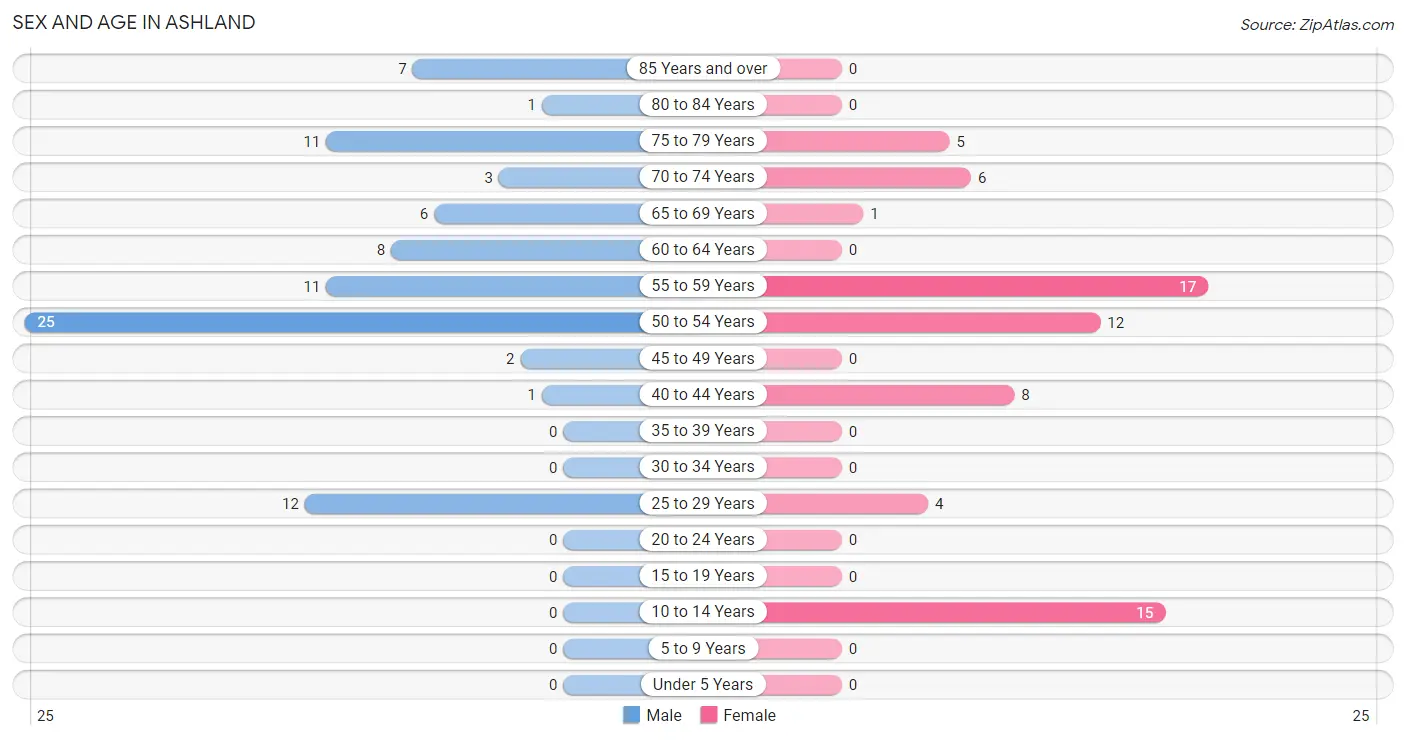
| Age Bracket | Male | Female |
| Under 5 Years | 0 (0.0%) | 0 (0.0%) |
| 5 to 9 Years | 0 (0.0%) | 0 (0.0%) |
| 10 to 14 Years | 0 (0.0%) | 15 (22.1%) |
| 15 to 19 Years | 0 (0.0%) | 0 (0.0%) |
| 20 to 24 Years | 0 (0.0%) | 0 (0.0%) |
| 25 to 29 Years | 12 (13.8%) | 4 (5.9%) |
| 30 to 34 Years | 0 (0.0%) | 0 (0.0%) |
| 35 to 39 Years | 0 (0.0%) | 0 (0.0%) |
| 40 to 44 Years | 1 (1.1%) | 8 (11.8%) |
| 45 to 49 Years | 2 (2.3%) | 0 (0.0%) |
| 50 to 54 Years | 25 (28.7%) | 12 (17.6%) |
| 55 to 59 Years | 11 (12.6%) | 17 (25.0%) |
| 60 to 64 Years | 8 (9.2%) | 0 (0.0%) |
| 65 to 69 Years | 6 (6.9%) | 1 (1.5%) |
| 70 to 74 Years | 3 (3.5%) | 6 (8.8%) |
| 75 to 79 Years | 11 (12.6%) | 5 (7.3%) |
| 80 to 84 Years | 1 (1.1%) | 0 (0.0%) |
| 85 Years and over | 7 (8.1%) | 0 (0.0%) |
| Total | 87 (100.0%) | 68 (100.0%) |
Families and Households in Ashland
Median Family Size in Ashland
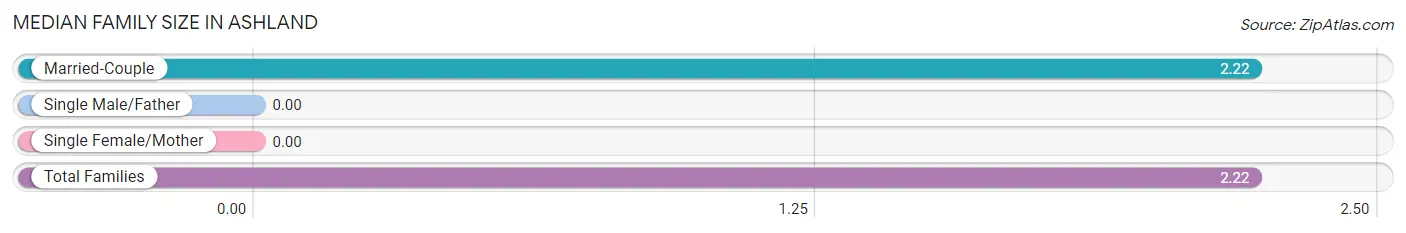
| Family Type | # Families | Family Size |
| Married-Couple | 51 (100.0%) | 2.22 |
| Single Male/Father | 0 (0.0%) | - |
| Single Female/Mother | 0 (0.0%) | - |
| Total Families | 51 (100.0%) | 2.22 |
Median Household Size in Ashland
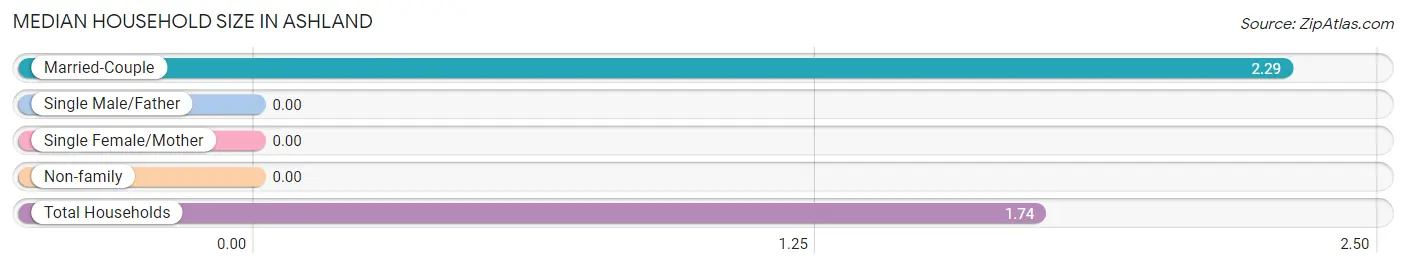
| Household Type | # Households | Household Size |
| Married-Couple | 51 (57.3%) | 2.29 |
| Single Male/Father | 0 (0.0%) | - |
| Single Female/Mother | 0 (0.0%) | - |
| Non-family | 38 (42.7%) | - |
| Total Households | 89 (100.0%) | 1.74 |
Household Size by Marriage Status in Ashland
Out of a total of 89 households in Ashland, 51 (57.3%) are family households, while 38 (42.7%) are nonfamily households. The most numerous type of family households are 3-person households, comprising 26, and the most common type of nonfamily households are 1-person households, comprising 38.
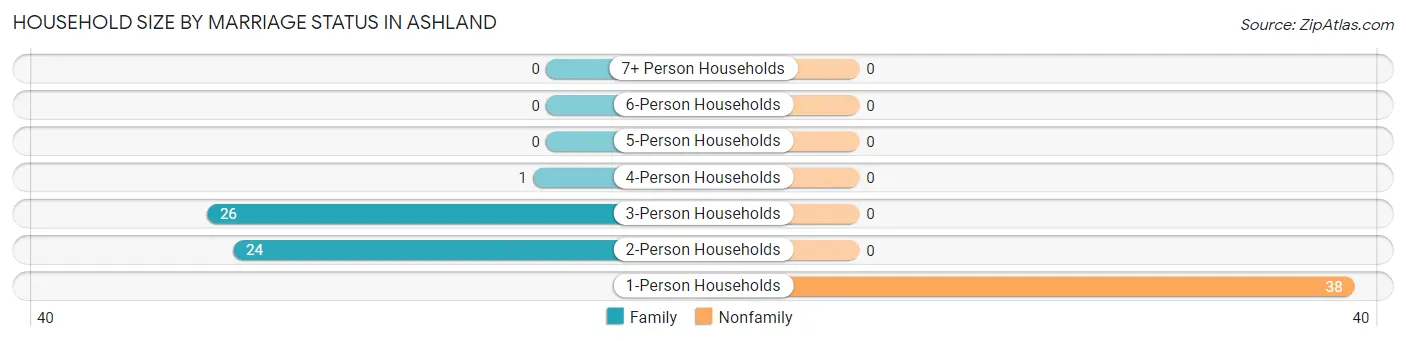
| Household Size | Family Households | Nonfamily Households |
| 1-Person Households | - | 38 (42.7%) |
| 2-Person Households | 24 (27.0%) | 0 (0.0%) |
| 3-Person Households | 26 (29.2%) | 0 (0.0%) |
| 4-Person Households | 1 (1.1%) | 0 (0.0%) |
| 5-Person Households | 0 (0.0%) | 0 (0.0%) |
| 6-Person Households | 0 (0.0%) | 0 (0.0%) |
| 7+ Person Households | 0 (0.0%) | 0 (0.0%) |
| Total | 51 (57.3%) | 38 (42.7%) |
Female Fertility in Ashland
Fertility by Age in Ashland
| Age Bracket | Women with Births | Births / 1,000 Women |
| 15 to 19 years | 0 (0.0%) | 0.0 |
| 20 to 34 years | 0 (0.0%) | 0.0 |
| 35 to 50 years | 0 (0.0%) | 0.0 |
| Total | 0 (0.0%) | 0.0 |
Fertility by Age by Marriage Status in Ashland
| Age Bracket | Married | Unmarried |
| 15 to 19 years | 0 (0.0%) | 0 (0.0%) |
| 20 to 34 years | 0 (0.0%) | 0 (0.0%) |
| 35 to 50 years | 0 (0.0%) | 0 (0.0%) |
| Total | 0 (0.0%) | 0 (0.0%) |
Fertility by Education in Ashland
| Educational Attainment | Women with Births | Births / 1,000 Women |
| Less than High School | 0 (0.0%) | 0.0 |
| High School Diploma | 0 (0.0%) | 0.0 |
| College or Associate's Degree | 0 (0.0%) | 0.0 |
| Bachelor's Degree | 0 (0.0%) | 0.0 |
| Graduate Degree | 0 (0.0%) | 0.0 |
| Total | 0 (0.0%) | 0.0 |
Fertility by Education by Marriage Status in Ashland
| Educational Attainment | Married | Unmarried |
| Less than High School | 0 (0.0%) | 0 (0.0%) |
| High School Diploma | 0 (0.0%) | 0 (0.0%) |
| College or Associate's Degree | 0 (0.0%) | 0 (0.0%) |
| Bachelor's Degree | 0 (0.0%) | 0 (0.0%) |
| Graduate Degree | 0 (0.0%) | 0 (0.0%) |
| Total | 0 (0.0%) | 0 (0.0%) |
Employment Characteristics in Ashland
Employment by Class of Employer in Ashland
Among the 68 employed individuals in Ashland, self-employed (incorporated) (33 | 48.5%), private company employees (24 | 35.3%), and local government employees (8 | 11.8%) make up the most common classes of employment.
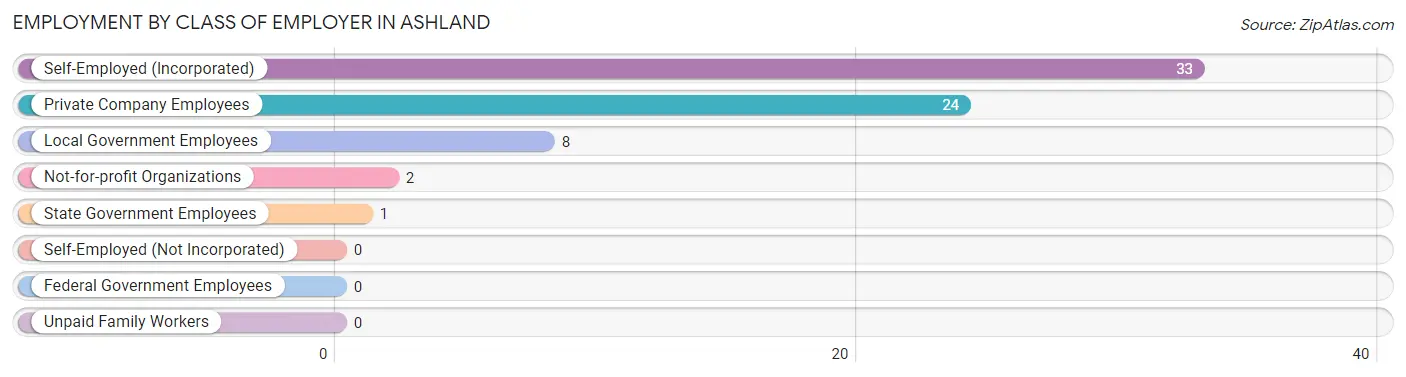
| Employer Class | # Employees | % Employees |
| Private Company Employees | 24 | 35.3% |
| Self-Employed (Incorporated) | 33 | 48.5% |
| Self-Employed (Not Incorporated) | 0 | 0.0% |
| Not-for-profit Organizations | 2 | 2.9% |
| Local Government Employees | 8 | 11.8% |
| State Government Employees | 1 | 1.5% |
| Federal Government Employees | 0 | 0.0% |
| Unpaid Family Workers | 0 | 0.0% |
| Total | 68 | 100.0% |
Employment Status by Age in Ashland
According to the labor force statistics for Ashland, out of the total population over 16 years of age (140), 51.4% or 72 individuals are in the labor force, with 5.6% or 4 of them unemployed. The age group with the highest labor force participation rate is 25 to 29 years, with 100.0% or 16 individuals in the labor force. Within the labor force, the 25 to 29 years age range has the highest percentage of unemployed individuals, with 25.0% or 4 of them being unemployed.
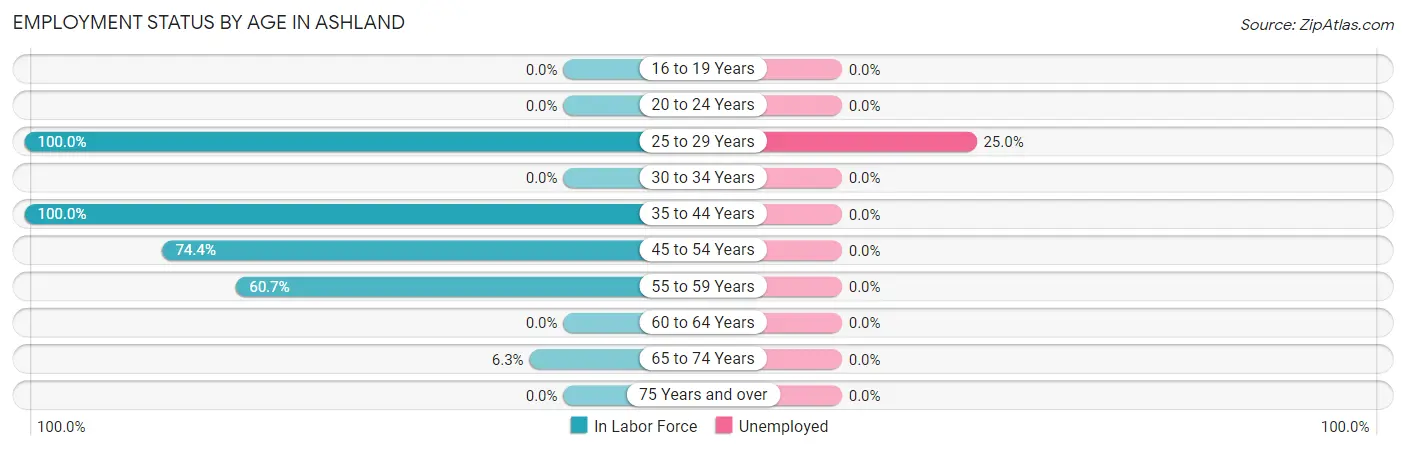
| Age Bracket | In Labor Force | Unemployed |
| 16 to 19 Years | 0 (0.0%) | 0 (0.0%) |
| 20 to 24 Years | 0 (0.0%) | 0 (0.0%) |
| 25 to 29 Years | 16 (100.0%) | 4 (25.0%) |
| 30 to 34 Years | 0 (0.0%) | 0 (0.0%) |
| 35 to 44 Years | 9 (100.0%) | 0 (0.0%) |
| 45 to 54 Years | 29 (74.4%) | 0 (0.0%) |
| 55 to 59 Years | 17 (60.7%) | 0 (0.0%) |
| 60 to 64 Years | 0 (0.0%) | 0 (0.0%) |
| 65 to 74 Years | 1 (6.3%) | 0 (0.0%) |
| 75 Years and over | 0 (0.0%) | 0 (0.0%) |
| Total | 72 (51.4%) | 4 (5.6%) |
Employment Status by Educational Attainment in Ashland
According to labor force statistics for Ashland, 71.0% of individuals (71) out of the total population between 25 and 64 years of age (100) are in the labor force, with 5.6% or 4 of them being unemployed. The group with the highest labor force participation rate are those with the educational attainment of less than high school, with 100.0% or 1 individuals in the labor force. Within the labor force, individuals with high school diploma education have the highest percentage of unemployment, with 8.9% or 4 of them being unemployed.
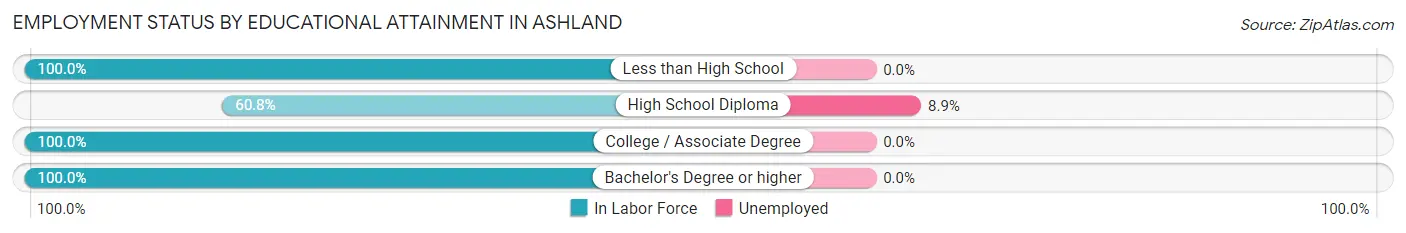
| Educational Attainment | In Labor Force | Unemployed |
| Less than High School | 1 (100.0%) | 0 (0.0%) |
| High School Diploma | 45 (60.8%) | 7 (8.9%) |
| College / Associate Degree | 19 (100.0%) | 0 (0.0%) |
| Bachelor's Degree or higher | 6 (100.0%) | 0 (0.0%) |
| Total | 71 (71.0%) | 6 (5.6%) |
Employment Occupations by Sex in Ashland
Management, Business, Science and Arts Occupations
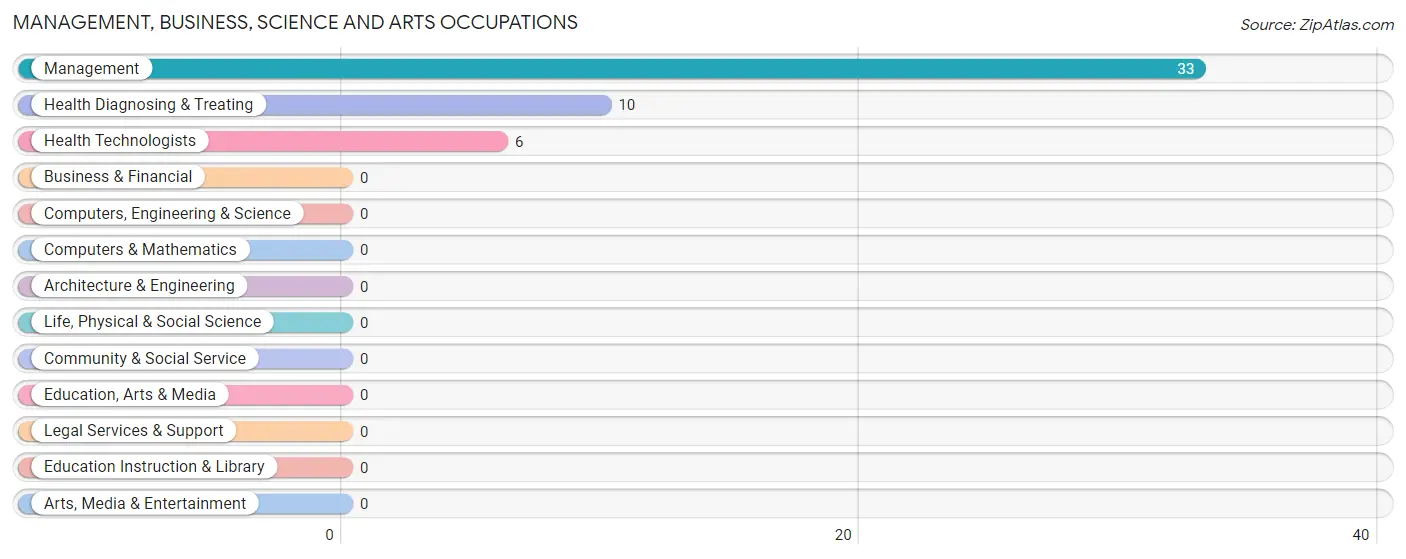
The most common Management, Business, Science and Arts occupations in Ashland are Management (33 | 48.5%), Health Diagnosing & Treating (10 | 14.7%), and Health Technologists (6 | 8.8%).
Management, Business, Science and Arts Occupations by Sex
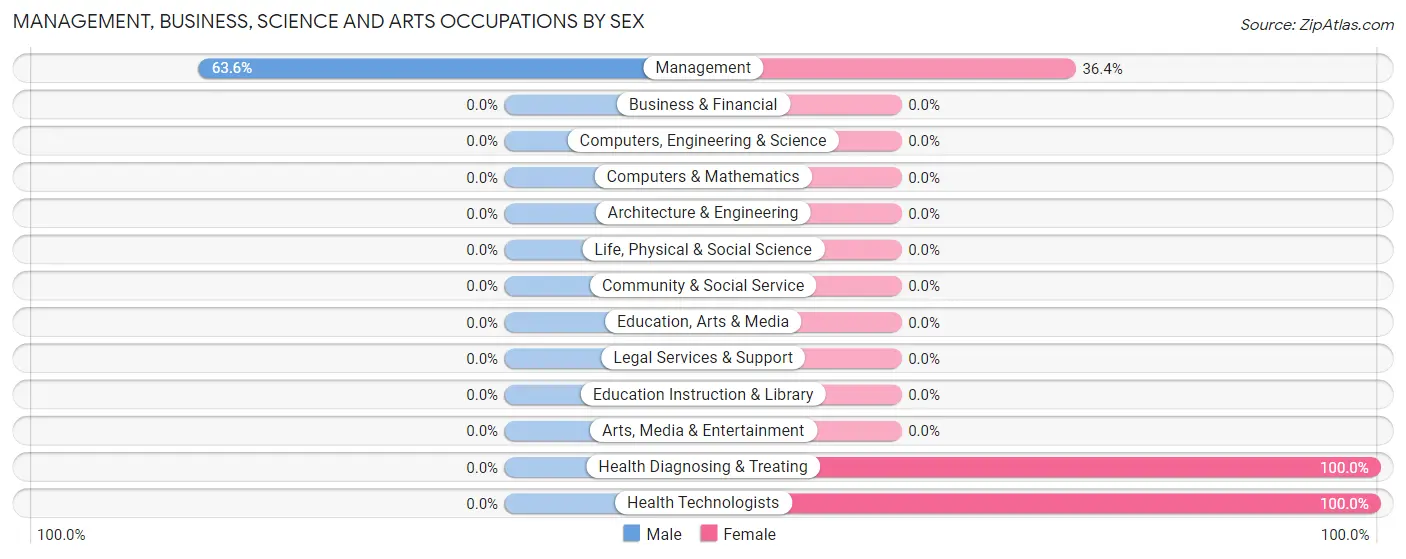
| Occupation | Male | Female |
| Management | 21 (63.6%) | 12 (36.4%) |
| Business & Financial | 0 (0.0%) | 0 (0.0%) |
| Computers, Engineering & Science | 0 (0.0%) | 0 (0.0%) |
| Computers & Mathematics | 0 (0.0%) | 0 (0.0%) |
| Architecture & Engineering | 0 (0.0%) | 0 (0.0%) |
| Life, Physical & Social Science | 0 (0.0%) | 0 (0.0%) |
| Community & Social Service | 0 (0.0%) | 0 (0.0%) |
| Education, Arts & Media | 0 (0.0%) | 0 (0.0%) |
| Legal Services & Support | 0 (0.0%) | 0 (0.0%) |
| Education Instruction & Library | 0 (0.0%) | 0 (0.0%) |
| Arts, Media & Entertainment | 0 (0.0%) | 0 (0.0%) |
| Health Diagnosing & Treating | 0 (0.0%) | 10 (100.0%) |
| Health Technologists | 0 (0.0%) | 6 (100.0%) |
| Total (Category) | 21 (48.8%) | 22 (51.2%) |
| Total (Overall) | 40 (58.8%) | 28 (41.2%) |
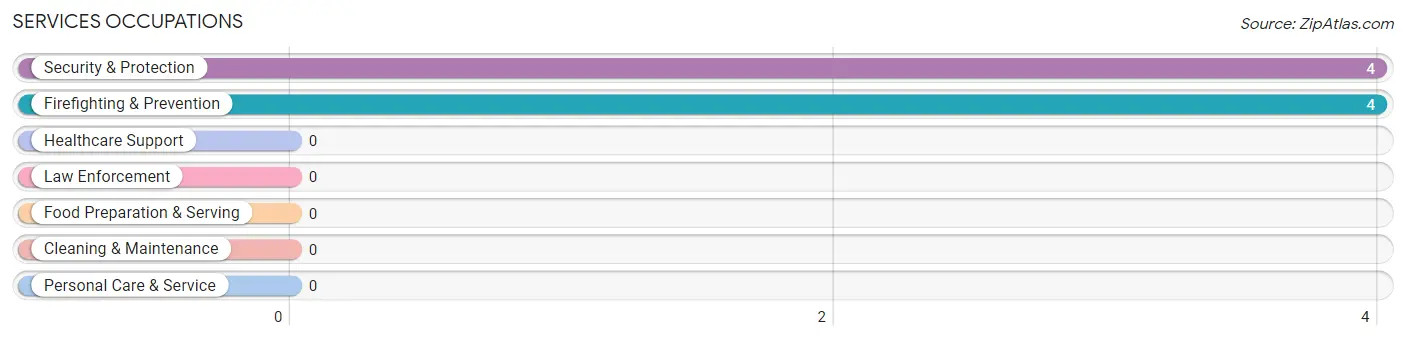
Services Occupations
The most common Services occupations in Ashland are Security & Protection (4 | 5.9%), and Firefighting & Prevention (4 | 5.9%).
Services Occupations by Sex
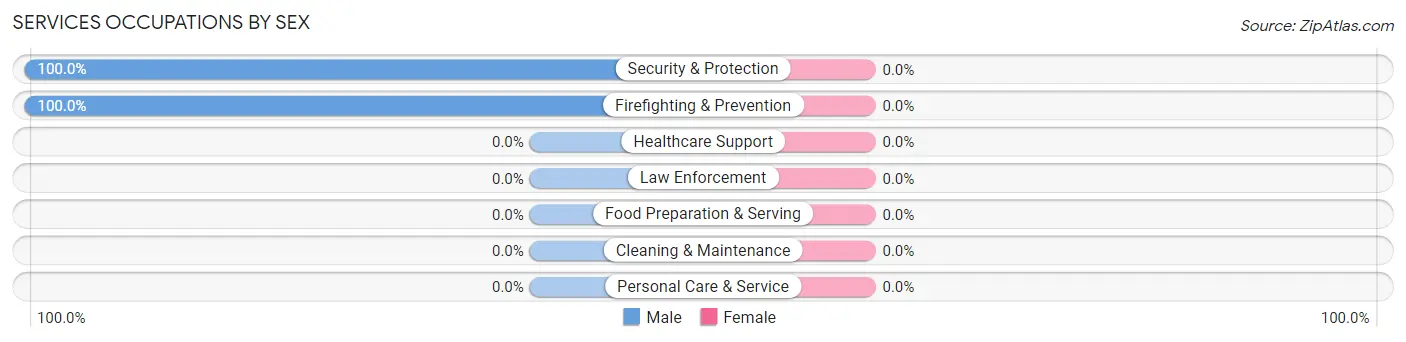
| Occupation | Male | Female |
| Healthcare Support | 0 (0.0%) | 0 (0.0%) |
| Security & Protection | 4 (100.0%) | 0 (0.0%) |
| Firefighting & Prevention | 4 (100.0%) | 0 (0.0%) |
| Law Enforcement | 0 (0.0%) | 0 (0.0%) |
| Food Preparation & Serving | 0 (0.0%) | 0 (0.0%) |
| Cleaning & Maintenance | 0 (0.0%) | 0 (0.0%) |
| Personal Care & Service | 0 (0.0%) | 0 (0.0%) |
| Total (Category) | 4 (100.0%) | 0 (0.0%) |
| Total (Overall) | 40 (58.8%) | 28 (41.2%) |
Sales and Office Occupations
The most common Sales and Office occupations in Ashland are , and Office & Administration (2 | 2.9%).
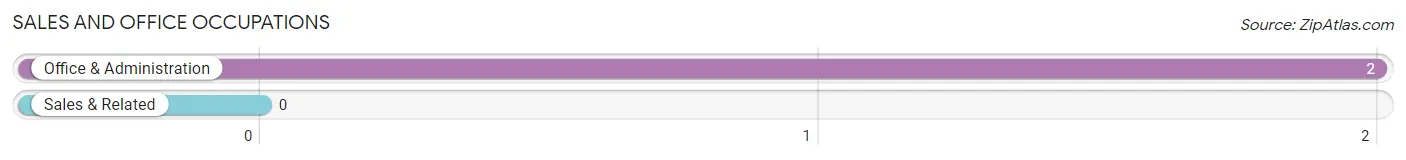
Sales and Office Occupations by Sex

| Occupation | Male | Female |
| Sales & Related | 0 (0.0%) | 0 (0.0%) |
| Office & Administration | 0 (0.0%) | 2 (100.0%) |
| Total (Category) | 0 (0.0%) | 2 (100.0%) |
| Total (Overall) | 40 (58.8%) | 28 (41.2%) |
Natural Resources, Construction and Maintenance Occupations
The most common Natural Resources, Construction and Maintenance occupations in Ashland are Construction & Extraction (3 | 4.4%), and Farming, Fishing & Forestry (2 | 2.9%).
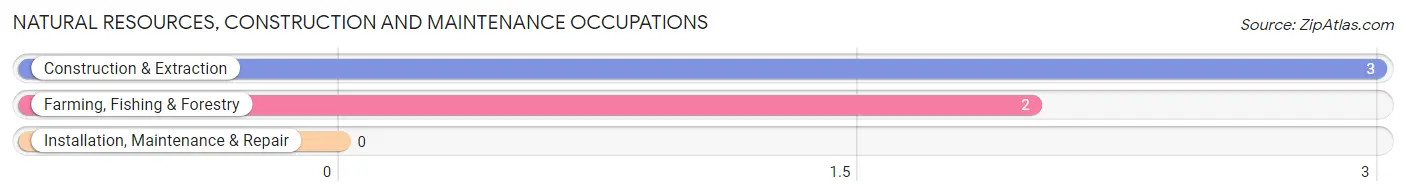
Natural Resources, Construction and Maintenance Occupations by Sex
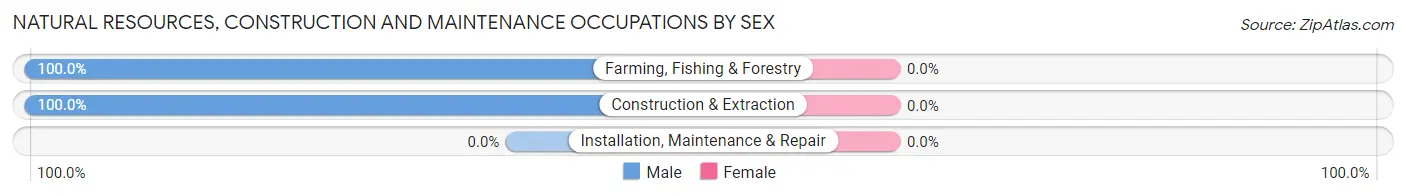
| Occupation | Male | Female |
| Farming, Fishing & Forestry | 2 (100.0%) | 0 (0.0%) |
| Construction & Extraction | 3 (100.0%) | 0 (0.0%) |
| Installation, Maintenance & Repair | 0 (0.0%) | 0 (0.0%) |
| Total (Category) | 5 (100.0%) | 0 (0.0%) |
| Total (Overall) | 40 (58.8%) | 28 (41.2%) |
Production, Transportation and Moving Occupations
The most common Production, Transportation and Moving occupations in Ashland are Transportation (10 | 14.7%), and Production (4 | 5.9%).
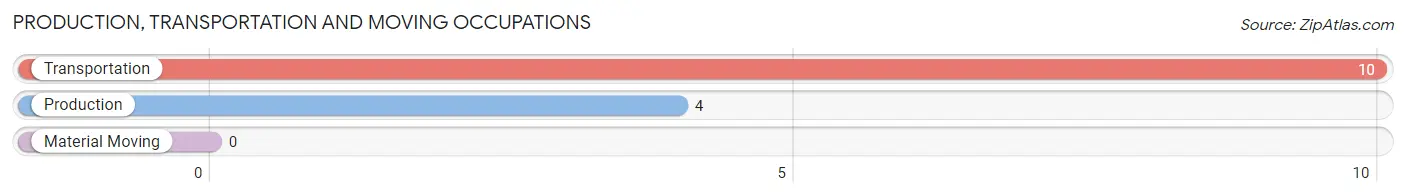
Production, Transportation and Moving Occupations by Sex
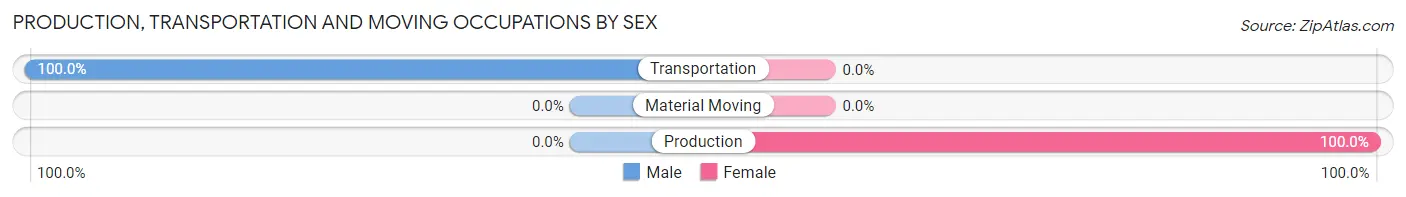
| Occupation | Male | Female |
| Production | 0 (0.0%) | 4 (100.0%) |
| Transportation | 10 (100.0%) | 0 (0.0%) |
| Material Moving | 0 (0.0%) | 0 (0.0%) |
| Total (Category) | 10 (71.4%) | 4 (28.6%) |
| Total (Overall) | 40 (58.8%) | 28 (41.2%) |
Employment Industries by Sex in Ashland
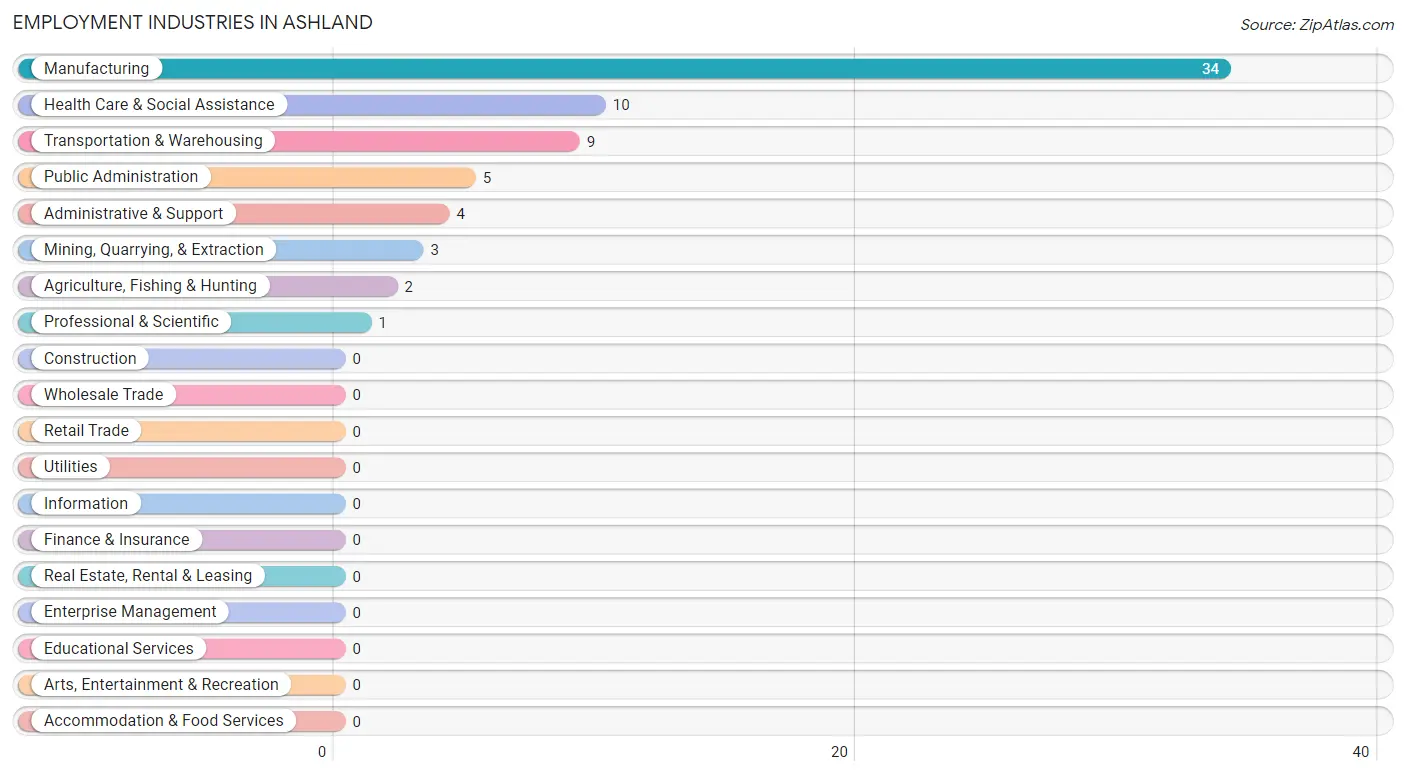
Employment Industries in Ashland
The major employment industries in Ashland include Manufacturing (34 | 50.0%), Health Care & Social Assistance (10 | 14.7%), Transportation & Warehousing (9 | 13.2%), Public Administration (5 | 7.3%), and Administrative & Support (4 | 5.9%).
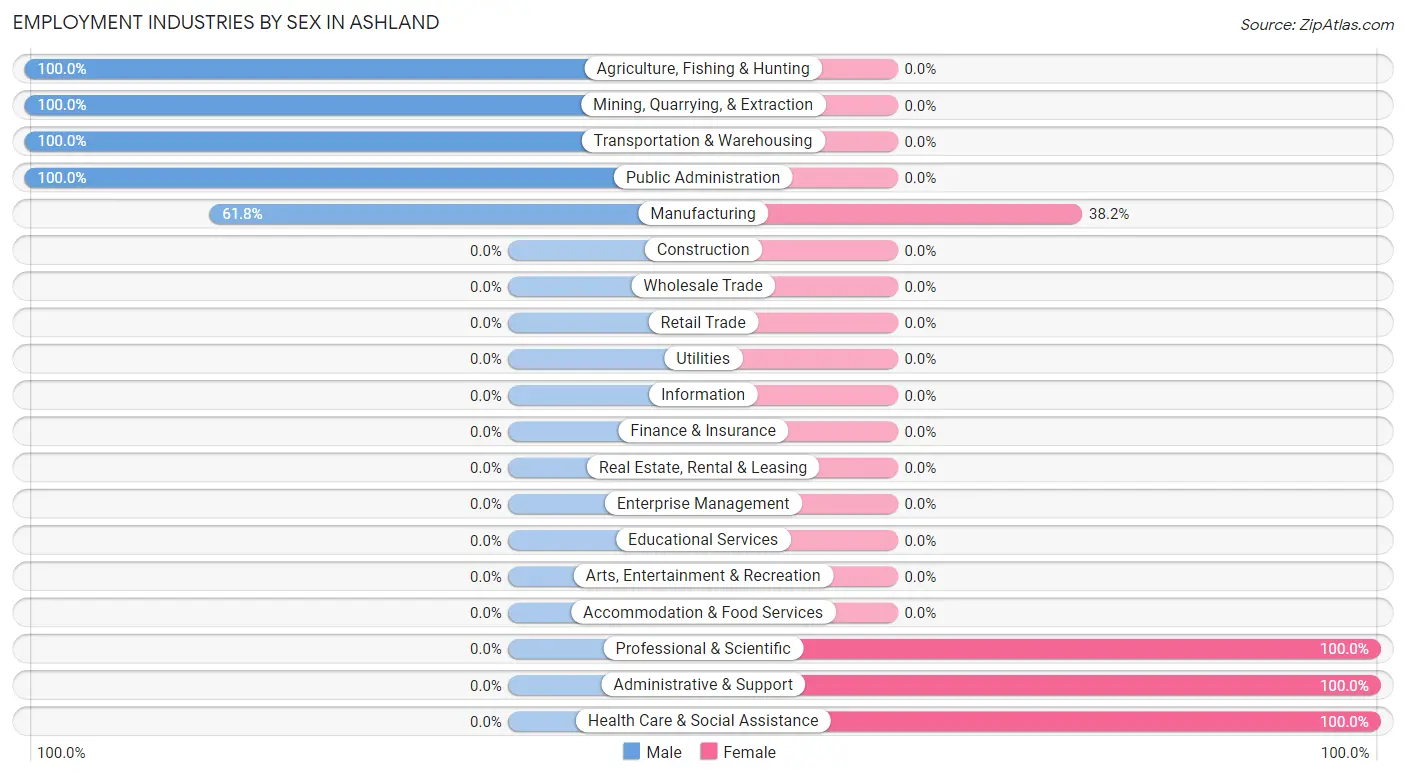
Employment Industries by Sex in Ashland
The Ashland industries that see more men than women are Agriculture, Fishing & Hunting (100.0%), Mining, Quarrying, & Extraction (100.0%), and Transportation & Warehousing (100.0%), whereas the industries that tend to have a higher number of women are Professional & Scientific (100.0%), Administrative & Support (100.0%), and Health Care & Social Assistance (100.0%).
| Industry | Male | Female |
| Agriculture, Fishing & Hunting | 2 (100.0%) | 0 (0.0%) |
| Mining, Quarrying, & Extraction | 3 (100.0%) | 0 (0.0%) |
| Construction | 0 (0.0%) | 0 (0.0%) |
| Manufacturing | 21 (61.8%) | 13 (38.2%) |
| Wholesale Trade | 0 (0.0%) | 0 (0.0%) |
| Retail Trade | 0 (0.0%) | 0 (0.0%) |
| Transportation & Warehousing | 9 (100.0%) | 0 (0.0%) |
| Utilities | 0 (0.0%) | 0 (0.0%) |
| Information | 0 (0.0%) | 0 (0.0%) |
| Finance & Insurance | 0 (0.0%) | 0 (0.0%) |
| Real Estate, Rental & Leasing | 0 (0.0%) | 0 (0.0%) |
| Professional & Scientific | 0 (0.0%) | 1 (100.0%) |
| Enterprise Management | 0 (0.0%) | 0 (0.0%) |
| Administrative & Support | 0 (0.0%) | 4 (100.0%) |
| Educational Services | 0 (0.0%) | 0 (0.0%) |
| Health Care & Social Assistance | 0 (0.0%) | 10 (100.0%) |
| Arts, Entertainment & Recreation | 0 (0.0%) | 0 (0.0%) |
| Accommodation & Food Services | 0 (0.0%) | 0 (0.0%) |
| Public Administration | 5 (100.0%) | 0 (0.0%) |
| Total | 40 (58.8%) | 28 (41.2%) |
Education in Ashland
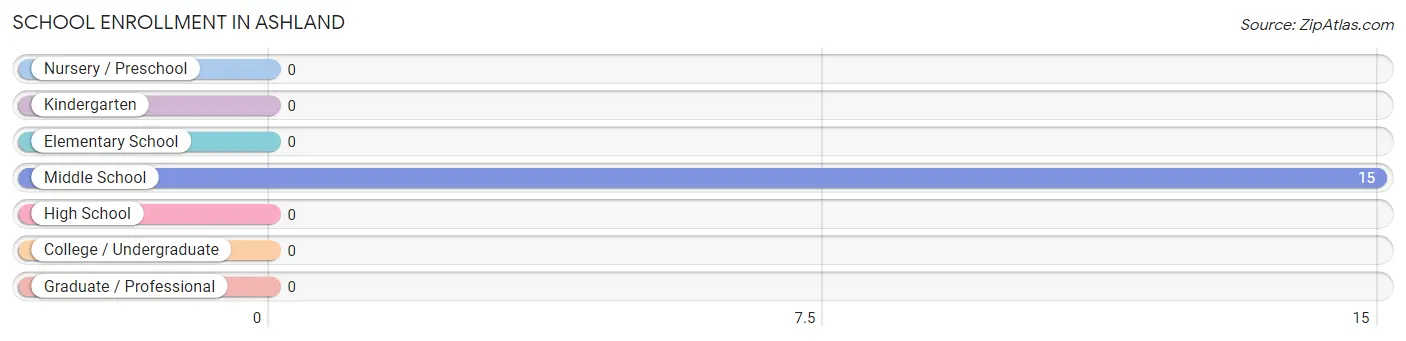
School Enrollment in Ashland
| School Level | # Students | % Students |
| Nursery / Preschool | 0 | 0.0% |
| Kindergarten | 0 | 0.0% |
| Elementary School | 0 | 0.0% |
| Middle School | 15 | 100.0% |
| High School | 0 | 0.0% |
| College / Undergraduate | 0 | 0.0% |
| Graduate / Professional | 0 | 0.0% |
| Total | 15 | 100.0% |
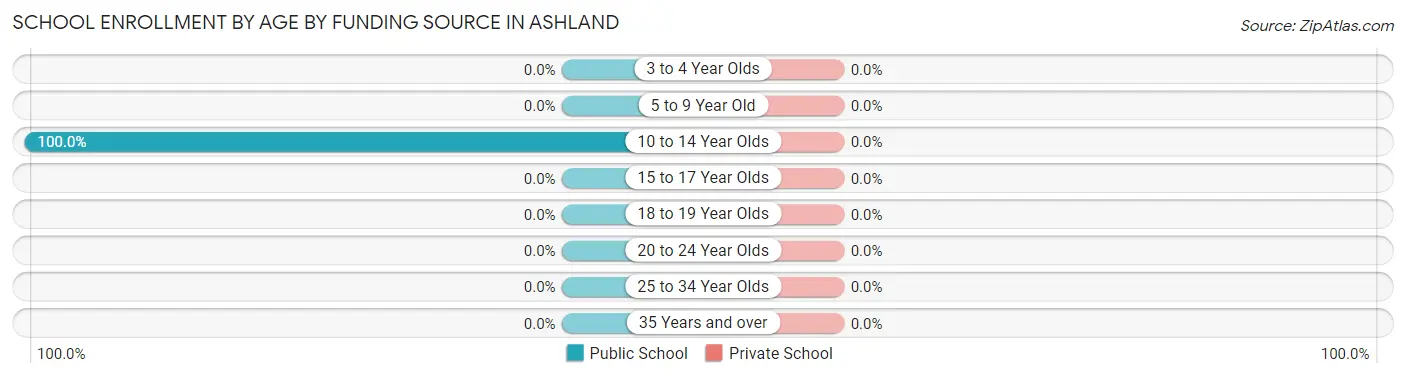
School Enrollment by Age by Funding Source in Ashland
| Age Bracket | Public School | Private School |
| 3 to 4 Year Olds | 0 (0.0%) | 0 (0.0%) |
| 5 to 9 Year Old | 0 (0.0%) | 0 (0.0%) |
| 10 to 14 Year Olds | 15 (100.0%) | 0 (0.0%) |
| 15 to 17 Year Olds | 0 (0.0%) | 0 (0.0%) |
| 18 to 19 Year Olds | 0 (0.0%) | 0 (0.0%) |
| 20 to 24 Year Olds | 0 (0.0%) | 0 (0.0%) |
| 25 to 34 Year Olds | 0 (0.0%) | 0 (0.0%) |
| 35 Years and over | 0 (0.0%) | 0 (0.0%) |
| Total | 15 (100.0%) | 0 (0.0%) |
Educational Attainment by Field of Study in Ashland
Education (16 | 57.1%), business (7 | 25.0%), engineering (4 | 14.3%), and physical & health sciences (1 | 3.6%) are the most common fields of study among 28 individuals in Ashland who have obtained a bachelor's degree or higher.
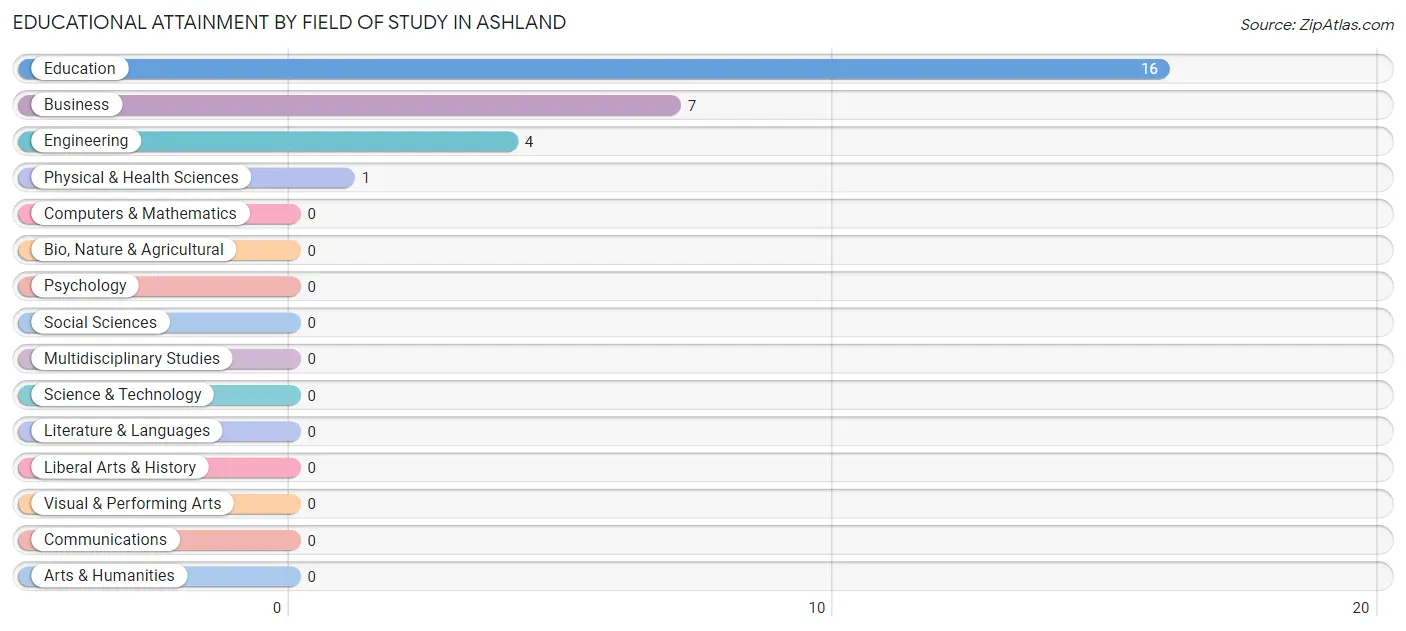
| Field of Study | # Graduates | % Graduates |
| Computers & Mathematics | 0 | 0.0% |
| Bio, Nature & Agricultural | 0 | 0.0% |
| Physical & Health Sciences | 1 | 3.6% |
| Psychology | 0 | 0.0% |
| Social Sciences | 0 | 0.0% |
| Engineering | 4 | 14.3% |
| Multidisciplinary Studies | 0 | 0.0% |
| Science & Technology | 0 | 0.0% |
| Business | 7 | 25.0% |
| Education | 16 | 57.1% |
| Literature & Languages | 0 | 0.0% |
| Liberal Arts & History | 0 | 0.0% |
| Visual & Performing Arts | 0 | 0.0% |
| Communications | 0 | 0.0% |
| Arts & Humanities | 0 | 0.0% |
| Total | 28 | 100.0% |
Transportation & Commute in Ashland
Vehicle Availability by Sex in Ashland
The most prevalent vehicle ownership categories in Ashland are males with 4 vehicles (22, accounting for 55.0%) and females with 4 vehicles (13, making up 78.6%).
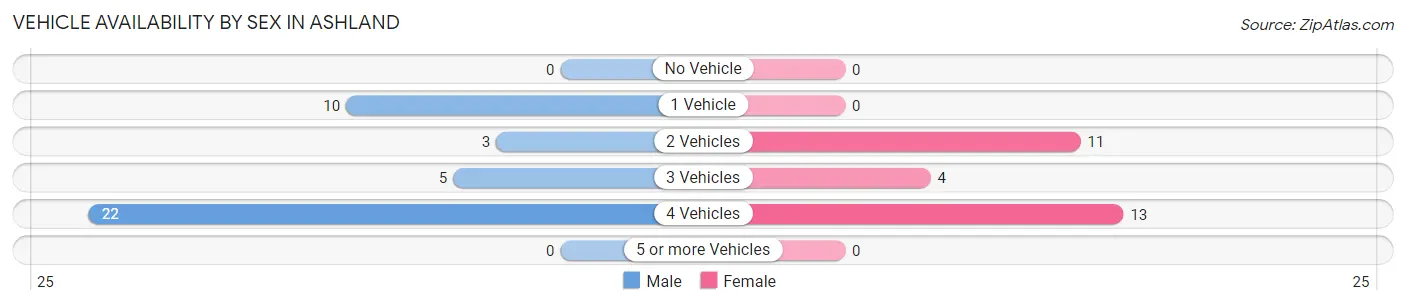
| Vehicles Available | Male | Female |
| No Vehicle | 0 (0.0%) | 0 (0.0%) |
| 1 Vehicle | 10 (25.0%) | 0 (0.0%) |
| 2 Vehicles | 3 (7.5%) | 11 (39.3%) |
| 3 Vehicles | 5 (12.5%) | 4 (14.3%) |
| 4 Vehicles | 22 (55.0%) | 13 (46.4%) |
| 5 or more Vehicles | 0 (0.0%) | 0 (0.0%) |
| Total | 40 (100.0%) | 28 (100.0%) |
Commute Time in Ashland
The most frequently occuring commute durations in Ashland are 90 or more minutes (33 commuters, 48.5%), 60 to 89 minutes (14 commuters, 20.6%), and 25 to 29 minutes (8 commuters, 11.8%).
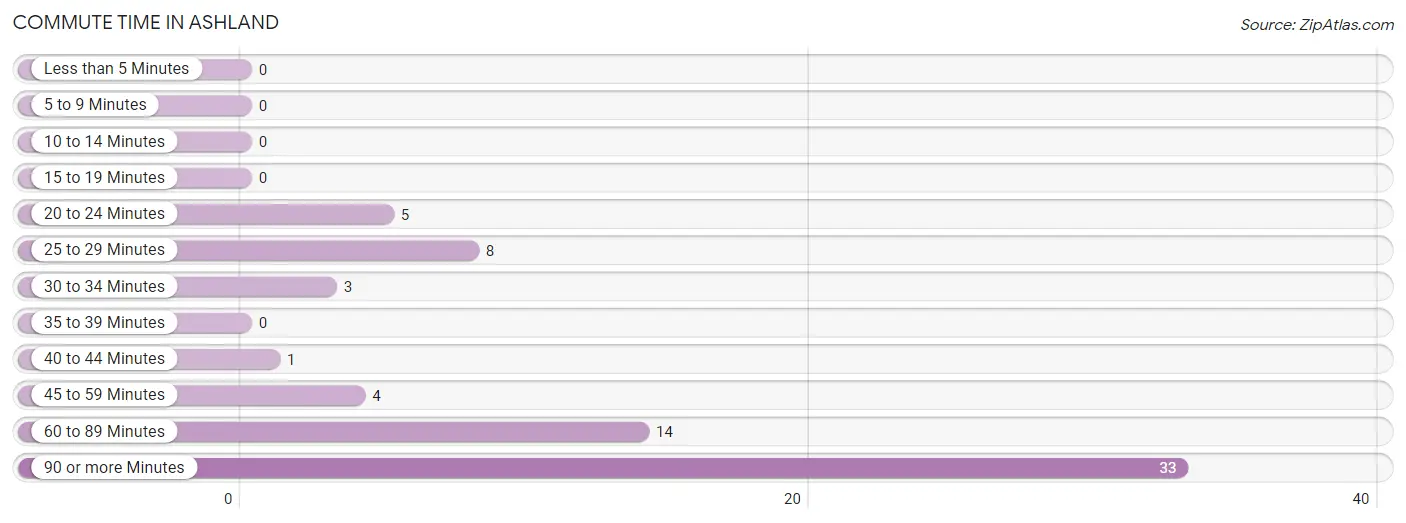
| Commute Time | # Commuters | % Commuters |
| Less than 5 Minutes | 0 | 0.0% |
| 5 to 9 Minutes | 0 | 0.0% |
| 10 to 14 Minutes | 0 | 0.0% |
| 15 to 19 Minutes | 0 | 0.0% |
| 20 to 24 Minutes | 5 | 7.3% |
| 25 to 29 Minutes | 8 | 11.8% |
| 30 to 34 Minutes | 3 | 4.4% |
| 35 to 39 Minutes | 0 | 0.0% |
| 40 to 44 Minutes | 1 | 1.5% |
| 45 to 59 Minutes | 4 | 5.9% |
| 60 to 89 Minutes | 14 | 20.6% |
| 90 or more Minutes | 33 | 48.5% |
Commute Time by Sex in Ashland
The most common commute times in Ashland are 90 or more minutes (21 commuters, 52.5%) for males and 90 or more minutes (12 commuters, 42.9%) for females.
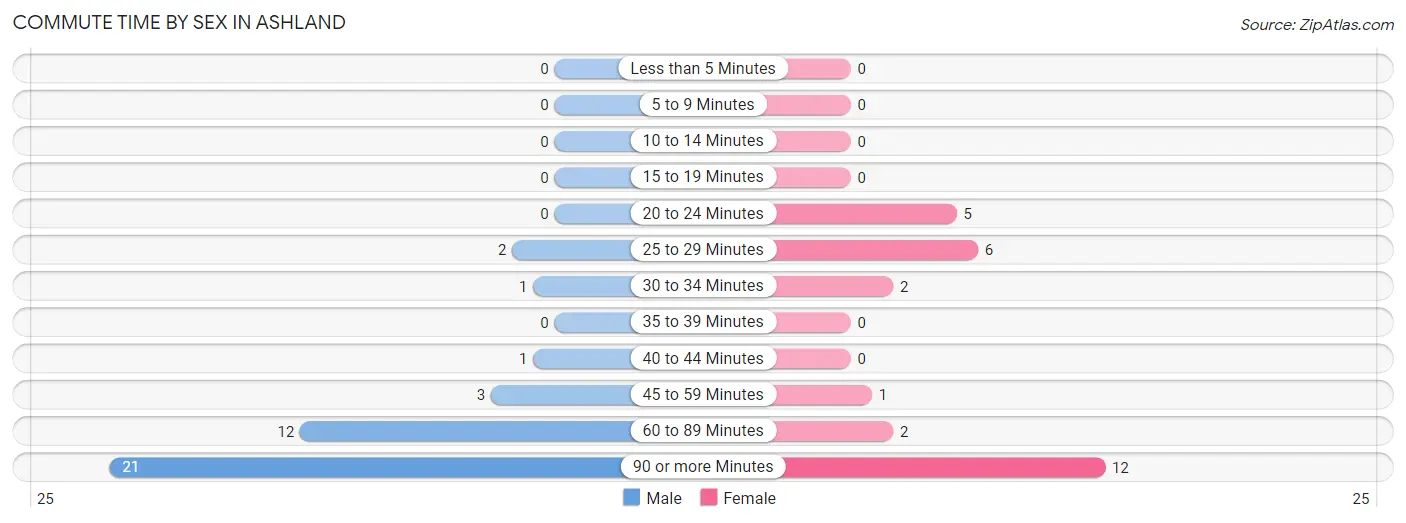
| Commute Time | Male | Female |
| Less than 5 Minutes | 0 (0.0%) | 0 (0.0%) |
| 5 to 9 Minutes | 0 (0.0%) | 0 (0.0%) |
| 10 to 14 Minutes | 0 (0.0%) | 0 (0.0%) |
| 15 to 19 Minutes | 0 (0.0%) | 0 (0.0%) |
| 20 to 24 Minutes | 0 (0.0%) | 5 (17.9%) |
| 25 to 29 Minutes | 2 (5.0%) | 6 (21.4%) |
| 30 to 34 Minutes | 1 (2.5%) | 2 (7.1%) |
| 35 to 39 Minutes | 0 (0.0%) | 0 (0.0%) |
| 40 to 44 Minutes | 1 (2.5%) | 0 (0.0%) |
| 45 to 59 Minutes | 3 (7.5%) | 1 (3.6%) |
| 60 to 89 Minutes | 12 (30.0%) | 2 (7.1%) |
| 90 or more Minutes | 21 (52.5%) | 12 (42.9%) |
Time of Departure to Work by Sex in Ashland
The most frequent times of departure to work in Ashland are 6:30 AM to 6:59 AM (22, 55.0%) for males and 7:30 AM to 7:59 AM (14, 50.0%) for females.
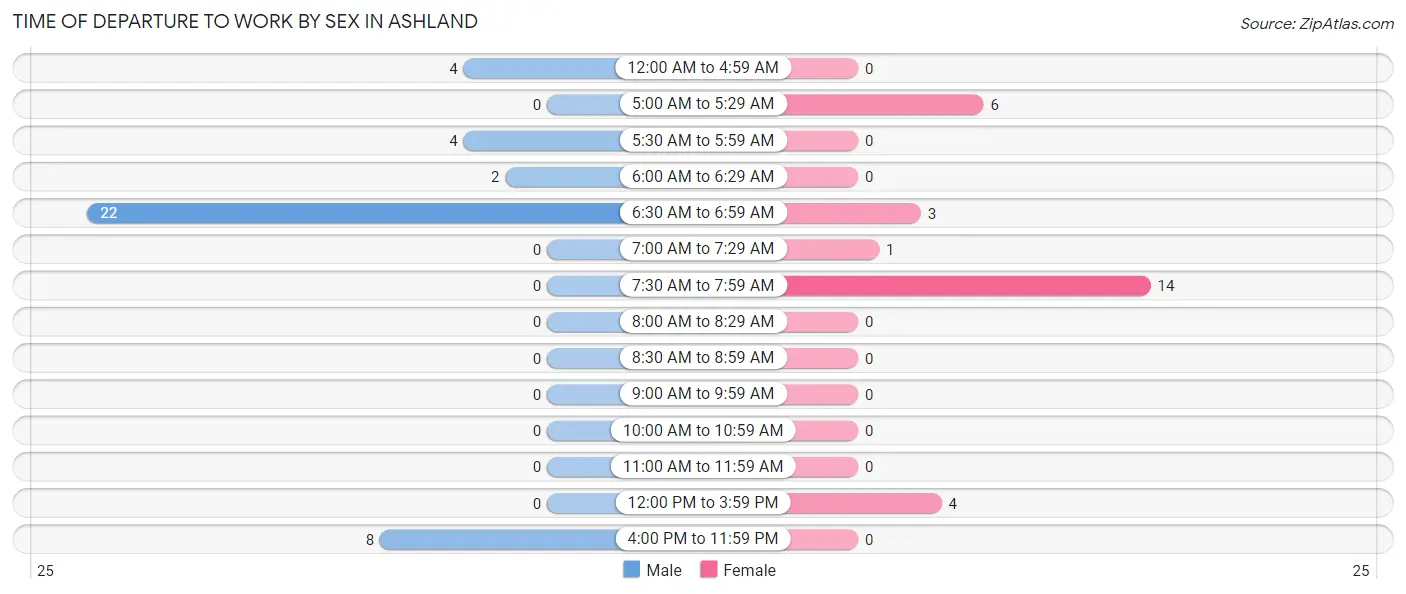
| Time of Departure | Male | Female |
| 12:00 AM to 4:59 AM | 4 (10.0%) | 0 (0.0%) |
| 5:00 AM to 5:29 AM | 0 (0.0%) | 6 (21.4%) |
| 5:30 AM to 5:59 AM | 4 (10.0%) | 0 (0.0%) |
| 6:00 AM to 6:29 AM | 2 (5.0%) | 0 (0.0%) |
| 6:30 AM to 6:59 AM | 22 (55.0%) | 3 (10.7%) |
| 7:00 AM to 7:29 AM | 0 (0.0%) | 1 (3.6%) |
| 7:30 AM to 7:59 AM | 0 (0.0%) | 14 (50.0%) |
| 8:00 AM to 8:29 AM | 0 (0.0%) | 0 (0.0%) |
| 8:30 AM to 8:59 AM | 0 (0.0%) | 0 (0.0%) |
| 9:00 AM to 9:59 AM | 0 (0.0%) | 0 (0.0%) |
| 10:00 AM to 10:59 AM | 0 (0.0%) | 0 (0.0%) |
| 11:00 AM to 11:59 AM | 0 (0.0%) | 0 (0.0%) |
| 12:00 PM to 3:59 PM | 0 (0.0%) | 4 (14.3%) |
| 4:00 PM to 11:59 PM | 8 (20.0%) | 0 (0.0%) |
| Total | 40 (100.0%) | 28 (100.0%) |
Housing Occupancy in Ashland
Occupancy by Ownership in Ashland
Of the total 89 dwellings in Ashland, owner-occupied units account for 51 (57.3%), while renter-occupied units make up 38 (42.7%).
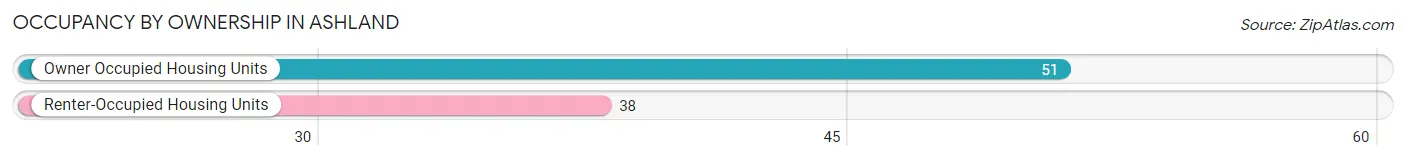
| Occupancy | # Housing Units | % Housing Units |
| Owner Occupied Housing Units | 51 | 57.3% |
| Renter-Occupied Housing Units | 38 | 42.7% |
| Total Occupied Housing Units | 89 | 100.0% |
Occupancy by Household Size in Ashland
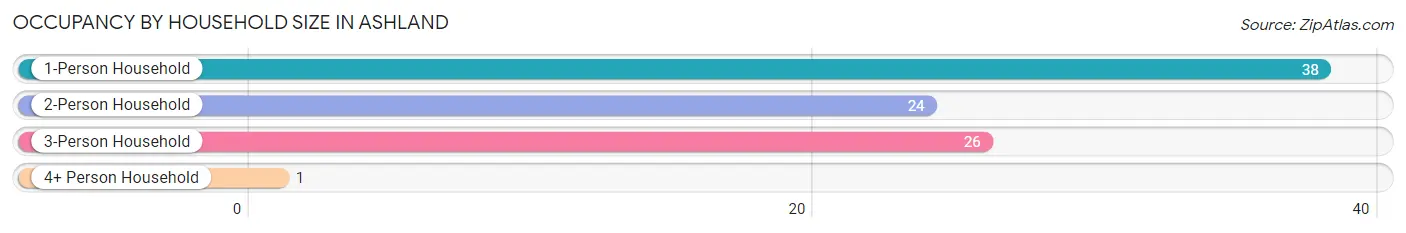
| Household Size | # Housing Units | % Housing Units |
| 1-Person Household | 38 | 42.7% |
| 2-Person Household | 24 | 27.0% |
| 3-Person Household | 26 | 29.2% |
| 4+ Person Household | 1 | 1.1% |
| Total Housing Units | 89 | 100.0% |
Occupancy by Ownership by Household Size in Ashland
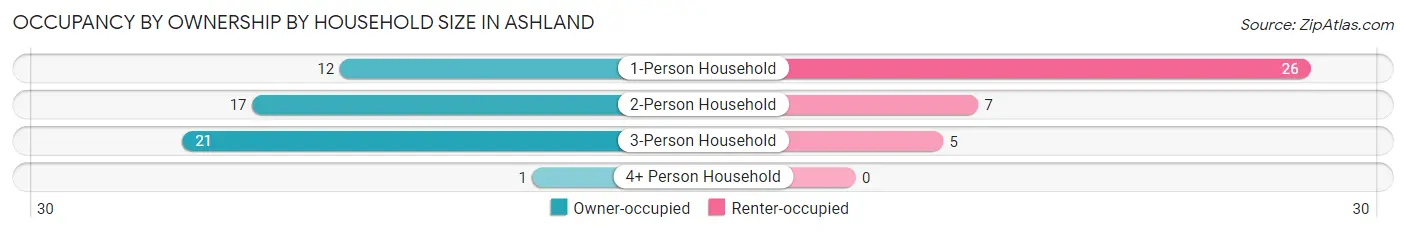
| Household Size | Owner-occupied | Renter-occupied |
| 1-Person Household | 12 (31.6%) | 26 (68.4%) |
| 2-Person Household | 17 (70.8%) | 7 (29.2%) |
| 3-Person Household | 21 (80.8%) | 5 (19.2%) |
| 4+ Person Household | 1 (100.0%) | 0 (0.0%) |
| Total Housing Units | 51 (57.3%) | 38 (42.7%) |
Occupancy by Educational Attainment in Ashland
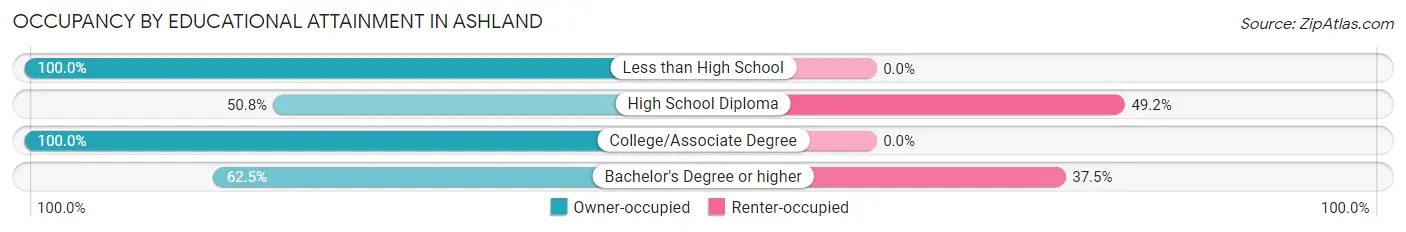
| Household Size | Owner-occupied | Renter-occupied |
| Less than High School | 1 (100.0%) | 0 (0.0%) |
| High School Diploma | 33 (50.8%) | 32 (49.2%) |
| College/Associate Degree | 7 (100.0%) | 0 (0.0%) |
| Bachelor's Degree or higher | 10 (62.5%) | 6 (37.5%) |
Occupancy by Age of Householder in Ashland
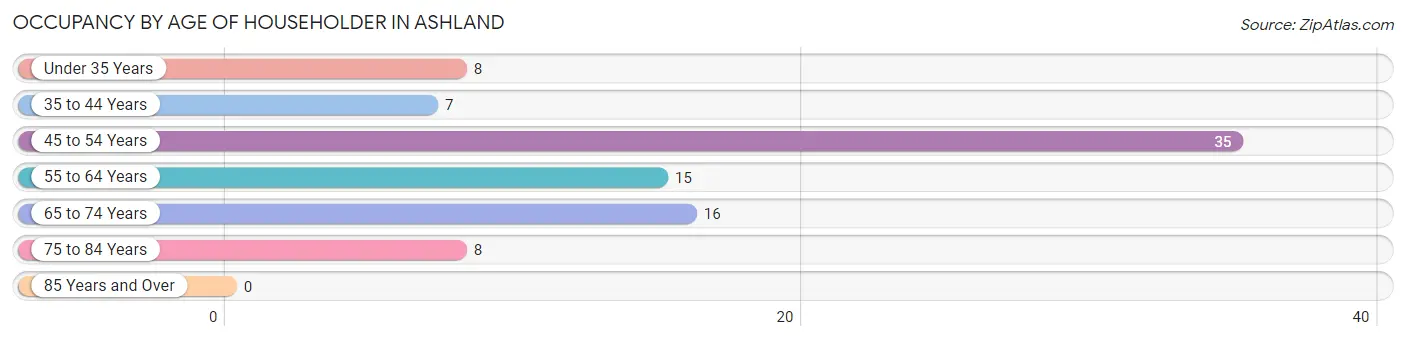
| Age Bracket | # Households | % Households |
| Under 35 Years | 8 | 9.0% |
| 35 to 44 Years | 7 | 7.9% |
| 45 to 54 Years | 35 | 39.3% |
| 55 to 64 Years | 15 | 16.9% |
| 65 to 74 Years | 16 | 18.0% |
| 75 to 84 Years | 8 | 9.0% |
| 85 Years and Over | 0 | 0.0% |
| Total | 89 | 100.0% |
Housing Finances in Ashland
Median Income by Occupancy in Ashland
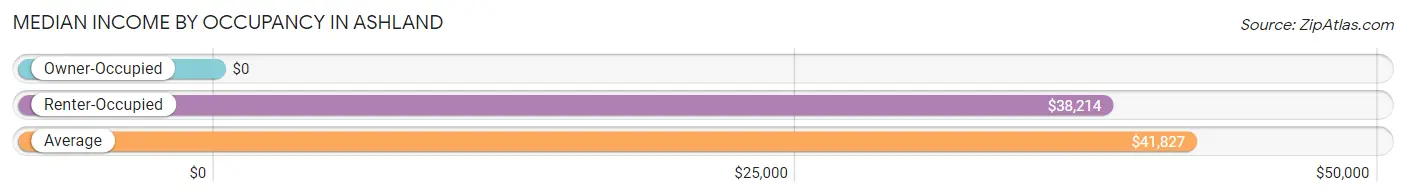
| Occupancy Type | # Households | Median Income |
| Owner-Occupied | 51 (57.3%) | $0 |
| Renter-Occupied | 38 (42.7%) | $38,214 |
| Average | 89 (100.0%) | $41,827 |
Occupancy by Householder Income Bracket in Ashland
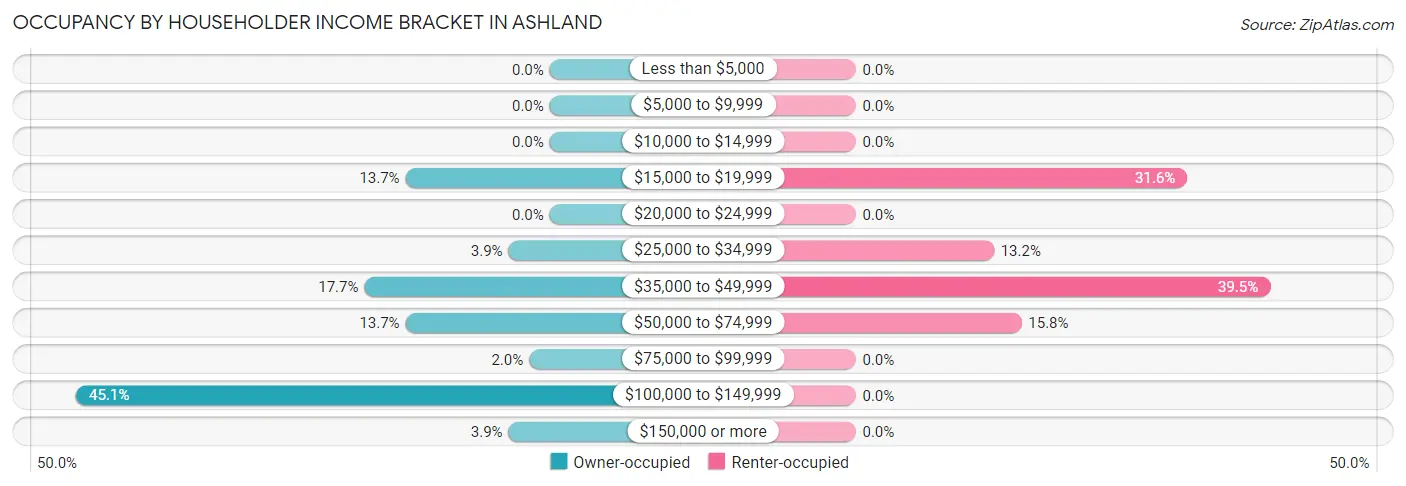
| Income Bracket | Owner-occupied | Renter-occupied |
| Less than $5,000 | 0 (0.0%) | 0 (0.0%) |
| $5,000 to $9,999 | 0 (0.0%) | 0 (0.0%) |
| $10,000 to $14,999 | 0 (0.0%) | 0 (0.0%) |
| $15,000 to $19,999 | 7 (13.7%) | 12 (31.6%) |
| $20,000 to $24,999 | 0 (0.0%) | 0 (0.0%) |
| $25,000 to $34,999 | 2 (3.9%) | 5 (13.2%) |
| $35,000 to $49,999 | 9 (17.6%) | 15 (39.5%) |
| $50,000 to $74,999 | 7 (13.7%) | 6 (15.8%) |
| $75,000 to $99,999 | 1 (2.0%) | 0 (0.0%) |
| $100,000 to $149,999 | 23 (45.1%) | 0 (0.0%) |
| $150,000 or more | 2 (3.9%) | 0 (0.0%) |
| Total | 51 (100.0%) | 38 (100.0%) |
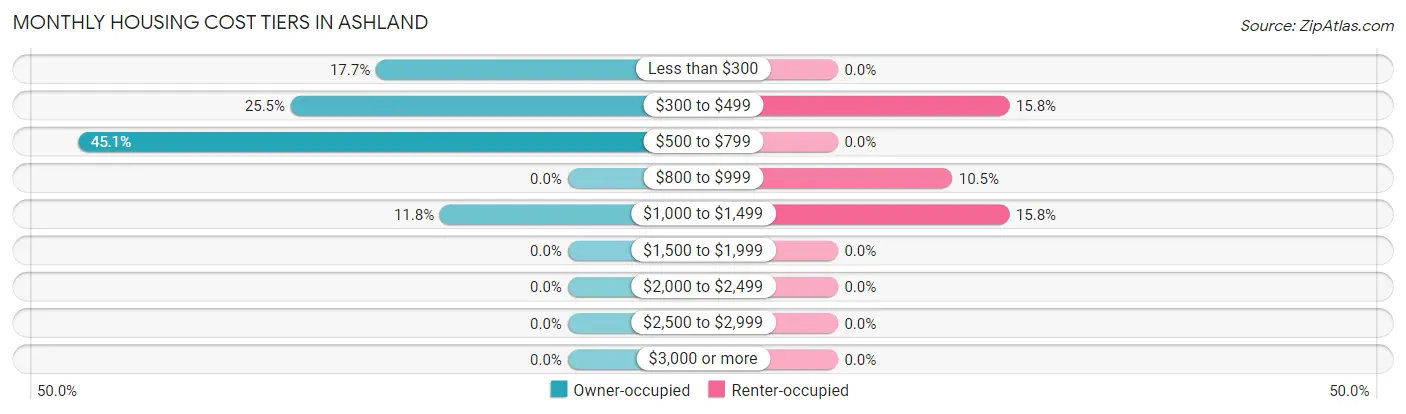
Monthly Housing Cost Tiers in Ashland
| Monthly Cost | Owner-occupied | Renter-occupied |
| Less than $300 | 9 (17.6%) | 0 (0.0%) |
| $300 to $499 | 13 (25.5%) | 6 (15.8%) |
| $500 to $799 | 23 (45.1%) | 0 (0.0%) |
| $800 to $999 | 0 (0.0%) | 4 (10.5%) |
| $1,000 to $1,499 | 6 (11.8%) | 6 (15.8%) |
| $1,500 to $1,999 | 0 (0.0%) | 0 (0.0%) |
| $2,000 to $2,499 | 0 (0.0%) | 0 (0.0%) |
| $2,500 to $2,999 | 0 (0.0%) | 0 (0.0%) |
| $3,000 or more | 0 (0.0%) | 0 (0.0%) |
| Total | 51 (100.0%) | 38 (100.0%) |
Physical Housing Characteristics in Ashland
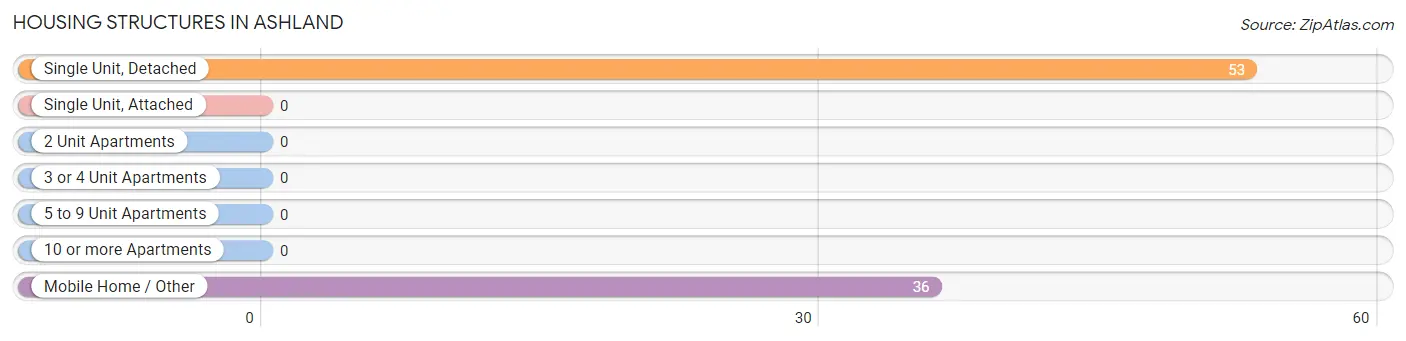
Housing Structures in Ashland
| Structure Type | # Housing Units | % Housing Units |
| Single Unit, Detached | 53 | 59.6% |
| Single Unit, Attached | 0 | 0.0% |
| 2 Unit Apartments | 0 | 0.0% |
| 3 or 4 Unit Apartments | 0 | 0.0% |
| 5 to 9 Unit Apartments | 0 | 0.0% |
| 10 or more Apartments | 0 | 0.0% |
| Mobile Home / Other | 36 | 40.5% |
| Total | 89 | 100.0% |
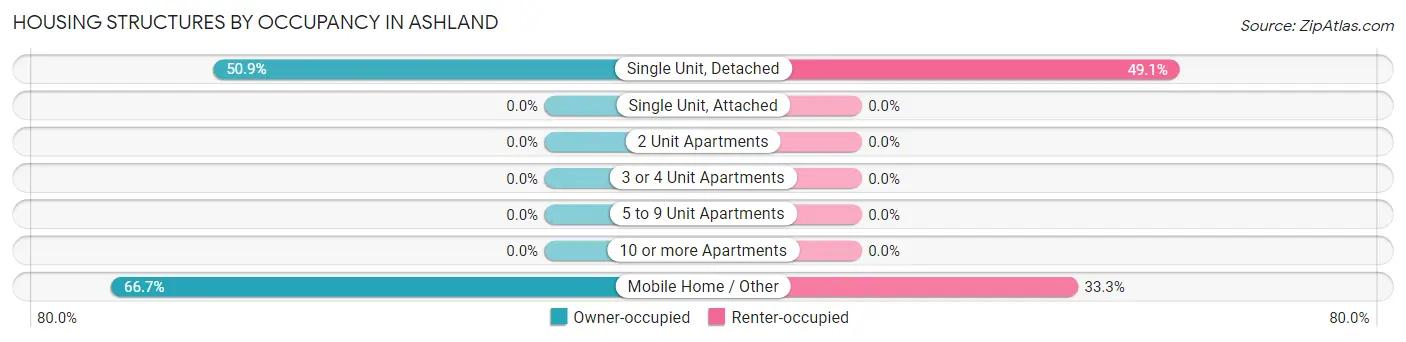
Housing Structures by Occupancy in Ashland
| Structure Type | Owner-occupied | Renter-occupied |
| Single Unit, Detached | 27 (50.9%) | 26 (49.1%) |
| Single Unit, Attached | 0 (0.0%) | 0 (0.0%) |
| 2 Unit Apartments | 0 (0.0%) | 0 (0.0%) |
| 3 or 4 Unit Apartments | 0 (0.0%) | 0 (0.0%) |
| 5 to 9 Unit Apartments | 0 (0.0%) | 0 (0.0%) |
| 10 or more Apartments | 0 (0.0%) | 0 (0.0%) |
| Mobile Home / Other | 24 (66.7%) | 12 (33.3%) |
| Total | 51 (57.3%) | 38 (42.7%) |
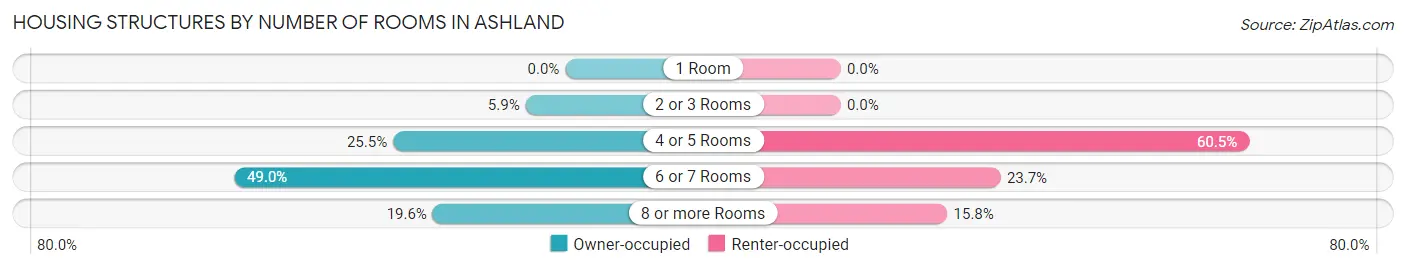
Housing Structures by Number of Rooms in Ashland
| Number of Rooms | Owner-occupied | Renter-occupied |
| 1 Room | 0 (0.0%) | 0 (0.0%) |
| 2 or 3 Rooms | 3 (5.9%) | 0 (0.0%) |
| 4 or 5 Rooms | 13 (25.5%) | 23 (60.5%) |
| 6 or 7 Rooms | 25 (49.0%) | 9 (23.7%) |
| 8 or more Rooms | 10 (19.6%) | 6 (15.8%) |
| Total | 51 (100.0%) | 38 (100.0%) |
Housing Structure by Heating Type in Ashland
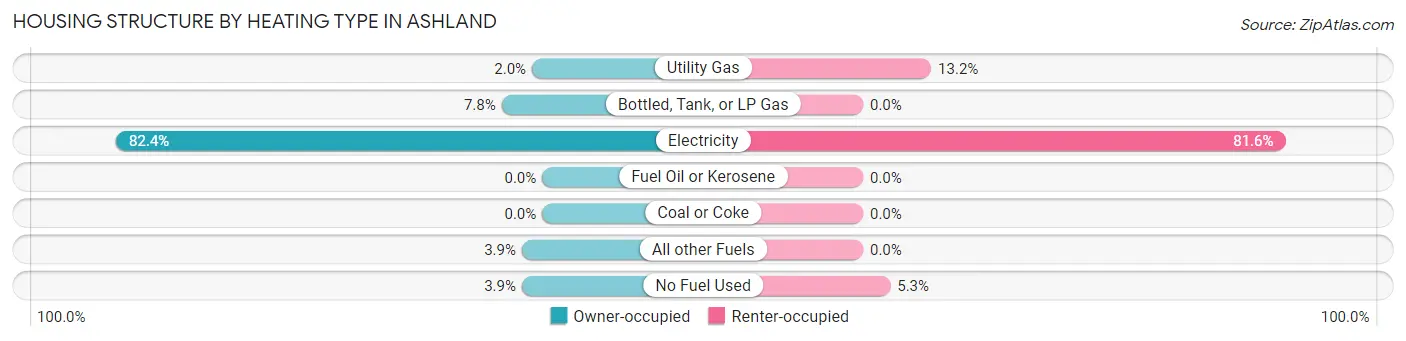
| Heating Type | Owner-occupied | Renter-occupied |
| Utility Gas | 1 (2.0%) | 5 (13.2%) |
| Bottled, Tank, or LP Gas | 4 (7.8%) | 0 (0.0%) |
| Electricity | 42 (82.4%) | 31 (81.6%) |
| Fuel Oil or Kerosene | 0 (0.0%) | 0 (0.0%) |
| Coal or Coke | 0 (0.0%) | 0 (0.0%) |
| All other Fuels | 2 (3.9%) | 0 (0.0%) |
| No Fuel Used | 2 (3.9%) | 2 (5.3%) |
| Total | 51 (100.0%) | 38 (100.0%) |
Household Vehicle Usage in Ashland
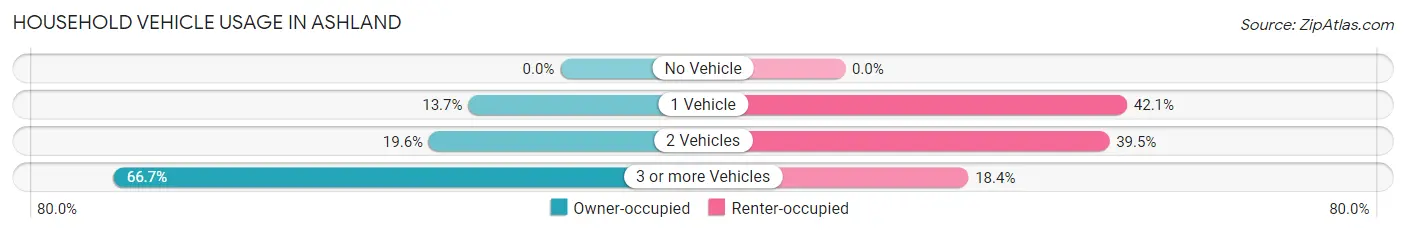
| Vehicles per Household | Owner-occupied | Renter-occupied |
| No Vehicle | 0 (0.0%) | 0 (0.0%) |
| 1 Vehicle | 7 (13.7%) | 16 (42.1%) |
| 2 Vehicles | 10 (19.6%) | 15 (39.5%) |
| 3 or more Vehicles | 34 (66.7%) | 7 (18.4%) |
| Total | 51 (100.0%) | 38 (100.0%) |
Real Estate & Mortgages in Ashland
Real Estate and Mortgage Overview in Ashland
| Characteristic | Without Mortgage | With Mortgage |
| Housing Units | 45 | 6 |
| Median Property Value | $115,100 | $156,300 |
| Median Household Income | $106,250 | $2 |
| Monthly Housing Costs | $525 | $0 |
| Real Estate Taxes | $829 | $2 |
Property Value by Mortgage Status in Ashland
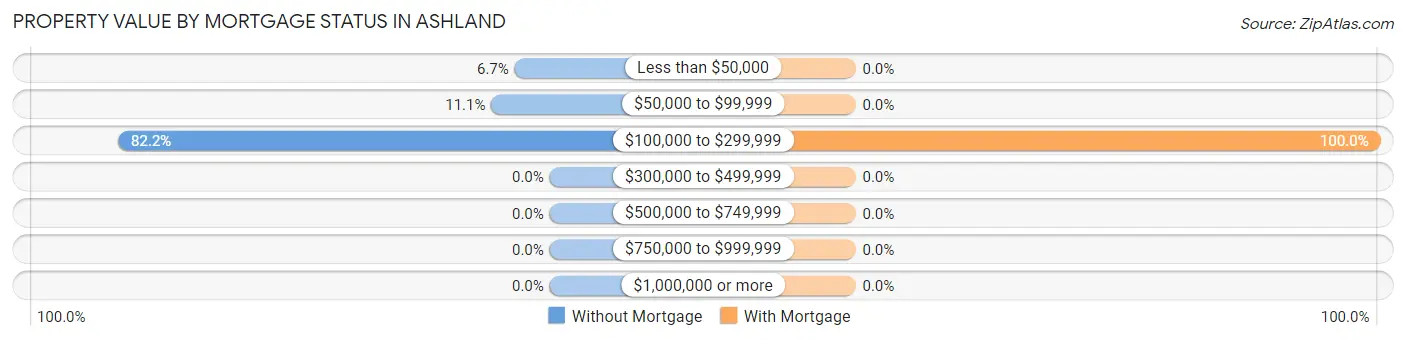
| Property Value | Without Mortgage | With Mortgage |
| Less than $50,000 | 3 (6.7%) | 0 (0.0%) |
| $50,000 to $99,999 | 5 (11.1%) | 0 (0.0%) |
| $100,000 to $299,999 | 37 (82.2%) | 6 (100.0%) |
| $300,000 to $499,999 | 0 (0.0%) | 0 (0.0%) |
| $500,000 to $749,999 | 0 (0.0%) | 0 (0.0%) |
| $750,000 to $999,999 | 0 (0.0%) | 0 (0.0%) |
| $1,000,000 or more | 0 (0.0%) | 0 (0.0%) |
| Total | 45 (100.0%) | 6 (100.0%) |
Household Income by Mortgage Status in Ashland
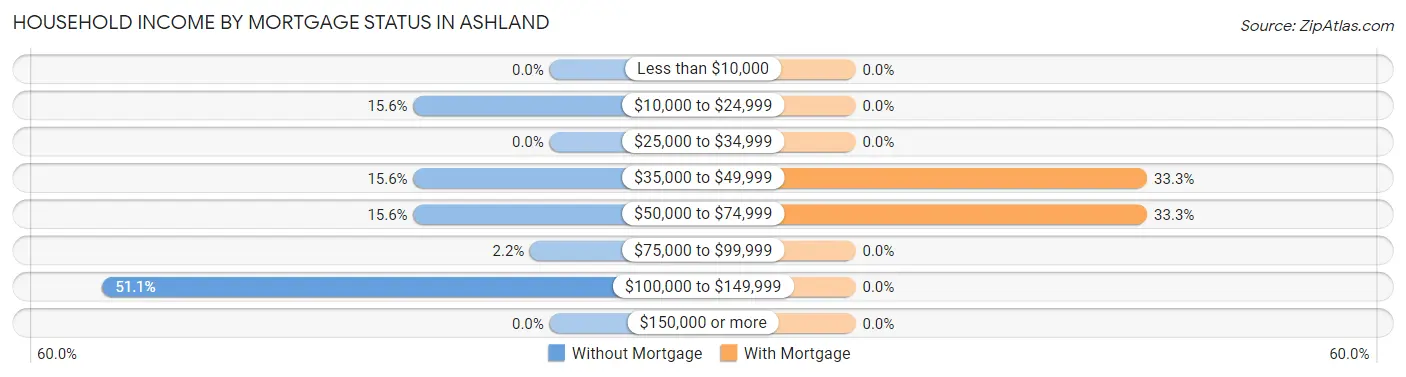
| Household Income | Without Mortgage | With Mortgage |
| Less than $10,000 | 0 (0.0%) | 0 (0.0%) |
| $10,000 to $24,999 | 7 (15.6%) | 0 (0.0%) |
| $25,000 to $34,999 | 0 (0.0%) | 0 (0.0%) |
| $35,000 to $49,999 | 7 (15.6%) | 2 (33.3%) |
| $50,000 to $74,999 | 7 (15.6%) | 2 (33.3%) |
| $75,000 to $99,999 | 1 (2.2%) | 0 (0.0%) |
| $100,000 to $149,999 | 23 (51.1%) | 0 (0.0%) |
| $150,000 or more | 0 (0.0%) | 0 (0.0%) |
| Total | 45 (100.0%) | 6 (100.0%) |
Property Value to Household Income Ratio in Ashland
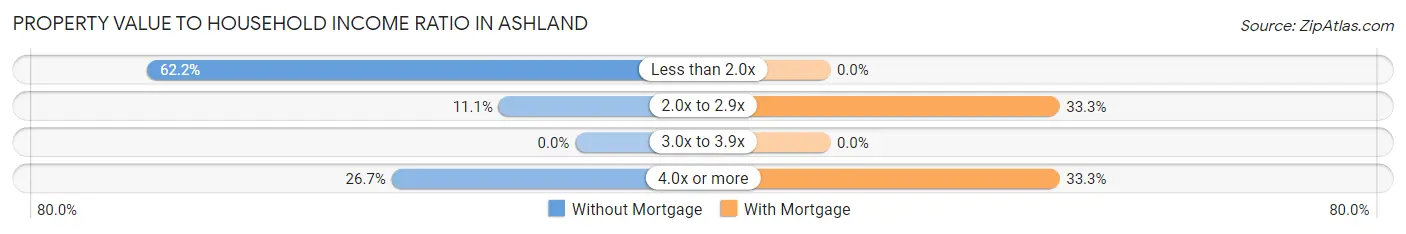
| Value-to-Income Ratio | Without Mortgage | With Mortgage |
| Less than 2.0x | 28 (62.2%) | 0 (0.0%) |
| 2.0x to 2.9x | 5 (11.1%) | 2 (33.3%) |
| 3.0x to 3.9x | 0 (0.0%) | 0 (0.0%) |
| 4.0x or more | 12 (26.7%) | 2 (33.3%) |
| Total | 45 (100.0%) | 6 (100.0%) |
Real Estate Taxes by Mortgage Status in Ashland
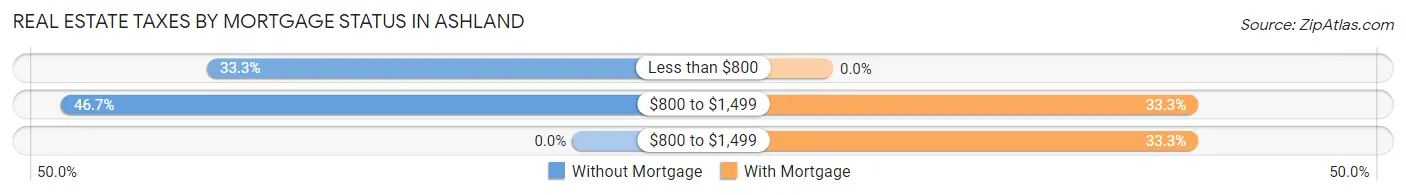
| Property Taxes | Without Mortgage | With Mortgage |
| Less than $800 | 15 (33.3%) | 0 (0.0%) |
| $800 to $1,499 | 21 (46.7%) | 2 (33.3%) |
| $800 to $1,499 | 0 (0.0%) | 2 (33.3%) |
| Total | 45 (100.0%) | 6 (100.0%) |
Health & Disability in Ashland
Health Insurance Coverage by Age in Ashland
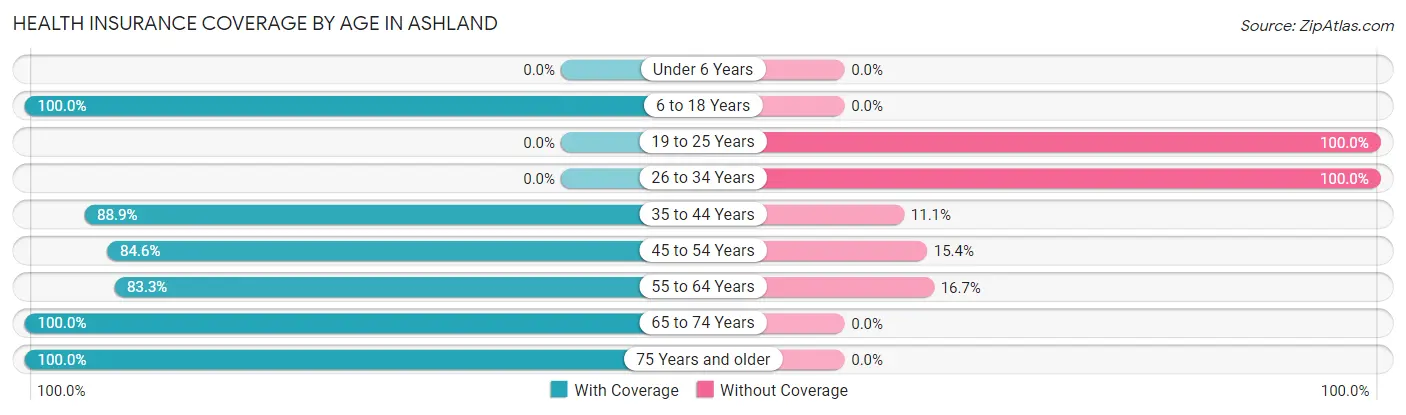
| Age Bracket | With Coverage | Without Coverage |
| Under 6 Years | 0 (0.0%) | 0 (0.0%) |
| 6 to 18 Years | 15 (100.0%) | 0 (0.0%) |
| 19 to 25 Years | 0 (0.0%) | 8 (100.0%) |
| 26 to 34 Years | 0 (0.0%) | 8 (100.0%) |
| 35 to 44 Years | 8 (88.9%) | 1 (11.1%) |
| 45 to 54 Years | 33 (84.6%) | 6 (15.4%) |
| 55 to 64 Years | 30 (83.3%) | 6 (16.7%) |
| 65 to 74 Years | 16 (100.0%) | 0 (0.0%) |
| 75 Years and older | 24 (100.0%) | 0 (0.0%) |
| Total | 126 (81.3%) | 29 (18.7%) |
Health Insurance Coverage by Citizenship Status in Ashland
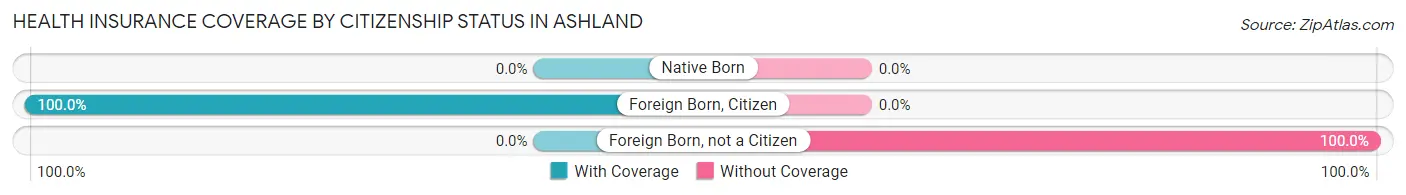
| Citizenship Status | With Coverage | Without Coverage |
| Native Born | 0 (0.0%) | 0 (0.0%) |
| Foreign Born, Citizen | 15 (100.0%) | 0 (0.0%) |
| Foreign Born, not a Citizen | 0 (0.0%) | 8 (100.0%) |
Health Insurance Coverage by Household Income in Ashland
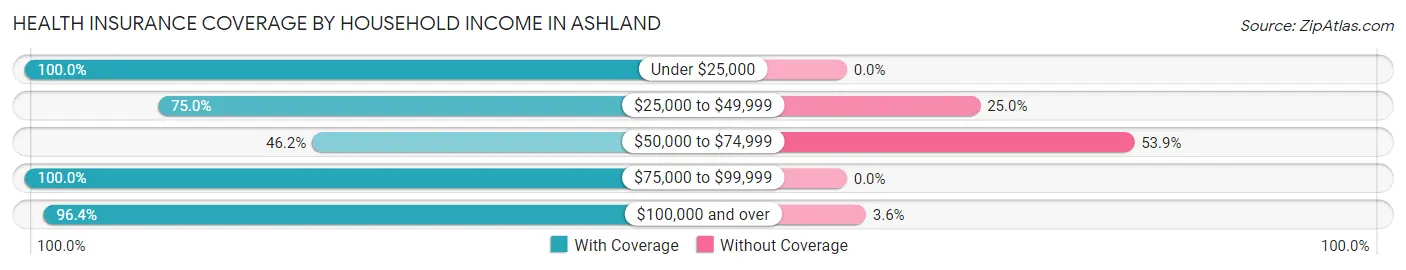
| Household Income | With Coverage | Without Coverage |
| Under $25,000 | 19 (100.0%) | 0 (0.0%) |
| $25,000 to $49,999 | 39 (75.0%) | 13 (25.0%) |
| $50,000 to $74,999 | 12 (46.2%) | 14 (53.8%) |
| $75,000 to $99,999 | 2 (100.0%) | 0 (0.0%) |
| $100,000 and over | 54 (96.4%) | 2 (3.6%) |
Public vs Private Health Insurance Coverage by Age in Ashland
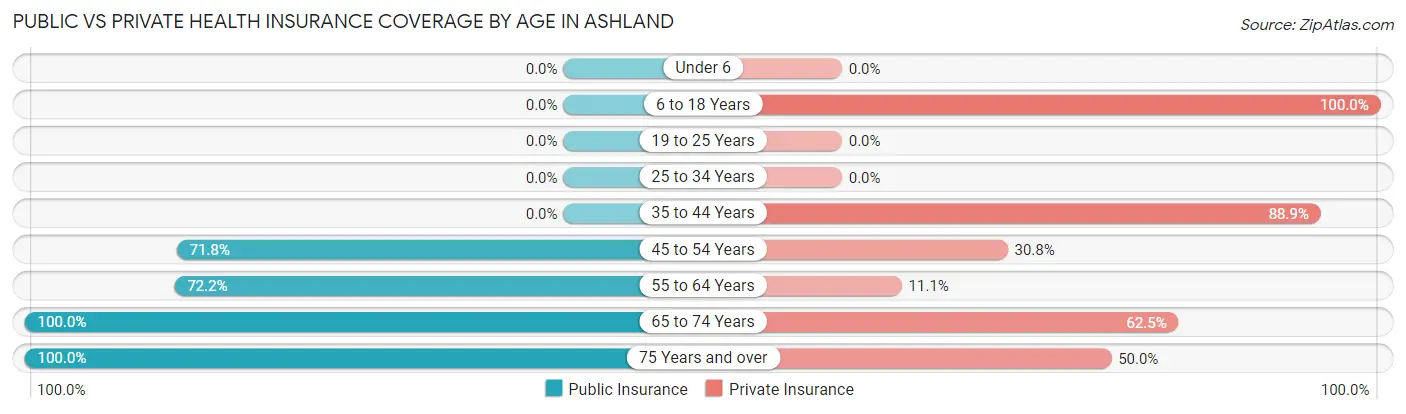
| Age Bracket | Public Insurance | Private Insurance |
| Under 6 | 0 (0.0%) | 0 (0.0%) |
| 6 to 18 Years | 0 (0.0%) | 15 (100.0%) |
| 19 to 25 Years | 0 (0.0%) | 0 (0.0%) |
| 25 to 34 Years | 0 (0.0%) | 0 (0.0%) |
| 35 to 44 Years | 0 (0.0%) | 8 (88.9%) |
| 45 to 54 Years | 28 (71.8%) | 12 (30.8%) |
| 55 to 64 Years | 26 (72.2%) | 4 (11.1%) |
| 65 to 74 Years | 16 (100.0%) | 10 (62.5%) |
| 75 Years and over | 24 (100.0%) | 12 (50.0%) |
| Total | 94 (60.7%) | 61 (39.4%) |
Disability Status by Sex by Age in Ashland
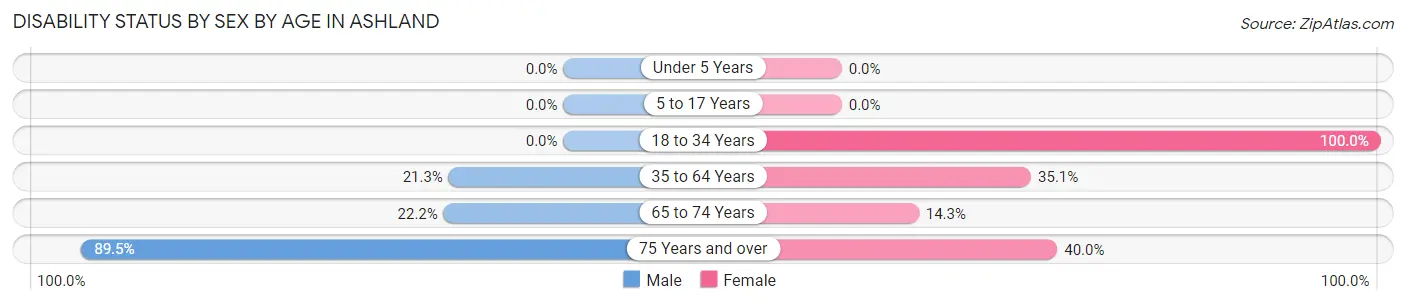
| Age Bracket | Male | Female |
| Under 5 Years | 0 (0.0%) | 0 (0.0%) |
| 5 to 17 Years | 0 (0.0%) | 0 (0.0%) |
| 18 to 34 Years | 0 (0.0%) | 4 (100.0%) |
| 35 to 64 Years | 10 (21.3%) | 13 (35.1%) |
| 65 to 74 Years | 2 (22.2%) | 1 (14.3%) |
| 75 Years and over | 17 (89.5%) | 2 (40.0%) |
Disability Class by Sex by Age in Ashland
Disability Class: Hearing Difficulty
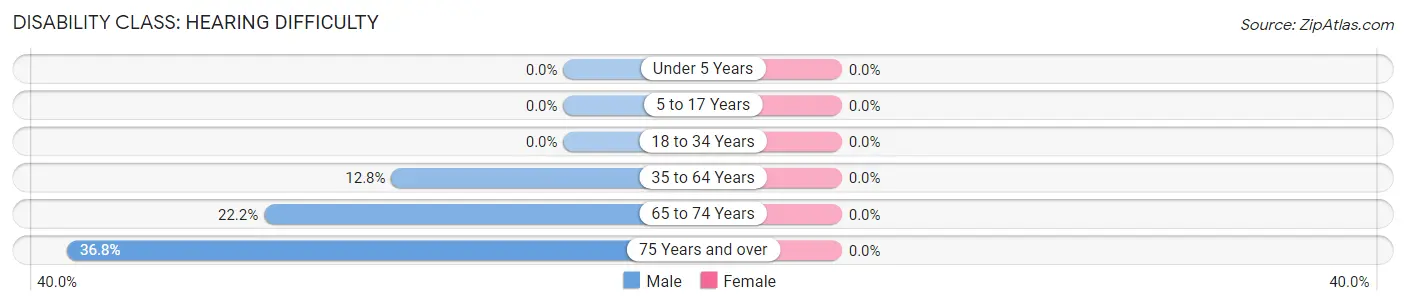
| Age Bracket | Male | Female |
| Under 5 Years | 0 (0.0%) | 0 (0.0%) |
| 5 to 17 Years | 0 (0.0%) | 0 (0.0%) |
| 18 to 34 Years | 0 (0.0%) | 0 (0.0%) |
| 35 to 64 Years | 6 (12.8%) | 0 (0.0%) |
| 65 to 74 Years | 2 (22.2%) | 0 (0.0%) |
| 75 Years and over | 7 (36.8%) | 0 (0.0%) |
Disability Class: Vision Difficulty
| Age Bracket | Male | Female |
| Under 5 Years | 0 (0.0%) | 0 (0.0%) |
| 5 to 17 Years | 0 (0.0%) | 0 (0.0%) |
| 18 to 34 Years | 0 (0.0%) | 0 (0.0%) |
| 35 to 64 Years | 0 (0.0%) | 0 (0.0%) |
| 65 to 74 Years | 0 (0.0%) | 0 (0.0%) |
| 75 Years and over | 0 (0.0%) | 0 (0.0%) |
Disability Class: Cognitive Difficulty
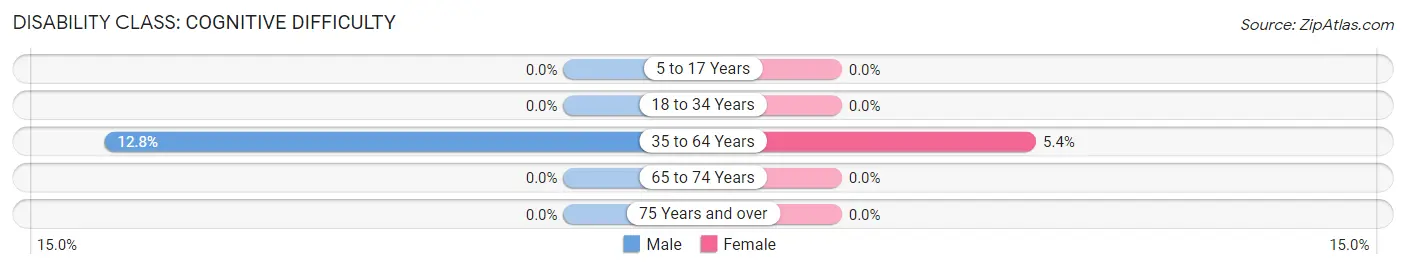
| Age Bracket | Male | Female |
| 5 to 17 Years | 0 (0.0%) | 0 (0.0%) |
| 18 to 34 Years | 0 (0.0%) | 0 (0.0%) |
| 35 to 64 Years | 6 (12.8%) | 2 (5.4%) |
| 65 to 74 Years | 0 (0.0%) | 0 (0.0%) |
| 75 Years and over | 0 (0.0%) | 0 (0.0%) |
Disability Class: Ambulatory Difficulty
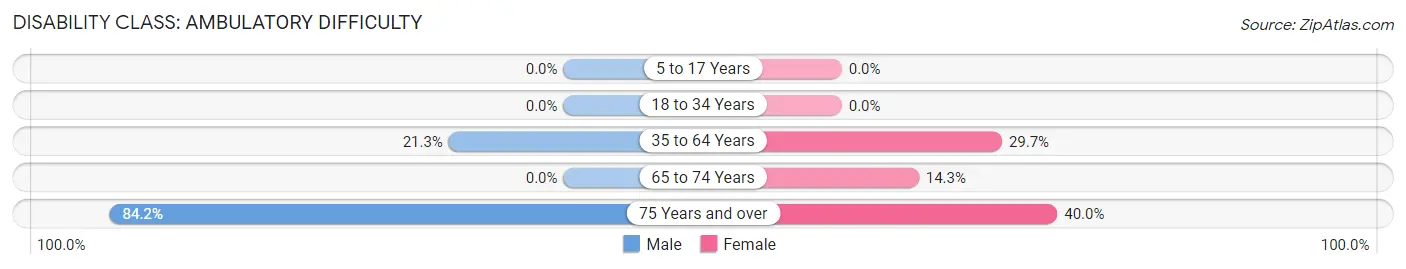
| Age Bracket | Male | Female |
| 5 to 17 Years | 0 (0.0%) | 0 (0.0%) |
| 18 to 34 Years | 0 (0.0%) | 0 (0.0%) |
| 35 to 64 Years | 10 (21.3%) | 11 (29.7%) |
| 65 to 74 Years | 0 (0.0%) | 1 (14.3%) |
| 75 Years and over | 16 (84.2%) | 2 (40.0%) |
Disability Class: Self-Care Difficulty
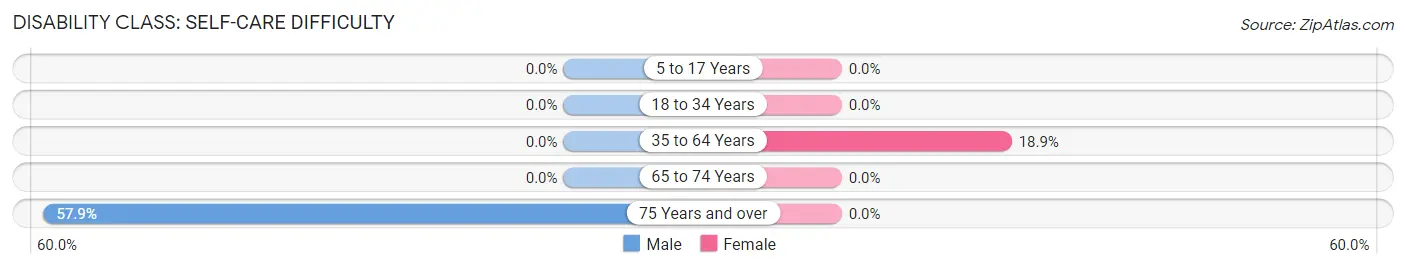
| Age Bracket | Male | Female |
| 5 to 17 Years | 0 (0.0%) | 0 (0.0%) |
| 18 to 34 Years | 0 (0.0%) | 0 (0.0%) |
| 35 to 64 Years | 0 (0.0%) | 7 (18.9%) |
| 65 to 74 Years | 0 (0.0%) | 0 (0.0%) |
| 75 Years and over | 11 (57.9%) | 0 (0.0%) |
Technology Access in Ashland
Computing Device Access in Ashland
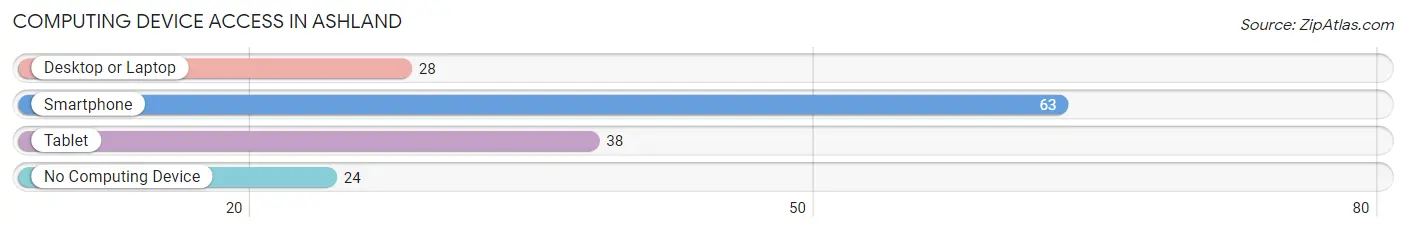
| Device Type | # Households | % Households |
| Desktop or Laptop | 28 | 31.5% |
| Smartphone | 63 | 70.8% |
| Tablet | 38 | 42.7% |
| No Computing Device | 24 | 27.0% |
| Total | 89 | 100.0% |
Internet Access in Ashland
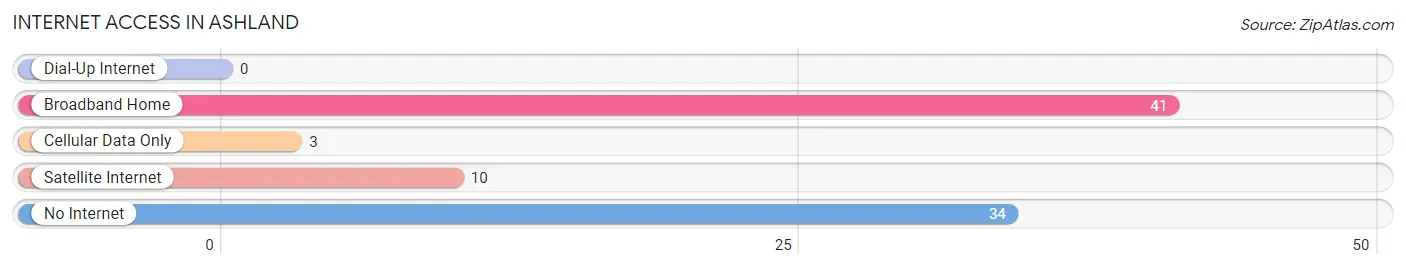
| Internet Type | # Households | % Households |
| Dial-Up Internet | 0 | 0.0% |
| Broadband Home | 41 | 46.1% |
| Cellular Data Only | 3 | 3.4% |
| Satellite Internet | 10 | 11.2% |
| No Internet | 34 | 38.2% |
| Total | 89 | 100.0% |
Ashland Summary
Ashland is a small town located in the state of Louisiana, in the United States. It is situated in the northern part of the state, in the parish of Natchitoches. The town has a population of approximately 1,000 people, and is located in a rural area.
History
The town of Ashland was founded in 1845 by a group of settlers from the nearby town of Natchitoches. The settlers were looking for a place to settle and start a new life, and they chose the area around Ashland because of its fertile soil and abundant natural resources. The town was named after the nearby Ashland Plantation, which was owned by the family of one of the settlers.
The town grew slowly over the years, and by the early 1900s it had become a thriving agricultural community. The town was home to several cotton plantations, as well as a number of small businesses. The town also had a school, a post office, and a few churches.
In the 1950s, the town began to decline as the cotton industry in the area began to decline. Many of the town’s residents moved away in search of better opportunities elsewhere. By the 1970s, the town had become a virtual ghost town, with only a few hundred people living in the area.
In the late 1980s, the town began to experience a resurgence as people began to move back to the area. The town has since become a popular tourist destination, with many people visiting the area to enjoy the natural beauty of the area.
Geography
Ashland is located in the northern part of Louisiana, in the parish of Natchitoches. The town is situated in a rural area, and is surrounded by rolling hills and forests. The town is located near the Red River, which provides a source of water for the area.
The town is located approximately 30 miles from the city of Natchitoches, and is about an hour’s drive from the state capital of Baton Rouge. The town is also located close to the Sabine National Forest, which provides a variety of outdoor activities for visitors.
Economy
The economy of Ashland is largely based on agriculture and tourism. The town is home to several cotton plantations, as well as a number of small businesses. The town also has a few restaurants and shops, which cater to the needs of the local population.
The town is also a popular tourist destination, with many people visiting the area to enjoy the natural beauty of the area. The town is home to several festivals and events throughout the year, which attract visitors from all over the state.
Demographics
As of the 2010 census, the population of Ashland was 1,000 people. The town is predominantly white, with approximately 90% of the population being white. The remaining 10% of the population is made up of African Americans, Hispanics, and other ethnicities.
The median household income in Ashland is approximately $30,000, which is slightly lower than the national average. The town has a poverty rate of approximately 20%, which is slightly higher than the national average. The town also has a high unemployment rate, with approximately 10% of the population being unemployed.
Common Questions
What is Per Capita Income in Ashland?
Per Capita income in Ashland is $33,659.
What is the Median Household income in Ashland?
Median Household Income in Ashland is $41,827.
What is Income or Wage Gap in Ashland?
Income or Wage Gap in Ashland is 15.9%.
Women in Ashland earn 84.1 cents for every dollar earned by a man.
What is Inequality or Gini Index in Ashland?
Inequality or Gini Index in Ashland is 0.40.
What is the Total Population of Ashland?
Total Population of Ashland is 155.
What is the Total Male Population of Ashland?
Total Male Population of Ashland is 87.
What is the Total Female Population of Ashland?
Total Female Population of Ashland is 68.
What is the Ratio of Males per 100 Females in Ashland?
There are 127.94 Males per 100 Females in Ashland.
What is the Ratio of Females per 100 Males in Ashland?
There are 78.16 Females per 100 Males in Ashland.
What is the Median Population Age in Ashland?
Median Population Age in Ashland is 54.9 Years.
What is the Average Family Size in Ashland
Average Family Size in Ashland is 2.2 People.
What is the Average Household Size in Ashland
Average Household Size in Ashland is 1.7 People.
How Large is the Labor Force in Ashland?
There are 72 People in the Labor Forcein in Ashland.
What is the Percentage of People in the Labor Force in Ashland?
51.4% of People are in the Labor Force in Ashland.
What is the Unemployment Rate in Ashland?
Unemployment Rate in Ashland is 5.6%.