Norco, LA Map & Demographics
Norco Map
Norco Overview
$45,074
PER CAPITA INCOME
$83,897
AVG FAMILY INCOME
$70,492
AVG HOUSEHOLD INCOME
58.5%
WAGE / INCOME GAP [ % ]
41.5¢/ $1
WAGE / INCOME GAP [ $ ]
0.45
INEQUALITY / GINI INDEX
2,848
TOTAL POPULATION
1,456
MALE POPULATION
1,392
FEMALE POPULATION
104.60
MALES / 100 FEMALES
95.60
FEMALES / 100 MALES
39.2
MEDIAN AGE
2.7
AVG FAMILY SIZE
2.4
AVG HOUSEHOLD SIZE
1,469
LABOR FORCE [ PEOPLE ]
65.6%
PERCENT IN LABOR FORCE
3.0%
UNEMPLOYMENT RATE
Norco Zip Codes
Norco Area Codes
Income in Norco
Income Overview in Norco
Per Capita Income in Norco is $45,074, while median incomes of families and households are $83,897 and $70,492 respectively.
| Characteristic | Number | Measure |
| Per Capita Income | 2,848 | $45,074 |
| Median Family Income | 937 | $83,897 |
| Mean Family Income | 937 | $119,518 |
| Median Household Income | 1,190 | $70,492 |
| Mean Household Income | 1,190 | $105,857 |
| Income Deficit | 937 | $0 |
| Wage / Income Gap (%) | 2,848 | 58.51% |
| Wage / Income Gap ($) | 2,848 | 41.49¢ per $1 |
| Gini / Inequality Index | 2,848 | 0.45 |
Earnings by Sex in Norco
Average Earnings in Norco are $51,736, $63,594 for men and $26,386 for women, a difference of 58.5%.
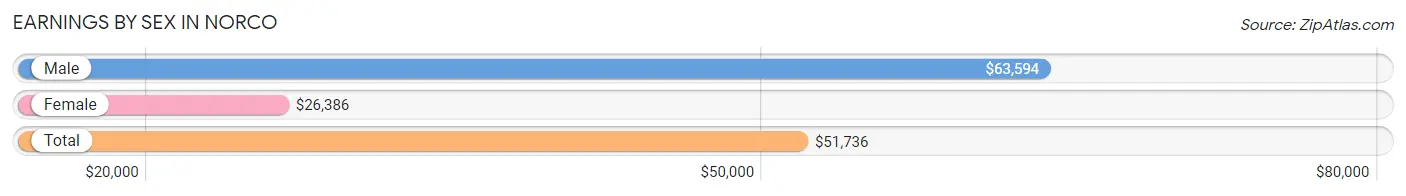
| Sex | Number | Average Earnings |
| Male | 845 (57.6%) | $63,594 |
| Female | 623 (42.4%) | $26,386 |
| Total | 1,468 (100.0%) | $51,736 |
Earnings by Sex by Income Bracket in Norco
The most common earnings brackets in Norco are $100,000+ for men (293 | 34.7%) and $12,500 to $14,999 for women (76 | 12.2%).
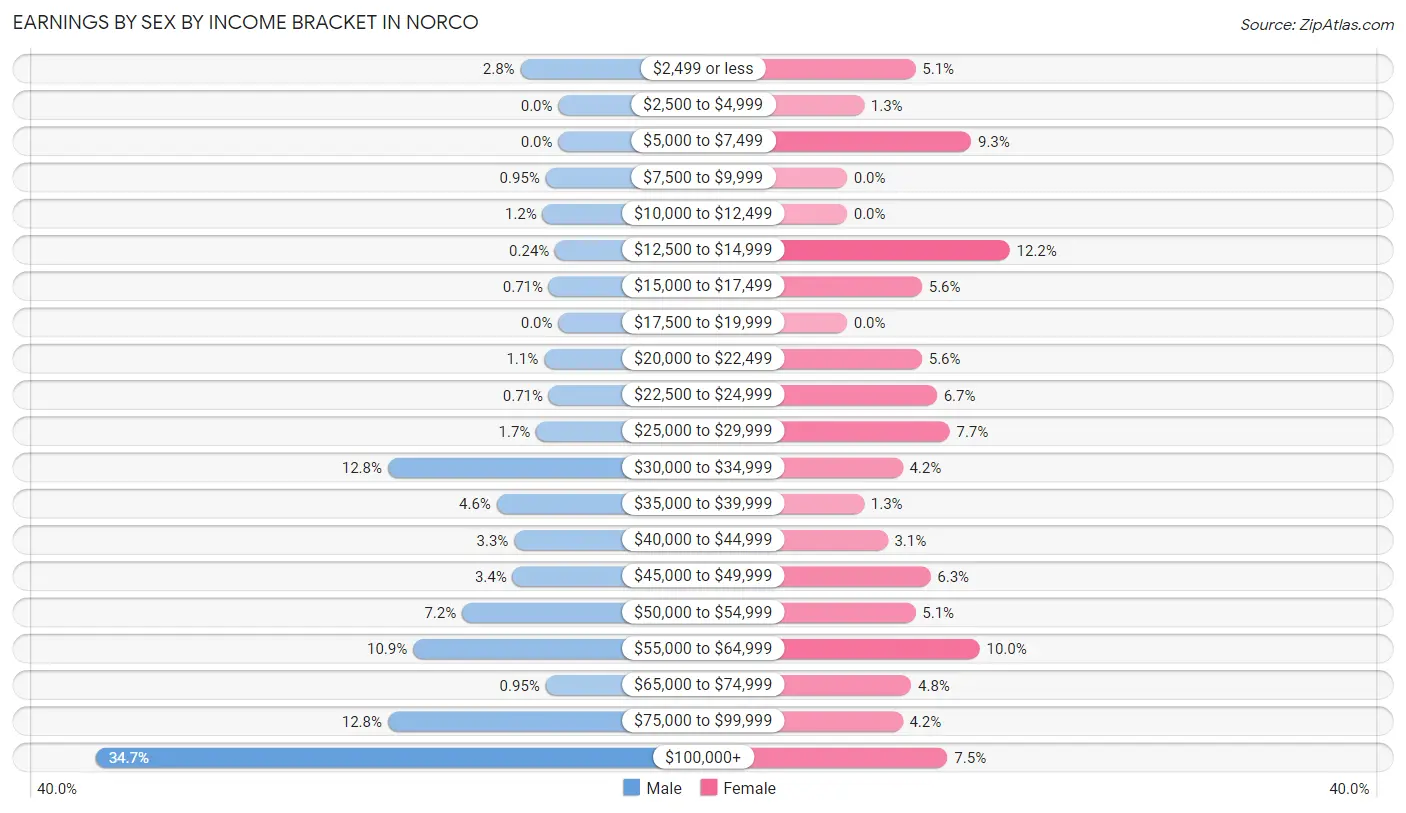
| Income | Male | Female |
| $2,499 or less | 24 (2.8%) | 32 (5.1%) |
| $2,500 to $4,999 | 0 (0.0%) | 8 (1.3%) |
| $5,000 to $7,499 | 0 (0.0%) | 58 (9.3%) |
| $7,500 to $9,999 | 8 (0.9%) | 0 (0.0%) |
| $10,000 to $12,499 | 10 (1.2%) | 0 (0.0%) |
| $12,500 to $14,999 | 2 (0.2%) | 76 (12.2%) |
| $15,000 to $17,499 | 6 (0.7%) | 35 (5.6%) |
| $17,500 to $19,999 | 0 (0.0%) | 0 (0.0%) |
| $20,000 to $22,499 | 9 (1.1%) | 35 (5.6%) |
| $22,500 to $24,999 | 6 (0.7%) | 42 (6.7%) |
| $25,000 to $29,999 | 14 (1.7%) | 48 (7.7%) |
| $30,000 to $34,999 | 108 (12.8%) | 26 (4.2%) |
| $35,000 to $39,999 | 39 (4.6%) | 8 (1.3%) |
| $40,000 to $44,999 | 28 (3.3%) | 19 (3.0%) |
| $45,000 to $49,999 | 29 (3.4%) | 39 (6.3%) |
| $50,000 to $54,999 | 61 (7.2%) | 32 (5.1%) |
| $55,000 to $64,999 | 92 (10.9%) | 62 (10.0%) |
| $65,000 to $74,999 | 8 (0.9%) | 30 (4.8%) |
| $75,000 to $99,999 | 108 (12.8%) | 26 (4.2%) |
| $100,000+ | 293 (34.7%) | 47 (7.5%) |
| Total | 845 (100.0%) | 623 (100.0%) |
Earnings by Sex by Educational Attainment in Norco
Average earnings in Norco are $64,479 for men and $27,364 for women, a difference of 57.6%. Men with an educational attainment of graduate degree enjoy the highest average annual earnings of $113,214, while those with bachelor's degree education earn the least with $46,250. Women with an educational attainment of graduate degree earn the most with the average annual earnings of $102,917, while those with college or associate's degree education have the smallest earnings of $21,679.
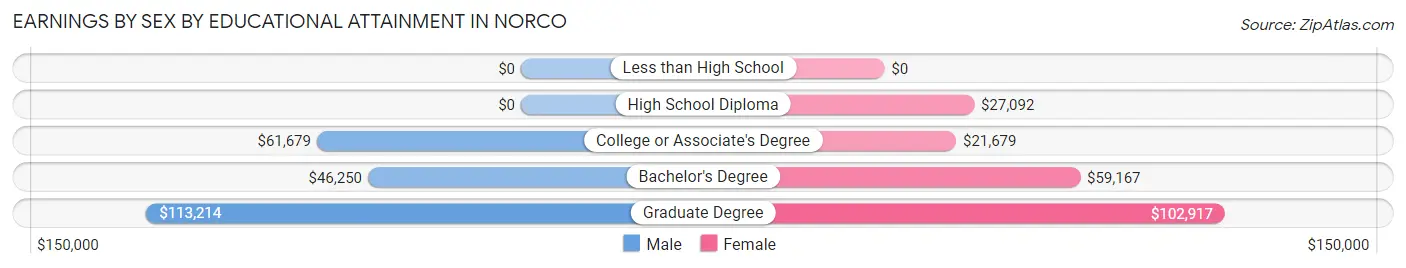
| Educational Attainment | Male Income | Female Income |
| Less than High School | - | - |
| High School Diploma | - | - |
| College or Associate's Degree | $61,679 | $21,679 |
| Bachelor's Degree | $46,250 | $59,167 |
| Graduate Degree | $113,214 | $102,917 |
| Total | $64,479 | $27,364 |
Family Income in Norco
Family Income Brackets in Norco
According to the Norco family income data, there are 243 families falling into the $200,000+ income range, which is the most common income bracket and makes up 25.9% of all families.
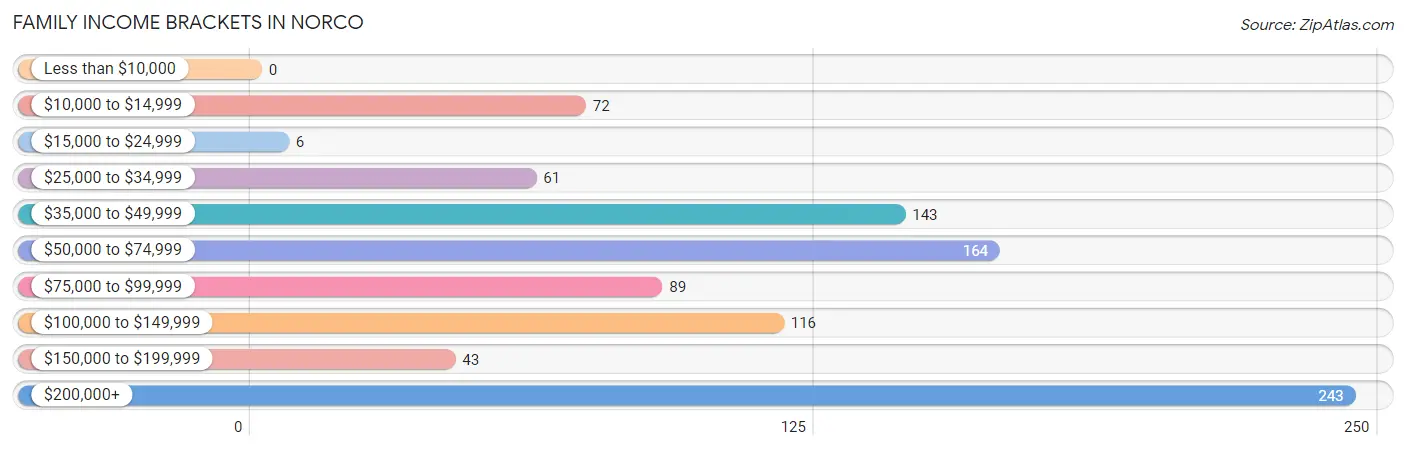
| Income Bracket | # Families | % Families |
| Less than $10,000 | 0 | 0.0% |
| $10,000 to $14,999 | 72 | 7.7% |
| $15,000 to $24,999 | 6 | 0.6% |
| $25,000 to $34,999 | 61 | 6.5% |
| $35,000 to $49,999 | 143 | 15.3% |
| $50,000 to $74,999 | 164 | 17.5% |
| $75,000 to $99,999 | 89 | 9.5% |
| $100,000 to $149,999 | 116 | 12.4% |
| $150,000 to $199,999 | 43 | 4.6% |
| $200,000+ | 243 | 25.9% |
Family Income by Famaliy Size in Norco
5-person families (176 | 18.8%) account for the highest median family income in Norco with $243,429 per family, while 5-person families (176 | 18.8%) have the highest median income of $48,686 per family member.
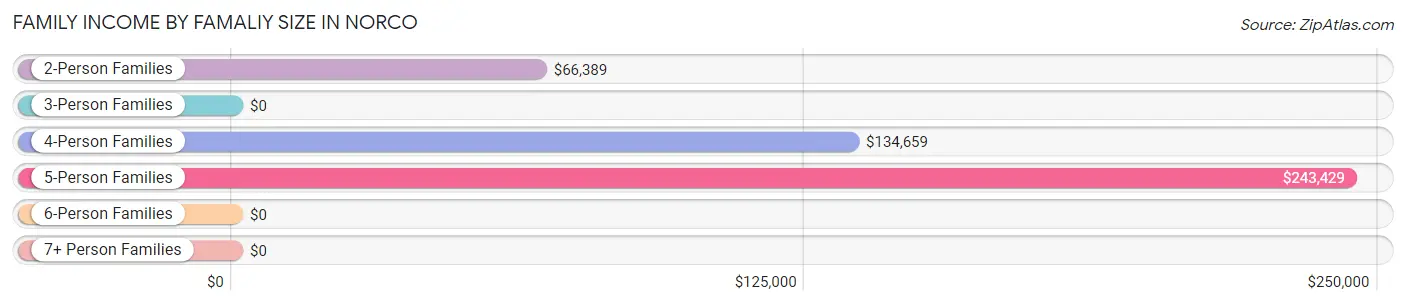
| Income Bracket | # Families | Median Income |
| 2-Person Families | 438 (46.7%) | $66,389 |
| 3-Person Families | 194 (20.7%) | $0 |
| 4-Person Families | 113 (12.1%) | $134,659 |
| 5-Person Families | 176 (18.8%) | $243,429 |
| 6-Person Families | 16 (1.7%) | $0 |
| 7+ Person Families | 0 (0.0%) | $0 |
| Total | 937 (100.0%) | $83,897 |
Family Income by Number of Earners in Norco
The median family income in Norco is $83,897, with families comprising 2 earners (465) having the highest median family income of $182,946, while families with no earners (146) have the lowest median family income of $41,563, accounting for 49.6% and 15.6% of families, respectively.
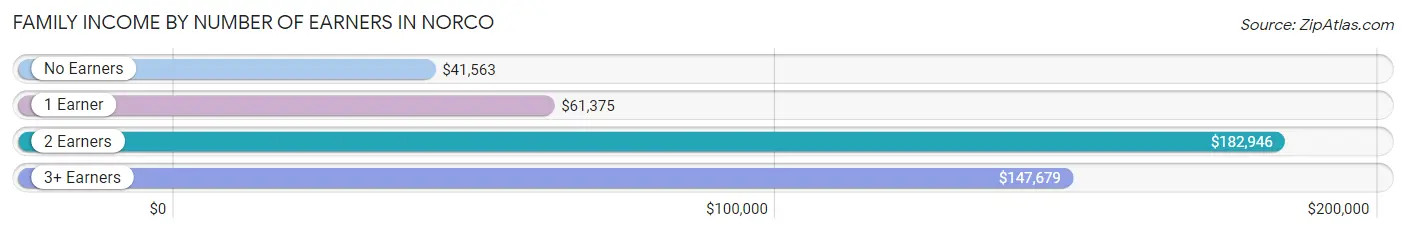
| Number of Earners | # Families | Median Income |
| No Earners | 146 (15.6%) | $41,563 |
| 1 Earner | 297 (31.7%) | $61,375 |
| 2 Earners | 465 (49.6%) | $182,946 |
| 3+ Earners | 29 (3.1%) | $147,679 |
| Total | 937 (100.0%) | $83,897 |
Household Income in Norco
Household Income Brackets in Norco
With 243 households falling in the category, the $200,000+ income range is the most frequent in Norco, accounting for 20.4% of all households. In contrast, only 11 households (0.9%) fall into the less than $10,000 income bracket, making it the least populous group.
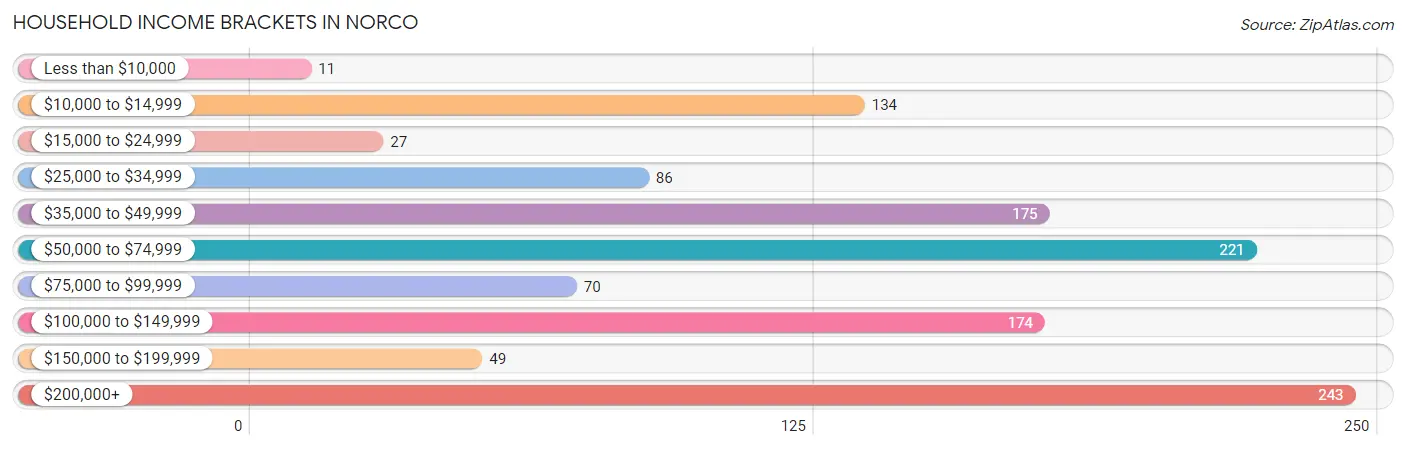
| Income Bracket | # Households | % Households |
| Less than $10,000 | 11 | 0.9% |
| $10,000 to $14,999 | 134 | 11.3% |
| $15,000 to $24,999 | 27 | 2.3% |
| $25,000 to $34,999 | 86 | 7.2% |
| $35,000 to $49,999 | 175 | 14.7% |
| $50,000 to $74,999 | 221 | 18.6% |
| $75,000 to $99,999 | 70 | 5.9% |
| $100,000 to $149,999 | 174 | 14.6% |
| $150,000 to $199,999 | 49 | 4.1% |
| $200,000+ | 243 | 20.4% |
Household Income by Householder Age in Norco
The median household income in Norco is $70,492, with the highest median household income of $131,964 found in the 25 to 44 years age bracket for the primary householder. A total of 561 households (47.1%) fall into this category. Meanwhile, the 15 to 24 years age bracket for the primary householder has the lowest median household income of $0, with 37 households (3.1%) in this group.
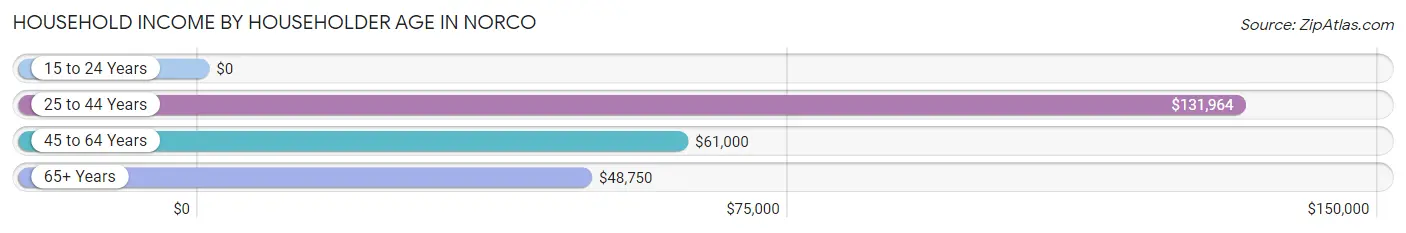
| Income Bracket | # Households | Median Income |
| 15 to 24 Years | 37 (3.1%) | $0 |
| 25 to 44 Years | 561 (47.1%) | $131,964 |
| 45 to 64 Years | 372 (31.3%) | $61,000 |
| 65+ Years | 220 (18.5%) | $48,750 |
| Total | 1,190 (100.0%) | $70,492 |
Poverty in Norco
Income Below Poverty by Sex and Age in Norco
With 13.3% poverty level for males and 10.8% for females among the residents of Norco, 12 to 14 year old males and under 5 year old females are the most vulnerable to poverty, with 33 males (70.2%) and 68 females (32.9%) in their respective age groups living below the poverty level.
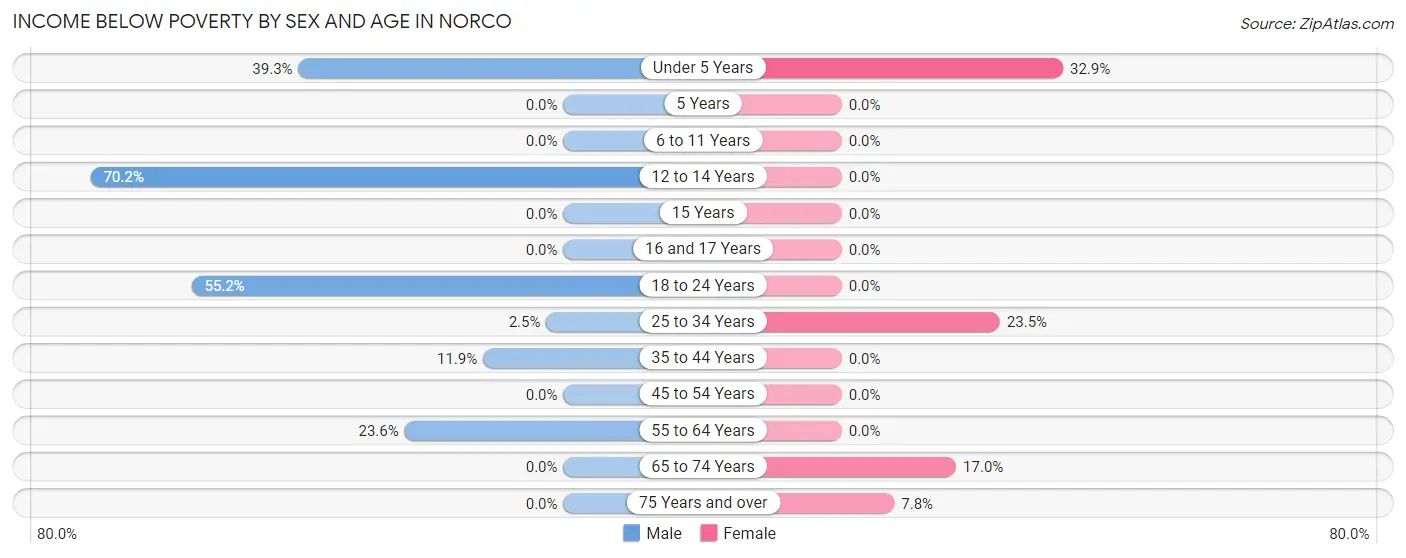
| Age Bracket | Male | Female |
| Under 5 Years | 24 (39.3%) | 68 (32.9%) |
| 5 Years | 0 (0.0%) | 0 (0.0%) |
| 6 to 11 Years | 0 (0.0%) | 0 (0.0%) |
| 12 to 14 Years | 33 (70.2%) | 0 (0.0%) |
| 15 Years | 0 (0.0%) | 0 (0.0%) |
| 16 and 17 Years | 0 (0.0%) | 0 (0.0%) |
| 18 to 24 Years | 37 (55.2%) | 0 (0.0%) |
| 25 to 34 Years | 6 (2.5%) | 54 (23.5%) |
| 35 to 44 Years | 39 (11.9%) | 0 (0.0%) |
| 45 to 54 Years | 0 (0.0%) | 0 (0.0%) |
| 55 to 64 Years | 54 (23.6%) | 0 (0.0%) |
| 65 to 74 Years | 0 (0.0%) | 18 (17.0%) |
| 75 Years and over | 0 (0.0%) | 11 (7.8%) |
| Total | 193 (13.3%) | 151 (10.8%) |
Income Above Poverty by Sex and Age in Norco
According to the poverty statistics in Norco, males aged 5 years and females aged 5 years are the age groups that are most secure financially, with 100.0% of males and 100.0% of females in these age groups living above the poverty line.
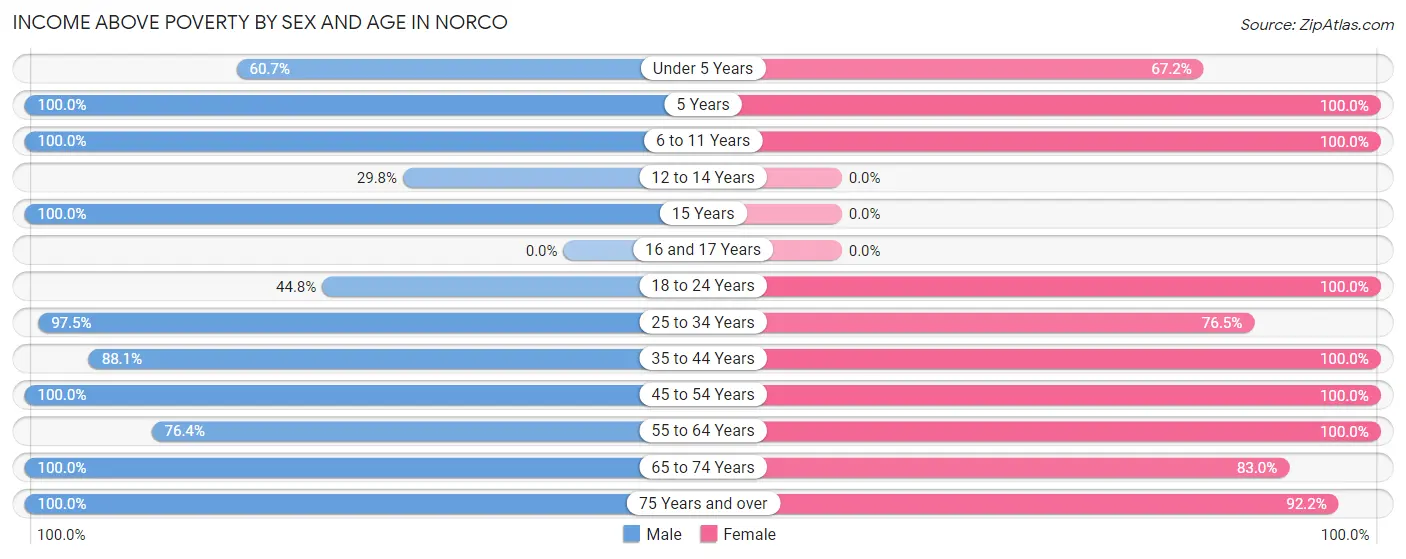
| Age Bracket | Male | Female |
| Under 5 Years | 37 (60.7%) | 139 (67.1%) |
| 5 Years | 43 (100.0%) | 8 (100.0%) |
| 6 to 11 Years | 100 (100.0%) | 117 (100.0%) |
| 12 to 14 Years | 14 (29.8%) | 0 (0.0%) |
| 15 Years | 25 (100.0%) | 0 (0.0%) |
| 16 and 17 Years | 0 (0.0%) | 0 (0.0%) |
| 18 to 24 Years | 30 (44.8%) | 56 (100.0%) |
| 25 to 34 Years | 231 (97.5%) | 176 (76.5%) |
| 35 to 44 Years | 288 (88.1%) | 233 (100.0%) |
| 45 to 54 Years | 161 (100.0%) | 66 (100.0%) |
| 55 to 64 Years | 175 (76.4%) | 228 (100.0%) |
| 65 to 74 Years | 51 (100.0%) | 88 (83.0%) |
| 75 Years and over | 108 (100.0%) | 130 (92.2%) |
| Total | 1,263 (86.7%) | 1,241 (89.1%) |
Income Below Poverty Among Married-Couple Families in Norco
The poverty statistics for married-couple families in Norco show that 0.9% or 6 of the total 687 families live below the poverty line. Families with 1 or 2 children have the highest poverty rate of 2.4%, comprising of 6 families. On the other hand, families with no children have the lowest poverty rate of 0.0%, which includes 0 families.
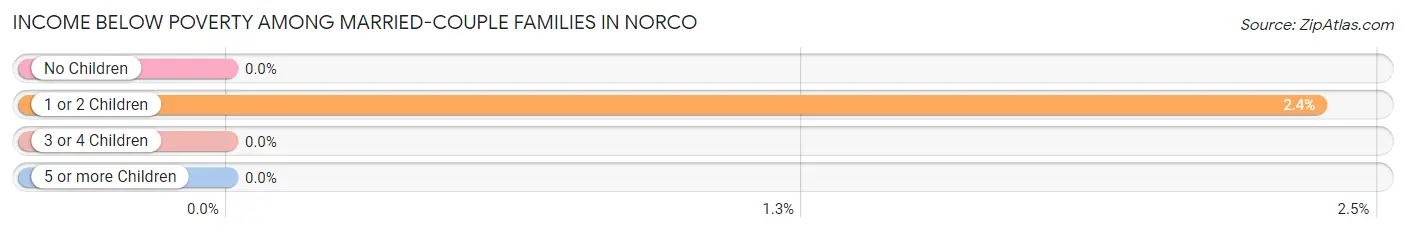
| Children | Above Poverty | Below Poverty |
| No Children | 382 (100.0%) | 0 (0.0%) |
| 1 or 2 Children | 247 (97.6%) | 6 (2.4%) |
| 3 or 4 Children | 52 (100.0%) | 0 (0.0%) |
| 5 or more Children | 0 (0.0%) | 0 (0.0%) |
| Total | 681 (99.1%) | 6 (0.9%) |
Income Below Poverty Among Single-Parent Households in Norco
According to the poverty data in Norco, 36.2% or 29 single-father households and 25.3% or 43 single-mother households are living below the poverty line. Among single-father households, those with no children have the highest poverty rate, with 29 households (36.2%) experiencing poverty. Likewise, among single-mother households, those with 1 or 2 children have the highest poverty rate, with 43 households (38.1%) falling below the poverty line.
| Children | Single Father | Single Mother |
| No Children | 29 (36.2%) | 0 (0.0%) |
| 1 or 2 Children | 0 (0.0%) | 43 (38.1%) |
| 3 or 4 Children | 0 (0.0%) | 0 (0.0%) |
| 5 or more Children | 0 (0.0%) | 0 (0.0%) |
| Total | 29 (36.2%) | 43 (25.3%) |
Income Below Poverty Among Married-Couple vs Single-Parent Households in Norco
The poverty data for Norco shows that 6 of the married-couple family households (0.9%) and 72 of the single-parent households (28.8%) are living below the poverty level. Within the married-couple family households, those with 1 or 2 children have the highest poverty rate, with 6 households (2.4%) falling below the poverty line. Among the single-parent households, those with 1 or 2 children have the highest poverty rate, with 43 household (38.1%) living below poverty.
| Children | Married-Couple Families | Single-Parent Households |
| No Children | 0 (0.0%) | 29 (21.2%) |
| 1 or 2 Children | 6 (2.4%) | 43 (38.1%) |
| 3 or 4 Children | 0 (0.0%) | 0 (0.0%) |
| 5 or more Children | 0 (0.0%) | 0 (0.0%) |
| Total | 6 (0.9%) | 72 (28.8%) |
Race in Norco
The most populous races in Norco are White / Caucasian (2,460 | 86.4%), Some other Race (211 | 7.4%), and Black / African American (114 | 4.0%).
| Race | # Population | % Population |
| Asian | 21 | 0.7% |
| Black / African American | 114 | 4.0% |
| Hawaiian / Pacific | 0 | 0.0% |
| Hispanic or Latino | 31 | 1.1% |
| Native / Alaskan | 33 | 1.2% |
| White / Caucasian | 2,460 | 86.4% |
| Two or more Races | 9 | 0.3% |
| Some other Race | 211 | 7.4% |
| Total | 2,848 | 100.0% |
Ancestry in Norco
The most populous ancestries reported in Norco are French (715 | 25.1%), American (522 | 18.3%), Italian (319 | 11.2%), German (257 | 9.0%), and Irish (101 | 3.5%), together accounting for 67.2% of all Norco residents.
| Ancestry | # Population | % Population |
| American | 522 | 18.3% |
| Arab | 91 | 3.2% |
| Chickasaw | 15 | 0.5% |
| Danish | 7 | 0.3% |
| English | 23 | 0.8% |
| European | 22 | 0.8% |
| French | 715 | 25.1% |
| French Canadian | 68 | 2.4% |
| German | 257 | 9.0% |
| Houma | 18 | 0.6% |
| Irish | 101 | 3.5% |
| Israeli | 9 | 0.3% |
| Italian | 319 | 11.2% |
| Mexican | 8 | 0.3% |
| Polish | 8 | 0.3% |
| Scotch-Irish | 9 | 0.3% |
| Scottish | 72 | 2.5% |
| Syrian | 4 | 0.1% |
| Thai | 21 | 0.7% | View All 19 Rows |
Immigrants in Norco
The most numerous immigrant groups reported in Norco came from Latin America (35 | 1.2%), Asia (26 | 0.9%), Israel (26 | 0.9%), Western Asia (26 | 0.9%), and Guyana (21 | 0.7%), together accounting for 4.7% of all Norco residents.
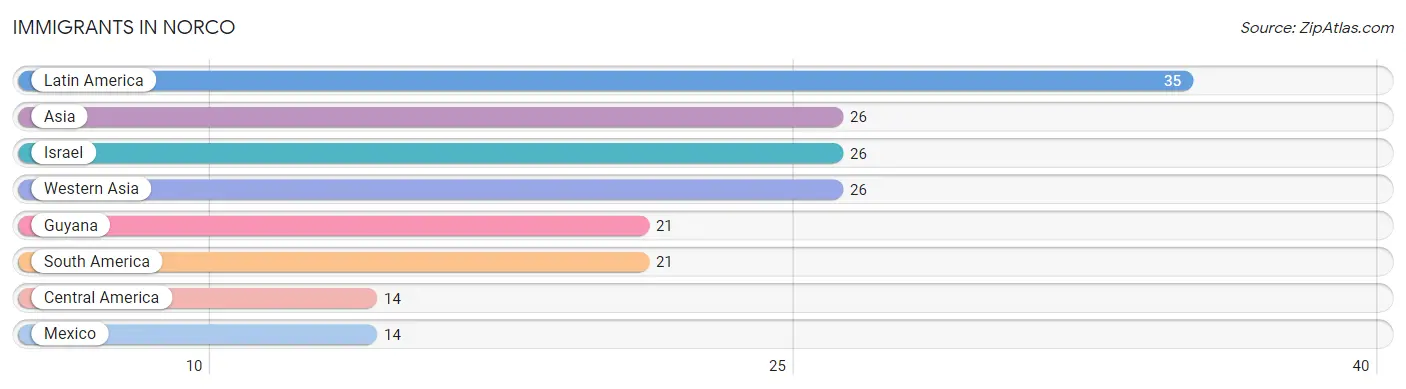
| Immigration Origin | # Population | % Population |
| Asia | 26 | 0.9% |
| Central America | 14 | 0.5% |
| Guyana | 21 | 0.7% |
| Israel | 26 | 0.9% |
| Latin America | 35 | 1.2% |
| Mexico | 14 | 0.5% |
| South America | 21 | 0.7% |
| Western Asia | 26 | 0.9% | View All 8 Rows |
Sex and Age in Norco
Sex and Age in Norco
The most populous age groups in Norco are 40 to 44 Years (206 | 14.1%) for men and Under 5 Years (207 | 14.9%) for women.
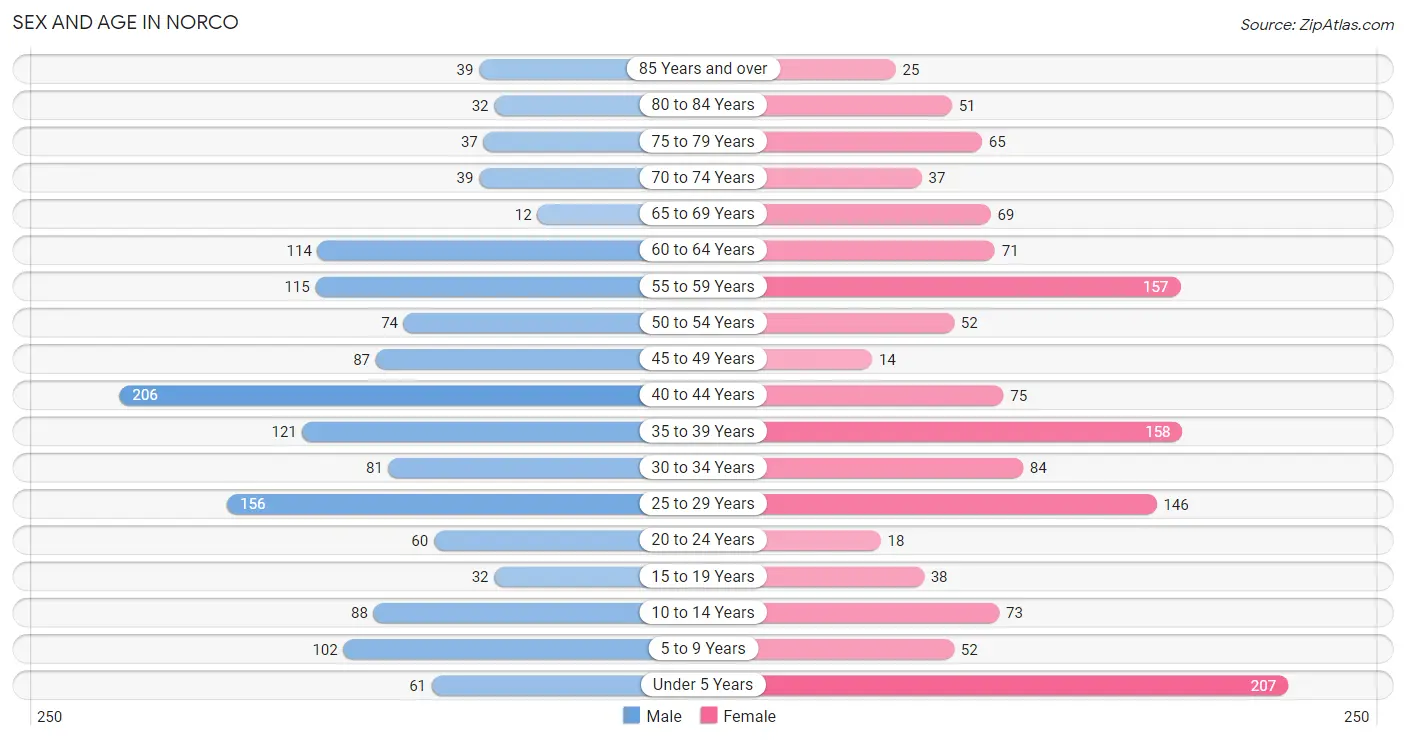
| Age Bracket | Male | Female |
| Under 5 Years | 61 (4.2%) | 207 (14.9%) |
| 5 to 9 Years | 102 (7.0%) | 52 (3.7%) |
| 10 to 14 Years | 88 (6.0%) | 73 (5.2%) |
| 15 to 19 Years | 32 (2.2%) | 38 (2.7%) |
| 20 to 24 Years | 60 (4.1%) | 18 (1.3%) |
| 25 to 29 Years | 156 (10.7%) | 146 (10.5%) |
| 30 to 34 Years | 81 (5.6%) | 84 (6.0%) |
| 35 to 39 Years | 121 (8.3%) | 158 (11.4%) |
| 40 to 44 Years | 206 (14.1%) | 75 (5.4%) |
| 45 to 49 Years | 87 (6.0%) | 14 (1.0%) |
| 50 to 54 Years | 74 (5.1%) | 52 (3.7%) |
| 55 to 59 Years | 115 (7.9%) | 157 (11.3%) |
| 60 to 64 Years | 114 (7.8%) | 71 (5.1%) |
| 65 to 69 Years | 12 (0.8%) | 69 (5.0%) |
| 70 to 74 Years | 39 (2.7%) | 37 (2.7%) |
| 75 to 79 Years | 37 (2.5%) | 65 (4.7%) |
| 80 to 84 Years | 32 (2.2%) | 51 (3.7%) |
| 85 Years and over | 39 (2.7%) | 25 (1.8%) |
| Total | 1,456 (100.0%) | 1,392 (100.0%) |
Families and Households in Norco
Median Family Size in Norco
The median family size in Norco is 2.67 persons per family, with single female/mother families (170 | 18.1%) accounting for the largest median family size of 2.79 persons per family. On the other hand, single male/father families (80 | 8.5%) represent the smallest median family size with 2.40 persons per family.
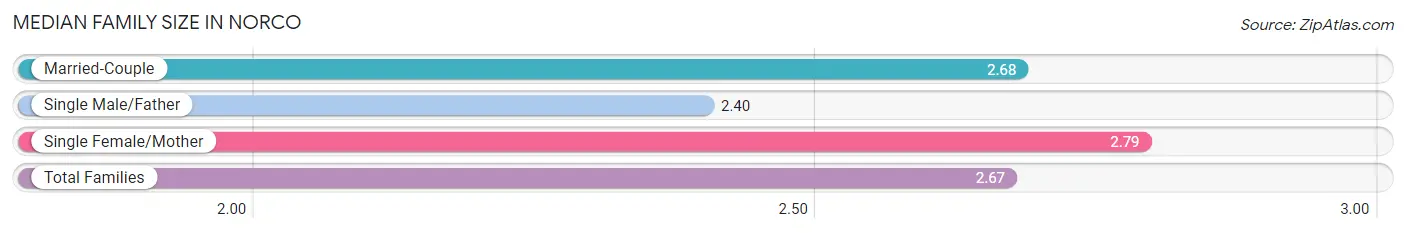
| Family Type | # Families | Family Size |
| Married-Couple | 687 (73.3%) | 2.68 |
| Single Male/Father | 80 (8.5%) | 2.40 |
| Single Female/Mother | 170 (18.1%) | 2.79 |
| Total Families | 937 (100.0%) | 2.67 |
Median Household Size in Norco
The median household size in Norco is 2.39 persons per household, with single female/mother households (170 | 14.3%) accounting for the largest median household size of 2.82 persons per household. non-family households (253 | 21.3%) represent the smallest median household size with 1.25 persons per household.
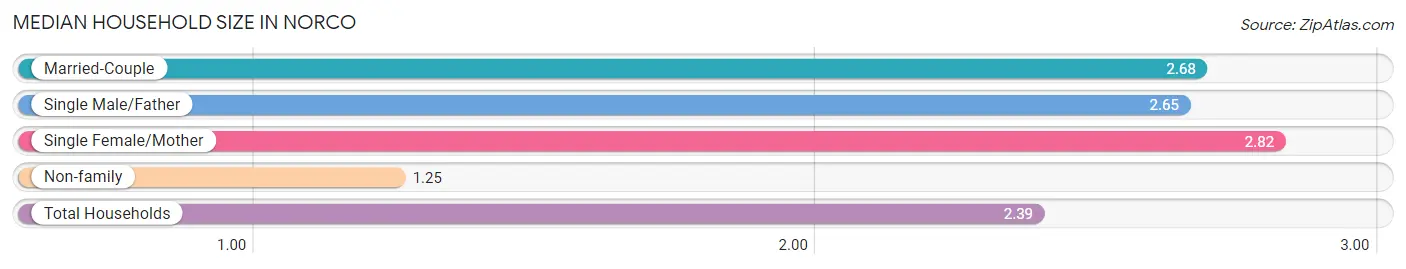
| Household Type | # Households | Household Size |
| Married-Couple | 687 (57.7%) | 2.68 |
| Single Male/Father | 80 (6.7%) | 2.65 |
| Single Female/Mother | 170 (14.3%) | 2.82 |
| Non-family | 253 (21.3%) | 1.25 |
| Total Households | 1,190 (100.0%) | 2.39 |
Household Size by Marriage Status in Norco
Out of a total of 1,190 households in Norco, 937 (78.7%) are family households, while 253 (21.3%) are nonfamily households. The most numerous type of family households are 2-person households, comprising 410, and the most common type of nonfamily households are 1-person households, comprising 206.
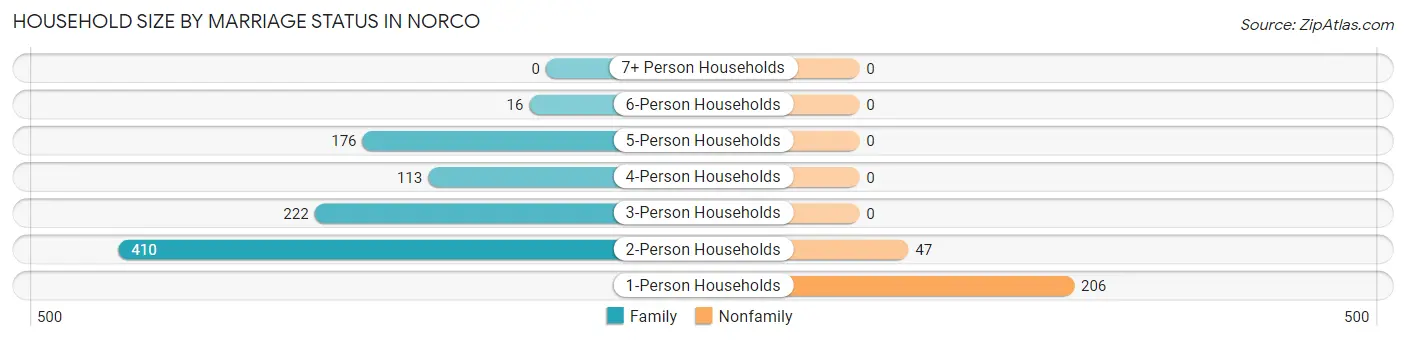
| Household Size | Family Households | Nonfamily Households |
| 1-Person Households | - | 206 (17.3%) |
| 2-Person Households | 410 (34.4%) | 47 (4.0%) |
| 3-Person Households | 222 (18.7%) | 0 (0.0%) |
| 4-Person Households | 113 (9.5%) | 0 (0.0%) |
| 5-Person Households | 176 (14.8%) | 0 (0.0%) |
| 6-Person Households | 16 (1.3%) | 0 (0.0%) |
| 7+ Person Households | 0 (0.0%) | 0 (0.0%) |
| Total | 937 (78.7%) | 253 (21.3%) |
Female Fertility in Norco
Fertility by Age in Norco
Average fertility rate in Norco is 64.0 births per 1,000 women. Women in the age bracket of 20 to 34 years have the highest fertility rate with 137.0 births per 1,000 women. Women in the age bracket of 20 to 34 years acount for 100.0% of all women with births.
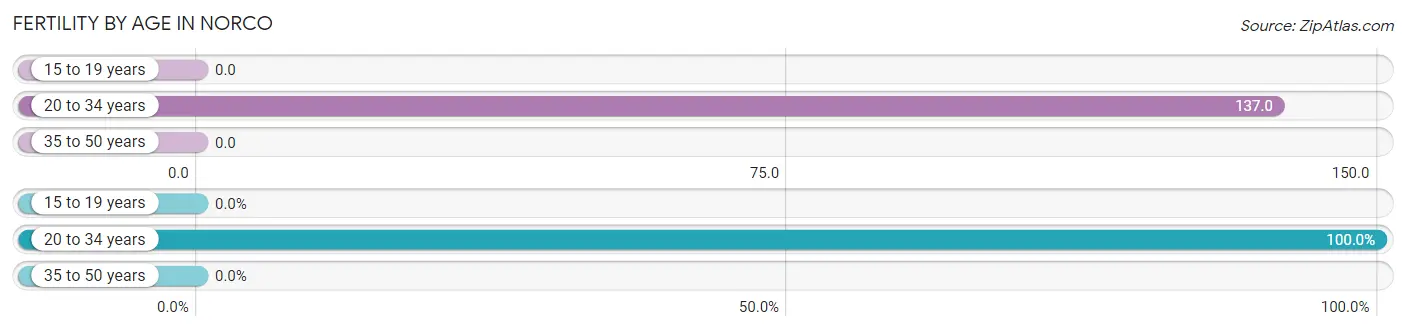
| Age Bracket | Women with Births | Births / 1,000 Women |
| 15 to 19 years | 0 (0.0%) | 0.0 |
| 20 to 34 years | 34 (100.0%) | 137.0 |
| 35 to 50 years | 0 (0.0%) | 0.0 |
| Total | 34 (100.0%) | 64.0 |
Fertility by Age by Marriage Status in Norco
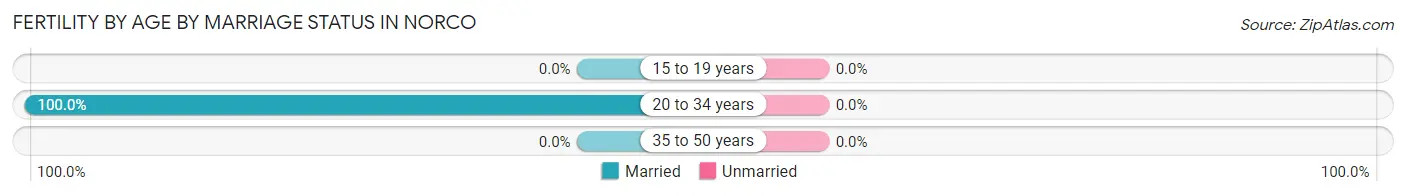
| Age Bracket | Married | Unmarried |
| 15 to 19 years | 0 (0.0%) | 0 (0.0%) |
| 20 to 34 years | 34 (100.0%) | 0 (0.0%) |
| 35 to 50 years | 0 (0.0%) | 0 (0.0%) |
| Total | 34 (100.0%) | 0 (0.0%) |
Fertility by Education in Norco
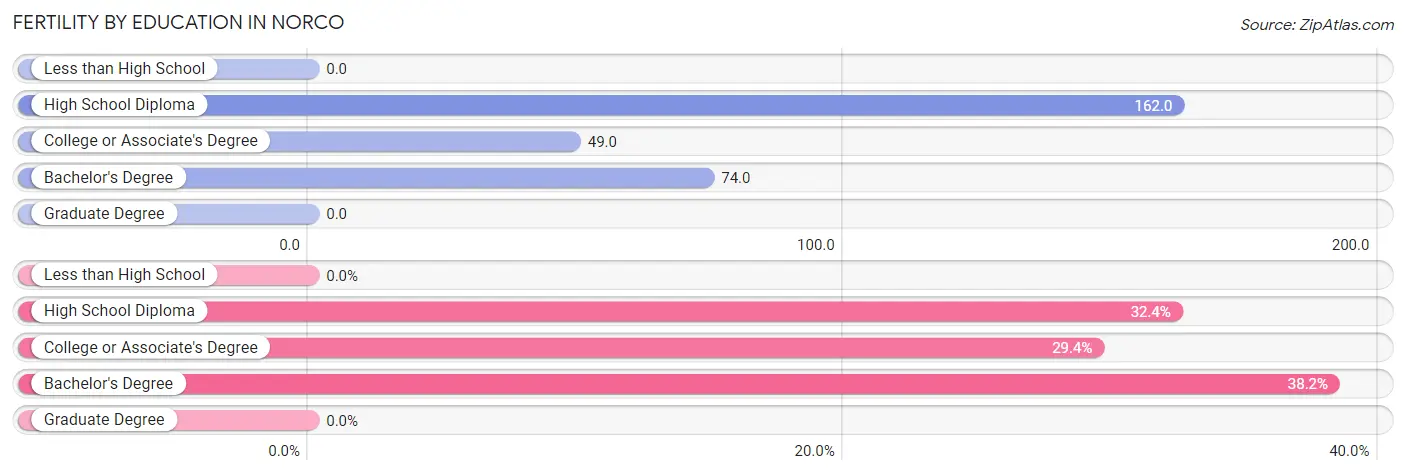
| Educational Attainment | Women with Births | Births / 1,000 Women |
| Less than High School | 0 (0.0%) | 0.0 |
| High School Diploma | 11 (32.4%) | 162.0 |
| College or Associate's Degree | 10 (29.4%) | 49.0 |
| Bachelor's Degree | 13 (38.2%) | 74.0 |
| Graduate Degree | 0 (0.0%) | 0.0 |
| Total | 34 (100.0%) | 64.0 |
Fertility by Education by Marriage Status in Norco
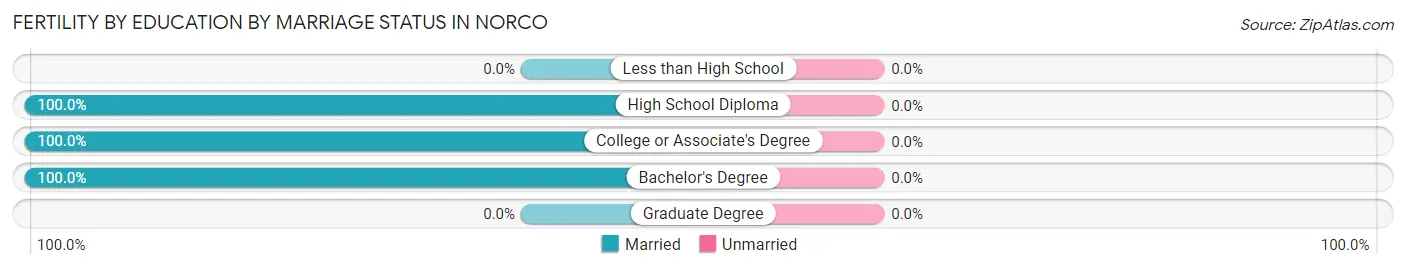
| Educational Attainment | Married | Unmarried |
| Less than High School | 0 (0.0%) | 0 (0.0%) |
| High School Diploma | 11 (100.0%) | 0 (0.0%) |
| College or Associate's Degree | 10 (100.0%) | 0 (0.0%) |
| Bachelor's Degree | 13 (100.0%) | 0 (0.0%) |
| Graduate Degree | 0 (0.0%) | 0 (0.0%) |
| Total | 34 (100.0%) | 0 (0.0%) |
Employment Characteristics in Norco
Employment by Class of Employer in Norco
Among the 1,374 employed individuals in Norco, private company employees (1,005 | 73.1%), local government employees (134 | 9.8%), and not-for-profit organizations (109 | 7.9%) make up the most common classes of employment.
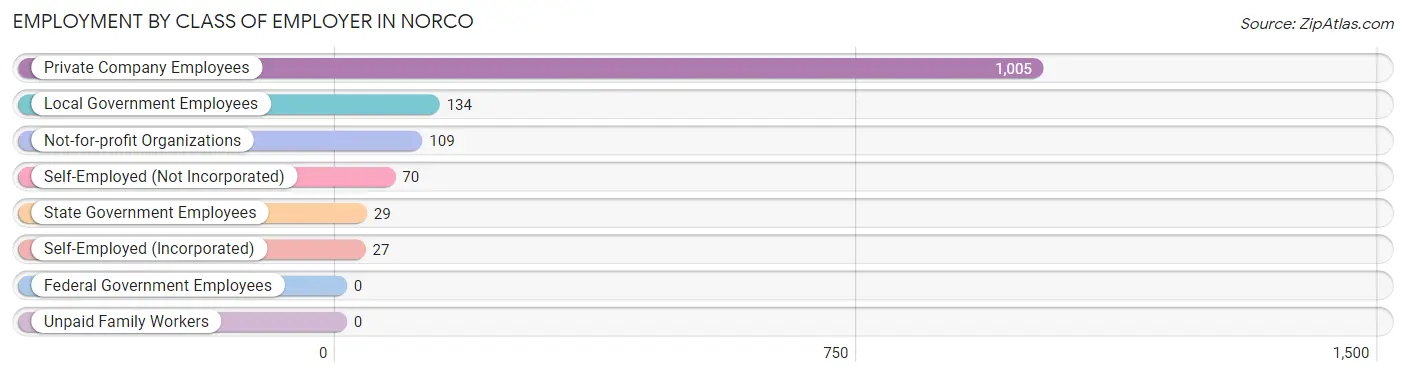
| Employer Class | # Employees | % Employees |
| Private Company Employees | 1,005 | 73.1% |
| Self-Employed (Incorporated) | 27 | 2.0% |
| Self-Employed (Not Incorporated) | 70 | 5.1% |
| Not-for-profit Organizations | 109 | 7.9% |
| Local Government Employees | 134 | 9.8% |
| State Government Employees | 29 | 2.1% |
| Federal Government Employees | 0 | 0.0% |
| Unpaid Family Workers | 0 | 0.0% |
| Total | 1,374 | 100.0% |
Employment Status by Age in Norco
According to the labor force statistics for Norco, out of the total population over 16 years of age (2,240), 65.6% or 1,469 individuals are in the labor force, with 3.0% or 44 of them unemployed. The age group with the highest labor force participation rate is 25 to 29 years, with 93.4% or 282 individuals in the labor force. Within the labor force, the 75 years and over age range has the highest percentage of unemployed individuals, with 100.0% or 11 of them being unemployed.
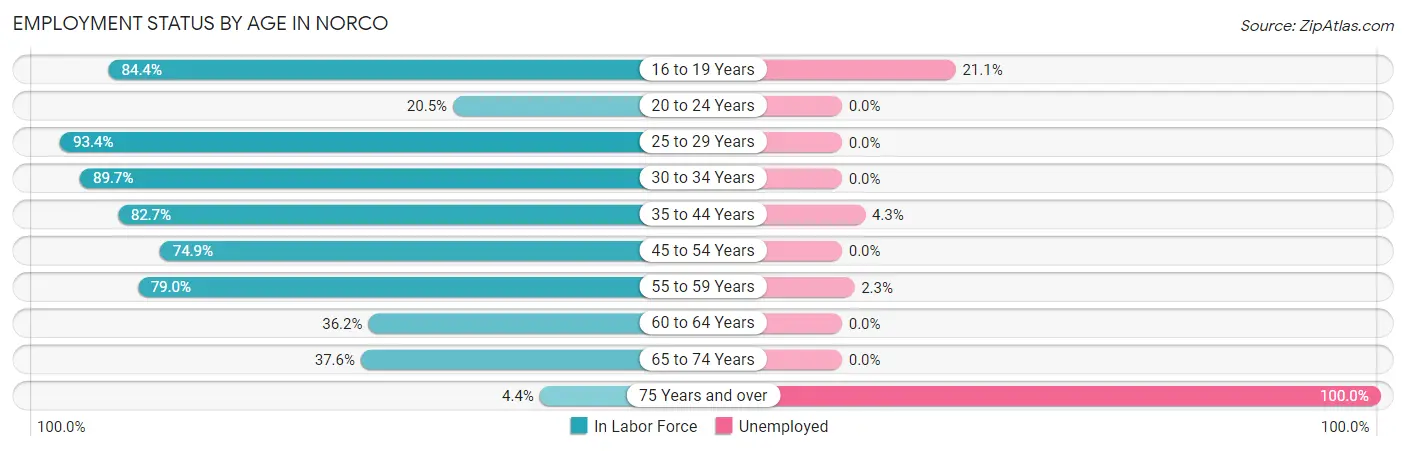
| Age Bracket | In Labor Force | Unemployed |
| 16 to 19 Years | 38 (84.4%) | 8 (21.1%) |
| 20 to 24 Years | 16 (20.5%) | 0 (0.0%) |
| 25 to 29 Years | 282 (93.4%) | 0 (0.0%) |
| 30 to 34 Years | 148 (89.7%) | 0 (0.0%) |
| 35 to 44 Years | 463 (82.7%) | 20 (4.3%) |
| 45 to 54 Years | 170 (74.9%) | 0 (0.0%) |
| 55 to 59 Years | 215 (79.0%) | 5 (2.3%) |
| 60 to 64 Years | 67 (36.2%) | 0 (0.0%) |
| 65 to 74 Years | 59 (37.6%) | 0 (0.0%) |
| 75 Years and over | 11 (4.4%) | 11 (100.0%) |
| Total | 1,469 (65.6%) | 44 (3.0%) |
Employment Status by Educational Attainment in Norco
According to labor force statistics for Norco, 78.6% of individuals (1,345) out of the total population between 25 and 64 years of age (1,711) are in the labor force, with 1.9% or 26 of them being unemployed. The group with the highest labor force participation rate are those with the educational attainment of college / associate degree, with 84.6% or 446 individuals in the labor force. Within the labor force, individuals with high school diploma education have the highest percentage of unemployment, with 4.1% or 20 of them being unemployed.
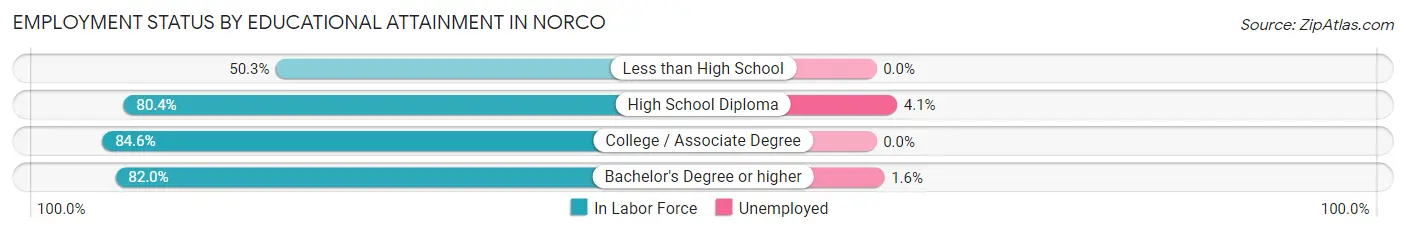
| Educational Attainment | In Labor Force | Unemployed |
| Less than High School | 98 (50.3%) | 0 (0.0%) |
| High School Diploma | 483 (80.4%) | 25 (4.1%) |
| College / Associate Degree | 446 (84.6%) | 0 (0.0%) |
| Bachelor's Degree or higher | 318 (82.0%) | 6 (1.6%) |
| Total | 1,345 (78.6%) | 33 (1.9%) |
Employment Occupations by Sex in Norco
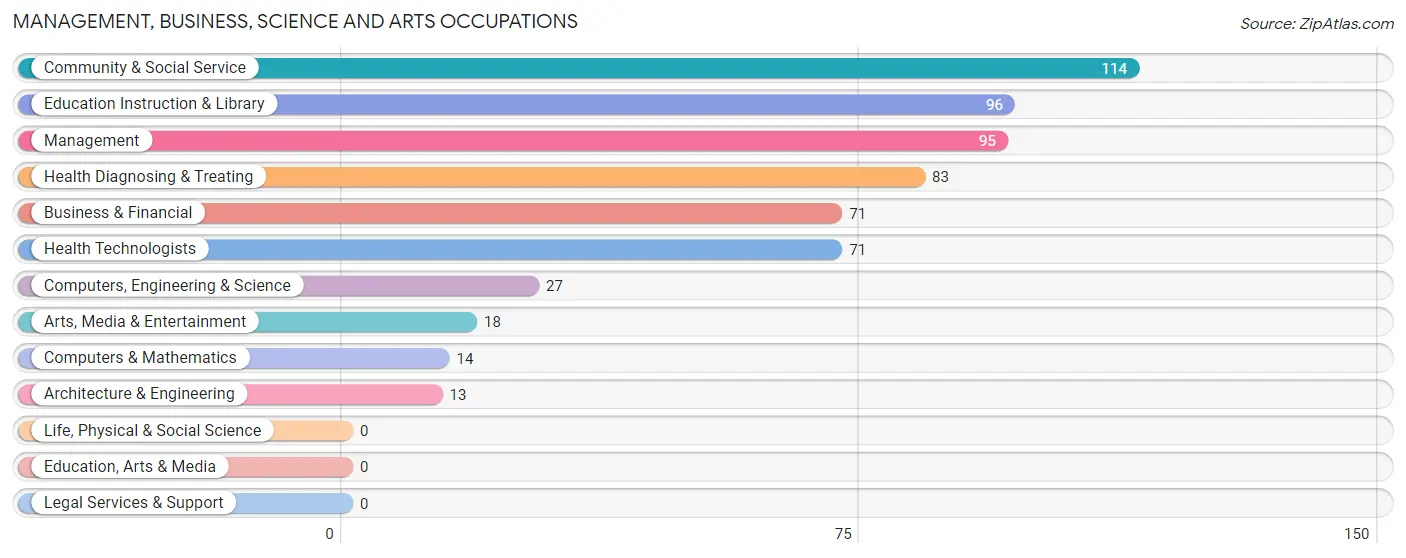
Management, Business, Science and Arts Occupations
The most common Management, Business, Science and Arts occupations in Norco are Community & Social Service (114 | 8.0%), Education Instruction & Library (96 | 6.7%), Management (95 | 6.7%), Health Diagnosing & Treating (83 | 5.8%), and Business & Financial (71 | 5.0%).
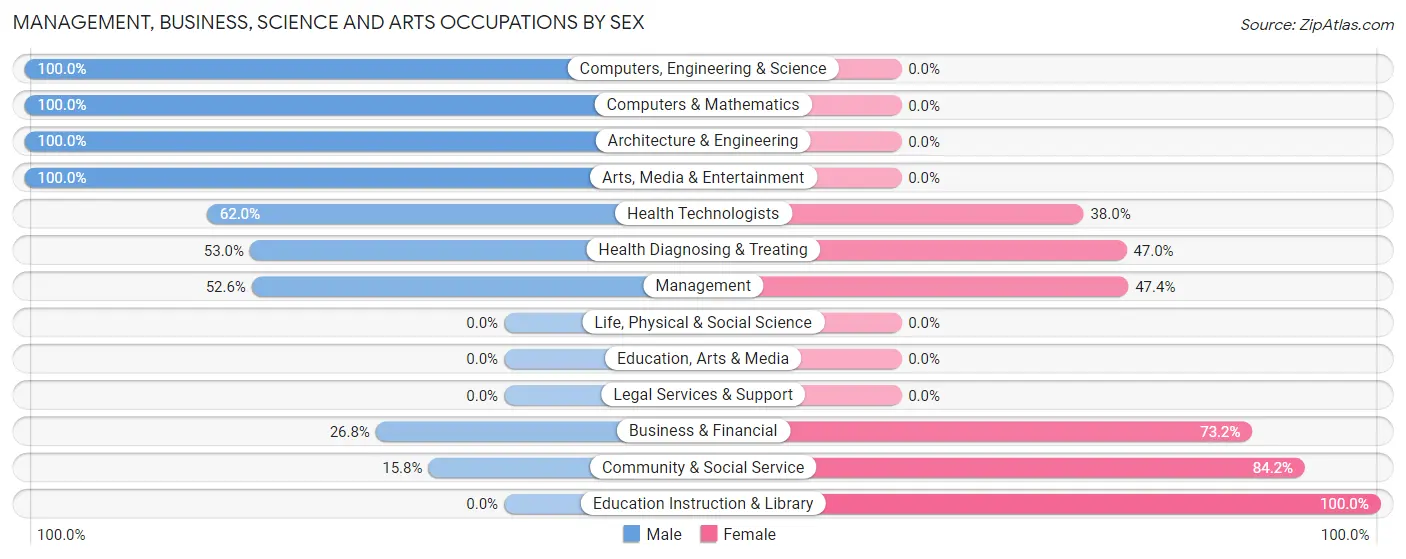
Management, Business, Science and Arts Occupations by Sex
Within the Management, Business, Science and Arts occupations in Norco, the most male-oriented occupations are Computers, Engineering & Science (100.0%), Computers & Mathematics (100.0%), and Architecture & Engineering (100.0%), while the most female-oriented occupations are Education Instruction & Library (100.0%), Community & Social Service (84.2%), and Business & Financial (73.2%).
| Occupation | Male | Female |
| Management | 50 (52.6%) | 45 (47.4%) |
| Business & Financial | 19 (26.8%) | 52 (73.2%) |
| Computers, Engineering & Science | 27 (100.0%) | 0 (0.0%) |
| Computers & Mathematics | 14 (100.0%) | 0 (0.0%) |
| Architecture & Engineering | 13 (100.0%) | 0 (0.0%) |
| Life, Physical & Social Science | 0 (0.0%) | 0 (0.0%) |
| Community & Social Service | 18 (15.8%) | 96 (84.2%) |
| Education, Arts & Media | 0 (0.0%) | 0 (0.0%) |
| Legal Services & Support | 0 (0.0%) | 0 (0.0%) |
| Education Instruction & Library | 0 (0.0%) | 96 (100.0%) |
| Arts, Media & Entertainment | 18 (100.0%) | 0 (0.0%) |
| Health Diagnosing & Treating | 44 (53.0%) | 39 (47.0%) |
| Health Technologists | 44 (62.0%) | 27 (38.0%) |
| Total (Category) | 158 (40.5%) | 232 (59.5%) |
| Total (Overall) | 812 (57.0%) | 613 (43.0%) |
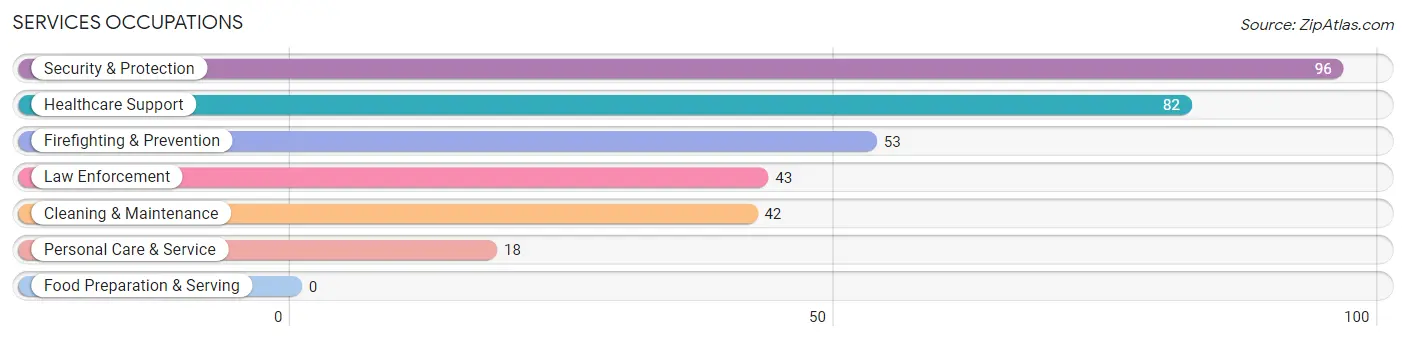
Services Occupations
The most common Services occupations in Norco are Security & Protection (96 | 6.7%), Healthcare Support (82 | 5.8%), Firefighting & Prevention (53 | 3.7%), Law Enforcement (43 | 3.0%), and Cleaning & Maintenance (42 | 2.9%).
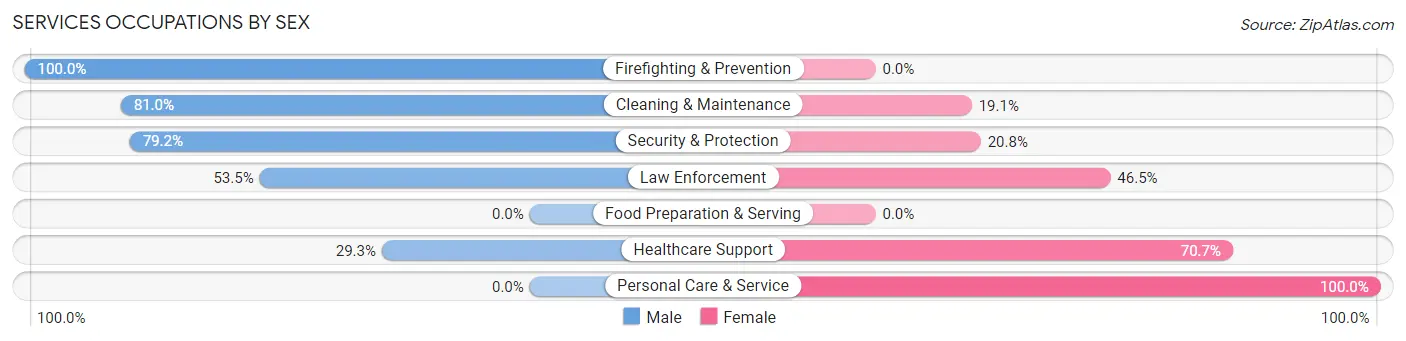
Services Occupations by Sex
Within the Services occupations in Norco, the most male-oriented occupations are Firefighting & Prevention (100.0%), Cleaning & Maintenance (80.9%), and Security & Protection (79.2%), while the most female-oriented occupations are Personal Care & Service (100.0%), Healthcare Support (70.7%), and Law Enforcement (46.5%).
| Occupation | Male | Female |
| Healthcare Support | 24 (29.3%) | 58 (70.7%) |
| Security & Protection | 76 (79.2%) | 20 (20.8%) |
| Firefighting & Prevention | 53 (100.0%) | 0 (0.0%) |
| Law Enforcement | 23 (53.5%) | 20 (46.5%) |
| Food Preparation & Serving | 0 (0.0%) | 0 (0.0%) |
| Cleaning & Maintenance | 34 (80.9%) | 8 (19.1%) |
| Personal Care & Service | 0 (0.0%) | 18 (100.0%) |
| Total (Category) | 134 (56.3%) | 104 (43.7%) |
| Total (Overall) | 812 (57.0%) | 613 (43.0%) |
Sales and Office Occupations
The most common Sales and Office occupations in Norco are Office & Administration (164 | 11.5%), and Sales & Related (142 | 10.0%).
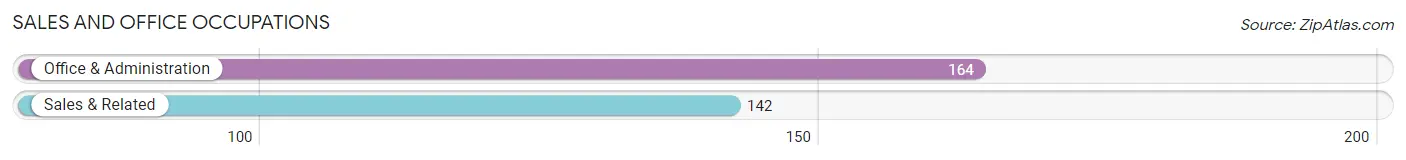
Sales and Office Occupations by Sex
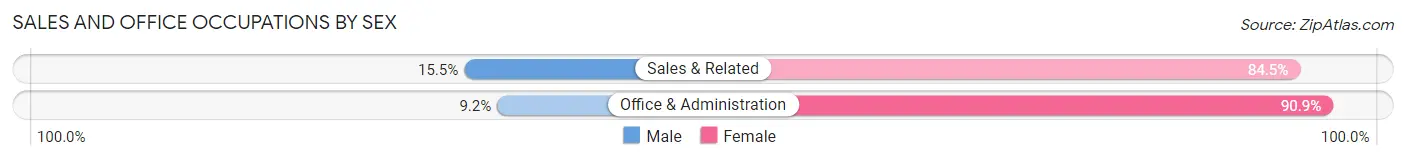
| Occupation | Male | Female |
| Sales & Related | 22 (15.5%) | 120 (84.5%) |
| Office & Administration | 15 (9.1%) | 149 (90.8%) |
| Total (Category) | 37 (12.1%) | 269 (87.9%) |
| Total (Overall) | 812 (57.0%) | 613 (43.0%) |
Natural Resources, Construction and Maintenance Occupations
The most common Natural Resources, Construction and Maintenance occupations in Norco are Construction & Extraction (152 | 10.7%), and Installation, Maintenance & Repair (84 | 5.9%).
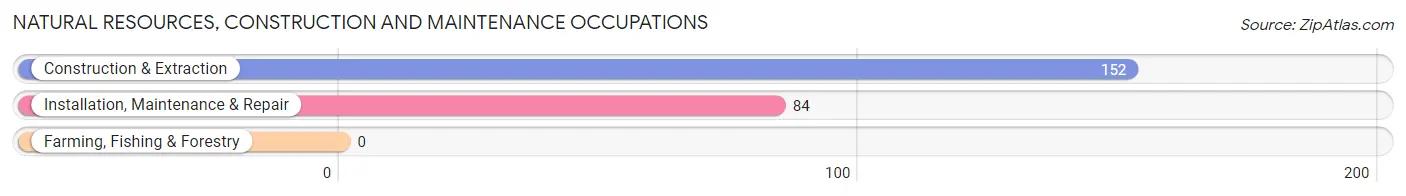
Natural Resources, Construction and Maintenance Occupations by Sex
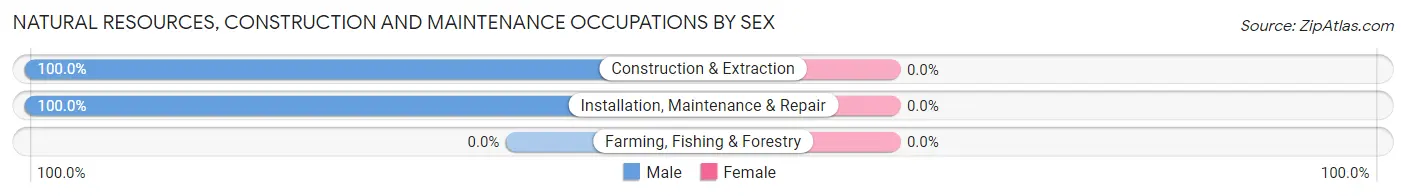
| Occupation | Male | Female |
| Farming, Fishing & Forestry | 0 (0.0%) | 0 (0.0%) |
| Construction & Extraction | 152 (100.0%) | 0 (0.0%) |
| Installation, Maintenance & Repair | 84 (100.0%) | 0 (0.0%) |
| Total (Category) | 236 (100.0%) | 0 (0.0%) |
| Total (Overall) | 812 (57.0%) | 613 (43.0%) |
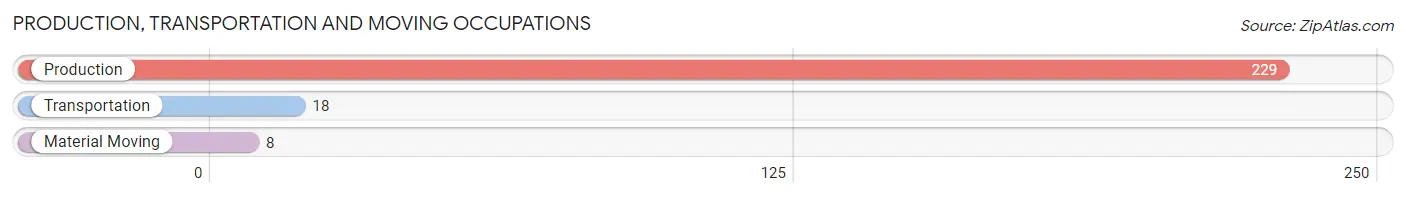
Production, Transportation and Moving Occupations
The most common Production, Transportation and Moving occupations in Norco are Production (229 | 16.1%), Transportation (18 | 1.3%), and Material Moving (8 | 0.6%).
Production, Transportation and Moving Occupations by Sex
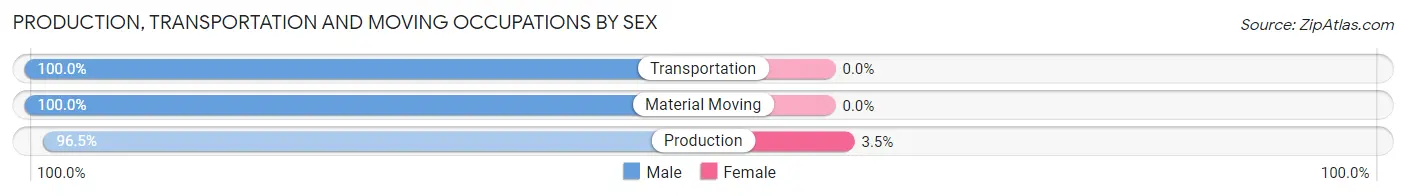
| Occupation | Male | Female |
| Production | 221 (96.5%) | 8 (3.5%) |
| Transportation | 18 (100.0%) | 0 (0.0%) |
| Material Moving | 8 (100.0%) | 0 (0.0%) |
| Total (Category) | 247 (96.9%) | 8 (3.1%) |
| Total (Overall) | 812 (57.0%) | 613 (43.0%) |
Employment Industries by Sex in Norco
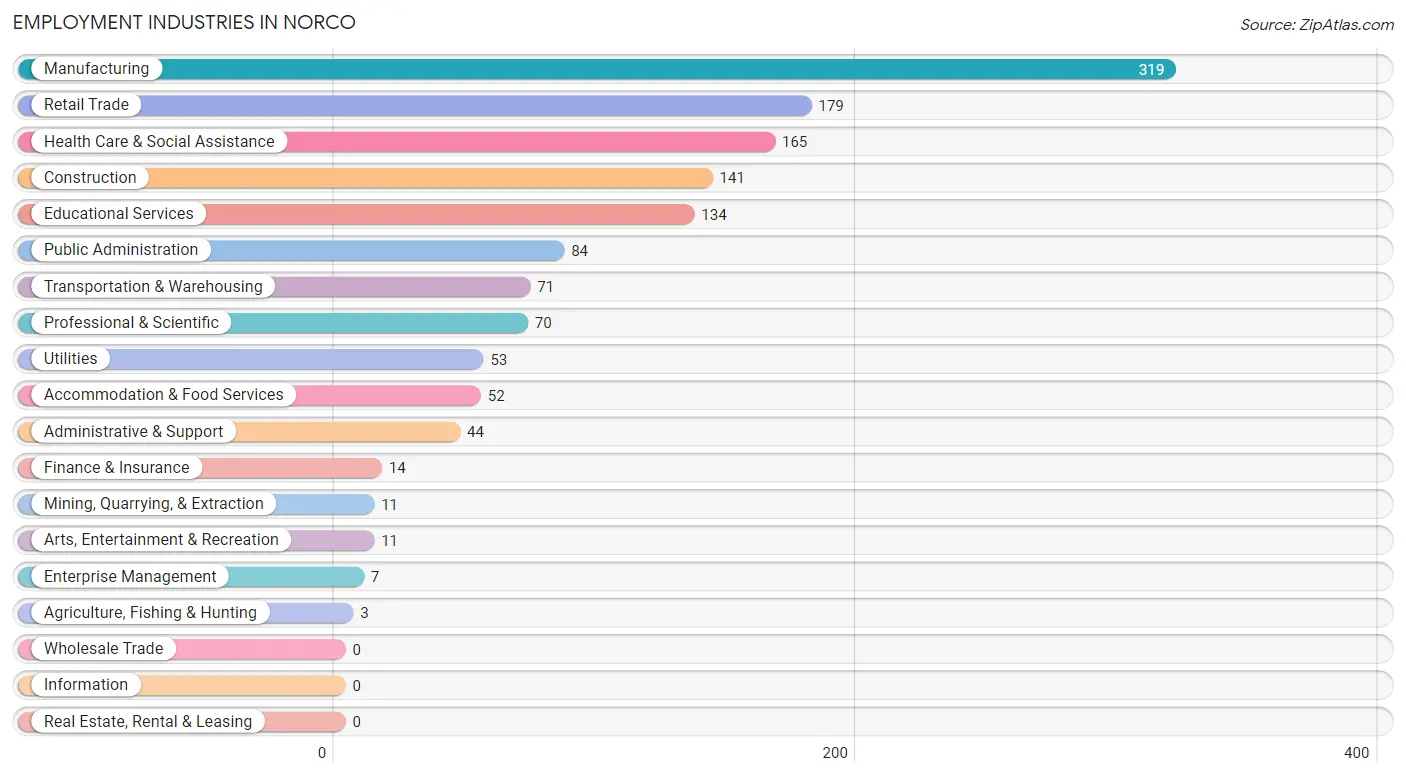
Employment Industries in Norco
The major employment industries in Norco include Manufacturing (319 | 22.4%), Retail Trade (179 | 12.6%), Health Care & Social Assistance (165 | 11.6%), Construction (141 | 9.9%), and Educational Services (134 | 9.4%).
Employment Industries by Sex in Norco
The Norco industries that see more men than women are Agriculture, Fishing & Hunting (100.0%), Mining, Quarrying, & Extraction (100.0%), and Utilities (100.0%), whereas the industries that tend to have a higher number of women are Arts, Entertainment & Recreation (100.0%), Educational Services (88.1%), and Accommodation & Food Services (78.8%).
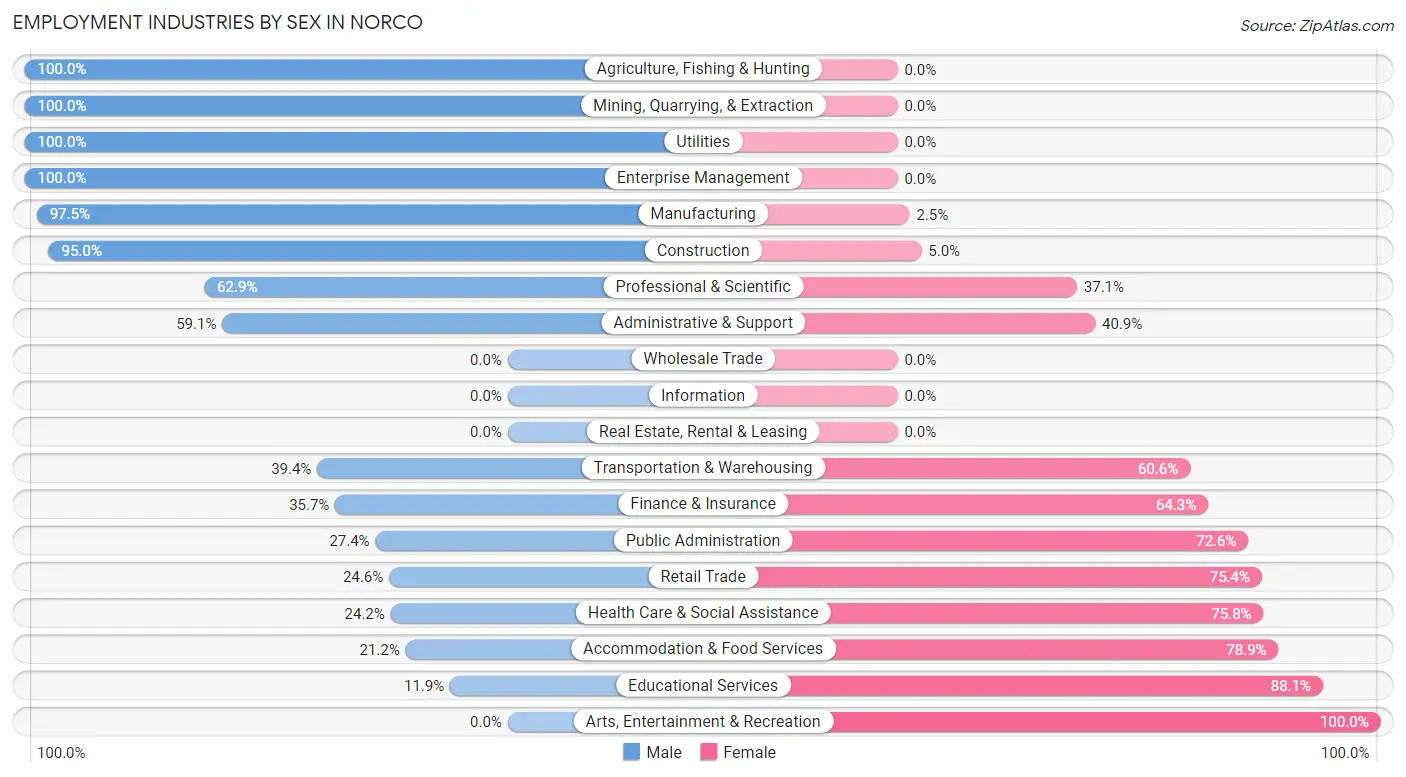
| Industry | Male | Female |
| Agriculture, Fishing & Hunting | 3 (100.0%) | 0 (0.0%) |
| Mining, Quarrying, & Extraction | 11 (100.0%) | 0 (0.0%) |
| Construction | 134 (95.0%) | 7 (5.0%) |
| Manufacturing | 311 (97.5%) | 8 (2.5%) |
| Wholesale Trade | 0 (0.0%) | 0 (0.0%) |
| Retail Trade | 44 (24.6%) | 135 (75.4%) |
| Transportation & Warehousing | 28 (39.4%) | 43 (60.6%) |
| Utilities | 53 (100.0%) | 0 (0.0%) |
| Information | 0 (0.0%) | 0 (0.0%) |
| Finance & Insurance | 5 (35.7%) | 9 (64.3%) |
| Real Estate, Rental & Leasing | 0 (0.0%) | 0 (0.0%) |
| Professional & Scientific | 44 (62.9%) | 26 (37.1%) |
| Enterprise Management | 7 (100.0%) | 0 (0.0%) |
| Administrative & Support | 26 (59.1%) | 18 (40.9%) |
| Educational Services | 16 (11.9%) | 118 (88.1%) |
| Health Care & Social Assistance | 40 (24.2%) | 125 (75.8%) |
| Arts, Entertainment & Recreation | 0 (0.0%) | 11 (100.0%) |
| Accommodation & Food Services | 11 (21.1%) | 41 (78.8%) |
| Public Administration | 23 (27.4%) | 61 (72.6%) |
| Total | 812 (57.0%) | 613 (43.0%) |
Education in Norco
School Enrollment in Norco
The most common levels of schooling among the 573 students in Norco are middle school (183 | 31.9%), elementary school (103 | 18.0%), and college / undergraduate (98 | 17.1%).
| School Level | # Students | % Students |
| Nursery / Preschool | 79 | 13.8% |
| Kindergarten | 44 | 7.7% |
| Elementary School | 103 | 18.0% |
| Middle School | 183 | 31.9% |
| High School | 33 | 5.8% |
| College / Undergraduate | 98 | 17.1% |
| Graduate / Professional | 33 | 5.8% |
| Total | 573 | 100.0% |
School Enrollment by Age by Funding Source in Norco
Out of a total of 573 students who are enrolled in schools in Norco, 87 (15.2%) attend a private institution, while the remaining 486 (84.8%) are enrolled in public schools. The age group of 35 years and over has the highest likelihood of being enrolled in private schools, with 41 (65.1% in the age bracket) enrolled. Conversely, the age group of 10 to 14 year olds has the lowest likelihood of being enrolled in a private school, with 161 (100.0% in the age bracket) attending a public institution.
| Age Bracket | Public School | Private School |
| 3 to 4 Year Olds | 51 (70.8%) | 21 (29.2%) |
| 5 to 9 Year Old | 139 (90.3%) | 15 (9.7%) |
| 10 to 14 Year Olds | 161 (100.0%) | 0 (0.0%) |
| 15 to 17 Year Olds | 25 (100.0%) | 0 (0.0%) |
| 18 to 19 Year Olds | 22 (75.9%) | 7 (24.1%) |
| 20 to 24 Year Olds | 33 (100.0%) | 0 (0.0%) |
| 25 to 34 Year Olds | 33 (91.7%) | 3 (8.3%) |
| 35 Years and over | 22 (34.9%) | 41 (65.1%) |
| Total | 486 (84.8%) | 87 (15.2%) |
Educational Attainment by Field of Study in Norco
Business (131 | 29.0%), education (97 | 21.5%), science & technology (57 | 12.6%), visual & performing arts (33 | 7.3%), and engineering (28 | 6.2%) are the most common fields of study among 452 individuals in Norco who have obtained a bachelor's degree or higher.
| Field of Study | # Graduates | % Graduates |
| Computers & Mathematics | 14 | 3.1% |
| Bio, Nature & Agricultural | 26 | 5.8% |
| Physical & Health Sciences | 0 | 0.0% |
| Psychology | 0 | 0.0% |
| Social Sciences | 0 | 0.0% |
| Engineering | 28 | 6.2% |
| Multidisciplinary Studies | 7 | 1.5% |
| Science & Technology | 57 | 12.6% |
| Business | 131 | 29.0% |
| Education | 97 | 21.5% |
| Literature & Languages | 0 | 0.0% |
| Liberal Arts & History | 8 | 1.8% |
| Visual & Performing Arts | 33 | 7.3% |
| Communications | 25 | 5.5% |
| Arts & Humanities | 26 | 5.8% |
| Total | 452 | 100.0% |
Transportation & Commute in Norco
Vehicle Availability by Sex in Norco
The most prevalent vehicle ownership categories in Norco are males with 2 vehicles (445, accounting for 54.8%) and females with 2 vehicles (254, making up 79.2%).
| Vehicles Available | Male | Female |
| No Vehicle | 0 (0.0%) | 25 (4.4%) |
| 1 Vehicle | 90 (11.1%) | 177 (31.5%) |
| 2 Vehicles | 445 (54.8%) | 254 (45.2%) |
| 3 Vehicles | 96 (11.8%) | 74 (13.2%) |
| 4 Vehicles | 39 (4.8%) | 32 (5.7%) |
| 5 or more Vehicles | 142 (17.5%) | 0 (0.0%) |
| Total | 812 (100.0%) | 562 (100.0%) |
Commute Time in Norco
The most frequently occuring commute durations in Norco are 5 to 9 minutes (268 commuters, 19.7%), 15 to 19 minutes (233 commuters, 17.1%), and 30 to 34 minutes (175 commuters, 12.9%).
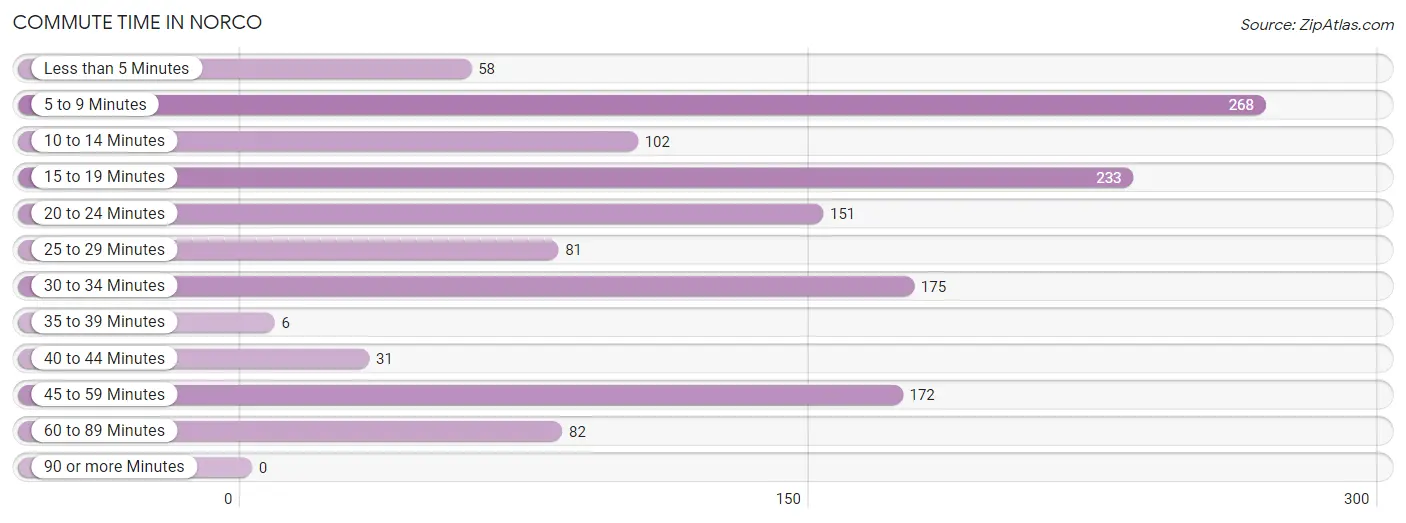
| Commute Time | # Commuters | % Commuters |
| Less than 5 Minutes | 58 | 4.3% |
| 5 to 9 Minutes | 268 | 19.7% |
| 10 to 14 Minutes | 102 | 7.5% |
| 15 to 19 Minutes | 233 | 17.1% |
| 20 to 24 Minutes | 151 | 11.1% |
| 25 to 29 Minutes | 81 | 6.0% |
| 30 to 34 Minutes | 175 | 12.9% |
| 35 to 39 Minutes | 6 | 0.4% |
| 40 to 44 Minutes | 31 | 2.3% |
| 45 to 59 Minutes | 172 | 12.7% |
| 60 to 89 Minutes | 82 | 6.0% |
| 90 or more Minutes | 0 | 0.0% |
Commute Time by Sex in Norco
The most common commute times in Norco are 5 to 9 minutes (205 commuters, 25.7%) for males and 30 to 34 minutes (131 commuters, 23.3%) for females.
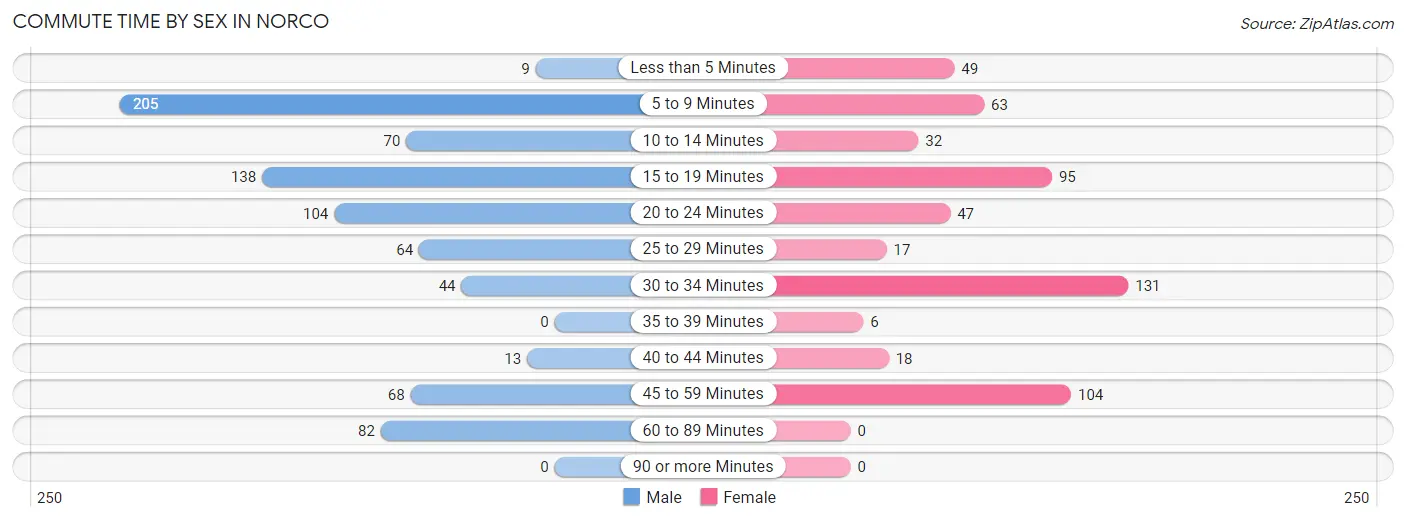
| Commute Time | Male | Female |
| Less than 5 Minutes | 9 (1.1%) | 49 (8.7%) |
| 5 to 9 Minutes | 205 (25.7%) | 63 (11.2%) |
| 10 to 14 Minutes | 70 (8.8%) | 32 (5.7%) |
| 15 to 19 Minutes | 138 (17.3%) | 95 (16.9%) |
| 20 to 24 Minutes | 104 (13.1%) | 47 (8.4%) |
| 25 to 29 Minutes | 64 (8.0%) | 17 (3.0%) |
| 30 to 34 Minutes | 44 (5.5%) | 131 (23.3%) |
| 35 to 39 Minutes | 0 (0.0%) | 6 (1.1%) |
| 40 to 44 Minutes | 13 (1.6%) | 18 (3.2%) |
| 45 to 59 Minutes | 68 (8.5%) | 104 (18.5%) |
| 60 to 89 Minutes | 82 (10.3%) | 0 (0.0%) |
| 90 or more Minutes | 0 (0.0%) | 0 (0.0%) |
Time of Departure to Work by Sex in Norco
The most frequent times of departure to work in Norco are 12:00 AM to 4:59 AM (266, 33.4%) for males and 7:00 AM to 7:29 AM (123, 21.9%) for females.
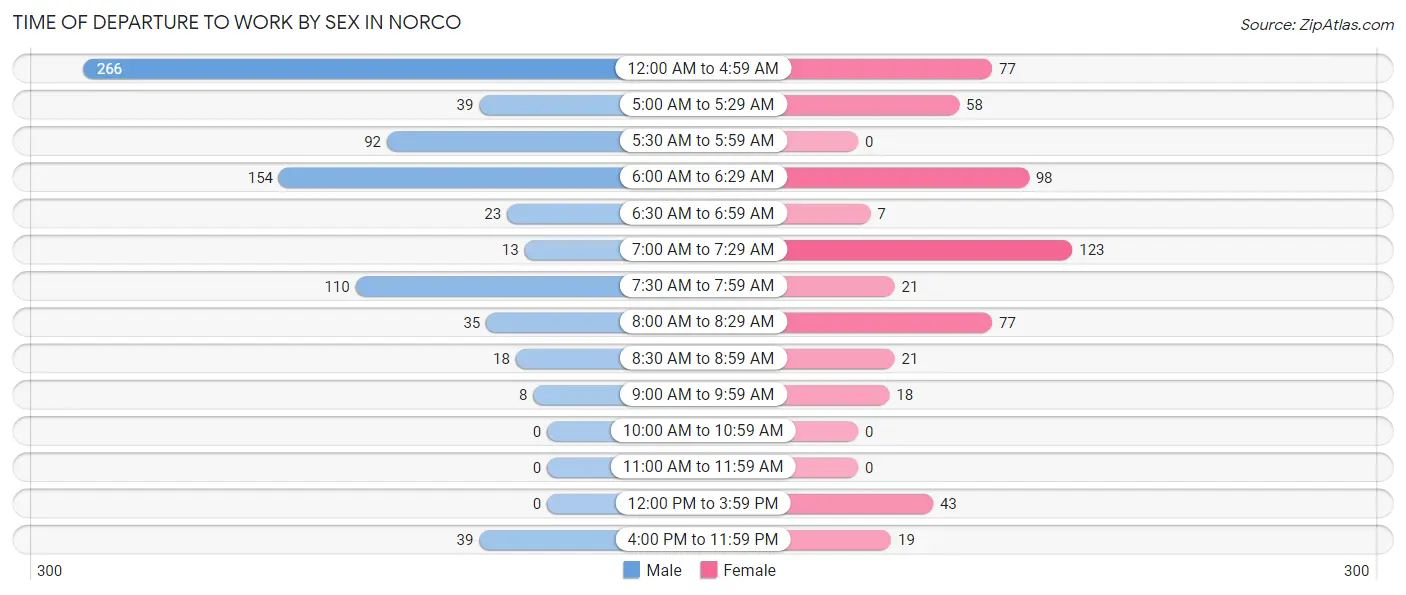
| Time of Departure | Male | Female |
| 12:00 AM to 4:59 AM | 266 (33.4%) | 77 (13.7%) |
| 5:00 AM to 5:29 AM | 39 (4.9%) | 58 (10.3%) |
| 5:30 AM to 5:59 AM | 92 (11.5%) | 0 (0.0%) |
| 6:00 AM to 6:29 AM | 154 (19.3%) | 98 (17.4%) |
| 6:30 AM to 6:59 AM | 23 (2.9%) | 7 (1.3%) |
| 7:00 AM to 7:29 AM | 13 (1.6%) | 123 (21.9%) |
| 7:30 AM to 7:59 AM | 110 (13.8%) | 21 (3.7%) |
| 8:00 AM to 8:29 AM | 35 (4.4%) | 77 (13.7%) |
| 8:30 AM to 8:59 AM | 18 (2.3%) | 21 (3.7%) |
| 9:00 AM to 9:59 AM | 8 (1.0%) | 18 (3.2%) |
| 10:00 AM to 10:59 AM | 0 (0.0%) | 0 (0.0%) |
| 11:00 AM to 11:59 AM | 0 (0.0%) | 0 (0.0%) |
| 12:00 PM to 3:59 PM | 0 (0.0%) | 43 (7.6%) |
| 4:00 PM to 11:59 PM | 39 (4.9%) | 19 (3.4%) |
| Total | 797 (100.0%) | 562 (100.0%) |
Housing Occupancy in Norco
Occupancy by Ownership in Norco
Of the total 1,190 dwellings in Norco, owner-occupied units account for 856 (71.9%), while renter-occupied units make up 334 (28.1%).
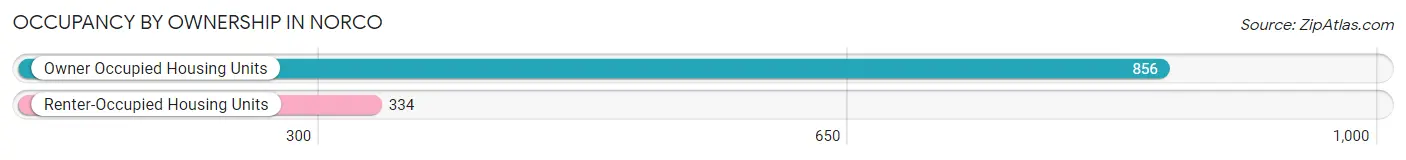
| Occupancy | # Housing Units | % Housing Units |
| Owner Occupied Housing Units | 856 | 71.9% |
| Renter-Occupied Housing Units | 334 | 28.1% |
| Total Occupied Housing Units | 1,190 | 100.0% |
Occupancy by Household Size in Norco
| Household Size | # Housing Units | % Housing Units |
| 1-Person Household | 206 | 17.3% |
| 2-Person Household | 457 | 38.4% |
| 3-Person Household | 222 | 18.7% |
| 4+ Person Household | 305 | 25.6% |
| Total Housing Units | 1,190 | 100.0% |
Occupancy by Ownership by Household Size in Norco
| Household Size | Owner-occupied | Renter-occupied |
| 1-Person Household | 143 (69.4%) | 63 (30.6%) |
| 2-Person Household | 307 (67.2%) | 150 (32.8%) |
| 3-Person Household | 107 (48.2%) | 115 (51.8%) |
| 4+ Person Household | 299 (98.0%) | 6 (2.0%) |
| Total Housing Units | 856 (71.9%) | 334 (28.1%) |
Occupancy by Educational Attainment in Norco
| Household Size | Owner-occupied | Renter-occupied |
| Less than High School | 52 (38.0%) | 85 (62.0%) |
| High School Diploma | 382 (85.5%) | 65 (14.5%) |
| College/Associate Degree | 278 (68.0%) | 131 (32.0%) |
| Bachelor's Degree or higher | 144 (73.1%) | 53 (26.9%) |
Occupancy by Age of Householder in Norco
| Age Bracket | # Households | % Households |
| Under 35 Years | 278 | 23.4% |
| 35 to 44 Years | 320 | 26.9% |
| 45 to 54 Years | 123 | 10.3% |
| 55 to 64 Years | 249 | 20.9% |
| 65 to 74 Years | 76 | 6.4% |
| 75 to 84 Years | 110 | 9.2% |
| 85 Years and Over | 34 | 2.9% |
| Total | 1,190 | 100.0% |
Housing Finances in Norco
Median Income by Occupancy in Norco
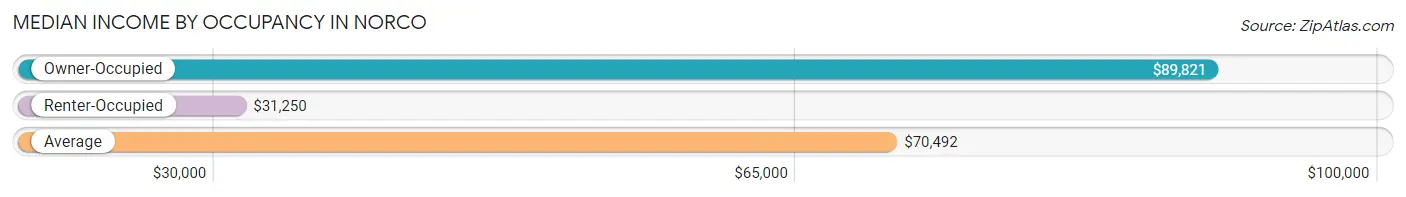
| Occupancy Type | # Households | Median Income |
| Owner-Occupied | 856 (71.9%) | $89,821 |
| Renter-Occupied | 334 (28.1%) | $31,250 |
| Average | 1,190 (100.0%) | $70,492 |
Occupancy by Householder Income Bracket in Norco
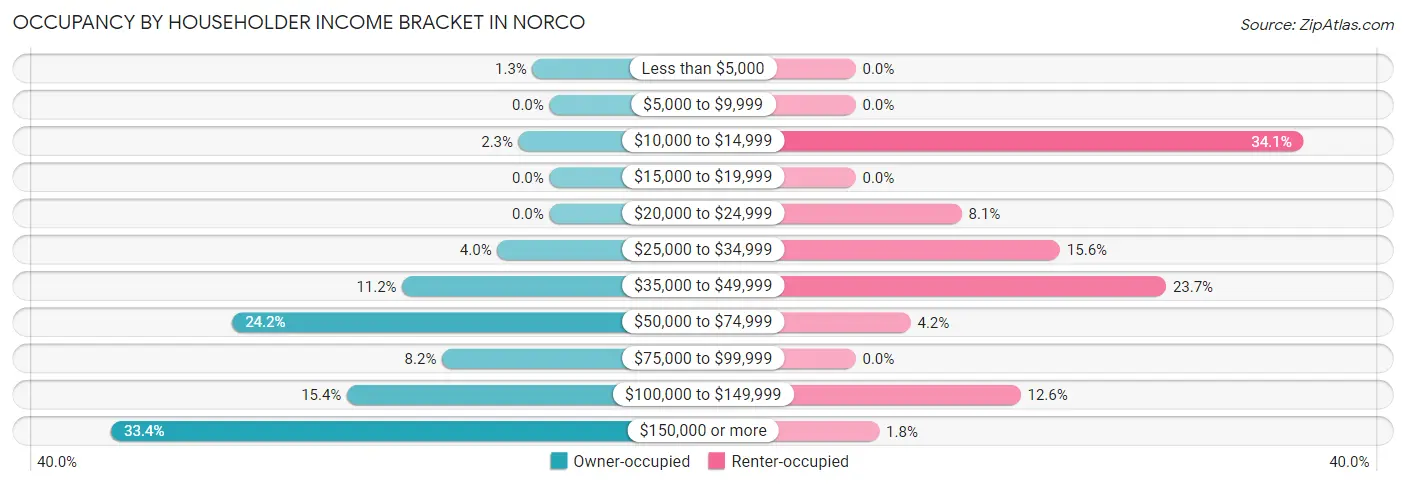
| Income Bracket | Owner-occupied | Renter-occupied |
| Less than $5,000 | 11 (1.3%) | 0 (0.0%) |
| $5,000 to $9,999 | 0 (0.0%) | 0 (0.0%) |
| $10,000 to $14,999 | 20 (2.3%) | 114 (34.1%) |
| $15,000 to $19,999 | 0 (0.0%) | 0 (0.0%) |
| $20,000 to $24,999 | 0 (0.0%) | 27 (8.1%) |
| $25,000 to $34,999 | 34 (4.0%) | 52 (15.6%) |
| $35,000 to $49,999 | 96 (11.2%) | 79 (23.6%) |
| $50,000 to $74,999 | 207 (24.2%) | 14 (4.2%) |
| $75,000 to $99,999 | 70 (8.2%) | 0 (0.0%) |
| $100,000 to $149,999 | 132 (15.4%) | 42 (12.6%) |
| $150,000 or more | 286 (33.4%) | 6 (1.8%) |
| Total | 856 (100.0%) | 334 (100.0%) |
Monthly Housing Cost Tiers in Norco
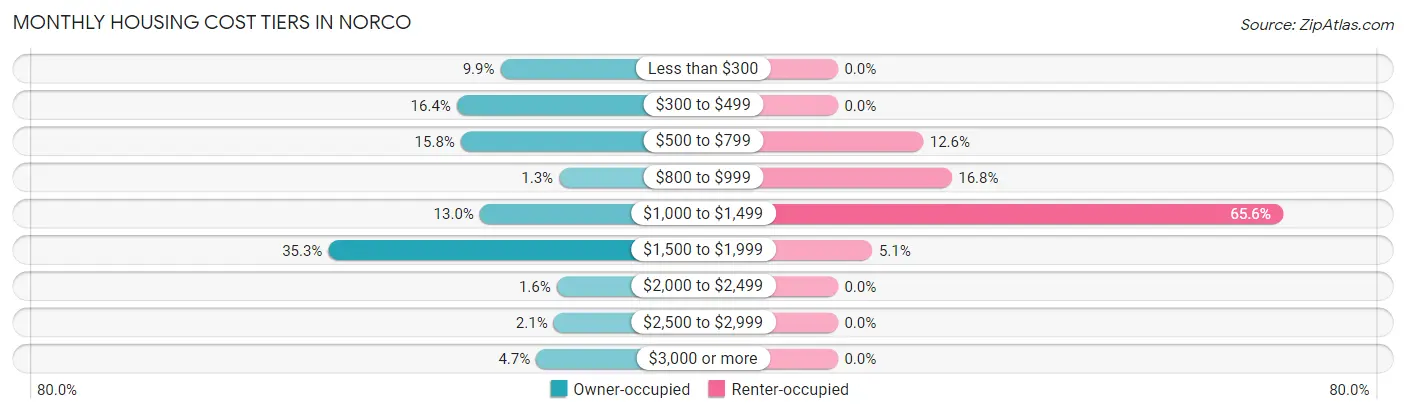
| Monthly Cost | Owner-occupied | Renter-occupied |
| Less than $300 | 85 (9.9%) | 0 (0.0%) |
| $300 to $499 | 140 (16.4%) | 0 (0.0%) |
| $500 to $799 | 135 (15.8%) | 42 (12.6%) |
| $800 to $999 | 11 (1.3%) | 56 (16.8%) |
| $1,000 to $1,499 | 111 (13.0%) | 219 (65.6%) |
| $1,500 to $1,999 | 302 (35.3%) | 17 (5.1%) |
| $2,000 to $2,499 | 14 (1.6%) | 0 (0.0%) |
| $2,500 to $2,999 | 18 (2.1%) | 0 (0.0%) |
| $3,000 or more | 40 (4.7%) | 0 (0.0%) |
| Total | 856 (100.0%) | 334 (100.0%) |
Physical Housing Characteristics in Norco
Housing Structures in Norco
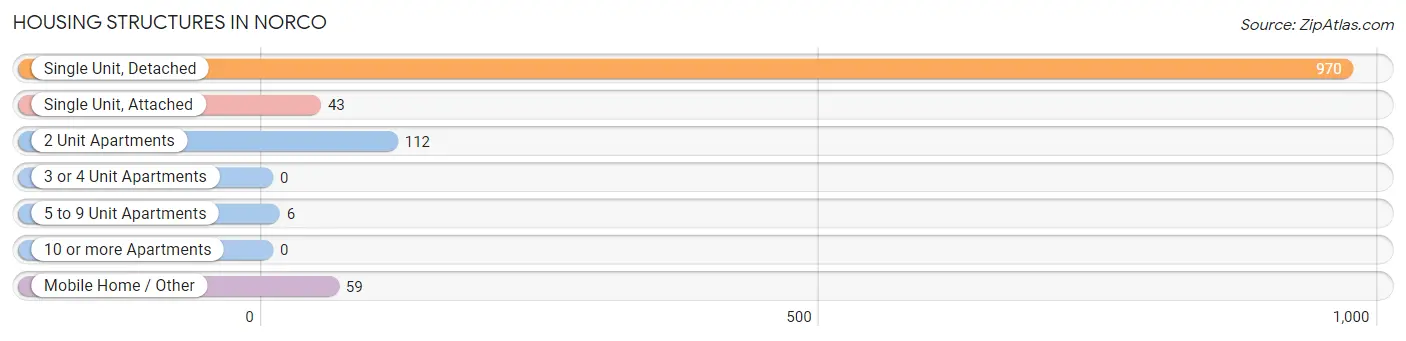
| Structure Type | # Housing Units | % Housing Units |
| Single Unit, Detached | 970 | 81.5% |
| Single Unit, Attached | 43 | 3.6% |
| 2 Unit Apartments | 112 | 9.4% |
| 3 or 4 Unit Apartments | 0 | 0.0% |
| 5 to 9 Unit Apartments | 6 | 0.5% |
| 10 or more Apartments | 0 | 0.0% |
| Mobile Home / Other | 59 | 5.0% |
| Total | 1,190 | 100.0% |
Housing Structures by Occupancy in Norco
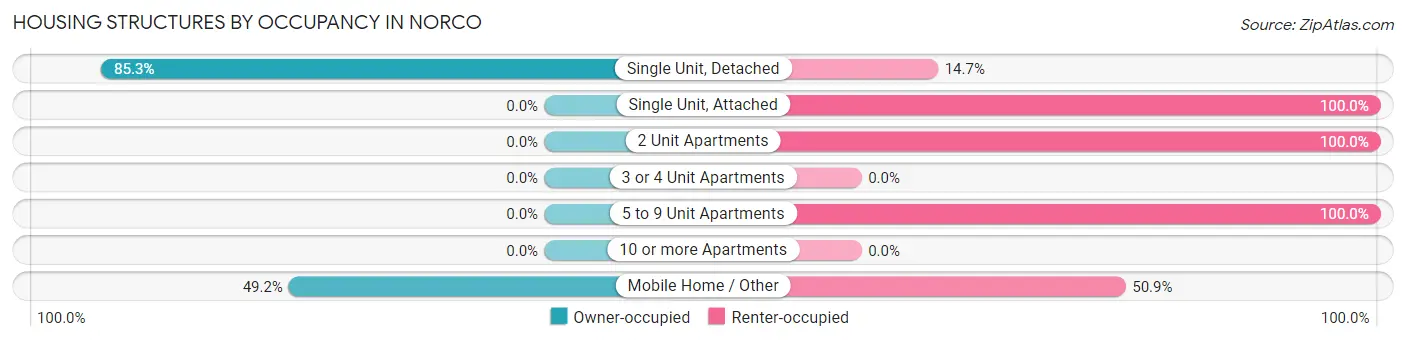
| Structure Type | Owner-occupied | Renter-occupied |
| Single Unit, Detached | 827 (85.3%) | 143 (14.7%) |
| Single Unit, Attached | 0 (0.0%) | 43 (100.0%) |
| 2 Unit Apartments | 0 (0.0%) | 112 (100.0%) |
| 3 or 4 Unit Apartments | 0 (0.0%) | 0 (0.0%) |
| 5 to 9 Unit Apartments | 0 (0.0%) | 6 (100.0%) |
| 10 or more Apartments | 0 (0.0%) | 0 (0.0%) |
| Mobile Home / Other | 29 (49.1%) | 30 (50.8%) |
| Total | 856 (71.9%) | 334 (28.1%) |
Housing Structures by Number of Rooms in Norco
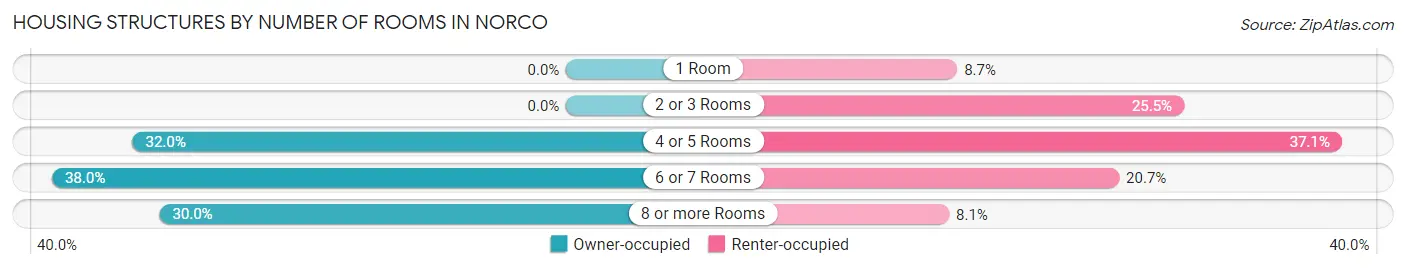
| Number of Rooms | Owner-occupied | Renter-occupied |
| 1 Room | 0 (0.0%) | 29 (8.7%) |
| 2 or 3 Rooms | 0 (0.0%) | 85 (25.5%) |
| 4 or 5 Rooms | 274 (32.0%) | 124 (37.1%) |
| 6 or 7 Rooms | 325 (38.0%) | 69 (20.7%) |
| 8 or more Rooms | 257 (30.0%) | 27 (8.1%) |
| Total | 856 (100.0%) | 334 (100.0%) |
Housing Structure by Heating Type in Norco
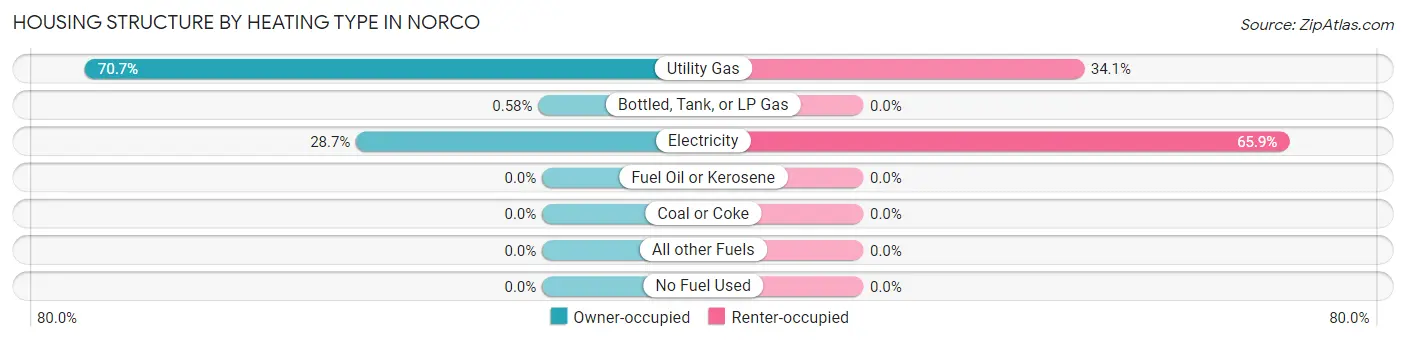
| Heating Type | Owner-occupied | Renter-occupied |
| Utility Gas | 605 (70.7%) | 114 (34.1%) |
| Bottled, Tank, or LP Gas | 5 (0.6%) | 0 (0.0%) |
| Electricity | 246 (28.7%) | 220 (65.9%) |
| Fuel Oil or Kerosene | 0 (0.0%) | 0 (0.0%) |
| Coal or Coke | 0 (0.0%) | 0 (0.0%) |
| All other Fuels | 0 (0.0%) | 0 (0.0%) |
| No Fuel Used | 0 (0.0%) | 0 (0.0%) |
| Total | 856 (100.0%) | 334 (100.0%) |
Household Vehicle Usage in Norco
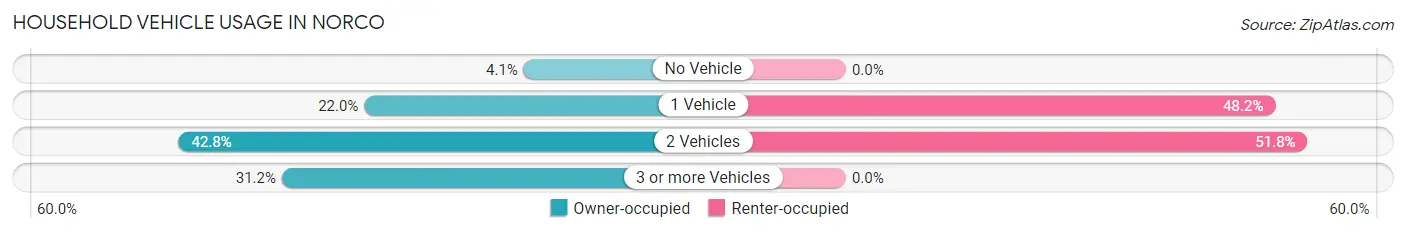
| Vehicles per Household | Owner-occupied | Renter-occupied |
| No Vehicle | 35 (4.1%) | 0 (0.0%) |
| 1 Vehicle | 188 (22.0%) | 161 (48.2%) |
| 2 Vehicles | 366 (42.8%) | 173 (51.8%) |
| 3 or more Vehicles | 267 (31.2%) | 0 (0.0%) |
| Total | 856 (100.0%) | 334 (100.0%) |
Real Estate & Mortgages in Norco
Real Estate and Mortgage Overview in Norco
| Characteristic | Without Mortgage | With Mortgage |
| Housing Units | 372 | 484 |
| Median Property Value | $180,400 | $260,200 |
| Median Household Income | $66,111 | $248 |
| Monthly Housing Costs | $451 | $29 |
| Real Estate Taxes | $551 | $42 |
Property Value by Mortgage Status in Norco
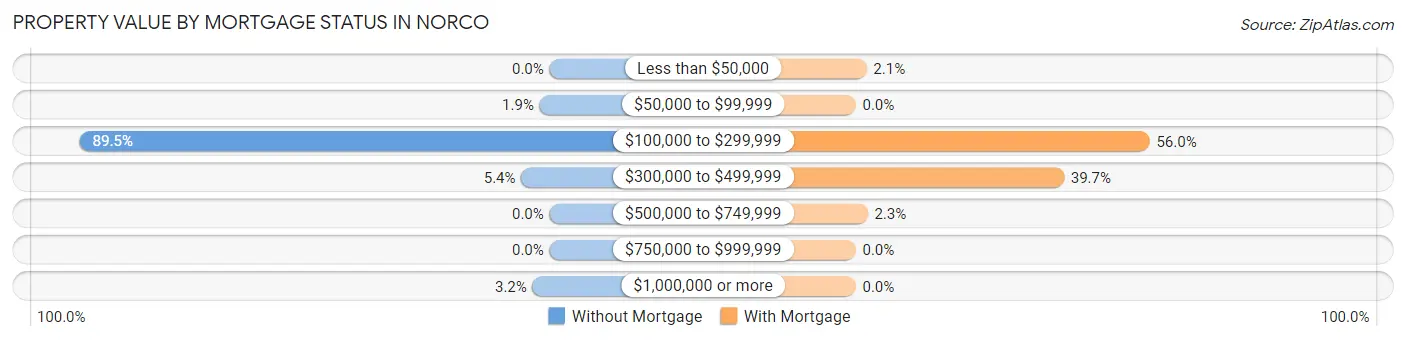
| Property Value | Without Mortgage | With Mortgage |
| Less than $50,000 | 0 (0.0%) | 10 (2.1%) |
| $50,000 to $99,999 | 7 (1.9%) | 0 (0.0%) |
| $100,000 to $299,999 | 333 (89.5%) | 271 (56.0%) |
| $300,000 to $499,999 | 20 (5.4%) | 192 (39.7%) |
| $500,000 to $749,999 | 0 (0.0%) | 11 (2.3%) |
| $750,000 to $999,999 | 0 (0.0%) | 0 (0.0%) |
| $1,000,000 or more | 12 (3.2%) | 0 (0.0%) |
| Total | 372 (100.0%) | 484 (100.0%) |
Household Income by Mortgage Status in Norco
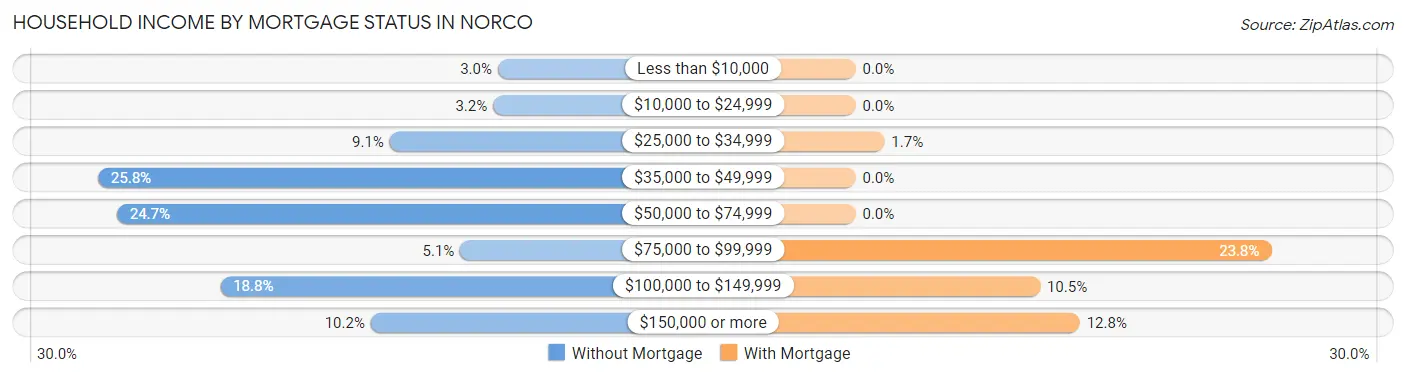
| Household Income | Without Mortgage | With Mortgage |
| Less than $10,000 | 11 (3.0%) | 0 (0.0%) |
| $10,000 to $24,999 | 12 (3.2%) | 0 (0.0%) |
| $25,000 to $34,999 | 34 (9.1%) | 8 (1.7%) |
| $35,000 to $49,999 | 96 (25.8%) | 0 (0.0%) |
| $50,000 to $74,999 | 92 (24.7%) | 0 (0.0%) |
| $75,000 to $99,999 | 19 (5.1%) | 115 (23.8%) |
| $100,000 to $149,999 | 70 (18.8%) | 51 (10.5%) |
| $150,000 or more | 38 (10.2%) | 62 (12.8%) |
| Total | 372 (100.0%) | 484 (100.0%) |
Property Value to Household Income Ratio in Norco
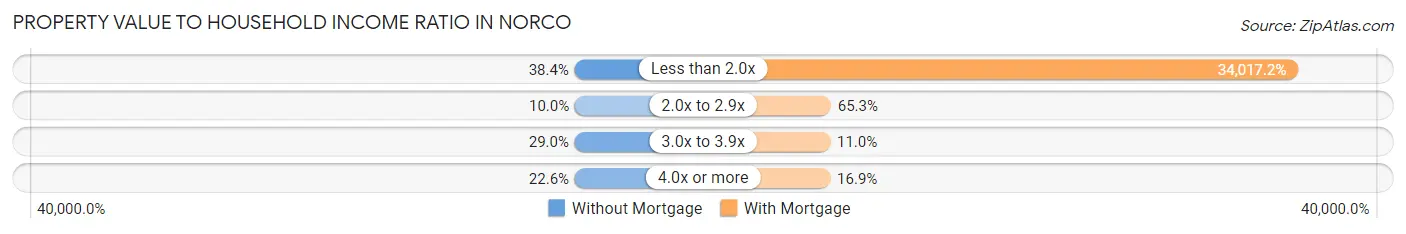
| Value-to-Income Ratio | Without Mortgage | With Mortgage |
| Less than 2.0x | 143 (38.4%) | 164,643 (34,017.1%) |
| 2.0x to 2.9x | 37 (10.0%) | 316 (65.3%) |
| 3.0x to 3.9x | 108 (29.0%) | 53 (11.0%) |
| 4.0x or more | 84 (22.6%) | 82 (16.9%) |
| Total | 372 (100.0%) | 484 (100.0%) |
Real Estate Taxes by Mortgage Status in Norco
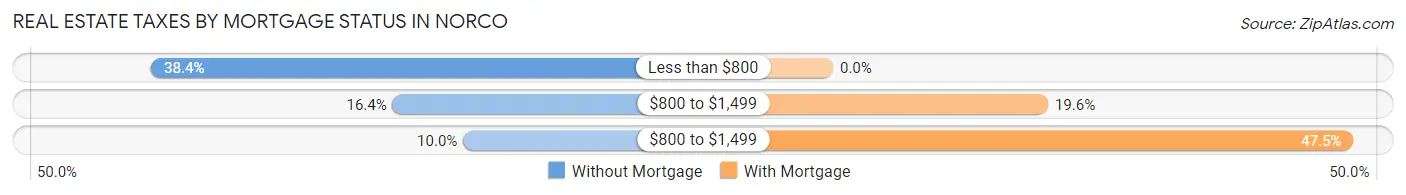
| Property Taxes | Without Mortgage | With Mortgage |
| Less than $800 | 143 (38.4%) | 0 (0.0%) |
| $800 to $1,499 | 61 (16.4%) | 95 (19.6%) |
| $800 to $1,499 | 37 (10.0%) | 230 (47.5%) |
| Total | 372 (100.0%) | 484 (100.0%) |
Health & Disability in Norco
Health Insurance Coverage by Age in Norco
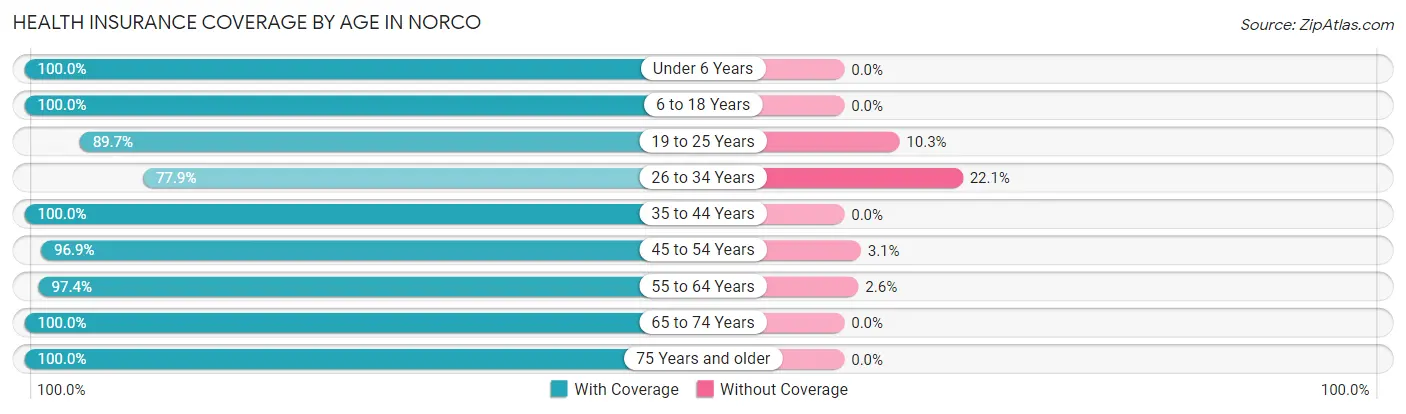
| Age Bracket | With Coverage | Without Coverage |
| Under 6 Years | 319 (100.0%) | 0 (0.0%) |
| 6 to 18 Years | 319 (100.0%) | 0 (0.0%) |
| 19 to 25 Years | 96 (89.7%) | 11 (10.3%) |
| 26 to 34 Years | 353 (77.9%) | 100 (22.1%) |
| 35 to 44 Years | 560 (100.0%) | 0 (0.0%) |
| 45 to 54 Years | 220 (96.9%) | 7 (3.1%) |
| 55 to 64 Years | 445 (97.4%) | 12 (2.6%) |
| 65 to 74 Years | 157 (100.0%) | 0 (0.0%) |
| 75 Years and older | 249 (100.0%) | 0 (0.0%) |
| Total | 2,718 (95.4%) | 130 (4.6%) |
Health Insurance Coverage by Citizenship Status in Norco
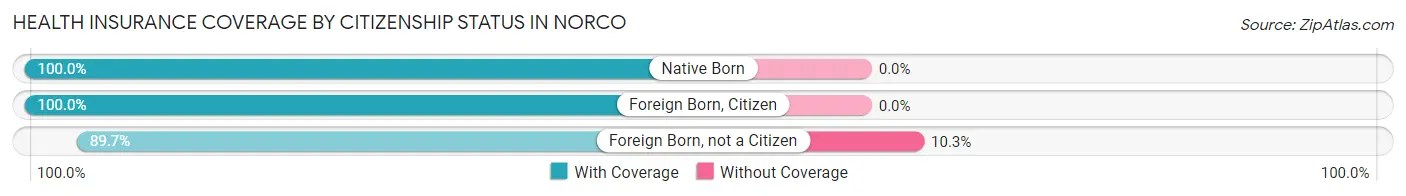
| Citizenship Status | With Coverage | Without Coverage |
| Native Born | 319 (100.0%) | 0 (0.0%) |
| Foreign Born, Citizen | 319 (100.0%) | 0 (0.0%) |
| Foreign Born, not a Citizen | 96 (89.7%) | 11 (10.3%) |
Health Insurance Coverage by Household Income in Norco
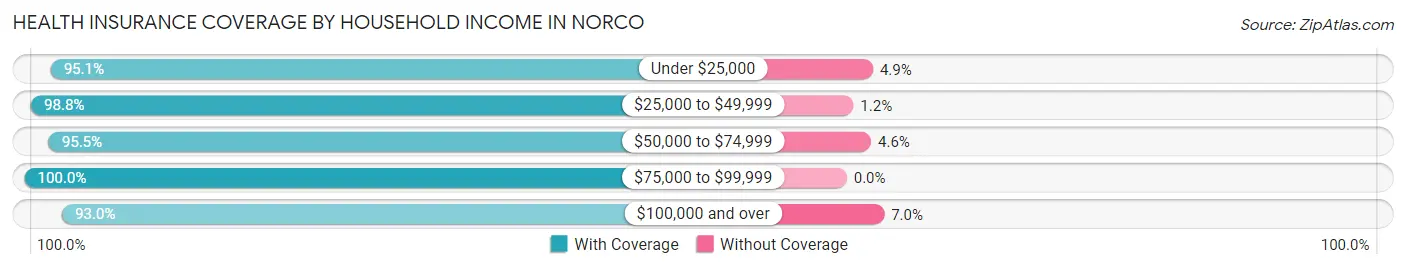
| Household Income | With Coverage | Without Coverage |
| Under $25,000 | 330 (95.1%) | 17 (4.9%) |
| $25,000 to $49,999 | 557 (98.8%) | 7 (1.2%) |
| $50,000 to $74,999 | 630 (95.5%) | 30 (4.5%) |
| $75,000 to $99,999 | 193 (100.0%) | 0 (0.0%) |
| $100,000 and over | 1,008 (93.0%) | 76 (7.0%) |
Public vs Private Health Insurance Coverage by Age in Norco
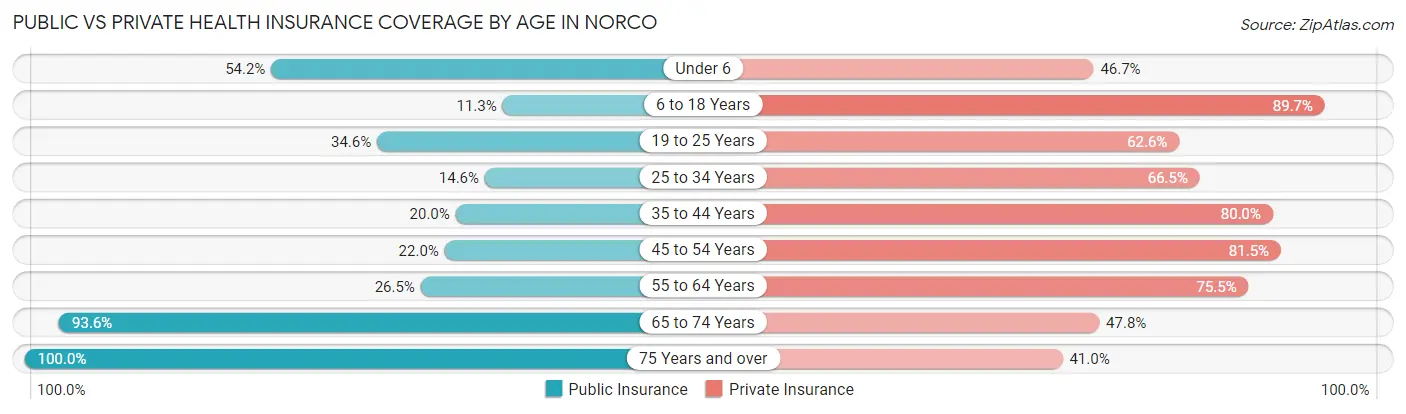
| Age Bracket | Public Insurance | Private Insurance |
| Under 6 | 173 (54.2%) | 149 (46.7%) |
| 6 to 18 Years | 36 (11.3%) | 286 (89.7%) |
| 19 to 25 Years | 37 (34.6%) | 67 (62.6%) |
| 25 to 34 Years | 66 (14.6%) | 301 (66.4%) |
| 35 to 44 Years | 112 (20.0%) | 448 (80.0%) |
| 45 to 54 Years | 50 (22.0%) | 185 (81.5%) |
| 55 to 64 Years | 121 (26.5%) | 345 (75.5%) |
| 65 to 74 Years | 147 (93.6%) | 75 (47.8%) |
| 75 Years and over | 249 (100.0%) | 102 (41.0%) |
| Total | 991 (34.8%) | 1,958 (68.8%) |
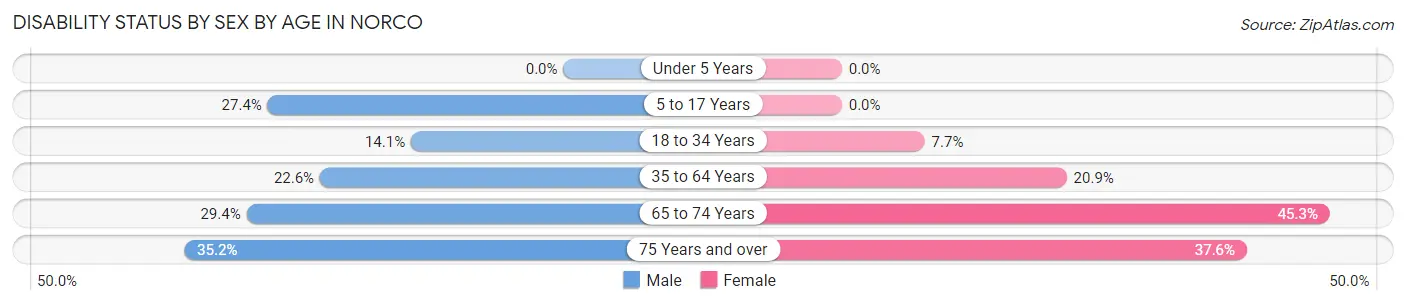
Disability Status by Sex by Age in Norco
| Age Bracket | Male | Female |
| Under 5 Years | 0 (0.0%) | 0 (0.0%) |
| 5 to 17 Years | 59 (27.4%) | 0 (0.0%) |
| 18 to 34 Years | 43 (14.1%) | 22 (7.7%) |
| 35 to 64 Years | 162 (22.6%) | 110 (20.9%) |
| 65 to 74 Years | 15 (29.4%) | 48 (45.3%) |
| 75 Years and over | 38 (35.2%) | 53 (37.6%) |
Disability Class by Sex by Age in Norco
Disability Class: Hearing Difficulty
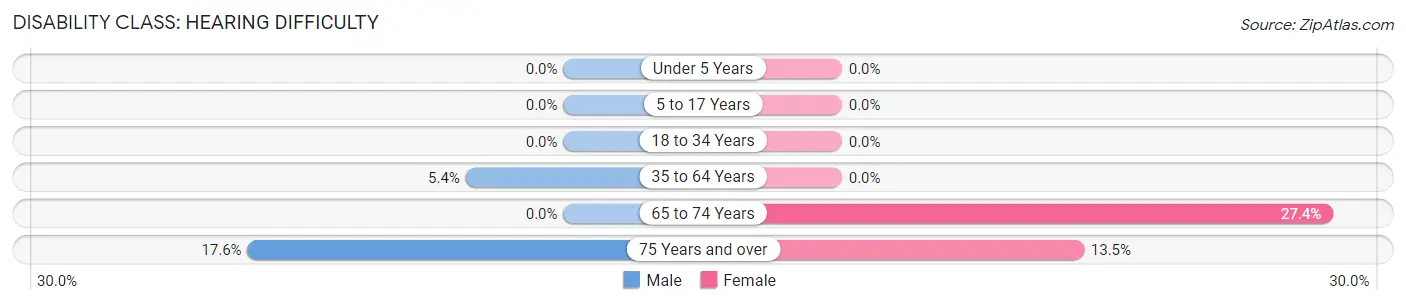
| Age Bracket | Male | Female |
| Under 5 Years | 0 (0.0%) | 0 (0.0%) |
| 5 to 17 Years | 0 (0.0%) | 0 (0.0%) |
| 18 to 34 Years | 0 (0.0%) | 0 (0.0%) |
| 35 to 64 Years | 39 (5.4%) | 0 (0.0%) |
| 65 to 74 Years | 0 (0.0%) | 29 (27.4%) |
| 75 Years and over | 19 (17.6%) | 19 (13.5%) |
Disability Class: Vision Difficulty
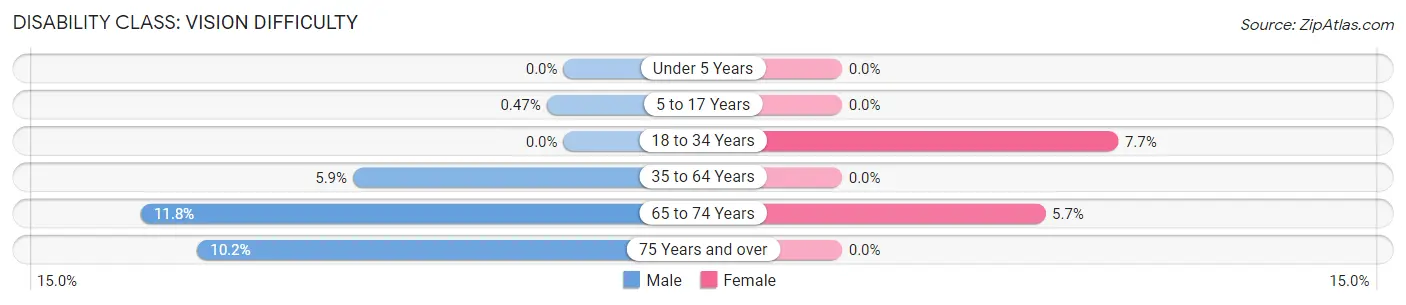
| Age Bracket | Male | Female |
| Under 5 Years | 0 (0.0%) | 0 (0.0%) |
| 5 to 17 Years | 1 (0.5%) | 0 (0.0%) |
| 18 to 34 Years | 0 (0.0%) | 22 (7.7%) |
| 35 to 64 Years | 42 (5.9%) | 0 (0.0%) |
| 65 to 74 Years | 6 (11.8%) | 6 (5.7%) |
| 75 Years and over | 11 (10.2%) | 0 (0.0%) |
Disability Class: Cognitive Difficulty
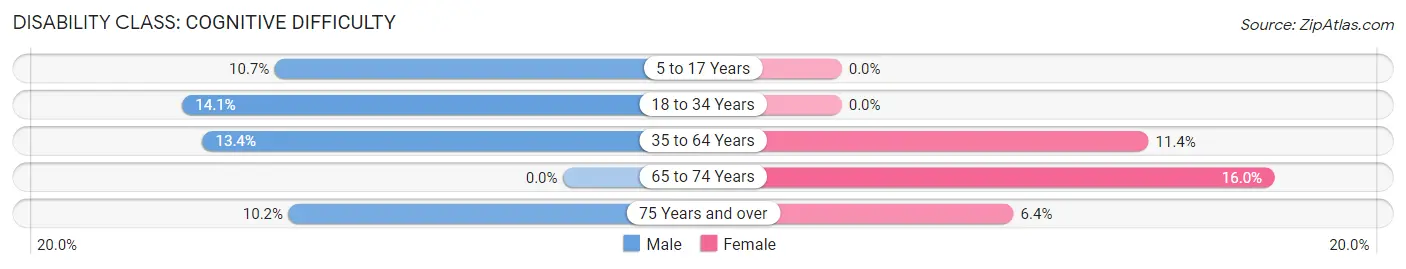
| Age Bracket | Male | Female |
| 5 to 17 Years | 23 (10.7%) | 0 (0.0%) |
| 18 to 34 Years | 43 (14.1%) | 0 (0.0%) |
| 35 to 64 Years | 96 (13.4%) | 60 (11.4%) |
| 65 to 74 Years | 0 (0.0%) | 17 (16.0%) |
| 75 Years and over | 11 (10.2%) | 9 (6.4%) |
Disability Class: Ambulatory Difficulty
| Age Bracket | Male | Female |
| 5 to 17 Years | 0 (0.0%) | 0 (0.0%) |
| 18 to 34 Years | 29 (9.5%) | 0 (0.0%) |
| 35 to 64 Years | 54 (7.5%) | 46 (8.7%) |
| 65 to 74 Years | 9 (17.6%) | 13 (12.3%) |
| 75 Years and over | 30 (27.8%) | 53 (37.6%) |
Disability Class: Self-Care Difficulty
| Age Bracket | Male | Female |
| 5 to 17 Years | 36 (16.7%) | 0 (0.0%) |
| 18 to 34 Years | 29 (9.5%) | 0 (0.0%) |
| 35 to 64 Years | 0 (0.0%) | 0 (0.0%) |
| 65 to 74 Years | 0 (0.0%) | 3 (2.8%) |
| 75 Years and over | 21 (19.4%) | 9 (6.4%) |
Technology Access in Norco
Computing Device Access in Norco
| Device Type | # Households | % Households |
| Desktop or Laptop | 891 | 74.9% |
| Smartphone | 1,016 | 85.4% |
| Tablet | 789 | 66.3% |
| No Computing Device | 107 | 9.0% |
| Total | 1,190 | 100.0% |
Internet Access in Norco
| Internet Type | # Households | % Households |
| Dial-Up Internet | 0 | 0.0% |
| Broadband Home | 817 | 68.7% |
| Cellular Data Only | 84 | 7.1% |
| Satellite Internet | 115 | 9.7% |
| No Internet | 172 | 14.4% |
| Total | 1,190 | 100.0% |
Norco Summary
History
Norco, Louisiana is a small town located in St. Charles Parish, Louisiana. It is situated on the banks of the Mississippi River, approximately 25 miles west of New Orleans. The town was founded in 1883 by the Norco Land and Improvement Company, which was formed by a group of investors from New Orleans. The town was named after the Norco Sugar Refinery, which was built in the area in 1884. The refinery was the first of its kind in the United States and was the largest sugar refinery in the world at the time.
The town of Norco grew rapidly in the late 19th and early 20th centuries, becoming a major center for the sugar industry. The town was home to several large sugar refineries, as well as a number of other businesses related to the sugar industry. The town also had a thriving port, which was used to ship sugar and other goods to and from the area.
In the early 20th century, Norco was a major center for the oil and gas industry. The town was home to several large oil refineries, as well as a number of other businesses related to the oil and gas industry. The town also had a thriving port, which was used to ship oil and other goods to and from the area.
In the late 20th century, Norco began to diversify its economy. The town is now home to a number of businesses, including a large chemical plant, a paper mill, and a number of other industrial and commercial businesses. The town is also home to a number of retail stores, restaurants, and other businesses.
Geography
Norco is located in St. Charles Parish, Louisiana, on the banks of the Mississippi River. The town is situated approximately 25 miles west of New Orleans. The town is bordered by the towns of Destrehan to the north, Luling to the east, and Paradis to the south. The town is located in a flat, low-lying area, with the Mississippi River to the west and the Gulf of Mexico to the south.
The climate in Norco is humid subtropical, with hot, humid summers and mild winters. The average annual temperature is around 70 degrees Fahrenheit, with temperatures ranging from the mid-50s in the winter to the mid-90s in the summer. The average annual precipitation is around 60 inches, with most of the rain falling in the summer months.
Economy
Norco’s economy is largely based on the oil and gas industry, as well as the sugar industry. The town is home to several large oil refineries, as well as a number of other businesses related to the oil and gas industry. The town also has a thriving port, which is used to ship oil and other goods to and from the area.
The town is also home to a number of other businesses, including a large chemical plant, a paper mill, and a number of other industrial and commercial businesses. The town is also home to a number of retail stores, restaurants, and other businesses.
Demographics
As of the 2010 census, the population of Norco was 5,719. The racial makeup of the town was 79.3% White, 17.2% African American, 0.5% Native American, 0.7% Asian, 0.1% Pacific Islander, and 2.2% from other races. Hispanic or Latino of any race were 3.2% of the population.
The median household income in Norco was $45,938, and the median family income was $54,938. The per capita income in Norco was $20,938. About 11.2% of families and 14.2% of the population were below the poverty line, including 18.2% of those under age 18 and 8.2% of those age 65 or over.
Common Questions
What is Per Capita Income in Norco?
Per Capita income in Norco is $45,074.
What is the Median Family Income in Norco?
Median Family Income in Norco is $83,897.
What is the Median Household income in Norco?
Median Household Income in Norco is $70,492.
What is Income or Wage Gap in Norco?
Income or Wage Gap in Norco is 58.5%.
Women in Norco earn 41.5 cents for every dollar earned by a man.
What is Inequality or Gini Index in Norco?
Inequality or Gini Index in Norco is 0.45.
What is the Total Population of Norco?
Total Population of Norco is 2,848.
What is the Total Male Population of Norco?
Total Male Population of Norco is 1,456.
What is the Total Female Population of Norco?
Total Female Population of Norco is 1,392.
What is the Ratio of Males per 100 Females in Norco?
There are 104.60 Males per 100 Females in Norco.
What is the Ratio of Females per 100 Males in Norco?
There are 95.60 Females per 100 Males in Norco.
What is the Median Population Age in Norco?
Median Population Age in Norco is 39.2 Years.
What is the Average Family Size in Norco
Average Family Size in Norco is 2.7 People.
What is the Average Household Size in Norco
Average Household Size in Norco is 2.4 People.
How Large is the Labor Force in Norco?
There are 1,469 People in the Labor Forcein in Norco.
What is the Percentage of People in the Labor Force in Norco?
65.6% of People are in the Labor Force in Norco.
What is the Unemployment Rate in Norco?
Unemployment Rate in Norco is 3.0%.