Montpelier, LA Map & Demographics
Montpelier Map
Montpelier Overview
$33,748
PER CAPITA INCOME
$48,125
AVG HOUSEHOLD INCOME
0.56
INEQUALITY / GINI INDEX
390
TOTAL POPULATION
171
MALE POPULATION
219
FEMALE POPULATION
78.08
MALES / 100 FEMALES
128.07
FEMALES / 100 MALES
38.0
MEDIAN AGE
4.4
AVG FAMILY SIZE
3.5
AVG HOUSEHOLD SIZE
272
LABOR FORCE [ PEOPLE ]
80.5%
PERCENT IN LABOR FORCE
28.3%
UNEMPLOYMENT RATE
Income in Montpelier
Income Overview in Montpelier
| Characteristic | Number | Measure |
| Per Capita Income | 390 | $33,748 |
| Median Family Income | 62 | $0 |
| Mean Family Income | 62 | $120,323 |
| Median Household Income | 110 | $48,125 |
| Mean Household Income | 110 | $76,158 |
| Income Deficit | 62 | $0 |
| Wage / Income Gap (%) | 390 | 0.00% |
| Wage / Income Gap ($) | 390 | 100.00¢ per $1 |
| Gini / Inequality Index | 390 | 0.56 |
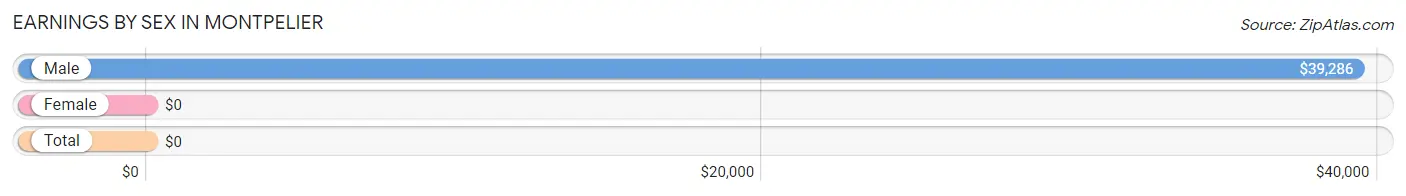
Earnings by Sex in Montpelier
| Sex | Number | Average Earnings |
| Male | 114 (42.2%) | $39,286 |
| Female | 156 (57.8%) | $0 |
| Total | 270 (100.0%) | $0 |
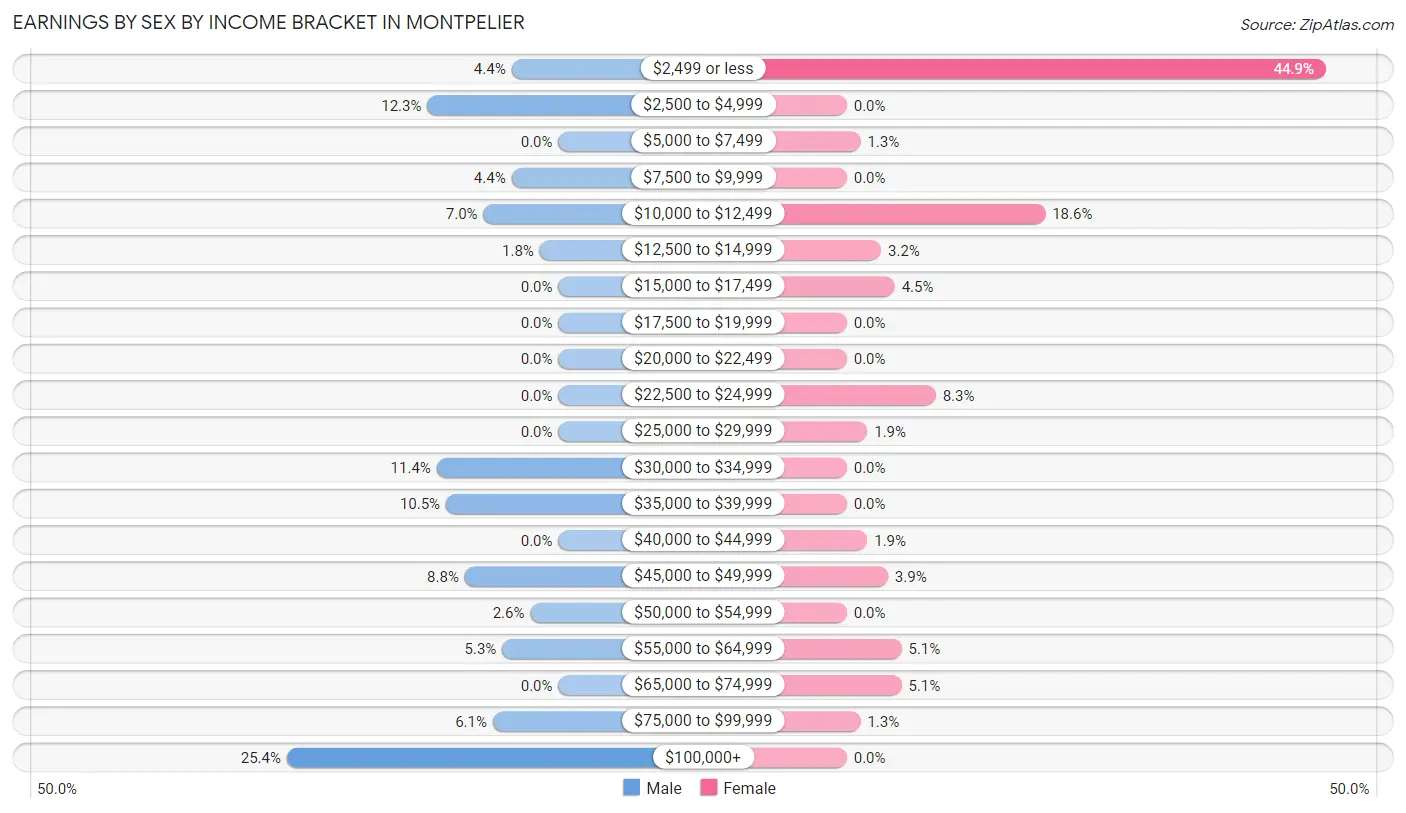
Earnings by Sex by Income Bracket in Montpelier
The most common earnings brackets in Montpelier are $100,000+ for men (29 | 25.4%) and $2,499 or less for women (70 | 44.9%).
| Income | Male | Female |
| $2,499 or less | 5 (4.4%) | 70 (44.9%) |
| $2,500 to $4,999 | 14 (12.3%) | 0 (0.0%) |
| $5,000 to $7,499 | 0 (0.0%) | 2 (1.3%) |
| $7,500 to $9,999 | 5 (4.4%) | 0 (0.0%) |
| $10,000 to $12,499 | 8 (7.0%) | 29 (18.6%) |
| $12,500 to $14,999 | 2 (1.8%) | 5 (3.2%) |
| $15,000 to $17,499 | 0 (0.0%) | 7 (4.5%) |
| $17,500 to $19,999 | 0 (0.0%) | 0 (0.0%) |
| $20,000 to $22,499 | 0 (0.0%) | 0 (0.0%) |
| $22,500 to $24,999 | 0 (0.0%) | 13 (8.3%) |
| $25,000 to $29,999 | 0 (0.0%) | 3 (1.9%) |
| $30,000 to $34,999 | 13 (11.4%) | 0 (0.0%) |
| $35,000 to $39,999 | 12 (10.5%) | 0 (0.0%) |
| $40,000 to $44,999 | 0 (0.0%) | 3 (1.9%) |
| $45,000 to $49,999 | 10 (8.8%) | 6 (3.8%) |
| $50,000 to $54,999 | 3 (2.6%) | 0 (0.0%) |
| $55,000 to $64,999 | 6 (5.3%) | 8 (5.1%) |
| $65,000 to $74,999 | 0 (0.0%) | 8 (5.1%) |
| $75,000 to $99,999 | 7 (6.1%) | 2 (1.3%) |
| $100,000+ | 29 (25.4%) | 0 (0.0%) |
| Total | 114 (100.0%) | 156 (100.0%) |
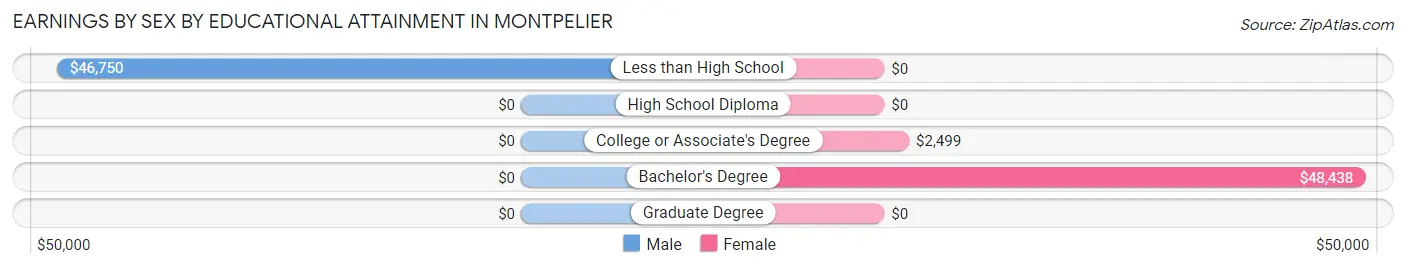
Earnings by Sex by Educational Attainment in Montpelier
| Educational Attainment | Male Income | Female Income |
| Less than High School | $46,750 | $0 |
| High School Diploma | - | - |
| College or Associate's Degree | - | - |
| Bachelor's Degree | - | - |
| Graduate Degree | - | - |
| Total | $46,250 | $0 |
Family Income in Montpelier
Family Income Brackets in Montpelier
According to the Montpelier family income data, there are 20 families falling into the $50,000 to $74,999 income range, which is the most common income bracket and makes up 32.3% of all families.
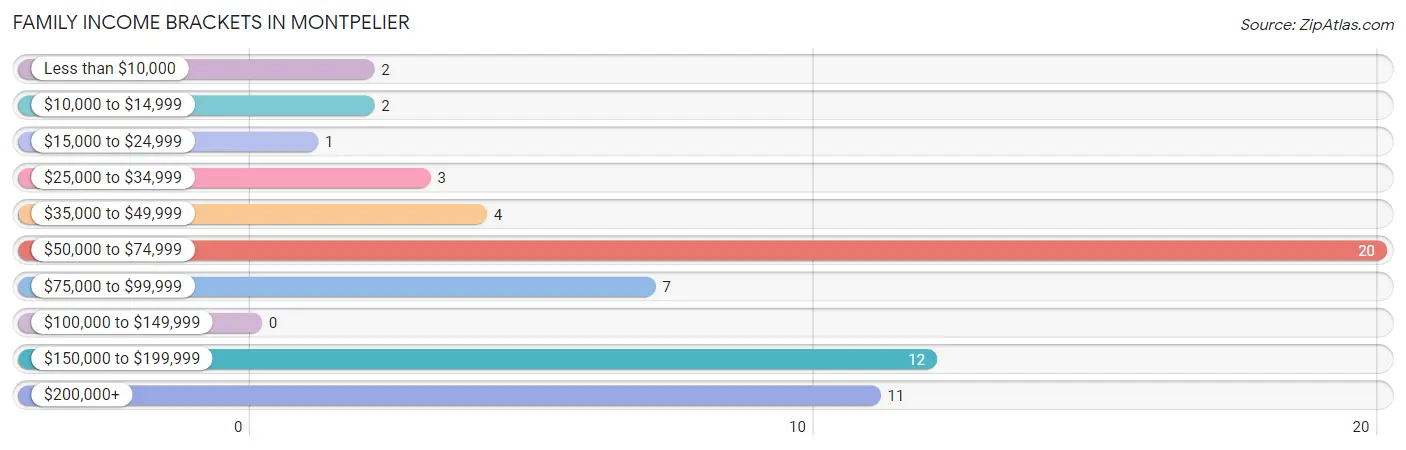
| Income Bracket | # Families | % Families |
| Less than $10,000 | 2 | 3.2% |
| $10,000 to $14,999 | 2 | 3.2% |
| $15,000 to $24,999 | 1 | 1.6% |
| $25,000 to $34,999 | 3 | 4.8% |
| $35,000 to $49,999 | 4 | 6.5% |
| $50,000 to $74,999 | 20 | 32.3% |
| $75,000 to $99,999 | 7 | 11.3% |
| $100,000 to $149,999 | 0 | 0.0% |
| $150,000 to $199,999 | 12 | 19.4% |
| $200,000+ | 11 | 17.7% |
Family Income by Famaliy Size in Montpelier
4-person families (24 | 38.7%) account for the highest median family income in Montpelier with $76,250 per family, while 4-person families (24 | 38.7%) have the highest median income of $19,062 per family member.
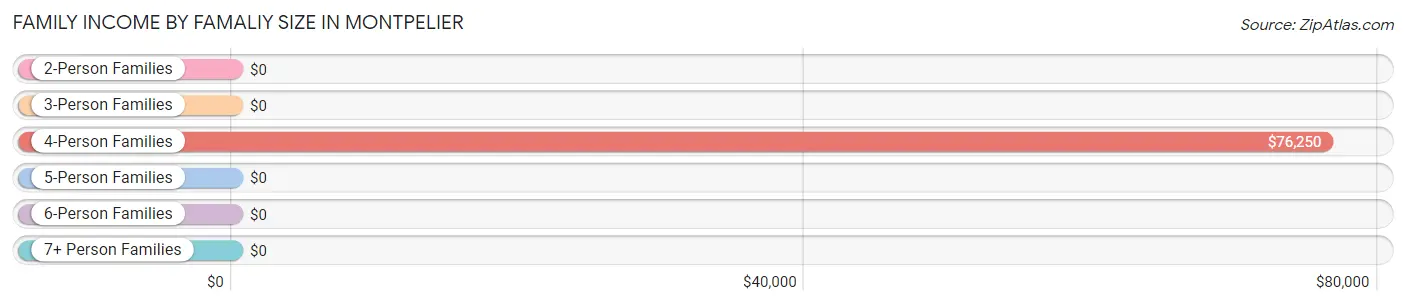
| Income Bracket | # Families | Median Income |
| 2-Person Families | 19 (30.6%) | $0 |
| 3-Person Families | 19 (30.6%) | $0 |
| 4-Person Families | 24 (38.7%) | $76,250 |
| 5-Person Families | 0 (0.0%) | $0 |
| 6-Person Families | 0 (0.0%) | $0 |
| 7+ Person Families | 0 (0.0%) | $0 |
| Total | 62 (100.0%) | $0 |
Family Income by Number of Earners in Montpelier
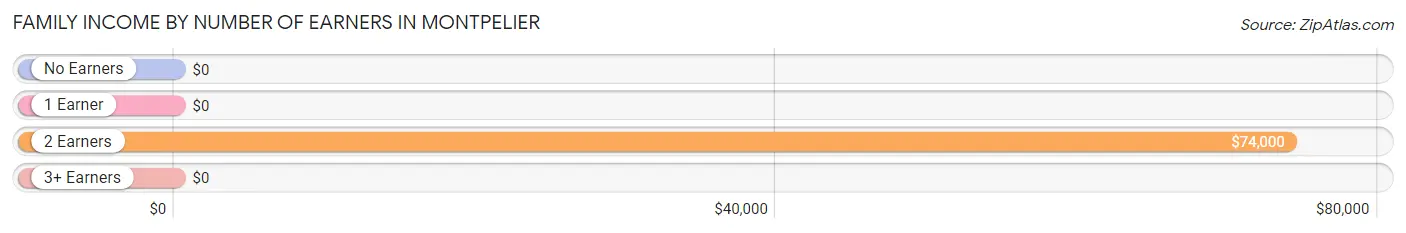
| Number of Earners | # Families | Median Income |
| No Earners | 4 (6.5%) | $0 |
| 1 Earner | 11 (17.7%) | $0 |
| 2 Earners | 42 (67.7%) | $74,000 |
| 3+ Earners | 5 (8.1%) | $0 |
| Total | 62 (100.0%) | $0 |
Household Income in Montpelier
Household Income Brackets in Montpelier
With 20 households falling in the category, the $50,000 to $74,999 income range is the most frequent in Montpelier, accounting for 18.2% of all households.
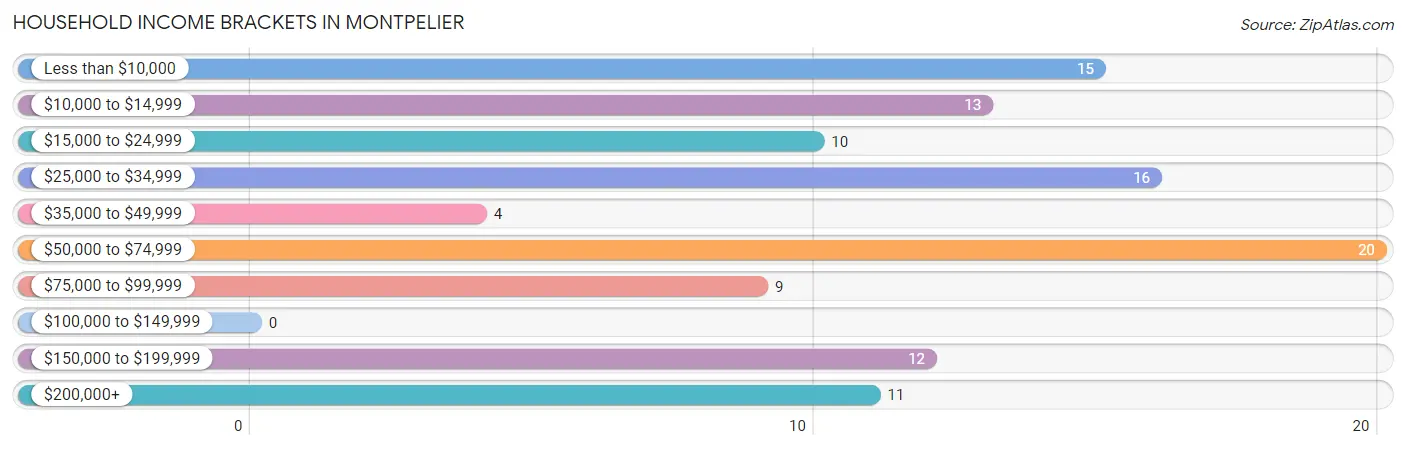
| Income Bracket | # Households | % Households |
| Less than $10,000 | 15 | 13.6% |
| $10,000 to $14,999 | 13 | 11.8% |
| $15,000 to $24,999 | 10 | 9.1% |
| $25,000 to $34,999 | 16 | 14.5% |
| $35,000 to $49,999 | 4 | 3.6% |
| $50,000 to $74,999 | 20 | 18.2% |
| $75,000 to $99,999 | 9 | 8.2% |
| $100,000 to $149,999 | 0 | 0.0% |
| $150,000 to $199,999 | 12 | 10.9% |
| $200,000+ | 11 | 10.0% |
Household Income by Householder Age in Montpelier
| Income Bracket | # Households | Median Income |
| 15 to 24 Years | 2 (1.8%) | $0 |
| 25 to 44 Years | 28 (25.5%) | $0 |
| 45 to 64 Years | 60 (54.5%) | $0 |
| 65+ Years | 20 (18.2%) | $0 |
| Total | 110 (100.0%) | $48,125 |
Poverty in Montpelier
Income Below Poverty by Sex and Age in Montpelier
With 17.0% poverty level for males and 40.6% for females among the residents of Montpelier, under 5 year old males and under 5 year old females are the most vulnerable to poverty, with 7 males (100.0%) and 2 females (100.0%) in their respective age groups living below the poverty level.
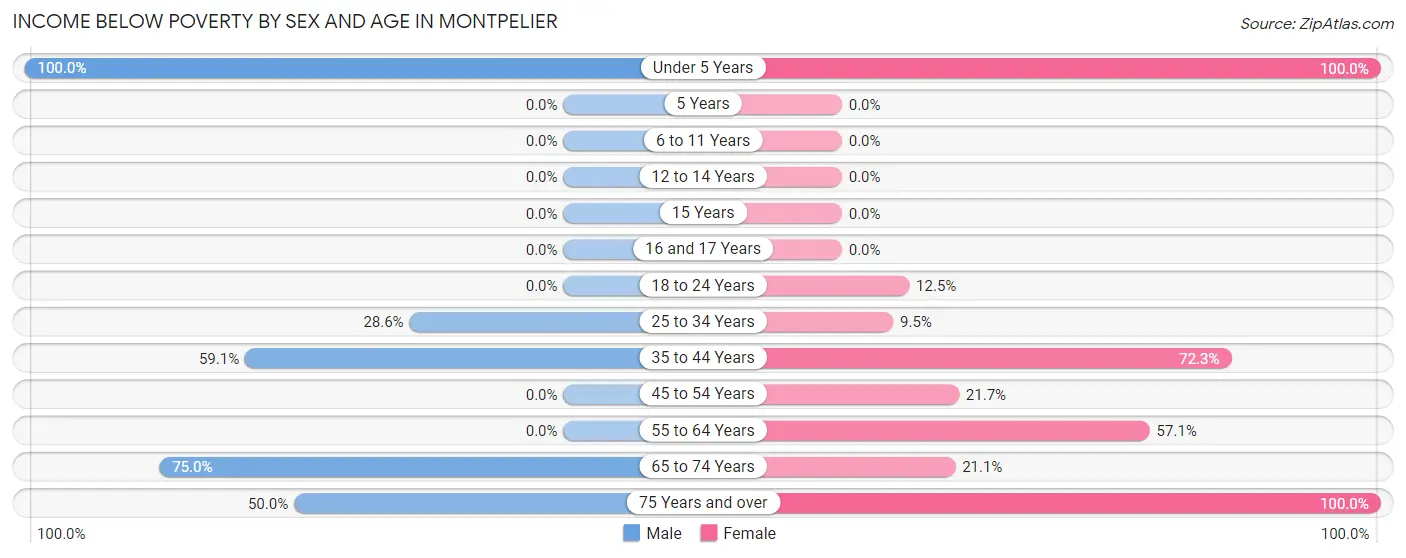
| Age Bracket | Male | Female |
| Under 5 Years | 7 (100.0%) | 2 (100.0%) |
| 5 Years | 0 (0.0%) | 0 (0.0%) |
| 6 to 11 Years | 0 (0.0%) | 0 (0.0%) |
| 12 to 14 Years | 0 (0.0%) | 0 (0.0%) |
| 15 Years | 0 (0.0%) | 0 (0.0%) |
| 16 and 17 Years | 0 (0.0%) | 0 (0.0%) |
| 18 to 24 Years | 0 (0.0%) | 2 (12.5%) |
| 25 to 34 Years | 2 (28.6%) | 2 (9.5%) |
| 35 to 44 Years | 13 (59.1%) | 60 (72.3%) |
| 45 to 54 Years | 0 (0.0%) | 5 (21.7%) |
| 55 to 64 Years | 0 (0.0%) | 12 (57.1%) |
| 65 to 74 Years | 6 (75.0%) | 4 (21.0%) |
| 75 Years and over | 1 (50.0%) | 2 (100.0%) |
| Total | 29 (17.0%) | 89 (40.6%) |
Income Above Poverty by Sex and Age in Montpelier
According to the poverty statistics in Montpelier, males aged 5 years and females aged 6 to 11 years are the age groups that are most secure financially, with 100.0% of males and 100.0% of females in these age groups living above the poverty line.
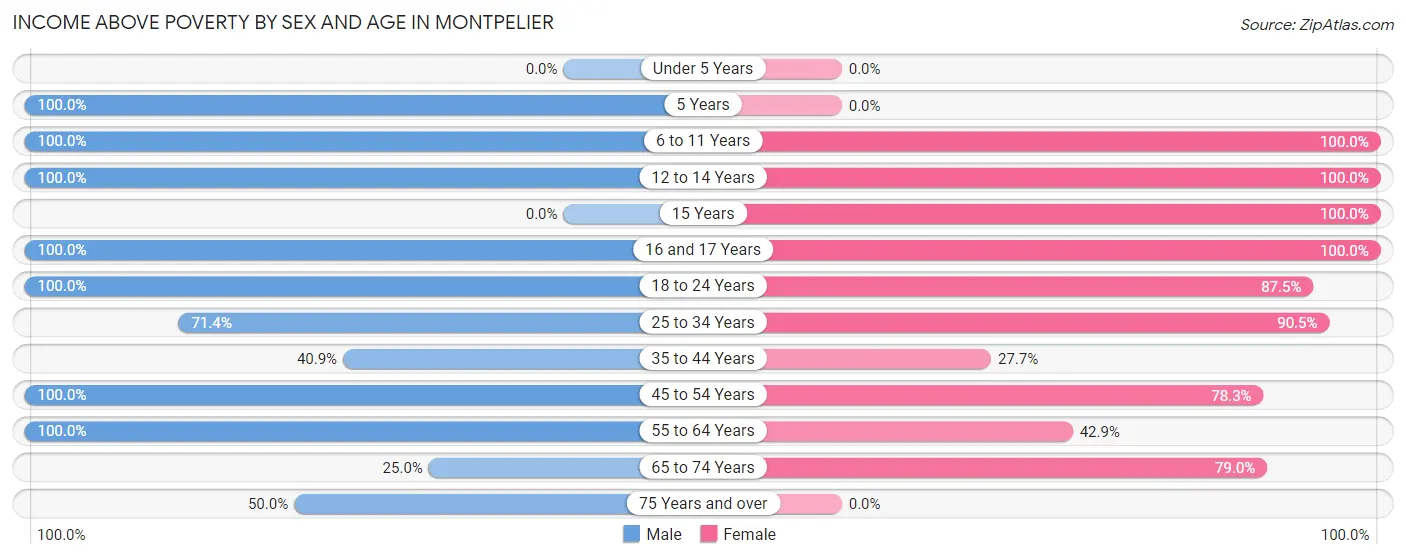
| Age Bracket | Male | Female |
| Under 5 Years | 0 (0.0%) | 0 (0.0%) |
| 5 Years | 4 (100.0%) | 0 (0.0%) |
| 6 to 11 Years | 5 (100.0%) | 17 (100.0%) |
| 12 to 14 Years | 5 (100.0%) | 3 (100.0%) |
| 15 Years | 0 (0.0%) | 9 (100.0%) |
| 16 and 17 Years | 26 (100.0%) | 3 (100.0%) |
| 18 to 24 Years | 12 (100.0%) | 14 (87.5%) |
| 25 to 34 Years | 5 (71.4%) | 19 (90.5%) |
| 35 to 44 Years | 9 (40.9%) | 23 (27.7%) |
| 45 to 54 Years | 45 (100.0%) | 18 (78.3%) |
| 55 to 64 Years | 28 (100.0%) | 9 (42.9%) |
| 65 to 74 Years | 2 (25.0%) | 15 (78.9%) |
| 75 Years and over | 1 (50.0%) | 0 (0.0%) |
| Total | 142 (83.0%) | 130 (59.4%) |
Income Below Poverty Among Married-Couple Families in Montpelier
The poverty statistics for married-couple families in Montpelier show that 6.0% or 3 of the total 50 families live below the poverty line. Families with 1 or 2 children have the highest poverty rate of 6.2%, comprising of 2 families. On the other hand, families with no children have the lowest poverty rate of 5.6%, which includes 1 families.
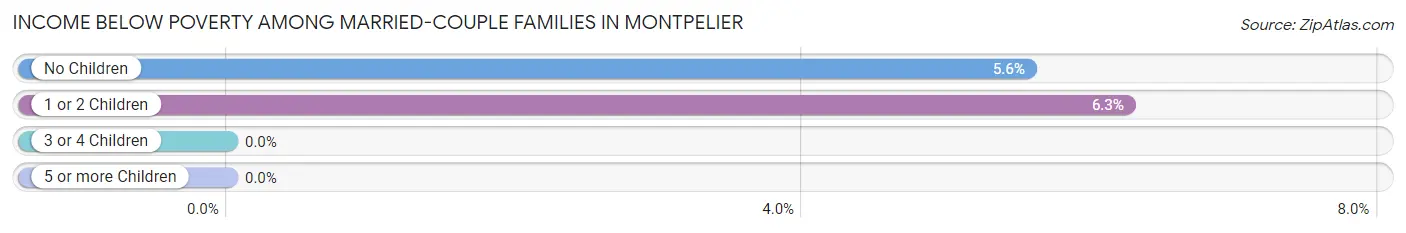
| Children | Above Poverty | Below Poverty |
| No Children | 17 (94.4%) | 1 (5.6%) |
| 1 or 2 Children | 30 (93.8%) | 2 (6.2%) |
| 3 or 4 Children | 0 (0.0%) | 0 (0.0%) |
| 5 or more Children | 0 (0.0%) | 0 (0.0%) |
| Total | 47 (94.0%) | 3 (6.0%) |
Income Below Poverty Among Single-Parent Households in Montpelier
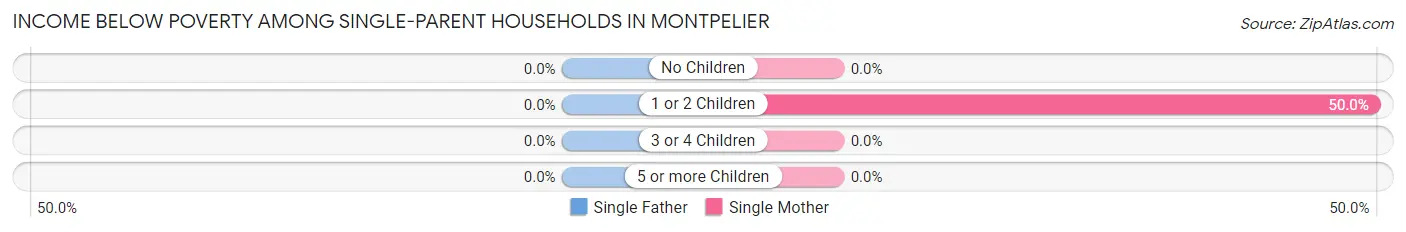
| Children | Single Father | Single Mother |
| No Children | 0 (0.0%) | 0 (0.0%) |
| 1 or 2 Children | 0 (0.0%) | 2 (50.0%) |
| 3 or 4 Children | 0 (0.0%) | 0 (0.0%) |
| 5 or more Children | 0 (0.0%) | 0 (0.0%) |
| Total | 0 (0.0%) | 2 (18.2%) |
Income Below Poverty Among Married-Couple vs Single-Parent Households in Montpelier
The poverty data for Montpelier shows that 3 of the married-couple family households (6.0%) and 2 of the single-parent households (16.7%) are living below the poverty level. Within the married-couple family households, those with 1 or 2 children have the highest poverty rate, with 2 households (6.2%) falling below the poverty line. Among the single-parent households, those with 1 or 2 children have the highest poverty rate, with 2 household (50.0%) living below poverty.
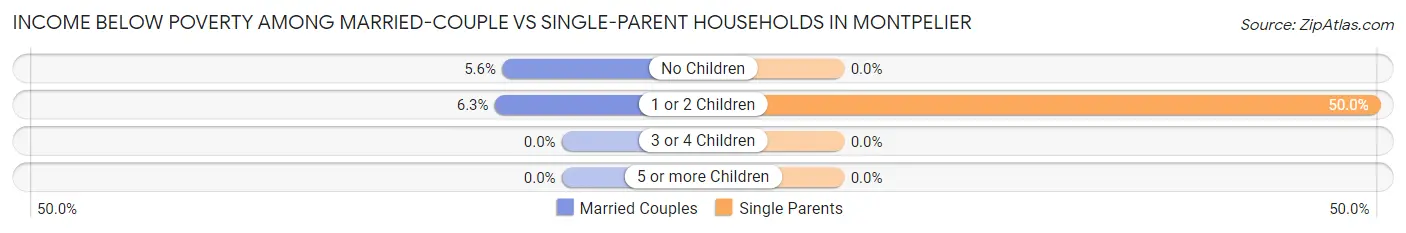
| Children | Married-Couple Families | Single-Parent Households |
| No Children | 1 (5.6%) | 0 (0.0%) |
| 1 or 2 Children | 2 (6.2%) | 2 (50.0%) |
| 3 or 4 Children | 0 (0.0%) | 0 (0.0%) |
| 5 or more Children | 0 (0.0%) | 0 (0.0%) |
| Total | 3 (6.0%) | 2 (16.7%) |
Race in Montpelier
The most populous races in Montpelier are White / Caucasian (310 | 79.5%), Black / African American (76 | 19.5%), and Hispanic or Latino (27 | 6.9%).
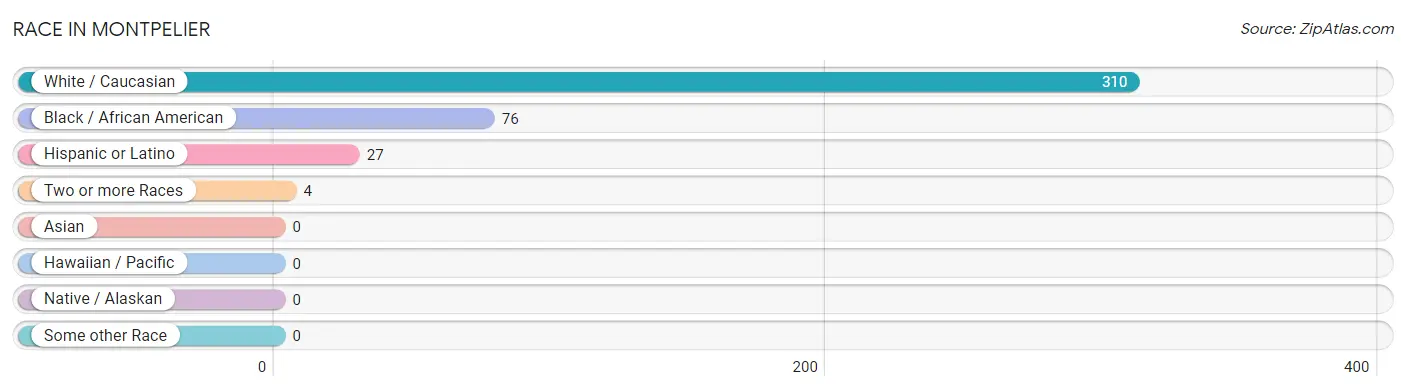
| Race | # Population | % Population |
| Asian | 0 | 0.0% |
| Black / African American | 76 | 19.5% |
| Hawaiian / Pacific | 0 | 0.0% |
| Hispanic or Latino | 27 | 6.9% |
| Native / Alaskan | 0 | 0.0% |
| White / Caucasian | 310 | 79.5% |
| Two or more Races | 4 | 1.0% |
| Some other Race | 0 | 0.0% |
| Total | 390 | 100.0% |
Ancestry in Montpelier
The most populous ancestries reported in Montpelier are English (72 | 18.5%), Irish (38 | 9.7%), French (34 | 8.7%), Italian (34 | 8.7%), and American (17 | 4.4%), together accounting for 50.0% of all Montpelier residents.
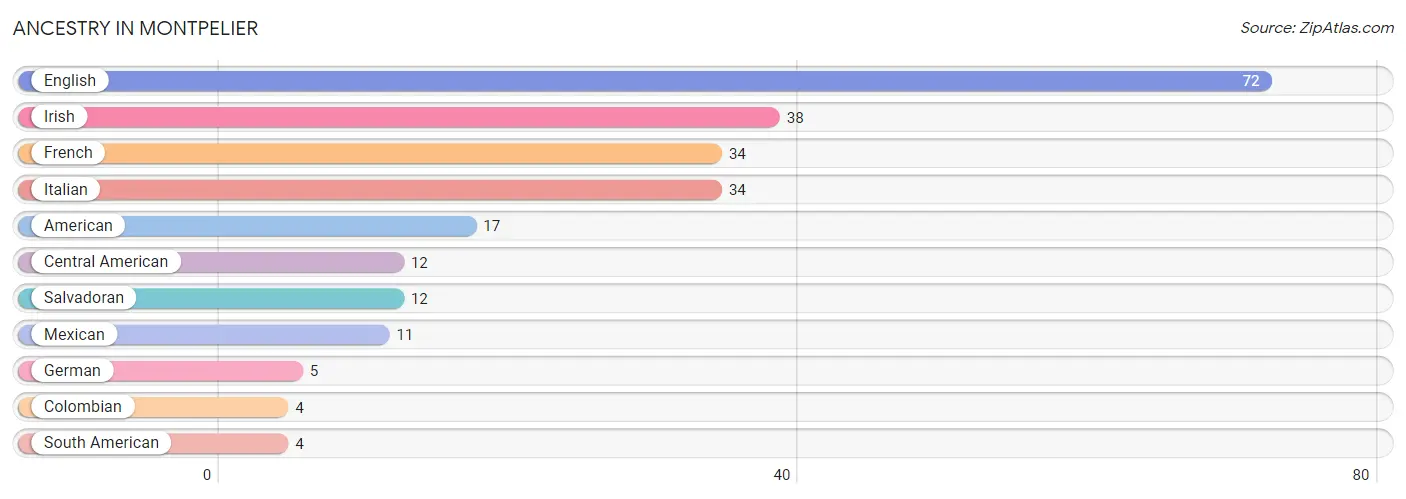
| Ancestry | # Population | % Population |
| American | 17 | 4.4% |
| Central American | 12 | 3.1% |
| Colombian | 4 | 1.0% |
| English | 72 | 18.5% |
| French | 34 | 8.7% |
| German | 5 | 1.3% |
| Irish | 38 | 9.7% |
| Italian | 34 | 8.7% |
| Mexican | 11 | 2.8% |
| Salvadoran | 12 | 3.1% |
| South American | 4 | 1.0% | View All 11 Rows |
Immigrants in Montpelier
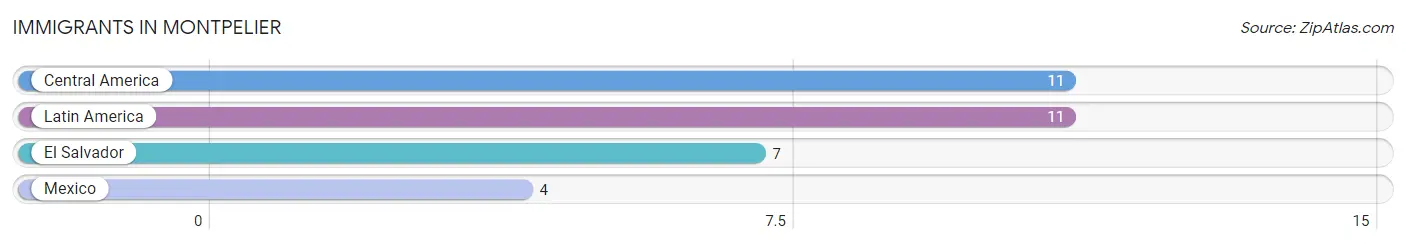
The most numerous immigrant groups reported in Montpelier came from Central America (11 | 2.8%), Latin America (11 | 2.8%), El Salvador (7 | 1.8%), and Mexico (4 | 1.0%), together accounting for 8.5% of all Montpelier residents.
| Immigration Origin | # Population | % Population |
| Central America | 11 | 2.8% |
| El Salvador | 7 | 1.8% |
| Latin America | 11 | 2.8% |
| Mexico | 4 | 1.0% | View All 4 Rows |
Sex and Age in Montpelier
Sex and Age in Montpelier
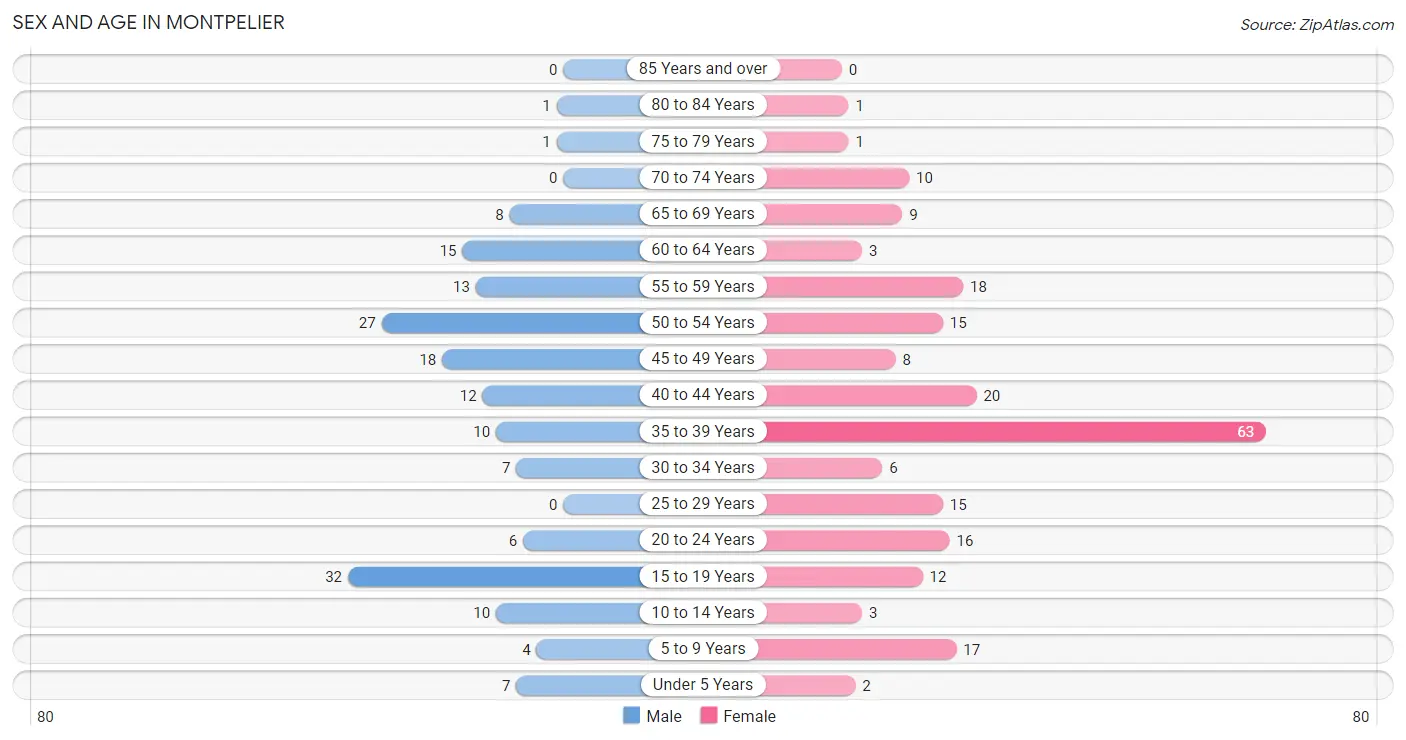
The most populous age groups in Montpelier are 15 to 19 Years (32 | 18.7%) for men and 35 to 39 Years (63 | 28.8%) for women.
| Age Bracket | Male | Female |
| Under 5 Years | 7 (4.1%) | 2 (0.9%) |
| 5 to 9 Years | 4 (2.3%) | 17 (7.8%) |
| 10 to 14 Years | 10 (5.9%) | 3 (1.4%) |
| 15 to 19 Years | 32 (18.7%) | 12 (5.5%) |
| 20 to 24 Years | 6 (3.5%) | 16 (7.3%) |
| 25 to 29 Years | 0 (0.0%) | 15 (6.9%) |
| 30 to 34 Years | 7 (4.1%) | 6 (2.7%) |
| 35 to 39 Years | 10 (5.9%) | 63 (28.8%) |
| 40 to 44 Years | 12 (7.0%) | 20 (9.1%) |
| 45 to 49 Years | 18 (10.5%) | 8 (3.6%) |
| 50 to 54 Years | 27 (15.8%) | 15 (6.9%) |
| 55 to 59 Years | 13 (7.6%) | 18 (8.2%) |
| 60 to 64 Years | 15 (8.8%) | 3 (1.4%) |
| 65 to 69 Years | 8 (4.7%) | 9 (4.1%) |
| 70 to 74 Years | 0 (0.0%) | 10 (4.6%) |
| 75 to 79 Years | 1 (0.6%) | 1 (0.5%) |
| 80 to 84 Years | 1 (0.6%) | 1 (0.5%) |
| 85 Years and over | 0 (0.0%) | 0 (0.0%) |
| Total | 171 (100.0%) | 219 (100.0%) |
Families and Households in Montpelier
Median Family Size in Montpelier
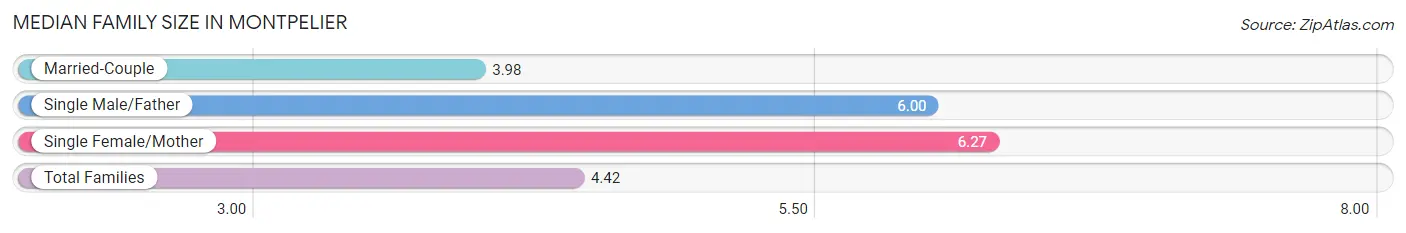
The median family size in Montpelier is 4.42 persons per family, with single female/mother families (11 | 17.7%) accounting for the largest median family size of 6.27 persons per family. On the other hand, married-couple families (50 | 80.6%) represent the smallest median family size with 3.98 persons per family.
| Family Type | # Families | Family Size |
| Married-Couple | 50 (80.6%) | 3.98 |
| Single Male/Father | 1 (1.6%) | 6.00 |
| Single Female/Mother | 11 (17.7%) | 6.27 |
| Total Families | 62 (100.0%) | 4.42 |
Median Household Size in Montpelier
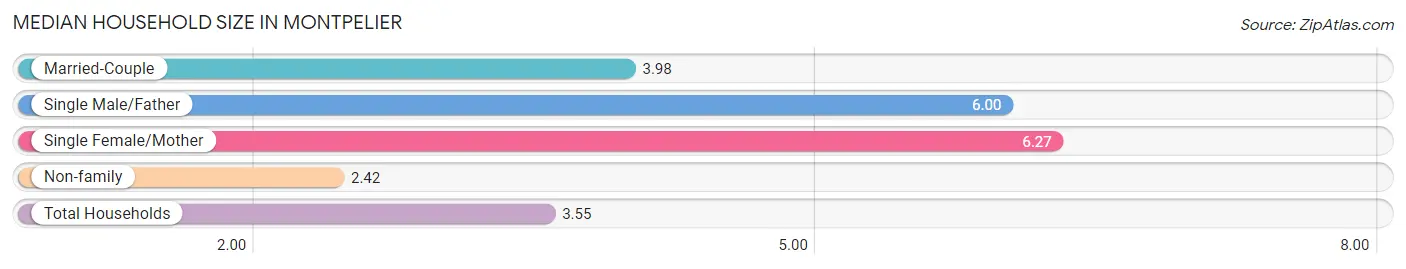
The median household size in Montpelier is 3.55 persons per household, with single female/mother households (11 | 10.0%) accounting for the largest median household size of 6.27 persons per household. non-family households (48 | 43.6%) represent the smallest median household size with 2.42 persons per household.
| Household Type | # Households | Household Size |
| Married-Couple | 50 (45.5%) | 3.98 |
| Single Male/Father | 1 (0.9%) | 6.00 |
| Single Female/Mother | 11 (10.0%) | 6.27 |
| Non-family | 48 (43.6%) | 2.42 |
| Total Households | 110 (100.0%) | 3.55 |
Household Size by Marriage Status in Montpelier
Out of a total of 110 households in Montpelier, 62 (56.4%) are family households, while 48 (43.6%) are nonfamily households. The most numerous type of family households are 4-person households, comprising 24, and the most common type of nonfamily households are 1-person households, comprising 39.
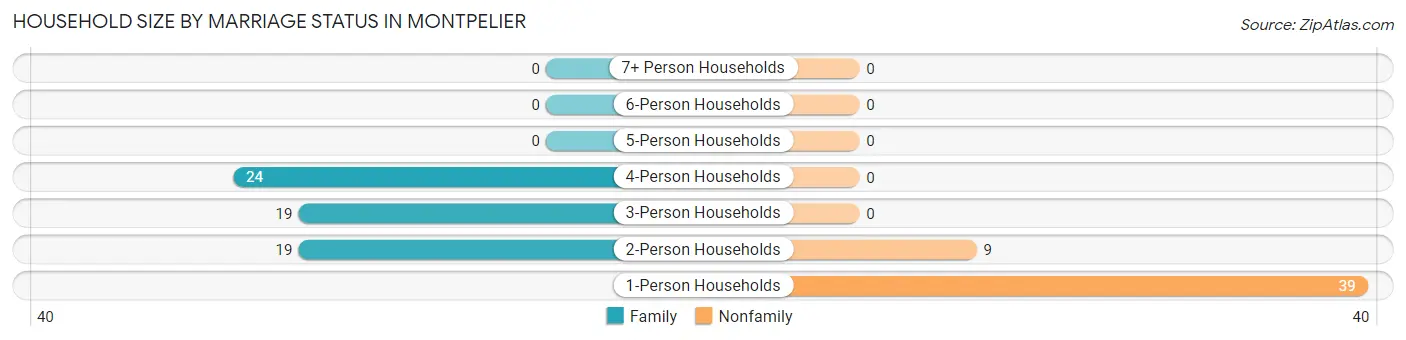
| Household Size | Family Households | Nonfamily Households |
| 1-Person Households | - | 39 (35.4%) |
| 2-Person Households | 19 (17.3%) | 9 (8.2%) |
| 3-Person Households | 19 (17.3%) | 0 (0.0%) |
| 4-Person Households | 24 (21.8%) | 0 (0.0%) |
| 5-Person Households | 0 (0.0%) | 0 (0.0%) |
| 6-Person Households | 0 (0.0%) | 0 (0.0%) |
| 7+ Person Households | 0 (0.0%) | 0 (0.0%) |
| Total | 62 (56.4%) | 48 (43.6%) |
Female Fertility in Montpelier
Fertility by Age in Montpelier
Average fertility rate in Montpelier is 13.0 births per 1,000 women. Women in the age bracket of 20 to 34 years have the highest fertility rate with 54.0 births per 1,000 women. Women in the age bracket of 20 to 34 years acount for 100.0% of all women with births.
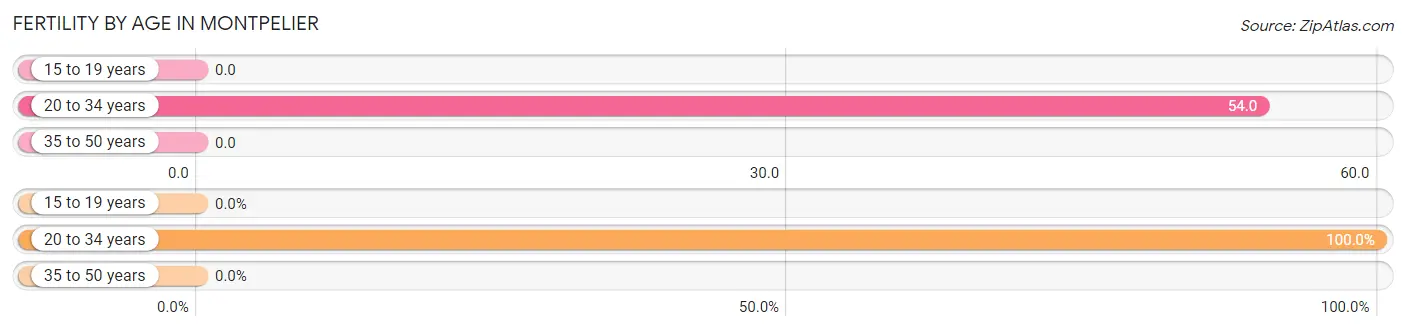
| Age Bracket | Women with Births | Births / 1,000 Women |
| 15 to 19 years | 0 (0.0%) | 0.0 |
| 20 to 34 years | 2 (100.0%) | 54.0 |
| 35 to 50 years | 0 (0.0%) | 0.0 |
| Total | 2 (100.0%) | 13.0 |
Fertility by Age by Marriage Status in Montpelier
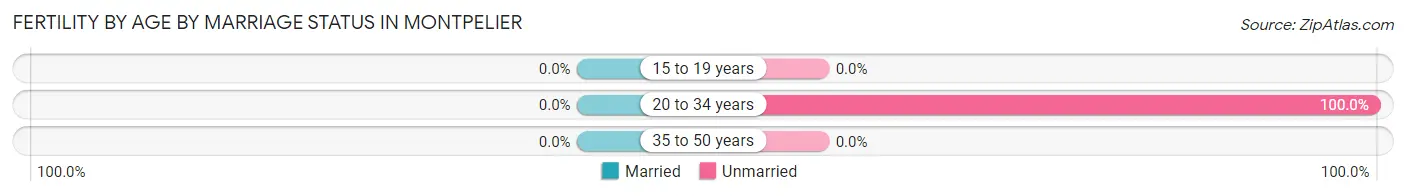
| Age Bracket | Married | Unmarried |
| 15 to 19 years | 0 (0.0%) | 0 (0.0%) |
| 20 to 34 years | 0 (0.0%) | 2 (100.0%) |
| 35 to 50 years | 0 (0.0%) | 0 (0.0%) |
| Total | 0 (0.0%) | 2 (100.0%) |
Fertility by Education in Montpelier
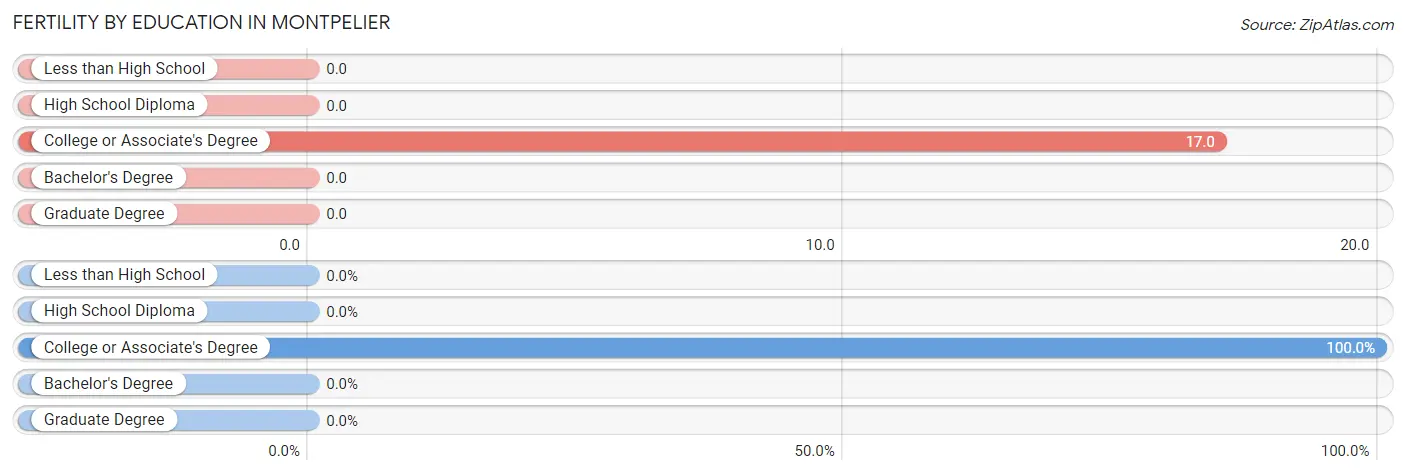
| Educational Attainment | Women with Births | Births / 1,000 Women |
| Less than High School | 0 (0.0%) | 0.0 |
| High School Diploma | 0 (0.0%) | 0.0 |
| College or Associate's Degree | 2 (100.0%) | 17.0 |
| Bachelor's Degree | 0 (0.0%) | 0.0 |
| Graduate Degree | 0 (0.0%) | 0.0 |
| Total | 2 (100.0%) | 13.0 |
Fertility by Education by Marriage Status in Montpelier
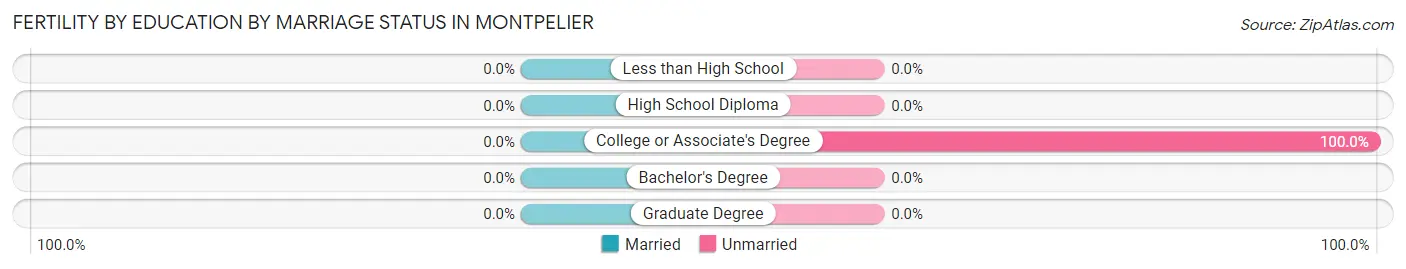
| Educational Attainment | Married | Unmarried |
| Less than High School | 0 (0.0%) | 0 (0.0%) |
| High School Diploma | 0 (0.0%) | 0 (0.0%) |
| College or Associate's Degree | 0 (0.0%) | 2 (100.0%) |
| Bachelor's Degree | 0 (0.0%) | 0 (0.0%) |
| Graduate Degree | 0 (0.0%) | 0 (0.0%) |
| Total | 0 (0.0%) | 2 (100.0%) |
Employment Characteristics in Montpelier
Employment by Class of Employer in Montpelier
Among the 195 employed individuals in Montpelier, private company employees (132 | 67.7%), self-employed (not incorporated) (19 | 9.7%), and local government employees (17 | 8.7%) make up the most common classes of employment.
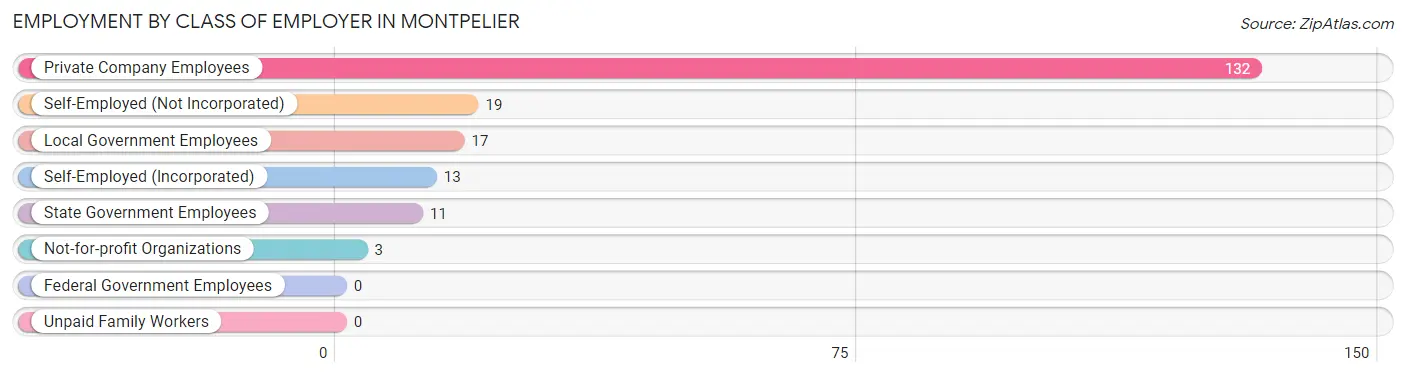
| Employer Class | # Employees | % Employees |
| Private Company Employees | 132 | 67.7% |
| Self-Employed (Incorporated) | 13 | 6.7% |
| Self-Employed (Not Incorporated) | 19 | 9.7% |
| Not-for-profit Organizations | 3 | 1.5% |
| Local Government Employees | 17 | 8.7% |
| State Government Employees | 11 | 5.6% |
| Federal Government Employees | 0 | 0.0% |
| Unpaid Family Workers | 0 | 0.0% |
| Total | 195 | 100.0% |
Employment Status by Age in Montpelier
According to the labor force statistics for Montpelier, out of the total population over 16 years of age (338), 80.5% or 272 individuals are in the labor force, with 28.3% or 77 of them unemployed. The age group with the highest labor force participation rate is 20 to 24 years, with 100.0% or 22 individuals in the labor force. Within the labor force, the 16 to 19 years age range has the highest percentage of unemployed individuals, with 62.5% or 5 of them being unemployed.
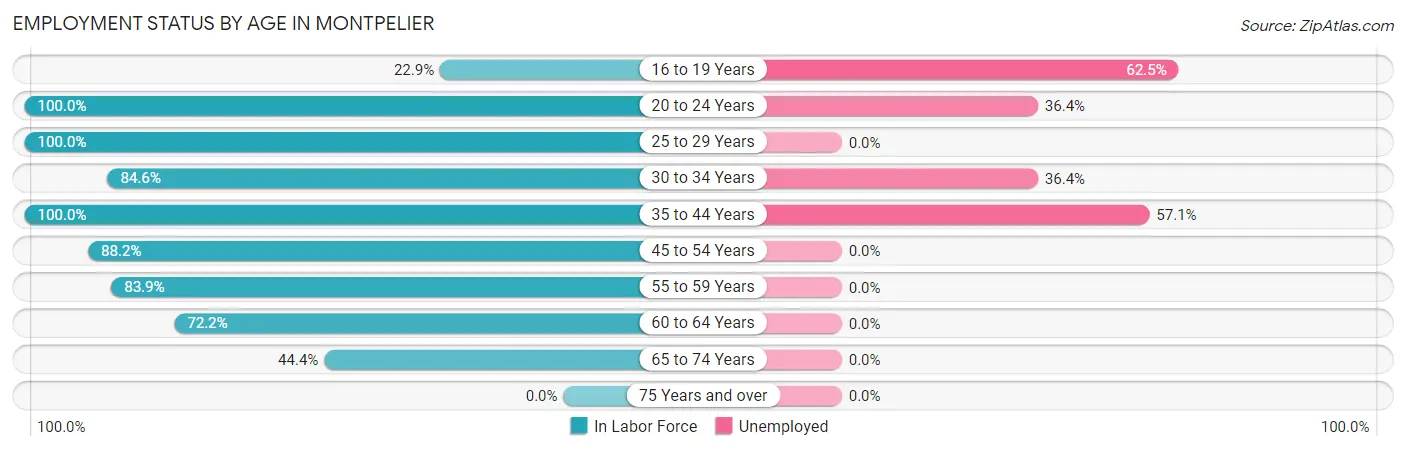
| Age Bracket | In Labor Force | Unemployed |
| 16 to 19 Years | 8 (22.9%) | 5 (62.5%) |
| 20 to 24 Years | 22 (100.0%) | 8 (36.4%) |
| 25 to 29 Years | 15 (100.0%) | 0 (0.0%) |
| 30 to 34 Years | 11 (84.6%) | 4 (36.4%) |
| 35 to 44 Years | 105 (100.0%) | 60 (57.1%) |
| 45 to 54 Years | 60 (88.2%) | 0 (0.0%) |
| 55 to 59 Years | 26 (83.9%) | 0 (0.0%) |
| 60 to 64 Years | 13 (72.2%) | 0 (0.0%) |
| 65 to 74 Years | 12 (44.4%) | 0 (0.0%) |
| 75 Years and over | 0 (0.0%) | 0 (0.0%) |
| Total | 272 (80.5%) | 77 (28.3%) |
Employment Status by Educational Attainment in Montpelier
According to labor force statistics for Montpelier, 92.0% of individuals (230) out of the total population between 25 and 64 years of age (250) are in the labor force, with 27.8% or 64 of them being unemployed. The group with the highest labor force participation rate are those with the educational attainment of bachelor's degree or higher, with 100.0% or 20 individuals in the labor force. Within the labor force, individuals with college / associate degree education have the highest percentage of unemployment, with 54.2% or 64 of them being unemployed.
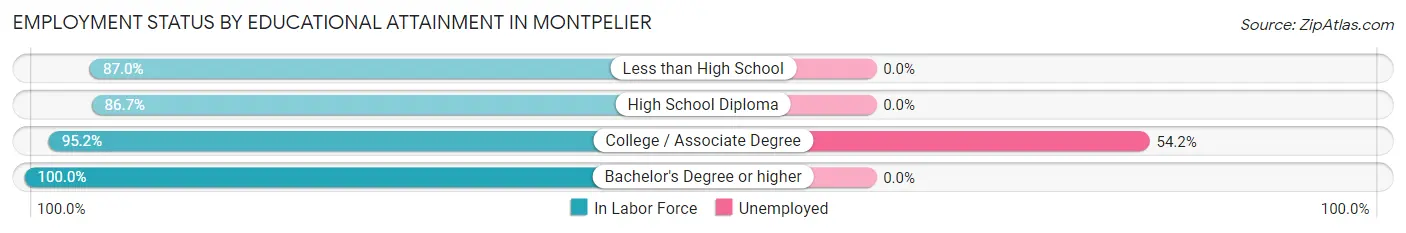
| Educational Attainment | In Labor Force | Unemployed |
| Less than High School | 20 (87.0%) | 0 (0.0%) |
| High School Diploma | 72 (86.7%) | 0 (0.0%) |
| College / Associate Degree | 118 (95.2%) | 67 (54.2%) |
| Bachelor's Degree or higher | 20 (100.0%) | 0 (0.0%) |
| Total | 230 (92.0%) | 70 (27.8%) |
Employment Occupations by Sex in Montpelier
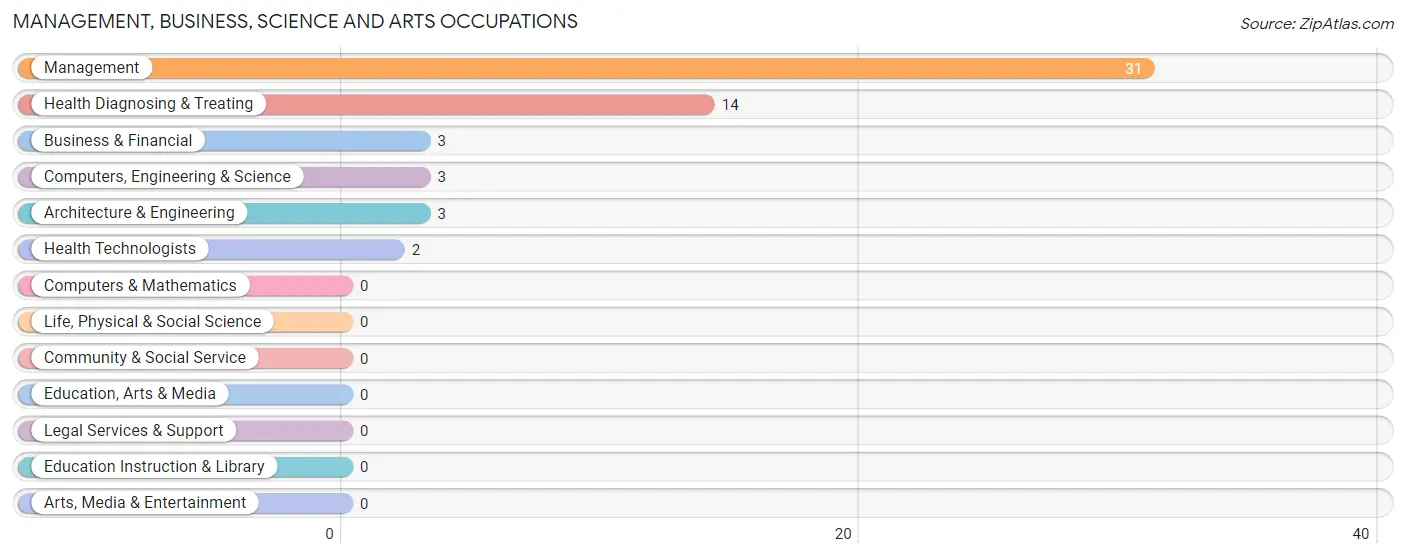
Management, Business, Science and Arts Occupations
The most common Management, Business, Science and Arts occupations in Montpelier are Management (31 | 15.9%), Health Diagnosing & Treating (14 | 7.2%), Business & Financial (3 | 1.5%), Computers, Engineering & Science (3 | 1.5%), and Architecture & Engineering (3 | 1.5%).
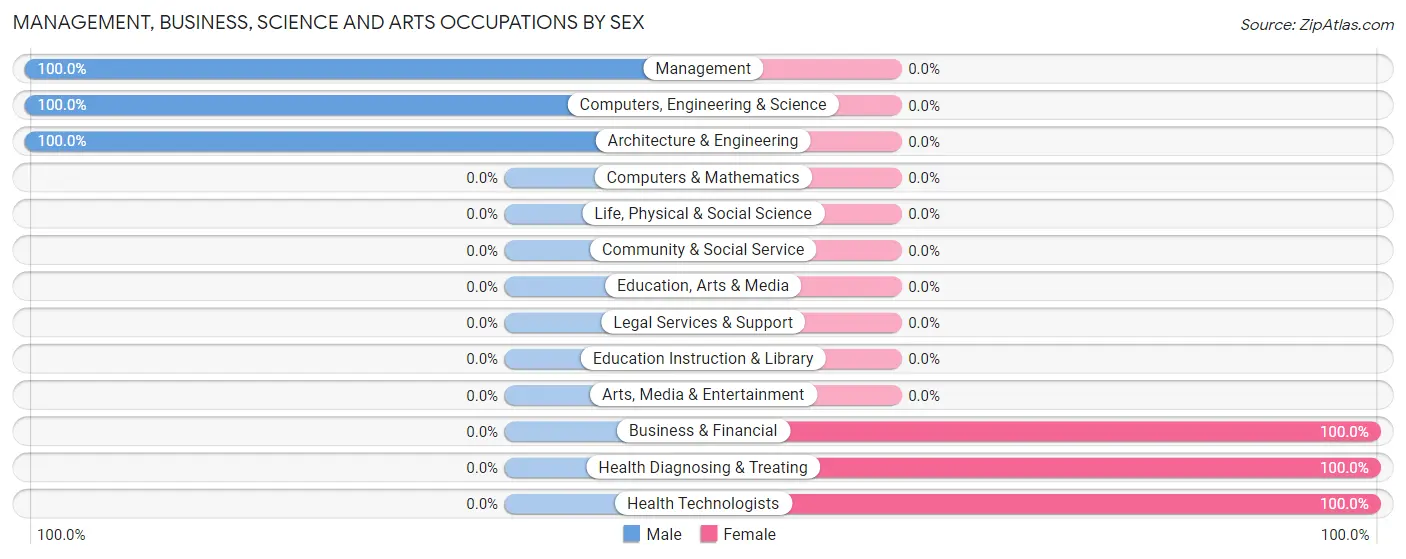
Management, Business, Science and Arts Occupations by Sex
Within the Management, Business, Science and Arts occupations in Montpelier, the most male-oriented occupations are Management (100.0%), Computers, Engineering & Science (100.0%), and Architecture & Engineering (100.0%), while the most female-oriented occupations are Business & Financial (100.0%), Health Diagnosing & Treating (100.0%), and Health Technologists (100.0%).
| Occupation | Male | Female |
| Management | 31 (100.0%) | 0 (0.0%) |
| Business & Financial | 0 (0.0%) | 3 (100.0%) |
| Computers, Engineering & Science | 3 (100.0%) | 0 (0.0%) |
| Computers & Mathematics | 0 (0.0%) | 0 (0.0%) |
| Architecture & Engineering | 3 (100.0%) | 0 (0.0%) |
| Life, Physical & Social Science | 0 (0.0%) | 0 (0.0%) |
| Community & Social Service | 0 (0.0%) | 0 (0.0%) |
| Education, Arts & Media | 0 (0.0%) | 0 (0.0%) |
| Legal Services & Support | 0 (0.0%) | 0 (0.0%) |
| Education Instruction & Library | 0 (0.0%) | 0 (0.0%) |
| Arts, Media & Entertainment | 0 (0.0%) | 0 (0.0%) |
| Health Diagnosing & Treating | 0 (0.0%) | 14 (100.0%) |
| Health Technologists | 0 (0.0%) | 2 (100.0%) |
| Total (Category) | 34 (66.7%) | 17 (33.3%) |
| Total (Overall) | 103 (52.8%) | 92 (47.2%) |
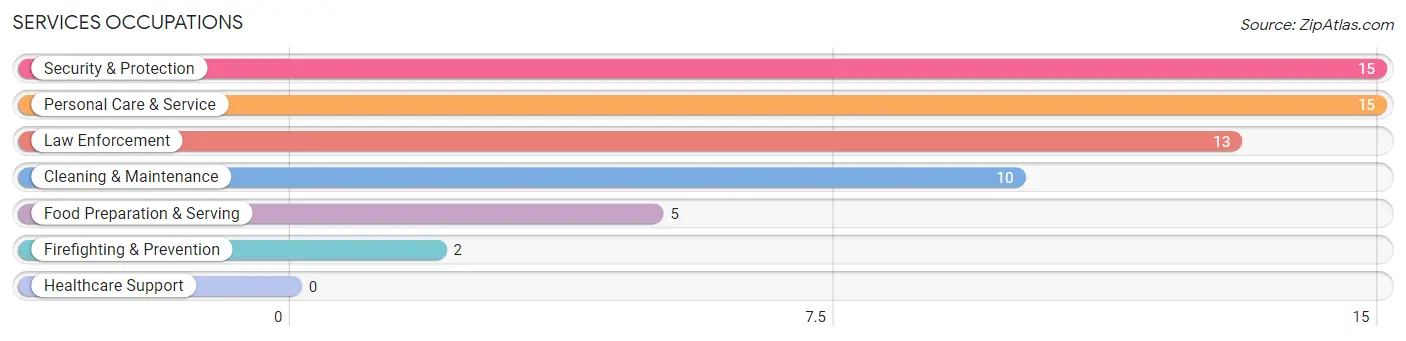
Services Occupations
The most common Services occupations in Montpelier are Security & Protection (15 | 7.7%), Personal Care & Service (15 | 7.7%), Law Enforcement (13 | 6.7%), Cleaning & Maintenance (10 | 5.1%), and Food Preparation & Serving (5 | 2.6%).
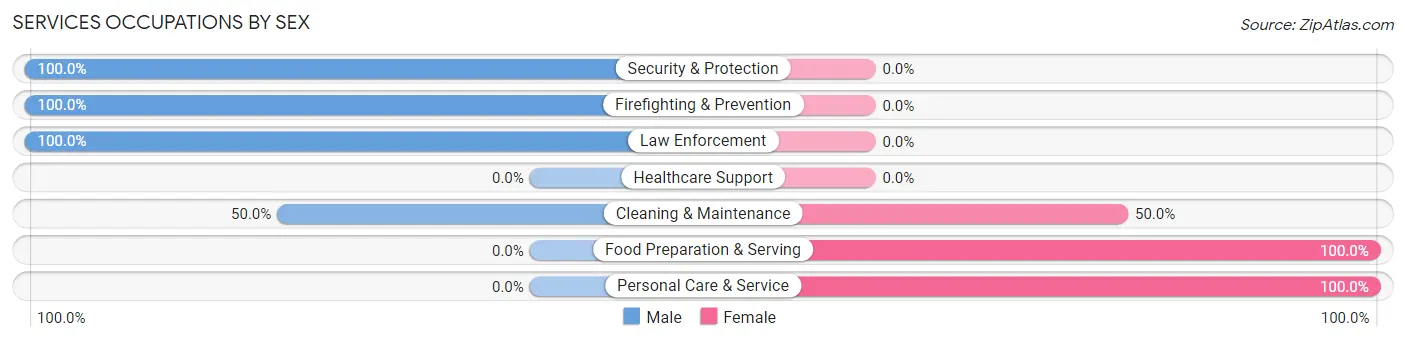
Services Occupations by Sex
Within the Services occupations in Montpelier, the most male-oriented occupations are Security & Protection (100.0%), Firefighting & Prevention (100.0%), and Law Enforcement (100.0%), while the most female-oriented occupations are Food Preparation & Serving (100.0%), Personal Care & Service (100.0%), and Cleaning & Maintenance (50.0%).
| Occupation | Male | Female |
| Healthcare Support | 0 (0.0%) | 0 (0.0%) |
| Security & Protection | 15 (100.0%) | 0 (0.0%) |
| Firefighting & Prevention | 2 (100.0%) | 0 (0.0%) |
| Law Enforcement | 13 (100.0%) | 0 (0.0%) |
| Food Preparation & Serving | 0 (0.0%) | 5 (100.0%) |
| Cleaning & Maintenance | 5 (50.0%) | 5 (50.0%) |
| Personal Care & Service | 0 (0.0%) | 15 (100.0%) |
| Total (Category) | 20 (44.4%) | 25 (55.6%) |
| Total (Overall) | 103 (52.8%) | 92 (47.2%) |
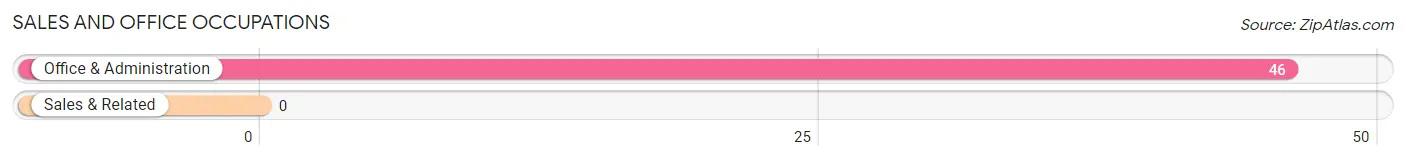
Sales and Office Occupations
The most common Sales and Office occupations in Montpelier are , and Office & Administration (46 | 23.6%).
Sales and Office Occupations by Sex
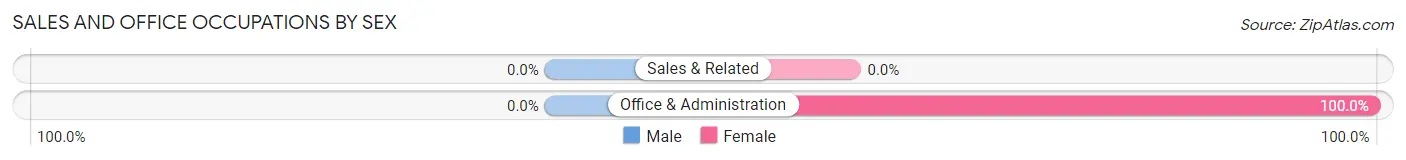
| Occupation | Male | Female |
| Sales & Related | 0 (0.0%) | 0 (0.0%) |
| Office & Administration | 0 (0.0%) | 46 (100.0%) |
| Total (Category) | 0 (0.0%) | 46 (100.0%) |
| Total (Overall) | 103 (52.8%) | 92 (47.2%) |
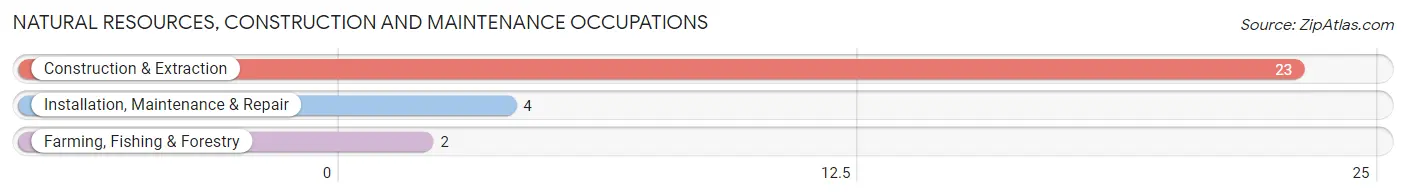
Natural Resources, Construction and Maintenance Occupations
The most common Natural Resources, Construction and Maintenance occupations in Montpelier are Construction & Extraction (23 | 11.8%), Installation, Maintenance & Repair (4 | 2.1%), and Farming, Fishing & Forestry (2 | 1.0%).
Natural Resources, Construction and Maintenance Occupations by Sex
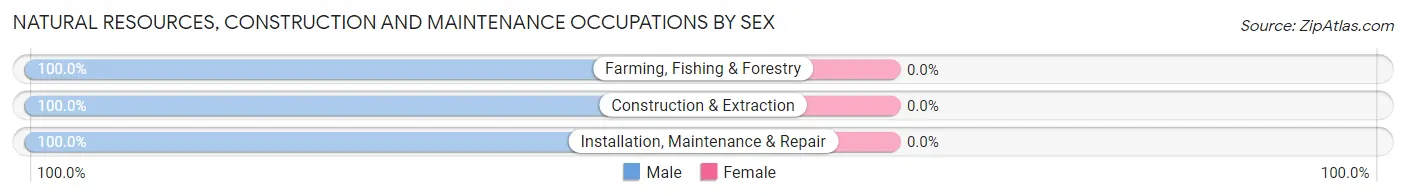
| Occupation | Male | Female |
| Farming, Fishing & Forestry | 2 (100.0%) | 0 (0.0%) |
| Construction & Extraction | 23 (100.0%) | 0 (0.0%) |
| Installation, Maintenance & Repair | 4 (100.0%) | 0 (0.0%) |
| Total (Category) | 29 (100.0%) | 0 (0.0%) |
| Total (Overall) | 103 (52.8%) | 92 (47.2%) |
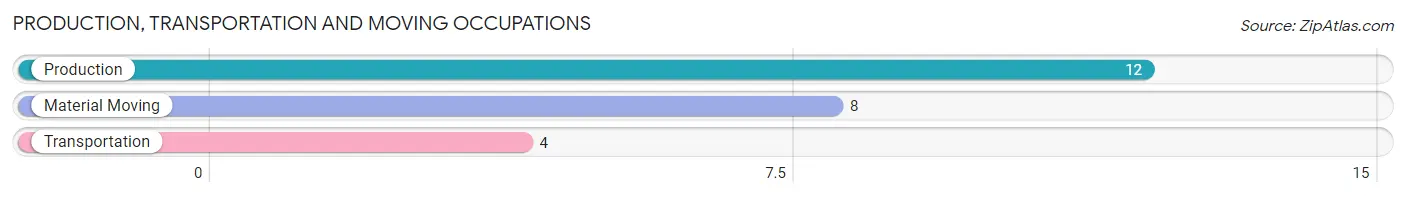
Production, Transportation and Moving Occupations
The most common Production, Transportation and Moving occupations in Montpelier are Production (12 | 6.1%), Material Moving (8 | 4.1%), and Transportation (4 | 2.1%).
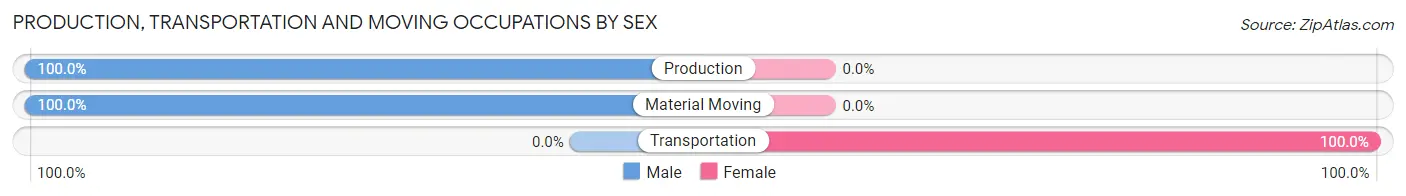
Production, Transportation and Moving Occupations by Sex
| Occupation | Male | Female |
| Production | 12 (100.0%) | 0 (0.0%) |
| Transportation | 0 (0.0%) | 4 (100.0%) |
| Material Moving | 8 (100.0%) | 0 (0.0%) |
| Total (Category) | 20 (83.3%) | 4 (16.7%) |
| Total (Overall) | 103 (52.8%) | 92 (47.2%) |
Employment Industries by Sex in Montpelier
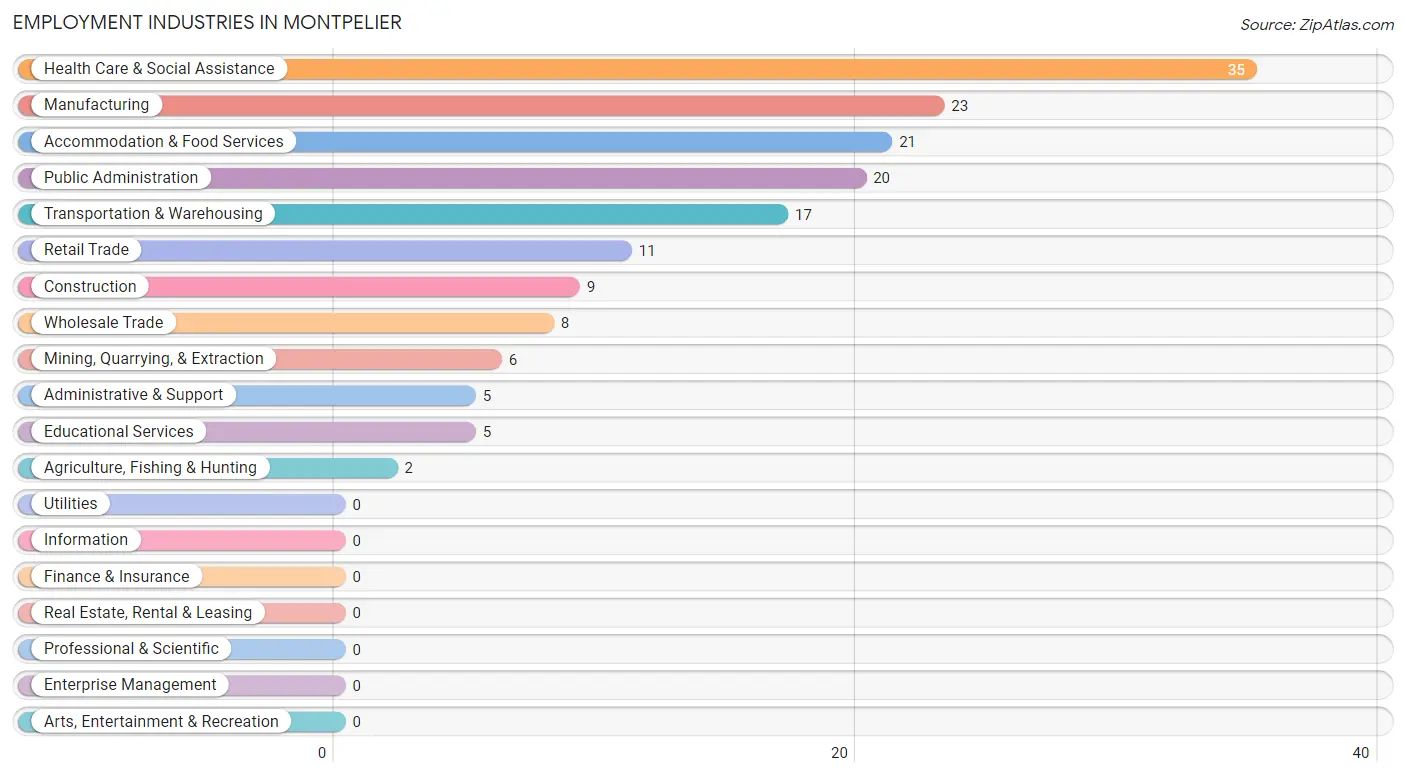
Employment Industries in Montpelier
The major employment industries in Montpelier include Health Care & Social Assistance (35 | 17.9%), Manufacturing (23 | 11.8%), Accommodation & Food Services (21 | 10.8%), Public Administration (20 | 10.3%), and Transportation & Warehousing (17 | 8.7%).
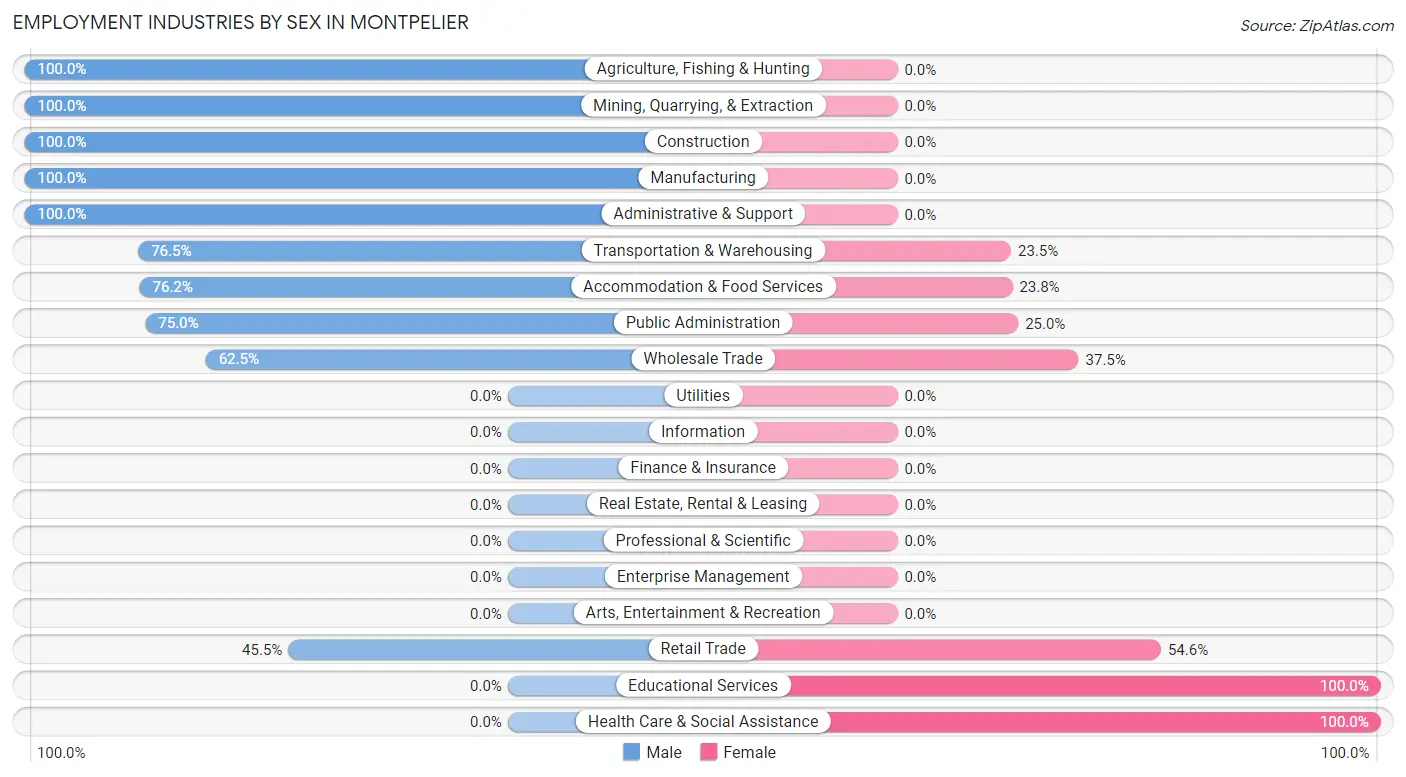
Employment Industries by Sex in Montpelier
The Montpelier industries that see more men than women are Agriculture, Fishing & Hunting (100.0%), Mining, Quarrying, & Extraction (100.0%), and Construction (100.0%), whereas the industries that tend to have a higher number of women are Educational Services (100.0%), Health Care & Social Assistance (100.0%), and Retail Trade (54.5%).
| Industry | Male | Female |
| Agriculture, Fishing & Hunting | 2 (100.0%) | 0 (0.0%) |
| Mining, Quarrying, & Extraction | 6 (100.0%) | 0 (0.0%) |
| Construction | 9 (100.0%) | 0 (0.0%) |
| Manufacturing | 23 (100.0%) | 0 (0.0%) |
| Wholesale Trade | 5 (62.5%) | 3 (37.5%) |
| Retail Trade | 5 (45.5%) | 6 (54.5%) |
| Transportation & Warehousing | 13 (76.5%) | 4 (23.5%) |
| Utilities | 0 (0.0%) | 0 (0.0%) |
| Information | 0 (0.0%) | 0 (0.0%) |
| Finance & Insurance | 0 (0.0%) | 0 (0.0%) |
| Real Estate, Rental & Leasing | 0 (0.0%) | 0 (0.0%) |
| Professional & Scientific | 0 (0.0%) | 0 (0.0%) |
| Enterprise Management | 0 (0.0%) | 0 (0.0%) |
| Administrative & Support | 5 (100.0%) | 0 (0.0%) |
| Educational Services | 0 (0.0%) | 5 (100.0%) |
| Health Care & Social Assistance | 0 (0.0%) | 35 (100.0%) |
| Arts, Entertainment & Recreation | 0 (0.0%) | 0 (0.0%) |
| Accommodation & Food Services | 16 (76.2%) | 5 (23.8%) |
| Public Administration | 15 (75.0%) | 5 (25.0%) |
| Total | 103 (52.8%) | 92 (47.2%) |
Education in Montpelier
School Enrollment in Montpelier
The most common levels of schooling among the 92 students in Montpelier are high school (38 | 41.3%), college / undergraduate (20 | 21.7%), and elementary school (17 | 18.5%).
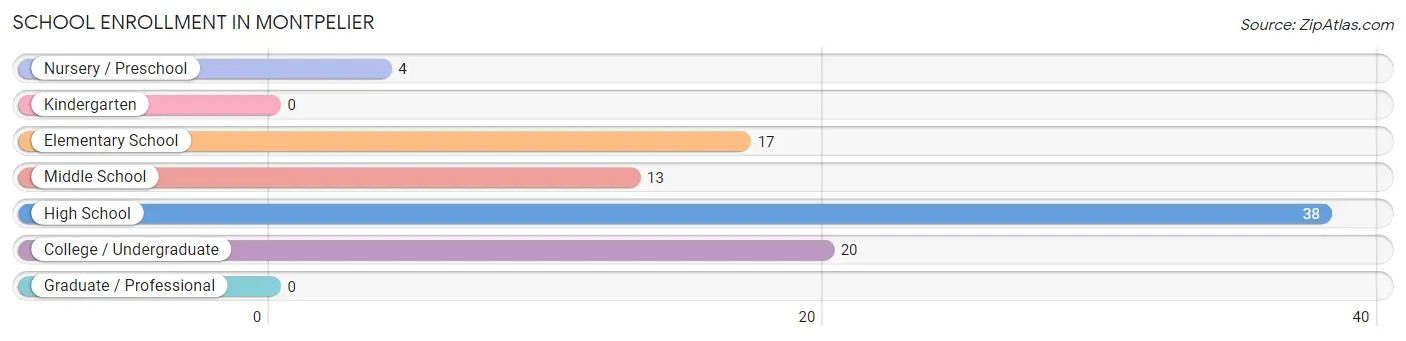
| School Level | # Students | % Students |
| Nursery / Preschool | 4 | 4.3% |
| Kindergarten | 0 | 0.0% |
| Elementary School | 17 | 18.5% |
| Middle School | 13 | 14.1% |
| High School | 38 | 41.3% |
| College / Undergraduate | 20 | 21.7% |
| Graduate / Professional | 0 | 0.0% |
| Total | 92 | 100.0% |
School Enrollment by Age by Funding Source in Montpelier
Out of a total of 92 students who are enrolled in schools in Montpelier, 33 (35.9%) attend a private institution, while the remaining 59 (64.1%) are enrolled in public schools. The age group of 10 to 14 year olds has the highest likelihood of being enrolled in private schools, with 13 (100.0% in the age bracket) enrolled. Conversely, the age group of 5 to 9 year old has the lowest likelihood of being enrolled in a private school, with 21 (100.0% in the age bracket) attending a public institution.
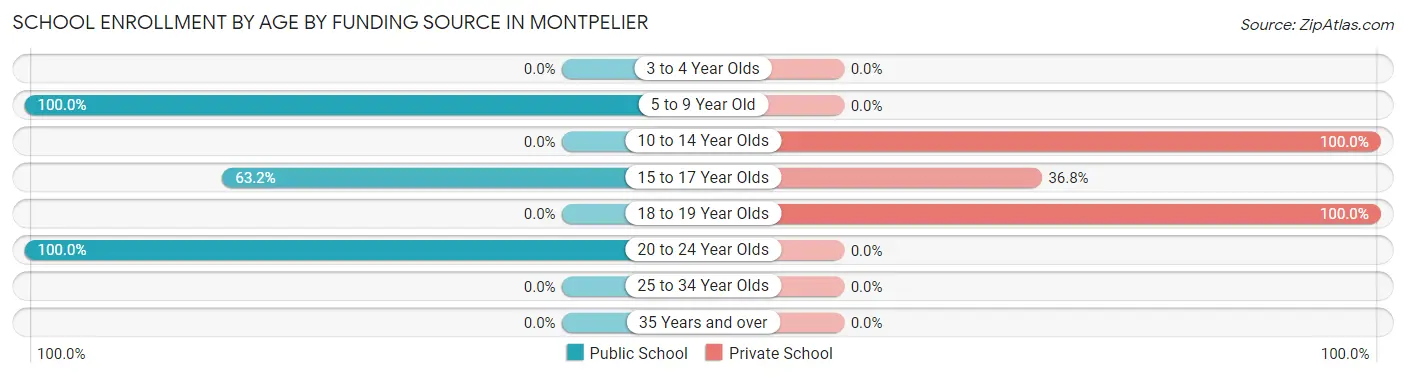
| Age Bracket | Public School | Private School |
| 3 to 4 Year Olds | 0 (0.0%) | 0 (0.0%) |
| 5 to 9 Year Old | 21 (100.0%) | 0 (0.0%) |
| 10 to 14 Year Olds | 0 (0.0%) | 13 (100.0%) |
| 15 to 17 Year Olds | 24 (63.2%) | 14 (36.8%) |
| 18 to 19 Year Olds | 0 (0.0%) | 6 (100.0%) |
| 20 to 24 Year Olds | 14 (100.0%) | 0 (0.0%) |
| 25 to 34 Year Olds | 0 (0.0%) | 0 (0.0%) |
| 35 Years and over | 0 (0.0%) | 0 (0.0%) |
| Total | 59 (64.1%) | 33 (35.9%) |
Educational Attainment by Field of Study in Montpelier
Business (10 | 41.7%), science & technology (5 | 20.8%), arts & humanities (4 | 16.7%), engineering (3 | 12.5%), and education (2 | 8.3%) are the most common fields of study among 24 individuals in Montpelier who have obtained a bachelor's degree or higher.
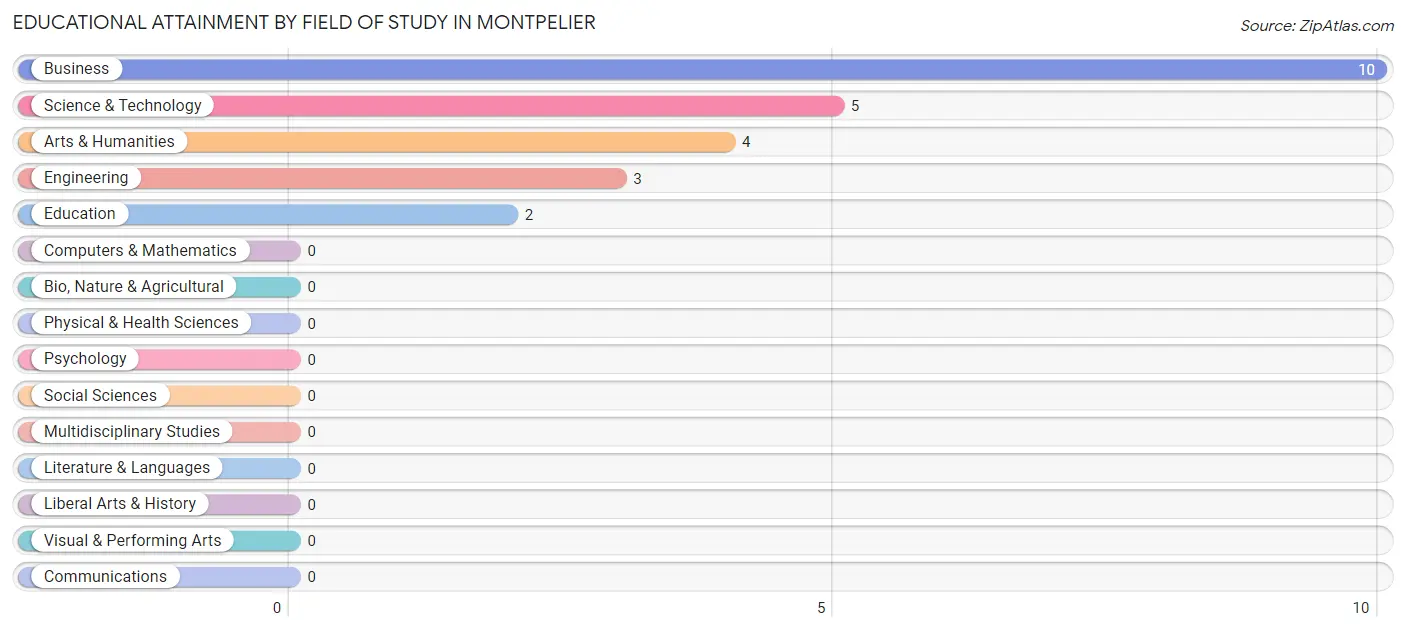
| Field of Study | # Graduates | % Graduates |
| Computers & Mathematics | 0 | 0.0% |
| Bio, Nature & Agricultural | 0 | 0.0% |
| Physical & Health Sciences | 0 | 0.0% |
| Psychology | 0 | 0.0% |
| Social Sciences | 0 | 0.0% |
| Engineering | 3 | 12.5% |
| Multidisciplinary Studies | 0 | 0.0% |
| Science & Technology | 5 | 20.8% |
| Business | 10 | 41.7% |
| Education | 2 | 8.3% |
| Literature & Languages | 0 | 0.0% |
| Liberal Arts & History | 0 | 0.0% |
| Visual & Performing Arts | 0 | 0.0% |
| Communications | 0 | 0.0% |
| Arts & Humanities | 4 | 16.7% |
| Total | 24 | 100.0% |
Transportation & Commute in Montpelier
Vehicle Availability by Sex in Montpelier
The most prevalent vehicle ownership categories in Montpelier are males with 2 vehicles (57, accounting for 55.3%) and females with 2 vehicles (16, making up 62.0%).
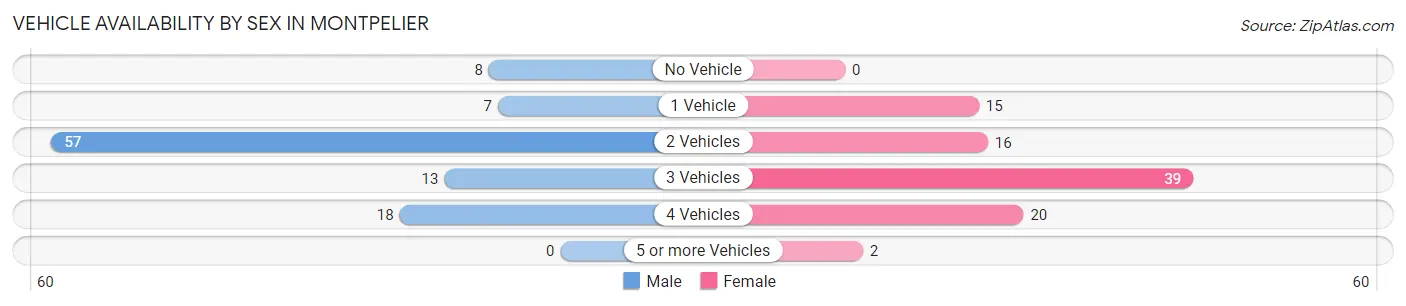
| Vehicles Available | Male | Female |
| No Vehicle | 8 (7.8%) | 0 (0.0%) |
| 1 Vehicle | 7 (6.8%) | 15 (16.3%) |
| 2 Vehicles | 57 (55.3%) | 16 (17.4%) |
| 3 Vehicles | 13 (12.6%) | 39 (42.4%) |
| 4 Vehicles | 18 (17.5%) | 20 (21.7%) |
| 5 or more Vehicles | 0 (0.0%) | 2 (2.2%) |
| Total | 103 (100.0%) | 92 (100.0%) |
Commute Time in Montpelier
The most frequently occuring commute durations in Montpelier are 15 to 19 minutes (54 commuters, 28.4%), 25 to 29 minutes (27 commuters, 14.2%), and 30 to 34 minutes (26 commuters, 13.7%).
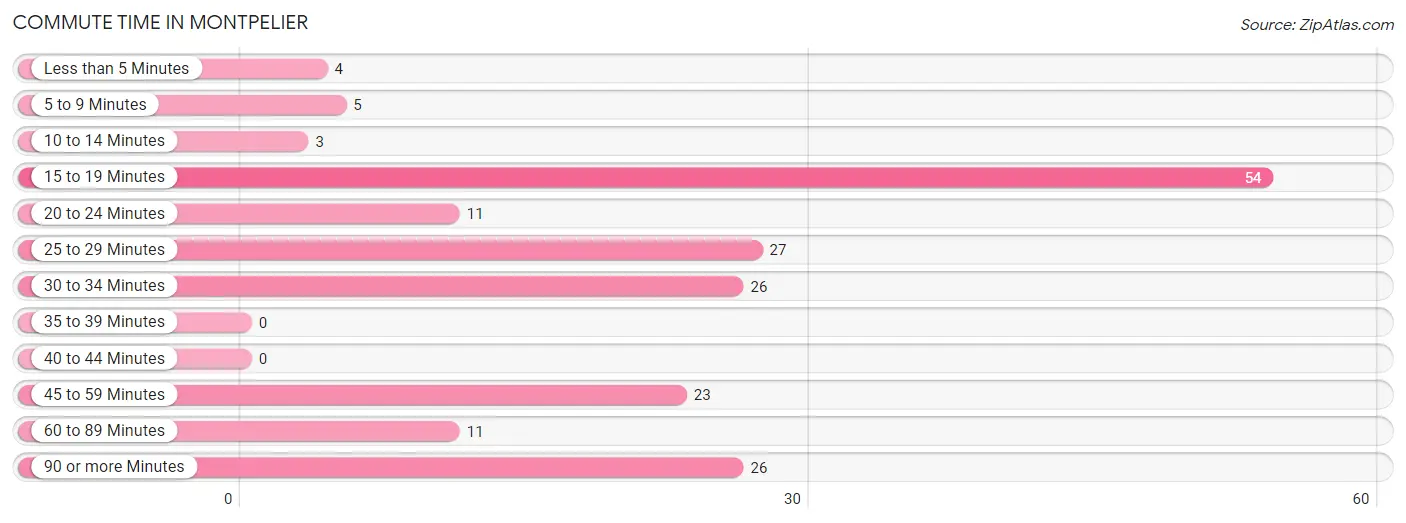
| Commute Time | # Commuters | % Commuters |
| Less than 5 Minutes | 4 | 2.1% |
| 5 to 9 Minutes | 5 | 2.6% |
| 10 to 14 Minutes | 3 | 1.6% |
| 15 to 19 Minutes | 54 | 28.4% |
| 20 to 24 Minutes | 11 | 5.8% |
| 25 to 29 Minutes | 27 | 14.2% |
| 30 to 34 Minutes | 26 | 13.7% |
| 35 to 39 Minutes | 0 | 0.0% |
| 40 to 44 Minutes | 0 | 0.0% |
| 45 to 59 Minutes | 23 | 12.1% |
| 60 to 89 Minutes | 11 | 5.8% |
| 90 or more Minutes | 26 | 13.7% |
Commute Time by Sex in Montpelier
The most common commute times in Montpelier are 15 to 19 minutes (23 commuters, 22.3%) for males and 15 to 19 minutes (31 commuters, 35.6%) for females.
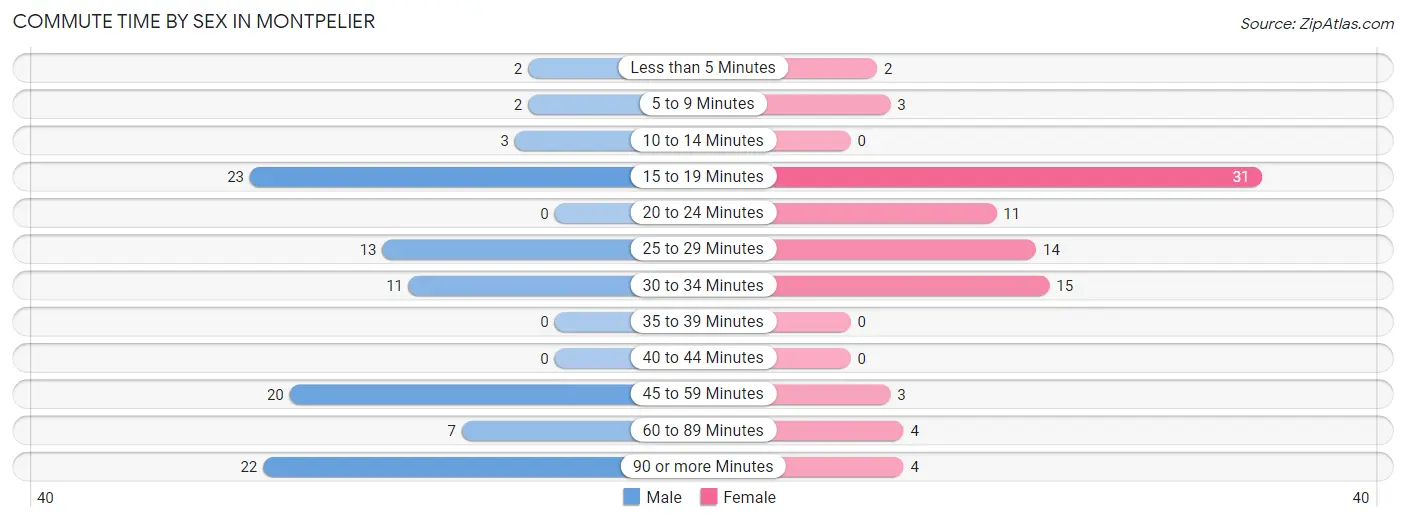
| Commute Time | Male | Female |
| Less than 5 Minutes | 2 (1.9%) | 2 (2.3%) |
| 5 to 9 Minutes | 2 (1.9%) | 3 (3.5%) |
| 10 to 14 Minutes | 3 (2.9%) | 0 (0.0%) |
| 15 to 19 Minutes | 23 (22.3%) | 31 (35.6%) |
| 20 to 24 Minutes | 0 (0.0%) | 11 (12.6%) |
| 25 to 29 Minutes | 13 (12.6%) | 14 (16.1%) |
| 30 to 34 Minutes | 11 (10.7%) | 15 (17.2%) |
| 35 to 39 Minutes | 0 (0.0%) | 0 (0.0%) |
| 40 to 44 Minutes | 0 (0.0%) | 0 (0.0%) |
| 45 to 59 Minutes | 20 (19.4%) | 3 (3.5%) |
| 60 to 89 Minutes | 7 (6.8%) | 4 (4.6%) |
| 90 or more Minutes | 22 (21.4%) | 4 (4.6%) |
Time of Departure to Work by Sex in Montpelier
The most frequent times of departure to work in Montpelier are 12:00 AM to 4:59 AM (30, 29.1%) for males and 7:00 AM to 7:29 AM (24, 27.6%) for females.
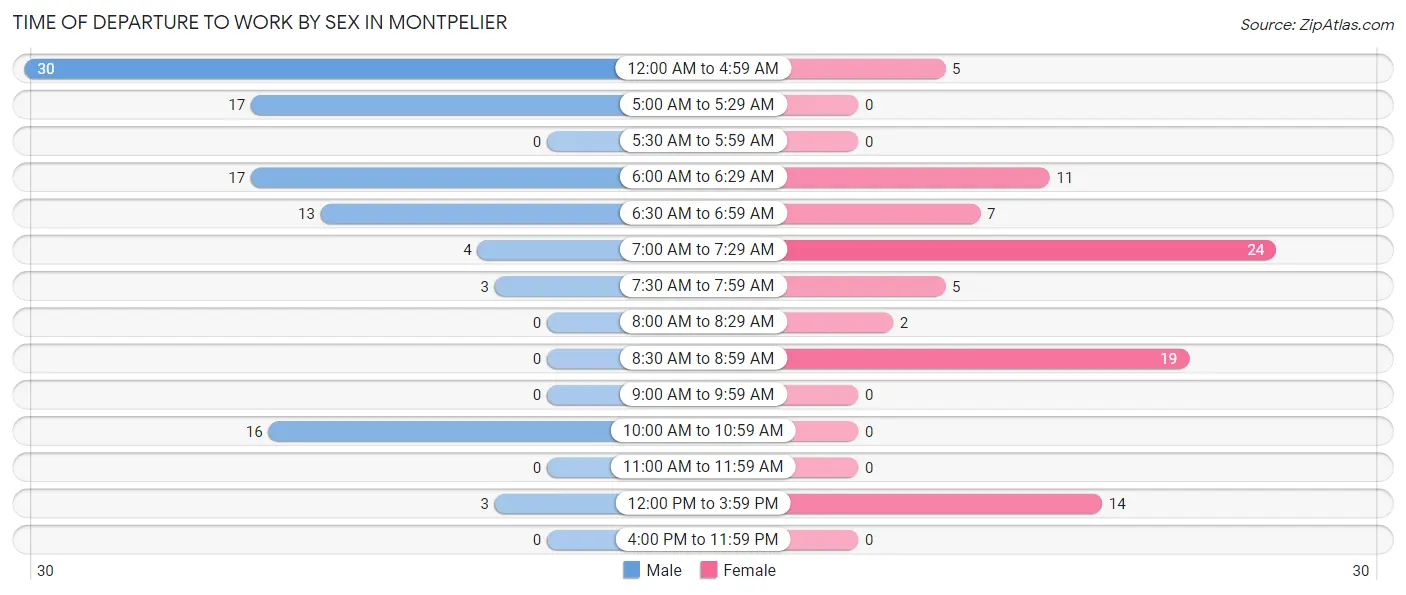
| Time of Departure | Male | Female |
| 12:00 AM to 4:59 AM | 30 (29.1%) | 5 (5.8%) |
| 5:00 AM to 5:29 AM | 17 (16.5%) | 0 (0.0%) |
| 5:30 AM to 5:59 AM | 0 (0.0%) | 0 (0.0%) |
| 6:00 AM to 6:29 AM | 17 (16.5%) | 11 (12.6%) |
| 6:30 AM to 6:59 AM | 13 (12.6%) | 7 (8.1%) |
| 7:00 AM to 7:29 AM | 4 (3.9%) | 24 (27.6%) |
| 7:30 AM to 7:59 AM | 3 (2.9%) | 5 (5.8%) |
| 8:00 AM to 8:29 AM | 0 (0.0%) | 2 (2.3%) |
| 8:30 AM to 8:59 AM | 0 (0.0%) | 19 (21.8%) |
| 9:00 AM to 9:59 AM | 0 (0.0%) | 0 (0.0%) |
| 10:00 AM to 10:59 AM | 16 (15.5%) | 0 (0.0%) |
| 11:00 AM to 11:59 AM | 0 (0.0%) | 0 (0.0%) |
| 12:00 PM to 3:59 PM | 3 (2.9%) | 14 (16.1%) |
| 4:00 PM to 11:59 PM | 0 (0.0%) | 0 (0.0%) |
| Total | 103 (100.0%) | 87 (100.0%) |
Housing Occupancy in Montpelier
Occupancy by Ownership in Montpelier
Of the total 110 dwellings in Montpelier, owner-occupied units account for 83 (75.4%), while renter-occupied units make up 27 (24.5%).
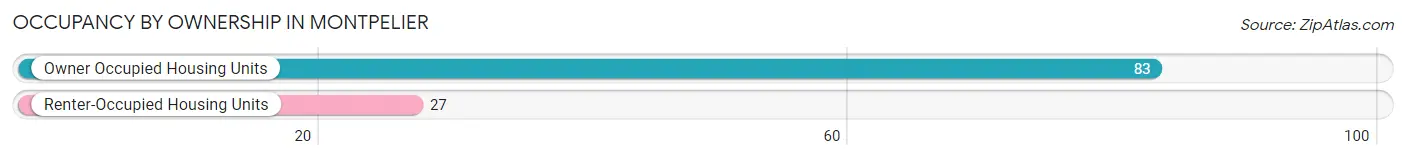
| Occupancy | # Housing Units | % Housing Units |
| Owner Occupied Housing Units | 83 | 75.4% |
| Renter-Occupied Housing Units | 27 | 24.5% |
| Total Occupied Housing Units | 110 | 100.0% |
Occupancy by Household Size in Montpelier
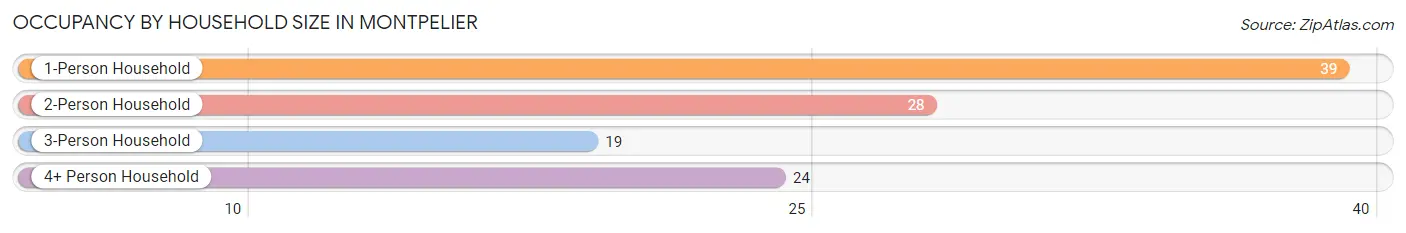
| Household Size | # Housing Units | % Housing Units |
| 1-Person Household | 39 | 35.4% |
| 2-Person Household | 28 | 25.5% |
| 3-Person Household | 19 | 17.3% |
| 4+ Person Household | 24 | 21.8% |
| Total Housing Units | 110 | 100.0% |
Occupancy by Ownership by Household Size in Montpelier
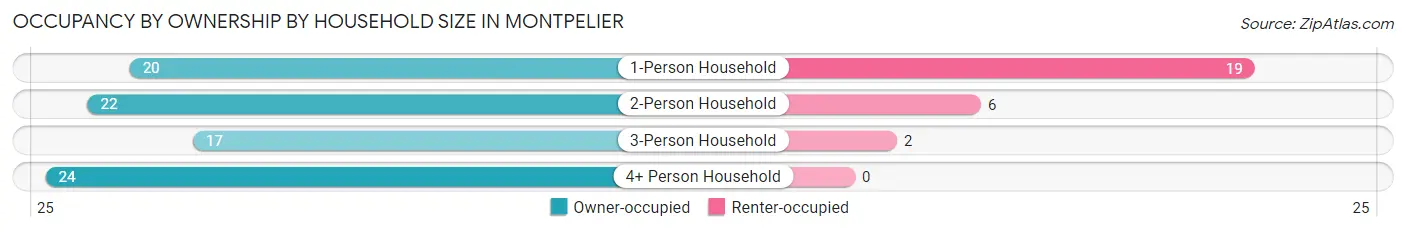
| Household Size | Owner-occupied | Renter-occupied |
| 1-Person Household | 20 (51.3%) | 19 (48.7%) |
| 2-Person Household | 22 (78.6%) | 6 (21.4%) |
| 3-Person Household | 17 (89.5%) | 2 (10.5%) |
| 4+ Person Household | 24 (100.0%) | 0 (0.0%) |
| Total Housing Units | 83 (75.4%) | 27 (24.5%) |
Occupancy by Educational Attainment in Montpelier
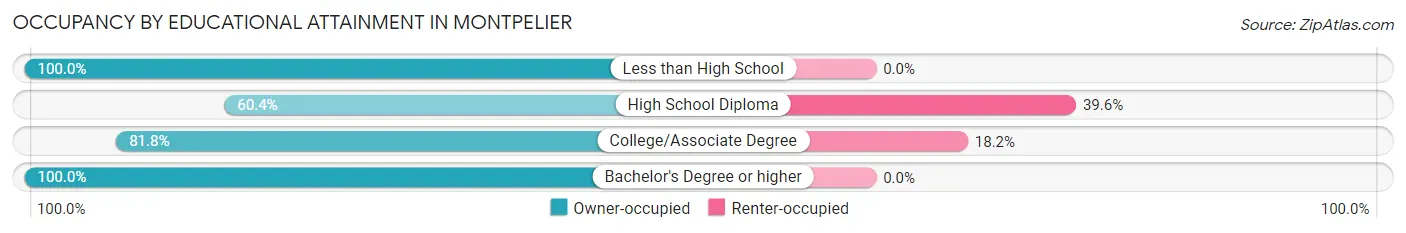
| Household Size | Owner-occupied | Renter-occupied |
| Less than High School | 8 (100.0%) | 0 (0.0%) |
| High School Diploma | 32 (60.4%) | 21 (39.6%) |
| College/Associate Degree | 27 (81.8%) | 6 (18.2%) |
| Bachelor's Degree or higher | 16 (100.0%) | 0 (0.0%) |
Occupancy by Age of Householder in Montpelier
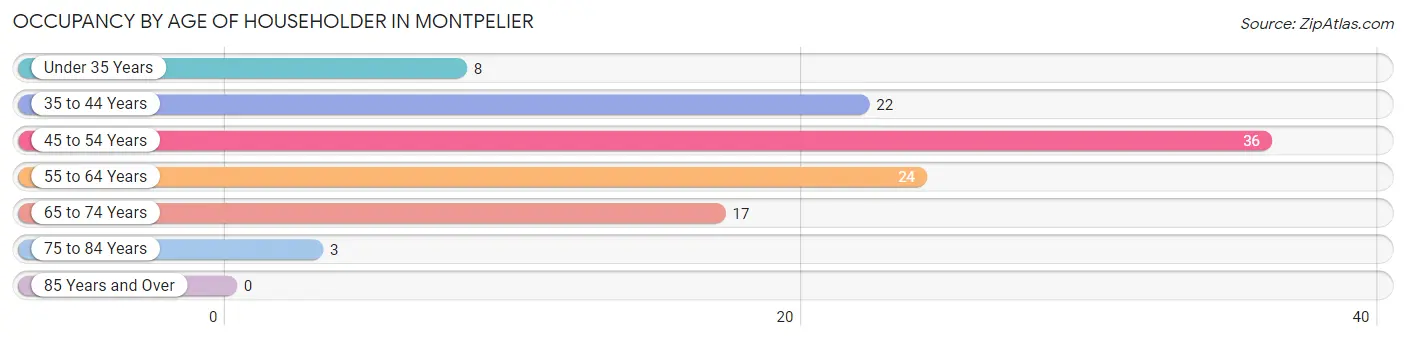
| Age Bracket | # Households | % Households |
| Under 35 Years | 8 | 7.3% |
| 35 to 44 Years | 22 | 20.0% |
| 45 to 54 Years | 36 | 32.7% |
| 55 to 64 Years | 24 | 21.8% |
| 65 to 74 Years | 17 | 15.4% |
| 75 to 84 Years | 3 | 2.7% |
| 85 Years and Over | 0 | 0.0% |
| Total | 110 | 100.0% |
Housing Finances in Montpelier
Median Income by Occupancy in Montpelier
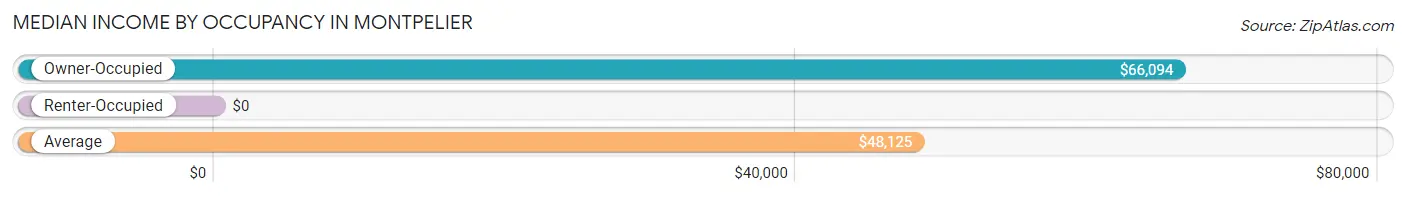
| Occupancy Type | # Households | Median Income |
| Owner-Occupied | 83 (75.4%) | $66,094 |
| Renter-Occupied | 27 (24.5%) | $0 |
| Average | 110 (100.0%) | $48,125 |
Occupancy by Householder Income Bracket in Montpelier
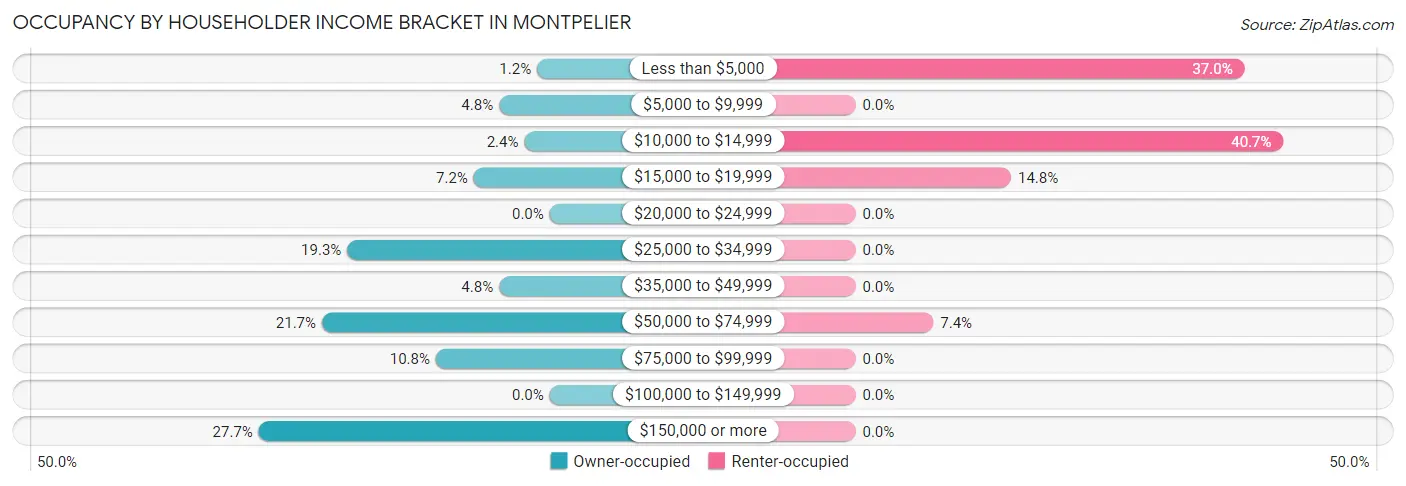
| Income Bracket | Owner-occupied | Renter-occupied |
| Less than $5,000 | 1 (1.2%) | 10 (37.0%) |
| $5,000 to $9,999 | 4 (4.8%) | 0 (0.0%) |
| $10,000 to $14,999 | 2 (2.4%) | 11 (40.7%) |
| $15,000 to $19,999 | 6 (7.2%) | 4 (14.8%) |
| $20,000 to $24,999 | 0 (0.0%) | 0 (0.0%) |
| $25,000 to $34,999 | 16 (19.3%) | 0 (0.0%) |
| $35,000 to $49,999 | 4 (4.8%) | 0 (0.0%) |
| $50,000 to $74,999 | 18 (21.7%) | 2 (7.4%) |
| $75,000 to $99,999 | 9 (10.8%) | 0 (0.0%) |
| $100,000 to $149,999 | 0 (0.0%) | 0 (0.0%) |
| $150,000 or more | 23 (27.7%) | 0 (0.0%) |
| Total | 83 (100.0%) | 27 (100.0%) |
Monthly Housing Cost Tiers in Montpelier
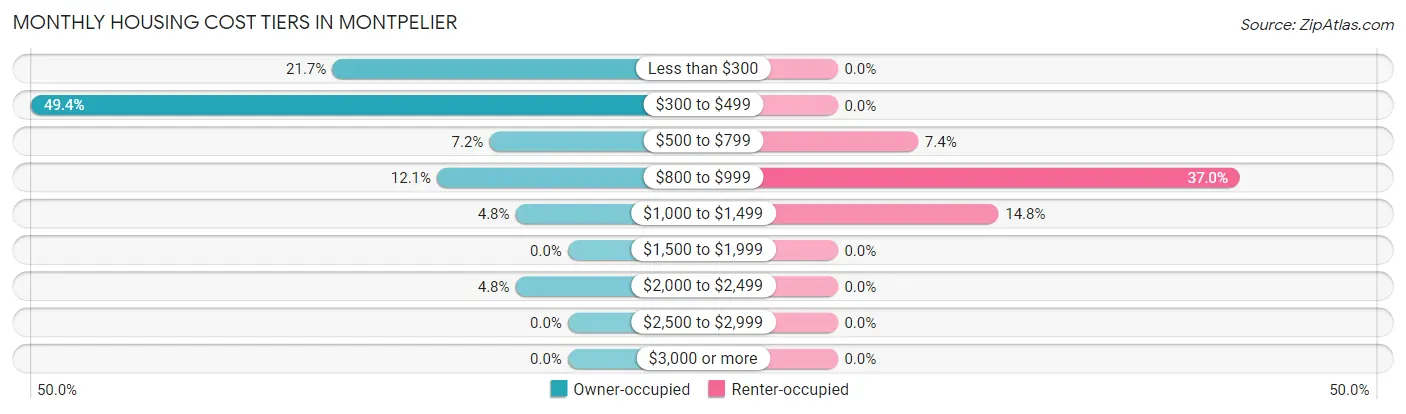
| Monthly Cost | Owner-occupied | Renter-occupied |
| Less than $300 | 18 (21.7%) | 0 (0.0%) |
| $300 to $499 | 41 (49.4%) | 0 (0.0%) |
| $500 to $799 | 6 (7.2%) | 2 (7.4%) |
| $800 to $999 | 10 (12.0%) | 10 (37.0%) |
| $1,000 to $1,499 | 4 (4.8%) | 4 (14.8%) |
| $1,500 to $1,999 | 0 (0.0%) | 0 (0.0%) |
| $2,000 to $2,499 | 4 (4.8%) | 0 (0.0%) |
| $2,500 to $2,999 | 0 (0.0%) | 0 (0.0%) |
| $3,000 or more | 0 (0.0%) | 0 (0.0%) |
| Total | 83 (100.0%) | 27 (100.0%) |
Physical Housing Characteristics in Montpelier
Housing Structures in Montpelier
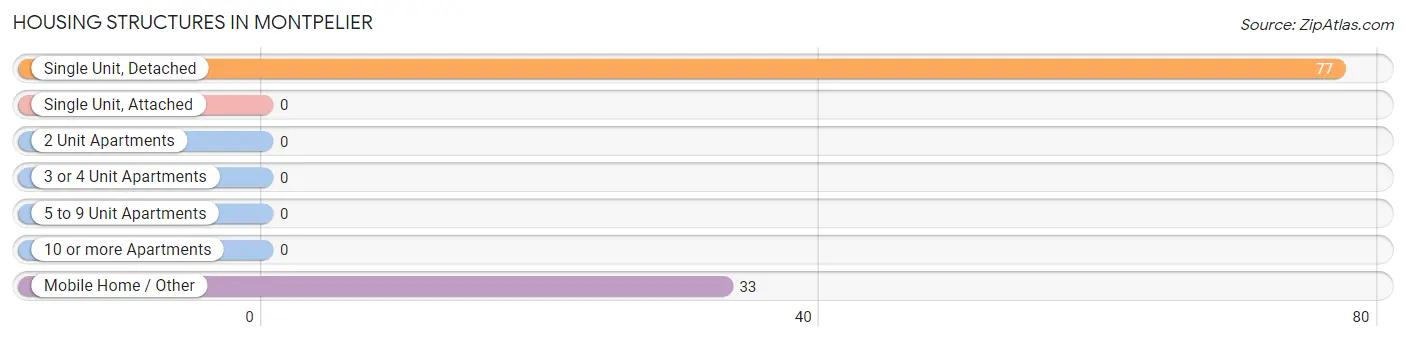
| Structure Type | # Housing Units | % Housing Units |
| Single Unit, Detached | 77 | 70.0% |
| Single Unit, Attached | 0 | 0.0% |
| 2 Unit Apartments | 0 | 0.0% |
| 3 or 4 Unit Apartments | 0 | 0.0% |
| 5 to 9 Unit Apartments | 0 | 0.0% |
| 10 or more Apartments | 0 | 0.0% |
| Mobile Home / Other | 33 | 30.0% |
| Total | 110 | 100.0% |
Housing Structures by Occupancy in Montpelier

| Structure Type | Owner-occupied | Renter-occupied |
| Single Unit, Detached | 52 (67.5%) | 25 (32.5%) |
| Single Unit, Attached | 0 (0.0%) | 0 (0.0%) |
| 2 Unit Apartments | 0 (0.0%) | 0 (0.0%) |
| 3 or 4 Unit Apartments | 0 (0.0%) | 0 (0.0%) |
| 5 to 9 Unit Apartments | 0 (0.0%) | 0 (0.0%) |
| 10 or more Apartments | 0 (0.0%) | 0 (0.0%) |
| Mobile Home / Other | 31 (93.9%) | 2 (6.1%) |
| Total | 83 (75.4%) | 27 (24.5%) |
Housing Structures by Number of Rooms in Montpelier
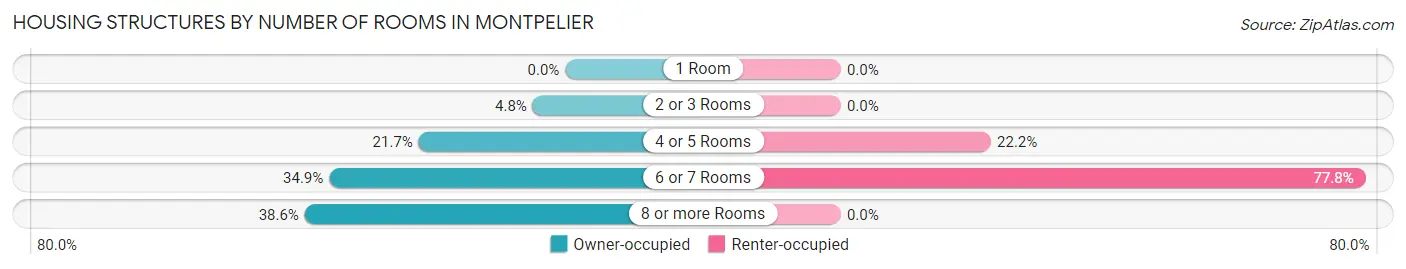
| Number of Rooms | Owner-occupied | Renter-occupied |
| 1 Room | 0 (0.0%) | 0 (0.0%) |
| 2 or 3 Rooms | 4 (4.8%) | 0 (0.0%) |
| 4 or 5 Rooms | 18 (21.7%) | 6 (22.2%) |
| 6 or 7 Rooms | 29 (34.9%) | 21 (77.8%) |
| 8 or more Rooms | 32 (38.6%) | 0 (0.0%) |
| Total | 83 (100.0%) | 27 (100.0%) |
Housing Structure by Heating Type in Montpelier
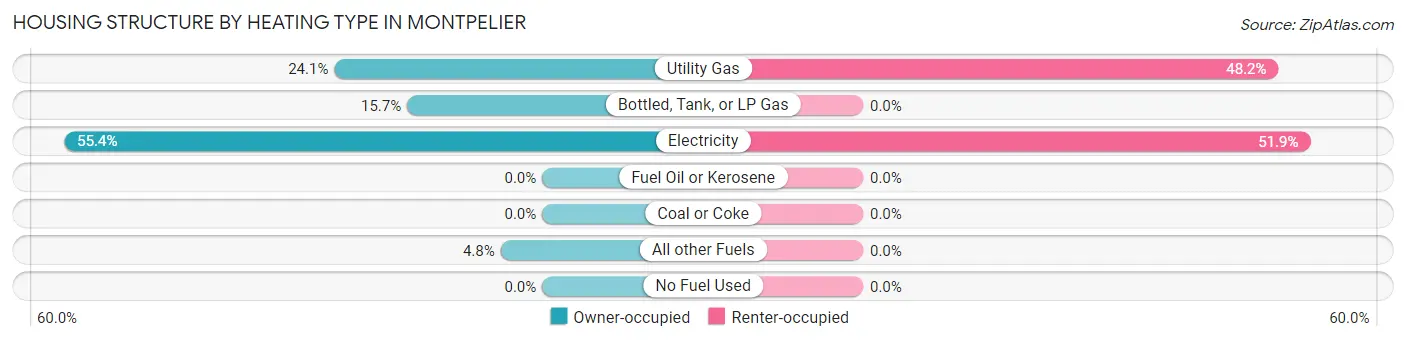
| Heating Type | Owner-occupied | Renter-occupied |
| Utility Gas | 20 (24.1%) | 13 (48.1%) |
| Bottled, Tank, or LP Gas | 13 (15.7%) | 0 (0.0%) |
| Electricity | 46 (55.4%) | 14 (51.8%) |
| Fuel Oil or Kerosene | 0 (0.0%) | 0 (0.0%) |
| Coal or Coke | 0 (0.0%) | 0 (0.0%) |
| All other Fuels | 4 (4.8%) | 0 (0.0%) |
| No Fuel Used | 0 (0.0%) | 0 (0.0%) |
| Total | 83 (100.0%) | 27 (100.0%) |
Household Vehicle Usage in Montpelier
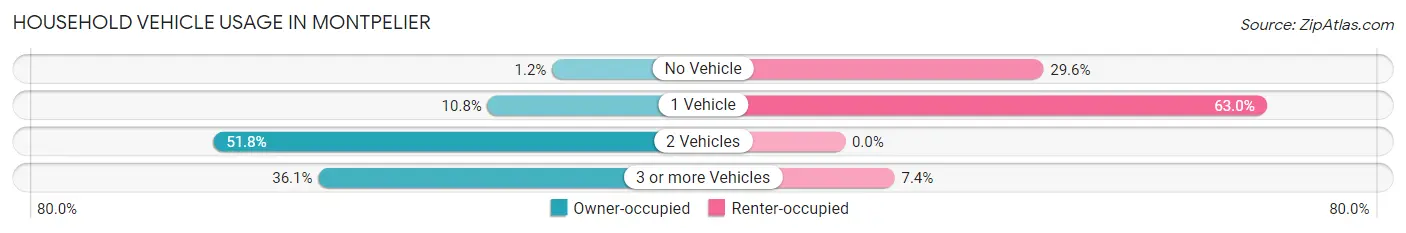
| Vehicles per Household | Owner-occupied | Renter-occupied |
| No Vehicle | 1 (1.2%) | 8 (29.6%) |
| 1 Vehicle | 9 (10.8%) | 17 (63.0%) |
| 2 Vehicles | 43 (51.8%) | 0 (0.0%) |
| 3 or more Vehicles | 30 (36.1%) | 2 (7.4%) |
| Total | 83 (100.0%) | 27 (100.0%) |
Real Estate & Mortgages in Montpelier
Real Estate and Mortgage Overview in Montpelier
| Characteristic | Without Mortgage | With Mortgage |
| Housing Units | 55 | 28 |
| Median Property Value | $109,400 | $0 |
| Median Household Income | - | - |
| Monthly Housing Costs | $318 | $0 |
| Real Estate Taxes | $199 | $20 |
Property Value by Mortgage Status in Montpelier
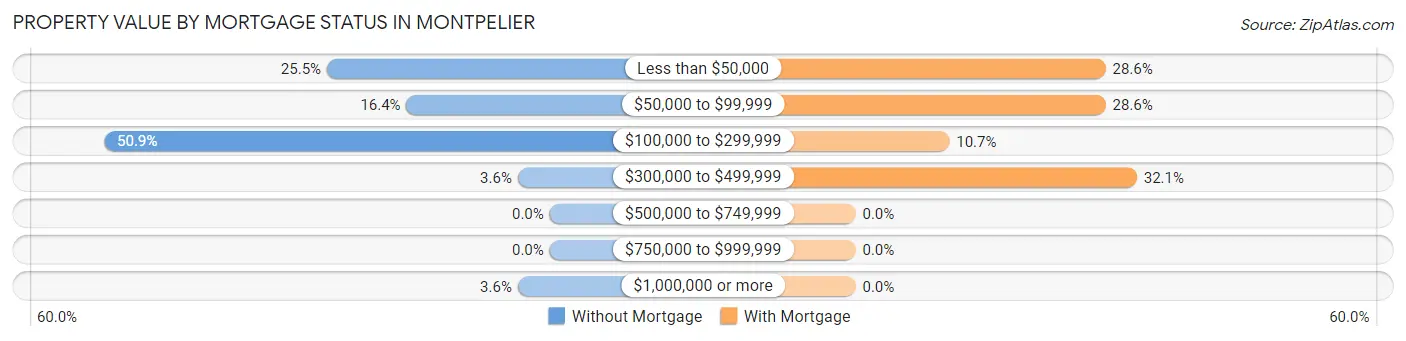
| Property Value | Without Mortgage | With Mortgage |
| Less than $50,000 | 14 (25.5%) | 8 (28.6%) |
| $50,000 to $99,999 | 9 (16.4%) | 8 (28.6%) |
| $100,000 to $299,999 | 28 (50.9%) | 3 (10.7%) |
| $300,000 to $499,999 | 2 (3.6%) | 9 (32.1%) |
| $500,000 to $749,999 | 0 (0.0%) | 0 (0.0%) |
| $750,000 to $999,999 | 0 (0.0%) | 0 (0.0%) |
| $1,000,000 or more | 2 (3.6%) | 0 (0.0%) |
| Total | 55 (100.0%) | 28 (100.0%) |
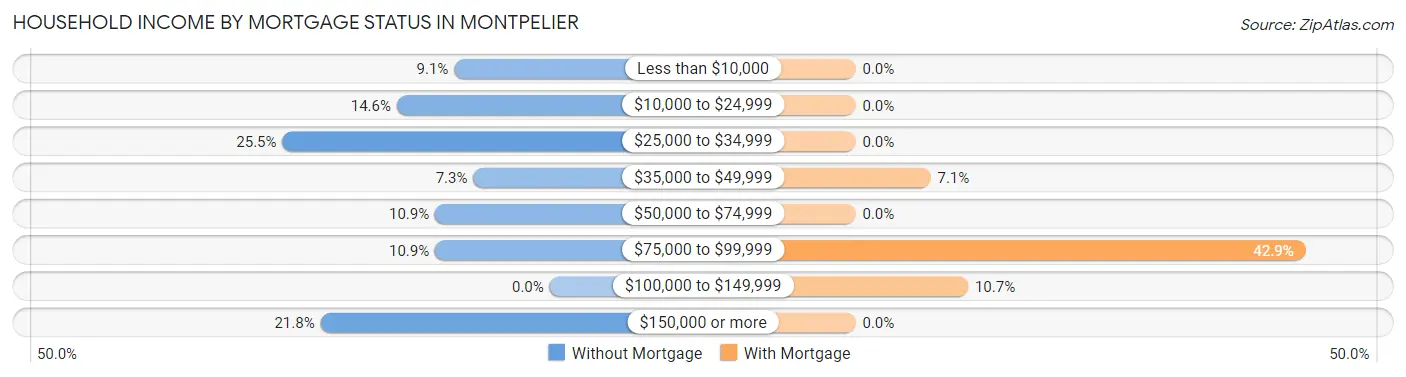
Household Income by Mortgage Status in Montpelier
| Household Income | Without Mortgage | With Mortgage |
| Less than $10,000 | 5 (9.1%) | 0 (0.0%) |
| $10,000 to $24,999 | 8 (14.5%) | 0 (0.0%) |
| $25,000 to $34,999 | 14 (25.5%) | 0 (0.0%) |
| $35,000 to $49,999 | 4 (7.3%) | 2 (7.1%) |
| $50,000 to $74,999 | 6 (10.9%) | 0 (0.0%) |
| $75,000 to $99,999 | 6 (10.9%) | 12 (42.9%) |
| $100,000 to $149,999 | 0 (0.0%) | 3 (10.7%) |
| $150,000 or more | 12 (21.8%) | 0 (0.0%) |
| Total | 55 (100.0%) | 28 (100.0%) |
Property Value to Household Income Ratio in Montpelier
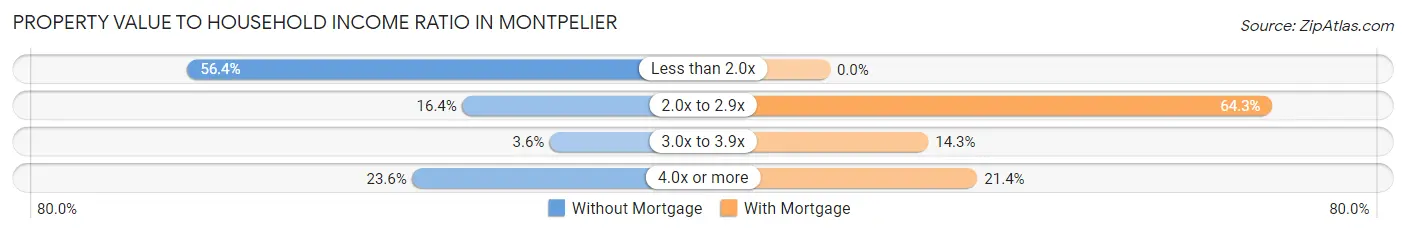
| Value-to-Income Ratio | Without Mortgage | With Mortgage |
| Less than 2.0x | 31 (56.4%) | 0 (0.0%) |
| 2.0x to 2.9x | 9 (16.4%) | 18 (64.3%) |
| 3.0x to 3.9x | 2 (3.6%) | 4 (14.3%) |
| 4.0x or more | 13 (23.6%) | 6 (21.4%) |
| Total | 55 (100.0%) | 28 (100.0%) |
Real Estate Taxes by Mortgage Status in Montpelier
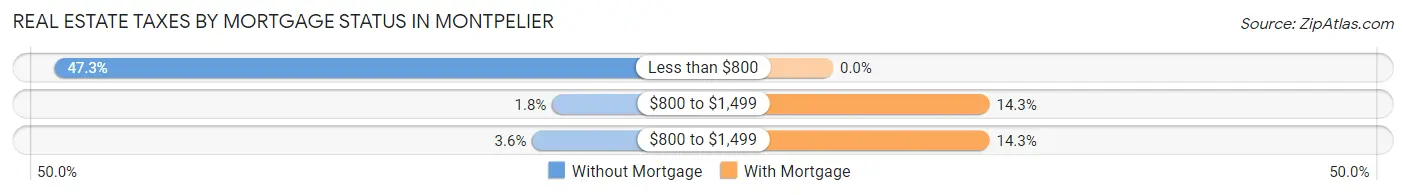
| Property Taxes | Without Mortgage | With Mortgage |
| Less than $800 | 26 (47.3%) | 0 (0.0%) |
| $800 to $1,499 | 1 (1.8%) | 4 (14.3%) |
| $800 to $1,499 | 2 (3.6%) | 4 (14.3%) |
| Total | 55 (100.0%) | 28 (100.0%) |
Health & Disability in Montpelier
Health Insurance Coverage by Age in Montpelier
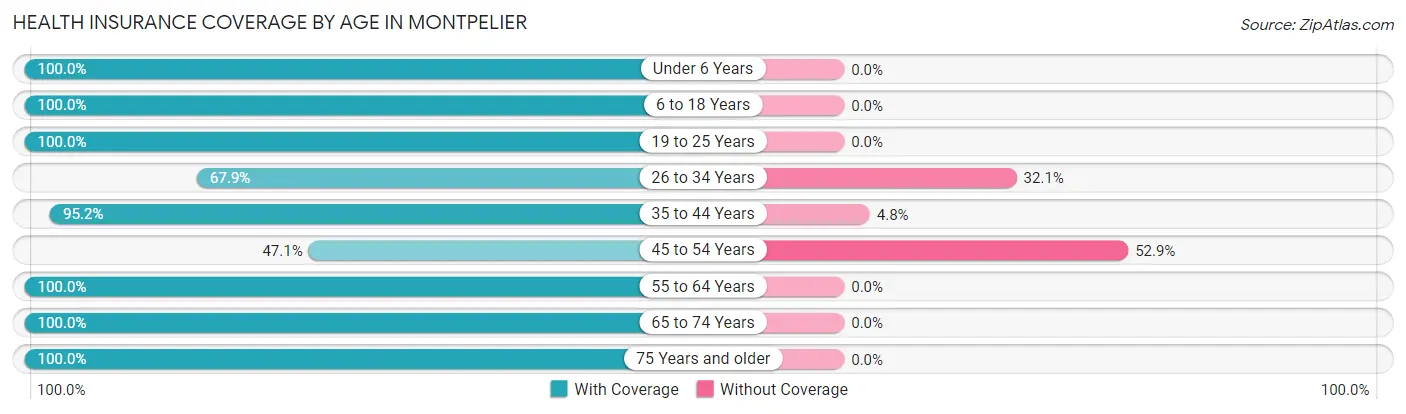
| Age Bracket | With Coverage | Without Coverage |
| Under 6 Years | 13 (100.0%) | 0 (0.0%) |
| 6 to 18 Years | 74 (100.0%) | 0 (0.0%) |
| 19 to 25 Years | 22 (100.0%) | 0 (0.0%) |
| 26 to 34 Years | 19 (67.9%) | 9 (32.1%) |
| 35 to 44 Years | 100 (95.2%) | 5 (4.8%) |
| 45 to 54 Years | 32 (47.1%) | 36 (52.9%) |
| 55 to 64 Years | 49 (100.0%) | 0 (0.0%) |
| 65 to 74 Years | 27 (100.0%) | 0 (0.0%) |
| 75 Years and older | 4 (100.0%) | 0 (0.0%) |
| Total | 340 (87.2%) | 50 (12.8%) |
Health Insurance Coverage by Citizenship Status in Montpelier
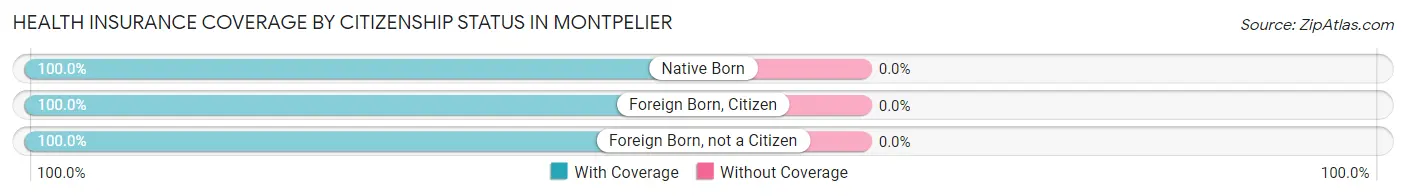
| Citizenship Status | With Coverage | Without Coverage |
| Native Born | 13 (100.0%) | 0 (0.0%) |
| Foreign Born, Citizen | 74 (100.0%) | 0 (0.0%) |
| Foreign Born, not a Citizen | 22 (100.0%) | 0 (0.0%) |
Health Insurance Coverage by Household Income in Montpelier
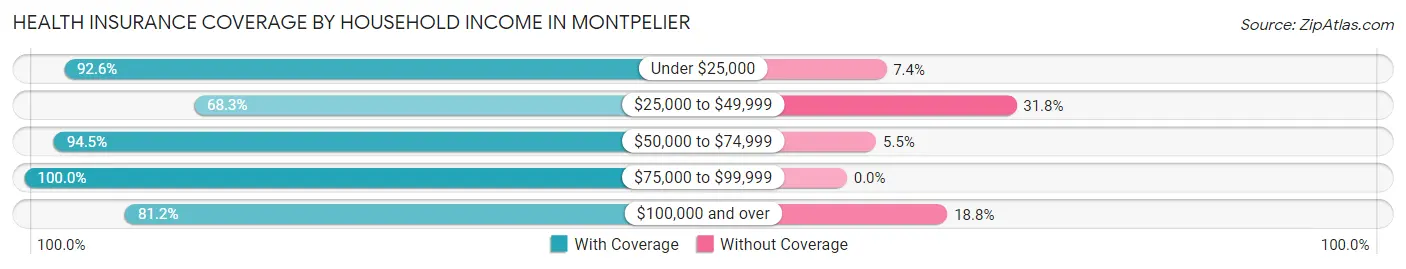
| Household Income | With Coverage | Without Coverage |
| Under $25,000 | 113 (92.6%) | 9 (7.4%) |
| $25,000 to $49,999 | 43 (68.2%) | 20 (31.8%) |
| $50,000 to $74,999 | 86 (94.5%) | 5 (5.5%) |
| $75,000 to $99,999 | 29 (100.0%) | 0 (0.0%) |
| $100,000 and over | 69 (81.2%) | 16 (18.8%) |
Public vs Private Health Insurance Coverage by Age in Montpelier
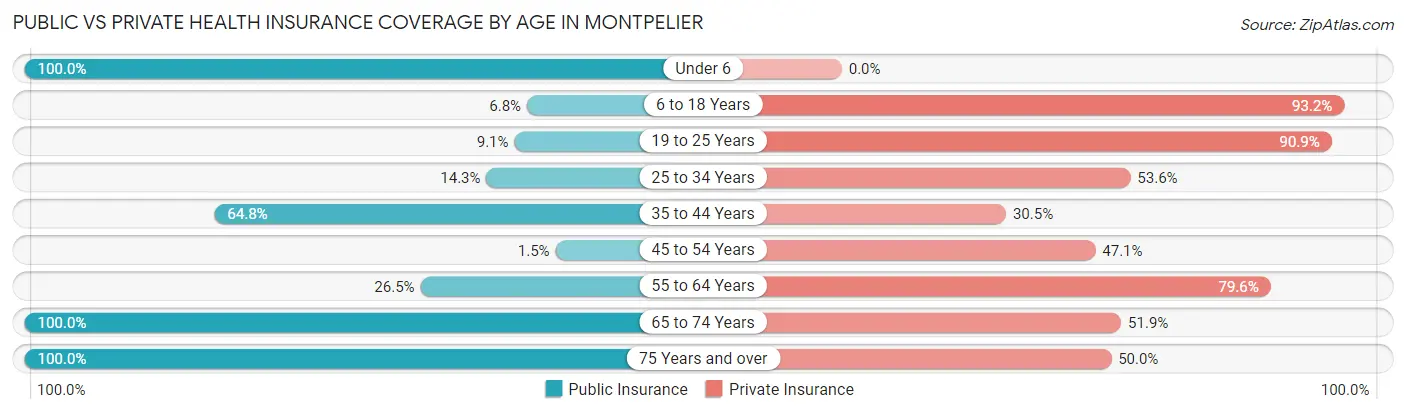
| Age Bracket | Public Insurance | Private Insurance |
| Under 6 | 13 (100.0%) | 0 (0.0%) |
| 6 to 18 Years | 5 (6.8%) | 69 (93.2%) |
| 19 to 25 Years | 2 (9.1%) | 20 (90.9%) |
| 25 to 34 Years | 4 (14.3%) | 15 (53.6%) |
| 35 to 44 Years | 68 (64.8%) | 32 (30.5%) |
| 45 to 54 Years | 1 (1.5%) | 32 (47.1%) |
| 55 to 64 Years | 13 (26.5%) | 39 (79.6%) |
| 65 to 74 Years | 27 (100.0%) | 14 (51.8%) |
| 75 Years and over | 4 (100.0%) | 2 (50.0%) |
| Total | 137 (35.1%) | 223 (57.2%) |
Disability Status by Sex by Age in Montpelier
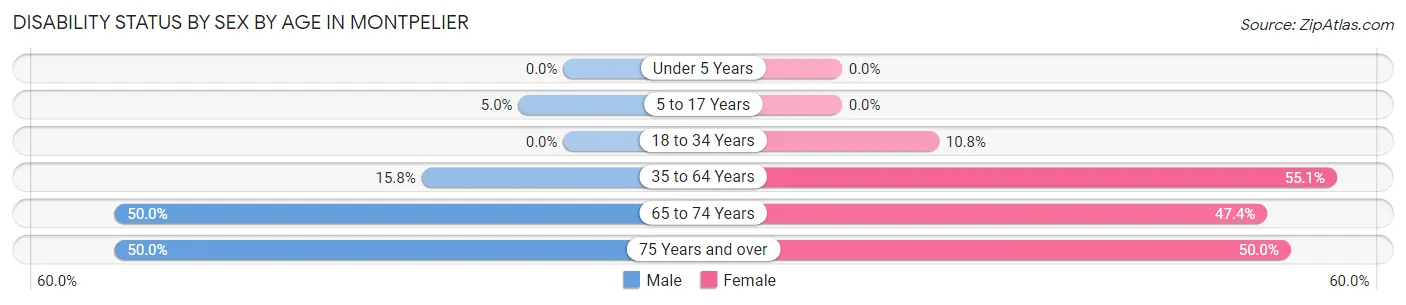
| Age Bracket | Male | Female |
| Under 5 Years | 0 (0.0%) | 0 (0.0%) |
| 5 to 17 Years | 2 (5.0%) | 0 (0.0%) |
| 18 to 34 Years | 0 (0.0%) | 4 (10.8%) |
| 35 to 64 Years | 15 (15.8%) | 70 (55.1%) |
| 65 to 74 Years | 4 (50.0%) | 9 (47.4%) |
| 75 Years and over | 1 (50.0%) | 1 (50.0%) |
Disability Class by Sex by Age in Montpelier
Disability Class: Hearing Difficulty
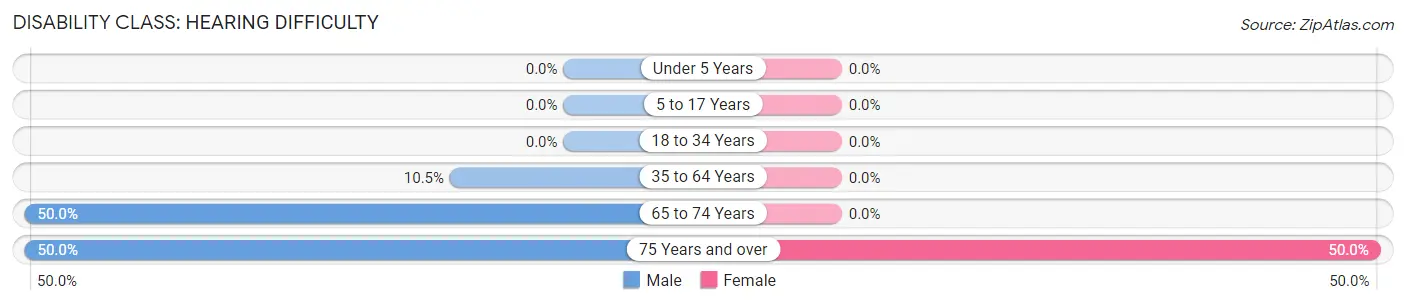
| Age Bracket | Male | Female |
| Under 5 Years | 0 (0.0%) | 0 (0.0%) |
| 5 to 17 Years | 0 (0.0%) | 0 (0.0%) |
| 18 to 34 Years | 0 (0.0%) | 0 (0.0%) |
| 35 to 64 Years | 10 (10.5%) | 0 (0.0%) |
| 65 to 74 Years | 4 (50.0%) | 0 (0.0%) |
| 75 Years and over | 1 (50.0%) | 1 (50.0%) |
Disability Class: Vision Difficulty
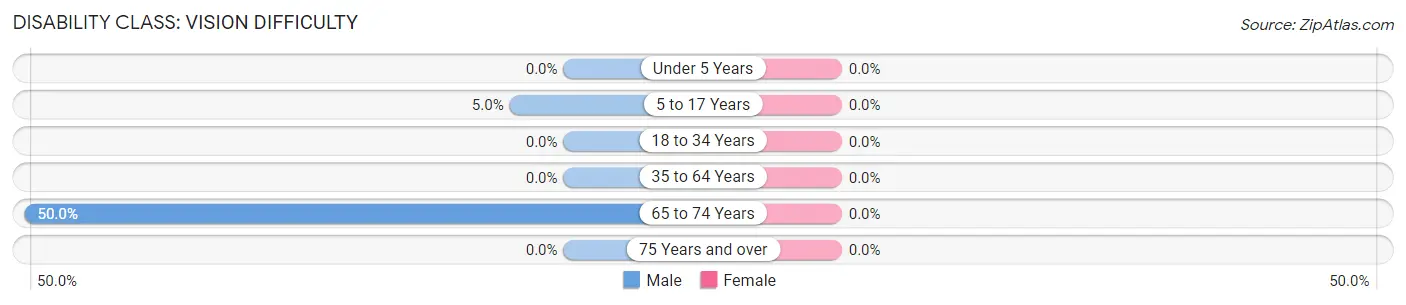
| Age Bracket | Male | Female |
| Under 5 Years | 0 (0.0%) | 0 (0.0%) |
| 5 to 17 Years | 2 (5.0%) | 0 (0.0%) |
| 18 to 34 Years | 0 (0.0%) | 0 (0.0%) |
| 35 to 64 Years | 0 (0.0%) | 0 (0.0%) |
| 65 to 74 Years | 4 (50.0%) | 0 (0.0%) |
| 75 Years and over | 0 (0.0%) | 0 (0.0%) |
Disability Class: Cognitive Difficulty
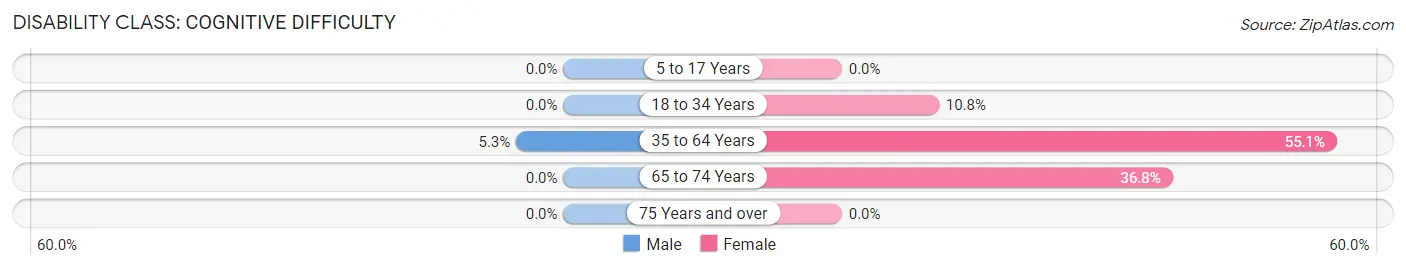
| Age Bracket | Male | Female |
| 5 to 17 Years | 0 (0.0%) | 0 (0.0%) |
| 18 to 34 Years | 0 (0.0%) | 4 (10.8%) |
| 35 to 64 Years | 5 (5.3%) | 70 (55.1%) |
| 65 to 74 Years | 0 (0.0%) | 7 (36.8%) |
| 75 Years and over | 0 (0.0%) | 0 (0.0%) |
Disability Class: Ambulatory Difficulty
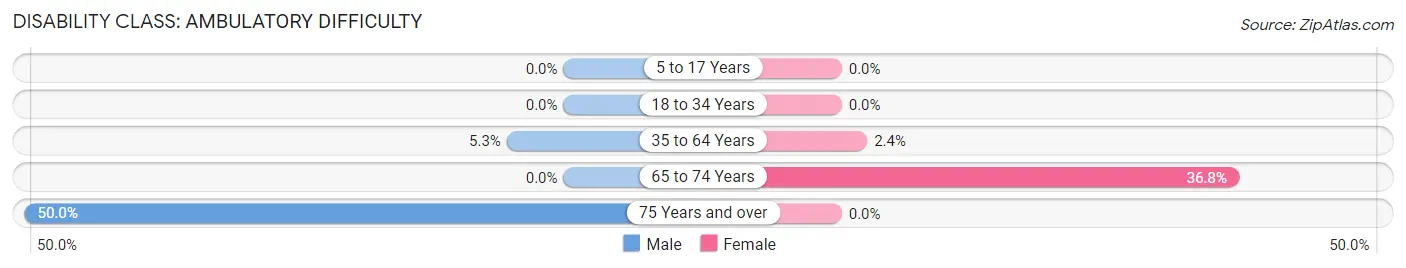
| Age Bracket | Male | Female |
| 5 to 17 Years | 0 (0.0%) | 0 (0.0%) |
| 18 to 34 Years | 0 (0.0%) | 0 (0.0%) |
| 35 to 64 Years | 5 (5.3%) | 3 (2.4%) |
| 65 to 74 Years | 0 (0.0%) | 7 (36.8%) |
| 75 Years and over | 1 (50.0%) | 0 (0.0%) |
Disability Class: Self-Care Difficulty
| Age Bracket | Male | Female |
| 5 to 17 Years | 0 (0.0%) | 0 (0.0%) |
| 18 to 34 Years | 0 (0.0%) | 0 (0.0%) |
| 35 to 64 Years | 0 (0.0%) | 0 (0.0%) |
| 65 to 74 Years | 0 (0.0%) | 0 (0.0%) |
| 75 Years and over | 0 (0.0%) | 0 (0.0%) |
Technology Access in Montpelier
Computing Device Access in Montpelier
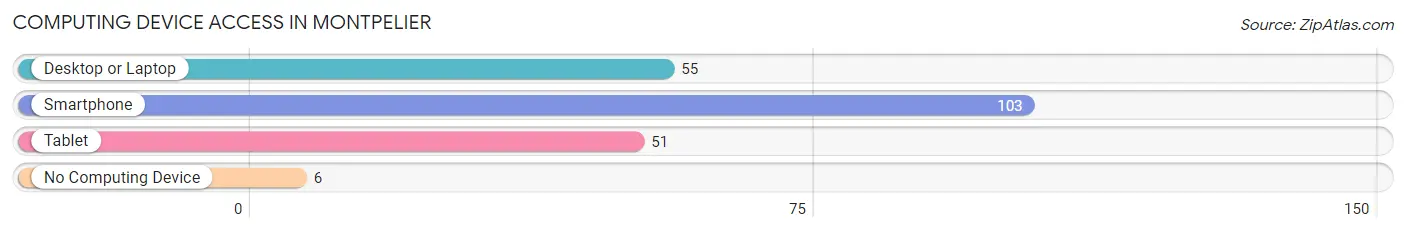
| Device Type | # Households | % Households |
| Desktop or Laptop | 55 | 50.0% |
| Smartphone | 103 | 93.6% |
| Tablet | 51 | 46.4% |
| No Computing Device | 6 | 5.4% |
| Total | 110 | 100.0% |
Internet Access in Montpelier
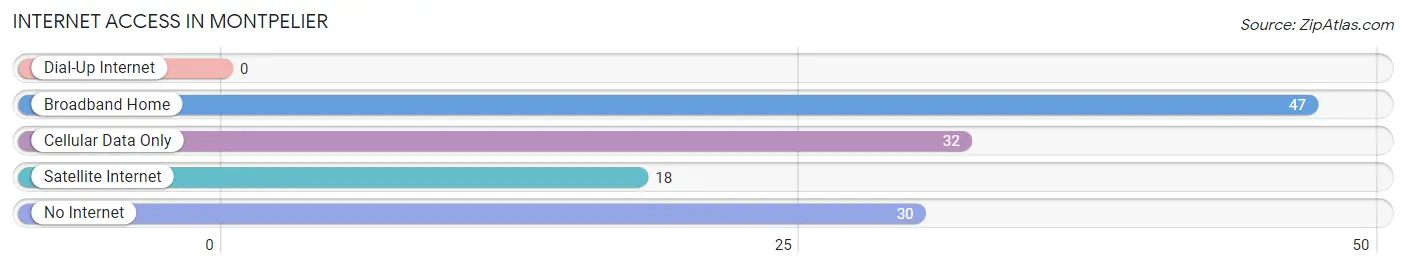
| Internet Type | # Households | % Households |
| Dial-Up Internet | 0 | 0.0% |
| Broadband Home | 47 | 42.7% |
| Cellular Data Only | 32 | 29.1% |
| Satellite Internet | 18 | 16.4% |
| No Internet | 30 | 27.3% |
| Total | 110 | 100.0% |
Montpelier Summary
Montpelier is a small town located in the state of Louisiana, United States. It is situated in the northern part of the state, in the parish of East Carroll. The town has a population of approximately 1,000 people, and is located on the banks of the Mississippi River.
History
Montpelier was founded in 1845 by a group of settlers from the nearby town of Lake Providence. The town was named after the French city of Montpellier, and was originally intended to be a trading post for the local farmers. The town quickly grew, and by the late 19th century, it had become a major port for the cotton industry. The town was also home to a number of sawmills, and was a major supplier of lumber to the surrounding area.
In the early 20th century, the town experienced a period of decline, as the cotton industry moved away from the area. However, the town was able to survive, and in the 1950s, it experienced a period of growth, as the town became a popular tourist destination. The town is now home to a number of small businesses, and is a popular destination for outdoor activities such as fishing and hunting.
Geography
Montpelier is located in the northern part of Louisiana, in the parish of East Carroll. The town is situated on the banks of the Mississippi River, and is surrounded by a number of small lakes and streams. The town is located in a rural area, and is surrounded by a number of small towns and villages. The nearest major city is Vicksburg, Mississippi, which is located approximately 40 miles to the south.
Economy
The economy of Montpelier is largely based on agriculture and tourism. The town is home to a number of small businesses, including restaurants, shops, and other services. The town is also home to a number of small farms, which produce a variety of crops, including cotton, soybeans, and corn. The town is also home to a number of small manufacturing companies, which produce a variety of products, including furniture and clothing.
The town is also a popular tourist destination, and is home to a number of attractions, including the Montpelier Museum, which houses a collection of artifacts from the town's history. The town is also home to a number of outdoor activities, such as fishing and hunting.
Demographics
As of the 2010 census, the population of Montpelier was 1,000 people. The town is predominantly white, with approximately 95% of the population being white. The town is also home to a small African American population, with approximately 4% of the population being African American. The town is also home to a small Hispanic population, with approximately 1% of the population being Hispanic. The median household income in the town is approximately $30,000, and the median home value is approximately $90,000.
Common Questions
What is Per Capita Income in Montpelier?
Per Capita income in Montpelier is $33,748.
What is the Median Household income in Montpelier?
Median Household Income in Montpelier is $48,125.
What is Inequality or Gini Index in Montpelier?
Inequality or Gini Index in Montpelier is 0.56.
What is the Total Population of Montpelier?
Total Population of Montpelier is 390.
What is the Total Male Population of Montpelier?
Total Male Population of Montpelier is 171.
What is the Total Female Population of Montpelier?
Total Female Population of Montpelier is 219.
What is the Ratio of Males per 100 Females in Montpelier?
There are 78.08 Males per 100 Females in Montpelier.
What is the Ratio of Females per 100 Males in Montpelier?
There are 128.07 Females per 100 Males in Montpelier.
What is the Median Population Age in Montpelier?
Median Population Age in Montpelier is 38.0 Years.
What is the Average Family Size in Montpelier
Average Family Size in Montpelier is 4.4 People.
What is the Average Household Size in Montpelier
Average Household Size in Montpelier is 3.5 People.
How Large is the Labor Force in Montpelier?
There are 272 People in the Labor Forcein in Montpelier.
What is the Percentage of People in the Labor Force in Montpelier?
80.5% of People are in the Labor Force in Montpelier.
What is the Unemployment Rate in Montpelier?
Unemployment Rate in Montpelier is 28.3%.