Cade, LA Map & Demographics
Cade Map
Cade Overview
$29,884
PER CAPITA INCOME
$68,672
AVG FAMILY INCOME
$64,028
AVG HOUSEHOLD INCOME
50.1%
WAGE / INCOME GAP [ % ]
49.9¢/ $1
WAGE / INCOME GAP [ $ ]
0.36
INEQUALITY / GINI INDEX
1,960
TOTAL POPULATION
937
MALE POPULATION
1,023
FEMALE POPULATION
91.59
MALES / 100 FEMALES
109.18
FEMALES / 100 MALES
38.7
MEDIAN AGE
3.4
AVG FAMILY SIZE
2.6
AVG HOUSEHOLD SIZE
1,132
LABOR FORCE [ PEOPLE ]
76.1%
PERCENT IN LABOR FORCE
1.4%
UNEMPLOYMENT RATE
Cade Zip Codes
Cade Area Codes
Income in Cade
Income Overview in Cade
Per Capita Income in Cade is $29,884, while median incomes of families and households are $68,672 and $64,028 respectively.
| Characteristic | Number | Measure |
| Per Capita Income | 1,960 | $29,884 |
| Median Family Income | 451 | $68,672 |
| Mean Family Income | 451 | $79,680 |
| Median Household Income | 763 | $64,028 |
| Mean Household Income | 763 | $67,236 |
| Income Deficit | 451 | $0 |
| Wage / Income Gap (%) | 1,960 | 50.09% |
| Wage / Income Gap ($) | 1,960 | 49.91¢ per $1 |
| Gini / Inequality Index | 1,960 | 0.36 |
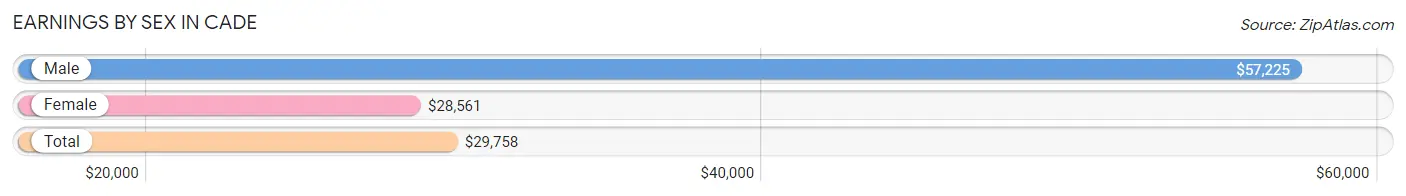
Earnings by Sex in Cade
Average Earnings in Cade are $29,758, $57,225 for men and $28,561 for women, a difference of 50.1%.
| Sex | Number | Average Earnings |
| Male | 541 (46.0%) | $57,225 |
| Female | 636 (54.0%) | $28,561 |
| Total | 1,177 (100.0%) | $29,758 |
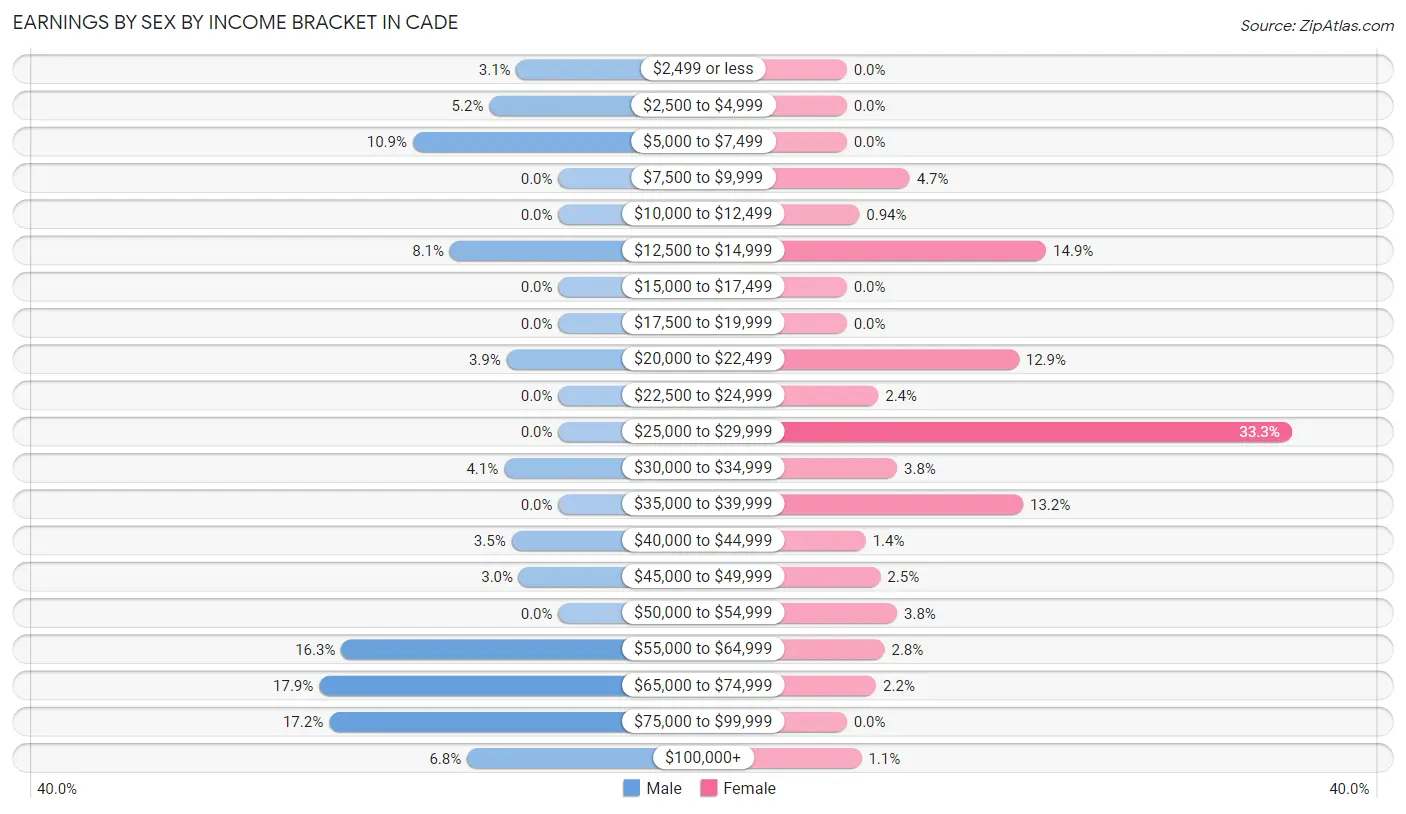
Earnings by Sex by Income Bracket in Cade
The most common earnings brackets in Cade are $65,000 to $74,999 for men (97 | 17.9%) and $25,000 to $29,999 for women (212 | 33.3%).
| Income | Male | Female |
| $2,499 or less | 17 (3.1%) | 0 (0.0%) |
| $2,500 to $4,999 | 28 (5.2%) | 0 (0.0%) |
| $5,000 to $7,499 | 59 (10.9%) | 0 (0.0%) |
| $7,500 to $9,999 | 0 (0.0%) | 30 (4.7%) |
| $10,000 to $12,499 | 0 (0.0%) | 6 (0.9%) |
| $12,500 to $14,999 | 44 (8.1%) | 95 (14.9%) |
| $15,000 to $17,499 | 0 (0.0%) | 0 (0.0%) |
| $17,500 to $19,999 | 0 (0.0%) | 0 (0.0%) |
| $20,000 to $22,499 | 21 (3.9%) | 82 (12.9%) |
| $22,500 to $24,999 | 0 (0.0%) | 15 (2.4%) |
| $25,000 to $29,999 | 0 (0.0%) | 212 (33.3%) |
| $30,000 to $34,999 | 22 (4.1%) | 24 (3.8%) |
| $35,000 to $39,999 | 0 (0.0%) | 84 (13.2%) |
| $40,000 to $44,999 | 19 (3.5%) | 9 (1.4%) |
| $45,000 to $49,999 | 16 (3.0%) | 16 (2.5%) |
| $50,000 to $54,999 | 0 (0.0%) | 24 (3.8%) |
| $55,000 to $64,999 | 88 (16.3%) | 18 (2.8%) |
| $65,000 to $74,999 | 97 (17.9%) | 14 (2.2%) |
| $75,000 to $99,999 | 93 (17.2%) | 0 (0.0%) |
| $100,000+ | 37 (6.8%) | 7 (1.1%) |
| Total | 541 (100.0%) | 636 (100.0%) |
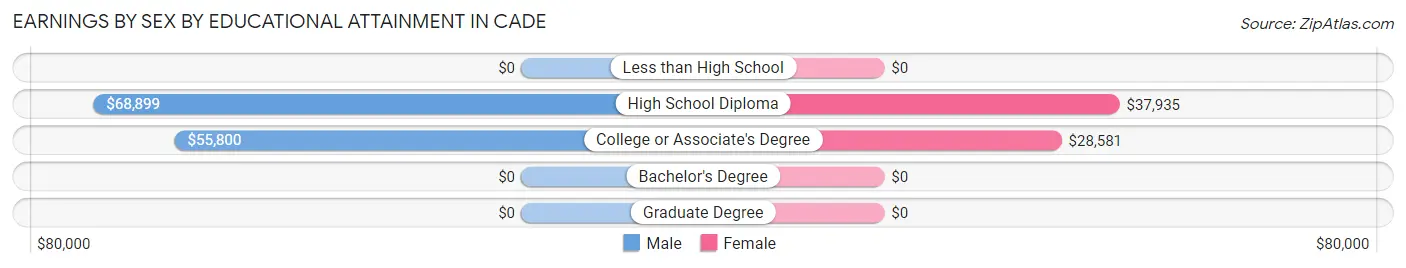
Earnings by Sex by Educational Attainment in Cade
Average earnings in Cade are $67,827 for men and $29,133 for women, a difference of 57.1%. Men with an educational attainment of high school diploma enjoy the highest average annual earnings of $68,899, while those with college or associate's degree education earn the least with $55,800. Women with an educational attainment of high school diploma earn the most with the average annual earnings of $37,935, while those with college or associate's degree education have the smallest earnings of $28,581.
| Educational Attainment | Male Income | Female Income |
| Less than High School | - | - |
| High School Diploma | $68,899 | $37,935 |
| College or Associate's Degree | $55,800 | $28,581 |
| Bachelor's Degree | - | - |
| Graduate Degree | - | - |
| Total | $67,827 | $29,133 |
Family Income in Cade
Family Income Brackets in Cade
According to the Cade family income data, there are 101 families falling into the $75,000 to $99,999 income range, which is the most common income bracket and makes up 22.4% of all families.
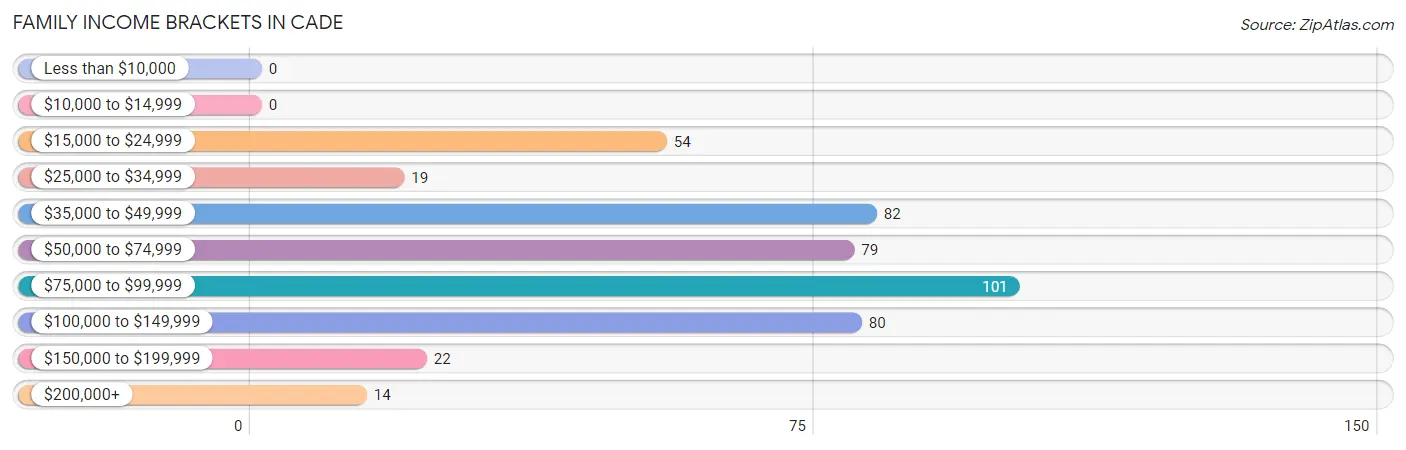
| Income Bracket | # Families | % Families |
| Less than $10,000 | 0 | 0.0% |
| $10,000 to $14,999 | 0 | 0.0% |
| $15,000 to $24,999 | 54 | 12.0% |
| $25,000 to $34,999 | 19 | 4.2% |
| $35,000 to $49,999 | 82 | 18.2% |
| $50,000 to $74,999 | 79 | 17.5% |
| $75,000 to $99,999 | 101 | 22.4% |
| $100,000 to $149,999 | 80 | 17.7% |
| $150,000 to $199,999 | 22 | 4.9% |
| $200,000+ | 14 | 3.1% |
Family Income by Famaliy Size in Cade
4-person families (129 | 28.6%) account for the highest median family income in Cade with $91,821 per family, while 2-person families (236 | 52.3%) have the highest median income of $33,148 per family member.
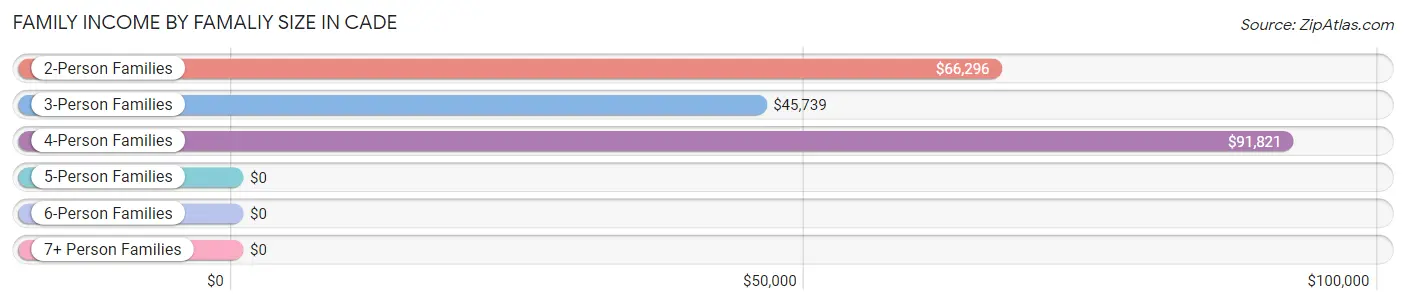
| Income Bracket | # Families | Median Income |
| 2-Person Families | 236 (52.3%) | $66,296 |
| 3-Person Families | 86 (19.1%) | $45,739 |
| 4-Person Families | 129 (28.6%) | $91,821 |
| 5-Person Families | 0 (0.0%) | $0 |
| 6-Person Families | 0 (0.0%) | $0 |
| 7+ Person Families | 0 (0.0%) | $0 |
| Total | 451 (100.0%) | $68,672 |
Family Income by Number of Earners in Cade
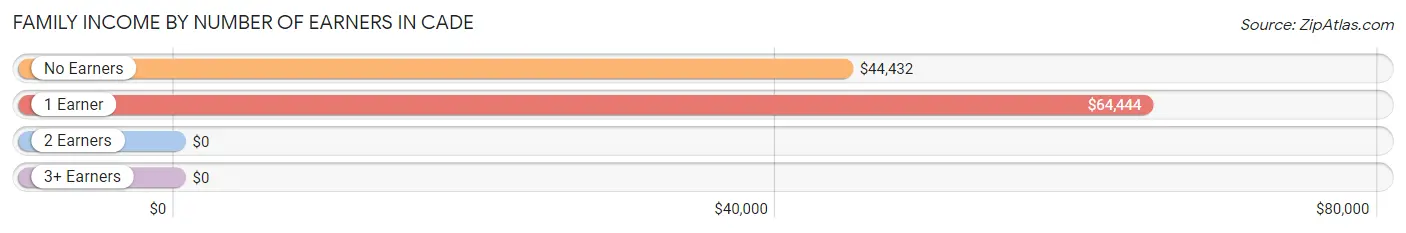
| Number of Earners | # Families | Median Income |
| No Earners | 37 (8.2%) | $44,432 |
| 1 Earner | 194 (43.0%) | $64,444 |
| 2 Earners | 169 (37.5%) | $0 |
| 3+ Earners | 51 (11.3%) | $0 |
| Total | 451 (100.0%) | $68,672 |
Household Income in Cade
Household Income Brackets in Cade
With 215 households falling in the category, the $75,000 to $99,999 income range is the most frequent in Cade, accounting for 28.2% of all households.
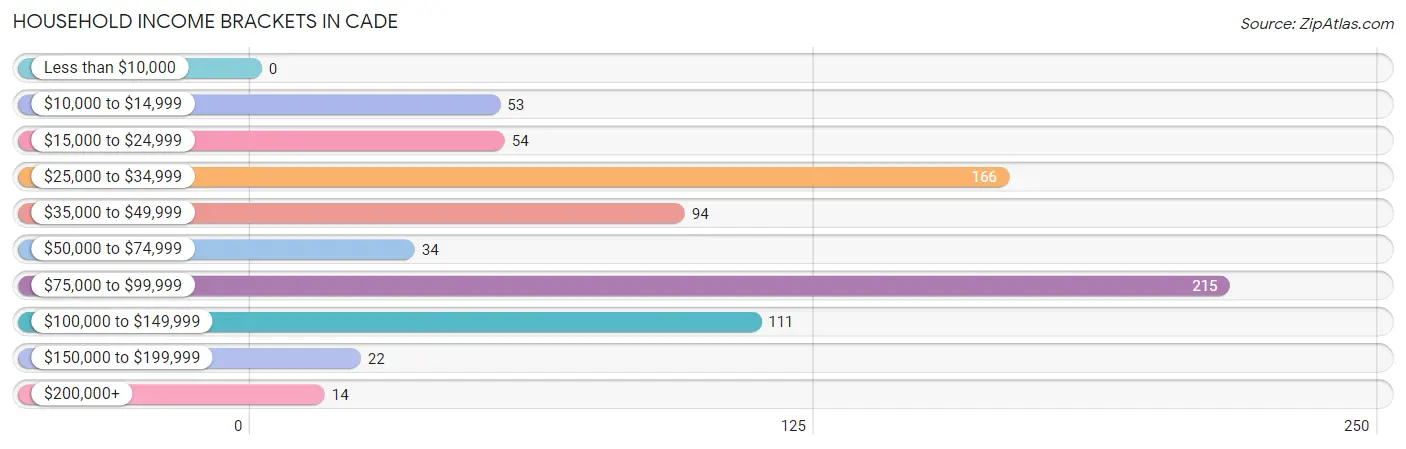
| Income Bracket | # Households | % Households |
| Less than $10,000 | 0 | 0.0% |
| $10,000 to $14,999 | 53 | 6.9% |
| $15,000 to $24,999 | 54 | 7.1% |
| $25,000 to $34,999 | 166 | 21.8% |
| $35,000 to $49,999 | 94 | 12.3% |
| $50,000 to $74,999 | 34 | 4.5% |
| $75,000 to $99,999 | 215 | 28.2% |
| $100,000 to $149,999 | 111 | 14.5% |
| $150,000 to $199,999 | 22 | 2.9% |
| $200,000+ | 14 | 1.8% |
Household Income by Householder Age in Cade
The median household income in Cade is $64,028, with the highest median household income of $84,868 found in the 45 to 64 years age bracket for the primary householder. A total of 256 households (33.6%) fall into this category. Meanwhile, the 15 to 24 years age bracket for the primary householder has the lowest median household income of $0, with 34 households (4.5%) in this group.
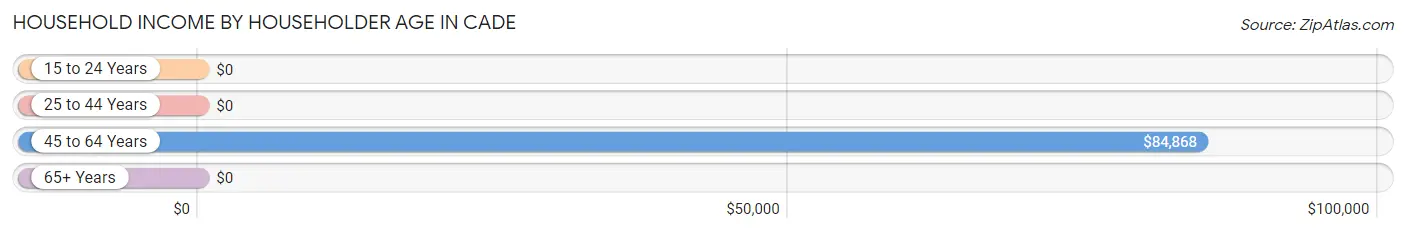
| Income Bracket | # Households | Median Income |
| 15 to 24 Years | 34 (4.5%) | $0 |
| 25 to 44 Years | 322 (42.2%) | $0 |
| 45 to 64 Years | 256 (33.6%) | $84,868 |
| 65+ Years | 151 (19.8%) | $0 |
| Total | 763 (100.0%) | $64,028 |
Poverty in Cade
Income Below Poverty by Sex and Age in Cade
With 1.8% poverty level for males and 7.7% for females among the residents of Cade, 45 to 54 year old males and 65 to 74 year old females are the most vulnerable to poverty, with 17 males (7.1%) and 63 females (54.3%) in their respective age groups living below the poverty level.
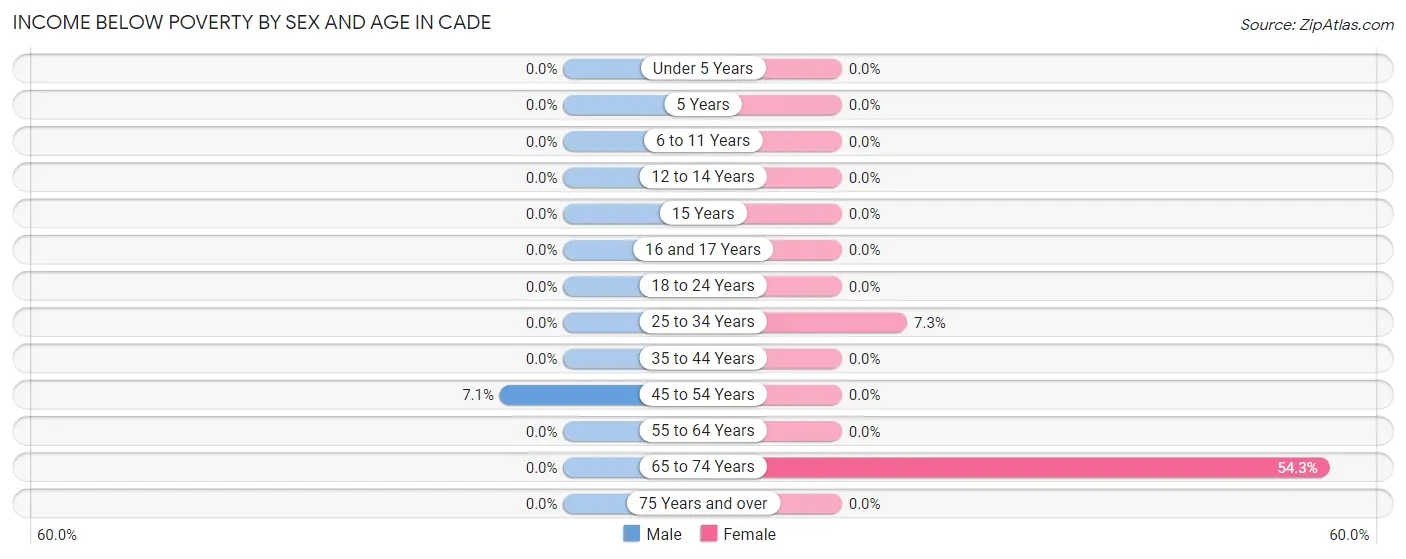
| Age Bracket | Male | Female |
| Under 5 Years | 0 (0.0%) | 0 (0.0%) |
| 5 Years | 0 (0.0%) | 0 (0.0%) |
| 6 to 11 Years | 0 (0.0%) | 0 (0.0%) |
| 12 to 14 Years | 0 (0.0%) | 0 (0.0%) |
| 15 Years | 0 (0.0%) | 0 (0.0%) |
| 16 and 17 Years | 0 (0.0%) | 0 (0.0%) |
| 18 to 24 Years | 0 (0.0%) | 0 (0.0%) |
| 25 to 34 Years | 0 (0.0%) | 16 (7.3%) |
| 35 to 44 Years | 0 (0.0%) | 0 (0.0%) |
| 45 to 54 Years | 17 (7.1%) | 0 (0.0%) |
| 55 to 64 Years | 0 (0.0%) | 0 (0.0%) |
| 65 to 74 Years | 0 (0.0%) | 63 (54.3%) |
| 75 Years and over | 0 (0.0%) | 0 (0.0%) |
| Total | 17 (1.8%) | 79 (7.7%) |
Income Above Poverty by Sex and Age in Cade
According to the poverty statistics in Cade, males aged under 5 years and females aged under 5 years are the age groups that are most secure financially, with 100.0% of males and 100.0% of females in these age groups living above the poverty line.
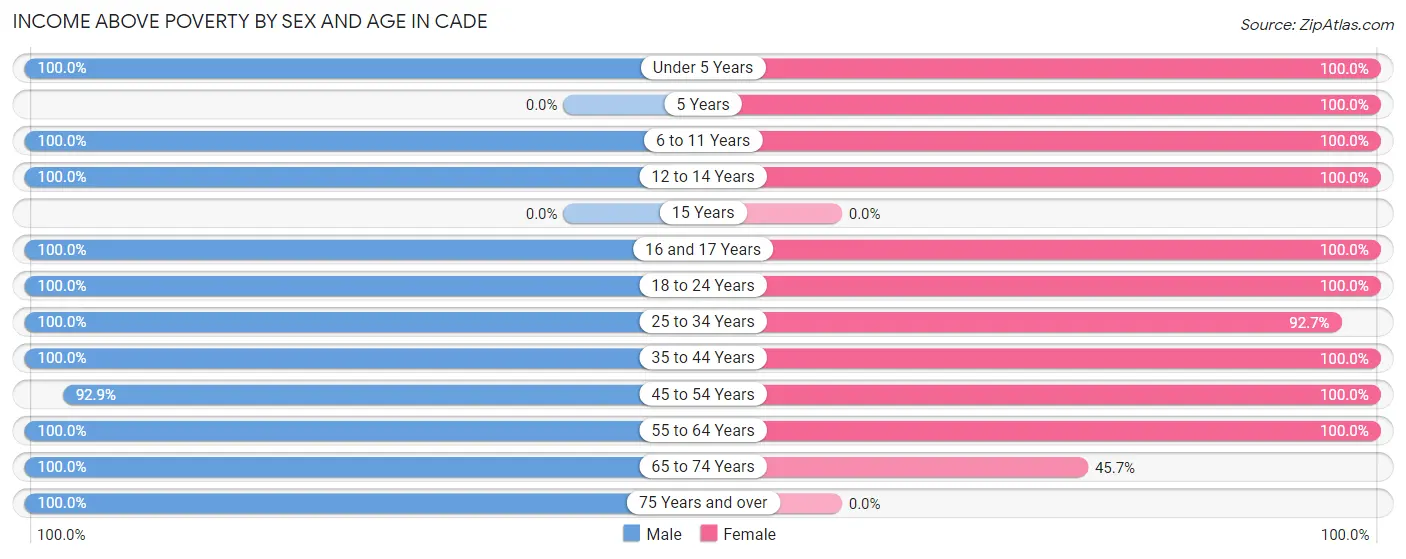
| Age Bracket | Male | Female |
| Under 5 Years | 167 (100.0%) | 14 (100.0%) |
| 5 Years | 0 (0.0%) | 19 (100.0%) |
| 6 to 11 Years | 46 (100.0%) | 189 (100.0%) |
| 12 to 14 Years | 22 (100.0%) | 16 (100.0%) |
| 15 Years | 0 (0.0%) | 0 (0.0%) |
| 16 and 17 Years | 32 (100.0%) | 16 (100.0%) |
| 18 to 24 Years | 92 (100.0%) | 97 (100.0%) |
| 25 to 34 Years | 16 (100.0%) | 204 (92.7%) |
| 35 to 44 Years | 80 (100.0%) | 163 (100.0%) |
| 45 to 54 Years | 223 (92.9%) | 109 (100.0%) |
| 55 to 64 Years | 175 (100.0%) | 64 (100.0%) |
| 65 to 74 Years | 52 (100.0%) | 53 (45.7%) |
| 75 Years and over | 15 (100.0%) | 0 (0.0%) |
| Total | 920 (98.2%) | 944 (92.3%) |
Income Below Poverty Among Married-Couple Families in Cade
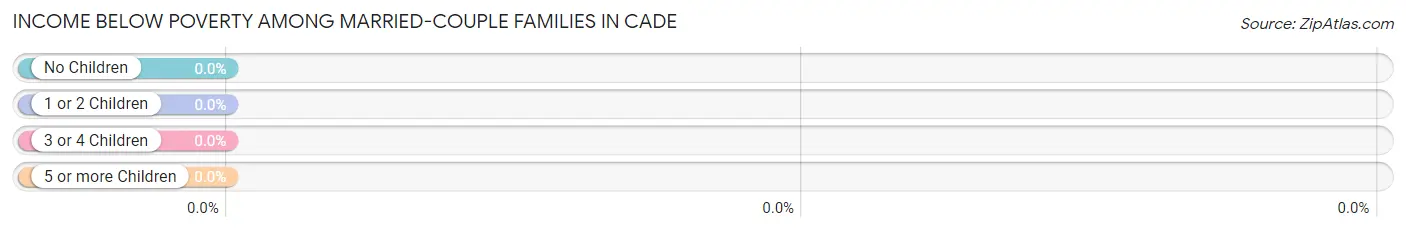
| Children | Above Poverty | Below Poverty |
| No Children | 76 (100.0%) | 0 (0.0%) |
| 1 or 2 Children | 154 (100.0%) | 0 (0.0%) |
| 3 or 4 Children | 0 (0.0%) | 0 (0.0%) |
| 5 or more Children | 0 (0.0%) | 0 (0.0%) |
| Total | 230 (100.0%) | 0 (0.0%) |
Income Below Poverty Among Single-Parent Households in Cade
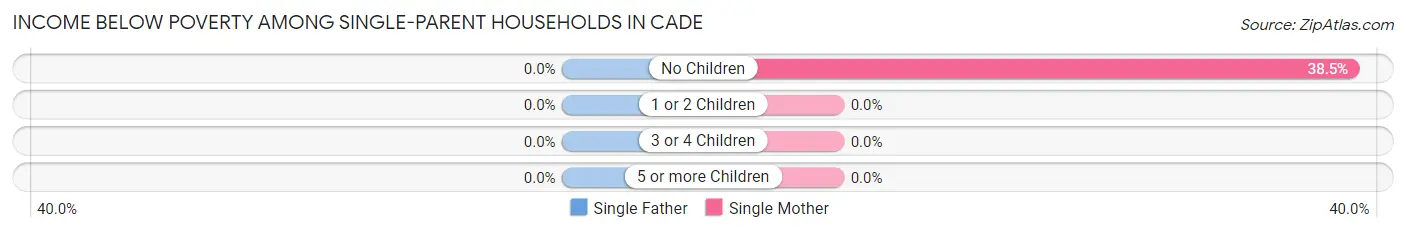
| Children | Single Father | Single Mother |
| No Children | 0 (0.0%) | 10 (38.5%) |
| 1 or 2 Children | 0 (0.0%) | 0 (0.0%) |
| 3 or 4 Children | 0 (0.0%) | 0 (0.0%) |
| 5 or more Children | 0 (0.0%) | 0 (0.0%) |
| Total | 0 (0.0%) | 10 (9.4%) |
Income Below Poverty Among Married-Couple vs Single-Parent Households in Cade
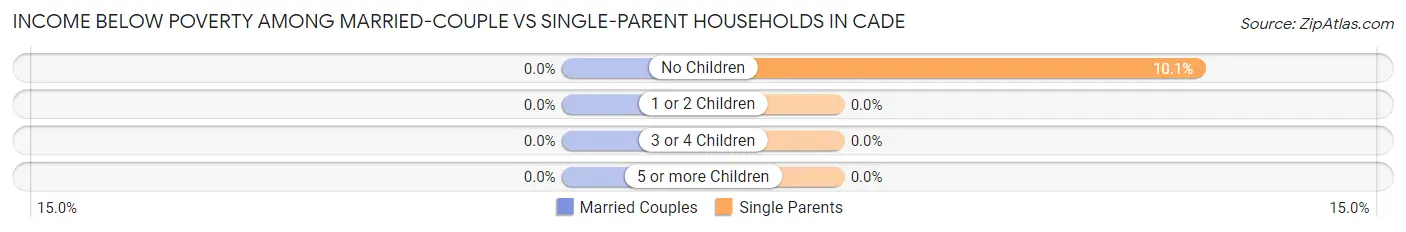
| Children | Married-Couple Families | Single-Parent Households |
| No Children | 0 (0.0%) | 10 (10.1%) |
| 1 or 2 Children | 0 (0.0%) | 0 (0.0%) |
| 3 or 4 Children | 0 (0.0%) | 0 (0.0%) |
| 5 or more Children | 0 (0.0%) | 0 (0.0%) |
| Total | 0 (0.0%) | 10 (4.5%) |
Race in Cade
The most populous races in Cade are White / Caucasian (1,615 | 82.4%), Black / African American (239 | 12.2%), and Two or more Races (54 | 2.8%).
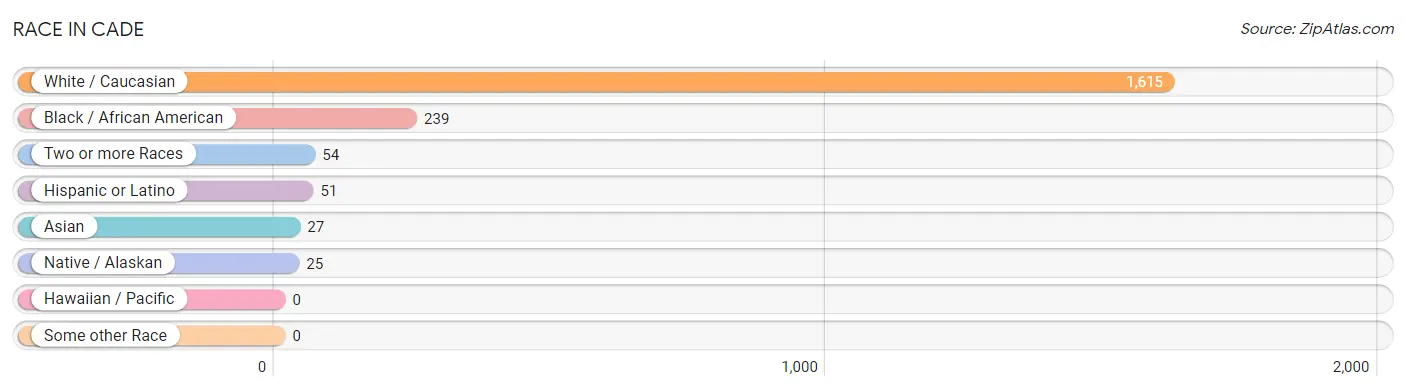
| Race | # Population | % Population |
| Asian | 27 | 1.4% |
| Black / African American | 239 | 12.2% |
| Hawaiian / Pacific | 0 | 0.0% |
| Hispanic or Latino | 51 | 2.6% |
| Native / Alaskan | 25 | 1.3% |
| White / Caucasian | 1,615 | 82.4% |
| Two or more Races | 54 | 2.8% |
| Some other Race | 0 | 0.0% |
| Total | 1,960 | 100.0% |
Ancestry in Cade
The most populous ancestries reported in Cade are French (360 | 18.4%), German (316 | 16.1%), French Canadian (106 | 5.4%), American (60 | 3.1%), and Irish (60 | 3.1%), together accounting for 46.0% of all Cade residents.
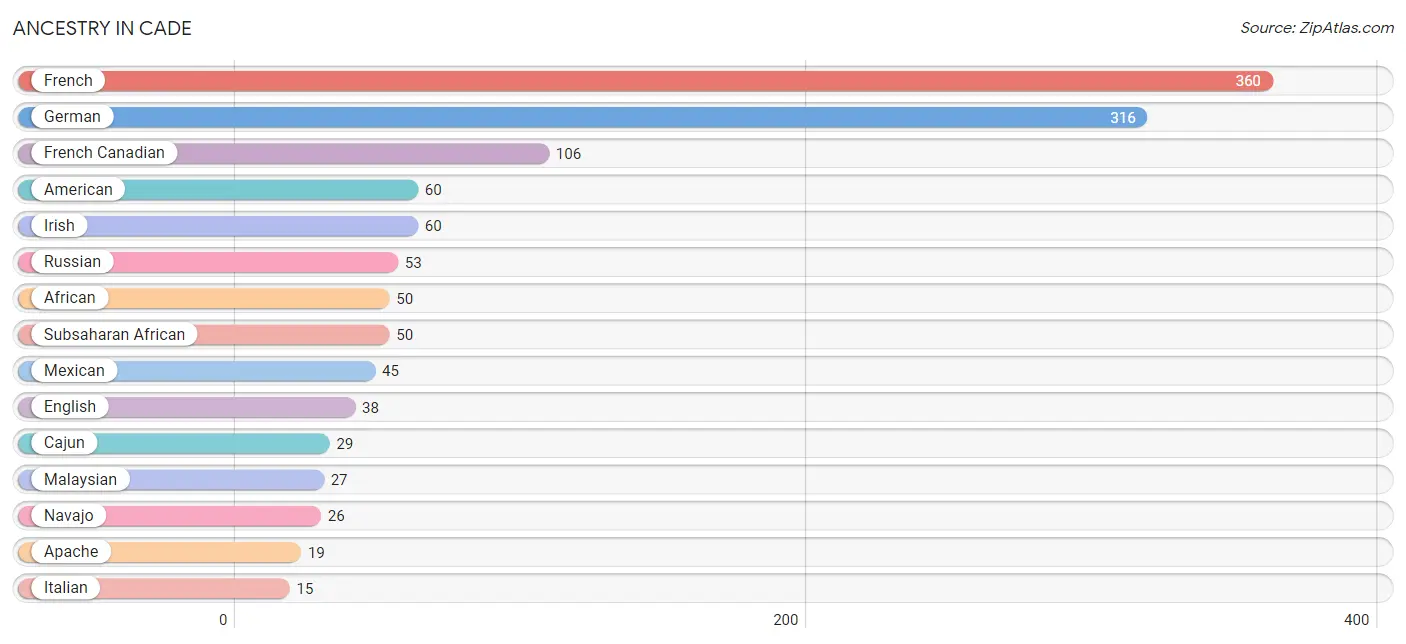
| Ancestry | # Population | % Population |
| African | 50 | 2.5% |
| American | 60 | 3.1% |
| Apache | 19 | 1.0% |
| Bulgarian | 9 | 0.5% |
| Cajun | 29 | 1.5% |
| English | 38 | 1.9% |
| French | 360 | 18.4% |
| French Canadian | 106 | 5.4% |
| German | 316 | 16.1% |
| Houma | 6 | 0.3% |
| Irish | 60 | 3.1% |
| Italian | 15 | 0.8% |
| Malaysian | 27 | 1.4% |
| Mexican | 45 | 2.3% |
| Navajo | 26 | 1.3% |
| Russian | 53 | 2.7% |
| Spanish | 6 | 0.3% |
| Subsaharan African | 50 | 2.5% | View All 18 Rows |
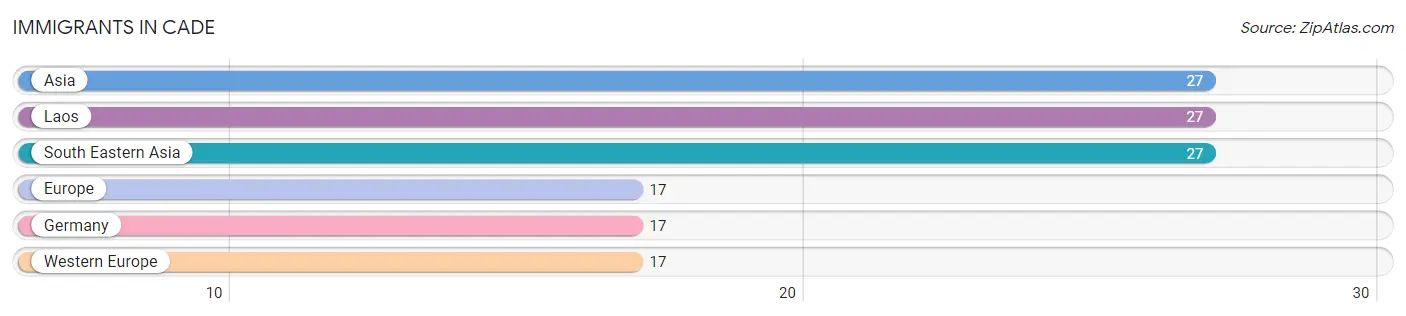
Immigrants in Cade
The most numerous immigrant groups reported in Cade came from Asia (27 | 1.4%), Laos (27 | 1.4%), South Eastern Asia (27 | 1.4%), Europe (17 | 0.9%), and Germany (17 | 0.9%), together accounting for 5.9% of all Cade residents.
| Immigration Origin | # Population | % Population |
| Asia | 27 | 1.4% |
| Europe | 17 | 0.9% |
| Germany | 17 | 0.9% |
| Laos | 27 | 1.4% |
| South Eastern Asia | 27 | 1.4% |
| Western Europe | 17 | 0.9% | View All 6 Rows |
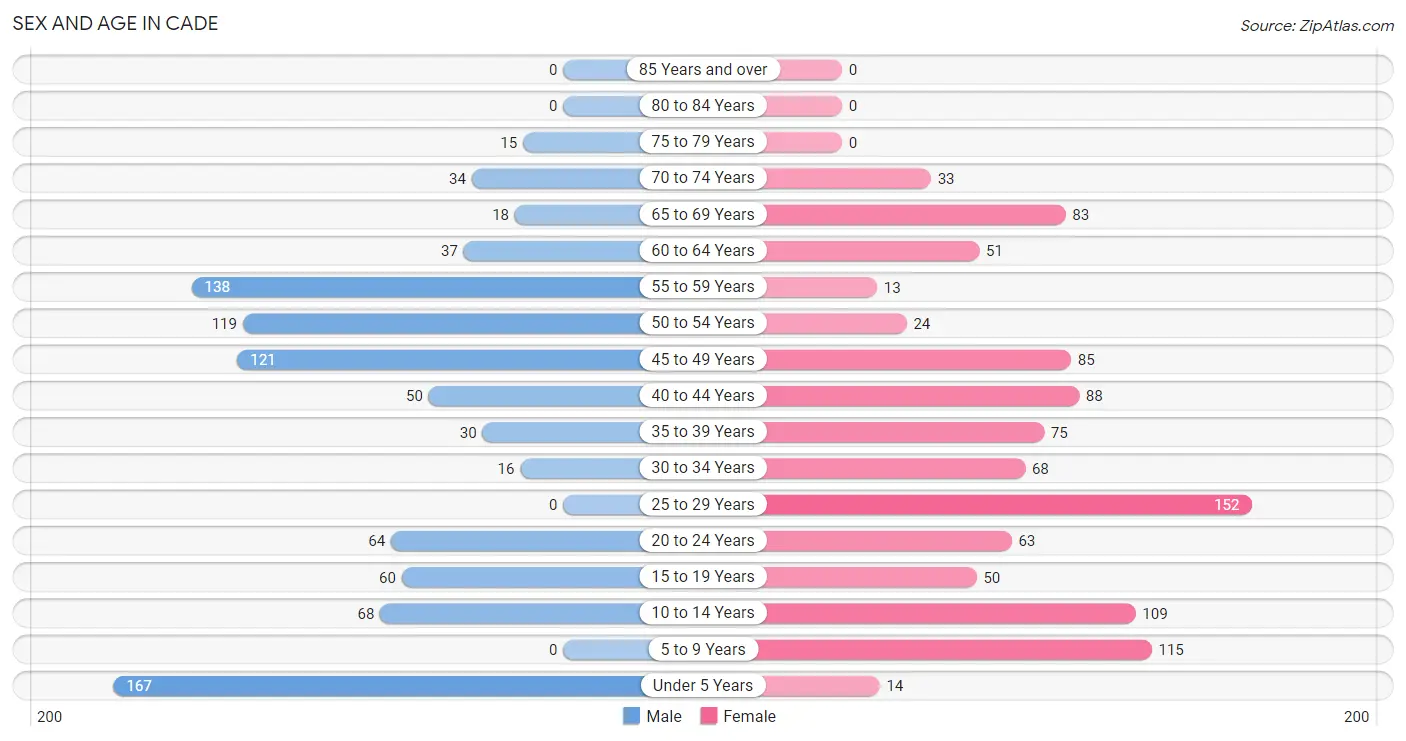
Sex and Age in Cade
Sex and Age in Cade
The most populous age groups in Cade are Under 5 Years (167 | 17.8%) for men and 25 to 29 Years (152 | 14.9%) for women.
| Age Bracket | Male | Female |
| Under 5 Years | 167 (17.8%) | 14 (1.4%) |
| 5 to 9 Years | 0 (0.0%) | 115 (11.2%) |
| 10 to 14 Years | 68 (7.3%) | 109 (10.6%) |
| 15 to 19 Years | 60 (6.4%) | 50 (4.9%) |
| 20 to 24 Years | 64 (6.8%) | 63 (6.2%) |
| 25 to 29 Years | 0 (0.0%) | 152 (14.9%) |
| 30 to 34 Years | 16 (1.7%) | 68 (6.7%) |
| 35 to 39 Years | 30 (3.2%) | 75 (7.3%) |
| 40 to 44 Years | 50 (5.3%) | 88 (8.6%) |
| 45 to 49 Years | 121 (12.9%) | 85 (8.3%) |
| 50 to 54 Years | 119 (12.7%) | 24 (2.4%) |
| 55 to 59 Years | 138 (14.7%) | 13 (1.3%) |
| 60 to 64 Years | 37 (4.0%) | 51 (5.0%) |
| 65 to 69 Years | 18 (1.9%) | 83 (8.1%) |
| 70 to 74 Years | 34 (3.6%) | 33 (3.2%) |
| 75 to 79 Years | 15 (1.6%) | 0 (0.0%) |
| 80 to 84 Years | 0 (0.0%) | 0 (0.0%) |
| 85 Years and over | 0 (0.0%) | 0 (0.0%) |
| Total | 937 (100.0%) | 1,023 (100.0%) |
Families and Households in Cade
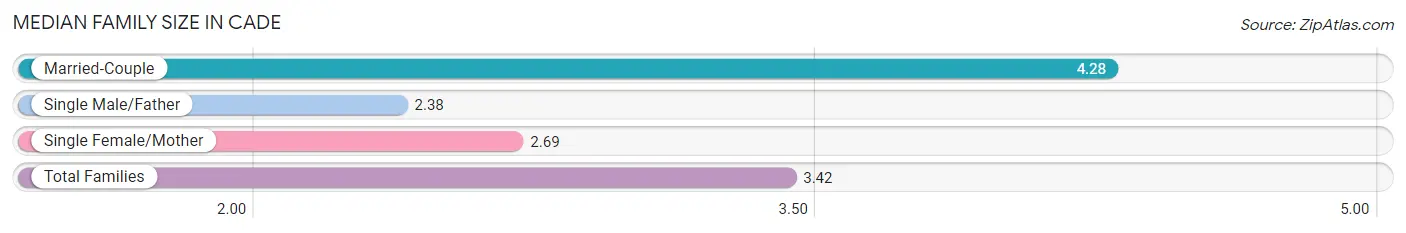
Median Family Size in Cade
The median family size in Cade is 3.42 persons per family, with married-couple families (230 | 51.0%) accounting for the largest median family size of 4.28 persons per family. On the other hand, single male/father families (115 | 25.5%) represent the smallest median family size with 2.38 persons per family.
| Family Type | # Families | Family Size |
| Married-Couple | 230 (51.0%) | 4.28 |
| Single Male/Father | 115 (25.5%) | 2.38 |
| Single Female/Mother | 106 (23.5%) | 2.69 |
| Total Families | 451 (100.0%) | 3.42 |
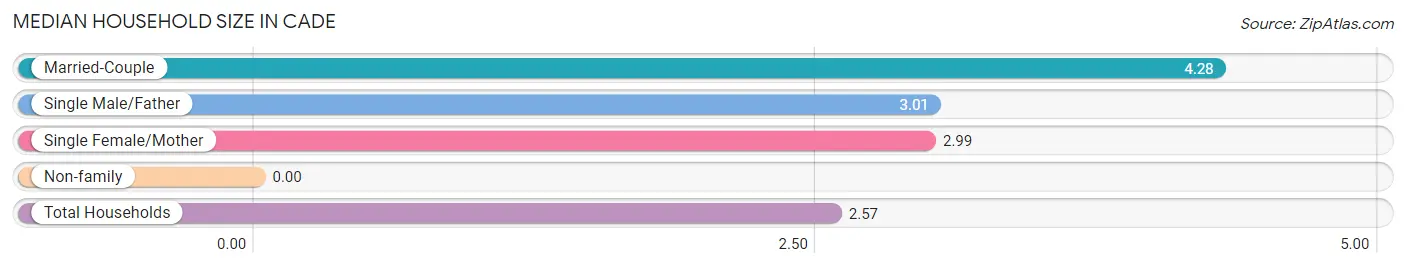
Median Household Size in Cade
| Household Type | # Households | Household Size |
| Married-Couple | 230 (30.1%) | 4.28 |
| Single Male/Father | 115 (15.1%) | 3.01 |
| Single Female/Mother | 106 (13.9%) | 2.99 |
| Non-family | 312 (40.9%) | - |
| Total Households | 763 (100.0%) | 2.57 |
Household Size by Marriage Status in Cade
Out of a total of 763 households in Cade, 451 (59.1%) are family households, while 312 (40.9%) are nonfamily households. The most numerous type of family households are 2-person households, comprising 166, and the most common type of nonfamily households are 1-person households, comprising 312.
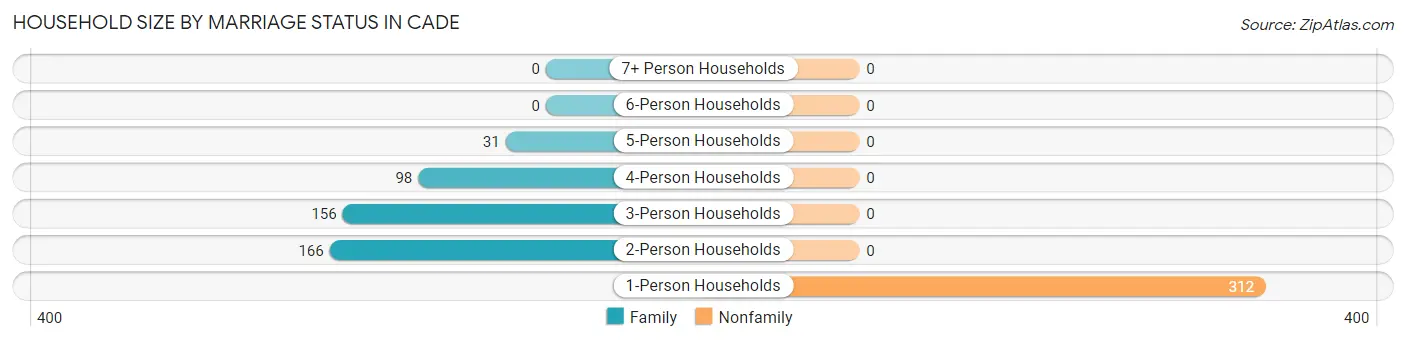
| Household Size | Family Households | Nonfamily Households |
| 1-Person Households | - | 312 (40.9%) |
| 2-Person Households | 166 (21.8%) | 0 (0.0%) |
| 3-Person Households | 156 (20.4%) | 0 (0.0%) |
| 4-Person Households | 98 (12.8%) | 0 (0.0%) |
| 5-Person Households | 31 (4.1%) | 0 (0.0%) |
| 6-Person Households | 0 (0.0%) | 0 (0.0%) |
| 7+ Person Households | 0 (0.0%) | 0 (0.0%) |
| Total | 451 (59.1%) | 312 (40.9%) |
Female Fertility in Cade
Fertility by Age in Cade
Average fertility rate in Cade is 12.0 births per 1,000 women. Women in the age bracket of 35 to 50 years have the highest fertility rate with 28.0 births per 1,000 women. Women in the age bracket of 35 to 50 years acount for 100.0% of all women with births.
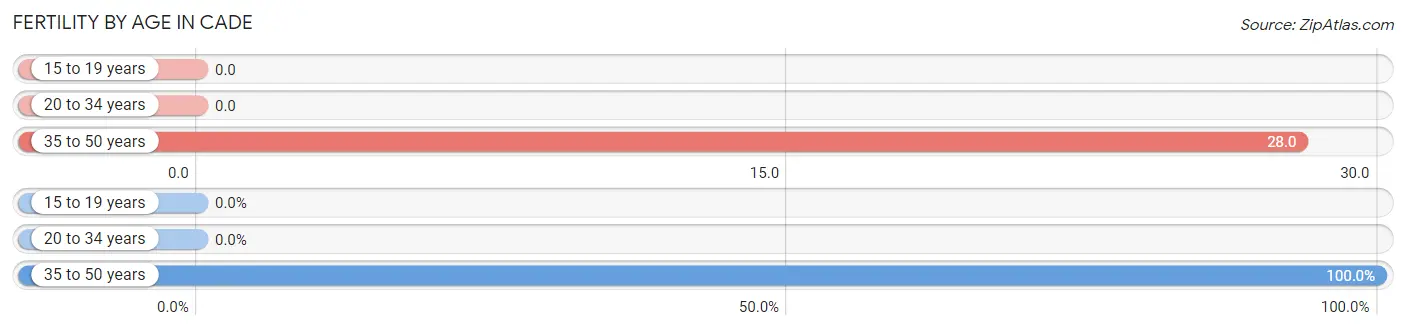
| Age Bracket | Women with Births | Births / 1,000 Women |
| 15 to 19 years | 0 (0.0%) | 0.0 |
| 20 to 34 years | 0 (0.0%) | 0.0 |
| 35 to 50 years | 7 (100.0%) | 28.0 |
| Total | 7 (100.0%) | 12.0 |
Fertility by Age by Marriage Status in Cade
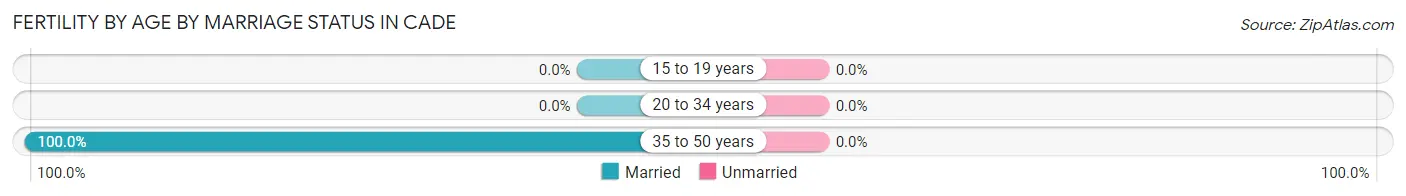
| Age Bracket | Married | Unmarried |
| 15 to 19 years | 0 (0.0%) | 0 (0.0%) |
| 20 to 34 years | 0 (0.0%) | 0 (0.0%) |
| 35 to 50 years | 7 (100.0%) | 0 (0.0%) |
| Total | 7 (100.0%) | 0 (0.0%) |
Fertility by Education in Cade
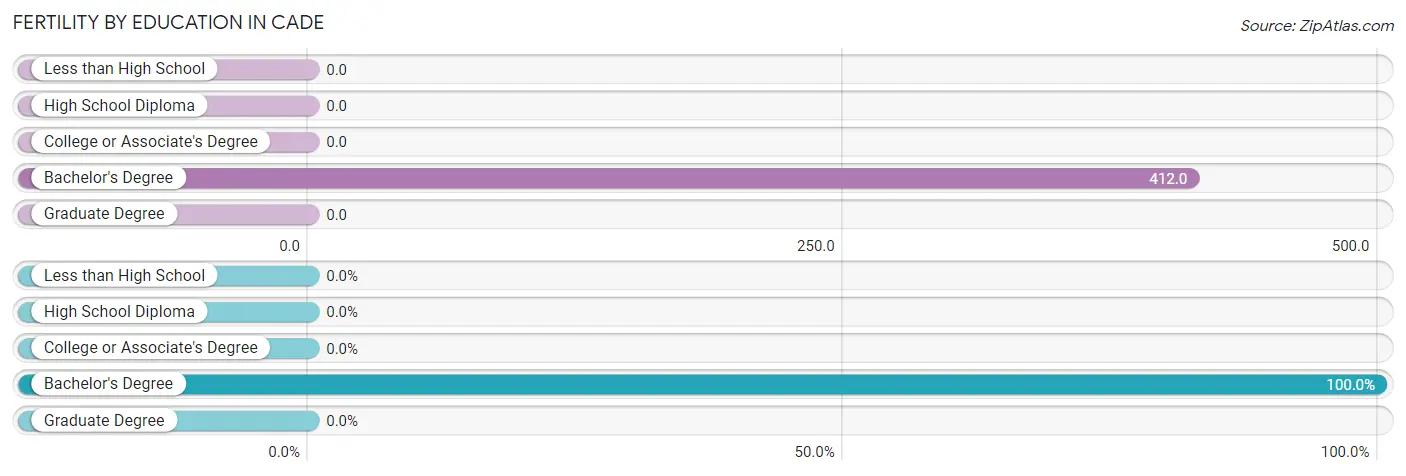
| Educational Attainment | Women with Births | Births / 1,000 Women |
| Less than High School | 0 (0.0%) | 0.0 |
| High School Diploma | 0 (0.0%) | 0.0 |
| College or Associate's Degree | 0 (0.0%) | 0.0 |
| Bachelor's Degree | 7 (100.0%) | 412.0 |
| Graduate Degree | 0 (0.0%) | 0.0 |
| Total | 7 (100.0%) | 12.0 |
Fertility by Education by Marriage Status in Cade
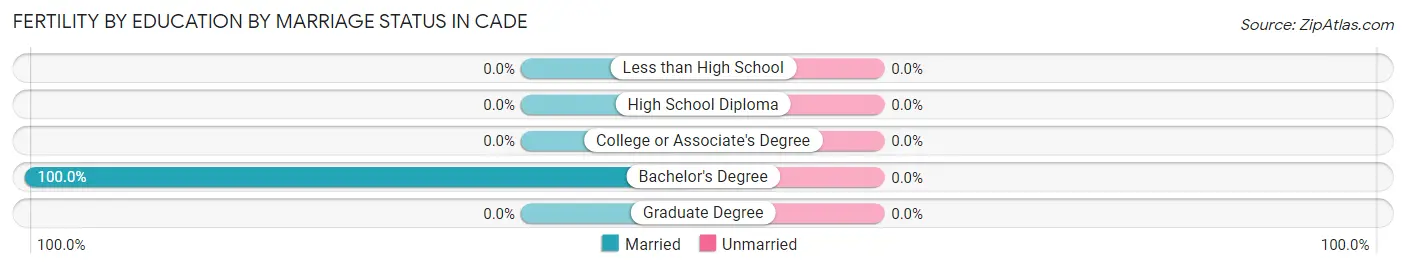
| Educational Attainment | Married | Unmarried |
| Less than High School | 0 (0.0%) | 0 (0.0%) |
| High School Diploma | 0 (0.0%) | 0 (0.0%) |
| College or Associate's Degree | 0 (0.0%) | 0 (0.0%) |
| Bachelor's Degree | 7 (100.0%) | 0 (0.0%) |
| Graduate Degree | 0 (0.0%) | 0 (0.0%) |
| Total | 7 (100.0%) | 0 (0.0%) |
Employment Characteristics in Cade
Employment by Class of Employer in Cade
Among the 1,116 employed individuals in Cade, private company employees (653 | 58.5%), self-employed (not incorporated) (138 | 12.4%), and federal government employees (99 | 8.9%) make up the most common classes of employment.
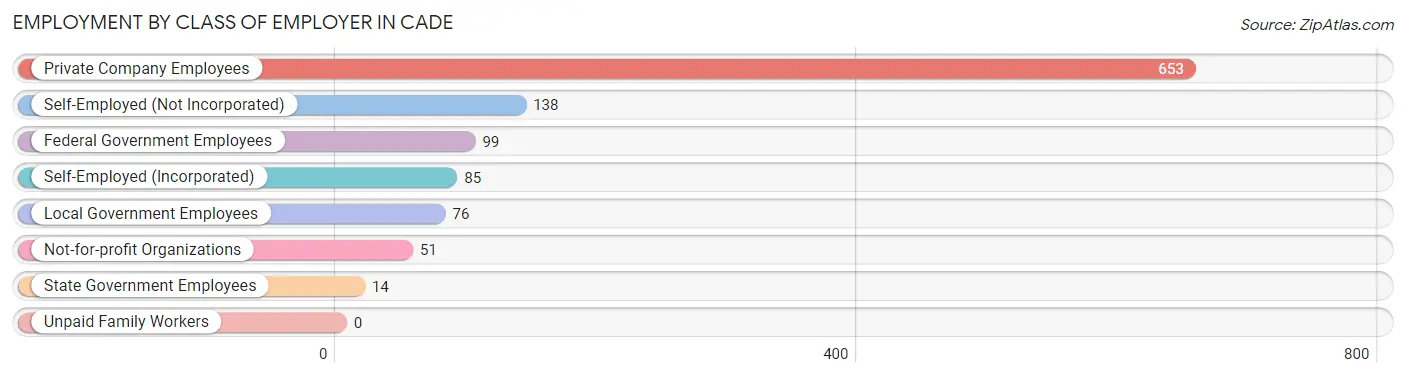
| Employer Class | # Employees | % Employees |
| Private Company Employees | 653 | 58.5% |
| Self-Employed (Incorporated) | 85 | 7.6% |
| Self-Employed (Not Incorporated) | 138 | 12.4% |
| Not-for-profit Organizations | 51 | 4.6% |
| Local Government Employees | 76 | 6.8% |
| State Government Employees | 14 | 1.3% |
| Federal Government Employees | 99 | 8.9% |
| Unpaid Family Workers | 0 | 0.0% |
| Total | 1,116 | 100.0% |
Employment Status by Age in Cade
According to the labor force statistics for Cade, out of the total population over 16 years of age (1,487), 76.1% or 1,132 individuals are in the labor force, with 1.4% or 16 of them unemployed. The age group with the highest labor force participation rate is 20 to 24 years, with 100.0% or 127 individuals in the labor force. Within the labor force, the 25 to 29 years age range has the highest percentage of unemployed individuals, with 10.5% or 16 of them being unemployed.
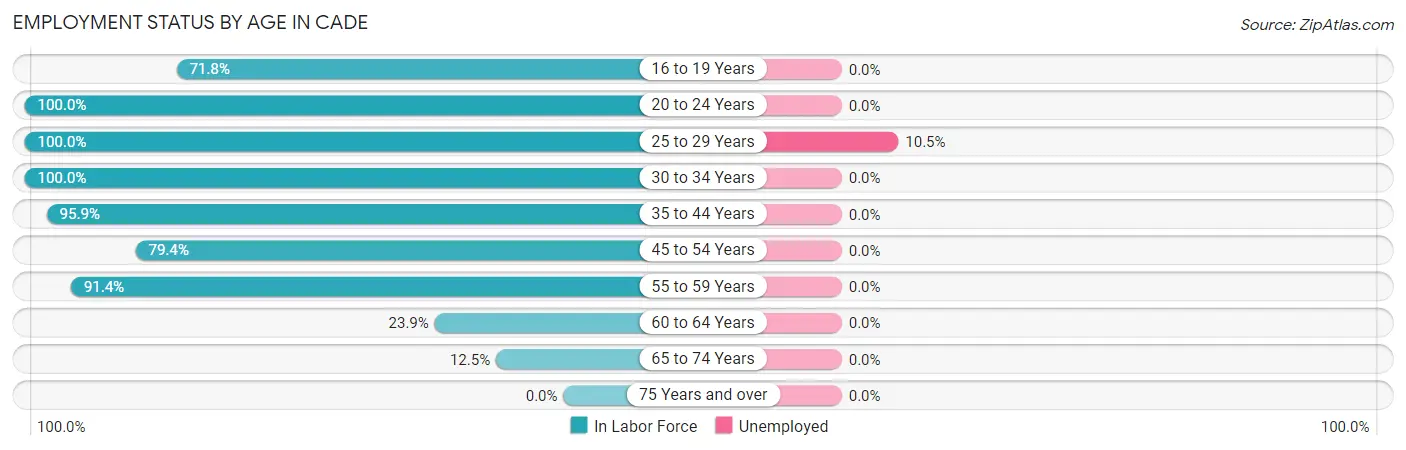
| Age Bracket | In Labor Force | Unemployed |
| 16 to 19 Years | 79 (71.8%) | 0 (0.0%) |
| 20 to 24 Years | 127 (100.0%) | 0 (0.0%) |
| 25 to 29 Years | 152 (100.0%) | 16 (10.5%) |
| 30 to 34 Years | 84 (100.0%) | 0 (0.0%) |
| 35 to 44 Years | 233 (95.9%) | 0 (0.0%) |
| 45 to 54 Years | 277 (79.4%) | 0 (0.0%) |
| 55 to 59 Years | 138 (91.4%) | 0 (0.0%) |
| 60 to 64 Years | 21 (23.9%) | 0 (0.0%) |
| 65 to 74 Years | 21 (12.5%) | 0 (0.0%) |
| 75 Years and over | 0 (0.0%) | 0 (0.0%) |
| Total | 1,132 (76.1%) | 16 (1.4%) |
Employment Status by Educational Attainment in Cade
According to labor force statistics for Cade, 84.8% of individuals (905) out of the total population between 25 and 64 years of age (1,067) are in the labor force, with 1.8% or 16 of them being unemployed. The group with the highest labor force participation rate are those with the educational attainment of college / associate degree, with 88.3% or 474 individuals in the labor force. Within the labor force, individuals with high school diploma education have the highest percentage of unemployment, with 4.7% or 16 of them being unemployed.
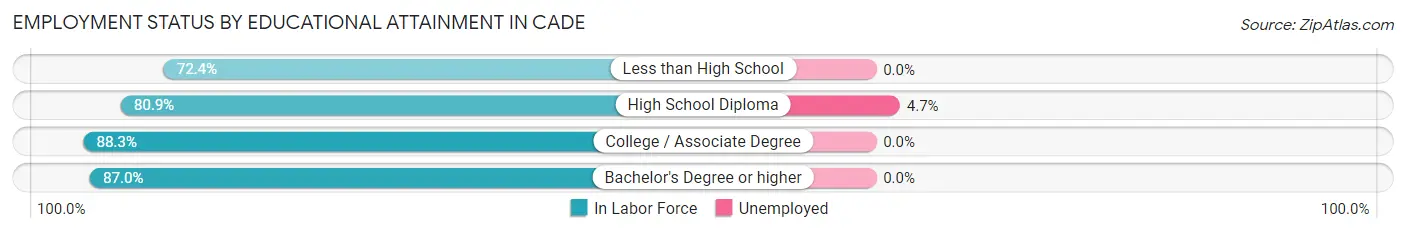
| Educational Attainment | In Labor Force | Unemployed |
| Less than High School | 21 (72.4%) | 0 (0.0%) |
| High School Diploma | 343 (80.9%) | 20 (4.7%) |
| College / Associate Degree | 474 (88.3%) | 0 (0.0%) |
| Bachelor's Degree or higher | 67 (87.0%) | 0 (0.0%) |
| Total | 905 (84.8%) | 19 (1.8%) |
Employment Occupations by Sex in Cade
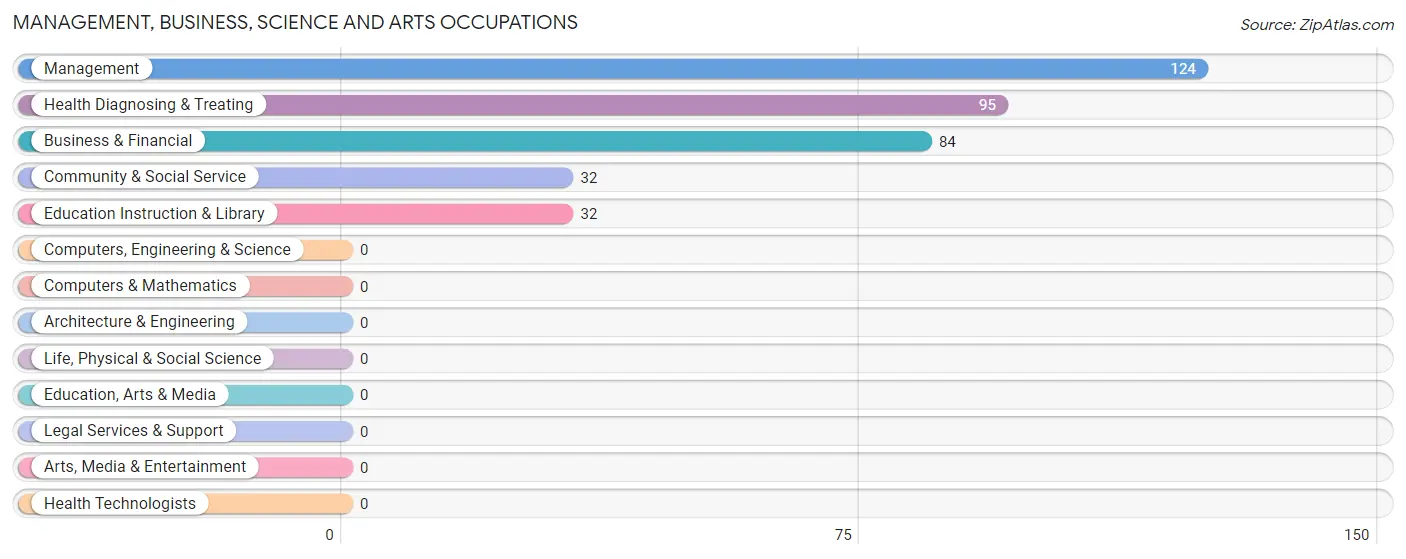
Management, Business, Science and Arts Occupations
The most common Management, Business, Science and Arts occupations in Cade are Management (124 | 11.3%), Health Diagnosing & Treating (95 | 8.7%), Business & Financial (84 | 7.7%), Community & Social Service (32 | 2.9%), and Education Instruction & Library (32 | 2.9%).
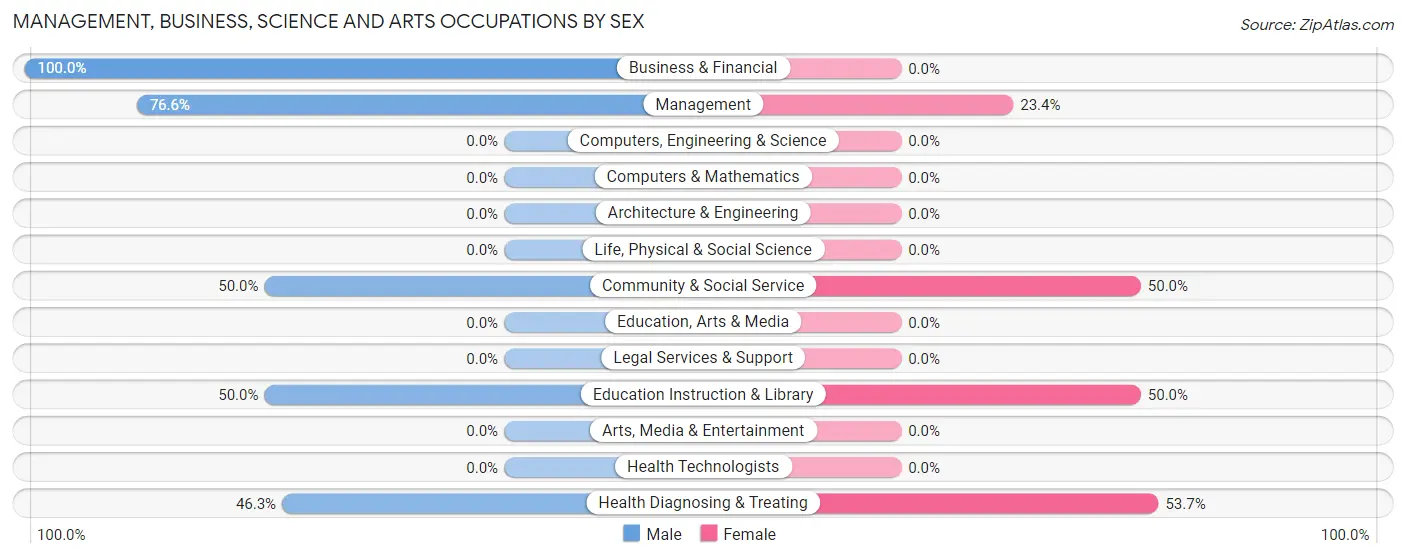
Management, Business, Science and Arts Occupations by Sex
Within the Management, Business, Science and Arts occupations in Cade, the most male-oriented occupations are Business & Financial (100.0%), Management (76.6%), and Community & Social Service (50.0%), while the most female-oriented occupations are Health Diagnosing & Treating (53.7%), Community & Social Service (50.0%), and Education Instruction & Library (50.0%).
| Occupation | Male | Female |
| Management | 95 (76.6%) | 29 (23.4%) |
| Business & Financial | 84 (100.0%) | 0 (0.0%) |
| Computers, Engineering & Science | 0 (0.0%) | 0 (0.0%) |
| Computers & Mathematics | 0 (0.0%) | 0 (0.0%) |
| Architecture & Engineering | 0 (0.0%) | 0 (0.0%) |
| Life, Physical & Social Science | 0 (0.0%) | 0 (0.0%) |
| Community & Social Service | 16 (50.0%) | 16 (50.0%) |
| Education, Arts & Media | 0 (0.0%) | 0 (0.0%) |
| Legal Services & Support | 0 (0.0%) | 0 (0.0%) |
| Education Instruction & Library | 16 (50.0%) | 16 (50.0%) |
| Arts, Media & Entertainment | 0 (0.0%) | 0 (0.0%) |
| Health Diagnosing & Treating | 44 (46.3%) | 51 (53.7%) |
| Health Technologists | 0 (0.0%) | 0 (0.0%) |
| Total (Category) | 239 (71.3%) | 96 (28.7%) |
| Total (Overall) | 489 (44.7%) | 605 (55.3%) |
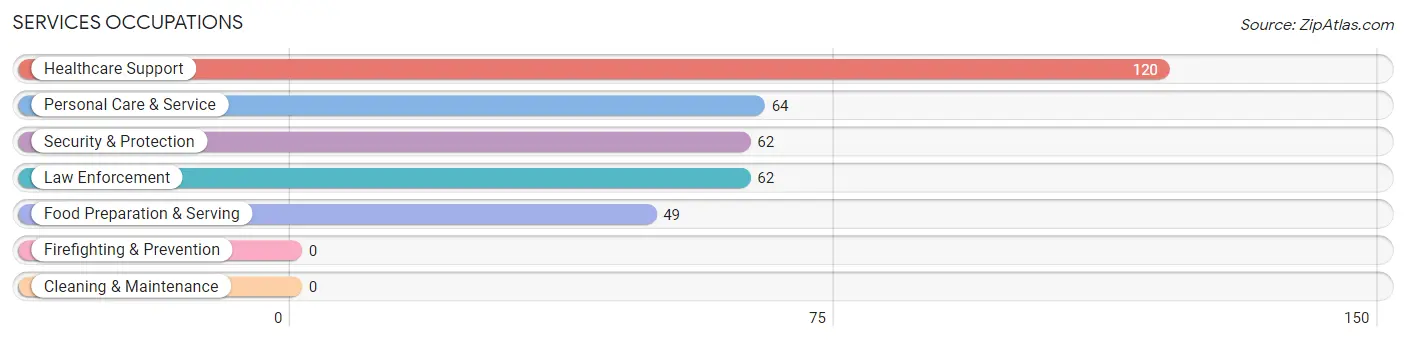
Services Occupations
The most common Services occupations in Cade are Healthcare Support (120 | 11.0%), Personal Care & Service (64 | 5.9%), Security & Protection (62 | 5.7%), Law Enforcement (62 | 5.7%), and Food Preparation & Serving (49 | 4.5%).
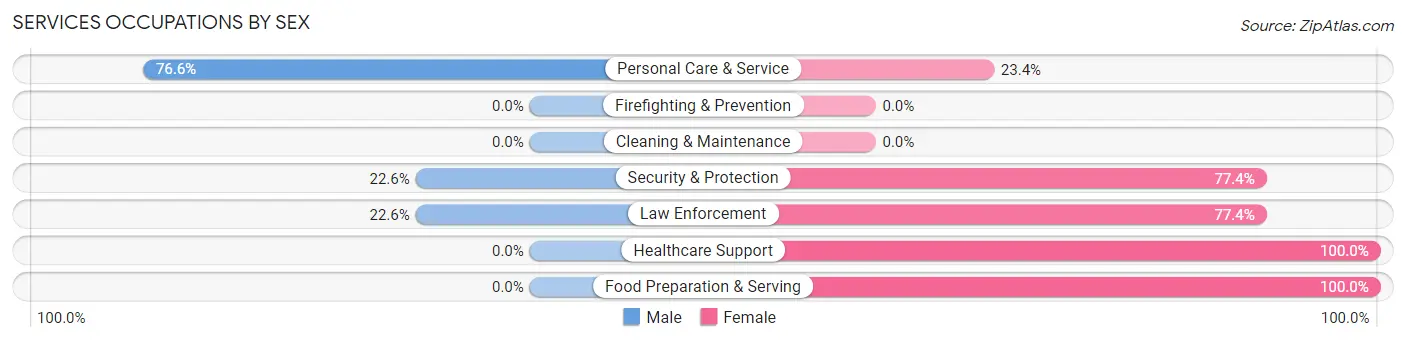
Services Occupations by Sex
Within the Services occupations in Cade, the most male-oriented occupations are Personal Care & Service (76.6%), Security & Protection (22.6%), and Law Enforcement (22.6%), while the most female-oriented occupations are Healthcare Support (100.0%), Food Preparation & Serving (100.0%), and Security & Protection (77.4%).
| Occupation | Male | Female |
| Healthcare Support | 0 (0.0%) | 120 (100.0%) |
| Security & Protection | 14 (22.6%) | 48 (77.4%) |
| Firefighting & Prevention | 0 (0.0%) | 0 (0.0%) |
| Law Enforcement | 14 (22.6%) | 48 (77.4%) |
| Food Preparation & Serving | 0 (0.0%) | 49 (100.0%) |
| Cleaning & Maintenance | 0 (0.0%) | 0 (0.0%) |
| Personal Care & Service | 49 (76.6%) | 15 (23.4%) |
| Total (Category) | 63 (21.4%) | 232 (78.6%) |
| Total (Overall) | 489 (44.7%) | 605 (55.3%) |
Sales and Office Occupations
The most common Sales and Office occupations in Cade are Office & Administration (277 | 25.3%), and Sales & Related (19 | 1.7%).
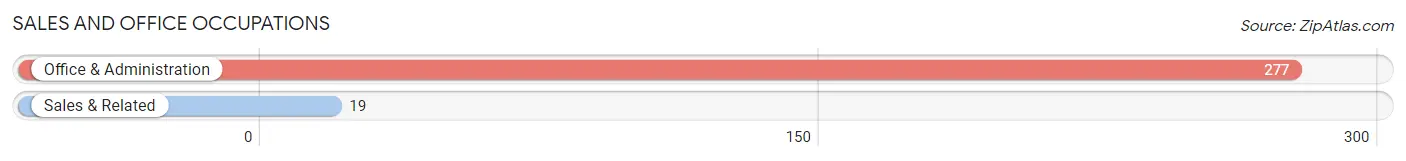
Sales and Office Occupations by Sex

| Occupation | Male | Female |
| Sales & Related | 19 (100.0%) | 0 (0.0%) |
| Office & Administration | 31 (11.2%) | 246 (88.8%) |
| Total (Category) | 50 (16.9%) | 246 (83.1%) |
| Total (Overall) | 489 (44.7%) | 605 (55.3%) |
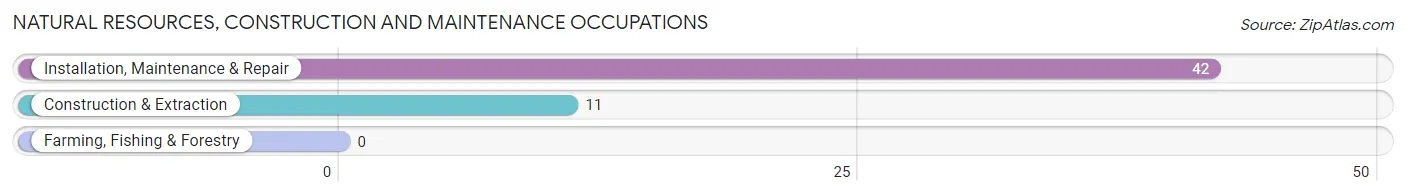
Natural Resources, Construction and Maintenance Occupations
The most common Natural Resources, Construction and Maintenance occupations in Cade are Installation, Maintenance & Repair (42 | 3.8%), and Construction & Extraction (11 | 1.0%).
Natural Resources, Construction and Maintenance Occupations by Sex
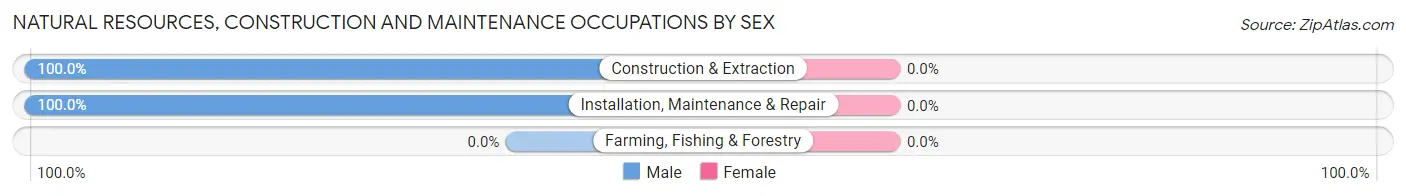
| Occupation | Male | Female |
| Farming, Fishing & Forestry | 0 (0.0%) | 0 (0.0%) |
| Construction & Extraction | 11 (100.0%) | 0 (0.0%) |
| Installation, Maintenance & Repair | 42 (100.0%) | 0 (0.0%) |
| Total (Category) | 53 (100.0%) | 0 (0.0%) |
| Total (Overall) | 489 (44.7%) | 605 (55.3%) |
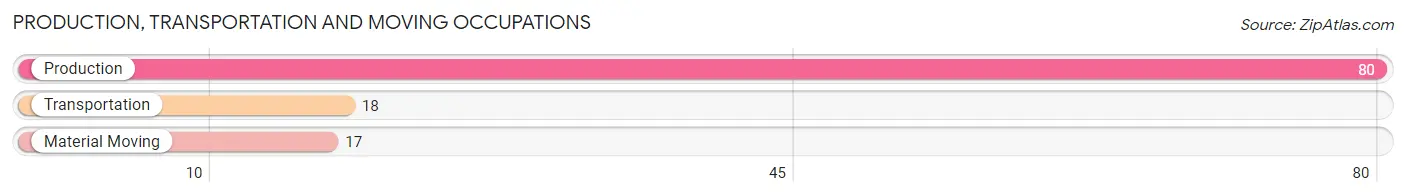
Production, Transportation and Moving Occupations
The most common Production, Transportation and Moving occupations in Cade are Production (80 | 7.3%), Transportation (18 | 1.7%), and Material Moving (17 | 1.5%).
Production, Transportation and Moving Occupations by Sex
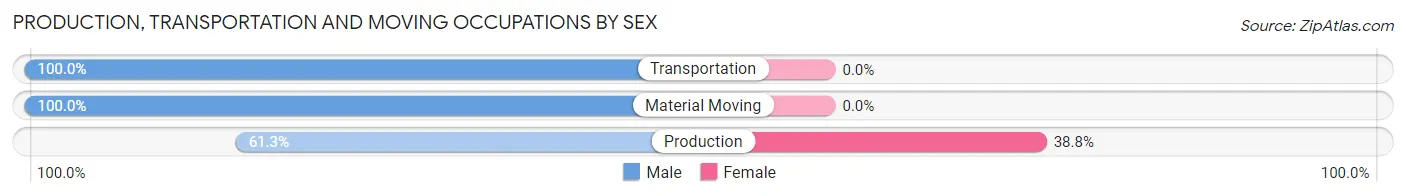
| Occupation | Male | Female |
| Production | 49 (61.3%) | 31 (38.8%) |
| Transportation | 18 (100.0%) | 0 (0.0%) |
| Material Moving | 17 (100.0%) | 0 (0.0%) |
| Total (Category) | 84 (73.0%) | 31 (27.0%) |
| Total (Overall) | 489 (44.7%) | 605 (55.3%) |
Employment Industries by Sex in Cade
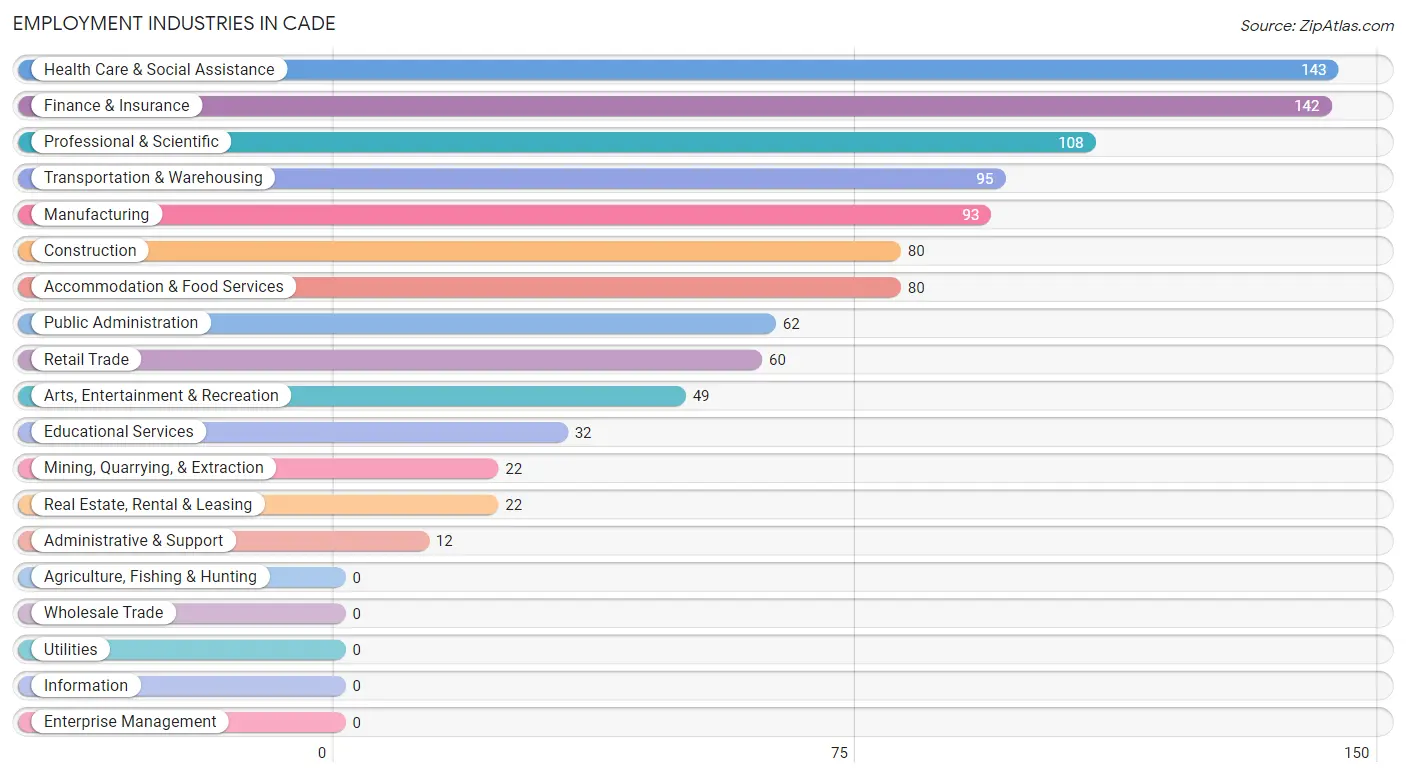
Employment Industries in Cade
The major employment industries in Cade include Health Care & Social Assistance (143 | 13.1%), Finance & Insurance (142 | 13.0%), Professional & Scientific (108 | 9.9%), Transportation & Warehousing (95 | 8.7%), and Manufacturing (93 | 8.5%).
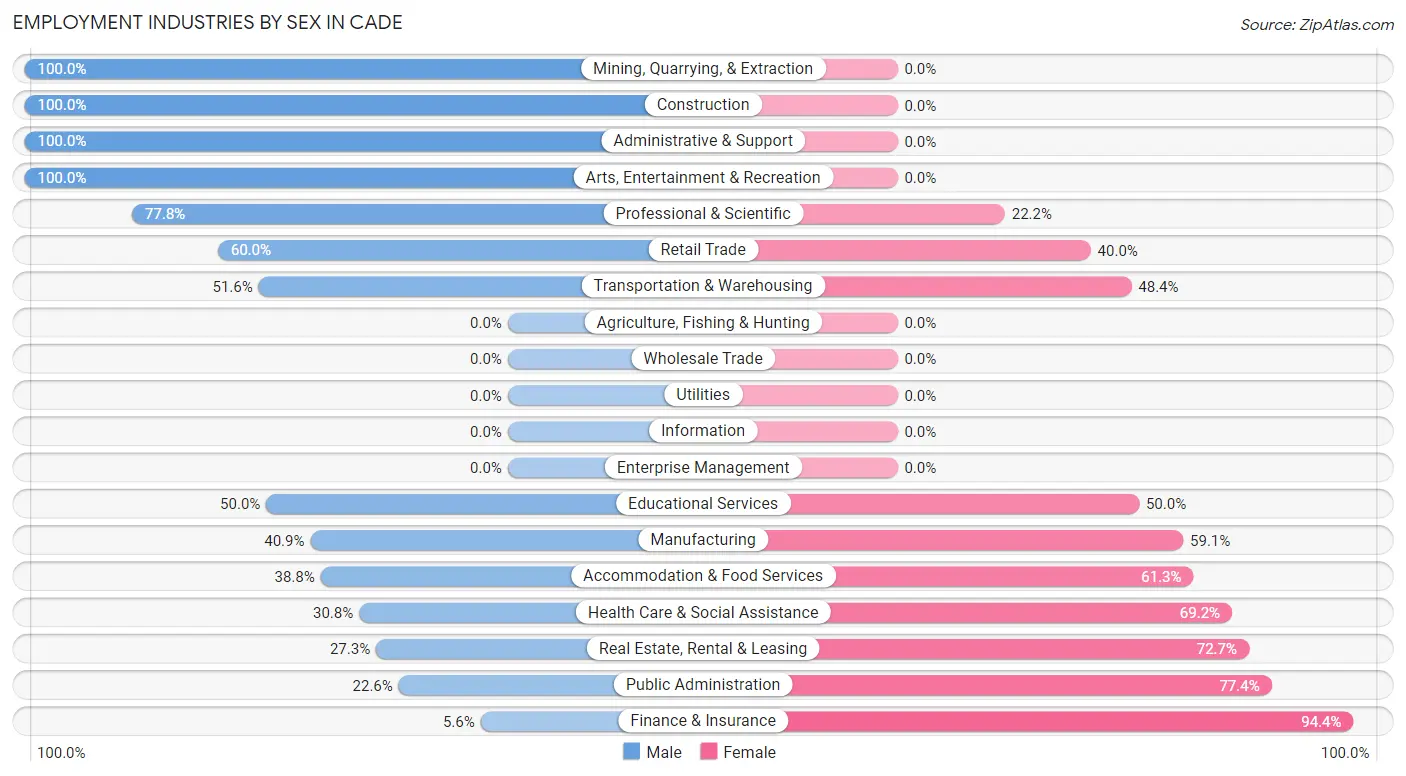
Employment Industries by Sex in Cade
The Cade industries that see more men than women are Mining, Quarrying, & Extraction (100.0%), Construction (100.0%), and Administrative & Support (100.0%), whereas the industries that tend to have a higher number of women are Finance & Insurance (94.4%), Public Administration (77.4%), and Real Estate, Rental & Leasing (72.7%).
| Industry | Male | Female |
| Agriculture, Fishing & Hunting | 0 (0.0%) | 0 (0.0%) |
| Mining, Quarrying, & Extraction | 22 (100.0%) | 0 (0.0%) |
| Construction | 80 (100.0%) | 0 (0.0%) |
| Manufacturing | 38 (40.9%) | 55 (59.1%) |
| Wholesale Trade | 0 (0.0%) | 0 (0.0%) |
| Retail Trade | 36 (60.0%) | 24 (40.0%) |
| Transportation & Warehousing | 49 (51.6%) | 46 (48.4%) |
| Utilities | 0 (0.0%) | 0 (0.0%) |
| Information | 0 (0.0%) | 0 (0.0%) |
| Finance & Insurance | 8 (5.6%) | 134 (94.4%) |
| Real Estate, Rental & Leasing | 6 (27.3%) | 16 (72.7%) |
| Professional & Scientific | 84 (77.8%) | 24 (22.2%) |
| Enterprise Management | 0 (0.0%) | 0 (0.0%) |
| Administrative & Support | 12 (100.0%) | 0 (0.0%) |
| Educational Services | 16 (50.0%) | 16 (50.0%) |
| Health Care & Social Assistance | 44 (30.8%) | 99 (69.2%) |
| Arts, Entertainment & Recreation | 49 (100.0%) | 0 (0.0%) |
| Accommodation & Food Services | 31 (38.8%) | 49 (61.3%) |
| Public Administration | 14 (22.6%) | 48 (77.4%) |
| Total | 489 (44.7%) | 605 (55.3%) |
Education in Cade
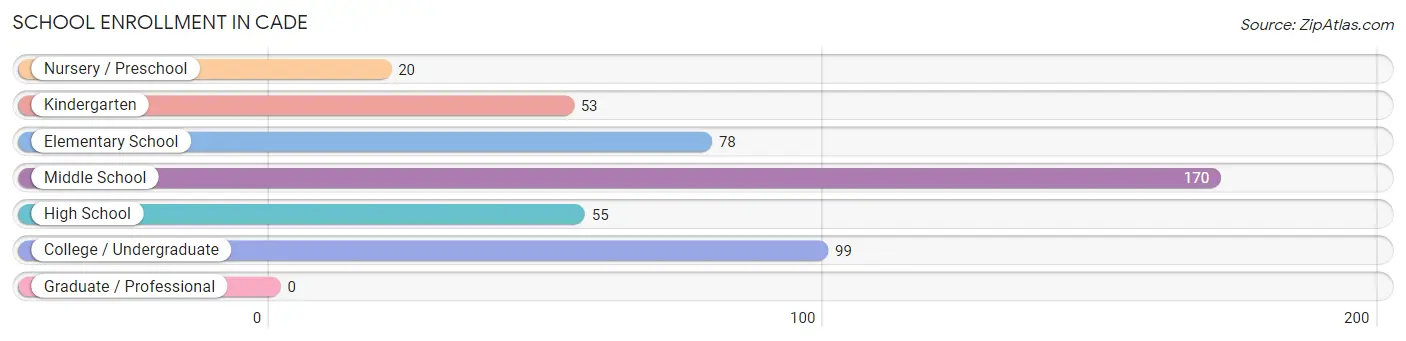
School Enrollment in Cade
The most common levels of schooling among the 475 students in Cade are middle school (170 | 35.8%), college / undergraduate (99 | 20.8%), and elementary school (78 | 16.4%).
| School Level | # Students | % Students |
| Nursery / Preschool | 20 | 4.2% |
| Kindergarten | 53 | 11.2% |
| Elementary School | 78 | 16.4% |
| Middle School | 170 | 35.8% |
| High School | 55 | 11.6% |
| College / Undergraduate | 99 | 20.8% |
| Graduate / Professional | 0 | 0.0% |
| Total | 475 | 100.0% |
School Enrollment by Age by Funding Source in Cade
Out of a total of 475 students who are enrolled in schools in Cade, 172 (36.2%) attend a private institution, while the remaining 303 (63.8%) are enrolled in public schools. The age group of 3 to 4 year olds has the highest likelihood of being enrolled in private schools, with 36 (100.0% in the age bracket) enrolled. Conversely, the age group of 18 to 19 year olds has the lowest likelihood of being enrolled in a private school, with 62 (100.0% in the age bracket) attending a public institution.
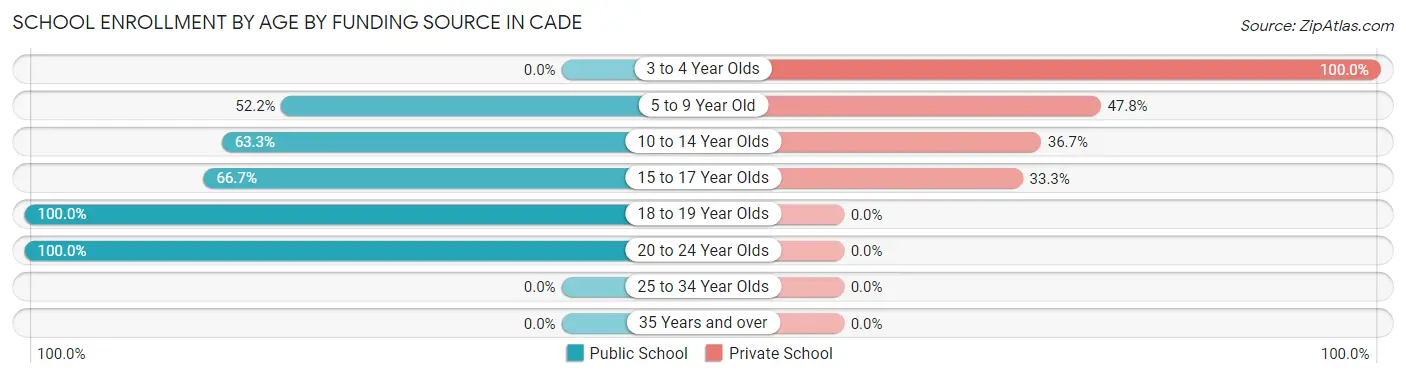
| Age Bracket | Public School | Private School |
| 3 to 4 Year Olds | 0 (0.0%) | 36 (100.0%) |
| 5 to 9 Year Old | 60 (52.2%) | 55 (47.8%) |
| 10 to 14 Year Olds | 112 (63.3%) | 65 (36.7%) |
| 15 to 17 Year Olds | 32 (66.7%) | 16 (33.3%) |
| 18 to 19 Year Olds | 62 (100.0%) | 0 (0.0%) |
| 20 to 24 Year Olds | 37 (100.0%) | 0 (0.0%) |
| 25 to 34 Year Olds | 0 (0.0%) | 0 (0.0%) |
| 35 Years and over | 0 (0.0%) | 0 (0.0%) |
| Total | 303 (63.8%) | 172 (36.2%) |
Educational Attainment by Field of Study in Cade
Liberal arts & history (30 | 34.9%), education (19 | 22.1%), bio, nature & agricultural (16 | 18.6%), physical & health sciences (8 | 9.3%), and science & technology (7 | 8.1%) are the most common fields of study among 86 individuals in Cade who have obtained a bachelor's degree or higher.
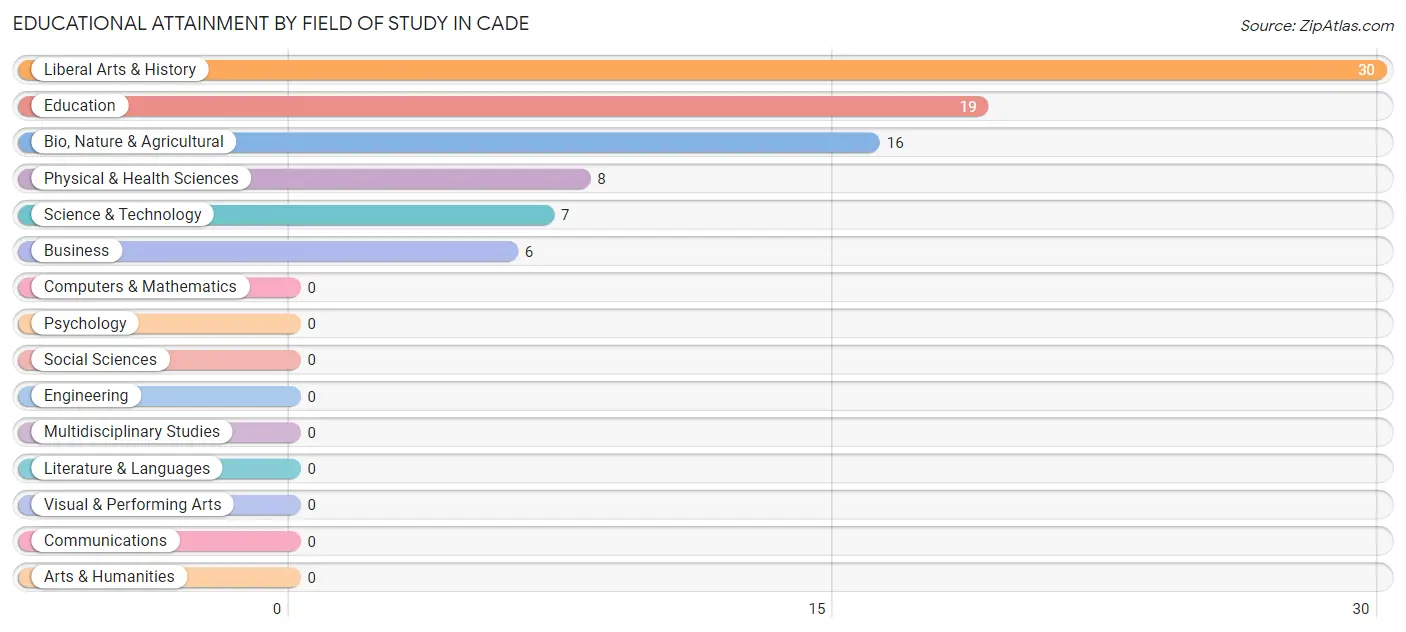
| Field of Study | # Graduates | % Graduates |
| Computers & Mathematics | 0 | 0.0% |
| Bio, Nature & Agricultural | 16 | 18.6% |
| Physical & Health Sciences | 8 | 9.3% |
| Psychology | 0 | 0.0% |
| Social Sciences | 0 | 0.0% |
| Engineering | 0 | 0.0% |
| Multidisciplinary Studies | 0 | 0.0% |
| Science & Technology | 7 | 8.1% |
| Business | 6 | 7.0% |
| Education | 19 | 22.1% |
| Literature & Languages | 0 | 0.0% |
| Liberal Arts & History | 30 | 34.9% |
| Visual & Performing Arts | 0 | 0.0% |
| Communications | 0 | 0.0% |
| Arts & Humanities | 0 | 0.0% |
| Total | 86 | 100.0% |
Transportation & Commute in Cade
Vehicle Availability by Sex in Cade
The most prevalent vehicle ownership categories in Cade are males with 3 vehicles (239, accounting for 46.8%) and females with 3 vehicles (197, making up 39.5%).
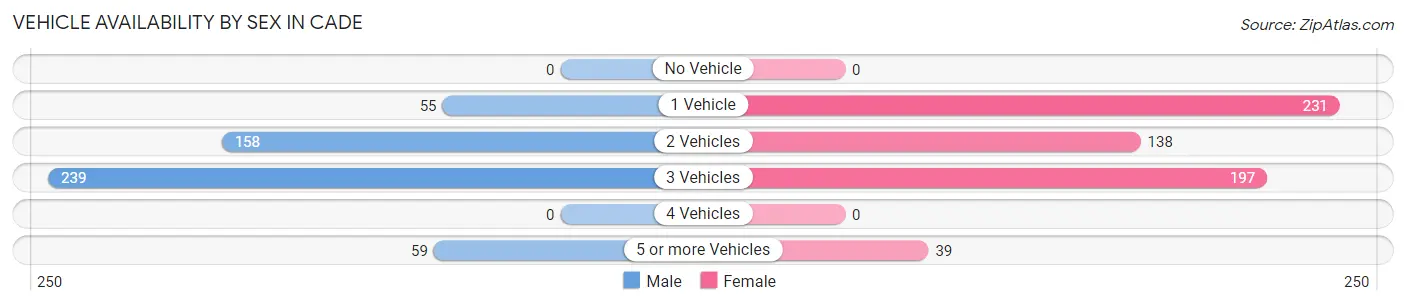
| Vehicles Available | Male | Female |
| No Vehicle | 0 (0.0%) | 0 (0.0%) |
| 1 Vehicle | 55 (10.8%) | 231 (38.2%) |
| 2 Vehicles | 158 (30.9%) | 138 (22.8%) |
| 3 Vehicles | 239 (46.8%) | 197 (32.6%) |
| 4 Vehicles | 0 (0.0%) | 0 (0.0%) |
| 5 or more Vehicles | 59 (11.6%) | 39 (6.5%) |
| Total | 511 (100.0%) | 605 (100.0%) |
Commute Time in Cade
The most frequently occuring commute durations in Cade are 10 to 14 minutes (277 commuters, 26.0%), 15 to 19 minutes (163 commuters, 15.3%), and 30 to 34 minutes (151 commuters, 14.2%).
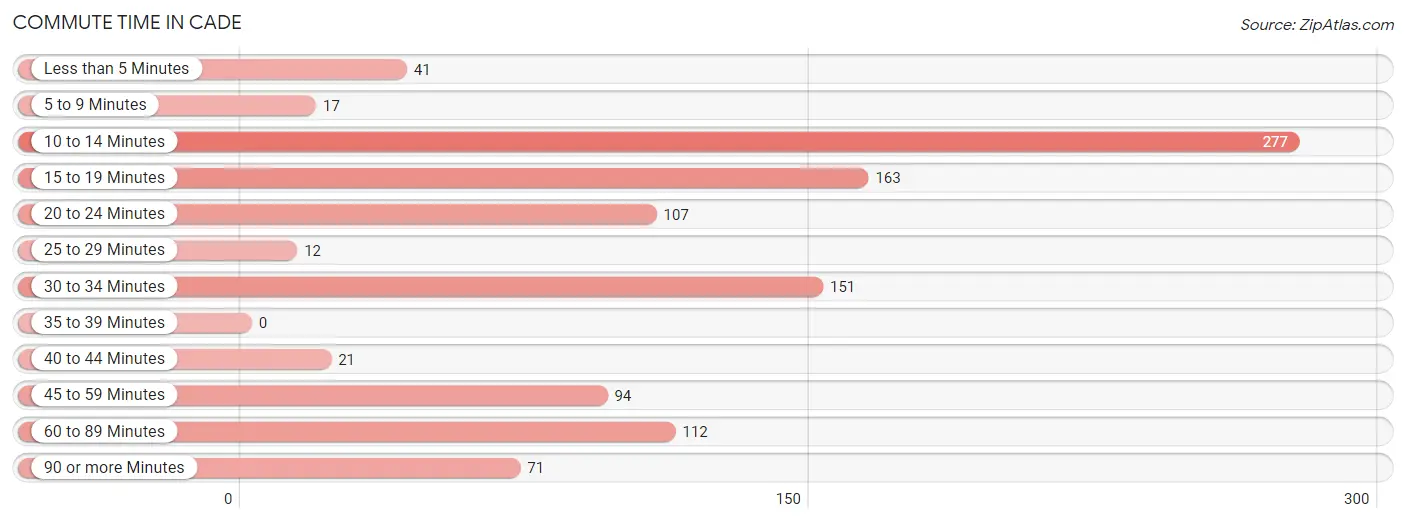
| Commute Time | # Commuters | % Commuters |
| Less than 5 Minutes | 41 | 3.8% |
| 5 to 9 Minutes | 17 | 1.6% |
| 10 to 14 Minutes | 277 | 26.0% |
| 15 to 19 Minutes | 163 | 15.3% |
| 20 to 24 Minutes | 107 | 10.0% |
| 25 to 29 Minutes | 12 | 1.1% |
| 30 to 34 Minutes | 151 | 14.2% |
| 35 to 39 Minutes | 0 | 0.0% |
| 40 to 44 Minutes | 21 | 2.0% |
| 45 to 59 Minutes | 94 | 8.8% |
| 60 to 89 Minutes | 112 | 10.5% |
| 90 or more Minutes | 71 | 6.7% |
Commute Time by Sex in Cade
The most common commute times in Cade are 60 to 89 minutes (90 commuters, 19.3%) for males and 10 to 14 minutes (232 commuters, 38.7%) for females.
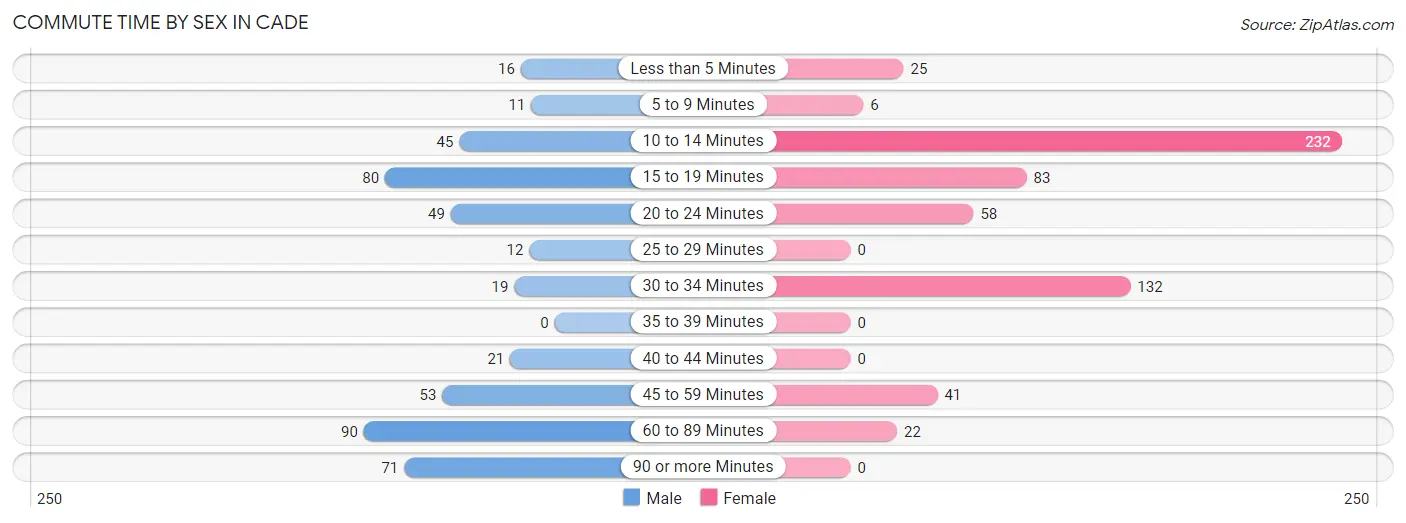
| Commute Time | Male | Female |
| Less than 5 Minutes | 16 (3.4%) | 25 (4.2%) |
| 5 to 9 Minutes | 11 (2.4%) | 6 (1.0%) |
| 10 to 14 Minutes | 45 (9.6%) | 232 (38.7%) |
| 15 to 19 Minutes | 80 (17.1%) | 83 (13.9%) |
| 20 to 24 Minutes | 49 (10.5%) | 58 (9.7%) |
| 25 to 29 Minutes | 12 (2.6%) | 0 (0.0%) |
| 30 to 34 Minutes | 19 (4.1%) | 132 (22.0%) |
| 35 to 39 Minutes | 0 (0.0%) | 0 (0.0%) |
| 40 to 44 Minutes | 21 (4.5%) | 0 (0.0%) |
| 45 to 59 Minutes | 53 (11.4%) | 41 (6.8%) |
| 60 to 89 Minutes | 90 (19.3%) | 22 (3.7%) |
| 90 or more Minutes | 71 (15.2%) | 0 (0.0%) |
Time of Departure to Work by Sex in Cade
The most frequent times of departure to work in Cade are 5:30 AM to 5:59 AM (101, 21.6%) for males and 6:00 AM to 6:29 AM (195, 32.6%) for females.
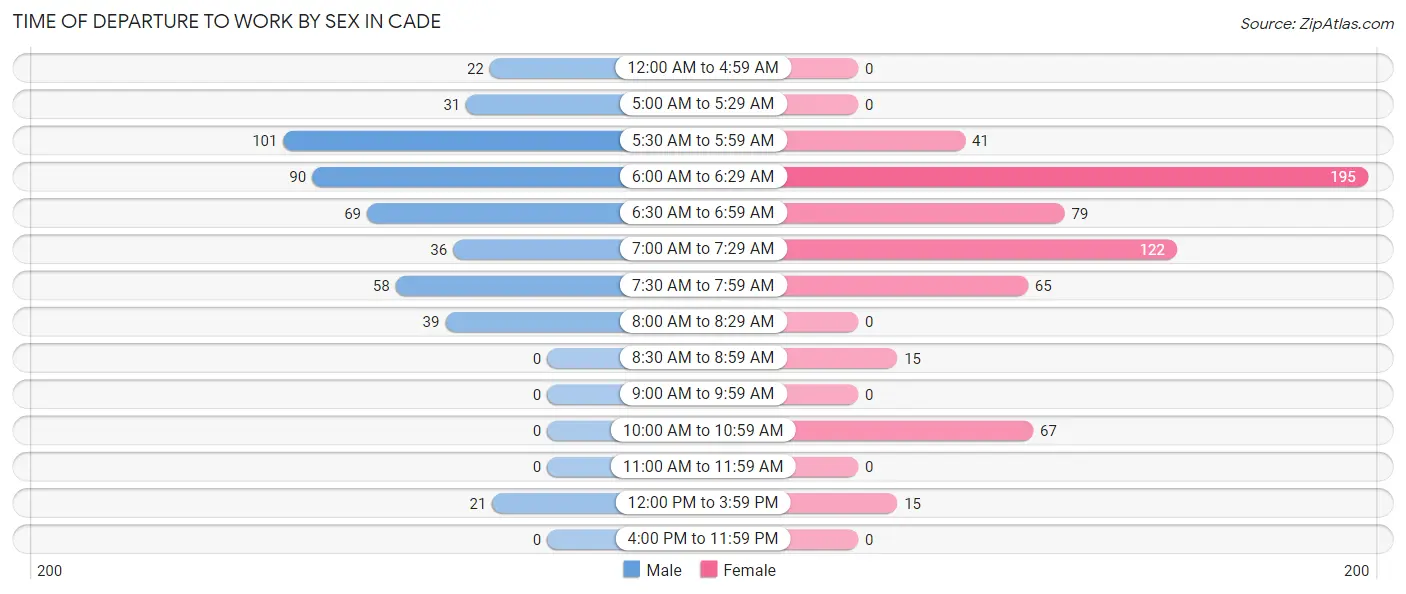
| Time of Departure | Male | Female |
| 12:00 AM to 4:59 AM | 22 (4.7%) | 0 (0.0%) |
| 5:00 AM to 5:29 AM | 31 (6.6%) | 0 (0.0%) |
| 5:30 AM to 5:59 AM | 101 (21.6%) | 41 (6.8%) |
| 6:00 AM to 6:29 AM | 90 (19.3%) | 195 (32.6%) |
| 6:30 AM to 6:59 AM | 69 (14.8%) | 79 (13.2%) |
| 7:00 AM to 7:29 AM | 36 (7.7%) | 122 (20.4%) |
| 7:30 AM to 7:59 AM | 58 (12.4%) | 65 (10.8%) |
| 8:00 AM to 8:29 AM | 39 (8.4%) | 0 (0.0%) |
| 8:30 AM to 8:59 AM | 0 (0.0%) | 15 (2.5%) |
| 9:00 AM to 9:59 AM | 0 (0.0%) | 0 (0.0%) |
| 10:00 AM to 10:59 AM | 0 (0.0%) | 67 (11.2%) |
| 11:00 AM to 11:59 AM | 0 (0.0%) | 0 (0.0%) |
| 12:00 PM to 3:59 PM | 21 (4.5%) | 15 (2.5%) |
| 4:00 PM to 11:59 PM | 0 (0.0%) | 0 (0.0%) |
| Total | 467 (100.0%) | 599 (100.0%) |
Housing Occupancy in Cade
Occupancy by Ownership in Cade
Of the total 763 dwellings in Cade, owner-occupied units account for 699 (91.6%), while renter-occupied units make up 64 (8.4%).
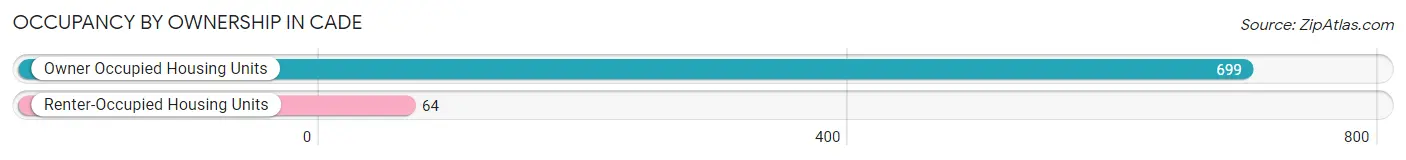
| Occupancy | # Housing Units | % Housing Units |
| Owner Occupied Housing Units | 699 | 91.6% |
| Renter-Occupied Housing Units | 64 | 8.4% |
| Total Occupied Housing Units | 763 | 100.0% |
Occupancy by Household Size in Cade
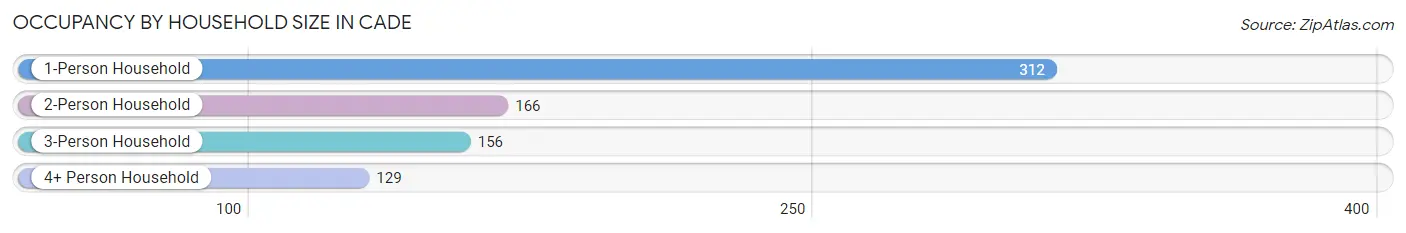
| Household Size | # Housing Units | % Housing Units |
| 1-Person Household | 312 | 40.9% |
| 2-Person Household | 166 | 21.8% |
| 3-Person Household | 156 | 20.4% |
| 4+ Person Household | 129 | 16.9% |
| Total Housing Units | 763 | 100.0% |
Occupancy by Ownership by Household Size in Cade
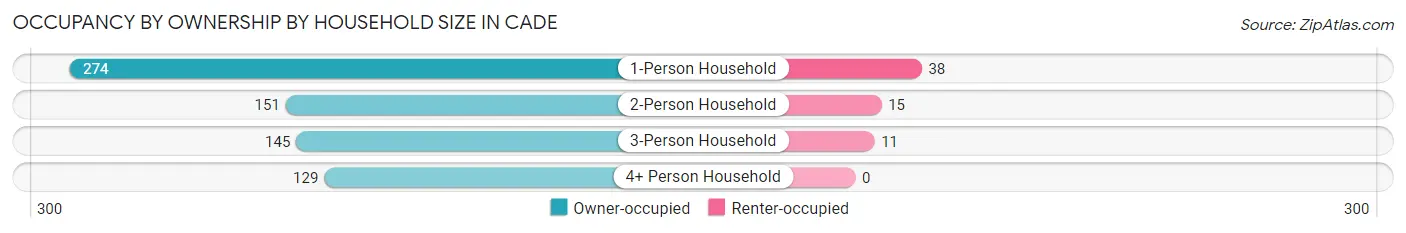
| Household Size | Owner-occupied | Renter-occupied |
| 1-Person Household | 274 (87.8%) | 38 (12.2%) |
| 2-Person Household | 151 (91.0%) | 15 (9.0%) |
| 3-Person Household | 145 (92.9%) | 11 (7.0%) |
| 4+ Person Household | 129 (100.0%) | 0 (0.0%) |
| Total Housing Units | 699 (91.6%) | 64 (8.4%) |
Occupancy by Educational Attainment in Cade
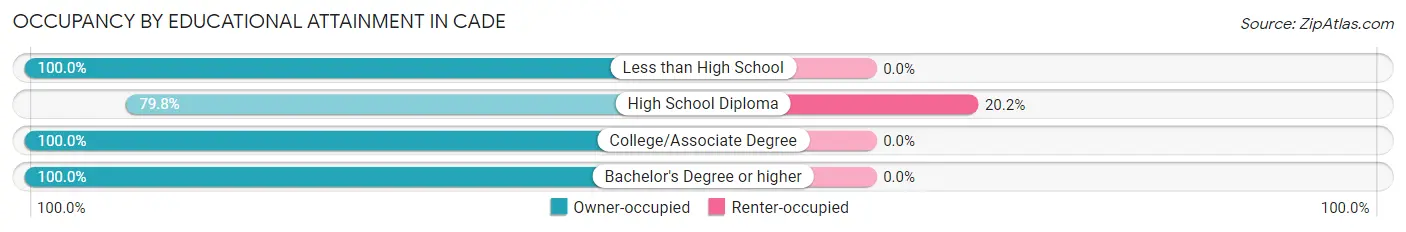
| Household Size | Owner-occupied | Renter-occupied |
| Less than High School | 48 (100.0%) | 0 (0.0%) |
| High School Diploma | 253 (79.8%) | 64 (20.2%) |
| College/Associate Degree | 335 (100.0%) | 0 (0.0%) |
| Bachelor's Degree or higher | 63 (100.0%) | 0 (0.0%) |
Occupancy by Age of Householder in Cade
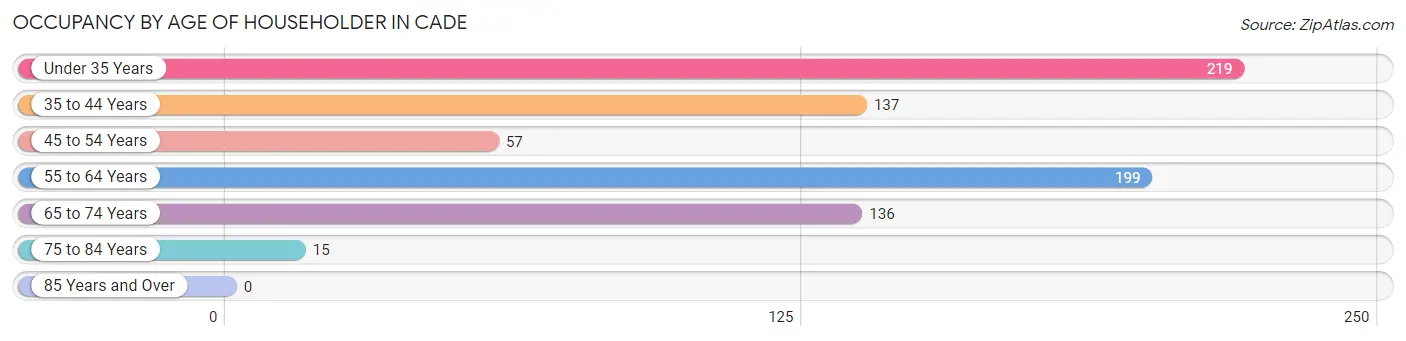
| Age Bracket | # Households | % Households |
| Under 35 Years | 219 | 28.7% |
| 35 to 44 Years | 137 | 18.0% |
| 45 to 54 Years | 57 | 7.5% |
| 55 to 64 Years | 199 | 26.1% |
| 65 to 74 Years | 136 | 17.8% |
| 75 to 84 Years | 15 | 2.0% |
| 85 Years and Over | 0 | 0.0% |
| Total | 763 | 100.0% |
Housing Finances in Cade
Median Income by Occupancy in Cade
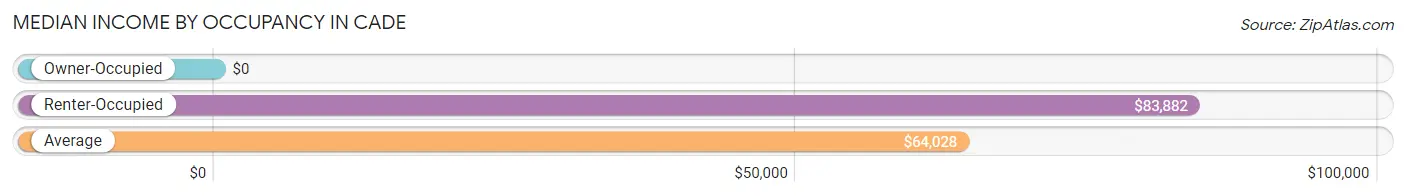
| Occupancy Type | # Households | Median Income |
| Owner-Occupied | 699 (91.6%) | $0 |
| Renter-Occupied | 64 (8.4%) | $83,882 |
| Average | 763 (100.0%) | $64,028 |
Occupancy by Householder Income Bracket in Cade
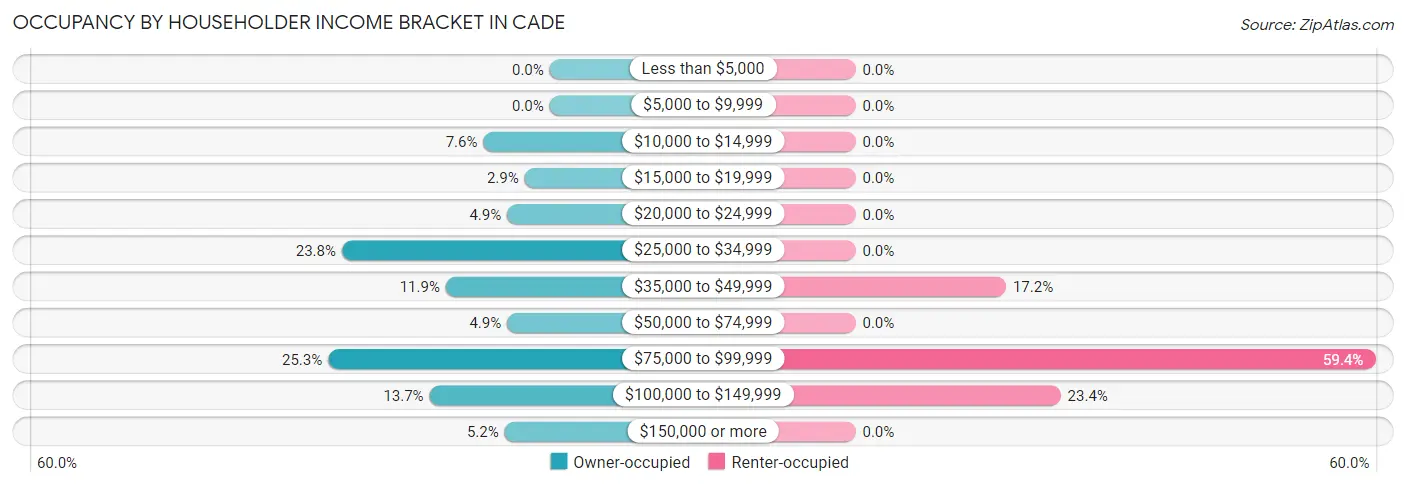
| Income Bracket | Owner-occupied | Renter-occupied |
| Less than $5,000 | 0 (0.0%) | 0 (0.0%) |
| $5,000 to $9,999 | 0 (0.0%) | 0 (0.0%) |
| $10,000 to $14,999 | 53 (7.6%) | 0 (0.0%) |
| $15,000 to $19,999 | 20 (2.9%) | 0 (0.0%) |
| $20,000 to $24,999 | 34 (4.9%) | 0 (0.0%) |
| $25,000 to $34,999 | 166 (23.7%) | 0 (0.0%) |
| $35,000 to $49,999 | 83 (11.9%) | 11 (17.2%) |
| $50,000 to $74,999 | 34 (4.9%) | 0 (0.0%) |
| $75,000 to $99,999 | 177 (25.3%) | 38 (59.4%) |
| $100,000 to $149,999 | 96 (13.7%) | 15 (23.4%) |
| $150,000 or more | 36 (5.1%) | 0 (0.0%) |
| Total | 699 (100.0%) | 64 (100.0%) |
Monthly Housing Cost Tiers in Cade
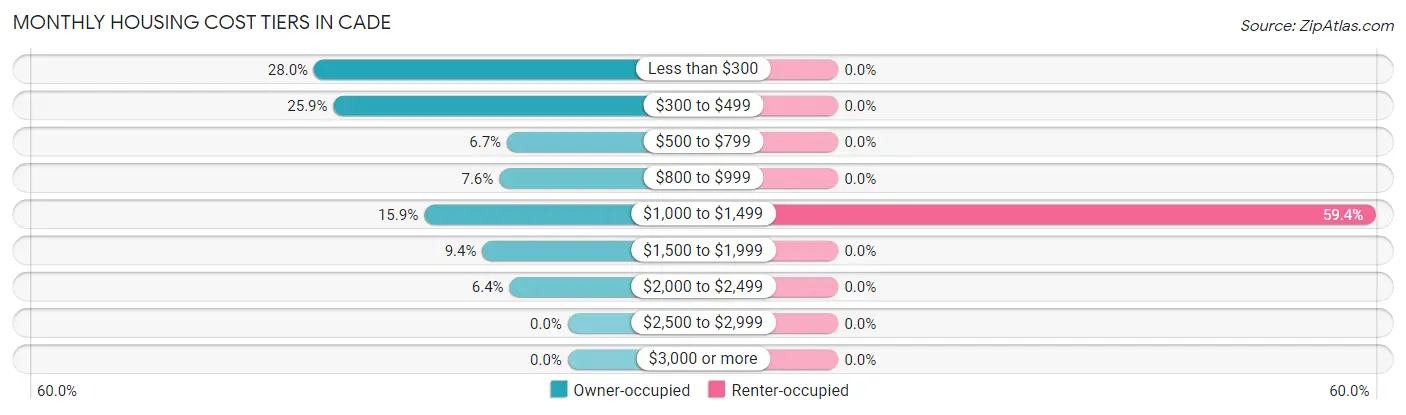
| Monthly Cost | Owner-occupied | Renter-occupied |
| Less than $300 | 196 (28.0%) | 0 (0.0%) |
| $300 to $499 | 181 (25.9%) | 0 (0.0%) |
| $500 to $799 | 47 (6.7%) | 0 (0.0%) |
| $800 to $999 | 53 (7.6%) | 0 (0.0%) |
| $1,000 to $1,499 | 111 (15.9%) | 38 (59.4%) |
| $1,500 to $1,999 | 66 (9.4%) | 0 (0.0%) |
| $2,000 to $2,499 | 45 (6.4%) | 0 (0.0%) |
| $2,500 to $2,999 | 0 (0.0%) | 0 (0.0%) |
| $3,000 or more | 0 (0.0%) | 0 (0.0%) |
| Total | 699 (100.0%) | 64 (100.0%) |
Physical Housing Characteristics in Cade
Housing Structures in Cade
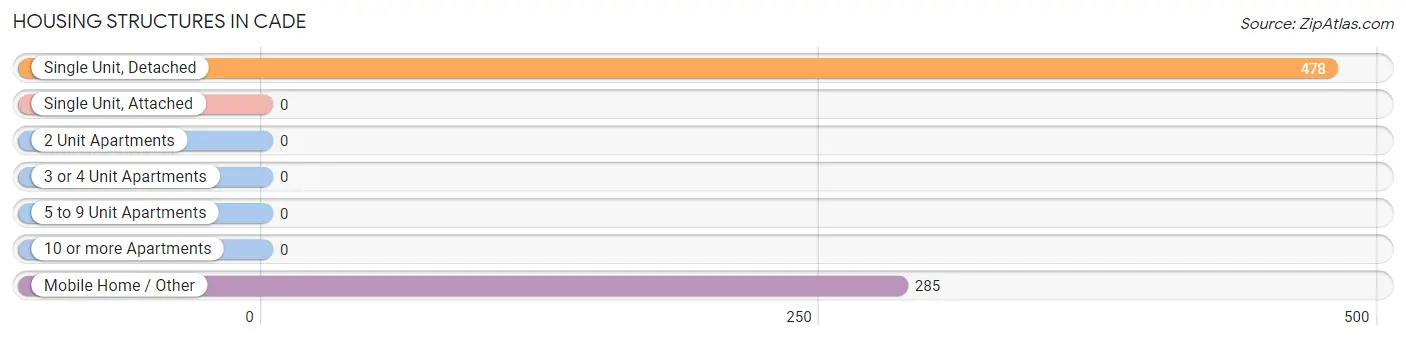
| Structure Type | # Housing Units | % Housing Units |
| Single Unit, Detached | 478 | 62.6% |
| Single Unit, Attached | 0 | 0.0% |
| 2 Unit Apartments | 0 | 0.0% |
| 3 or 4 Unit Apartments | 0 | 0.0% |
| 5 to 9 Unit Apartments | 0 | 0.0% |
| 10 or more Apartments | 0 | 0.0% |
| Mobile Home / Other | 285 | 37.3% |
| Total | 763 | 100.0% |
Housing Structures by Occupancy in Cade
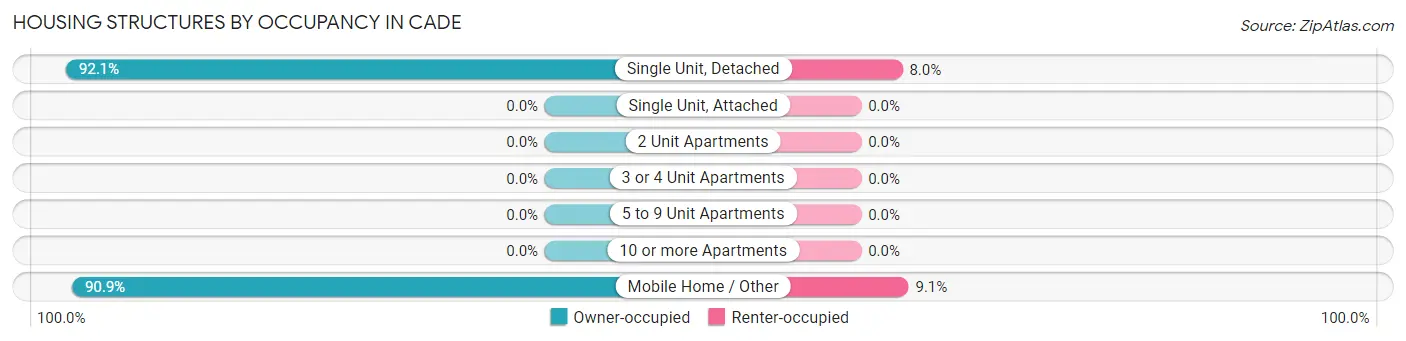
| Structure Type | Owner-occupied | Renter-occupied |
| Single Unit, Detached | 440 (92.0%) | 38 (8.0%) |
| Single Unit, Attached | 0 (0.0%) | 0 (0.0%) |
| 2 Unit Apartments | 0 (0.0%) | 0 (0.0%) |
| 3 or 4 Unit Apartments | 0 (0.0%) | 0 (0.0%) |
| 5 to 9 Unit Apartments | 0 (0.0%) | 0 (0.0%) |
| 10 or more Apartments | 0 (0.0%) | 0 (0.0%) |
| Mobile Home / Other | 259 (90.9%) | 26 (9.1%) |
| Total | 699 (91.6%) | 64 (8.4%) |
Housing Structures by Number of Rooms in Cade
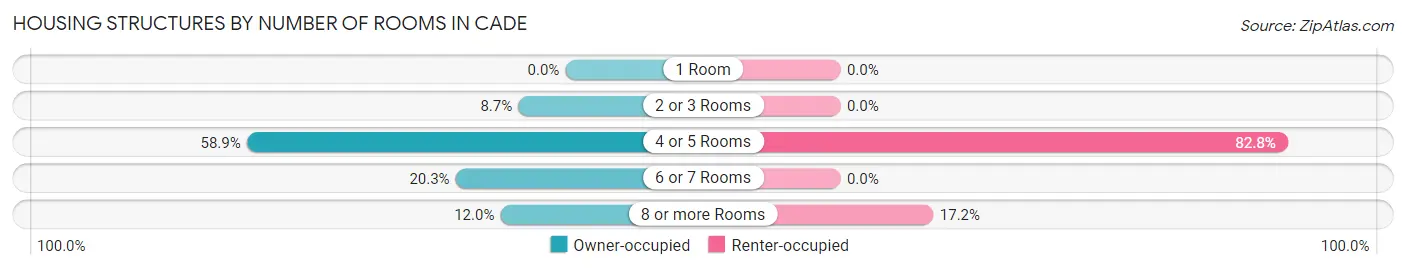
| Number of Rooms | Owner-occupied | Renter-occupied |
| 1 Room | 0 (0.0%) | 0 (0.0%) |
| 2 or 3 Rooms | 61 (8.7%) | 0 (0.0%) |
| 4 or 5 Rooms | 412 (58.9%) | 53 (82.8%) |
| 6 or 7 Rooms | 142 (20.3%) | 0 (0.0%) |
| 8 or more Rooms | 84 (12.0%) | 11 (17.2%) |
| Total | 699 (100.0%) | 64 (100.0%) |
Housing Structure by Heating Type in Cade
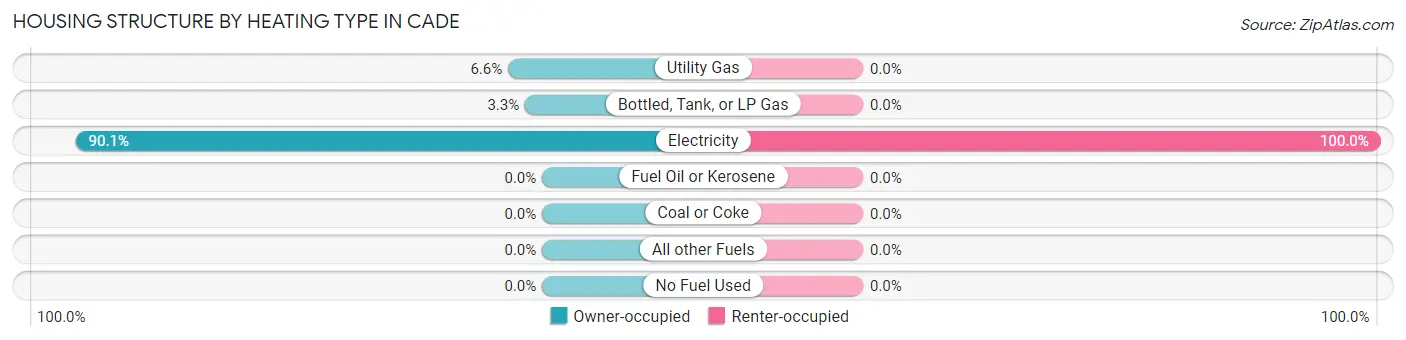
| Heating Type | Owner-occupied | Renter-occupied |
| Utility Gas | 46 (6.6%) | 0 (0.0%) |
| Bottled, Tank, or LP Gas | 23 (3.3%) | 0 (0.0%) |
| Electricity | 630 (90.1%) | 64 (100.0%) |
| Fuel Oil or Kerosene | 0 (0.0%) | 0 (0.0%) |
| Coal or Coke | 0 (0.0%) | 0 (0.0%) |
| All other Fuels | 0 (0.0%) | 0 (0.0%) |
| No Fuel Used | 0 (0.0%) | 0 (0.0%) |
| Total | 699 (100.0%) | 64 (100.0%) |
Household Vehicle Usage in Cade
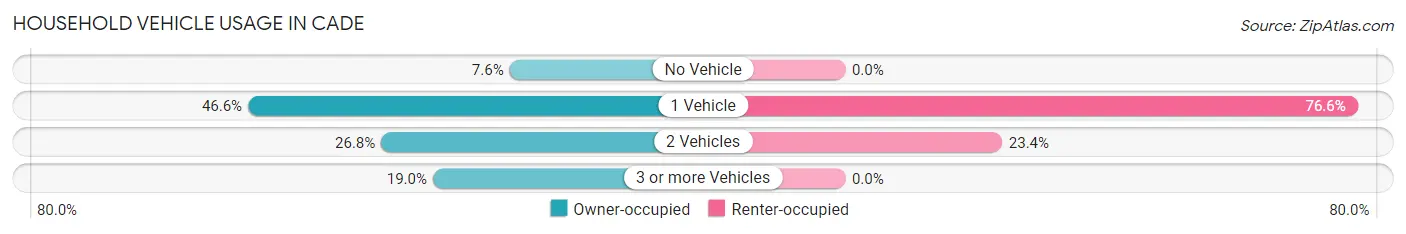
| Vehicles per Household | Owner-occupied | Renter-occupied |
| No Vehicle | 53 (7.6%) | 0 (0.0%) |
| 1 Vehicle | 326 (46.6%) | 49 (76.6%) |
| 2 Vehicles | 187 (26.8%) | 15 (23.4%) |
| 3 or more Vehicles | 133 (19.0%) | 0 (0.0%) |
| Total | 699 (100.0%) | 64 (100.0%) |
Real Estate & Mortgages in Cade
Real Estate and Mortgage Overview in Cade
| Characteristic | Without Mortgage | With Mortgage |
| Housing Units | 403 | 296 |
| Median Property Value | - | - |
| Median Household Income | $29,479 | $36 |
| Monthly Housing Costs | $305 | $0 |
| Real Estate Taxes | $876 | $48 |
Property Value by Mortgage Status in Cade
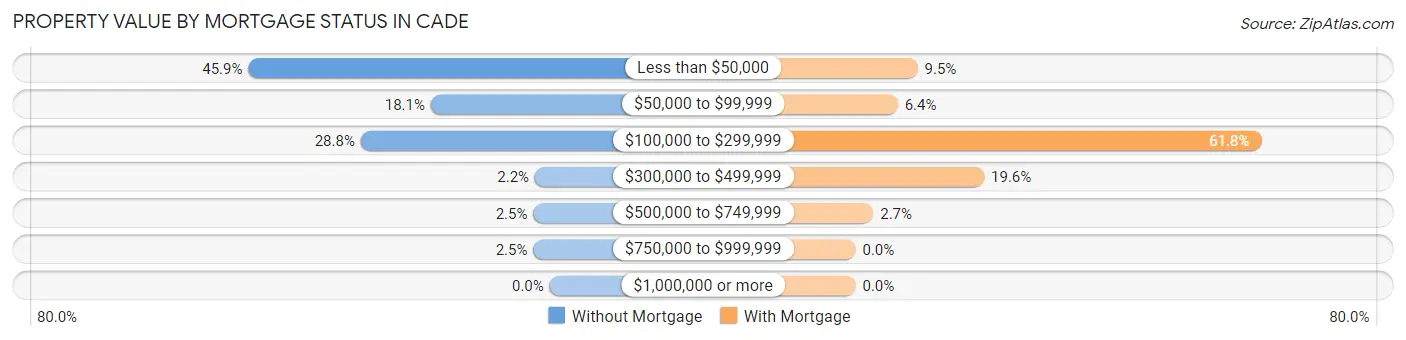
| Property Value | Without Mortgage | With Mortgage |
| Less than $50,000 | 185 (45.9%) | 28 (9.5%) |
| $50,000 to $99,999 | 73 (18.1%) | 19 (6.4%) |
| $100,000 to $299,999 | 116 (28.8%) | 183 (61.8%) |
| $300,000 to $499,999 | 9 (2.2%) | 58 (19.6%) |
| $500,000 to $749,999 | 10 (2.5%) | 8 (2.7%) |
| $750,000 to $999,999 | 10 (2.5%) | 0 (0.0%) |
| $1,000,000 or more | 0 (0.0%) | 0 (0.0%) |
| Total | 403 (100.0%) | 296 (100.0%) |
Household Income by Mortgage Status in Cade
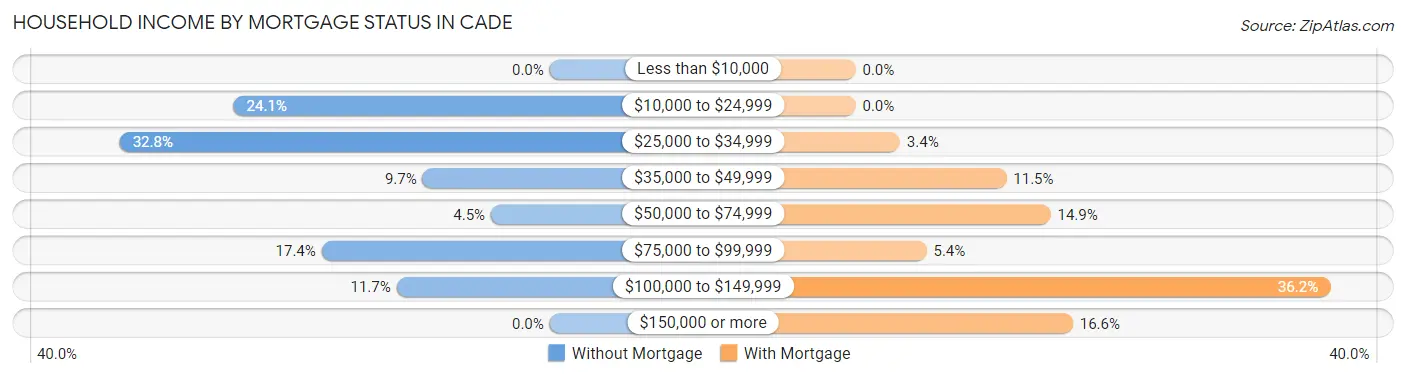
| Household Income | Without Mortgage | With Mortgage |
| Less than $10,000 | 0 (0.0%) | 0 (0.0%) |
| $10,000 to $24,999 | 97 (24.1%) | 0 (0.0%) |
| $25,000 to $34,999 | 132 (32.8%) | 10 (3.4%) |
| $35,000 to $49,999 | 39 (9.7%) | 34 (11.5%) |
| $50,000 to $74,999 | 18 (4.5%) | 44 (14.9%) |
| $75,000 to $99,999 | 70 (17.4%) | 16 (5.4%) |
| $100,000 to $149,999 | 47 (11.7%) | 107 (36.1%) |
| $150,000 or more | 0 (0.0%) | 49 (16.6%) |
| Total | 403 (100.0%) | 296 (100.0%) |
Property Value to Household Income Ratio in Cade
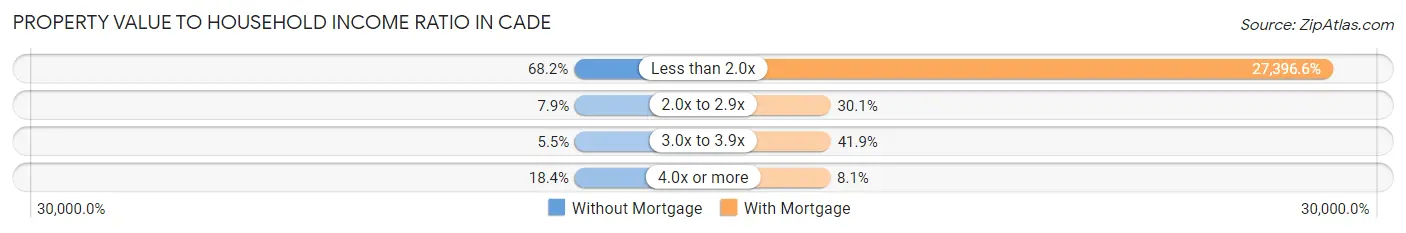
| Value-to-Income Ratio | Without Mortgage | With Mortgage |
| Less than 2.0x | 275 (68.2%) | 81,094 (27,396.6%) |
| 2.0x to 2.9x | 32 (7.9%) | 89 (30.1%) |
| 3.0x to 3.9x | 22 (5.5%) | 124 (41.9%) |
| 4.0x or more | 74 (18.4%) | 24 (8.1%) |
| Total | 403 (100.0%) | 296 (100.0%) |
Real Estate Taxes by Mortgage Status in Cade
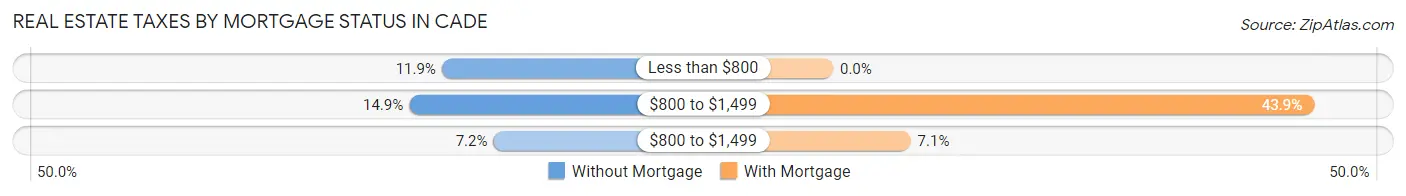
| Property Taxes | Without Mortgage | With Mortgage |
| Less than $800 | 48 (11.9%) | 0 (0.0%) |
| $800 to $1,499 | 60 (14.9%) | 130 (43.9%) |
| $800 to $1,499 | 29 (7.2%) | 21 (7.1%) |
| Total | 403 (100.0%) | 296 (100.0%) |
Health & Disability in Cade
Health Insurance Coverage by Age in Cade
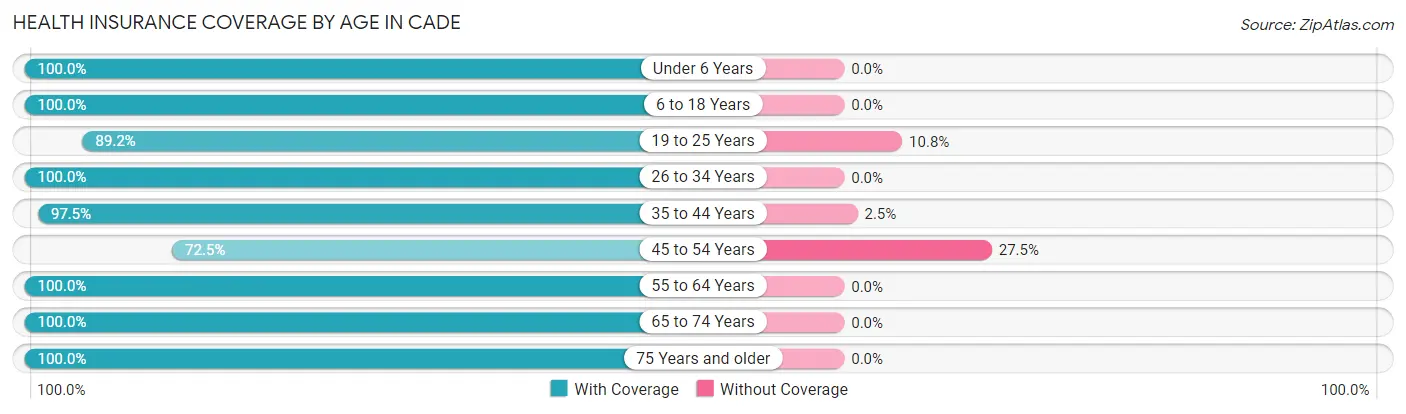
| Age Bracket | With Coverage | Without Coverage |
| Under 6 Years | 200 (100.0%) | 0 (0.0%) |
| 6 to 18 Years | 349 (100.0%) | 0 (0.0%) |
| 19 to 25 Years | 124 (89.2%) | 15 (10.8%) |
| 26 to 34 Years | 236 (100.0%) | 0 (0.0%) |
| 35 to 44 Years | 237 (97.5%) | 6 (2.5%) |
| 45 to 54 Years | 253 (72.5%) | 96 (27.5%) |
| 55 to 64 Years | 239 (100.0%) | 0 (0.0%) |
| 65 to 74 Years | 168 (100.0%) | 0 (0.0%) |
| 75 Years and older | 15 (100.0%) | 0 (0.0%) |
| Total | 1,821 (94.0%) | 117 (6.0%) |
Health Insurance Coverage by Citizenship Status in Cade

| Citizenship Status | With Coverage | Without Coverage |
| Native Born | 200 (100.0%) | 0 (0.0%) |
| Foreign Born, Citizen | 349 (100.0%) | 0 (0.0%) |
| Foreign Born, not a Citizen | 124 (89.2%) | 15 (10.8%) |
Health Insurance Coverage by Household Income in Cade
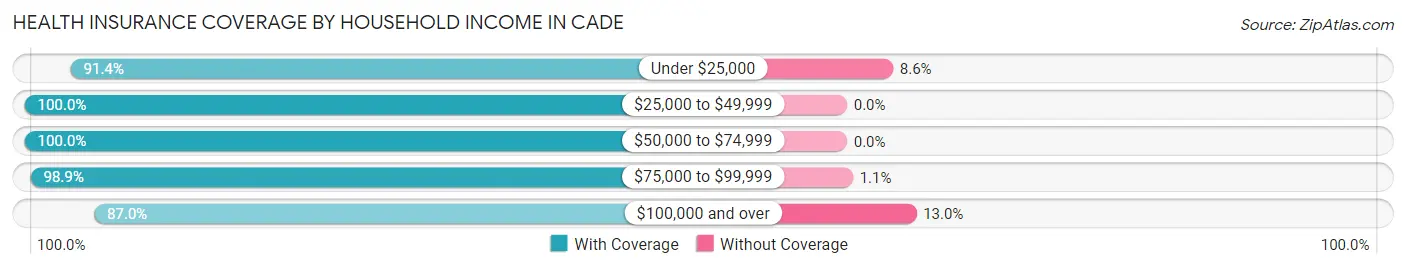
| Household Income | With Coverage | Without Coverage |
| Under $25,000 | 180 (91.4%) | 17 (8.6%) |
| $25,000 to $49,999 | 418 (100.0%) | 0 (0.0%) |
| $50,000 to $74,999 | 61 (100.0%) | 0 (0.0%) |
| $75,000 to $99,999 | 533 (98.9%) | 6 (1.1%) |
| $100,000 and over | 629 (87.0%) | 94 (13.0%) |
Public vs Private Health Insurance Coverage by Age in Cade
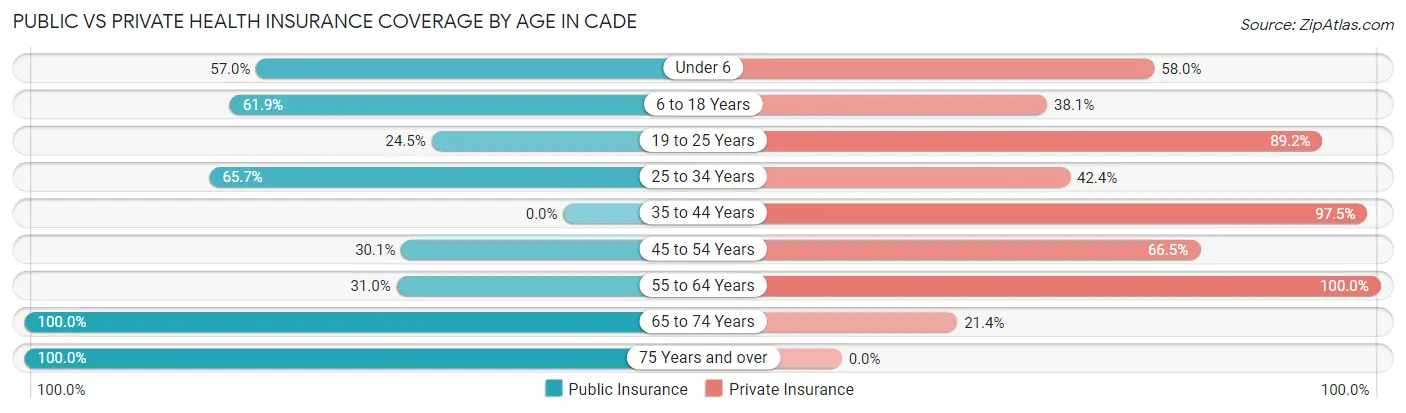
| Age Bracket | Public Insurance | Private Insurance |
| Under 6 | 114 (57.0%) | 116 (58.0%) |
| 6 to 18 Years | 216 (61.9%) | 133 (38.1%) |
| 19 to 25 Years | 34 (24.5%) | 124 (89.2%) |
| 25 to 34 Years | 155 (65.7%) | 100 (42.4%) |
| 35 to 44 Years | 0 (0.0%) | 237 (97.5%) |
| 45 to 54 Years | 105 (30.1%) | 232 (66.5%) |
| 55 to 64 Years | 74 (31.0%) | 239 (100.0%) |
| 65 to 74 Years | 168 (100.0%) | 36 (21.4%) |
| 75 Years and over | 15 (100.0%) | 0 (0.0%) |
| Total | 881 (45.5%) | 1,217 (62.8%) |
Disability Status by Sex by Age in Cade
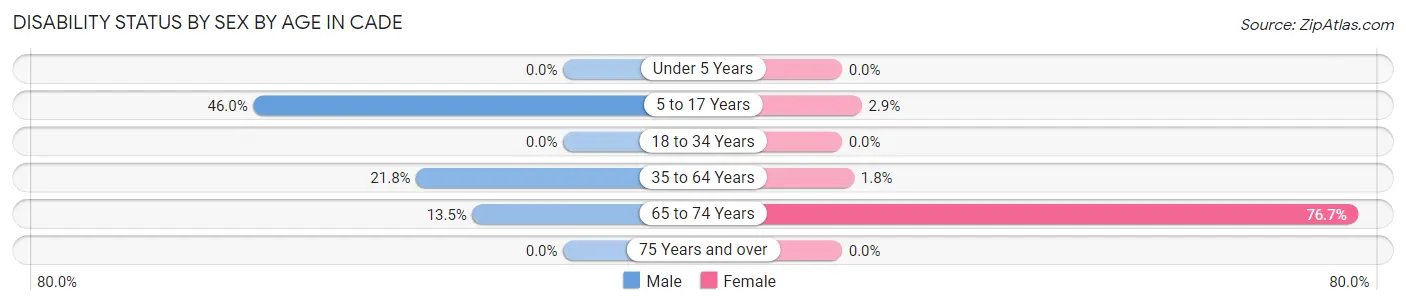
| Age Bracket | Male | Female |
| Under 5 Years | 0 (0.0%) | 0 (0.0%) |
| 5 to 17 Years | 46 (46.0%) | 7 (2.9%) |
| 18 to 34 Years | 0 (0.0%) | 0 (0.0%) |
| 35 to 64 Years | 108 (21.8%) | 6 (1.8%) |
| 65 to 74 Years | 7 (13.5%) | 89 (76.7%) |
| 75 Years and over | 0 (0.0%) | 0 (0.0%) |
Disability Class by Sex by Age in Cade
Disability Class: Hearing Difficulty
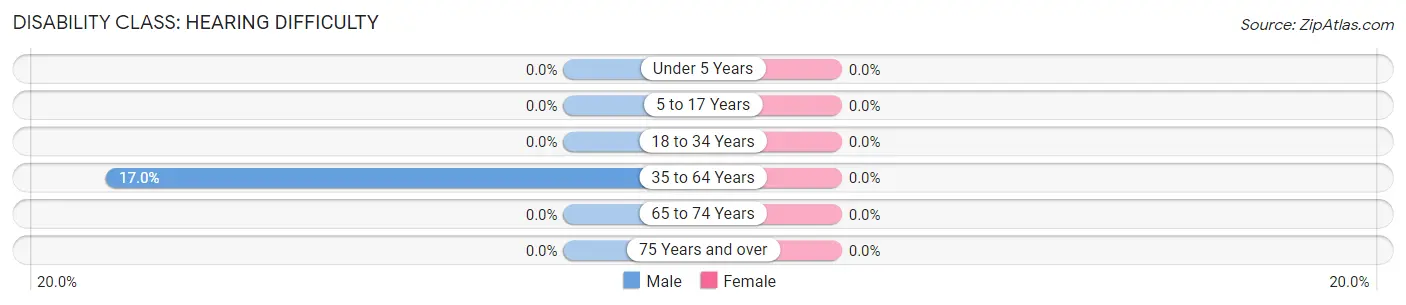
| Age Bracket | Male | Female |
| Under 5 Years | 0 (0.0%) | 0 (0.0%) |
| 5 to 17 Years | 0 (0.0%) | 0 (0.0%) |
| 18 to 34 Years | 0 (0.0%) | 0 (0.0%) |
| 35 to 64 Years | 84 (17.0%) | 0 (0.0%) |
| 65 to 74 Years | 0 (0.0%) | 0 (0.0%) |
| 75 Years and over | 0 (0.0%) | 0 (0.0%) |
Disability Class: Vision Difficulty
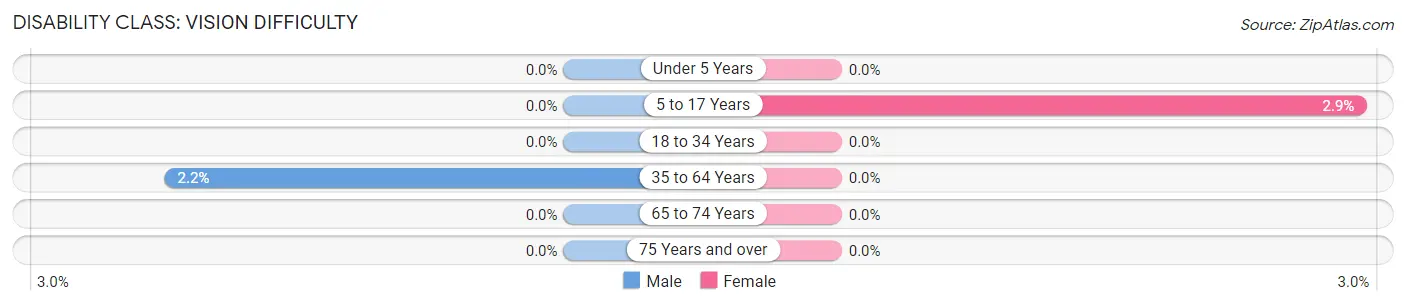
| Age Bracket | Male | Female |
| Under 5 Years | 0 (0.0%) | 0 (0.0%) |
| 5 to 17 Years | 0 (0.0%) | 7 (2.9%) |
| 18 to 34 Years | 0 (0.0%) | 0 (0.0%) |
| 35 to 64 Years | 11 (2.2%) | 0 (0.0%) |
| 65 to 74 Years | 0 (0.0%) | 0 (0.0%) |
| 75 Years and over | 0 (0.0%) | 0 (0.0%) |
Disability Class: Cognitive Difficulty
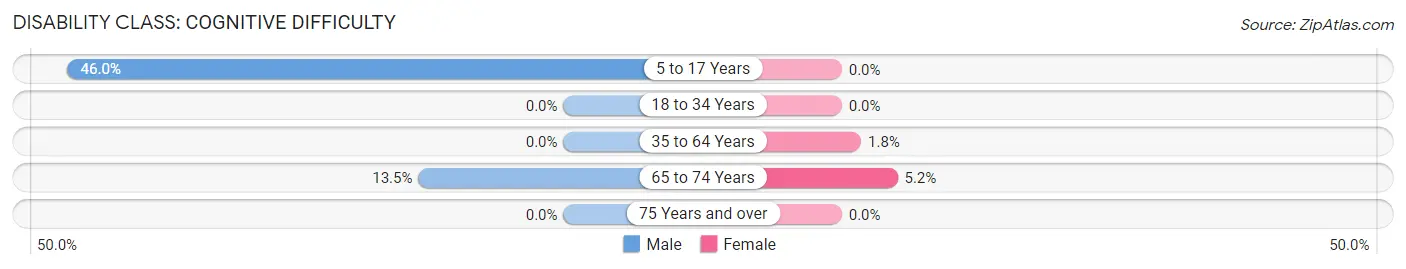
| Age Bracket | Male | Female |
| 5 to 17 Years | 46 (46.0%) | 0 (0.0%) |
| 18 to 34 Years | 0 (0.0%) | 0 (0.0%) |
| 35 to 64 Years | 0 (0.0%) | 6 (1.8%) |
| 65 to 74 Years | 7 (13.5%) | 6 (5.2%) |
| 75 Years and over | 0 (0.0%) | 0 (0.0%) |
Disability Class: Ambulatory Difficulty
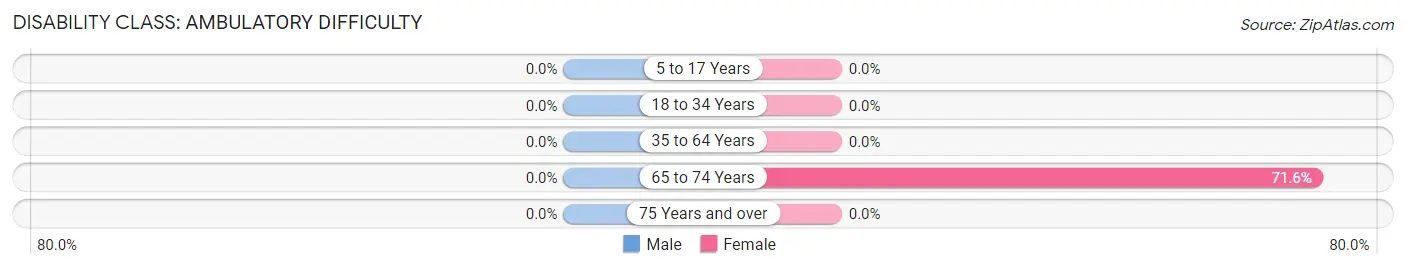
| Age Bracket | Male | Female |
| 5 to 17 Years | 0 (0.0%) | 0 (0.0%) |
| 18 to 34 Years | 0 (0.0%) | 0 (0.0%) |
| 35 to 64 Years | 0 (0.0%) | 0 (0.0%) |
| 65 to 74 Years | 0 (0.0%) | 83 (71.6%) |
| 75 Years and over | 0 (0.0%) | 0 (0.0%) |
Disability Class: Self-Care Difficulty
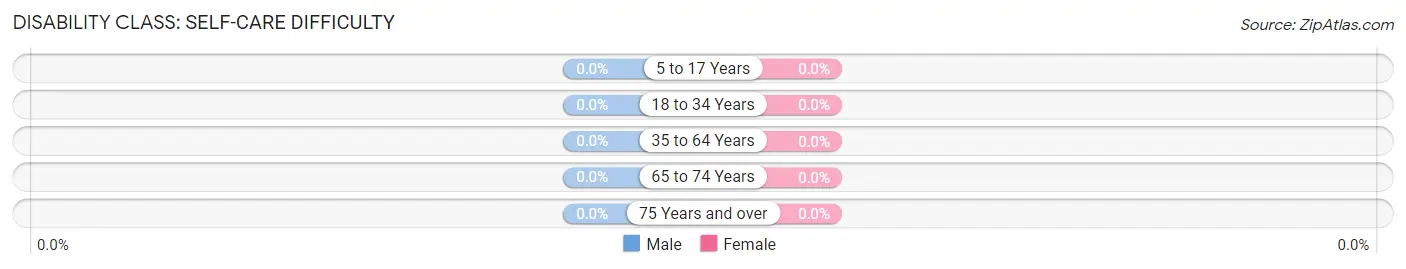
| Age Bracket | Male | Female |
| 5 to 17 Years | 0 (0.0%) | 0 (0.0%) |
| 18 to 34 Years | 0 (0.0%) | 0 (0.0%) |
| 35 to 64 Years | 0 (0.0%) | 0 (0.0%) |
| 65 to 74 Years | 0 (0.0%) | 0 (0.0%) |
| 75 Years and over | 0 (0.0%) | 0 (0.0%) |
Technology Access in Cade
Computing Device Access in Cade
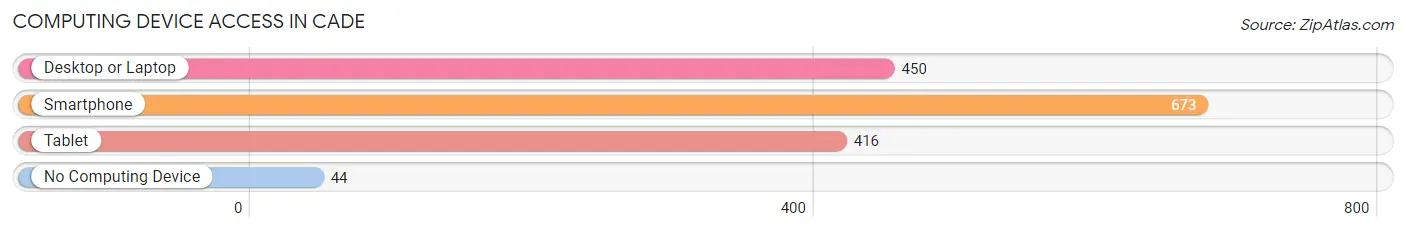
| Device Type | # Households | % Households |
| Desktop or Laptop | 450 | 59.0% |
| Smartphone | 673 | 88.2% |
| Tablet | 416 | 54.5% |
| No Computing Device | 44 | 5.8% |
| Total | 763 | 100.0% |
Internet Access in Cade
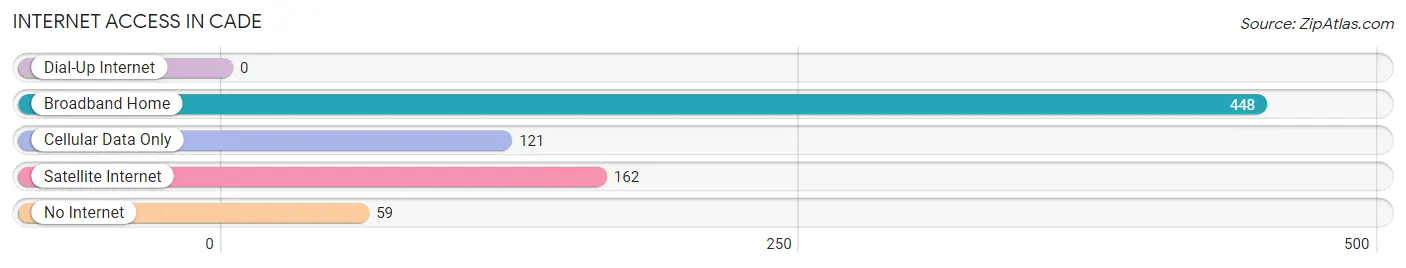
| Internet Type | # Households | % Households |
| Dial-Up Internet | 0 | 0.0% |
| Broadband Home | 448 | 58.7% |
| Cellular Data Only | 121 | 15.9% |
| Satellite Internet | 162 | 21.2% |
| No Internet | 59 | 7.7% |
| Total | 763 | 100.0% |
Cade Summary
Cade is a small unincorporated community located in St. Martin Parish, Louisiana. It is situated on the banks of the Bayou Teche, approximately 10 miles south of the city of Lafayette. The population of Cade was estimated to be 1,093 in the year 2000.
History
Cade was founded in the early 1800s by French settlers who were attracted to the area by its fertile soil and abundant wildlife. The town was named after a local Native American chief, Chief Cade. The town was originally a trading post and a stop on the stagecoach route between New Orleans and St. Louis.
In the late 1800s, Cade became a popular destination for wealthy plantation owners who wanted to escape the heat of the summer months. The town was also known for its sugar cane production and its thriving lumber industry.
In the early 1900s, Cade was home to a number of businesses, including a general store, a blacksmith shop, a sawmill, and a cotton gin. The town also had a post office, a bank, and a hotel.
Geography
Cade is located in St. Martin Parish, Louisiana, approximately 10 miles south of the city of Lafayette. The town is situated on the banks of the Bayou Teche, a tributary of the Atchafalaya River. The terrain in the area is mostly flat, with some rolling hills. The climate is humid subtropical, with hot, humid summers and mild winters.
Economy
The economy of Cade is largely based on agriculture. The town is home to several large farms that produce sugar cane, cotton, corn, and soybeans. The town also has a thriving lumber industry, with several sawmills located in the area.
In addition to agriculture, Cade is home to a number of small businesses, including restaurants, convenience stores, and auto repair shops. The town also has a post office, a bank, and a hotel.
Demographics
As of the year 2000, the population of Cade was estimated to be 1,093. The racial makeup of the town was 79.3% White, 19.2% African American, 0.3% Native American, 0.2% Asian, and 0.9% from other races. The median household income was $25,938, and the median family income was $31,250.
Conclusion
Cade is a small unincorporated community located in St. Martin Parish, Louisiana. It is situated on the banks of the Bayou Teche, approximately 10 miles south of the city of Lafayette. The population of Cade was estimated to be 1,093 in the year 2000. The town is largely agricultural, with a thriving lumber industry and a number of small businesses. The racial makeup of the town was 79.3% White, 19.2% African American, 0.3% Native American, 0.2% Asian, and 0.9% from other races. The median household income was $25,938, and the median family income was $31,250.
Common Questions
What is Per Capita Income in Cade?
Per Capita income in Cade is $29,884.
What is the Median Family Income in Cade?
Median Family Income in Cade is $68,672.
What is the Median Household income in Cade?
Median Household Income in Cade is $64,028.
What is Income or Wage Gap in Cade?
Income or Wage Gap in Cade is 50.1%.
Women in Cade earn 49.9 cents for every dollar earned by a man.
What is Inequality or Gini Index in Cade?
Inequality or Gini Index in Cade is 0.36.
What is the Total Population of Cade?
Total Population of Cade is 1,960.
What is the Total Male Population of Cade?
Total Male Population of Cade is 937.
What is the Total Female Population of Cade?
Total Female Population of Cade is 1,023.
What is the Ratio of Males per 100 Females in Cade?
There are 91.59 Males per 100 Females in Cade.
What is the Ratio of Females per 100 Males in Cade?
There are 109.18 Females per 100 Males in Cade.
What is the Median Population Age in Cade?
Median Population Age in Cade is 38.7 Years.
What is the Average Family Size in Cade
Average Family Size in Cade is 3.4 People.
What is the Average Household Size in Cade
Average Household Size in Cade is 2.6 People.
How Large is the Labor Force in Cade?
There are 1,132 People in the Labor Forcein in Cade.
What is the Percentage of People in the Labor Force in Cade?
76.1% of People are in the Labor Force in Cade.
What is the Unemployment Rate in Cade?
Unemployment Rate in Cade is 1.4%.