Port Sulphur, LA Map & Demographics
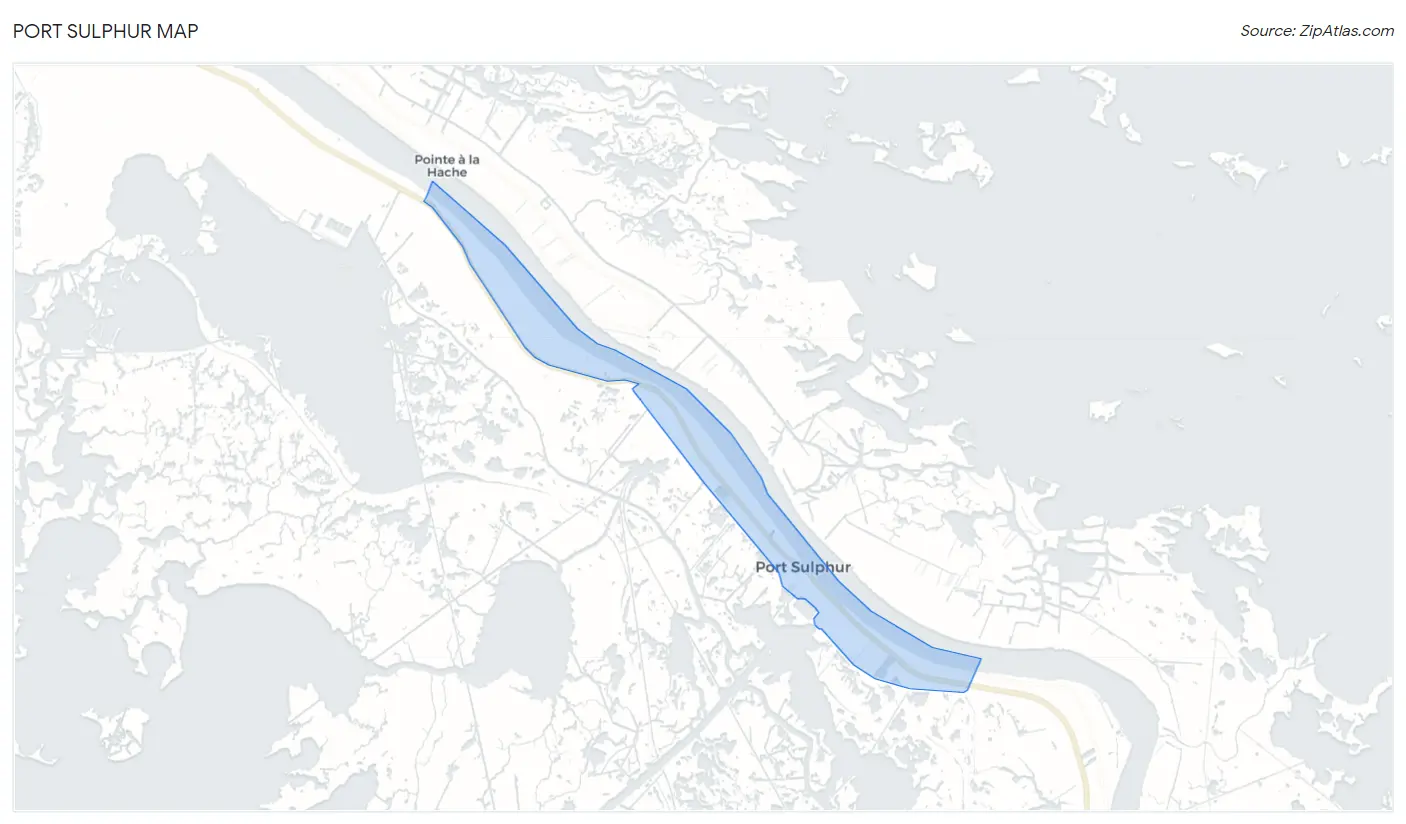
Port Sulphur Map
Port Sulphur Overview
$18,261
PER CAPITA INCOME
$31,325
AVG HOUSEHOLD INCOME
58.7%
WAGE / INCOME GAP [ % ]
41.3¢/ $1
WAGE / INCOME GAP [ $ ]
0.48
INEQUALITY / GINI INDEX
1,593
TOTAL POPULATION
867
MALE POPULATION
726
FEMALE POPULATION
119.42
MALES / 100 FEMALES
83.74
FEMALES / 100 MALES
27.5
MEDIAN AGE
3.3
AVG FAMILY SIZE
3.0
AVG HOUSEHOLD SIZE
641
LABOR FORCE [ PEOPLE ]
57.5%
PERCENT IN LABOR FORCE
20.3%
UNEMPLOYMENT RATE
Port Sulphur Zip Codes
Port Sulphur Area Codes
Income in Port Sulphur
Income Overview in Port Sulphur
| Characteristic | Number | Measure |
| Per Capita Income | 1,593 | $18,261 |
| Median Family Income | 439 | $0 |
| Mean Family Income | 439 | $59,278 |
| Median Household Income | 527 | $31,325 |
| Mean Household Income | 527 | $54,226 |
| Income Deficit | 439 | $0 |
| Wage / Income Gap (%) | 1,593 | 58.65% |
| Wage / Income Gap ($) | 1,593 | 41.35¢ per $1 |
| Gini / Inequality Index | 1,593 | 0.48 |
Earnings by Sex in Port Sulphur
Average Earnings in Port Sulphur are $29,948, $56,050 for men and $23,175 for women, a difference of 58.7%.
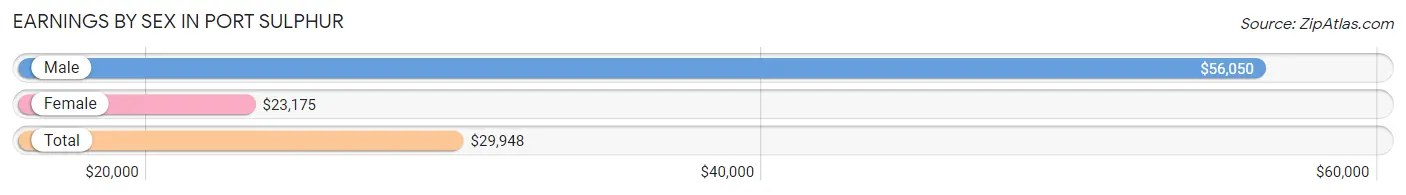
| Sex | Number | Average Earnings |
| Male | 255 (41.2%) | $56,050 |
| Female | 364 (58.8%) | $23,175 |
| Total | 619 (100.0%) | $29,948 |
Earnings by Sex by Income Bracket in Port Sulphur
The most common earnings brackets in Port Sulphur are $55,000 to $64,999 for men (112 | 43.9%) and $5,000 to $7,499 for women (106 | 29.1%).
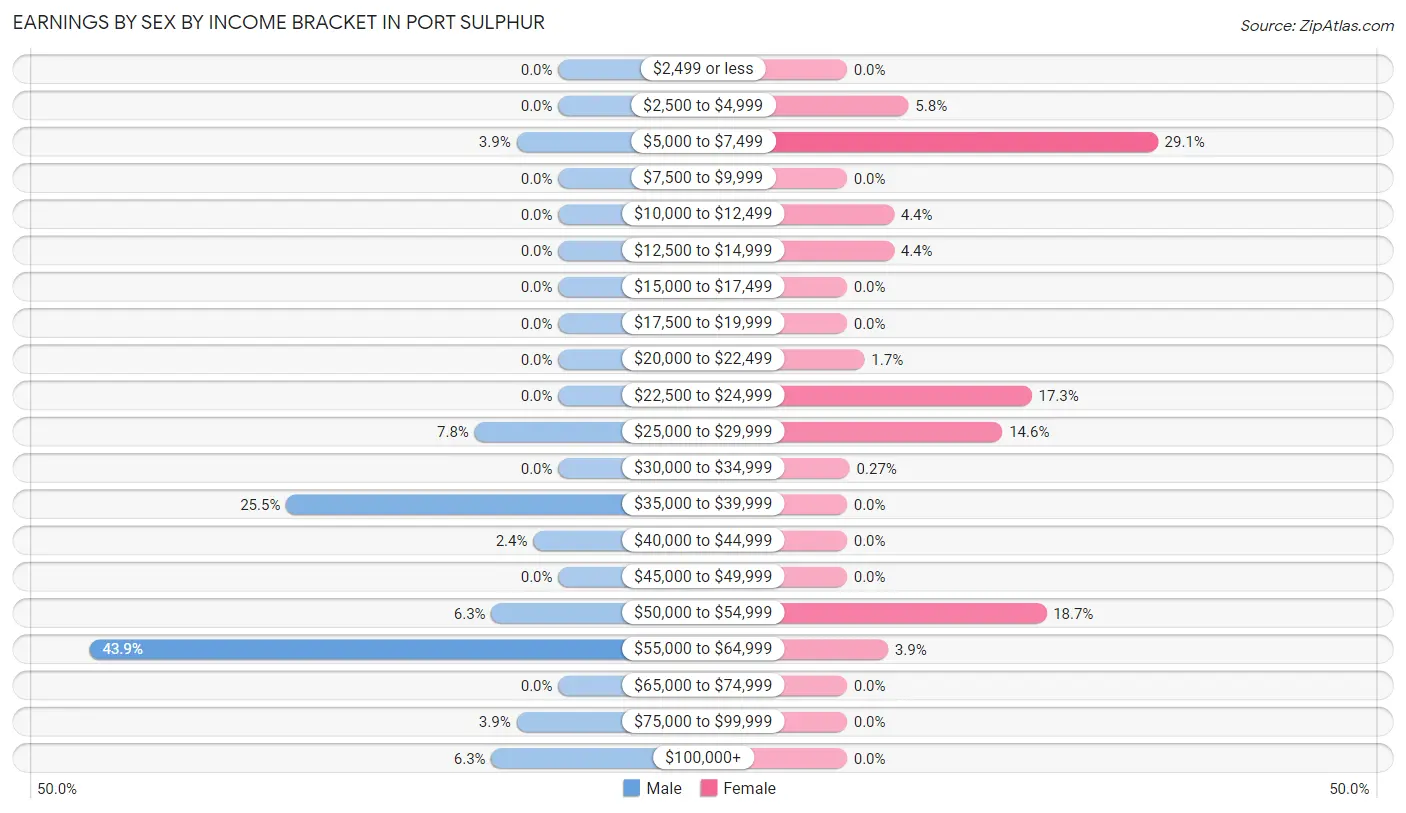
| Income | Male | Female |
| $2,499 or less | 0 (0.0%) | 0 (0.0%) |
| $2,500 to $4,999 | 0 (0.0%) | 21 (5.8%) |
| $5,000 to $7,499 | 10 (3.9%) | 106 (29.1%) |
| $7,500 to $9,999 | 0 (0.0%) | 0 (0.0%) |
| $10,000 to $12,499 | 0 (0.0%) | 16 (4.4%) |
| $12,500 to $14,999 | 0 (0.0%) | 16 (4.4%) |
| $15,000 to $17,499 | 0 (0.0%) | 0 (0.0%) |
| $17,500 to $19,999 | 0 (0.0%) | 0 (0.0%) |
| $20,000 to $22,499 | 0 (0.0%) | 6 (1.7%) |
| $22,500 to $24,999 | 0 (0.0%) | 63 (17.3%) |
| $25,000 to $29,999 | 20 (7.8%) | 53 (14.6%) |
| $30,000 to $34,999 | 0 (0.0%) | 1 (0.3%) |
| $35,000 to $39,999 | 65 (25.5%) | 0 (0.0%) |
| $40,000 to $44,999 | 6 (2.4%) | 0 (0.0%) |
| $45,000 to $49,999 | 0 (0.0%) | 0 (0.0%) |
| $50,000 to $54,999 | 16 (6.3%) | 68 (18.7%) |
| $55,000 to $64,999 | 112 (43.9%) | 14 (3.8%) |
| $65,000 to $74,999 | 0 (0.0%) | 0 (0.0%) |
| $75,000 to $99,999 | 10 (3.9%) | 0 (0.0%) |
| $100,000+ | 16 (6.3%) | 0 (0.0%) |
| Total | 255 (100.0%) | 364 (100.0%) |
Earnings by Sex by Educational Attainment in Port Sulphur
Average earnings in Port Sulphur are $56,300 for men and $24,802 for women, a difference of 55.9%. Men with an educational attainment of high school diploma enjoy the highest average annual earnings of $61,159, while those with college or associate's degree education earn the least with $36,923. Women with an educational attainment of college or associate's degree earn the most with the average annual earnings of $27,972, while those with college or associate's degree education have the smallest earnings of $27,972.
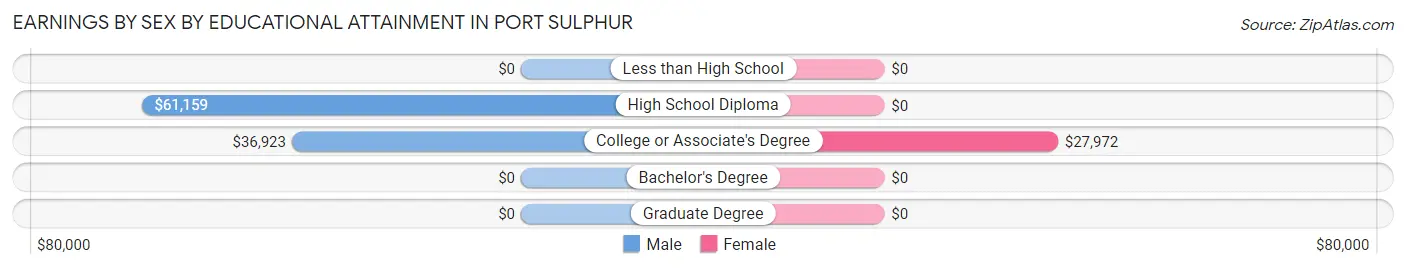
| Educational Attainment | Male Income | Female Income |
| Less than High School | - | - |
| High School Diploma | $61,159 | $0 |
| College or Associate's Degree | $36,923 | $27,972 |
| Bachelor's Degree | - | - |
| Graduate Degree | - | - |
| Total | $56,300 | $24,802 |
Family Income in Port Sulphur
Family Income Brackets in Port Sulphur
According to the Port Sulphur family income data, there are 113 families falling into the $25,000 to $34,999 income range, which is the most common income bracket and makes up 25.7% of all families.
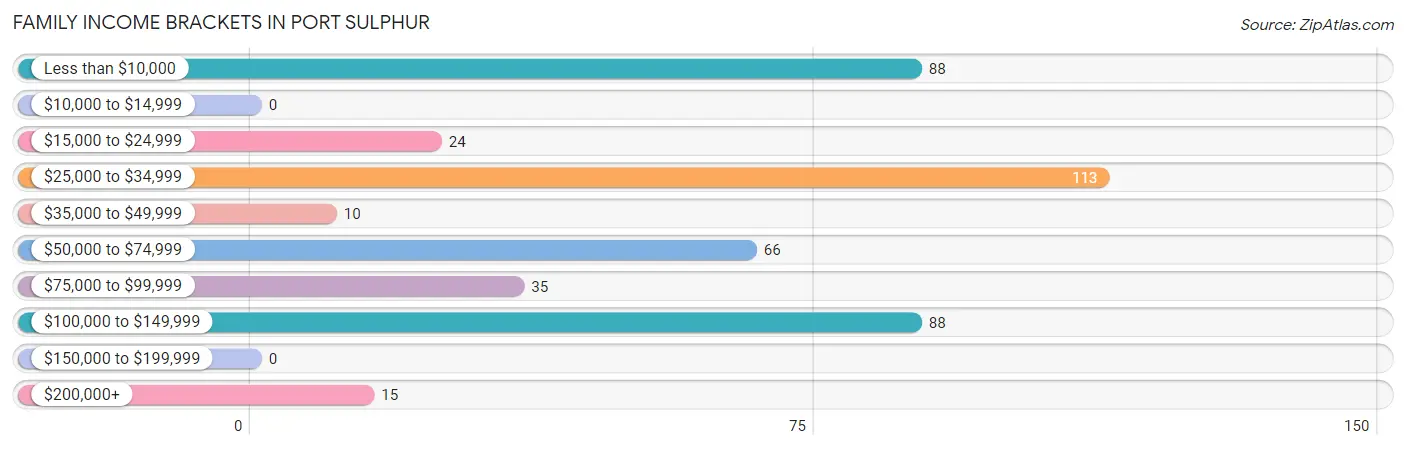
| Income Bracket | # Families | % Families |
| Less than $10,000 | 88 | 20.0% |
| $10,000 to $14,999 | 0 | 0.0% |
| $15,000 to $24,999 | 24 | 5.5% |
| $25,000 to $34,999 | 113 | 25.7% |
| $35,000 to $49,999 | 10 | 2.3% |
| $50,000 to $74,999 | 66 | 15.0% |
| $75,000 to $99,999 | 35 | 8.0% |
| $100,000 to $149,999 | 88 | 20.0% |
| $150,000 to $199,999 | 0 | 0.0% |
| $200,000+ | 15 | 3.4% |
Family Income by Famaliy Size in Port Sulphur
4-person families (107 | 24.4%) account for the highest median family income in Port Sulphur with $110,869 per family, while 4-person families (107 | 24.4%) have the highest median income of $27,717 per family member.
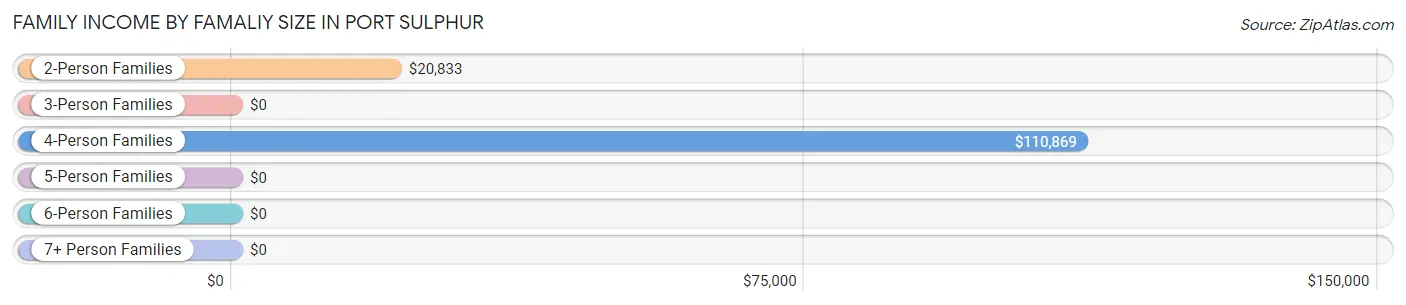
| Income Bracket | # Families | Median Income |
| 2-Person Families | 216 (49.2%) | $20,833 |
| 3-Person Families | 112 (25.5%) | $0 |
| 4-Person Families | 107 (24.4%) | $110,869 |
| 5-Person Families | 0 (0.0%) | $0 |
| 6-Person Families | 0 (0.0%) | $0 |
| 7+ Person Families | 4 (0.9%) | $0 |
| Total | 439 (100.0%) | $0 |
Family Income by Number of Earners in Port Sulphur
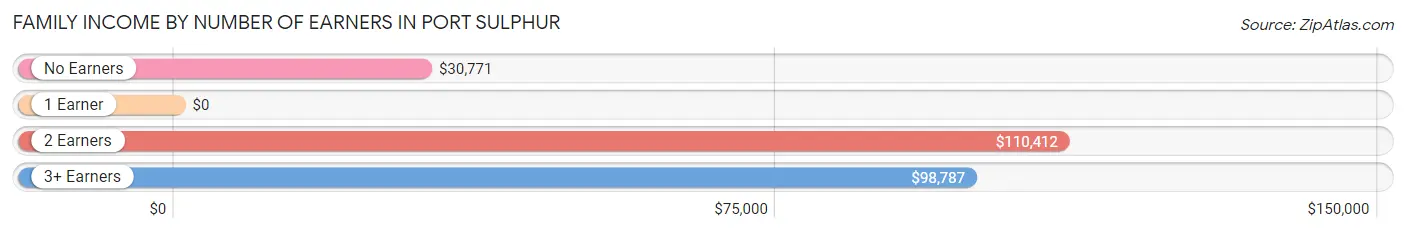
| Number of Earners | # Families | Median Income |
| No Earners | 97 (22.1%) | $30,771 |
| 1 Earner | 160 (36.4%) | $0 |
| 2 Earners | 139 (31.7%) | $110,412 |
| 3+ Earners | 43 (9.8%) | $98,787 |
| Total | 439 (100.0%) | $0 |
Household Income in Port Sulphur
Household Income Brackets in Port Sulphur
With 127 households falling in the category, the $25,000 to $34,999 income range is the most frequent in Port Sulphur, accounting for 24.1% of all households.
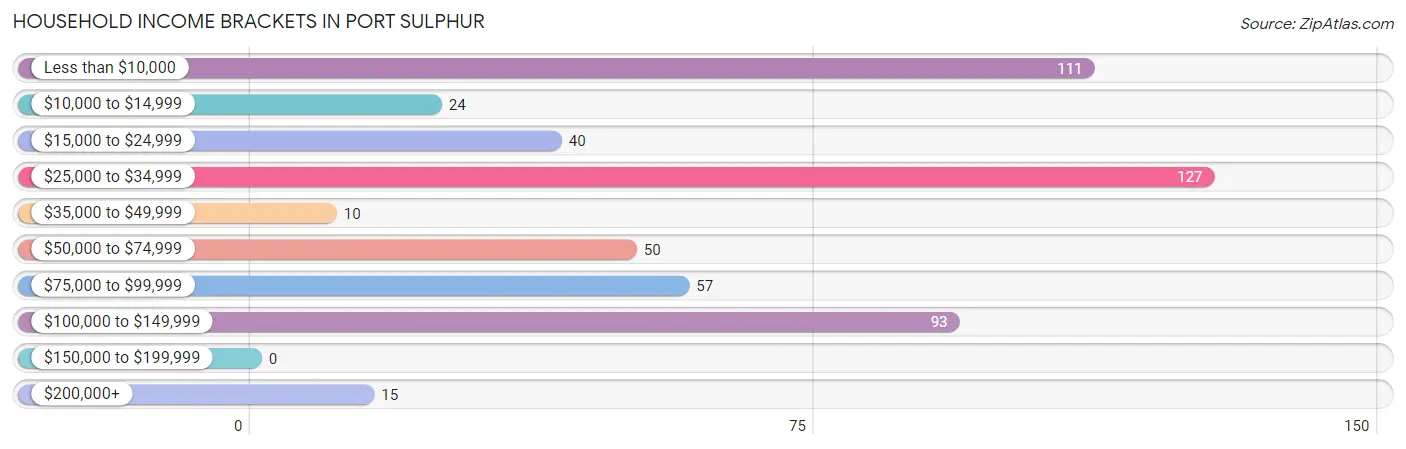
| Income Bracket | # Households | % Households |
| Less than $10,000 | 111 | 21.1% |
| $10,000 to $14,999 | 24 | 4.6% |
| $15,000 to $24,999 | 40 | 7.6% |
| $25,000 to $34,999 | 127 | 24.1% |
| $35,000 to $49,999 | 10 | 1.9% |
| $50,000 to $74,999 | 50 | 9.5% |
| $75,000 to $99,999 | 57 | 10.8% |
| $100,000 to $149,999 | 93 | 17.6% |
| $150,000 to $199,999 | 0 | 0.0% |
| $200,000+ | 15 | 2.8% |
Household Income by Householder Age in Port Sulphur
The median household income in Port Sulphur is $31,325, with the highest median household income of $29,269 found in the 25 to 44 years age bracket for the primary householder. A total of 75 households (14.2%) fall into this category. Meanwhile, the 15 to 24 years age bracket for the primary householder has the lowest median household income of $0, with 96 households (18.2%) in this group.
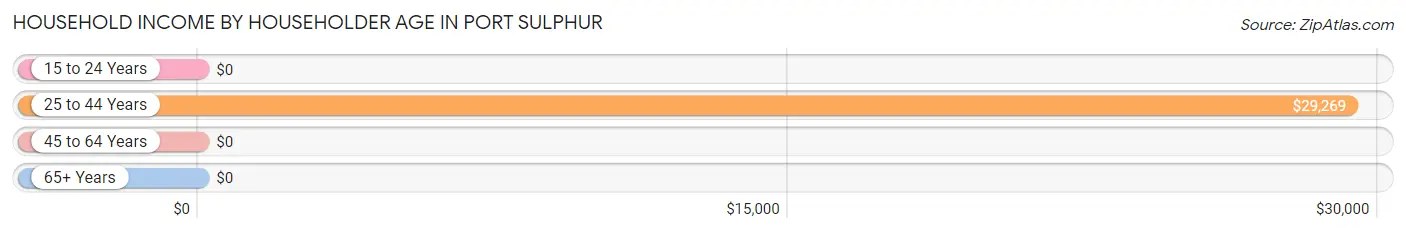
| Income Bracket | # Households | Median Income |
| 15 to 24 Years | 96 (18.2%) | $0 |
| 25 to 44 Years | 75 (14.2%) | $29,269 |
| 45 to 64 Years | 246 (46.7%) | $0 |
| 65+ Years | 110 (20.9%) | $0 |
| Total | 527 (100.0%) | $31,325 |
Poverty in Port Sulphur
Income Below Poverty by Sex and Age in Port Sulphur
With 4.4% poverty level for males and 35.0% for females among the residents of Port Sulphur, 65 to 74 year old males and 18 to 24 year old females are the most vulnerable to poverty, with 6 males (31.6%) and 82 females (100.0%) in their respective age groups living below the poverty level.
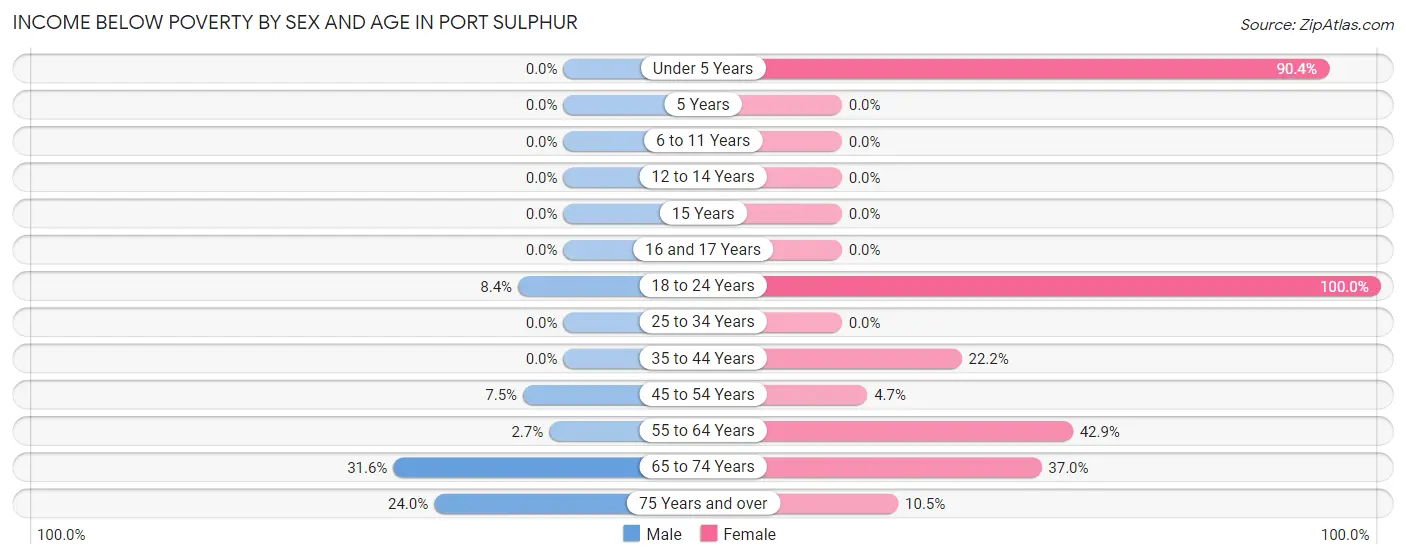
| Age Bracket | Male | Female |
| Under 5 Years | 0 (0.0%) | 94 (90.4%) |
| 5 Years | 0 (0.0%) | 0 (0.0%) |
| 6 to 11 Years | 0 (0.0%) | 0 (0.0%) |
| 12 to 14 Years | 0 (0.0%) | 0 (0.0%) |
| 15 Years | 0 (0.0%) | 0 (0.0%) |
| 16 and 17 Years | 0 (0.0%) | 0 (0.0%) |
| 18 to 24 Years | 14 (8.4%) | 82 (100.0%) |
| 25 to 34 Years | 0 (0.0%) | 0 (0.0%) |
| 35 to 44 Years | 0 (0.0%) | 18 (22.2%) |
| 45 to 54 Years | 9 (7.5%) | 6 (4.7%) |
| 55 to 64 Years | 3 (2.6%) | 27 (42.9%) |
| 65 to 74 Years | 6 (31.6%) | 20 (37.0%) |
| 75 Years and over | 6 (24.0%) | 7 (10.4%) |
| Total | 38 (4.4%) | 254 (35.0%) |
Income Above Poverty by Sex and Age in Port Sulphur
According to the poverty statistics in Port Sulphur, males aged under 5 years and females aged 5 years are the age groups that are most secure financially, with 100.0% of males and 100.0% of females in these age groups living above the poverty line.
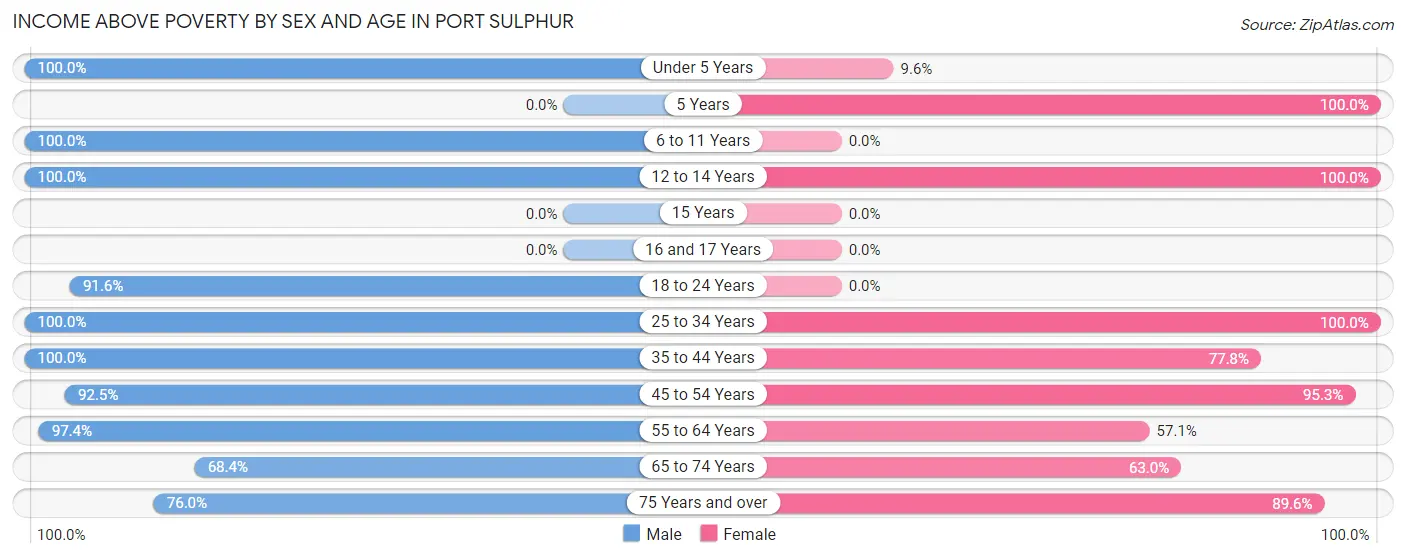
| Age Bracket | Male | Female |
| Under 5 Years | 35 (100.0%) | 10 (9.6%) |
| 5 Years | 0 (0.0%) | 20 (100.0%) |
| 6 to 11 Years | 7 (100.0%) | 0 (0.0%) |
| 12 to 14 Years | 244 (100.0%) | 69 (100.0%) |
| 15 Years | 0 (0.0%) | 0 (0.0%) |
| 16 and 17 Years | 0 (0.0%) | 0 (0.0%) |
| 18 to 24 Years | 152 (91.6%) | 0 (0.0%) |
| 25 to 34 Years | 103 (100.0%) | 58 (100.0%) |
| 35 to 44 Years | 21 (100.0%) | 63 (77.8%) |
| 45 to 54 Years | 111 (92.5%) | 121 (95.3%) |
| 55 to 64 Years | 110 (97.4%) | 36 (57.1%) |
| 65 to 74 Years | 13 (68.4%) | 34 (63.0%) |
| 75 Years and over | 19 (76.0%) | 60 (89.5%) |
| Total | 815 (95.6%) | 471 (65.0%) |
Income Below Poverty Among Married-Couple Families in Port Sulphur
The poverty statistics for married-couple families in Port Sulphur show that 8.9% or 12 of the total 135 families live below the poverty line. Families with no children have the highest poverty rate of 29.3%, comprising of 12 families. On the other hand, families with 1 or 2 children have the lowest poverty rate of 0.0%, which includes 0 families.
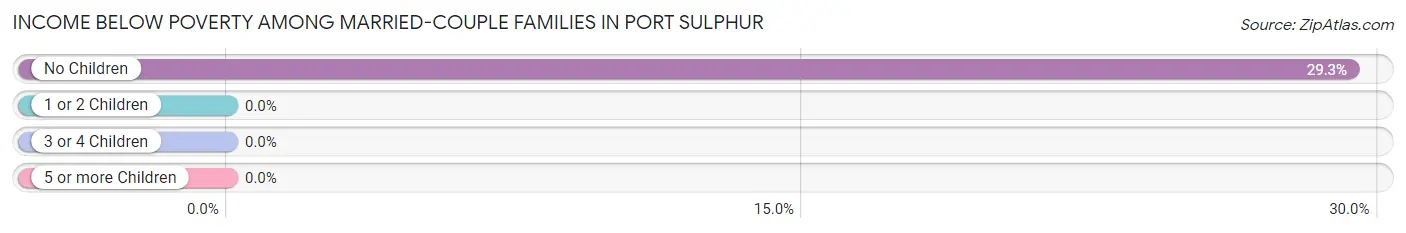
| Children | Above Poverty | Below Poverty |
| No Children | 29 (70.7%) | 12 (29.3%) |
| 1 or 2 Children | 94 (100.0%) | 0 (0.0%) |
| 3 or 4 Children | 0 (0.0%) | 0 (0.0%) |
| 5 or more Children | 0 (0.0%) | 0 (0.0%) |
| Total | 123 (91.1%) | 12 (8.9%) |
Income Below Poverty Among Single-Parent Households in Port Sulphur
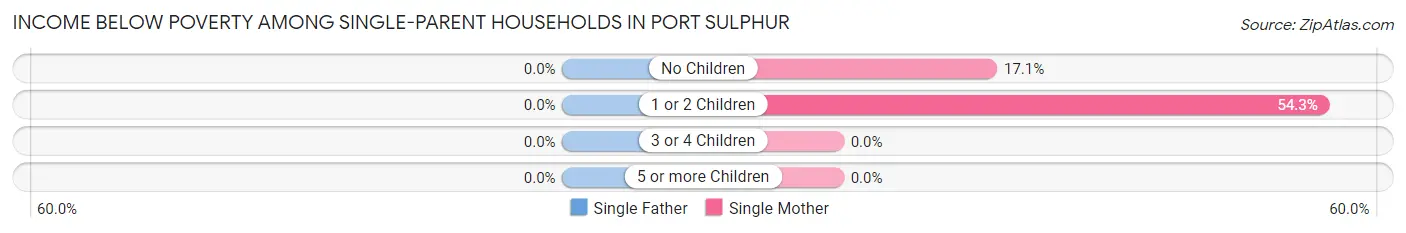
| Children | Single Father | Single Mother |
| No Children | 0 (0.0%) | 12 (17.1%) |
| 1 or 2 Children | 0 (0.0%) | 82 (54.3%) |
| 3 or 4 Children | 0 (0.0%) | 0 (0.0%) |
| 5 or more Children | 0 (0.0%) | 0 (0.0%) |
| Total | 0 (0.0%) | 94 (41.8%) |
Income Below Poverty Among Married-Couple vs Single-Parent Households in Port Sulphur
The poverty data for Port Sulphur shows that 12 of the married-couple family households (8.9%) and 94 of the single-parent households (30.9%) are living below the poverty level. Within the married-couple family households, those with no children have the highest poverty rate, with 12 households (29.3%) falling below the poverty line. Among the single-parent households, those with 1 or 2 children have the highest poverty rate, with 82 household (54.3%) living below poverty.
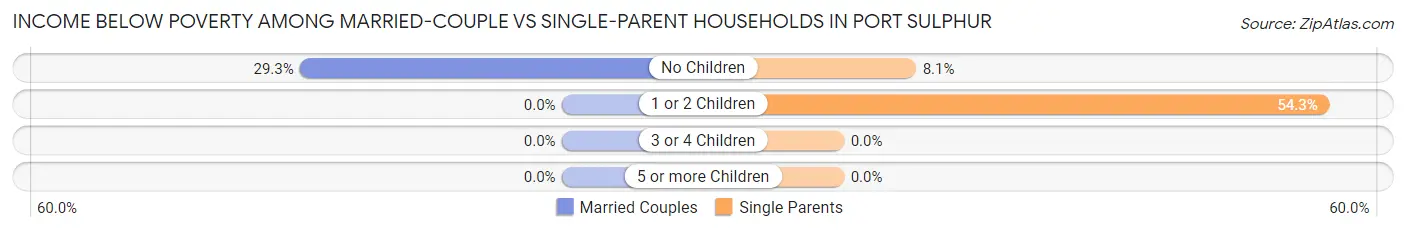
| Children | Married-Couple Families | Single-Parent Households |
| No Children | 12 (29.3%) | 12 (8.1%) |
| 1 or 2 Children | 0 (0.0%) | 82 (54.3%) |
| 3 or 4 Children | 0 (0.0%) | 0 (0.0%) |
| 5 or more Children | 0 (0.0%) | 0 (0.0%) |
| Total | 12 (8.9%) | 94 (30.9%) |
Race in Port Sulphur
The most populous races in Port Sulphur are Black / African American (880 | 55.2%), Two or more Races (411 | 25.8%), and White / Caucasian (214 | 13.4%).
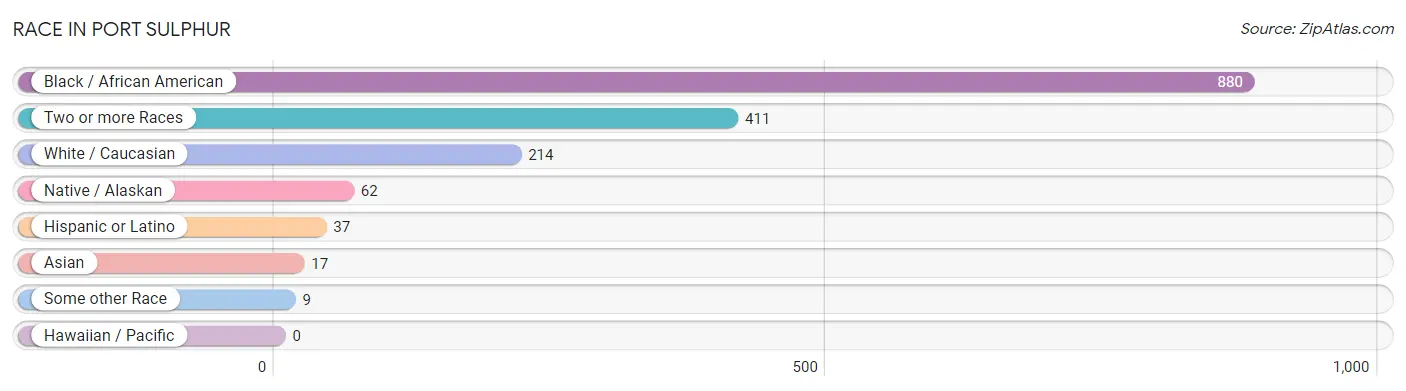
| Race | # Population | % Population |
| Asian | 17 | 1.1% |
| Black / African American | 880 | 55.2% |
| Hawaiian / Pacific | 0 | 0.0% |
| Hispanic or Latino | 37 | 2.3% |
| Native / Alaskan | 62 | 3.9% |
| White / Caucasian | 214 | 13.4% |
| Two or more Races | 411 | 25.8% |
| Some other Race | 9 | 0.6% |
| Total | 1,593 | 100.0% |
Ancestry in Port Sulphur
The most populous ancestries reported in Port Sulphur are French (268 | 16.8%), French American Indian (131 | 8.2%), Italian (110 | 6.9%), American (45 | 2.8%), and Dominican (30 | 1.9%), together accounting for 36.6% of all Port Sulphur residents.
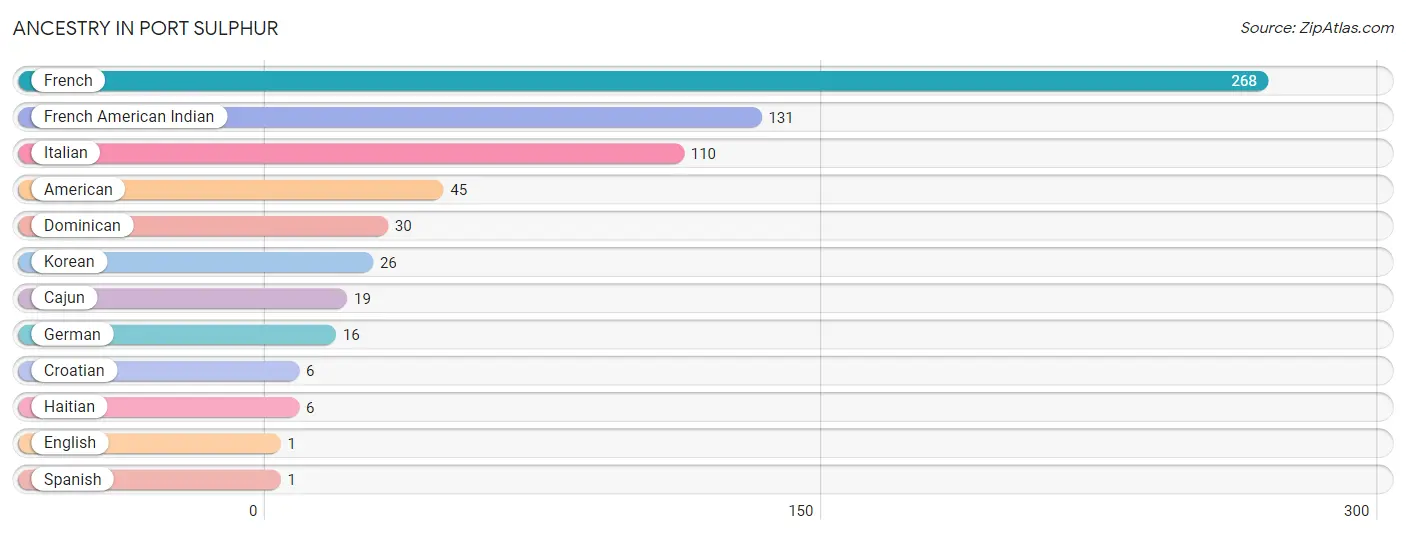
| Ancestry | # Population | % Population |
| American | 45 | 2.8% |
| Cajun | 19 | 1.2% |
| Croatian | 6 | 0.4% |
| Dominican | 30 | 1.9% |
| English | 1 | 0.1% |
| French | 268 | 16.8% |
| French American Indian | 131 | 8.2% |
| German | 16 | 1.0% |
| Haitian | 6 | 0.4% |
| Italian | 110 | 6.9% |
| Korean | 26 | 1.6% |
| Spanish | 1 | 0.1% | View All 12 Rows |
Immigrants in Port Sulphur
The most numerous immigrant groups reported in Port Sulphur came from Asia (17 | 1.1%), Philippines (17 | 1.1%), South Eastern Asia (17 | 1.1%), Europe (6 | 0.4%), and Northern Europe (6 | 0.4%), together accounting for 4.0% of all Port Sulphur residents.
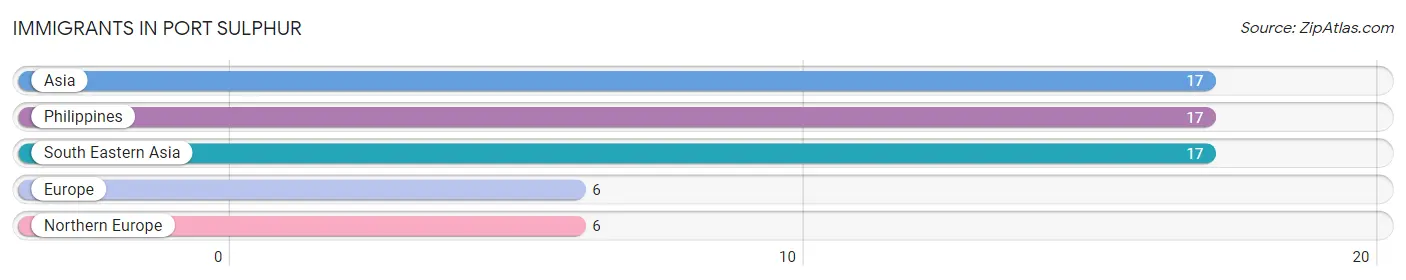
| Immigration Origin | # Population | % Population |
| Asia | 17 | 1.1% |
| Europe | 6 | 0.4% |
| Northern Europe | 6 | 0.4% |
| Philippines | 17 | 1.1% |
| South Eastern Asia | 17 | 1.1% | View All 5 Rows |
Sex and Age in Port Sulphur
Sex and Age in Port Sulphur
The most populous age groups in Port Sulphur are 10 to 14 Years (244 | 28.1%) for men and Under 5 Years (104 | 14.3%) for women.
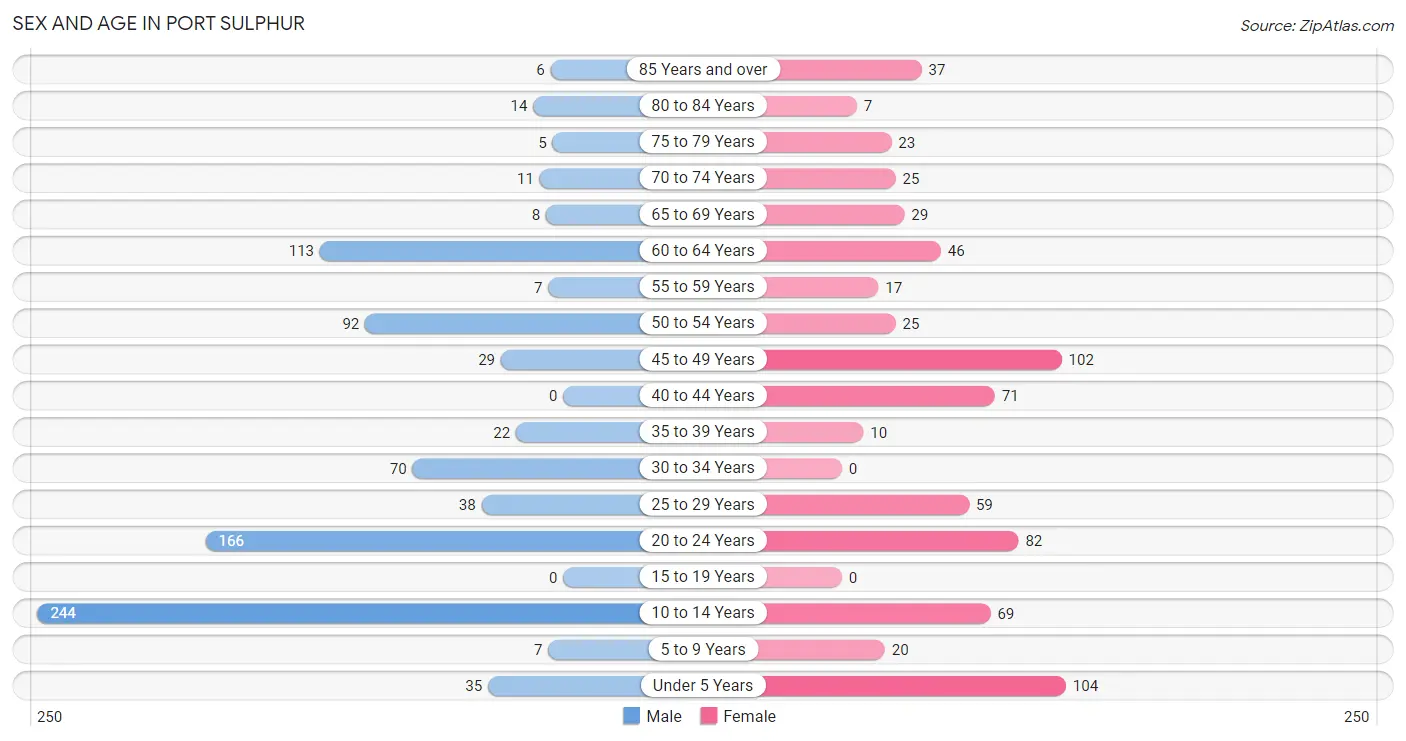
| Age Bracket | Male | Female |
| Under 5 Years | 35 (4.0%) | 104 (14.3%) |
| 5 to 9 Years | 7 (0.8%) | 20 (2.8%) |
| 10 to 14 Years | 244 (28.1%) | 69 (9.5%) |
| 15 to 19 Years | 0 (0.0%) | 0 (0.0%) |
| 20 to 24 Years | 166 (19.2%) | 82 (11.3%) |
| 25 to 29 Years | 38 (4.4%) | 59 (8.1%) |
| 30 to 34 Years | 70 (8.1%) | 0 (0.0%) |
| 35 to 39 Years | 22 (2.5%) | 10 (1.4%) |
| 40 to 44 Years | 0 (0.0%) | 71 (9.8%) |
| 45 to 49 Years | 29 (3.3%) | 102 (14.1%) |
| 50 to 54 Years | 92 (10.6%) | 25 (3.4%) |
| 55 to 59 Years | 7 (0.8%) | 17 (2.3%) |
| 60 to 64 Years | 113 (13.0%) | 46 (6.3%) |
| 65 to 69 Years | 8 (0.9%) | 29 (4.0%) |
| 70 to 74 Years | 11 (1.3%) | 25 (3.4%) |
| 75 to 79 Years | 5 (0.6%) | 23 (3.2%) |
| 80 to 84 Years | 14 (1.6%) | 7 (1.0%) |
| 85 Years and over | 6 (0.7%) | 37 (5.1%) |
| Total | 867 (100.0%) | 726 (100.0%) |
Families and Households in Port Sulphur
Median Family Size in Port Sulphur
The median family size in Port Sulphur is 3.31 persons per family, with married-couple families (135 | 30.7%) accounting for the largest median family size of 4.16 persons per family. On the other hand, single female/mother families (225 | 51.2%) represent the smallest median family size with 2.60 persons per family.
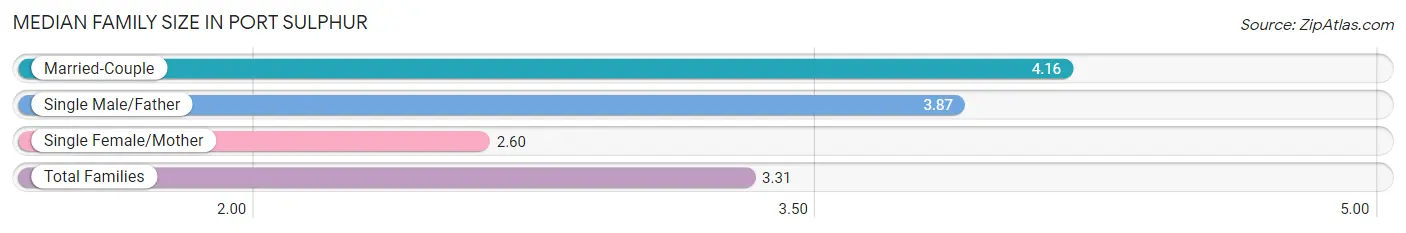
| Family Type | # Families | Family Size |
| Married-Couple | 135 (30.7%) | 4.16 |
| Single Male/Father | 79 (18.0%) | 3.87 |
| Single Female/Mother | 225 (51.2%) | 2.60 |
| Total Families | 439 (100.0%) | 3.31 |
Median Household Size in Port Sulphur
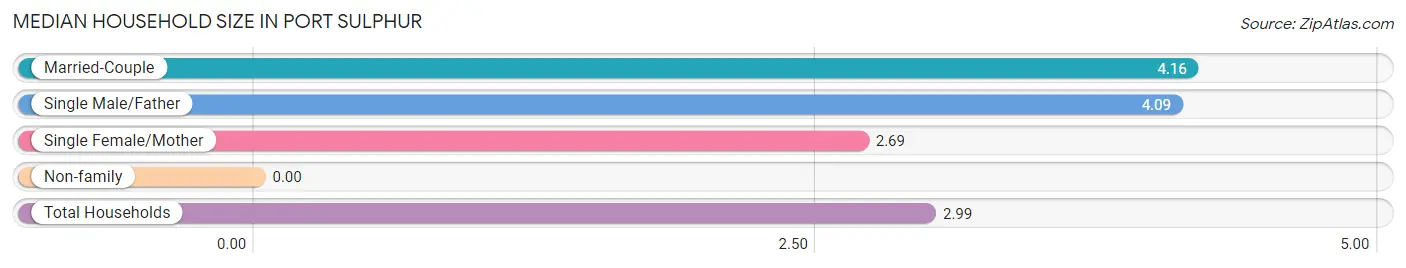
| Household Type | # Households | Household Size |
| Married-Couple | 135 (25.6%) | 4.16 |
| Single Male/Father | 79 (15.0%) | 4.09 |
| Single Female/Mother | 225 (42.7%) | 2.69 |
| Non-family | 88 (16.7%) | - |
| Total Households | 527 (100.0%) | 2.99 |
Household Size by Marriage Status in Port Sulphur
Out of a total of 527 households in Port Sulphur, 439 (83.3%) are family households, while 88 (16.7%) are nonfamily households. The most numerous type of family households are 2-person households, comprising 197, and the most common type of nonfamily households are 1-person households, comprising 88.
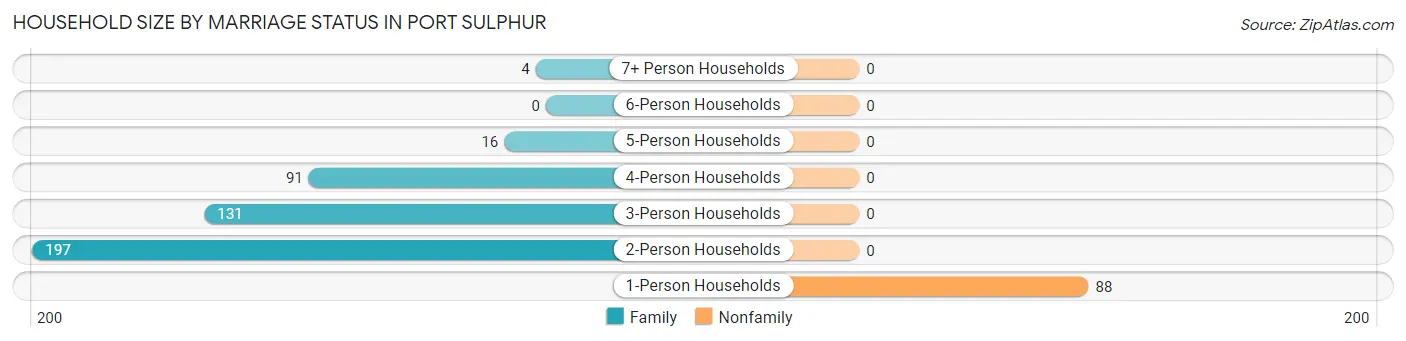
| Household Size | Family Households | Nonfamily Households |
| 1-Person Households | - | 88 (16.7%) |
| 2-Person Households | 197 (37.4%) | 0 (0.0%) |
| 3-Person Households | 131 (24.9%) | 0 (0.0%) |
| 4-Person Households | 91 (17.3%) | 0 (0.0%) |
| 5-Person Households | 16 (3.0%) | 0 (0.0%) |
| 6-Person Households | 0 (0.0%) | 0 (0.0%) |
| 7+ Person Households | 4 (0.8%) | 0 (0.0%) |
| Total | 439 (83.3%) | 88 (16.7%) |
Female Fertility in Port Sulphur
Fertility by Age in Port Sulphur
Average fertility rate in Port Sulphur is 28.0 births per 1,000 women. Women in the age bracket of 20 to 34 years have the highest fertility rate with 64.0 births per 1,000 women. Women in the age bracket of 20 to 34 years acount for 100.0% of all women with births.
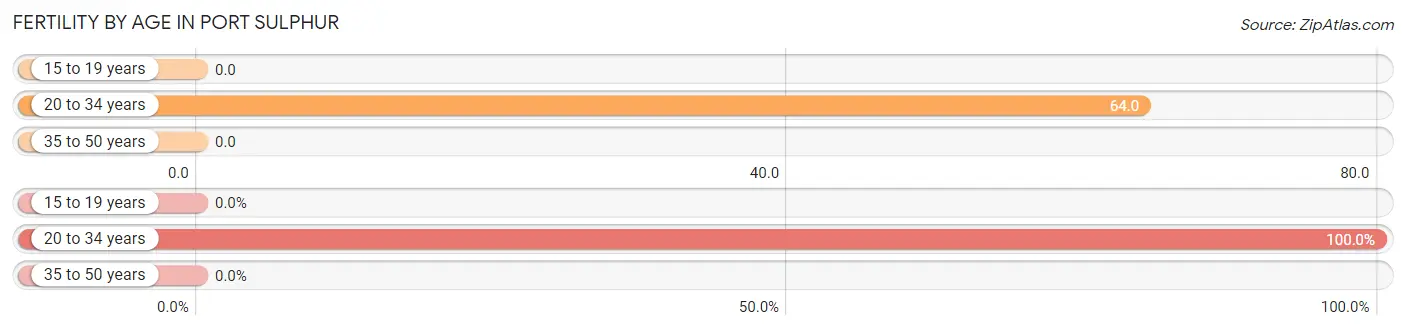
| Age Bracket | Women with Births | Births / 1,000 Women |
| 15 to 19 years | 0 (0.0%) | 0.0 |
| 20 to 34 years | 9 (100.0%) | 64.0 |
| 35 to 50 years | 0 (0.0%) | 0.0 |
| Total | 9 (100.0%) | 28.0 |
Fertility by Age by Marriage Status in Port Sulphur
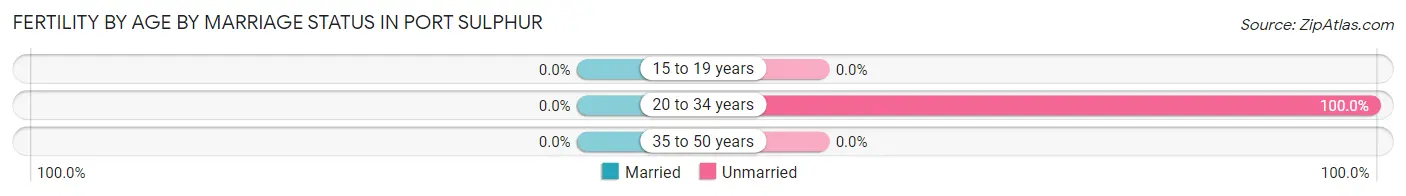
| Age Bracket | Married | Unmarried |
| 15 to 19 years | 0 (0.0%) | 0 (0.0%) |
| 20 to 34 years | 0 (0.0%) | 9 (100.0%) |
| 35 to 50 years | 0 (0.0%) | 0 (0.0%) |
| Total | 0 (0.0%) | 9 (100.0%) |
Fertility by Education in Port Sulphur
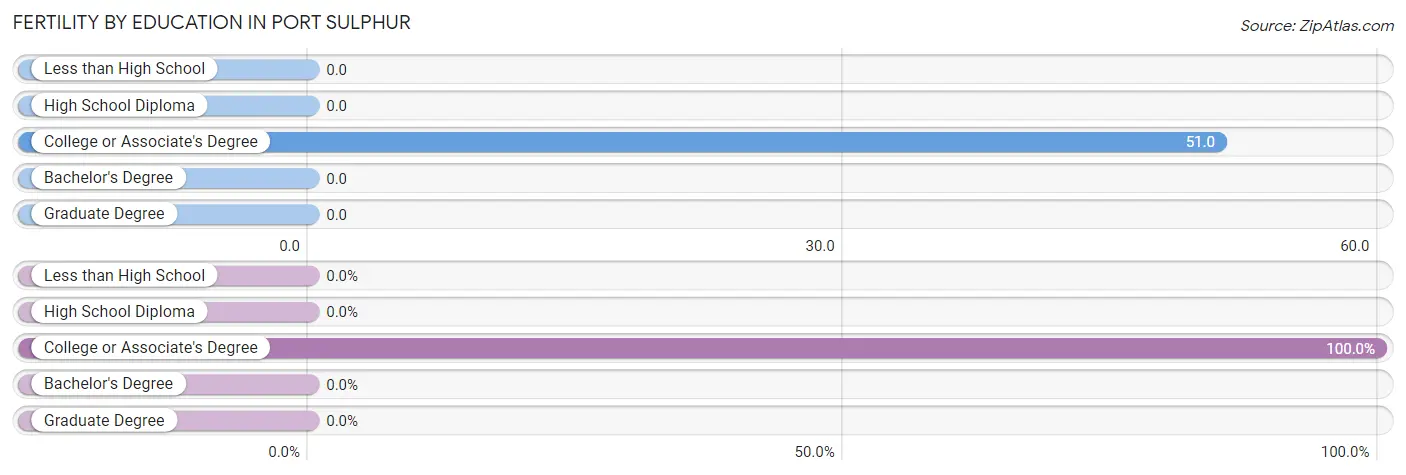
| Educational Attainment | Women with Births | Births / 1,000 Women |
| Less than High School | 0 (0.0%) | 0.0 |
| High School Diploma | 0 (0.0%) | 0.0 |
| College or Associate's Degree | 9 (100.0%) | 51.0 |
| Bachelor's Degree | 0 (0.0%) | 0.0 |
| Graduate Degree | 0 (0.0%) | 0.0 |
| Total | 9 (100.0%) | 28.0 |
Fertility by Education by Marriage Status in Port Sulphur
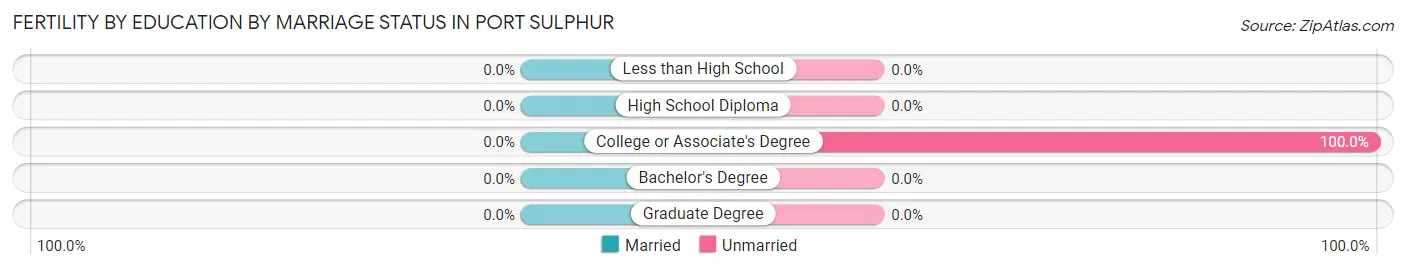
| Educational Attainment | Married | Unmarried |
| Less than High School | 0 (0.0%) | 0 (0.0%) |
| High School Diploma | 0 (0.0%) | 0 (0.0%) |
| College or Associate's Degree | 0 (0.0%) | 9 (100.0%) |
| Bachelor's Degree | 0 (0.0%) | 0 (0.0%) |
| Graduate Degree | 0 (0.0%) | 0 (0.0%) |
| Total | 0 (0.0%) | 9 (100.0%) |
Employment Characteristics in Port Sulphur
Employment by Class of Employer in Port Sulphur
Among the 510 employed individuals in Port Sulphur, private company employees (209 | 41.0%), local government employees (151 | 29.6%), and state government employees (125 | 24.5%) make up the most common classes of employment.
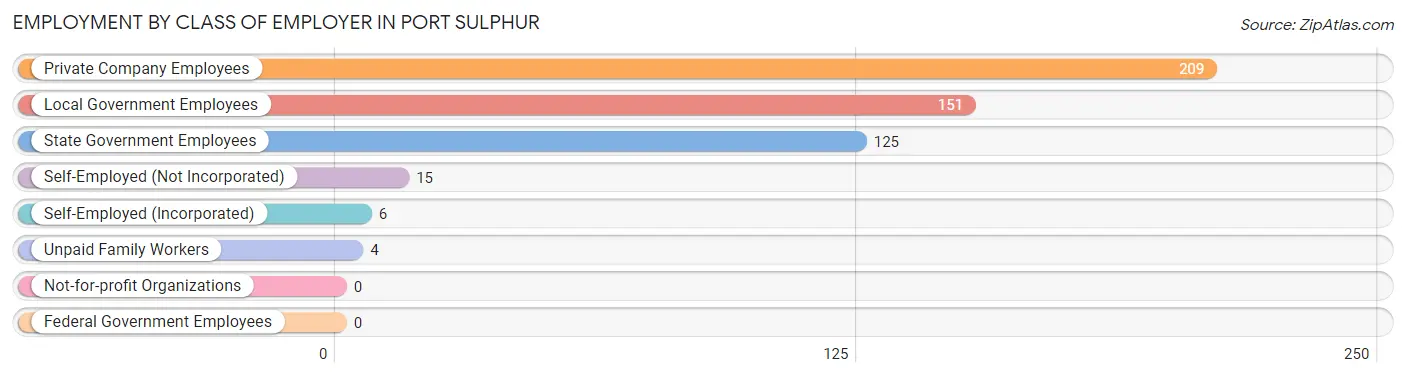
| Employer Class | # Employees | % Employees |
| Private Company Employees | 209 | 41.0% |
| Self-Employed (Incorporated) | 6 | 1.2% |
| Self-Employed (Not Incorporated) | 15 | 2.9% |
| Not-for-profit Organizations | 0 | 0.0% |
| Local Government Employees | 151 | 29.6% |
| State Government Employees | 125 | 24.5% |
| Federal Government Employees | 0 | 0.0% |
| Unpaid Family Workers | 4 | 0.8% |
| Total | 510 | 100.0% |
Employment Status by Age in Port Sulphur
According to the labor force statistics for Port Sulphur, out of the total population over 16 years of age (1,114), 57.5% or 641 individuals are in the labor force, with 20.3% or 130 of them unemployed. The age group with the highest labor force participation rate is 25 to 29 years, with 99.0% or 96 individuals in the labor force. Within the labor force, the 20 to 24 years age range has the highest percentage of unemployed individuals, with 94.3% or 82 of them being unemployed.
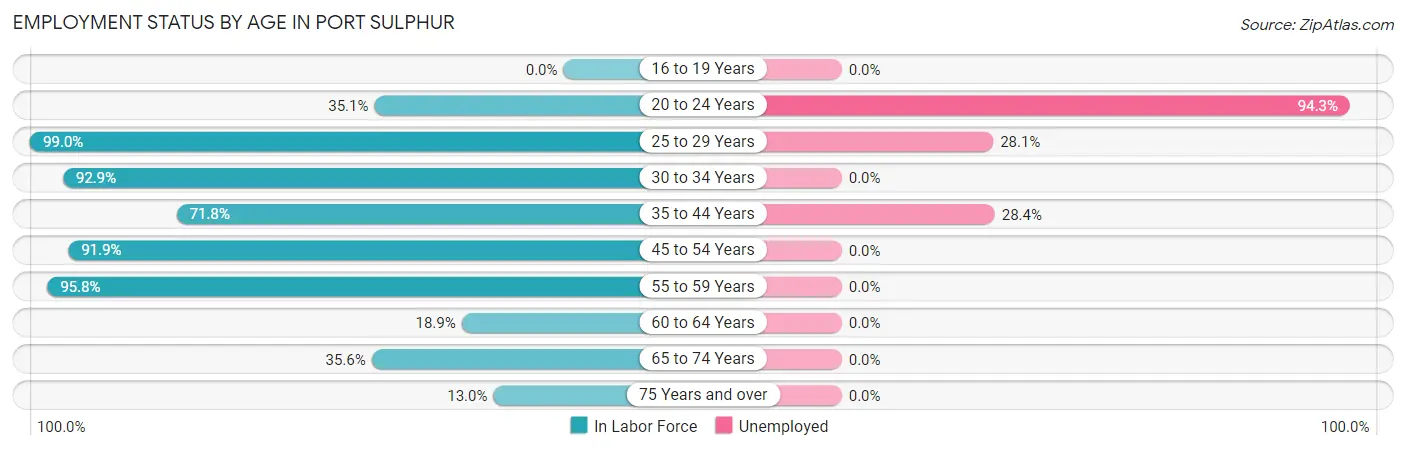
| Age Bracket | In Labor Force | Unemployed |
| 16 to 19 Years | 0 (0.0%) | 0 (0.0%) |
| 20 to 24 Years | 87 (35.1%) | 82 (94.3%) |
| 25 to 29 Years | 96 (99.0%) | 27 (28.1%) |
| 30 to 34 Years | 65 (92.9%) | 0 (0.0%) |
| 35 to 44 Years | 74 (71.8%) | 21 (28.4%) |
| 45 to 54 Years | 228 (91.9%) | 0 (0.0%) |
| 55 to 59 Years | 23 (95.8%) | 0 (0.0%) |
| 60 to 64 Years | 30 (18.9%) | 0 (0.0%) |
| 65 to 74 Years | 26 (35.6%) | 0 (0.0%) |
| 75 Years and over | 12 (13.0%) | 0 (0.0%) |
| Total | 641 (57.5%) | 130 (20.3%) |
Employment Status by Educational Attainment in Port Sulphur
According to labor force statistics for Port Sulphur, 73.6% of individuals (516) out of the total population between 25 and 64 years of age (701) are in the labor force, with 9.3% or 48 of them being unemployed. The group with the highest labor force participation rate are those with the educational attainment of bachelor's degree or higher, with 99.1% or 113 individuals in the labor force. Within the labor force, individuals with less than high school education have the highest percentage of unemployment, with 42.0% or 21 of them being unemployed.
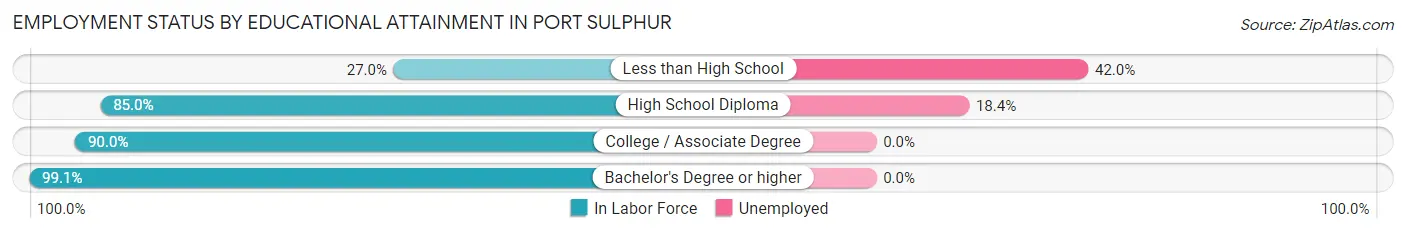
| Educational Attainment | In Labor Force | Unemployed |
| Less than High School | 50 (27.0%) | 78 (42.0%) |
| High School Diploma | 147 (85.0%) | 32 (18.4%) |
| College / Associate Degree | 206 (90.0%) | 0 (0.0%) |
| Bachelor's Degree or higher | 113 (99.1%) | 0 (0.0%) |
| Total | 516 (73.6%) | 65 (9.3%) |
Employment Occupations by Sex in Port Sulphur
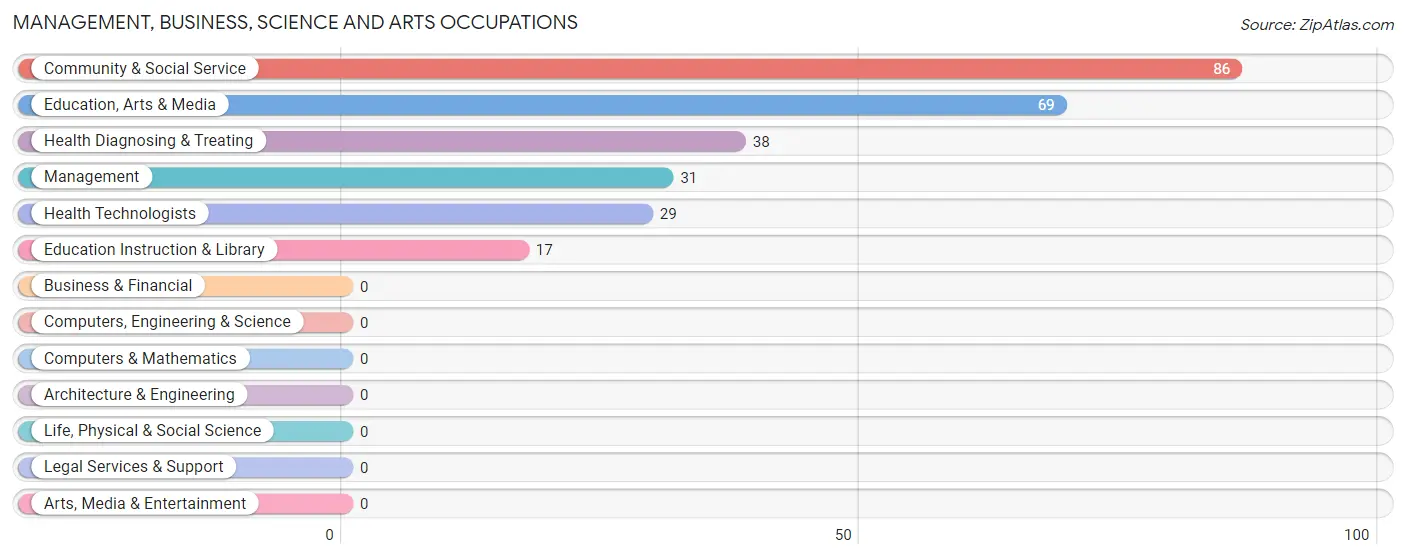
Management, Business, Science and Arts Occupations
The most common Management, Business, Science and Arts occupations in Port Sulphur are Community & Social Service (86 | 16.8%), Education, Arts & Media (69 | 13.5%), Health Diagnosing & Treating (38 | 7.4%), Management (31 | 6.1%), and Health Technologists (29 | 5.7%).
Management, Business, Science and Arts Occupations by Sex
Within the Management, Business, Science and Arts occupations in Port Sulphur, the most male-oriented occupations are Management (100.0%), Education Instruction & Library (94.1%), and Community & Social Service (19.8%), while the most female-oriented occupations are Health Diagnosing & Treating (100.0%), Health Technologists (100.0%), and Education, Arts & Media (98.6%).
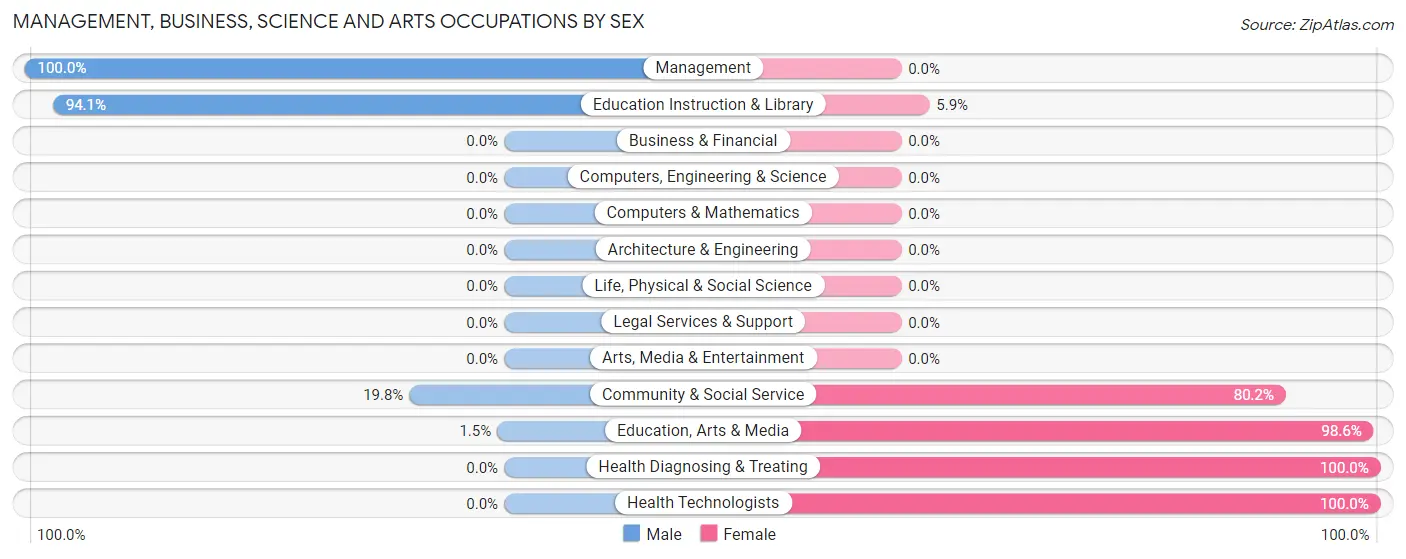
| Occupation | Male | Female |
| Management | 31 (100.0%) | 0 (0.0%) |
| Business & Financial | 0 (0.0%) | 0 (0.0%) |
| Computers, Engineering & Science | 0 (0.0%) | 0 (0.0%) |
| Computers & Mathematics | 0 (0.0%) | 0 (0.0%) |
| Architecture & Engineering | 0 (0.0%) | 0 (0.0%) |
| Life, Physical & Social Science | 0 (0.0%) | 0 (0.0%) |
| Community & Social Service | 17 (19.8%) | 69 (80.2%) |
| Education, Arts & Media | 1 (1.5%) | 68 (98.6%) |
| Legal Services & Support | 0 (0.0%) | 0 (0.0%) |
| Education Instruction & Library | 16 (94.1%) | 1 (5.9%) |
| Arts, Media & Entertainment | 0 (0.0%) | 0 (0.0%) |
| Health Diagnosing & Treating | 0 (0.0%) | 38 (100.0%) |
| Health Technologists | 0 (0.0%) | 29 (100.0%) |
| Total (Category) | 48 (31.0%) | 107 (69.0%) |
| Total (Overall) | 254 (49.7%) | 257 (50.3%) |
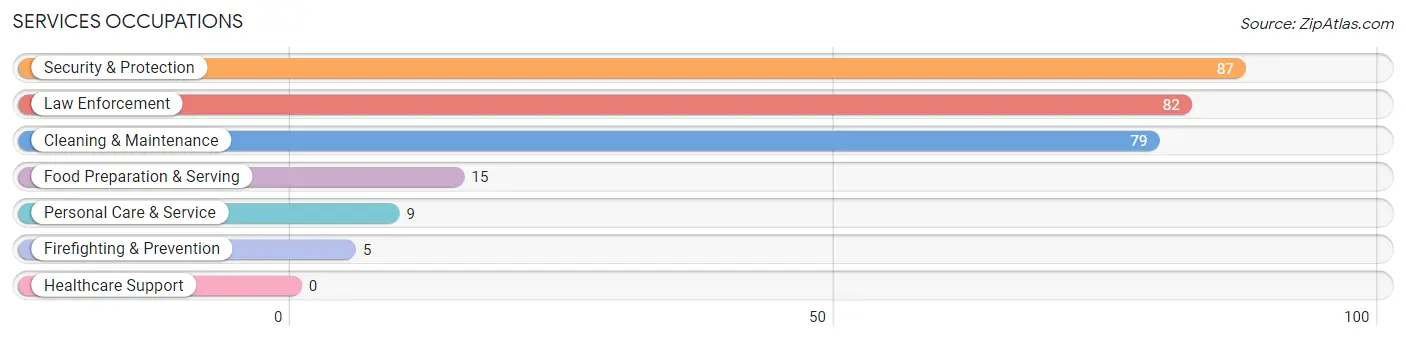
Services Occupations
The most common Services occupations in Port Sulphur are Security & Protection (87 | 17.0%), Law Enforcement (82 | 16.1%), Cleaning & Maintenance (79 | 15.5%), Food Preparation & Serving (15 | 2.9%), and Personal Care & Service (9 | 1.8%).
Services Occupations by Sex
Within the Services occupations in Port Sulphur, the most male-oriented occupations are Security & Protection (100.0%), Firefighting & Prevention (100.0%), and Law Enforcement (100.0%), while the most female-oriented occupations are Food Preparation & Serving (100.0%), Personal Care & Service (100.0%), and Cleaning & Maintenance (75.9%).
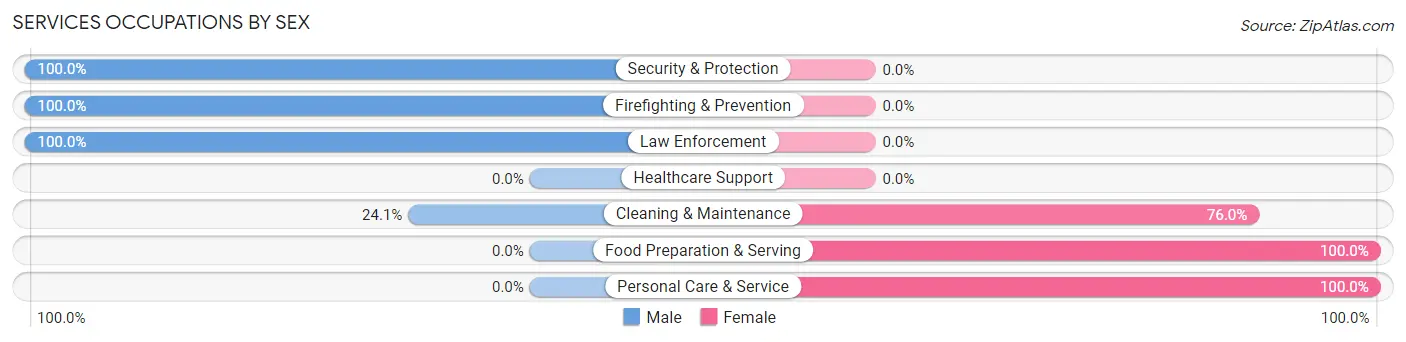
| Occupation | Male | Female |
| Healthcare Support | 0 (0.0%) | 0 (0.0%) |
| Security & Protection | 87 (100.0%) | 0 (0.0%) |
| Firefighting & Prevention | 5 (100.0%) | 0 (0.0%) |
| Law Enforcement | 82 (100.0%) | 0 (0.0%) |
| Food Preparation & Serving | 0 (0.0%) | 15 (100.0%) |
| Cleaning & Maintenance | 19 (24.0%) | 60 (75.9%) |
| Personal Care & Service | 0 (0.0%) | 9 (100.0%) |
| Total (Category) | 106 (55.8%) | 84 (44.2%) |
| Total (Overall) | 254 (49.7%) | 257 (50.3%) |
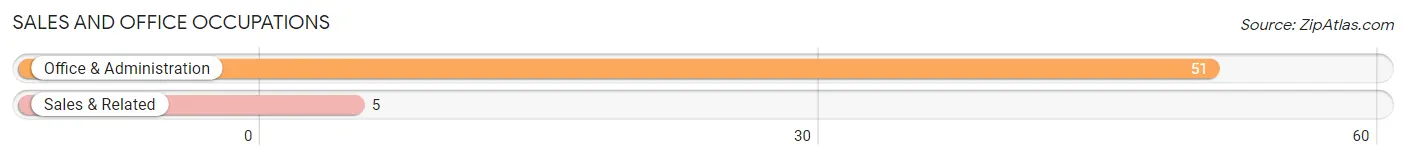
Sales and Office Occupations
The most common Sales and Office occupations in Port Sulphur are Office & Administration (51 | 10.0%), and Sales & Related (5 | 1.0%).
Sales and Office Occupations by Sex
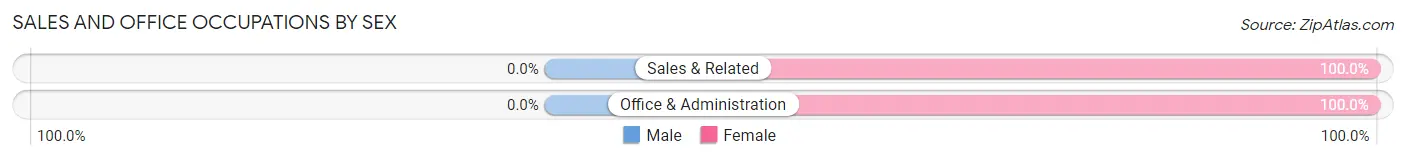
| Occupation | Male | Female |
| Sales & Related | 0 (0.0%) | 5 (100.0%) |
| Office & Administration | 0 (0.0%) | 51 (100.0%) |
| Total (Category) | 0 (0.0%) | 56 (100.0%) |
| Total (Overall) | 254 (49.7%) | 257 (50.3%) |
Natural Resources, Construction and Maintenance Occupations
The most common Natural Resources, Construction and Maintenance occupations in Port Sulphur are Construction & Extraction (65 | 12.7%), and Farming, Fishing & Forestry (16 | 3.1%).
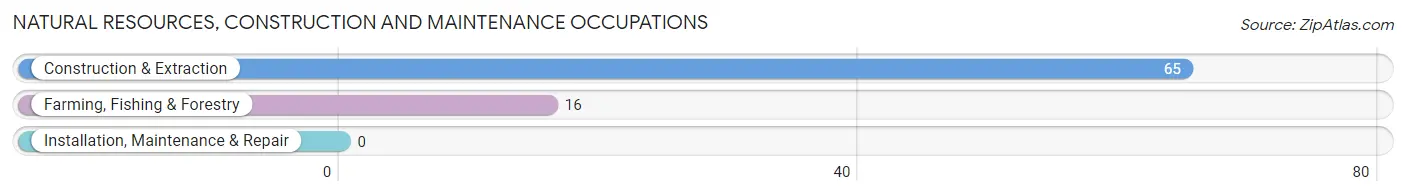
Natural Resources, Construction and Maintenance Occupations by Sex
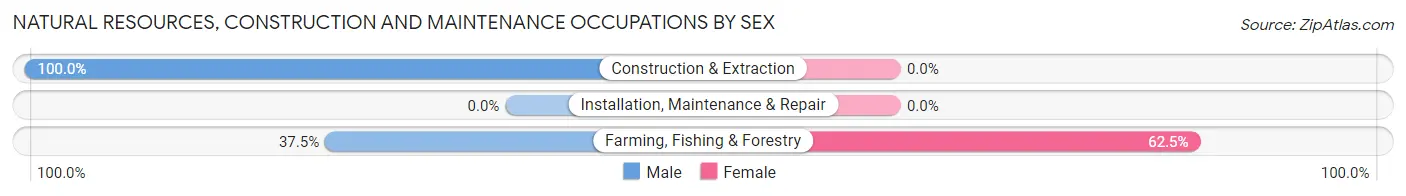
| Occupation | Male | Female |
| Farming, Fishing & Forestry | 6 (37.5%) | 10 (62.5%) |
| Construction & Extraction | 65 (100.0%) | 0 (0.0%) |
| Installation, Maintenance & Repair | 0 (0.0%) | 0 (0.0%) |
| Total (Category) | 71 (87.6%) | 10 (12.3%) |
| Total (Overall) | 254 (49.7%) | 257 (50.3%) |
Production, Transportation and Moving Occupations
The most common Production, Transportation and Moving occupations in Port Sulphur are Production (24 | 4.7%), and Material Moving (5 | 1.0%).
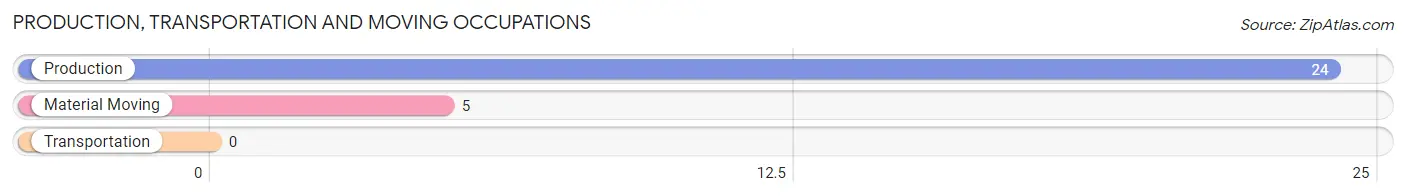
Production, Transportation and Moving Occupations by Sex
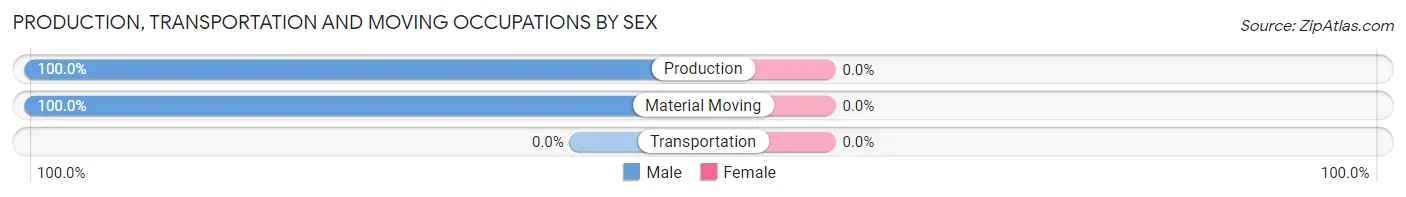
| Occupation | Male | Female |
| Production | 24 (100.0%) | 0 (0.0%) |
| Transportation | 0 (0.0%) | 0 (0.0%) |
| Material Moving | 5 (100.0%) | 0 (0.0%) |
| Total (Category) | 29 (100.0%) | 0 (0.0%) |
| Total (Overall) | 254 (49.7%) | 257 (50.3%) |
Employment Industries by Sex in Port Sulphur
Employment Industries in Port Sulphur
The major employment industries in Port Sulphur include Public Administration (164 | 32.1%), Educational Services (85 | 16.6%), Accommodation & Food Services (75 | 14.7%), Utilities (65 | 12.7%), and Health Care & Social Assistance (38 | 7.4%).
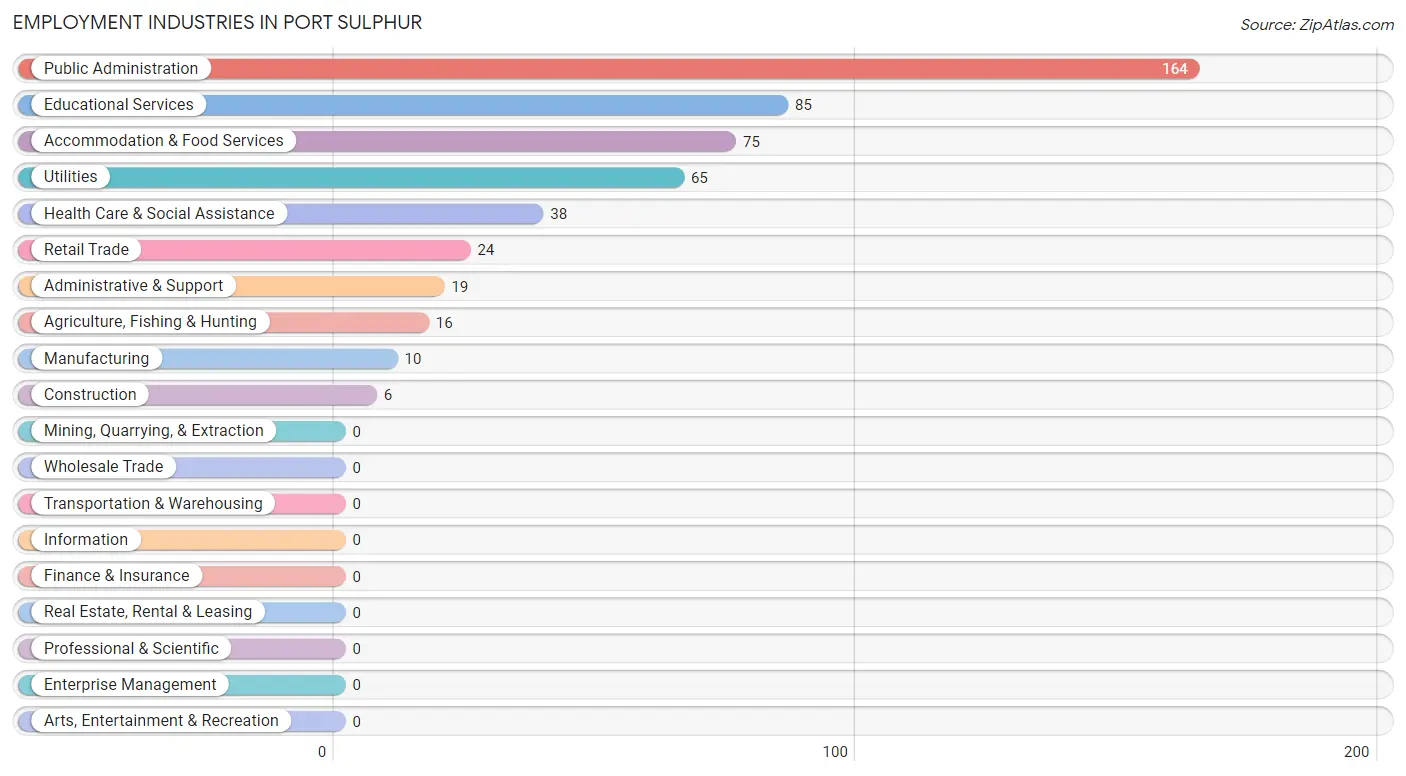
Employment Industries by Sex in Port Sulphur
The Port Sulphur industries that see more men than women are Construction (100.0%), Manufacturing (100.0%), and Utilities (100.0%), whereas the industries that tend to have a higher number of women are Health Care & Social Assistance (100.0%), Accommodation & Food Services (100.0%), and Educational Services (81.2%).
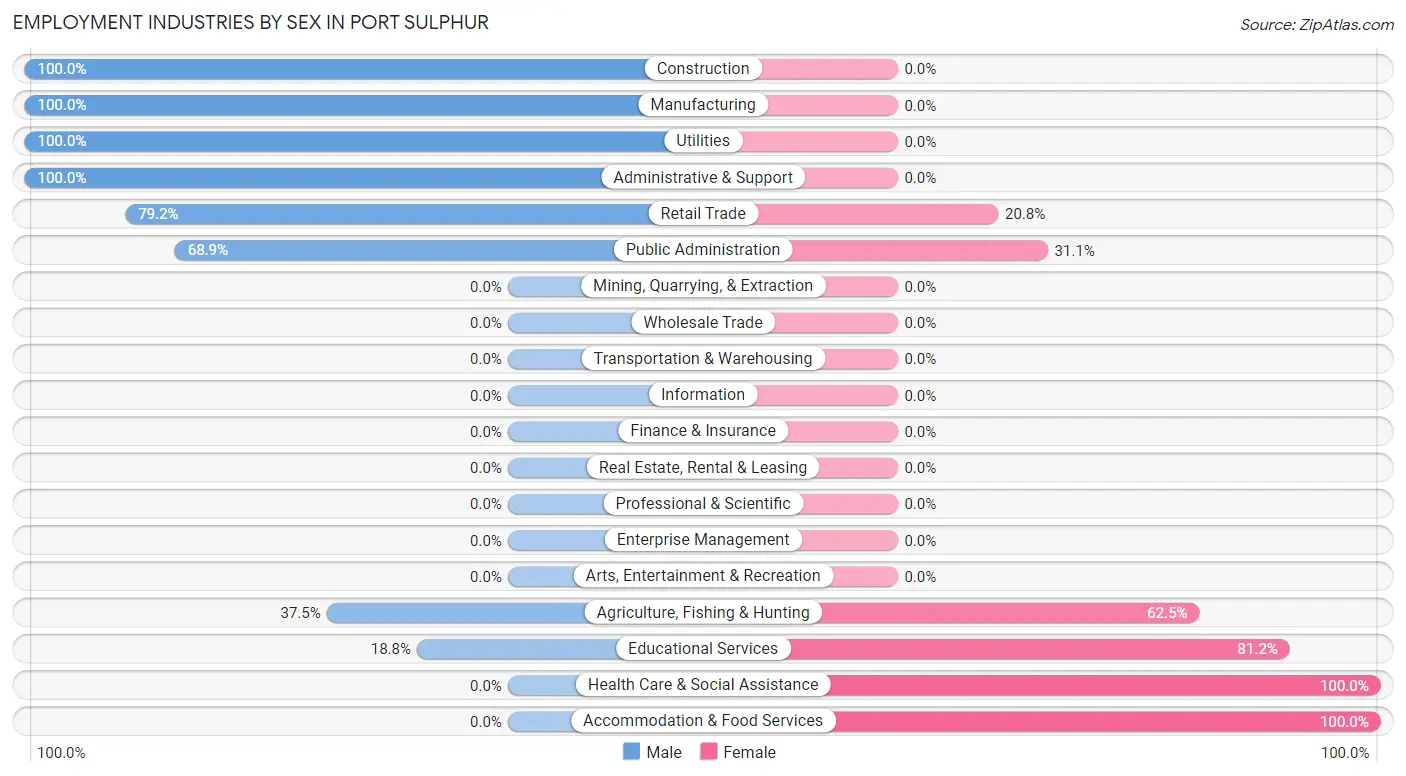
| Industry | Male | Female |
| Agriculture, Fishing & Hunting | 6 (37.5%) | 10 (62.5%) |
| Mining, Quarrying, & Extraction | 0 (0.0%) | 0 (0.0%) |
| Construction | 6 (100.0%) | 0 (0.0%) |
| Manufacturing | 10 (100.0%) | 0 (0.0%) |
| Wholesale Trade | 0 (0.0%) | 0 (0.0%) |
| Retail Trade | 19 (79.2%) | 5 (20.8%) |
| Transportation & Warehousing | 0 (0.0%) | 0 (0.0%) |
| Utilities | 65 (100.0%) | 0 (0.0%) |
| Information | 0 (0.0%) | 0 (0.0%) |
| Finance & Insurance | 0 (0.0%) | 0 (0.0%) |
| Real Estate, Rental & Leasing | 0 (0.0%) | 0 (0.0%) |
| Professional & Scientific | 0 (0.0%) | 0 (0.0%) |
| Enterprise Management | 0 (0.0%) | 0 (0.0%) |
| Administrative & Support | 19 (100.0%) | 0 (0.0%) |
| Educational Services | 16 (18.8%) | 69 (81.2%) |
| Health Care & Social Assistance | 0 (0.0%) | 38 (100.0%) |
| Arts, Entertainment & Recreation | 0 (0.0%) | 0 (0.0%) |
| Accommodation & Food Services | 0 (0.0%) | 75 (100.0%) |
| Public Administration | 113 (68.9%) | 51 (31.1%) |
| Total | 254 (49.7%) | 257 (50.3%) |
Education in Port Sulphur
School Enrollment in Port Sulphur
The most common levels of schooling among the 337 students in Port Sulphur are middle school (191 | 56.7%), nursery / preschool (114 | 33.8%), and college / undergraduate (25 | 7.4%).
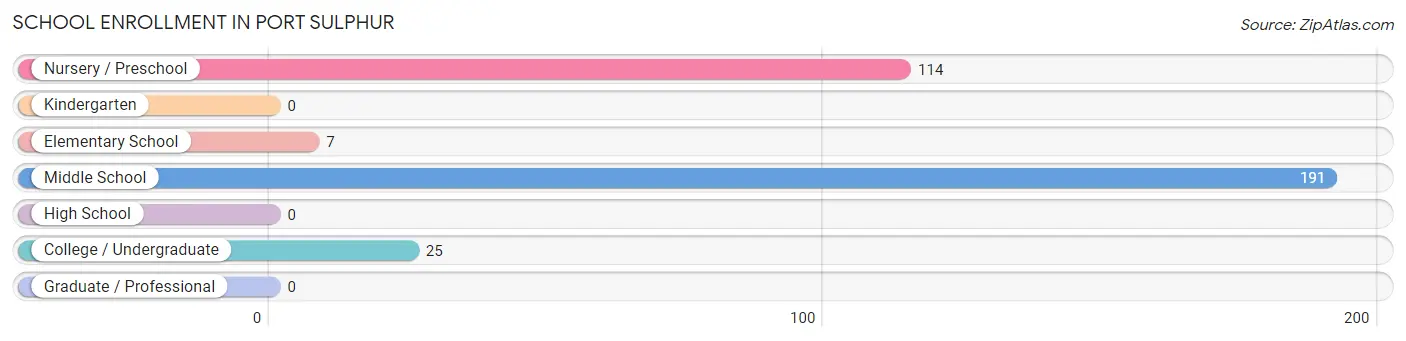
| School Level | # Students | % Students |
| Nursery / Preschool | 114 | 33.8% |
| Kindergarten | 0 | 0.0% |
| Elementary School | 7 | 2.1% |
| Middle School | 191 | 56.7% |
| High School | 0 | 0.0% |
| College / Undergraduate | 25 | 7.4% |
| Graduate / Professional | 0 | 0.0% |
| Total | 337 | 100.0% |
School Enrollment by Age by Funding Source in Port Sulphur
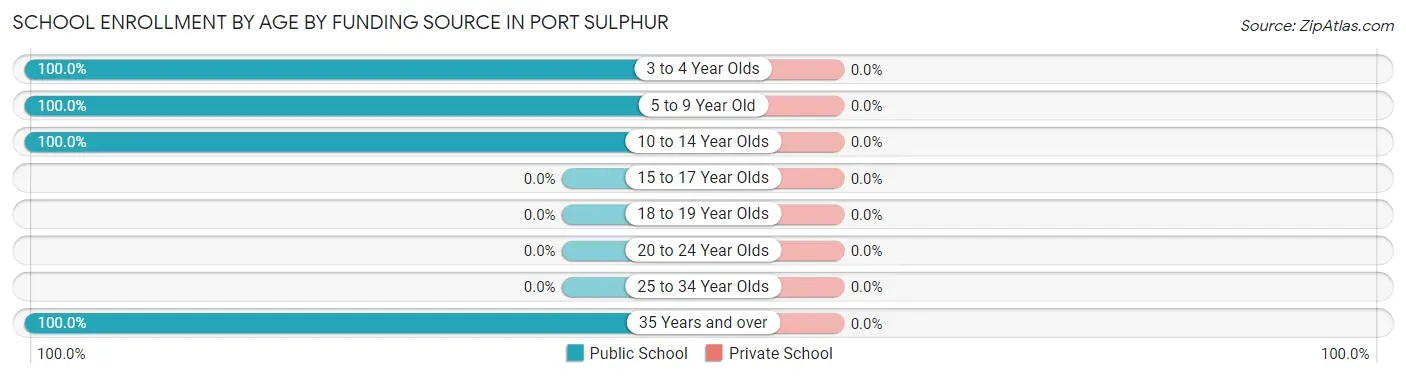
| Age Bracket | Public School | Private School |
| 3 to 4 Year Olds | 94 (100.0%) | 0 (0.0%) |
| 5 to 9 Year Old | 27 (100.0%) | 0 (0.0%) |
| 10 to 14 Year Olds | 191 (100.0%) | 0 (0.0%) |
| 15 to 17 Year Olds | 0 (0.0%) | 0 (0.0%) |
| 18 to 19 Year Olds | 0 (0.0%) | 0 (0.0%) |
| 20 to 24 Year Olds | 0 (0.0%) | 0 (0.0%) |
| 25 to 34 Year Olds | 0 (0.0%) | 0 (0.0%) |
| 35 Years and over | 25 (100.0%) | 0 (0.0%) |
| Total | 337 (100.0%) | 0 (0.0%) |
Educational Attainment by Field of Study in Port Sulphur
Psychology (68 | 59.7%), literature & languages (29 | 25.4%), and business (17 | 14.9%) are the most common fields of study among 114 individuals in Port Sulphur who have obtained a bachelor's degree or higher.
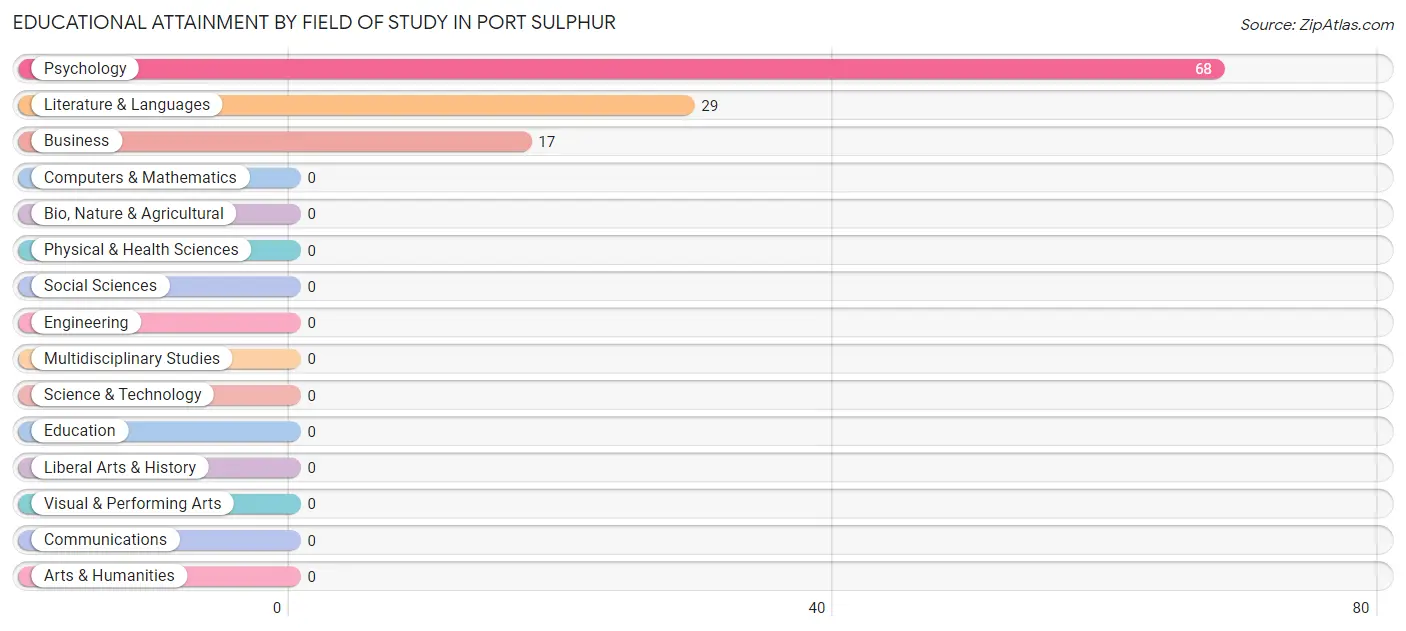
| Field of Study | # Graduates | % Graduates |
| Computers & Mathematics | 0 | 0.0% |
| Bio, Nature & Agricultural | 0 | 0.0% |
| Physical & Health Sciences | 0 | 0.0% |
| Psychology | 68 | 59.7% |
| Social Sciences | 0 | 0.0% |
| Engineering | 0 | 0.0% |
| Multidisciplinary Studies | 0 | 0.0% |
| Science & Technology | 0 | 0.0% |
| Business | 17 | 14.9% |
| Education | 0 | 0.0% |
| Literature & Languages | 29 | 25.4% |
| Liberal Arts & History | 0 | 0.0% |
| Visual & Performing Arts | 0 | 0.0% |
| Communications | 0 | 0.0% |
| Arts & Humanities | 0 | 0.0% |
| Total | 114 | 100.0% |
Transportation & Commute in Port Sulphur
Vehicle Availability by Sex in Port Sulphur
The most prevalent vehicle ownership categories in Port Sulphur are males with 3 vehicles (134, accounting for 52.8%) and females with 3 vehicles (106, making up 52.3%).
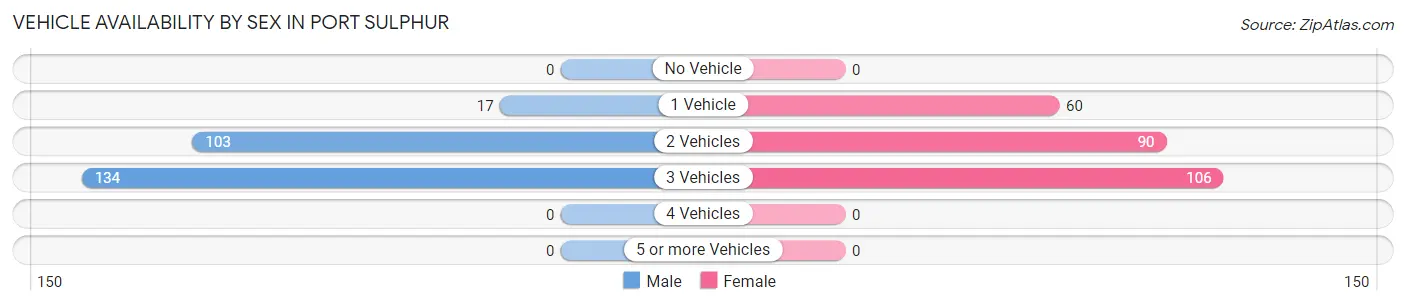
| Vehicles Available | Male | Female |
| No Vehicle | 0 (0.0%) | 0 (0.0%) |
| 1 Vehicle | 17 (6.7%) | 60 (23.4%) |
| 2 Vehicles | 103 (40.6%) | 90 (35.2%) |
| 3 Vehicles | 134 (52.8%) | 106 (41.4%) |
| 4 Vehicles | 0 (0.0%) | 0 (0.0%) |
| 5 or more Vehicles | 0 (0.0%) | 0 (0.0%) |
| Total | 254 (100.0%) | 256 (100.0%) |
Commute Time in Port Sulphur
The most frequently occuring commute durations in Port Sulphur are 10 to 14 minutes (143 commuters, 28.0%), 15 to 19 minutes (93 commuters, 18.2%), and 30 to 34 minutes (91 commuters, 17.8%).
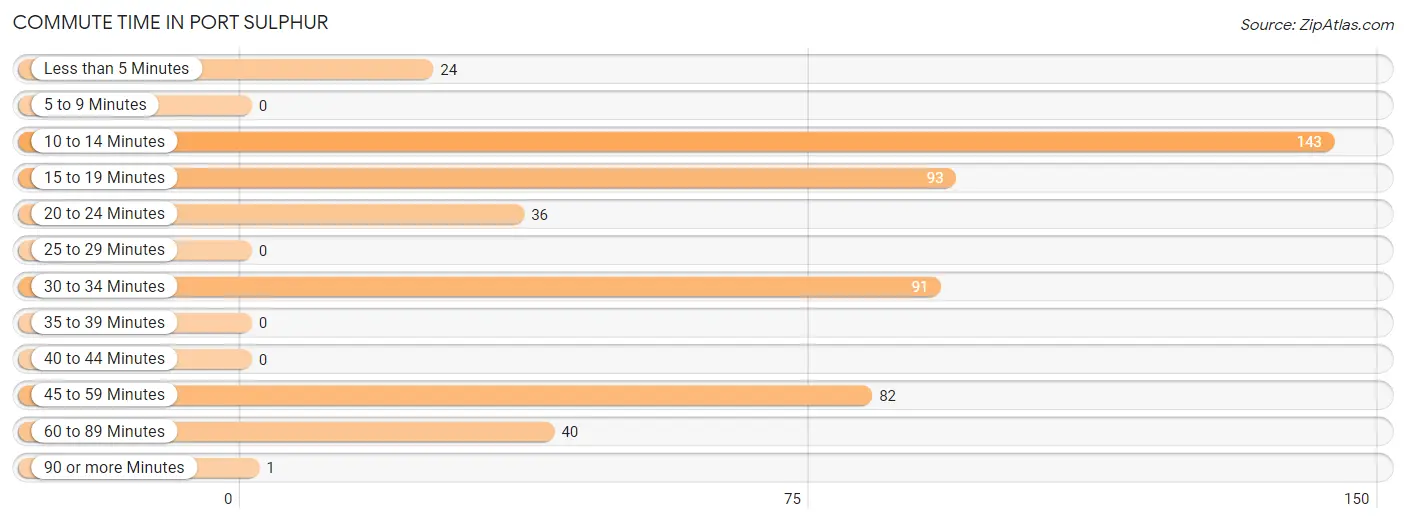
| Commute Time | # Commuters | % Commuters |
| Less than 5 Minutes | 24 | 4.7% |
| 5 to 9 Minutes | 0 | 0.0% |
| 10 to 14 Minutes | 143 | 28.0% |
| 15 to 19 Minutes | 93 | 18.2% |
| 20 to 24 Minutes | 36 | 7.1% |
| 25 to 29 Minutes | 0 | 0.0% |
| 30 to 34 Minutes | 91 | 17.8% |
| 35 to 39 Minutes | 0 | 0.0% |
| 40 to 44 Minutes | 0 | 0.0% |
| 45 to 59 Minutes | 82 | 16.1% |
| 60 to 89 Minutes | 40 | 7.8% |
| 90 or more Minutes | 1 | 0.2% |
Commute Time by Sex in Port Sulphur
The most common commute times in Port Sulphur are 45 to 59 minutes (82 commuters, 32.3%) for males and 15 to 19 minutes (83 commuters, 32.4%) for females.
| Commute Time | Male | Female |
| Less than 5 Minutes | 19 (7.5%) | 5 (1.9%) |
| 5 to 9 Minutes | 0 (0.0%) | 0 (0.0%) |
| 10 to 14 Minutes | 65 (25.6%) | 78 (30.5%) |
| 15 to 19 Minutes | 10 (3.9%) | 83 (32.4%) |
| 20 to 24 Minutes | 19 (7.5%) | 17 (6.6%) |
| 25 to 29 Minutes | 0 (0.0%) | 0 (0.0%) |
| 30 to 34 Minutes | 22 (8.7%) | 69 (27.0%) |
| 35 to 39 Minutes | 0 (0.0%) | 0 (0.0%) |
| 40 to 44 Minutes | 0 (0.0%) | 0 (0.0%) |
| 45 to 59 Minutes | 82 (32.3%) | 0 (0.0%) |
| 60 to 89 Minutes | 36 (14.2%) | 4 (1.6%) |
| 90 or more Minutes | 1 (0.4%) | 0 (0.0%) |
Time of Departure to Work by Sex in Port Sulphur
The most frequent times of departure to work in Port Sulphur are 7:00 AM to 7:29 AM (148, 58.3%) for males and 7:30 AM to 7:59 AM (147, 57.4%) for females.
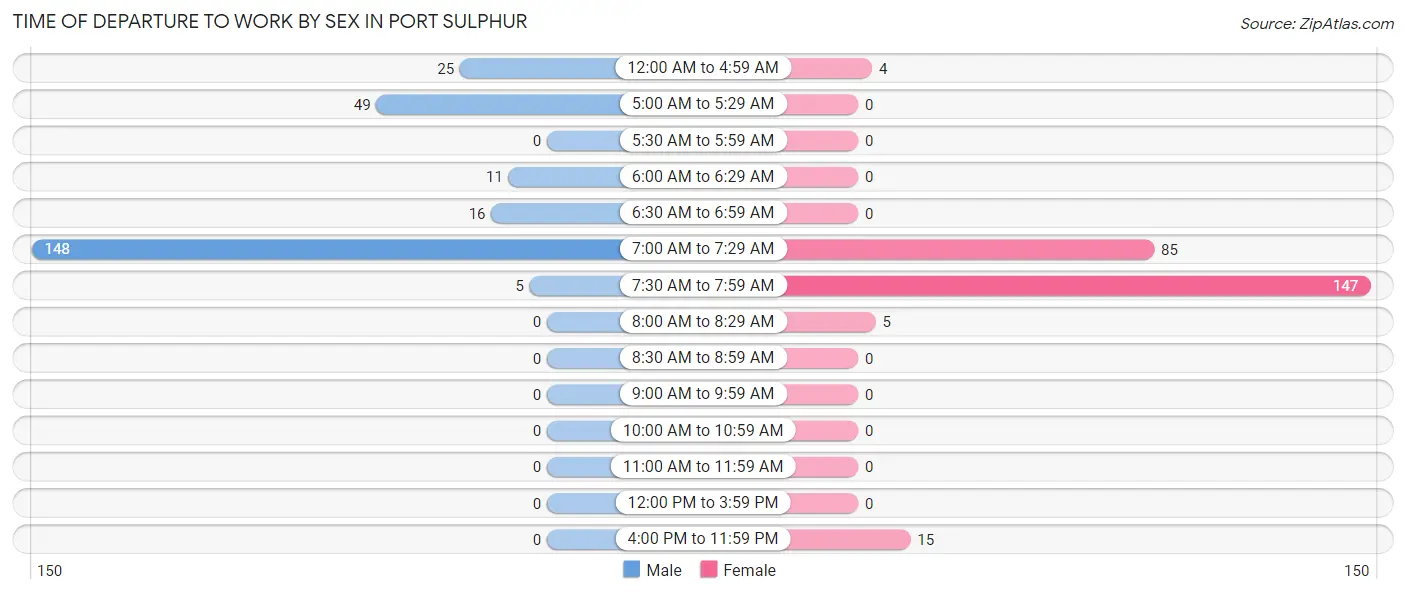
| Time of Departure | Male | Female |
| 12:00 AM to 4:59 AM | 25 (9.8%) | 4 (1.6%) |
| 5:00 AM to 5:29 AM | 49 (19.3%) | 0 (0.0%) |
| 5:30 AM to 5:59 AM | 0 (0.0%) | 0 (0.0%) |
| 6:00 AM to 6:29 AM | 11 (4.3%) | 0 (0.0%) |
| 6:30 AM to 6:59 AM | 16 (6.3%) | 0 (0.0%) |
| 7:00 AM to 7:29 AM | 148 (58.3%) | 85 (33.2%) |
| 7:30 AM to 7:59 AM | 5 (2.0%) | 147 (57.4%) |
| 8:00 AM to 8:29 AM | 0 (0.0%) | 5 (1.9%) |
| 8:30 AM to 8:59 AM | 0 (0.0%) | 0 (0.0%) |
| 9:00 AM to 9:59 AM | 0 (0.0%) | 0 (0.0%) |
| 10:00 AM to 10:59 AM | 0 (0.0%) | 0 (0.0%) |
| 11:00 AM to 11:59 AM | 0 (0.0%) | 0 (0.0%) |
| 12:00 PM to 3:59 PM | 0 (0.0%) | 0 (0.0%) |
| 4:00 PM to 11:59 PM | 0 (0.0%) | 15 (5.9%) |
| Total | 254 (100.0%) | 256 (100.0%) |
Housing Occupancy in Port Sulphur
Occupancy by Ownership in Port Sulphur
Of the total 527 dwellings in Port Sulphur, owner-occupied units account for 431 (81.8%), while renter-occupied units make up 96 (18.2%).
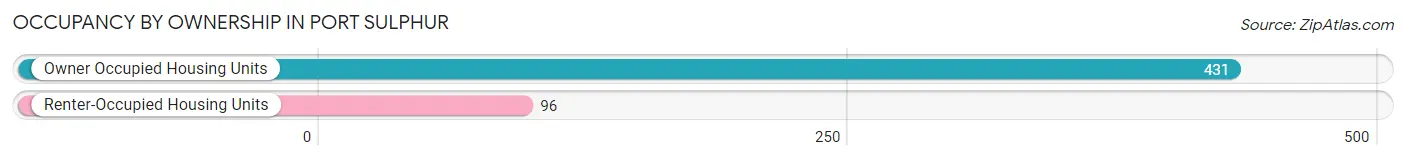
| Occupancy | # Housing Units | % Housing Units |
| Owner Occupied Housing Units | 431 | 81.8% |
| Renter-Occupied Housing Units | 96 | 18.2% |
| Total Occupied Housing Units | 527 | 100.0% |
Occupancy by Household Size in Port Sulphur
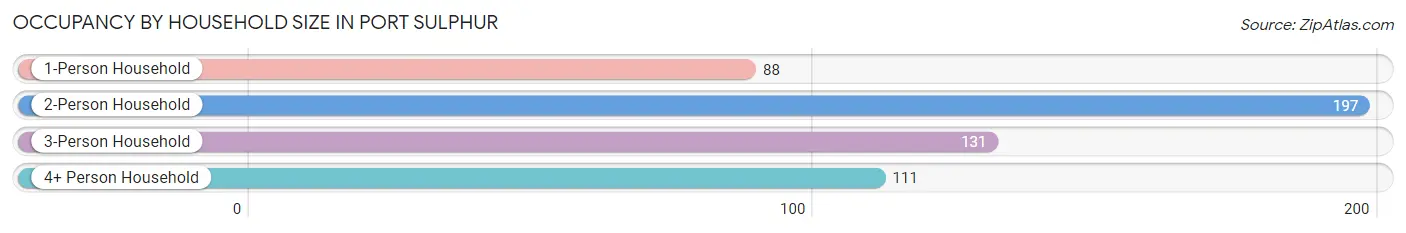
| Household Size | # Housing Units | % Housing Units |
| 1-Person Household | 88 | 16.7% |
| 2-Person Household | 197 | 37.4% |
| 3-Person Household | 131 | 24.9% |
| 4+ Person Household | 111 | 21.1% |
| Total Housing Units | 527 | 100.0% |
Occupancy by Ownership by Household Size in Port Sulphur
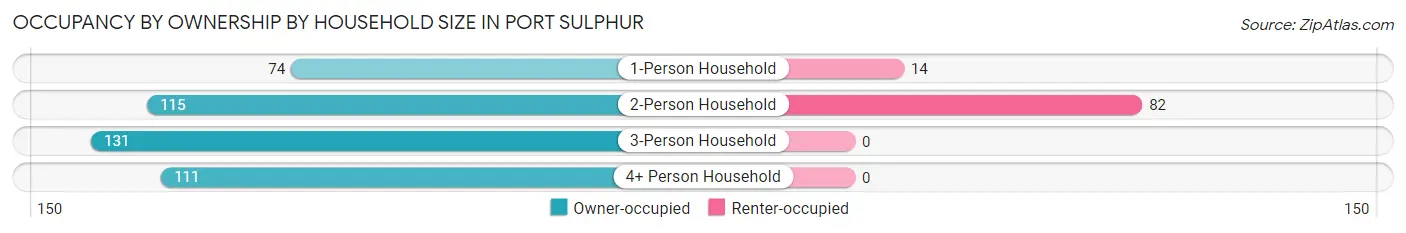
| Household Size | Owner-occupied | Renter-occupied |
| 1-Person Household | 74 (84.1%) | 14 (15.9%) |
| 2-Person Household | 115 (58.4%) | 82 (41.6%) |
| 3-Person Household | 131 (100.0%) | 0 (0.0%) |
| 4+ Person Household | 111 (100.0%) | 0 (0.0%) |
| Total Housing Units | 431 (81.8%) | 96 (18.2%) |
Occupancy by Educational Attainment in Port Sulphur
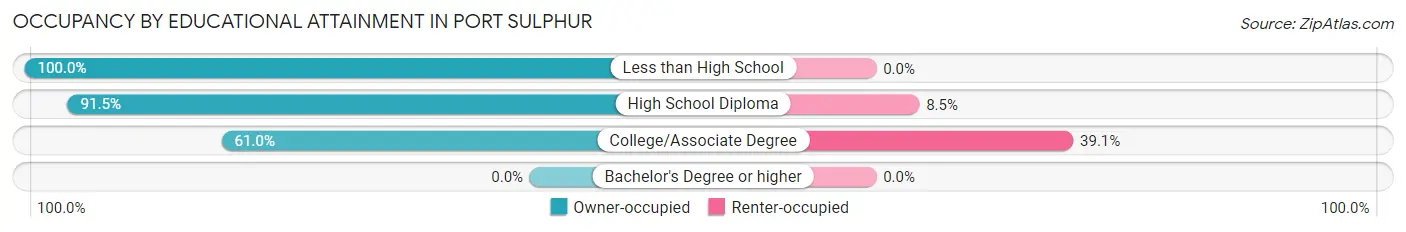
| Household Size | Owner-occupied | Renter-occupied |
| Less than High School | 153 (100.0%) | 0 (0.0%) |
| High School Diploma | 150 (91.5%) | 14 (8.5%) |
| College/Associate Degree | 128 (61.0%) | 82 (39.1%) |
| Bachelor's Degree or higher | 0 (0.0%) | 0 (0.0%) |
Occupancy by Age of Householder in Port Sulphur
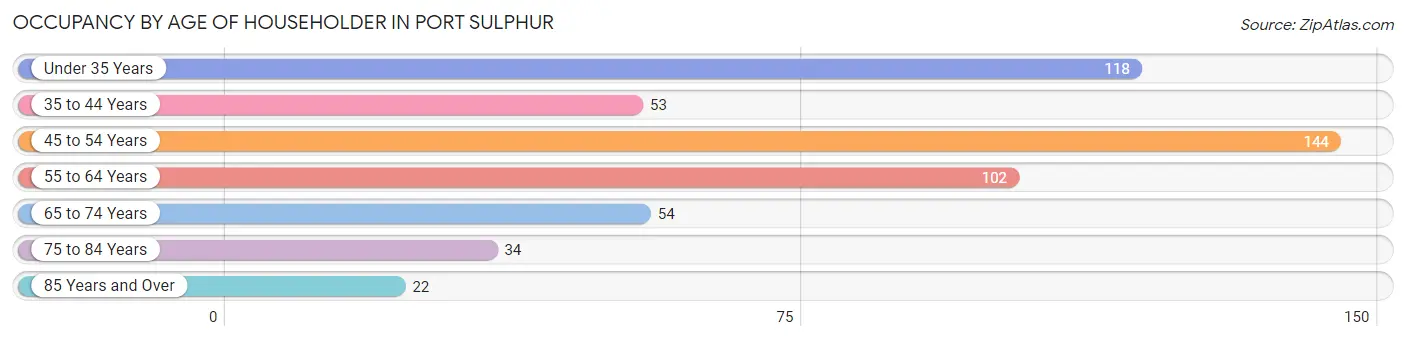
| Age Bracket | # Households | % Households |
| Under 35 Years | 118 | 22.4% |
| 35 to 44 Years | 53 | 10.1% |
| 45 to 54 Years | 144 | 27.3% |
| 55 to 64 Years | 102 | 19.4% |
| 65 to 74 Years | 54 | 10.2% |
| 75 to 84 Years | 34 | 6.5% |
| 85 Years and Over | 22 | 4.2% |
| Total | 527 | 100.0% |
Housing Finances in Port Sulphur
Median Income by Occupancy in Port Sulphur
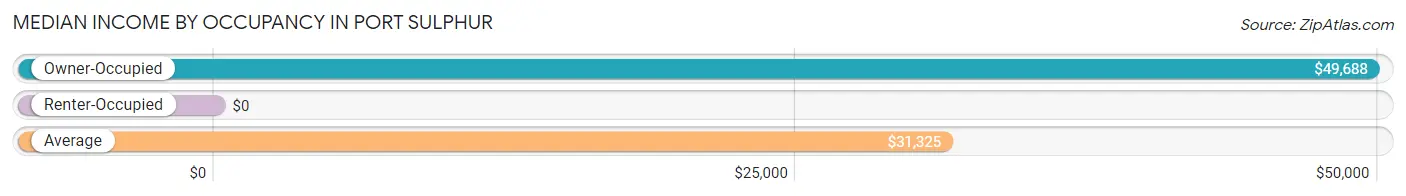
| Occupancy Type | # Households | Median Income |
| Owner-Occupied | 431 (81.8%) | $49,688 |
| Renter-Occupied | 96 (18.2%) | $0 |
| Average | 527 (100.0%) | $31,325 |
Occupancy by Householder Income Bracket in Port Sulphur
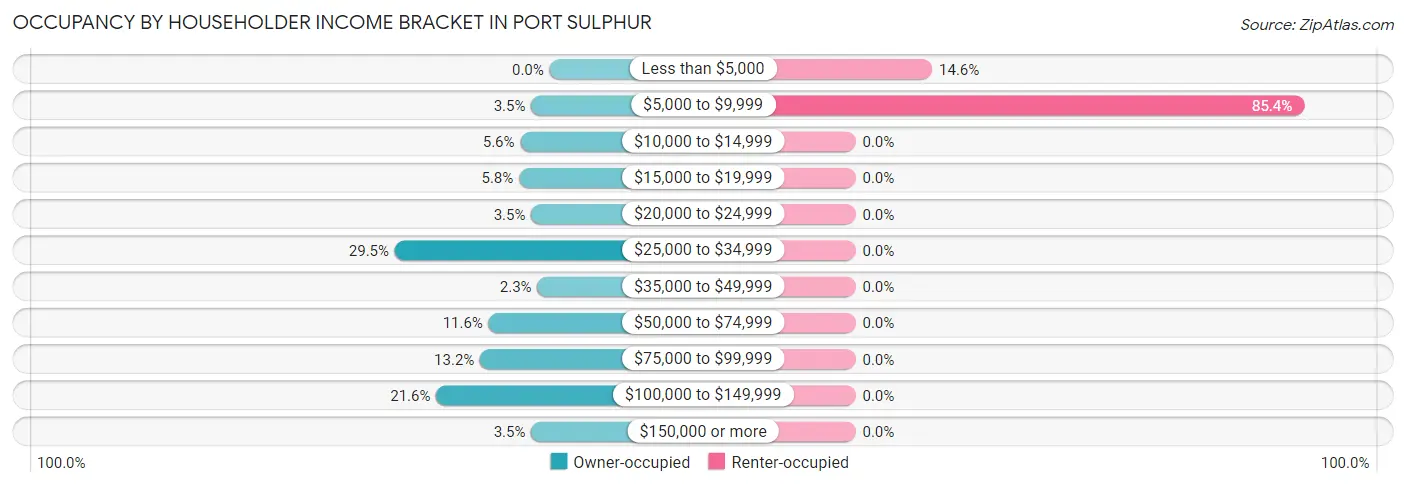
| Income Bracket | Owner-occupied | Renter-occupied |
| Less than $5,000 | 0 (0.0%) | 14 (14.6%) |
| $5,000 to $9,999 | 15 (3.5%) | 82 (85.4%) |
| $10,000 to $14,999 | 24 (5.6%) | 0 (0.0%) |
| $15,000 to $19,999 | 25 (5.8%) | 0 (0.0%) |
| $20,000 to $24,999 | 15 (3.5%) | 0 (0.0%) |
| $25,000 to $34,999 | 127 (29.5%) | 0 (0.0%) |
| $35,000 to $49,999 | 10 (2.3%) | 0 (0.0%) |
| $50,000 to $74,999 | 50 (11.6%) | 0 (0.0%) |
| $75,000 to $99,999 | 57 (13.2%) | 0 (0.0%) |
| $100,000 to $149,999 | 93 (21.6%) | 0 (0.0%) |
| $150,000 or more | 15 (3.5%) | 0 (0.0%) |
| Total | 431 (100.0%) | 96 (100.0%) |
Monthly Housing Cost Tiers in Port Sulphur
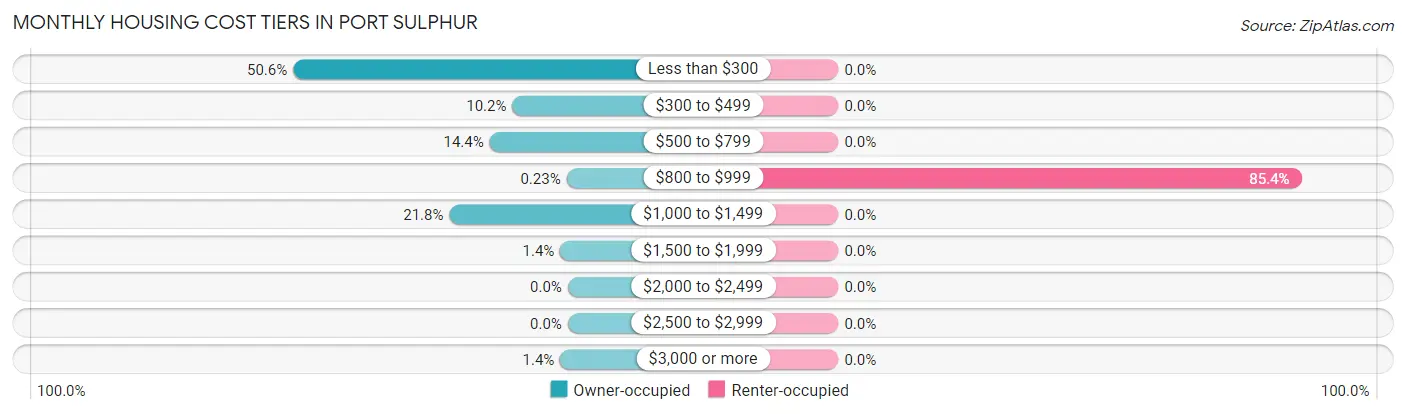
| Monthly Cost | Owner-occupied | Renter-occupied |
| Less than $300 | 218 (50.6%) | 0 (0.0%) |
| $300 to $499 | 44 (10.2%) | 0 (0.0%) |
| $500 to $799 | 62 (14.4%) | 0 (0.0%) |
| $800 to $999 | 1 (0.2%) | 82 (85.4%) |
| $1,000 to $1,499 | 94 (21.8%) | 0 (0.0%) |
| $1,500 to $1,999 | 6 (1.4%) | 0 (0.0%) |
| $2,000 to $2,499 | 0 (0.0%) | 0 (0.0%) |
| $2,500 to $2,999 | 0 (0.0%) | 0 (0.0%) |
| $3,000 or more | 6 (1.4%) | 0 (0.0%) |
| Total | 431 (100.0%) | 96 (100.0%) |
Physical Housing Characteristics in Port Sulphur
Housing Structures in Port Sulphur
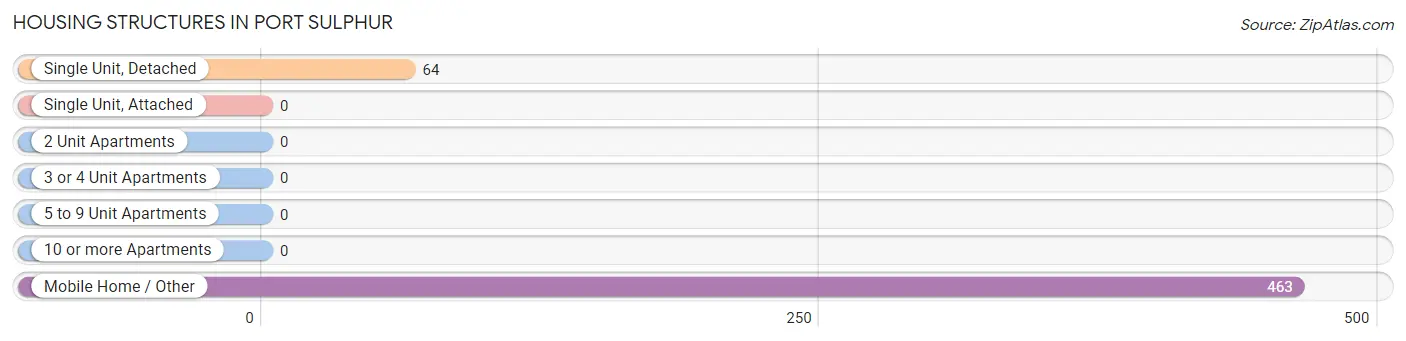
| Structure Type | # Housing Units | % Housing Units |
| Single Unit, Detached | 64 | 12.1% |
| Single Unit, Attached | 0 | 0.0% |
| 2 Unit Apartments | 0 | 0.0% |
| 3 or 4 Unit Apartments | 0 | 0.0% |
| 5 to 9 Unit Apartments | 0 | 0.0% |
| 10 or more Apartments | 0 | 0.0% |
| Mobile Home / Other | 463 | 87.9% |
| Total | 527 | 100.0% |
Housing Structures by Occupancy in Port Sulphur
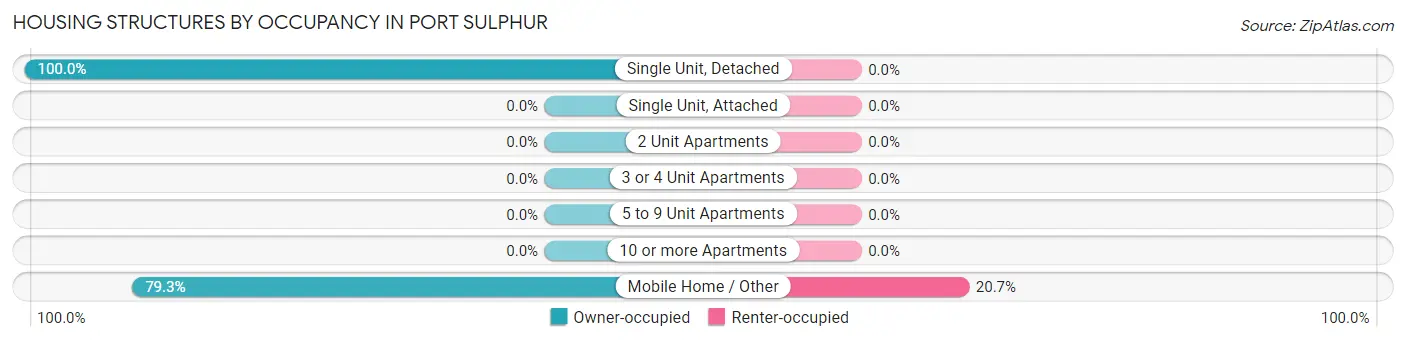
| Structure Type | Owner-occupied | Renter-occupied |
| Single Unit, Detached | 64 (100.0%) | 0 (0.0%) |
| Single Unit, Attached | 0 (0.0%) | 0 (0.0%) |
| 2 Unit Apartments | 0 (0.0%) | 0 (0.0%) |
| 3 or 4 Unit Apartments | 0 (0.0%) | 0 (0.0%) |
| 5 to 9 Unit Apartments | 0 (0.0%) | 0 (0.0%) |
| 10 or more Apartments | 0 (0.0%) | 0 (0.0%) |
| Mobile Home / Other | 367 (79.3%) | 96 (20.7%) |
| Total | 431 (81.8%) | 96 (18.2%) |
Housing Structures by Number of Rooms in Port Sulphur
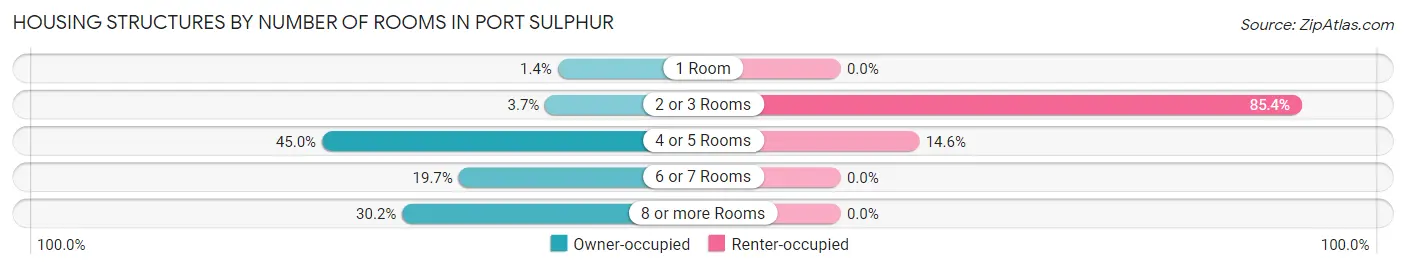
| Number of Rooms | Owner-occupied | Renter-occupied |
| 1 Room | 6 (1.4%) | 0 (0.0%) |
| 2 or 3 Rooms | 16 (3.7%) | 82 (85.4%) |
| 4 or 5 Rooms | 194 (45.0%) | 14 (14.6%) |
| 6 or 7 Rooms | 85 (19.7%) | 0 (0.0%) |
| 8 or more Rooms | 130 (30.2%) | 0 (0.0%) |
| Total | 431 (100.0%) | 96 (100.0%) |
Housing Structure by Heating Type in Port Sulphur
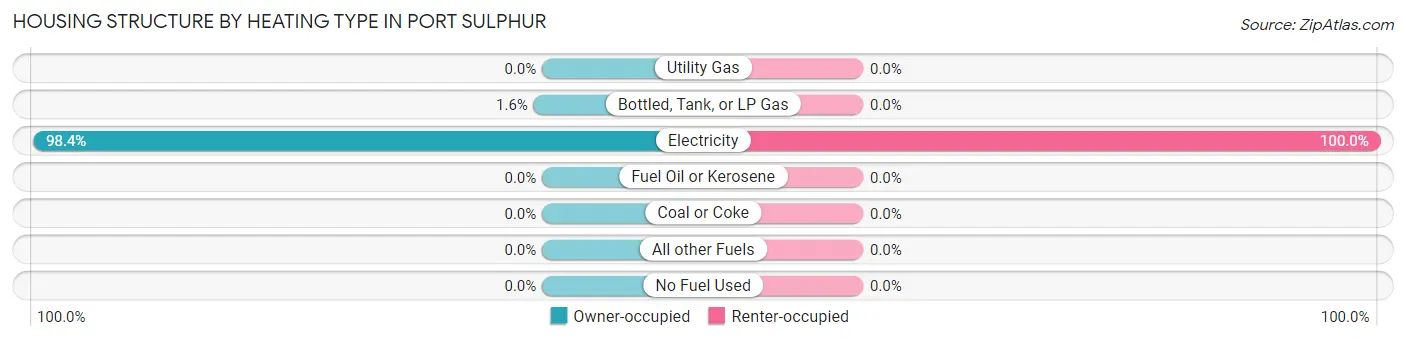
| Heating Type | Owner-occupied | Renter-occupied |
| Utility Gas | 0 (0.0%) | 0 (0.0%) |
| Bottled, Tank, or LP Gas | 7 (1.6%) | 0 (0.0%) |
| Electricity | 424 (98.4%) | 96 (100.0%) |
| Fuel Oil or Kerosene | 0 (0.0%) | 0 (0.0%) |
| Coal or Coke | 0 (0.0%) | 0 (0.0%) |
| All other Fuels | 0 (0.0%) | 0 (0.0%) |
| No Fuel Used | 0 (0.0%) | 0 (0.0%) |
| Total | 431 (100.0%) | 96 (100.0%) |
Household Vehicle Usage in Port Sulphur
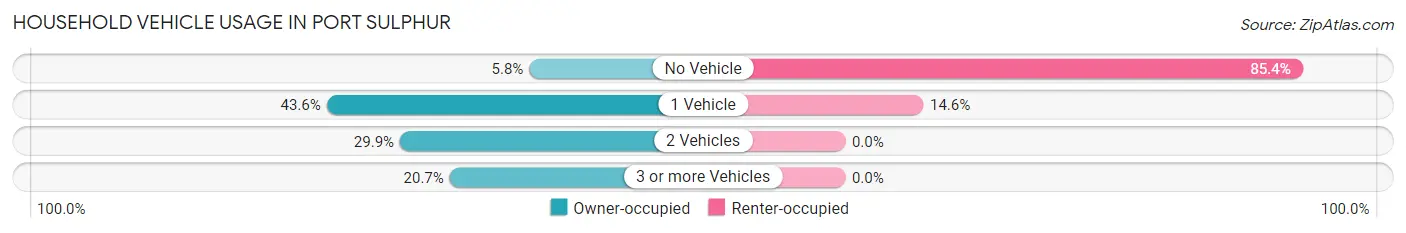
| Vehicles per Household | Owner-occupied | Renter-occupied |
| No Vehicle | 25 (5.8%) | 82 (85.4%) |
| 1 Vehicle | 188 (43.6%) | 14 (14.6%) |
| 2 Vehicles | 129 (29.9%) | 0 (0.0%) |
| 3 or more Vehicles | 89 (20.6%) | 0 (0.0%) |
| Total | 431 (100.0%) | 96 (100.0%) |
Real Estate & Mortgages in Port Sulphur
Real Estate and Mortgage Overview in Port Sulphur
| Characteristic | Without Mortgage | With Mortgage |
| Housing Units | 257 | 174 |
| Median Property Value | $83,900 | $88,400 |
| Median Household Income | $30,877 | $0 |
| Monthly Housing Costs | $209 | $6 |
| Real Estate Taxes | $199 | $67 |
Property Value by Mortgage Status in Port Sulphur
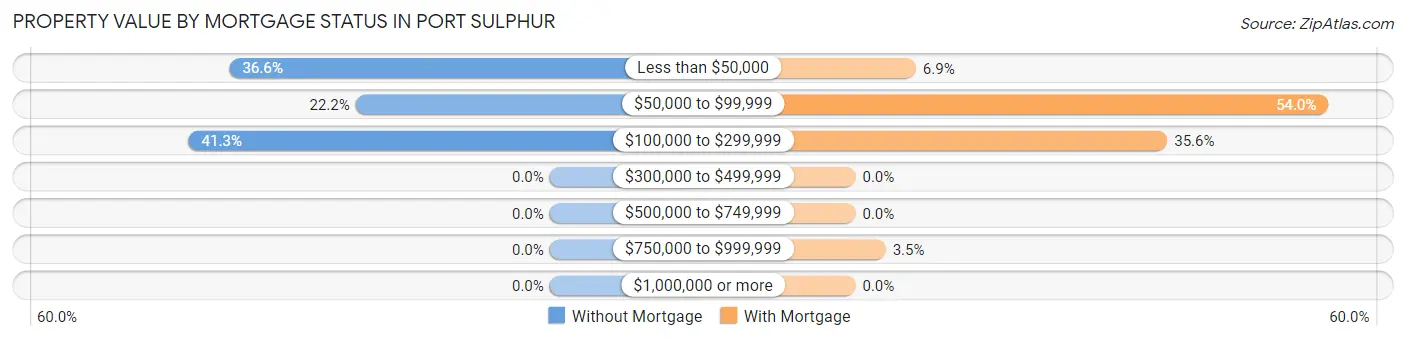
| Property Value | Without Mortgage | With Mortgage |
| Less than $50,000 | 94 (36.6%) | 12 (6.9%) |
| $50,000 to $99,999 | 57 (22.2%) | 94 (54.0%) |
| $100,000 to $299,999 | 106 (41.2%) | 62 (35.6%) |
| $300,000 to $499,999 | 0 (0.0%) | 0 (0.0%) |
| $500,000 to $749,999 | 0 (0.0%) | 0 (0.0%) |
| $750,000 to $999,999 | 0 (0.0%) | 6 (3.5%) |
| $1,000,000 or more | 0 (0.0%) | 0 (0.0%) |
| Total | 257 (100.0%) | 174 (100.0%) |
Household Income by Mortgage Status in Port Sulphur
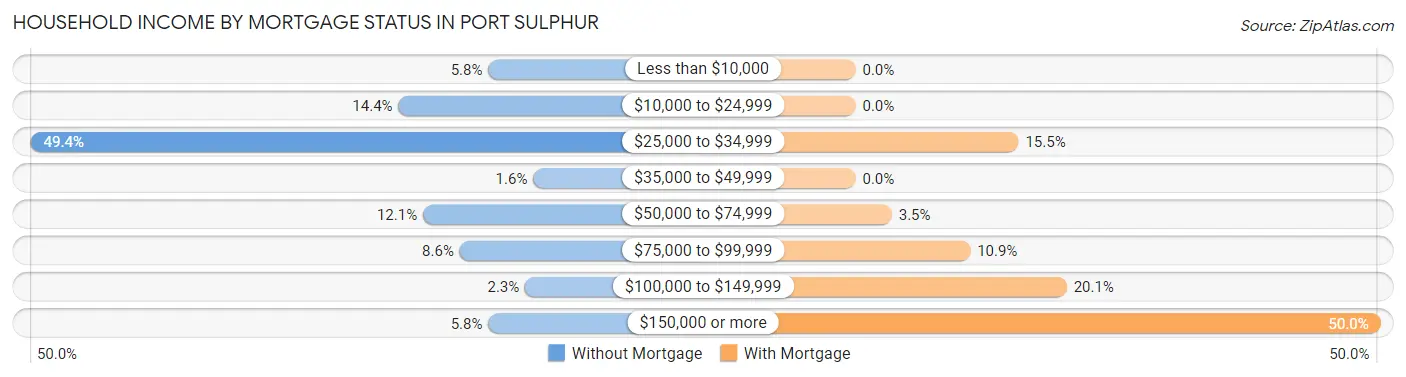
| Household Income | Without Mortgage | With Mortgage |
| Less than $10,000 | 15 (5.8%) | 0 (0.0%) |
| $10,000 to $24,999 | 37 (14.4%) | 0 (0.0%) |
| $25,000 to $34,999 | 127 (49.4%) | 27 (15.5%) |
| $35,000 to $49,999 | 4 (1.6%) | 0 (0.0%) |
| $50,000 to $74,999 | 31 (12.1%) | 6 (3.5%) |
| $75,000 to $99,999 | 22 (8.6%) | 19 (10.9%) |
| $100,000 to $149,999 | 6 (2.3%) | 35 (20.1%) |
| $150,000 or more | 15 (5.8%) | 87 (50.0%) |
| Total | 257 (100.0%) | 174 (100.0%) |
Property Value to Household Income Ratio in Port Sulphur
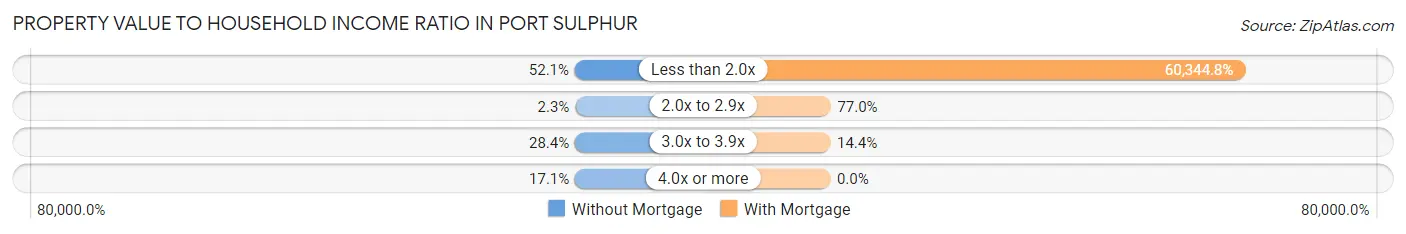
| Value-to-Income Ratio | Without Mortgage | With Mortgage |
| Less than 2.0x | 134 (52.1%) | 105,000 (60,344.8%) |
| 2.0x to 2.9x | 6 (2.3%) | 134 (77.0%) |
| 3.0x to 3.9x | 73 (28.4%) | 25 (14.4%) |
| 4.0x or more | 44 (17.1%) | 0 (0.0%) |
| Total | 257 (100.0%) | 174 (100.0%) |
Real Estate Taxes by Mortgage Status in Port Sulphur
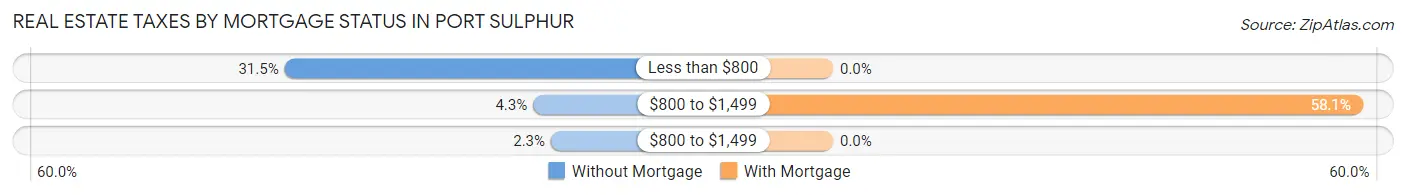
| Property Taxes | Without Mortgage | With Mortgage |
| Less than $800 | 81 (31.5%) | 0 (0.0%) |
| $800 to $1,499 | 11 (4.3%) | 101 (58.1%) |
| $800 to $1,499 | 6 (2.3%) | 0 (0.0%) |
| Total | 257 (100.0%) | 174 (100.0%) |
Health & Disability in Port Sulphur
Health Insurance Coverage by Age in Port Sulphur
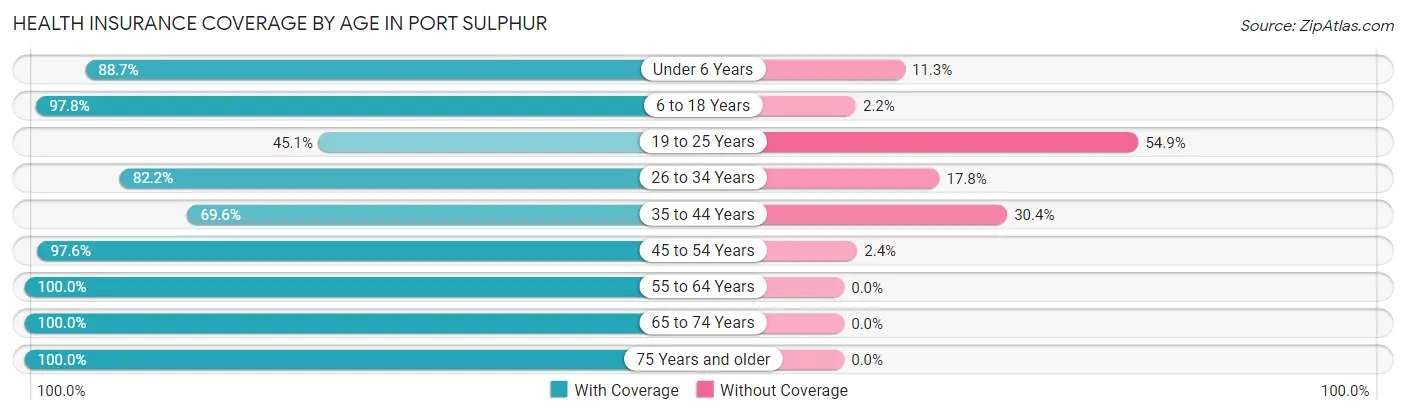
| Age Bracket | With Coverage | Without Coverage |
| Under 6 Years | 141 (88.7%) | 18 (11.3%) |
| 6 to 18 Years | 313 (97.8%) | 7 (2.2%) |
| 19 to 25 Years | 116 (45.1%) | 141 (54.9%) |
| 26 to 34 Years | 125 (82.2%) | 27 (17.8%) |
| 35 to 44 Years | 71 (69.6%) | 31 (30.4%) |
| 45 to 54 Years | 241 (97.6%) | 6 (2.4%) |
| 55 to 64 Years | 176 (100.0%) | 0 (0.0%) |
| 65 to 74 Years | 73 (100.0%) | 0 (0.0%) |
| 75 Years and older | 92 (100.0%) | 0 (0.0%) |
| Total | 1,348 (85.4%) | 230 (14.6%) |
Health Insurance Coverage by Citizenship Status in Port Sulphur
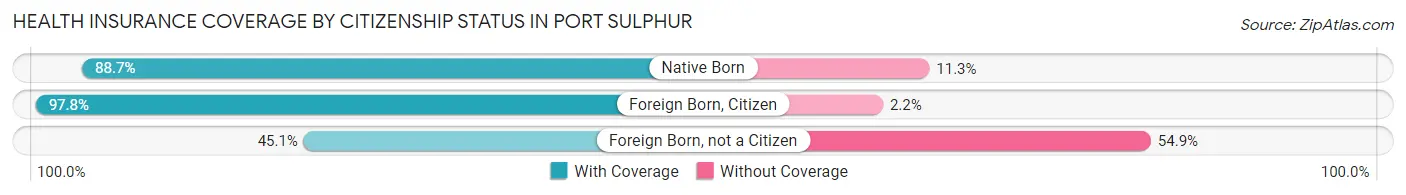
| Citizenship Status | With Coverage | Without Coverage |
| Native Born | 141 (88.7%) | 18 (11.3%) |
| Foreign Born, Citizen | 313 (97.8%) | 7 (2.2%) |
| Foreign Born, not a Citizen | 116 (45.1%) | 141 (54.9%) |
Health Insurance Coverage by Household Income in Port Sulphur
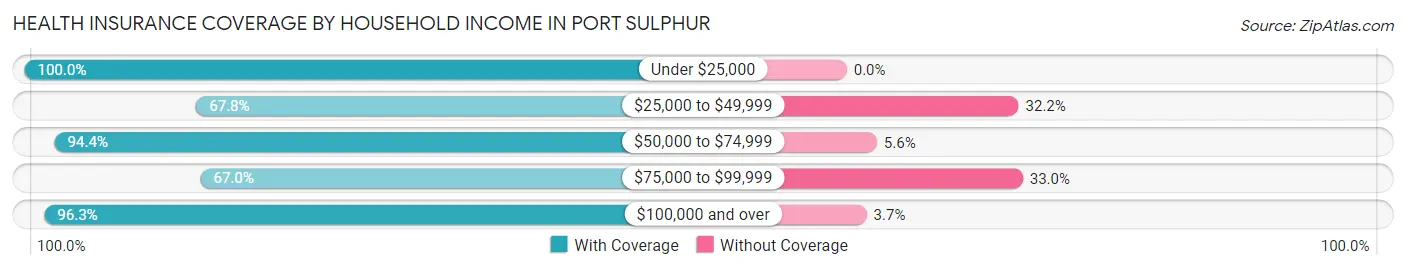
| Household Income | With Coverage | Without Coverage |
| Under $25,000 | 303 (100.0%) | 0 (0.0%) |
| $25,000 to $49,999 | 297 (67.8%) | 141 (32.2%) |
| $50,000 to $74,999 | 184 (94.4%) | 11 (5.6%) |
| $75,000 to $99,999 | 124 (67.0%) | 61 (33.0%) |
| $100,000 and over | 440 (96.3%) | 17 (3.7%) |
Public vs Private Health Insurance Coverage by Age in Port Sulphur
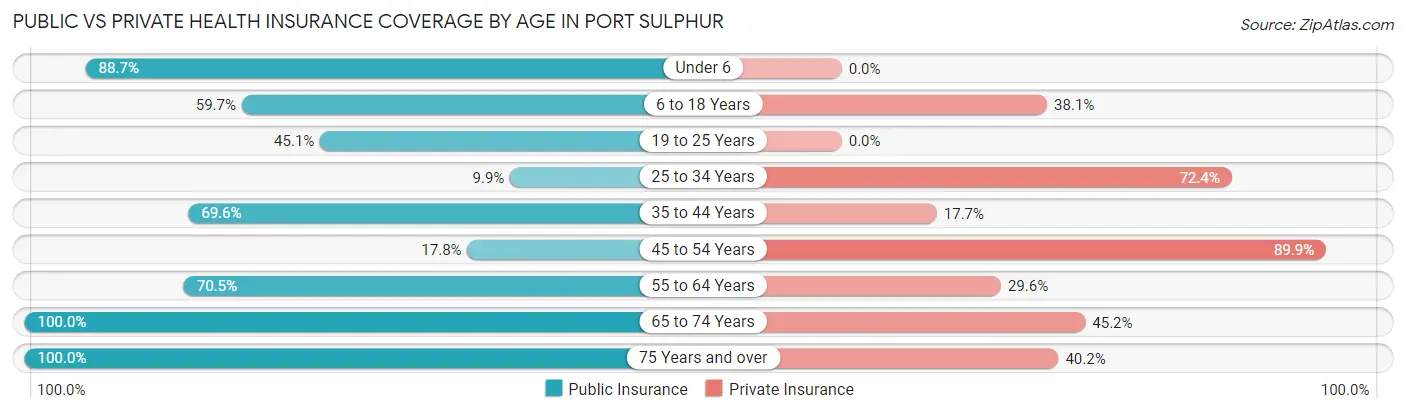
| Age Bracket | Public Insurance | Private Insurance |
| Under 6 | 141 (88.7%) | 0 (0.0%) |
| 6 to 18 Years | 191 (59.7%) | 122 (38.1%) |
| 19 to 25 Years | 116 (45.1%) | 0 (0.0%) |
| 25 to 34 Years | 15 (9.9%) | 110 (72.4%) |
| 35 to 44 Years | 71 (69.6%) | 18 (17.6%) |
| 45 to 54 Years | 44 (17.8%) | 222 (89.9%) |
| 55 to 64 Years | 124 (70.5%) | 52 (29.5%) |
| 65 to 74 Years | 73 (100.0%) | 33 (45.2%) |
| 75 Years and over | 92 (100.0%) | 37 (40.2%) |
| Total | 867 (54.9%) | 594 (37.6%) |
Disability Status by Sex by Age in Port Sulphur
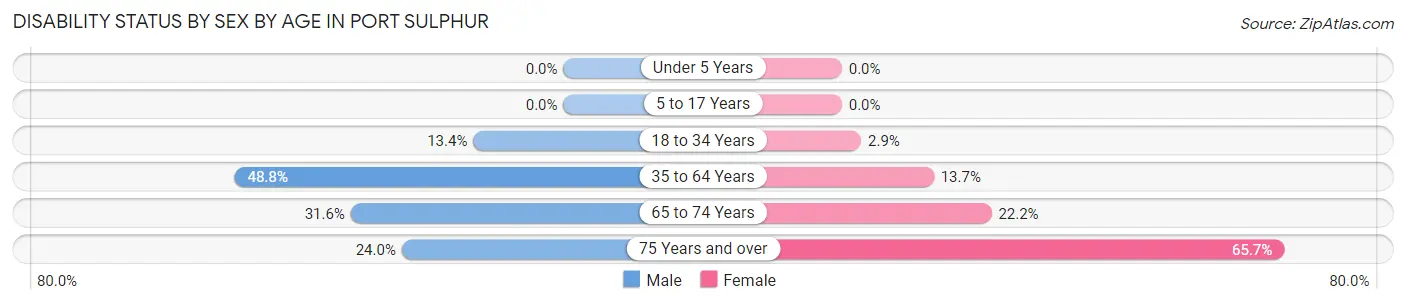
| Age Bracket | Male | Female |
| Under 5 Years | 0 (0.0%) | 0 (0.0%) |
| 5 to 17 Years | 0 (0.0%) | 0 (0.0%) |
| 18 to 34 Years | 36 (13.4%) | 4 (2.9%) |
| 35 to 64 Years | 124 (48.8%) | 37 (13.7%) |
| 65 to 74 Years | 6 (31.6%) | 12 (22.2%) |
| 75 Years and over | 6 (24.0%) | 44 (65.7%) |
Disability Class by Sex by Age in Port Sulphur
Disability Class: Hearing Difficulty
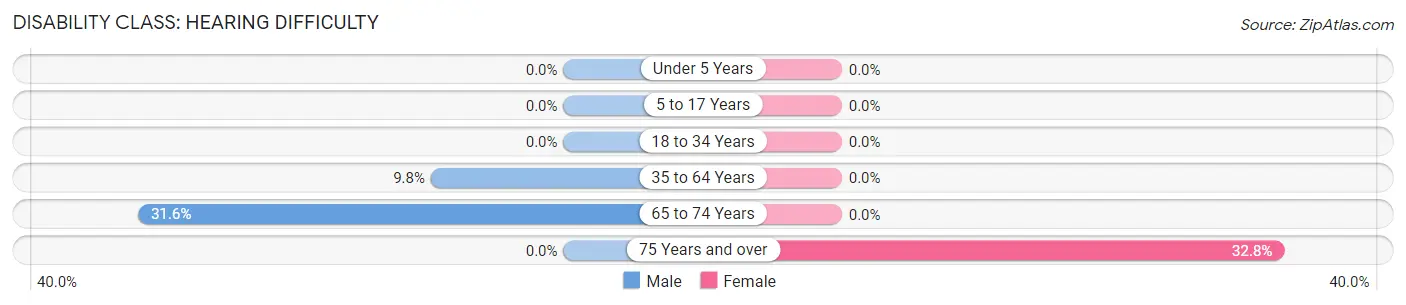
| Age Bracket | Male | Female |
| Under 5 Years | 0 (0.0%) | 0 (0.0%) |
| 5 to 17 Years | 0 (0.0%) | 0 (0.0%) |
| 18 to 34 Years | 0 (0.0%) | 0 (0.0%) |
| 35 to 64 Years | 25 (9.8%) | 0 (0.0%) |
| 65 to 74 Years | 6 (31.6%) | 0 (0.0%) |
| 75 Years and over | 0 (0.0%) | 22 (32.8%) |
Disability Class: Vision Difficulty
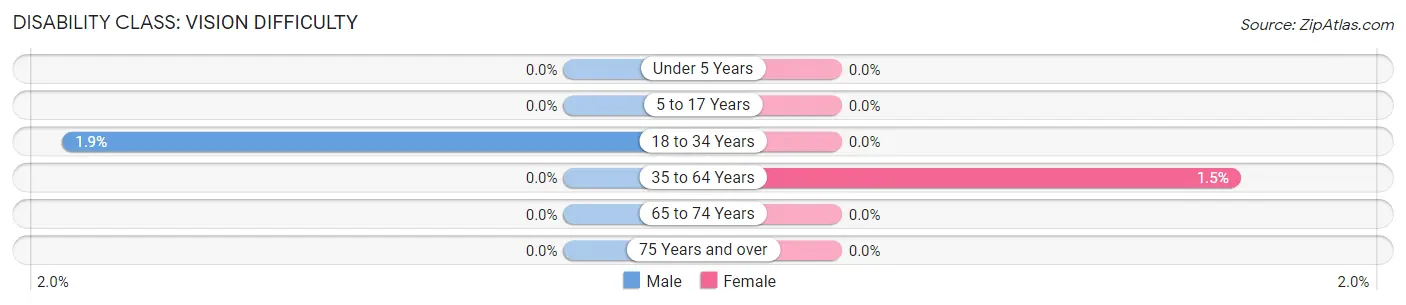
| Age Bracket | Male | Female |
| Under 5 Years | 0 (0.0%) | 0 (0.0%) |
| 5 to 17 Years | 0 (0.0%) | 0 (0.0%) |
| 18 to 34 Years | 5 (1.9%) | 0 (0.0%) |
| 35 to 64 Years | 0 (0.0%) | 4 (1.5%) |
| 65 to 74 Years | 0 (0.0%) | 0 (0.0%) |
| 75 Years and over | 0 (0.0%) | 0 (0.0%) |
Disability Class: Cognitive Difficulty
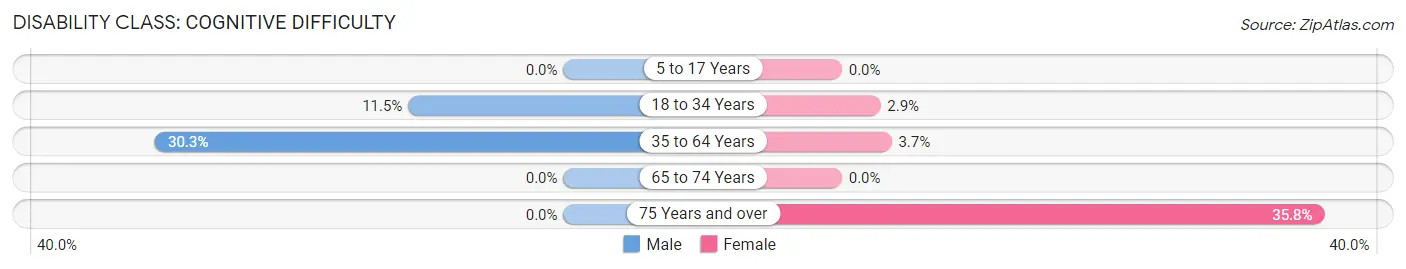
| Age Bracket | Male | Female |
| 5 to 17 Years | 0 (0.0%) | 0 (0.0%) |
| 18 to 34 Years | 31 (11.5%) | 4 (2.9%) |
| 35 to 64 Years | 77 (30.3%) | 10 (3.7%) |
| 65 to 74 Years | 0 (0.0%) | 0 (0.0%) |
| 75 Years and over | 0 (0.0%) | 24 (35.8%) |
Disability Class: Ambulatory Difficulty
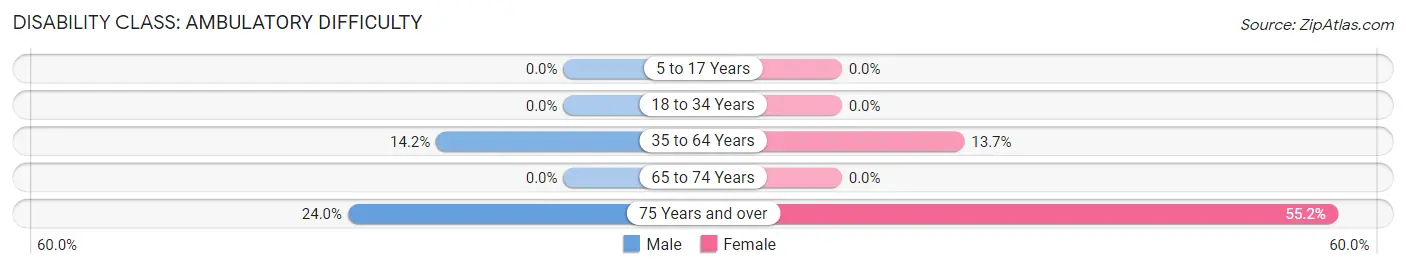
| Age Bracket | Male | Female |
| 5 to 17 Years | 0 (0.0%) | 0 (0.0%) |
| 18 to 34 Years | 0 (0.0%) | 0 (0.0%) |
| 35 to 64 Years | 36 (14.2%) | 37 (13.7%) |
| 65 to 74 Years | 0 (0.0%) | 0 (0.0%) |
| 75 Years and over | 6 (24.0%) | 37 (55.2%) |
Disability Class: Self-Care Difficulty
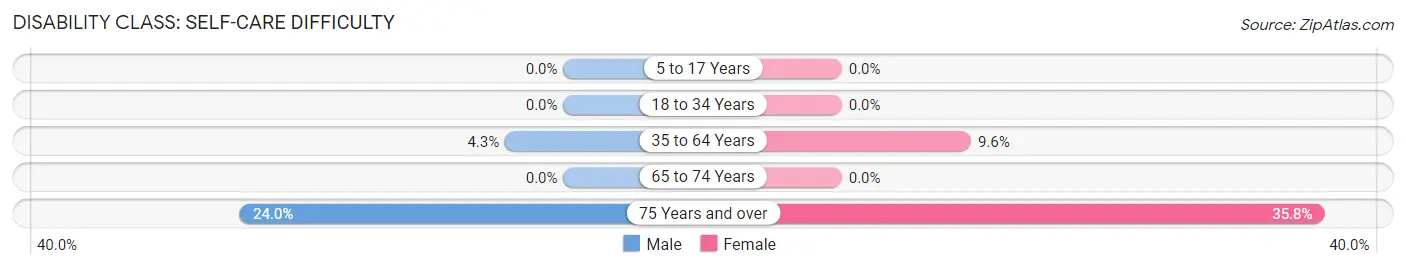
| Age Bracket | Male | Female |
| 5 to 17 Years | 0 (0.0%) | 0 (0.0%) |
| 18 to 34 Years | 0 (0.0%) | 0 (0.0%) |
| 35 to 64 Years | 11 (4.3%) | 26 (9.6%) |
| 65 to 74 Years | 0 (0.0%) | 0 (0.0%) |
| 75 Years and over | 6 (24.0%) | 24 (35.8%) |
Technology Access in Port Sulphur
Computing Device Access in Port Sulphur
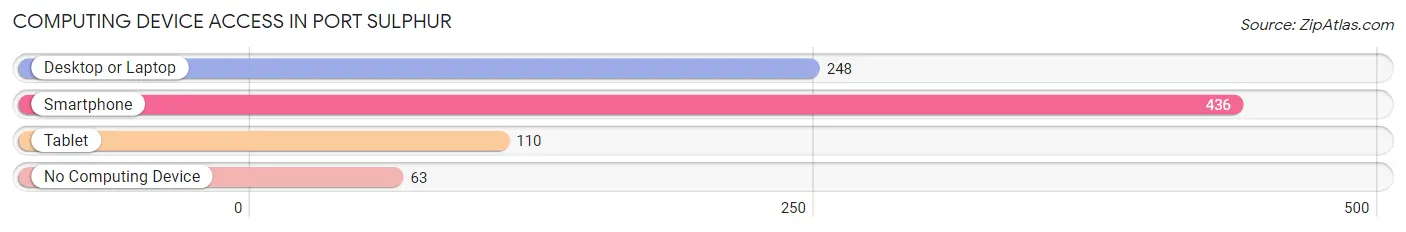
| Device Type | # Households | % Households |
| Desktop or Laptop | 248 | 47.1% |
| Smartphone | 436 | 82.7% |
| Tablet | 110 | 20.9% |
| No Computing Device | 63 | 11.9% |
| Total | 527 | 100.0% |
Internet Access in Port Sulphur
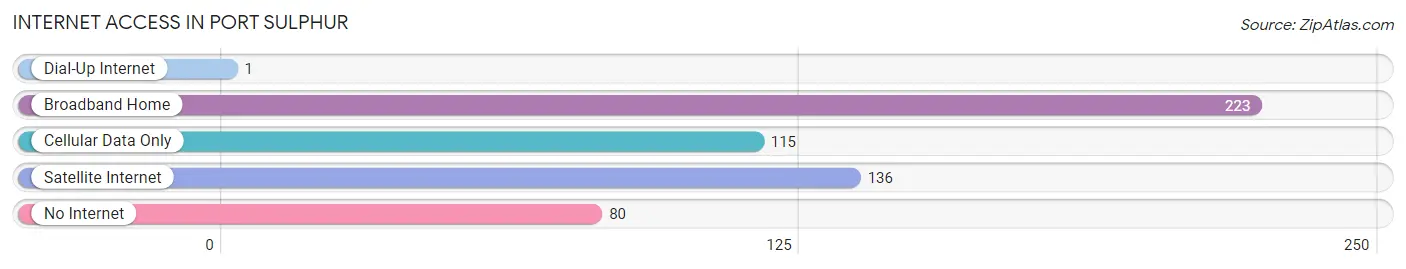
| Internet Type | # Households | % Households |
| Dial-Up Internet | 1 | 0.2% |
| Broadband Home | 223 | 42.3% |
| Cellular Data Only | 115 | 21.8% |
| Satellite Internet | 136 | 25.8% |
| No Internet | 80 | 15.2% |
| Total | 527 | 100.0% |
Port Sulphur Summary
History
Port Sulphur is a small town located in Plaquemines Parish, Louisiana. It is situated on the west bank of the Mississippi River, approximately 40 miles south of New Orleans. The town was founded in the early 1800s by French settlers who named it after the nearby sulfur springs. It was incorporated in 1891 and has since grown to a population of 1,717 as of the 2010 census.
The town has a rich history of fishing and shrimping, and was once home to a thriving oyster industry. In the early 1900s, the town was a major port for the export of cotton and other agricultural products. It was also a popular destination for recreational fishing and hunting.
In the 1950s, the town began to experience a decline in its economy due to the decline of the oyster industry and the closure of the port. In the 1970s, the town was hit hard by Hurricane Betsy, which caused extensive damage to the town and its infrastructure.
In the 1980s, the town began to experience a resurgence in its economy due to the development of the nearby Port of Plaquemines. The port is now a major hub for the import and export of goods, and has helped to revitalize the town.
Geography
Port Sulphur is located in Plaquemines Parish, Louisiana, on the west bank of the Mississippi River. It is situated approximately 40 miles south of New Orleans. The town is bordered by the Mississippi River to the east, the Gulf of Mexico to the south, and the Intracoastal Waterway to the west.
The town has a total area of 1.3 square miles, all of which is land. The terrain is mostly flat, with some low hills in the northern part of the town. The climate is humid subtropical, with hot, humid summers and mild winters.
Economy
Port Sulphur’s economy is largely based on the fishing and shrimping industries. The town is home to several seafood processing plants, as well as a number of fishing and shrimping boats. The town is also home to a number of small businesses, including restaurants, convenience stores, and retail stores.
The town is also home to the Port of Plaquemines, which is a major hub for the import and export of goods. The port is also home to a number of oil and gas companies, as well as a number of other businesses.
Demographics
As of the 2010 census, the population of Port Sulphur was 1,717. The racial makeup of the town was 79.3% White, 17.2% African American, 0.7% Native American, 0.3% Asian, 0.1% Pacific Islander, and 2.4% from other races. Hispanic or Latino of any race were 3.2% of the population.
The median income for a household in the town was $37,917, and the median income for a family was $45,313. The per capita income for the town was $17,917. About 17.2% of families and 20.2% of the population were below the poverty line, including 28.3% of those under age 18 and 11.2% of those age 65 or over.
Common Questions
What is Per Capita Income in Port Sulphur?
Per Capita income in Port Sulphur is $18,261.
What is the Median Household income in Port Sulphur?
Median Household Income in Port Sulphur is $31,325.
What is Income or Wage Gap in Port Sulphur?
Income or Wage Gap in Port Sulphur is 58.7%.
Women in Port Sulphur earn 41.3 cents for every dollar earned by a man.
What is Inequality or Gini Index in Port Sulphur?
Inequality or Gini Index in Port Sulphur is 0.48.
What is the Total Population of Port Sulphur?
Total Population of Port Sulphur is 1,593.
What is the Total Male Population of Port Sulphur?
Total Male Population of Port Sulphur is 867.
What is the Total Female Population of Port Sulphur?
Total Female Population of Port Sulphur is 726.
What is the Ratio of Males per 100 Females in Port Sulphur?
There are 119.42 Males per 100 Females in Port Sulphur.
What is the Ratio of Females per 100 Males in Port Sulphur?
There are 83.74 Females per 100 Males in Port Sulphur.
What is the Median Population Age in Port Sulphur?
Median Population Age in Port Sulphur is 27.5 Years.
What is the Average Family Size in Port Sulphur
Average Family Size in Port Sulphur is 3.3 People.
What is the Average Household Size in Port Sulphur
Average Household Size in Port Sulphur is 3.0 People.
How Large is the Labor Force in Port Sulphur?
There are 641 People in the Labor Forcein in Port Sulphur.
What is the Percentage of People in the Labor Force in Port Sulphur?
57.5% of People are in the Labor Force in Port Sulphur.
What is the Unemployment Rate in Port Sulphur?
Unemployment Rate in Port Sulphur is 20.3%.