Zip Codes with the Highest Percentage of Population Employed in Security & Protection in Louisiana
RELATED REPORTS & OPTIONS
Security & Protection
Louisiana
Compare Zip Codes
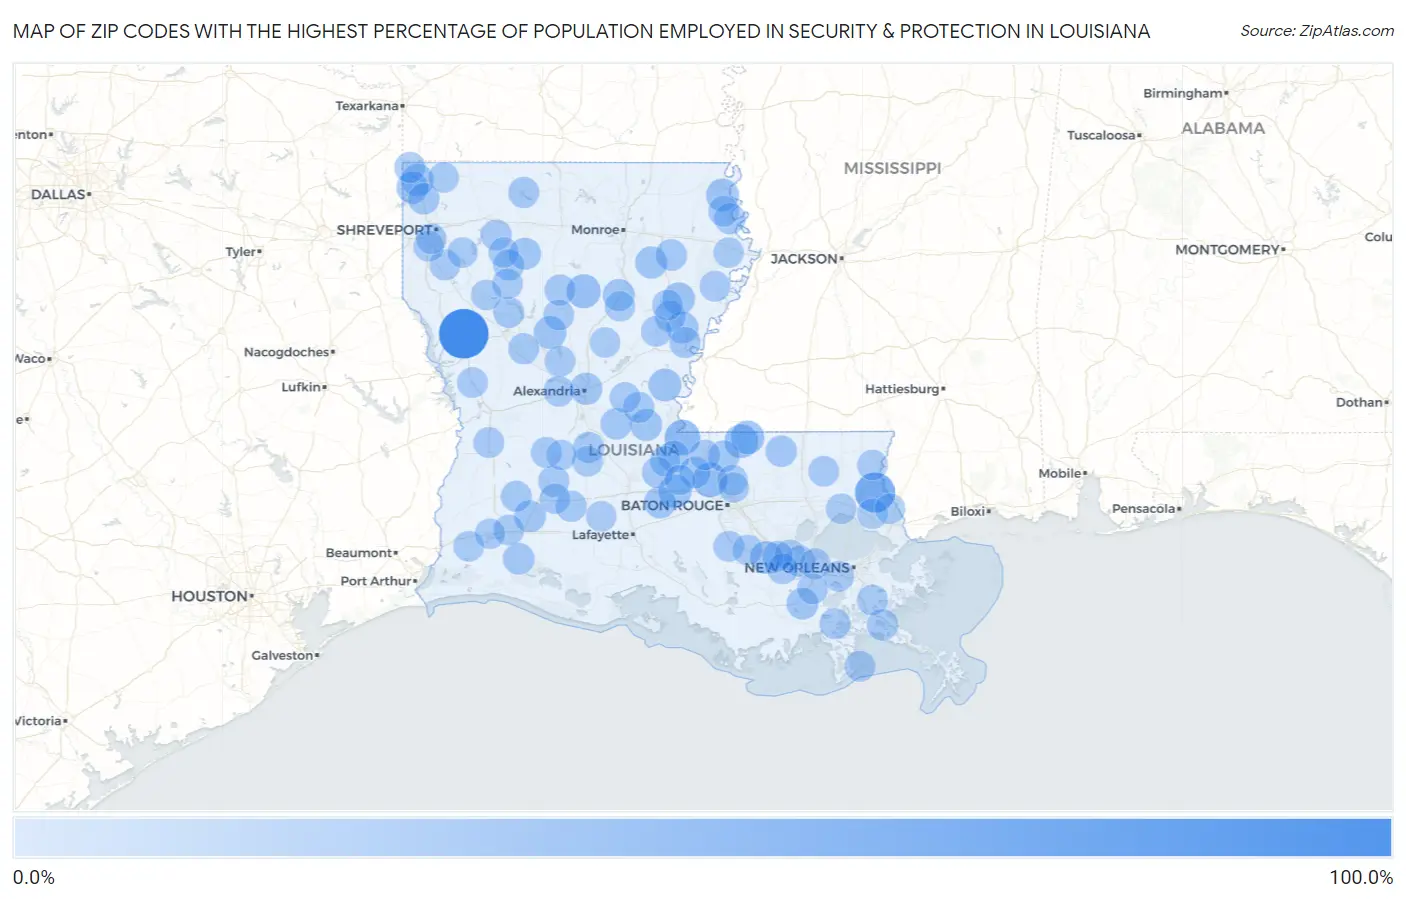
Map of Zip Codes with the Highest Percentage of Population Employed in Security & Protection in Louisiana
0.0%
100.0%
Zip Codes with the Highest Percentage of Population Employed in Security & Protection in Louisiana
| Zip Code | % Employed | vs State | vs National | |
| 1. | 71406 | 100.0% | 2.6%(+97.4)#1 | 2.1%(+97.9)#5 |
| 2. | 70464 | 51.9% | 2.6%(+49.2)#2 | 2.1%(+49.7)#32 |
| 3. | 70712 | 29.2% | 2.6%(+26.6)#3 | 2.1%(+27.0)#100 |
| 4. | 70736 | 25.7% | 2.6%(+23.1)#4 | 2.1%(+23.6)#123 |
| 5. | 71473 | 21.8% | 2.6%(+19.2)#5 | 2.1%(+19.6)#171 |
| 6. | 70789 | 20.5% | 2.6%(+17.9)#6 | 2.1%(+18.3)#188 |
| 7. | 70761 | 20.0% | 2.6%(+17.4)#7 | 2.1%(+17.9)#192 |
| 8. | 70756 | 18.2% | 2.6%(+15.6)#8 | 2.1%(+16.1)#241 |
| 9. | 71254 | 17.1% | 2.6%(+14.5)#9 | 2.1%(+14.9)#284 |
| 10. | 71404 | 16.2% | 2.6%(+13.6)#10 | 2.1%(+14.0)#307 |
| 11. | 71354 | 16.1% | 2.6%(+13.5)#11 | 2.1%(+13.9)#314 |
| 12. | 70723 | 15.3% | 2.6%(+12.7)#12 | 2.1%(+13.2)#347 |
| 13. | 71336 | 15.3% | 2.6%(+12.7)#13 | 2.1%(+13.2)#348 |
| 14. | 71043 | 14.4% | 2.6%(+11.8)#14 | 2.1%(+12.2)#394 |
| 15. | 71359 | 13.3% | 2.6%(+10.7)#15 | 2.1%(+11.2)#459 |
| 16. | 71259 | 13.3% | 2.6%(+10.7)#16 | 2.1%(+11.2)#461 |
| 17. | 71082 | 12.9% | 2.6%(+10.3)#17 | 2.1%(+10.8)#479 |
| 18. | 71355 | 12.7% | 2.6%(+10.0)#18 | 2.1%(+10.5)#498 |
| 19. | 70750 | 12.6% | 2.6%(+10.0)#19 | 2.1%(+10.5)#499 |
| 20. | 71008 | 12.1% | 2.6%(+9.47)#20 | 2.1%(+9.93)#545 |
| 21. | 71415 | 12.1% | 2.6%(+9.46)#21 | 2.1%(+9.92)#547 |
| 22. | 71326 | 12.1% | 2.6%(+9.46)#22 | 2.1%(+9.92)#548 |
| 23. | 70640 | 11.9% | 2.6%(+9.27)#23 | 2.1%(+9.73)#560 |
| 24. | 70375 | 11.7% | 2.6%(+9.08)#24 | 2.1%(+9.54)#579 |
| 25. | 70630 | 11.2% | 2.6%(+8.61)#25 | 2.1%(+9.07)#625 |
| 26. | 71219 | 10.4% | 2.6%(+7.83)#26 | 2.1%(+8.29)#717 |
| 27. | 70748 | 10.4% | 2.6%(+7.81)#27 | 2.1%(+8.27)#719 |
| 28. | 71341 | 10.3% | 2.6%(+7.71)#28 | 2.1%(+8.17)#728 |
| 29. | 70715 | 10.3% | 2.6%(+7.69)#29 | 2.1%(+8.15)#730 |
| 30. | 70760 | 10.2% | 2.6%(+7.62)#30 | 2.1%(+8.07)#741 |
| 31. | 70441 | 9.6% | 2.6%(+7.02)#31 | 2.1%(+7.47)#815 |
| 32. | 70083 | 9.6% | 2.6%(+6.97)#32 | 2.1%(+7.43)#824 |
| 33. | 71004 | 9.5% | 2.6%(+6.86)#33 | 2.1%(+7.32)#845 |
| 34. | 71368 | 8.9% | 2.6%(+6.32)#34 | 2.1%(+6.78)#928 |
| 35. | 71351 | 8.9% | 2.6%(+6.28)#35 | 2.1%(+6.74)#936 |
| 36. | 70515 | 8.9% | 2.6%(+6.28)#36 | 2.1%(+6.74)#937 |
| 37. | 70655 | 8.4% | 2.6%(+5.79)#37 | 2.1%(+6.25)#1,038 |
| 38. | 71069 | 8.3% | 2.6%(+5.73)#38 | 2.1%(+6.18)#1,063 |
| 39. | 70585 | 8.3% | 2.6%(+5.73)#39 | 2.1%(+6.18)#1,065 |
| 40. | 71456 | 8.2% | 2.6%(+5.63)#40 | 2.1%(+6.09)#1,086 |
| 41. | 70049 | 8.2% | 2.6%(+5.61)#41 | 2.1%(+6.07)#1,093 |
| 42. | 70658 | 8.1% | 2.6%(+5.50)#42 | 2.1%(+5.96)#1,125 |
| 43. | 71016 | 8.0% | 2.6%(+5.43)#43 | 2.1%(+5.89)#1,154 |
| 44. | 71334 | 7.9% | 2.6%(+5.33)#44 | 2.1%(+5.79)#1,186 |
| 45. | 71353 | 7.9% | 2.6%(+5.32)#45 | 2.1%(+5.78)#1,190 |
| 46. | 71422 | 7.9% | 2.6%(+5.32)#46 | 2.1%(+5.77)#1,192 |
| 47. | 71040 | 7.9% | 2.6%(+5.31)#47 | 2.1%(+5.77)#1,196 |
| 48. | 71276 | 7.9% | 2.6%(+5.26)#48 | 2.1%(+5.72)#1,218 |
| 49. | 71411 | 7.8% | 2.6%(+5.19)#49 | 2.1%(+5.65)#1,241 |
| 50. | 70051 | 7.5% | 2.6%(+4.92)#50 | 2.1%(+5.38)#1,323 |
| 51. | 70638 | 7.5% | 2.6%(+4.87)#51 | 2.1%(+5.33)#1,342 |
| 52. | 70358 | 7.5% | 2.6%(+4.86)#52 | 2.1%(+5.32)#1,346 |
| 53. | 71024 | 7.4% | 2.6%(+4.81)#53 | 2.1%(+5.27)#1,358 |
| 54. | 70345 | 7.2% | 2.6%(+4.63)#54 | 2.1%(+5.09)#1,426 |
| 55. | 71027 | 7.1% | 2.6%(+4.54)#55 | 2.1%(+4.99)#1,470 |
| 56. | 70442 | 7.1% | 2.6%(+4.44)#56 | 2.1%(+4.90)#1,512 |
| 57. | 71417 | 7.0% | 2.6%(+4.43)#57 | 2.1%(+4.88)#1,518 |
| 58. | 71286 | 6.8% | 2.6%(+4.23)#58 | 2.1%(+4.69)#1,613 |
| 59. | 71357 | 6.8% | 2.6%(+4.18)#59 | 2.1%(+4.64)#1,636 |
| 60. | 70079 | 6.8% | 2.6%(+4.18)#60 | 2.1%(+4.64)#1,638 |
| 61. | 70094 | 6.6% | 2.6%(+4.04)#61 | 2.1%(+4.50)#1,718 |
| 62. | 70659 | 6.6% | 2.6%(+4.03)#62 | 2.1%(+4.49)#1,723 |
| 63. | 71340 | 6.6% | 2.6%(+4.02)#63 | 2.1%(+4.47)#1,727 |
| 64. | 70788 | 6.6% | 2.6%(+3.99)#64 | 2.1%(+4.45)#1,734 |
| 65. | 71483 | 6.6% | 2.6%(+3.95)#65 | 2.1%(+4.41)#1,765 |
| 66. | 71409 | 6.5% | 2.6%(+3.88)#66 | 2.1%(+4.34)#1,789 |
| 67. | 71378 | 6.3% | 2.6%(+3.73)#67 | 2.1%(+4.19)#1,874 |
| 68. | 71118 | 6.3% | 2.6%(+3.73)#68 | 2.1%(+4.19)#1,875 |
| 69. | 70040 | 6.3% | 2.6%(+3.70)#69 | 2.1%(+4.16)#1,894 |
| 70. | 70030 | 6.3% | 2.6%(+3.69)#70 | 2.1%(+4.15)#1,901 |
| 71. | 71108 | 6.2% | 2.6%(+3.64)#71 | 2.1%(+4.10)#1,926 |
| 72. | 70090 | 6.2% | 2.6%(+3.57)#72 | 2.1%(+4.03)#1,966 |
| 73. | 70615 | 6.2% | 2.6%(+3.55)#73 | 2.1%(+4.01)#1,978 |
| 74. | 70576 | 6.0% | 2.6%(+3.39)#74 | 2.1%(+3.85)#2,080 |
| 75. | 70665 | 6.0% | 2.6%(+3.36)#75 | 2.1%(+3.82)#2,105 |
| 76. | 70532 | 6.0% | 2.6%(+3.35)#76 | 2.1%(+3.81)#2,107 |
| 77. | 71429 | 6.0% | 2.6%(+3.35)#77 | 2.1%(+3.81)#2,110 |
| 78. | 70763 | 5.9% | 2.6%(+3.31)#78 | 2.1%(+3.77)#2,135 |
| 79. | 71002 | 5.9% | 2.6%(+3.28)#79 | 2.1%(+3.73)#2,160 |
| 80. | 71019 | 5.9% | 2.6%(+3.27)#80 | 2.1%(+3.73)#2,165 |
| 81. | 71331 | 5.8% | 2.6%(+3.18)#81 | 2.1%(+3.63)#2,220 |
| 82. | 70427 | 5.7% | 2.6%(+3.05)#82 | 2.1%(+3.50)#2,321 |
| 83. | 70445 | 5.5% | 2.6%(+2.93)#83 | 2.1%(+3.39)#2,422 |
| 84. | 70447 | 5.5% | 2.6%(+2.90)#84 | 2.1%(+3.36)#2,448 |
| 85. | 71064 | 5.4% | 2.6%(+2.76)#85 | 2.1%(+3.22)#2,571 |
| 86. | 70516 | 5.4% | 2.6%(+2.75)#86 | 2.1%(+3.21)#2,573 |
| 87. | 70452 | 5.3% | 2.6%(+2.69)#87 | 2.1%(+3.15)#2,642 |
| 88. | 70775 | 5.1% | 2.6%(+2.54)#88 | 2.1%(+3.00)#2,764 |
| 89. | 70791 | 5.1% | 2.6%(+2.54)#89 | 2.1%(+3.00)#2,765 |
| 90. | 71371 | 5.1% | 2.6%(+2.50)#90 | 2.1%(+2.96)#2,804 |
| 91. | 71282 | 5.0% | 2.6%(+2.43)#91 | 2.1%(+2.89)#2,884 |
| 92. | 71045 | 5.0% | 2.6%(+2.38)#92 | 2.1%(+2.84)#2,938 |
| 93. | 70714 | 5.0% | 2.6%(+2.38)#93 | 2.1%(+2.84)#2,940 |
| 94. | 71051 | 5.0% | 2.6%(+2.38)#94 | 2.1%(+2.84)#2,941 |
| 95. | 71441 | 4.9% | 2.6%(+2.33)#95 | 2.1%(+2.79)#2,999 |
| 96. | 70669 | 4.9% | 2.6%(+2.33)#96 | 2.1%(+2.79)#3,008 |
| 97. | 71463 | 4.9% | 2.6%(+2.30)#97 | 2.1%(+2.76)#3,034 |
| 98. | 70753 | 4.9% | 2.6%(+2.30)#98 | 2.1%(+2.76)#3,038 |
| 99. | 70346 | 4.8% | 2.6%(+2.24)#99 | 2.1%(+2.69)#3,118 |
| 100. | 70732 | 4.8% | 2.6%(+2.22)#100 | 2.1%(+2.68)#3,146 |
Common Questions
What are the Top 10 Zip Codes with the Highest Percentage of Population Employed in Security & Protection in Louisiana?
Top 10 Zip Codes with the Highest Percentage of Population Employed in Security & Protection in Louisiana are:
What zip code has the Highest Percentage of Population Employed in Security & Protection in Louisiana?
71406 has the Highest Percentage of Population Employed in Security & Protection in Louisiana with 100.0%.
What is the Percentage of Population Employed in Security & Protection in the State of Louisiana?
Percentage of Population Employed in Security & Protection in Louisiana is 2.6%.
What is the Percentage of Population Employed in Security & Protection in the United States?
Percentage of Population Employed in Security & Protection in the United States is 2.1%.