Merryville, LA Map & Demographics
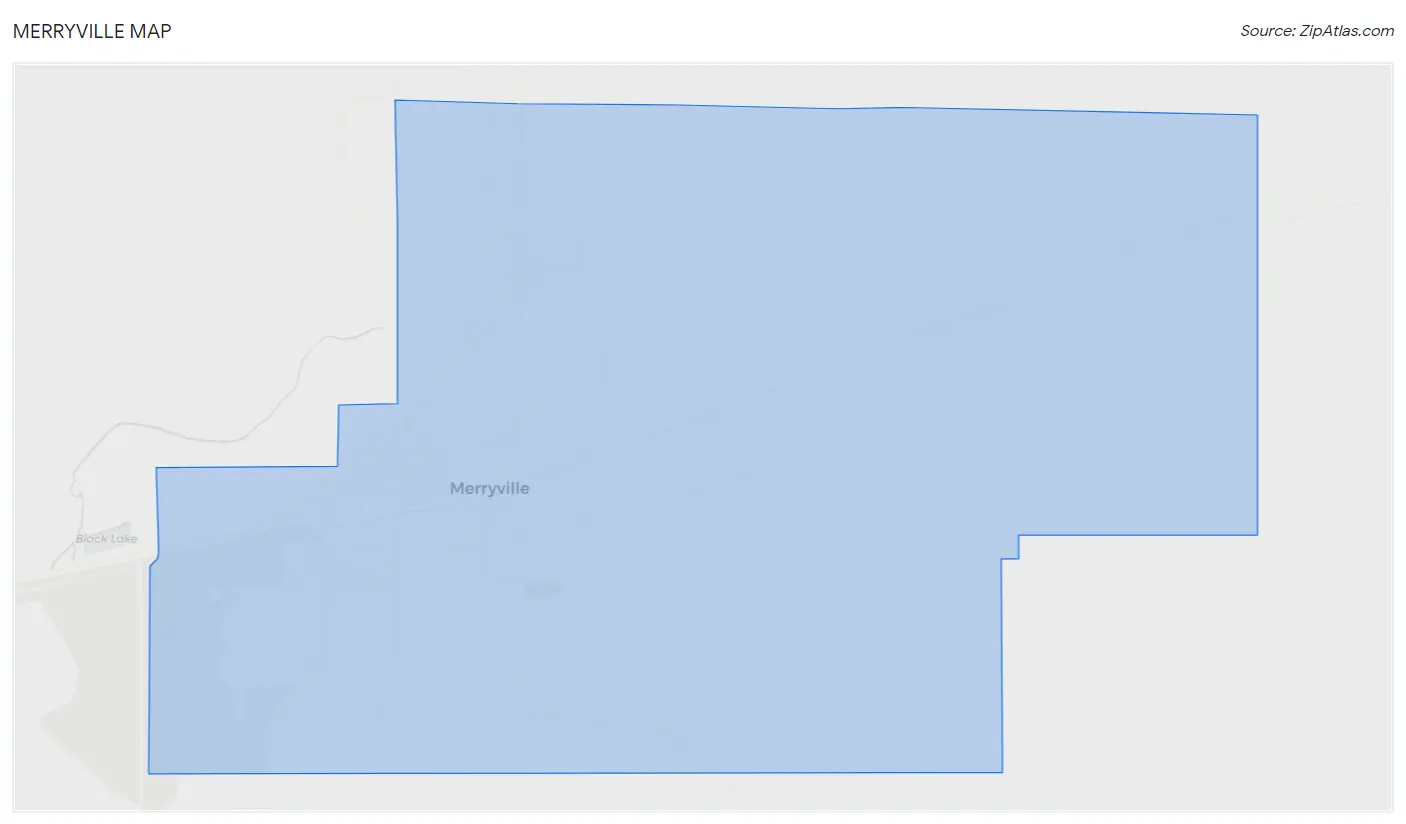
Merryville Map
Merryville Overview
$24,399
PER CAPITA INCOME
$46,719
AVG FAMILY INCOME
$35,227
AVG HOUSEHOLD INCOME
52.6%
WAGE / INCOME GAP [ % ]
47.4¢/ $1
WAGE / INCOME GAP [ $ ]
$10,298
FAMILY INCOME DEFICIT
0.55
INEQUALITY / GINI INDEX
918
TOTAL POPULATION
460
MALE POPULATION
458
FEMALE POPULATION
100.44
MALES / 100 FEMALES
99.57
FEMALES / 100 MALES
36.1
MEDIAN AGE
3.2
AVG FAMILY SIZE
2.5
AVG HOUSEHOLD SIZE
387
LABOR FORCE [ PEOPLE ]
55.4%
PERCENT IN LABOR FORCE
16.0%
UNEMPLOYMENT RATE
Merryville Zip Codes
Merryville Area Codes
Income in Merryville
Income Overview in Merryville
Per Capita Income in Merryville is $24,399, while median incomes of families and households are $46,719 and $35,227 respectively.
| Characteristic | Number | Measure |
| Per Capita Income | 918 | $24,399 |
| Median Family Income | 193 | $46,719 |
| Mean Family Income | 193 | $73,828 |
| Median Household Income | 354 | $35,227 |
| Mean Household Income | 354 | $59,308 |
| Income Deficit | 193 | $10,298 |
| Wage / Income Gap (%) | 918 | 52.55% |
| Wage / Income Gap ($) | 918 | 47.45¢ per $1 |
| Gini / Inequality Index | 918 | 0.55 |
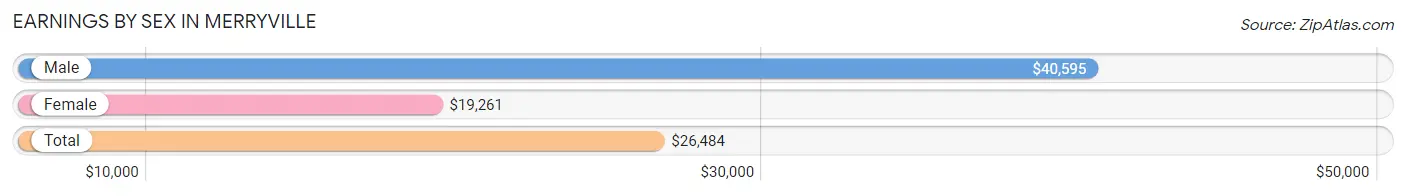
Earnings by Sex in Merryville
Average Earnings in Merryville are $26,484, $40,595 for men and $19,261 for women, a difference of 52.5%.
| Sex | Number | Average Earnings |
| Male | 218 (59.7%) | $40,595 |
| Female | 147 (40.3%) | $19,261 |
| Total | 365 (100.0%) | $26,484 |
Earnings by Sex by Income Bracket in Merryville
The most common earnings brackets in Merryville are $100,000+ for men (38 | 17.4%) and $22,500 to $24,999 for women (25 | 17.0%).
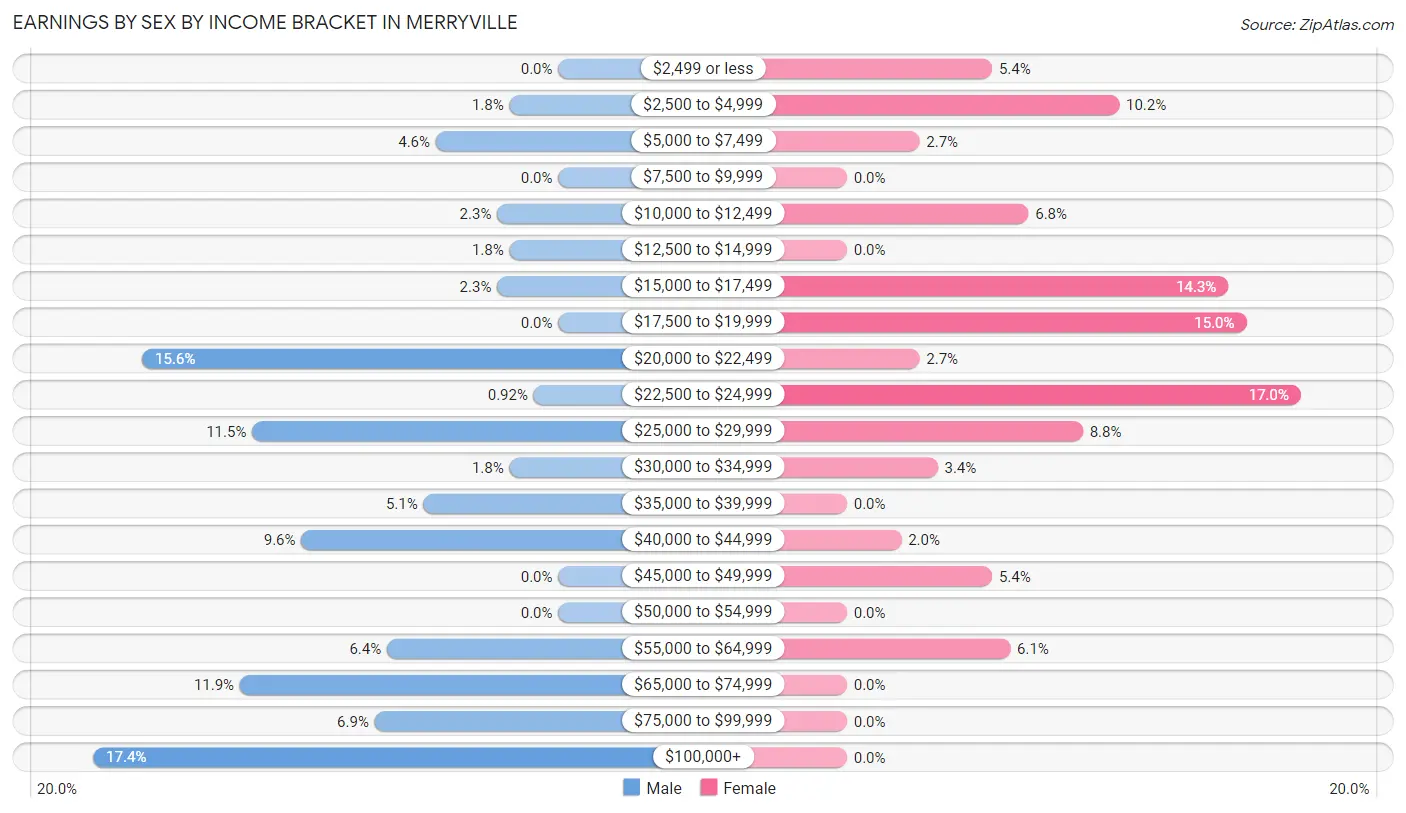
| Income | Male | Female |
| $2,499 or less | 0 (0.0%) | 8 (5.4%) |
| $2,500 to $4,999 | 4 (1.8%) | 15 (10.2%) |
| $5,000 to $7,499 | 10 (4.6%) | 4 (2.7%) |
| $7,500 to $9,999 | 0 (0.0%) | 0 (0.0%) |
| $10,000 to $12,499 | 5 (2.3%) | 10 (6.8%) |
| $12,500 to $14,999 | 4 (1.8%) | 0 (0.0%) |
| $15,000 to $17,499 | 5 (2.3%) | 21 (14.3%) |
| $17,500 to $19,999 | 0 (0.0%) | 22 (15.0%) |
| $20,000 to $22,499 | 34 (15.6%) | 4 (2.7%) |
| $22,500 to $24,999 | 2 (0.9%) | 25 (17.0%) |
| $25,000 to $29,999 | 25 (11.5%) | 13 (8.8%) |
| $30,000 to $34,999 | 4 (1.8%) | 5 (3.4%) |
| $35,000 to $39,999 | 11 (5.1%) | 0 (0.0%) |
| $40,000 to $44,999 | 21 (9.6%) | 3 (2.0%) |
| $45,000 to $49,999 | 0 (0.0%) | 8 (5.4%) |
| $50,000 to $54,999 | 0 (0.0%) | 0 (0.0%) |
| $55,000 to $64,999 | 14 (6.4%) | 9 (6.1%) |
| $65,000 to $74,999 | 26 (11.9%) | 0 (0.0%) |
| $75,000 to $99,999 | 15 (6.9%) | 0 (0.0%) |
| $100,000+ | 38 (17.4%) | 0 (0.0%) |
| Total | 218 (100.0%) | 147 (100.0%) |
Earnings by Sex by Educational Attainment in Merryville
Average earnings in Merryville are $40,875 for men and $19,205 for women, a difference of 53.0%. Men with an educational attainment of bachelor's degree enjoy the highest average annual earnings of $153,438, while those with less than high school education earn the least with $20,588. Women with an educational attainment of college or associate's degree earn the most with the average annual earnings of $24,375, while those with high school diploma education have the smallest earnings of $17,202.
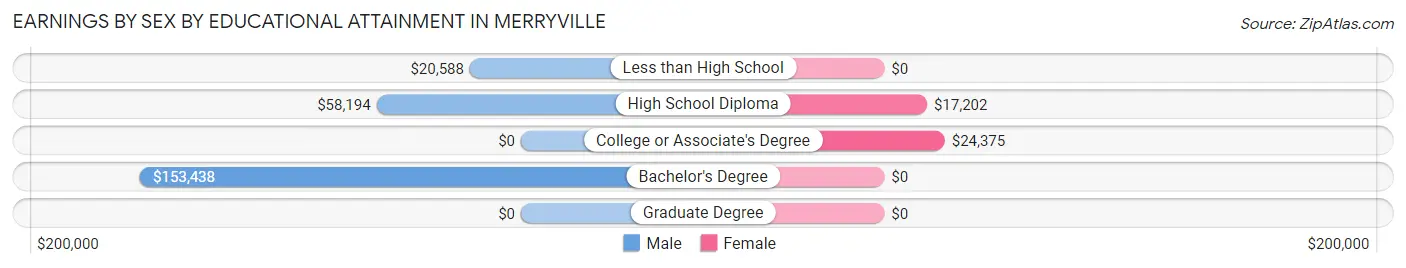
| Educational Attainment | Male Income | Female Income |
| Less than High School | $20,588 | $0 |
| High School Diploma | $58,194 | $17,202 |
| College or Associate's Degree | - | - |
| Bachelor's Degree | $153,438 | $0 |
| Graduate Degree | - | - |
| Total | $40,875 | $19,205 |
Family Income in Merryville
Family Income Brackets in Merryville
According to the Merryville family income data, there are 52 families falling into the $15,000 to $24,999 income range, which is the most common income bracket and makes up 26.9% of all families.
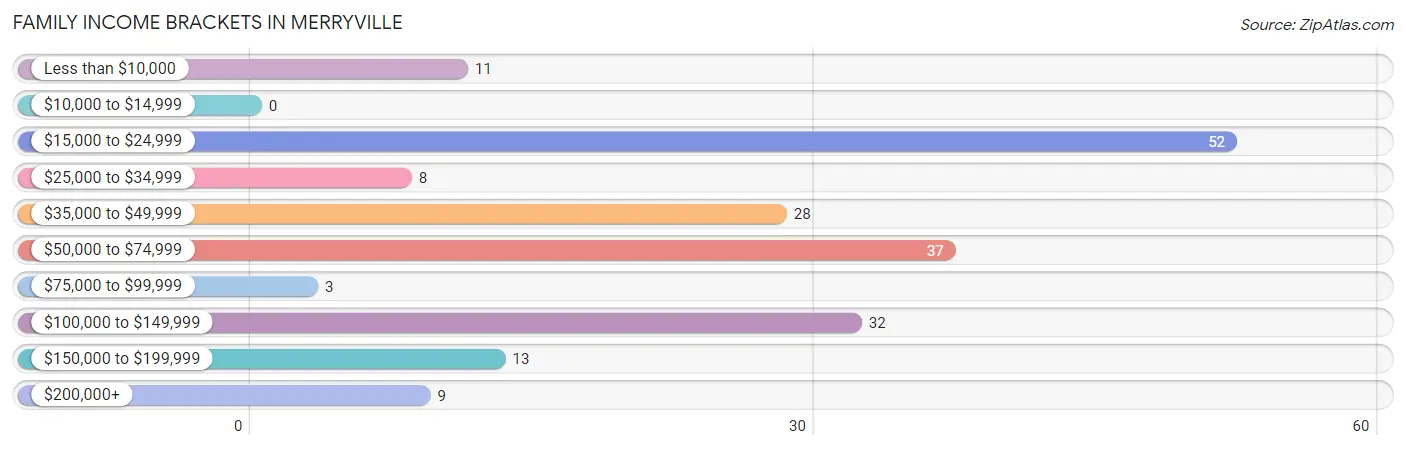
| Income Bracket | # Families | % Families |
| Less than $10,000 | 11 | 5.7% |
| $10,000 to $14,999 | 0 | 0.0% |
| $15,000 to $24,999 | 52 | 26.9% |
| $25,000 to $34,999 | 8 | 4.1% |
| $35,000 to $49,999 | 28 | 14.5% |
| $50,000 to $74,999 | 37 | 19.2% |
| $75,000 to $99,999 | 3 | 1.6% |
| $100,000 to $149,999 | 32 | 16.6% |
| $150,000 to $199,999 | 13 | 6.7% |
| $200,000+ | 9 | 4.7% |
Family Income by Famaliy Size in Merryville
3-person families (84 | 43.5%) account for the highest median family income in Merryville with $105,227 per family, while 3-person families (84 | 43.5%) have the highest median income of $35,076 per family member.
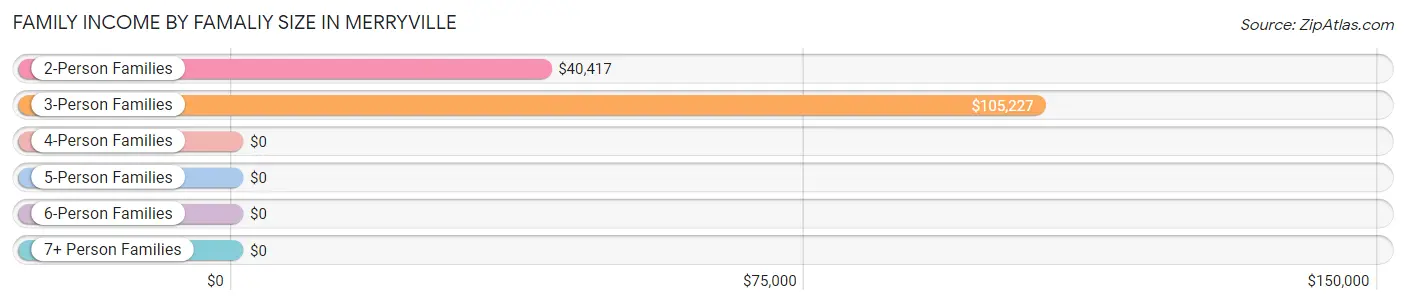
| Income Bracket | # Families | Median Income |
| 2-Person Families | 65 (33.7%) | $40,417 |
| 3-Person Families | 84 (43.5%) | $105,227 |
| 4-Person Families | 20 (10.4%) | $0 |
| 5-Person Families | 20 (10.4%) | $0 |
| 6-Person Families | 4 (2.1%) | $0 |
| 7+ Person Families | 0 (0.0%) | $0 |
| Total | 193 (100.0%) | $46,719 |
Family Income by Number of Earners in Merryville
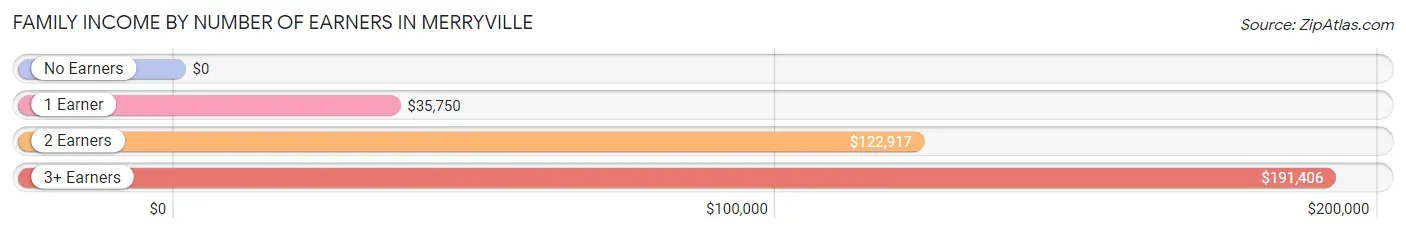
| Number of Earners | # Families | Median Income |
| No Earners | 18 (9.3%) | $0 |
| 1 Earner | 103 (53.4%) | $35,750 |
| 2 Earners | 57 (29.5%) | $122,917 |
| 3+ Earners | 15 (7.8%) | $191,406 |
| Total | 193 (100.0%) | $46,719 |
Household Income in Merryville
Household Income Brackets in Merryville
With 81 households falling in the category, the $15,000 to $24,999 income range is the most frequent in Merryville, accounting for 22.9% of all households. In contrast, only 3 households (0.9%) fall into the $75,000 to $99,999 income bracket, making it the least populous group.
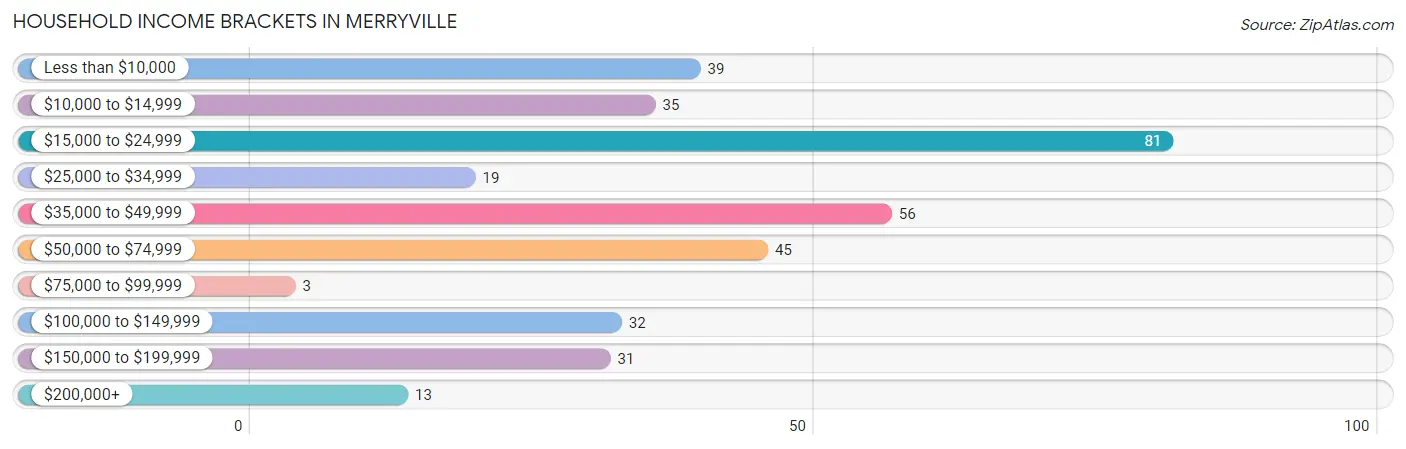
| Income Bracket | # Households | % Households |
| Less than $10,000 | 39 | 11.0% |
| $10,000 to $14,999 | 35 | 9.9% |
| $15,000 to $24,999 | 81 | 22.9% |
| $25,000 to $34,999 | 19 | 5.4% |
| $35,000 to $49,999 | 56 | 15.8% |
| $50,000 to $74,999 | 45 | 12.7% |
| $75,000 to $99,999 | 3 | 0.8% |
| $100,000 to $149,999 | 32 | 9.0% |
| $150,000 to $199,999 | 31 | 8.8% |
| $200,000+ | 13 | 3.7% |
Household Income by Householder Age in Merryville
The median household income in Merryville is $35,227, with the highest median household income of $57,500 found in the 25 to 44 years age bracket for the primary householder. A total of 72 households (20.3%) fall into this category. Meanwhile, the 65+ years age bracket for the primary householder has the lowest median household income of $0, with 66 households (18.6%) in this group.
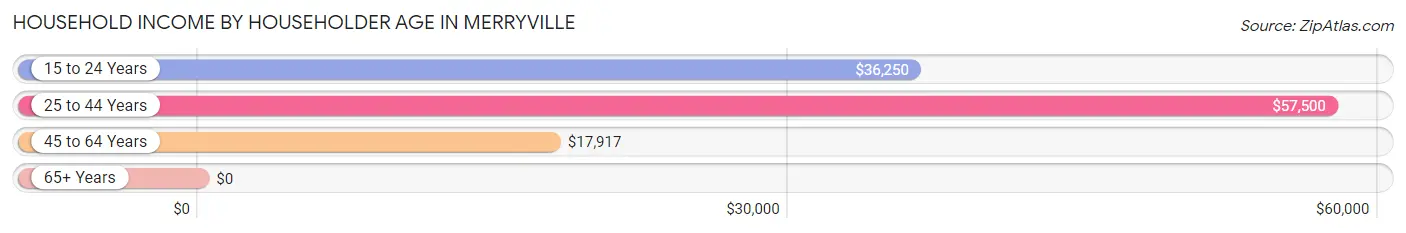
| Income Bracket | # Households | Median Income |
| 15 to 24 Years | 41 (11.6%) | $36,250 |
| 25 to 44 Years | 72 (20.3%) | $57,500 |
| 45 to 64 Years | 175 (49.4%) | $17,917 |
| 65+ Years | 66 (18.6%) | $0 |
| Total | 354 (100.0%) | $35,227 |
Poverty in Merryville
Income Below Poverty by Sex and Age in Merryville
With 32.7% poverty level for males and 39.1% for females among the residents of Merryville, under 5 year old males and 55 to 64 year old females are the most vulnerable to poverty, with 31 males (77.5%) and 39 females (84.8%) in their respective age groups living below the poverty level.
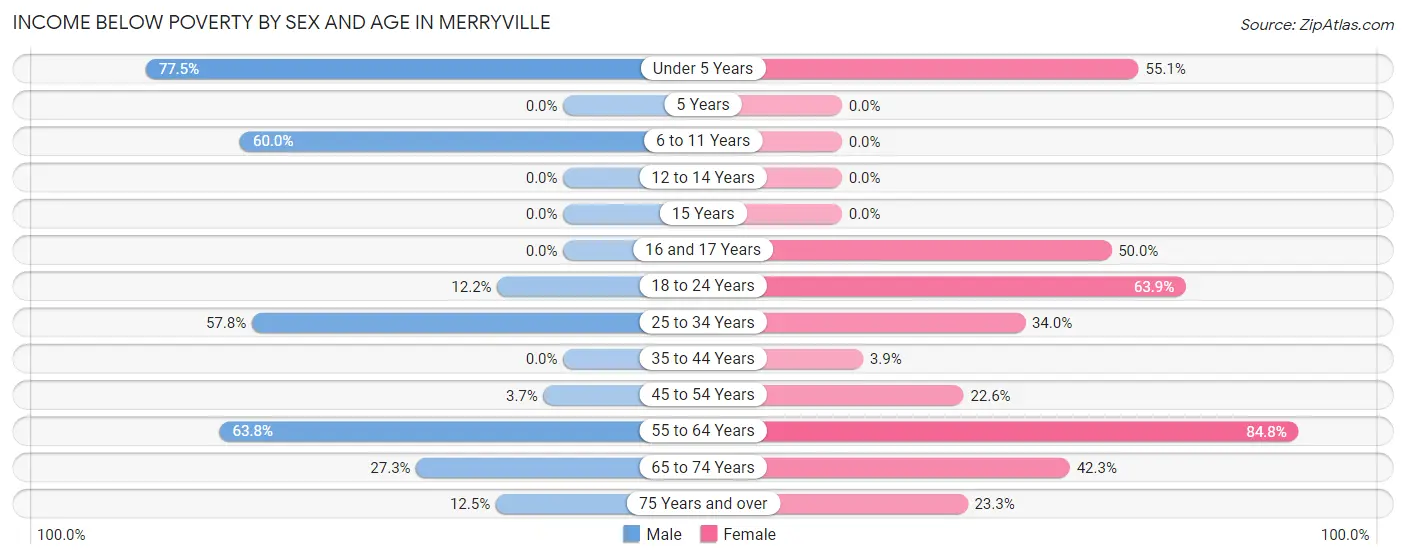
| Age Bracket | Male | Female |
| Under 5 Years | 31 (77.5%) | 27 (55.1%) |
| 5 Years | 0 (0.0%) | 0 (0.0%) |
| 6 to 11 Years | 30 (60.0%) | 0 (0.0%) |
| 12 to 14 Years | 0 (0.0%) | 0 (0.0%) |
| 15 Years | 0 (0.0%) | 0 (0.0%) |
| 16 and 17 Years | 0 (0.0%) | 3 (50.0%) |
| 18 to 24 Years | 6 (12.2%) | 46 (63.9%) |
| 25 to 34 Years | 26 (57.8%) | 17 (34.0%) |
| 35 to 44 Years | 0 (0.0%) | 2 (3.9%) |
| 45 to 54 Years | 3 (3.7%) | 7 (22.6%) |
| 55 to 64 Years | 37 (63.8%) | 39 (84.8%) |
| 65 to 74 Years | 9 (27.3%) | 22 (42.3%) |
| 75 Years and over | 2 (12.5%) | 7 (23.3%) |
| Total | 144 (32.7%) | 170 (39.1%) |
Income Above Poverty by Sex and Age in Merryville
According to the poverty statistics in Merryville, males aged 12 to 14 years and females aged 6 to 11 years are the age groups that are most secure financially, with 100.0% of males and 100.0% of females in these age groups living above the poverty line.
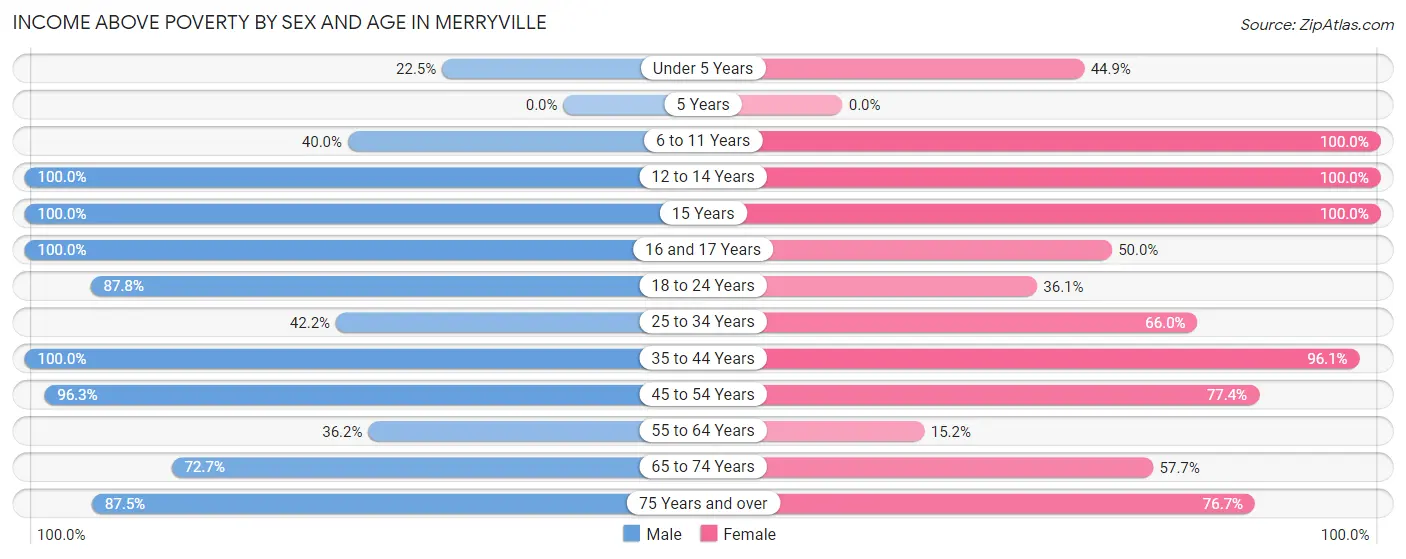
| Age Bracket | Male | Female |
| Under 5 Years | 9 (22.5%) | 22 (44.9%) |
| 5 Years | 0 (0.0%) | 0 (0.0%) |
| 6 to 11 Years | 20 (40.0%) | 15 (100.0%) |
| 12 to 14 Years | 8 (100.0%) | 27 (100.0%) |
| 15 Years | 14 (100.0%) | 6 (100.0%) |
| 16 and 17 Years | 8 (100.0%) | 3 (50.0%) |
| 18 to 24 Years | 43 (87.8%) | 26 (36.1%) |
| 25 to 34 Years | 19 (42.2%) | 33 (66.0%) |
| 35 to 44 Years | 38 (100.0%) | 49 (96.1%) |
| 45 to 54 Years | 79 (96.3%) | 24 (77.4%) |
| 55 to 64 Years | 21 (36.2%) | 7 (15.2%) |
| 65 to 74 Years | 24 (72.7%) | 30 (57.7%) |
| 75 Years and over | 14 (87.5%) | 23 (76.7%) |
| Total | 297 (67.3%) | 265 (60.9%) |
Income Below Poverty Among Married-Couple Families in Merryville
The poverty statistics for married-couple families in Merryville show that 24.8% or 28 of the total 113 families live below the poverty line. Families with 3 or 4 children have the highest poverty rate of 83.3%, comprising of 20 families. On the other hand, families with 1 or 2 children have the lowest poverty rate of 8.8%, which includes 3 families.
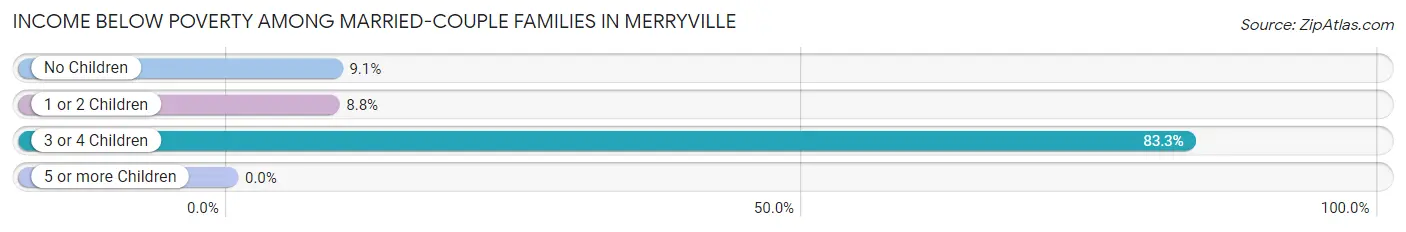
| Children | Above Poverty | Below Poverty |
| No Children | 50 (90.9%) | 5 (9.1%) |
| 1 or 2 Children | 31 (91.2%) | 3 (8.8%) |
| 3 or 4 Children | 4 (16.7%) | 20 (83.3%) |
| 5 or more Children | 0 (0.0%) | 0 (0.0%) |
| Total | 85 (75.2%) | 28 (24.8%) |
Income Below Poverty Among Single-Parent Households in Merryville
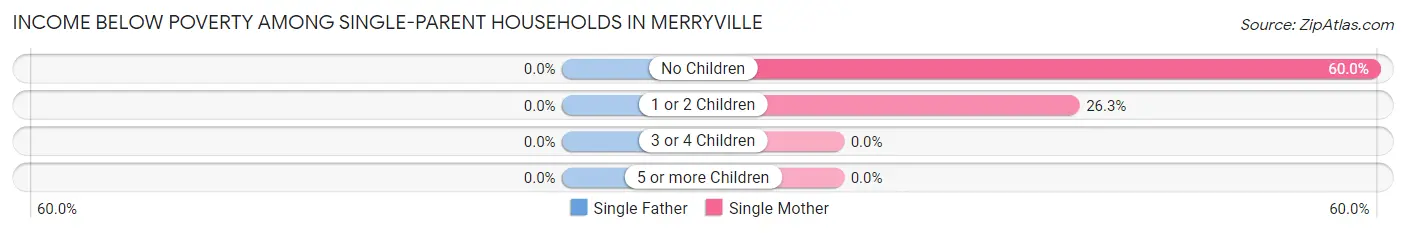
| Children | Single Father | Single Mother |
| No Children | 0 (0.0%) | 3 (60.0%) |
| 1 or 2 Children | 0 (0.0%) | 10 (26.3%) |
| 3 or 4 Children | 0 (0.0%) | 0 (0.0%) |
| 5 or more Children | 0 (0.0%) | 0 (0.0%) |
| Total | 0 (0.0%) | 13 (30.2%) |
Income Below Poverty Among Married-Couple vs Single-Parent Households in Merryville
The poverty data for Merryville shows that 28 of the married-couple family households (24.8%) and 13 of the single-parent households (16.3%) are living below the poverty level. Within the married-couple family households, those with 3 or 4 children have the highest poverty rate, with 20 households (83.3%) falling below the poverty line. Among the single-parent households, those with no children have the highest poverty rate, with 3 household (23.1%) living below poverty.
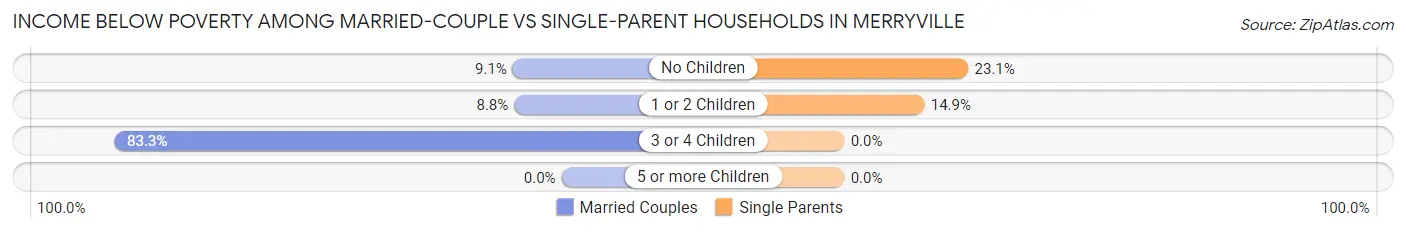
| Children | Married-Couple Families | Single-Parent Households |
| No Children | 5 (9.1%) | 3 (23.1%) |
| 1 or 2 Children | 3 (8.8%) | 10 (14.9%) |
| 3 or 4 Children | 20 (83.3%) | 0 (0.0%) |
| 5 or more Children | 0 (0.0%) | 0 (0.0%) |
| Total | 28 (24.8%) | 13 (16.3%) |
Race in Merryville
The most populous races in Merryville are White / Caucasian (761 | 82.9%), Black / African American (110 | 12.0%), and Two or more Races (40 | 4.4%).
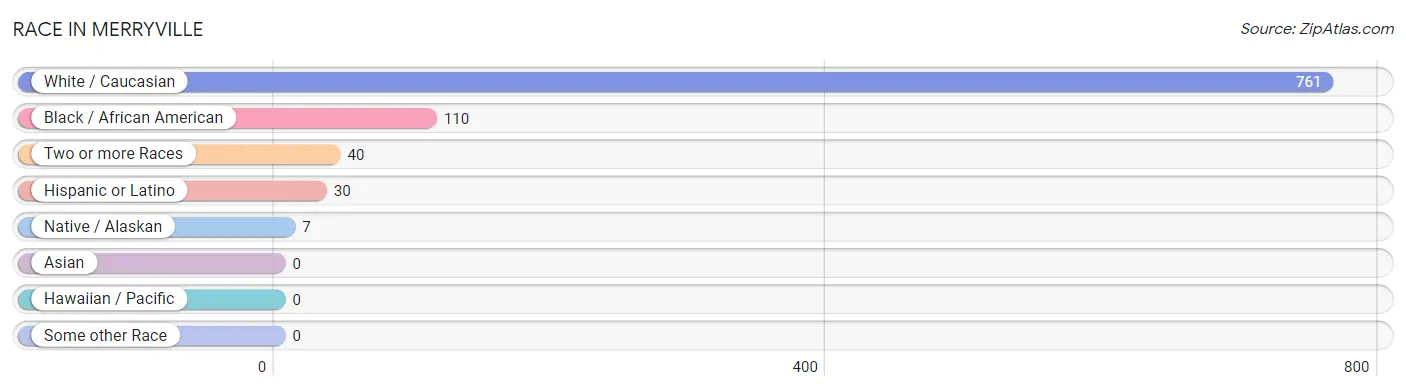
| Race | # Population | % Population |
| Asian | 0 | 0.0% |
| Black / African American | 110 | 12.0% |
| Hawaiian / Pacific | 0 | 0.0% |
| Hispanic or Latino | 30 | 3.3% |
| Native / Alaskan | 7 | 0.8% |
| White / Caucasian | 761 | 82.9% |
| Two or more Races | 40 | 4.4% |
| Some other Race | 0 | 0.0% |
| Total | 918 | 100.0% |
Ancestry in Merryville
The most populous ancestries reported in Merryville are English (121 | 13.2%), American (111 | 12.1%), Irish (92 | 10.0%), French (52 | 5.7%), and German (33 | 3.6%), together accounting for 44.5% of all Merryville residents.
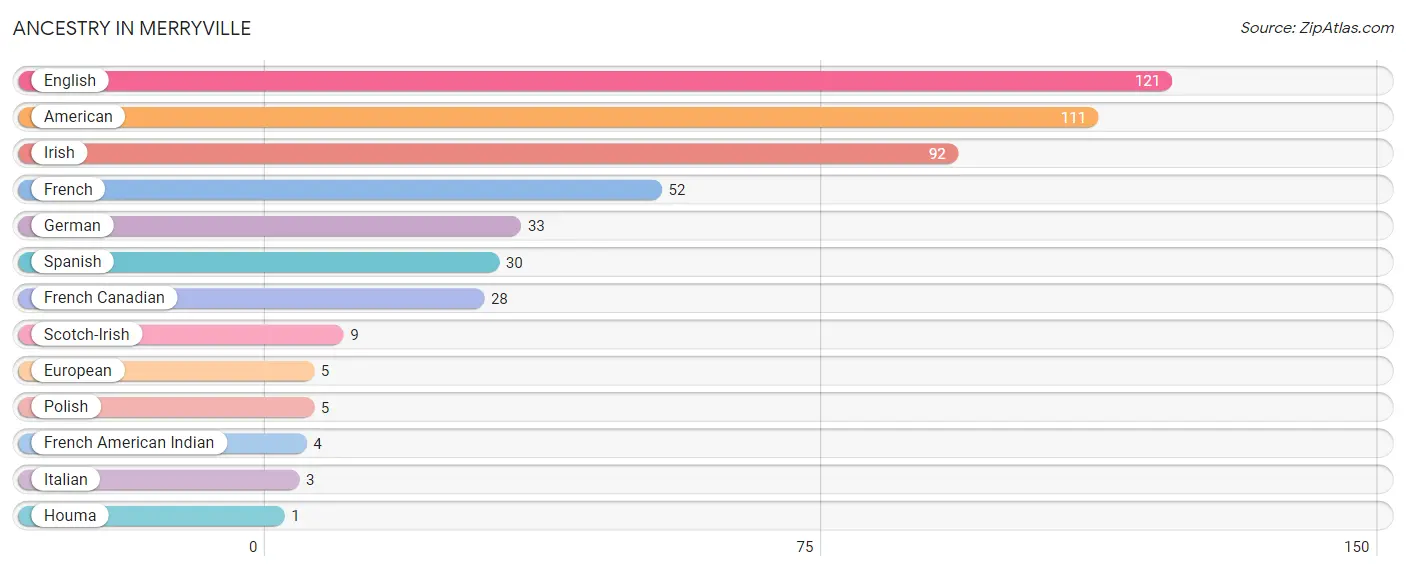
| Ancestry | # Population | % Population |
| American | 111 | 12.1% |
| English | 121 | 13.2% |
| European | 5 | 0.5% |
| French | 52 | 5.7% |
| French American Indian | 4 | 0.4% |
| French Canadian | 28 | 3.0% |
| German | 33 | 3.6% |
| Houma | 1 | 0.1% |
| Irish | 92 | 10.0% |
| Italian | 3 | 0.3% |
| Polish | 5 | 0.5% |
| Scotch-Irish | 9 | 1.0% |
| Spanish | 30 | 3.3% | View All 13 Rows |
Immigrants in Merryville
The most numerous immigrant groups reported in Merryville came from , and Canada (2 | 0.2%), together accounting for 0.2% of all Merryville residents.

| Immigration Origin | # Population | % Population |
| Canada | 2 | 0.2% | View All 1 Rows |
Sex and Age in Merryville
Sex and Age in Merryville
The most populous age groups in Merryville are 45 to 49 Years (65 | 14.1%) for men and 20 to 24 Years (72 | 15.7%) for women.
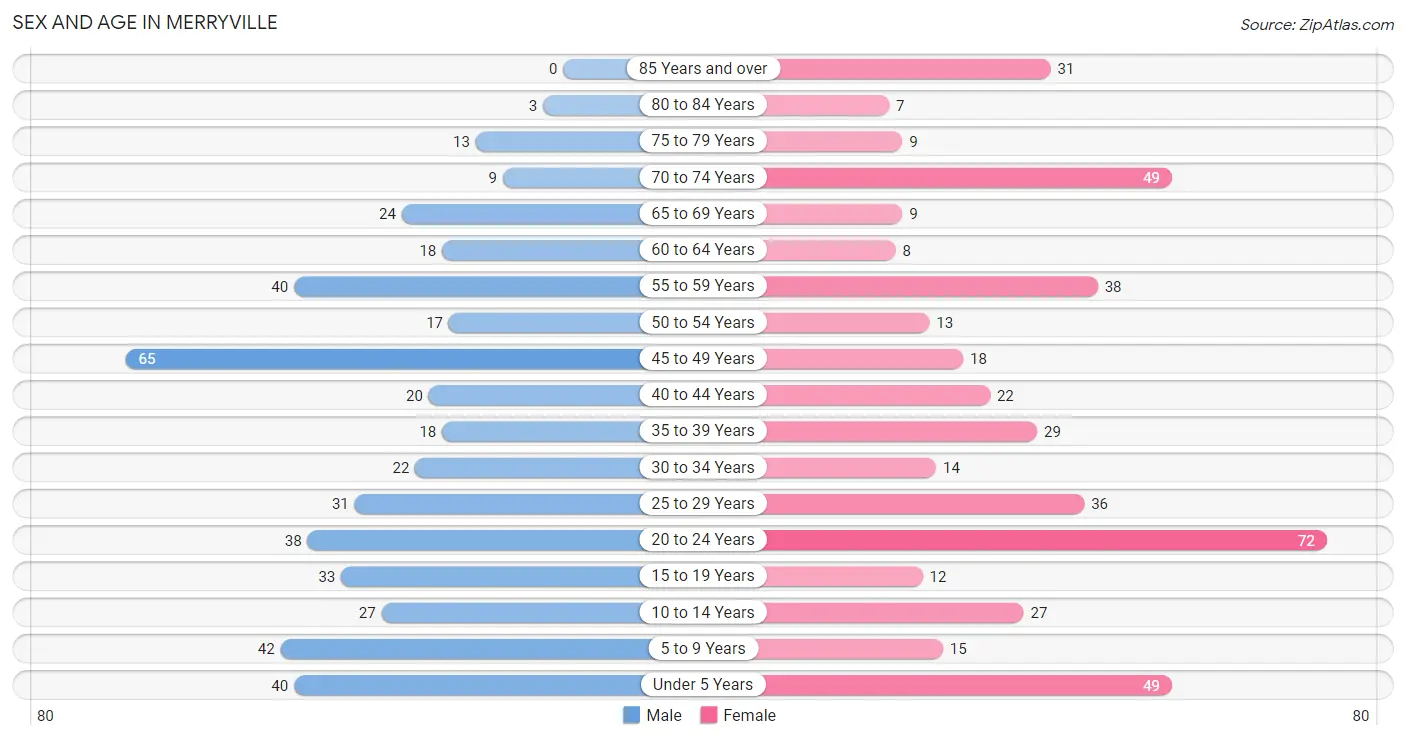
| Age Bracket | Male | Female |
| Under 5 Years | 40 (8.7%) | 49 (10.7%) |
| 5 to 9 Years | 42 (9.1%) | 15 (3.3%) |
| 10 to 14 Years | 27 (5.9%) | 27 (5.9%) |
| 15 to 19 Years | 33 (7.2%) | 12 (2.6%) |
| 20 to 24 Years | 38 (8.3%) | 72 (15.7%) |
| 25 to 29 Years | 31 (6.7%) | 36 (7.9%) |
| 30 to 34 Years | 22 (4.8%) | 14 (3.1%) |
| 35 to 39 Years | 18 (3.9%) | 29 (6.3%) |
| 40 to 44 Years | 20 (4.3%) | 22 (4.8%) |
| 45 to 49 Years | 65 (14.1%) | 18 (3.9%) |
| 50 to 54 Years | 17 (3.7%) | 13 (2.8%) |
| 55 to 59 Years | 40 (8.7%) | 38 (8.3%) |
| 60 to 64 Years | 18 (3.9%) | 8 (1.8%) |
| 65 to 69 Years | 24 (5.2%) | 9 (2.0%) |
| 70 to 74 Years | 9 (2.0%) | 49 (10.7%) |
| 75 to 79 Years | 13 (2.8%) | 9 (2.0%) |
| 80 to 84 Years | 3 (0.6%) | 7 (1.5%) |
| 85 Years and over | 0 (0.0%) | 31 (6.8%) |
| Total | 460 (100.0%) | 458 (100.0%) |
Families and Households in Merryville
Median Family Size in Merryville
The median family size in Merryville is 3.22 persons per family, with married-couple families (113 | 58.6%) accounting for the largest median family size of 3.56 persons per family. On the other hand, single male/father families (37 | 19.2%) represent the smallest median family size with 2.30 persons per family.
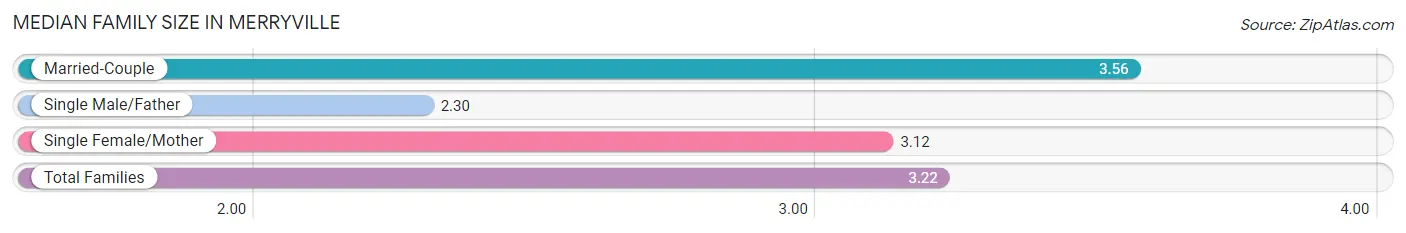
| Family Type | # Families | Family Size |
| Married-Couple | 113 (58.6%) | 3.56 |
| Single Male/Father | 37 (19.2%) | 2.30 |
| Single Female/Mother | 43 (22.3%) | 3.12 |
| Total Families | 193 (100.0%) | 3.22 |
Median Household Size in Merryville
The median household size in Merryville is 2.51 persons per household, with married-couple households (113 | 31.9%) accounting for the largest median household size of 3.64 persons per household. non-family households (161 | 45.5%) represent the smallest median household size with 1.27 persons per household.
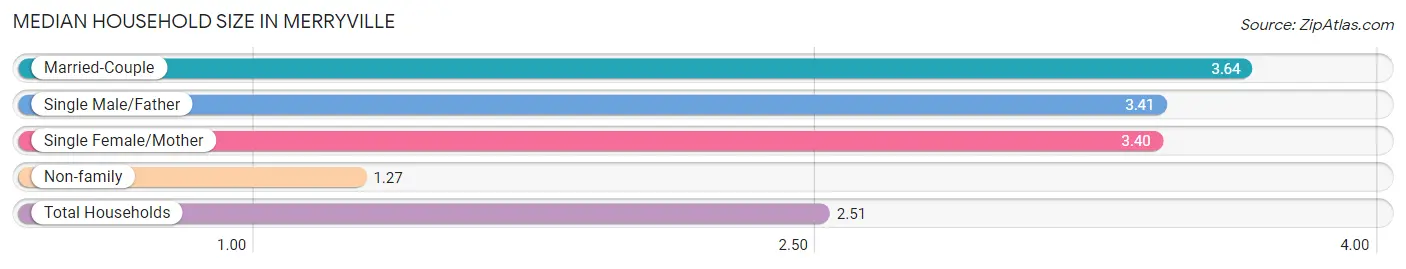
| Household Type | # Households | Household Size |
| Married-Couple | 113 (31.9%) | 3.64 |
| Single Male/Father | 37 (10.4%) | 3.41 |
| Single Female/Mother | 43 (12.1%) | 3.40 |
| Non-family | 161 (45.5%) | 1.27 |
| Total Households | 354 (100.0%) | 2.51 |
Household Size by Marriage Status in Merryville
Out of a total of 354 households in Merryville, 193 (54.5%) are family households, while 161 (45.5%) are nonfamily households. The most numerous type of family households are 3-person households, comprising 83, and the most common type of nonfamily households are 1-person households, comprising 123.
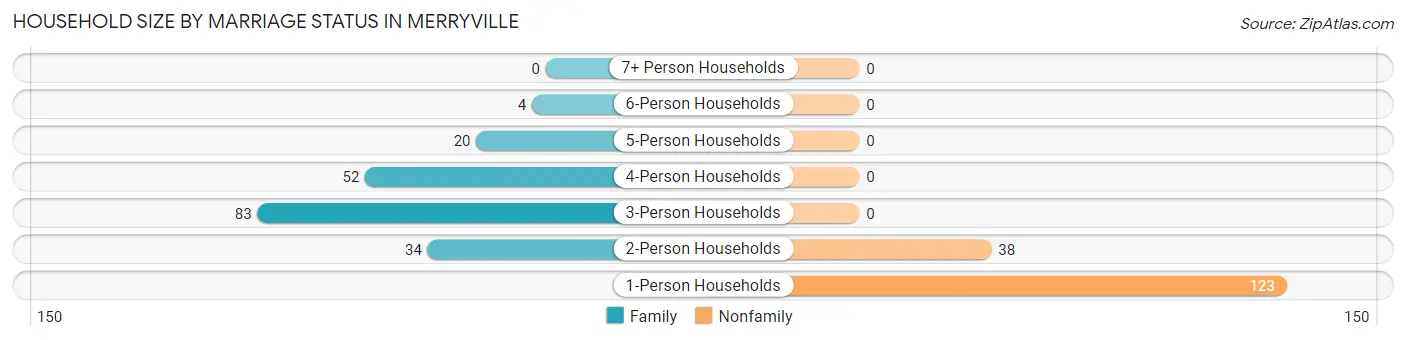
| Household Size | Family Households | Nonfamily Households |
| 1-Person Households | - | 123 (34.7%) |
| 2-Person Households | 34 (9.6%) | 38 (10.7%) |
| 3-Person Households | 83 (23.4%) | 0 (0.0%) |
| 4-Person Households | 52 (14.7%) | 0 (0.0%) |
| 5-Person Households | 20 (5.7%) | 0 (0.0%) |
| 6-Person Households | 4 (1.1%) | 0 (0.0%) |
| 7+ Person Households | 0 (0.0%) | 0 (0.0%) |
| Total | 193 (54.5%) | 161 (45.5%) |
Female Fertility in Merryville
Fertility by Age in Merryville
Average fertility rate in Merryville is 141.0 births per 1,000 women. Women in the age bracket of 15 to 19 years have the highest fertility rate with 250.0 births per 1,000 women. Women in the age bracket of 20 to 34 years acount for 89.7% of all women with births.
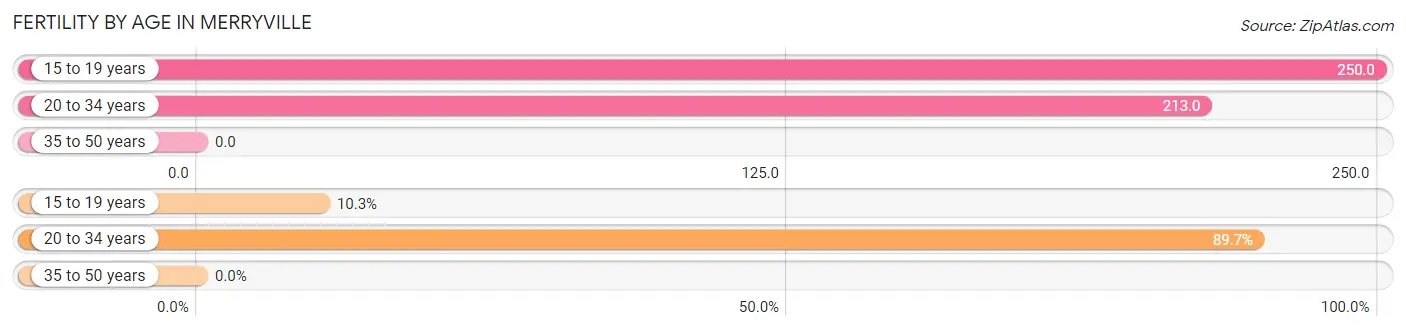
| Age Bracket | Women with Births | Births / 1,000 Women |
| 15 to 19 years | 3 (10.3%) | 250.0 |
| 20 to 34 years | 26 (89.7%) | 213.0 |
| 35 to 50 years | 0 (0.0%) | 0.0 |
| Total | 29 (100.0%) | 141.0 |
Fertility by Age by Marriage Status in Merryville
51.7% of women with births (29) in Merryville are married. The highest percentage of unmarried women with births falls into 15 to 19 years age bracket with 100.0% of them unmarried at the time of birth, while the lowest percentage of unmarried women with births belong to 20 to 34 years age bracket with 42.3% of them unmarried.
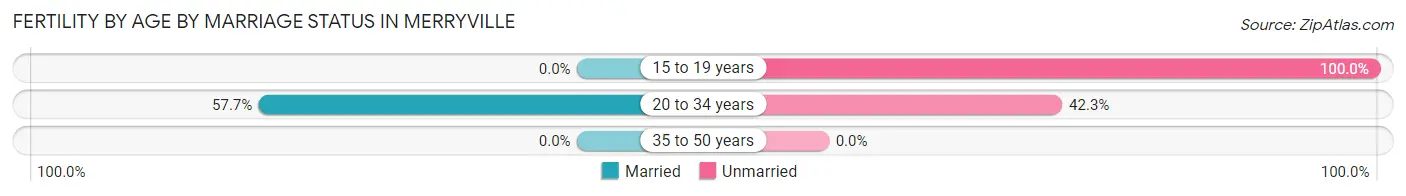
| Age Bracket | Married | Unmarried |
| 15 to 19 years | 0 (0.0%) | 3 (100.0%) |
| 20 to 34 years | 15 (57.7%) | 11 (42.3%) |
| 35 to 50 years | 0 (0.0%) | 0 (0.0%) |
| Total | 15 (51.7%) | 14 (48.3%) |
Fertility by Education in Merryville
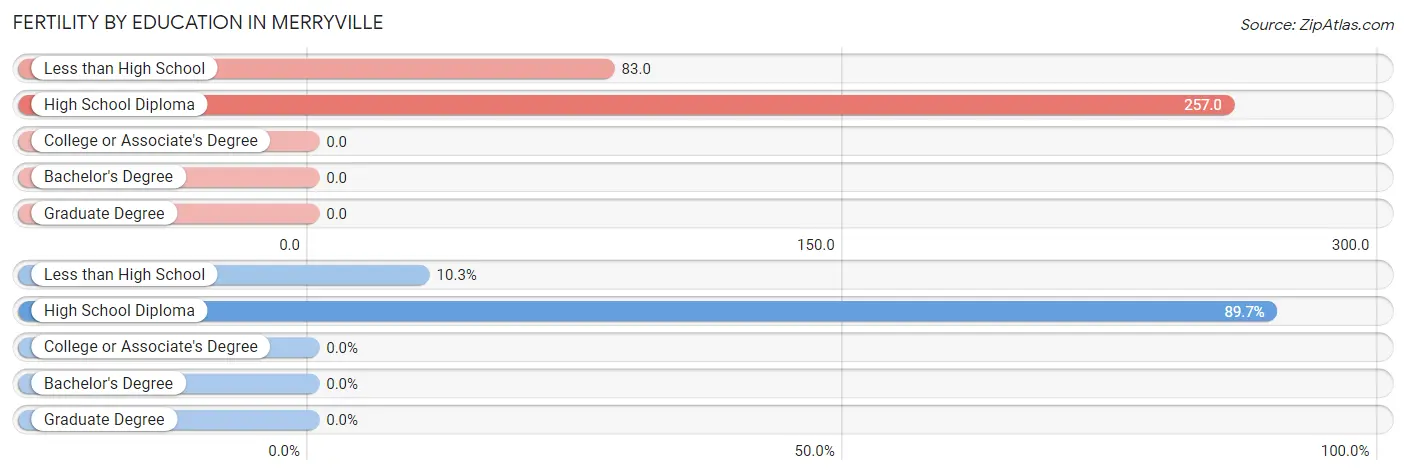
| Educational Attainment | Women with Births | Births / 1,000 Women |
| Less than High School | 3 (10.3%) | 83.0 |
| High School Diploma | 26 (89.7%) | 257.0 |
| College or Associate's Degree | 0 (0.0%) | 0.0 |
| Bachelor's Degree | 0 (0.0%) | 0.0 |
| Graduate Degree | 0 (0.0%) | 0.0 |
| Total | 29 (100.0%) | 141.0 |
Fertility by Education by Marriage Status in Merryville
48.3% of women with births in Merryville are unmarried. Women with the educational attainment of high school diploma are most likely to be married with 57.7% of them married at childbirth, while women with the educational attainment of less than high school are least likely to be married with 100.0% of them unmarried at childbirth.
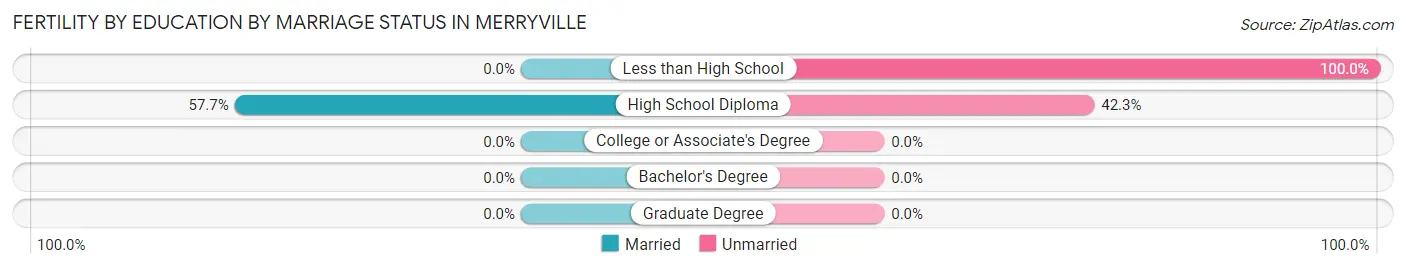
| Educational Attainment | Married | Unmarried |
| Less than High School | 0 (0.0%) | 3 (100.0%) |
| High School Diploma | 15 (57.7%) | 11 (42.3%) |
| College or Associate's Degree | 0 (0.0%) | 0 (0.0%) |
| Bachelor's Degree | 0 (0.0%) | 0 (0.0%) |
| Graduate Degree | 0 (0.0%) | 0 (0.0%) |
| Total | 15 (51.7%) | 14 (48.3%) |
Employment Characteristics in Merryville
Employment by Class of Employer in Merryville
Among the 321 employed individuals in Merryville, private company employees (212 | 66.0%), not-for-profit organizations (48 | 14.9%), and local government employees (29 | 9.0%) make up the most common classes of employment.
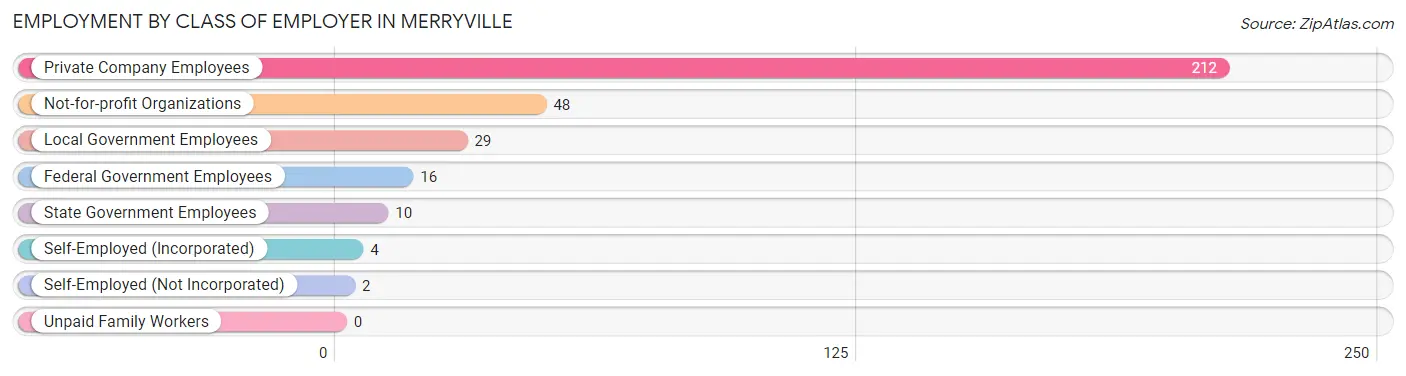
| Employer Class | # Employees | % Employees |
| Private Company Employees | 212 | 66.0% |
| Self-Employed (Incorporated) | 4 | 1.3% |
| Self-Employed (Not Incorporated) | 2 | 0.6% |
| Not-for-profit Organizations | 48 | 14.9% |
| Local Government Employees | 29 | 9.0% |
| State Government Employees | 10 | 3.1% |
| Federal Government Employees | 16 | 5.0% |
| Unpaid Family Workers | 0 | 0.0% |
| Total | 321 | 100.0% |
Employment Status by Age in Merryville
According to the labor force statistics for Merryville, out of the total population over 16 years of age (698), 55.4% or 387 individuals are in the labor force, with 16.0% or 62 of them unemployed. The age group with the highest labor force participation rate is 35 to 44 years, with 92.1% or 82 individuals in the labor force. Within the labor force, the 55 to 59 years age range has the highest percentage of unemployed individuals, with 50.0% or 13 of them being unemployed.
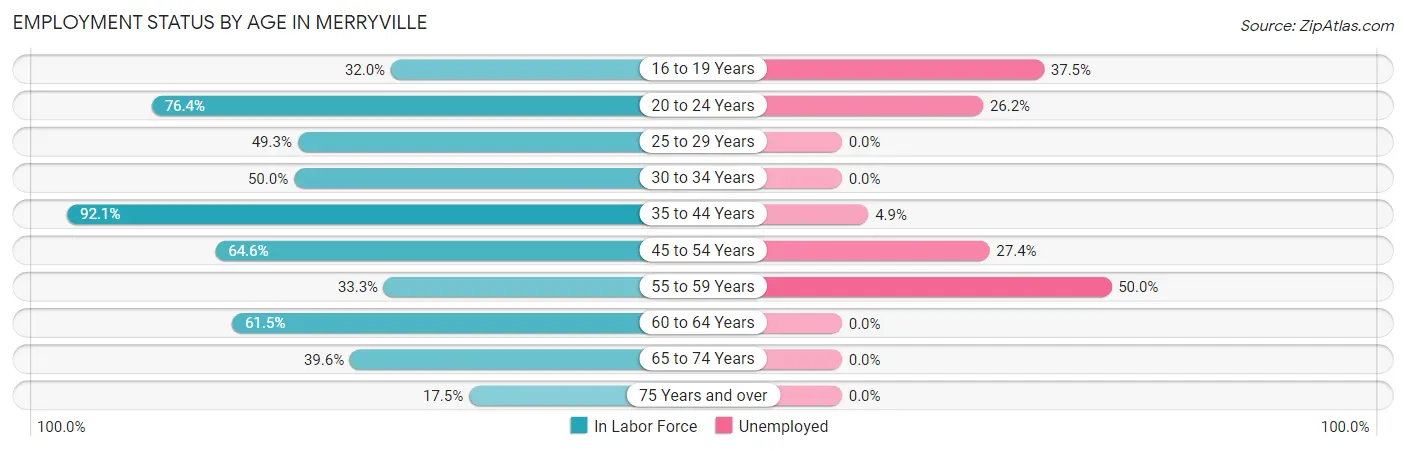
| Age Bracket | In Labor Force | Unemployed |
| 16 to 19 Years | 8 (32.0%) | 3 (37.5%) |
| 20 to 24 Years | 84 (76.4%) | 22 (26.2%) |
| 25 to 29 Years | 33 (49.3%) | 0 (0.0%) |
| 30 to 34 Years | 18 (50.0%) | 0 (0.0%) |
| 35 to 44 Years | 82 (92.1%) | 4 (4.9%) |
| 45 to 54 Years | 73 (64.6%) | 20 (27.4%) |
| 55 to 59 Years | 26 (33.3%) | 13 (50.0%) |
| 60 to 64 Years | 16 (61.5%) | 0 (0.0%) |
| 65 to 74 Years | 36 (39.6%) | 0 (0.0%) |
| 75 Years and over | 11 (17.5%) | 0 (0.0%) |
| Total | 387 (55.4%) | 62 (16.0%) |
Employment Status by Educational Attainment in Merryville
According to labor force statistics for Merryville, 60.6% of individuals (248) out of the total population between 25 and 64 years of age (409) are in the labor force, with 14.9% or 37 of them being unemployed. The group with the highest labor force participation rate are those with the educational attainment of bachelor's degree or higher, with 100.0% or 35 individuals in the labor force. Within the labor force, individuals with less than high school education have the highest percentage of unemployment, with 36.4% or 20 of them being unemployed.
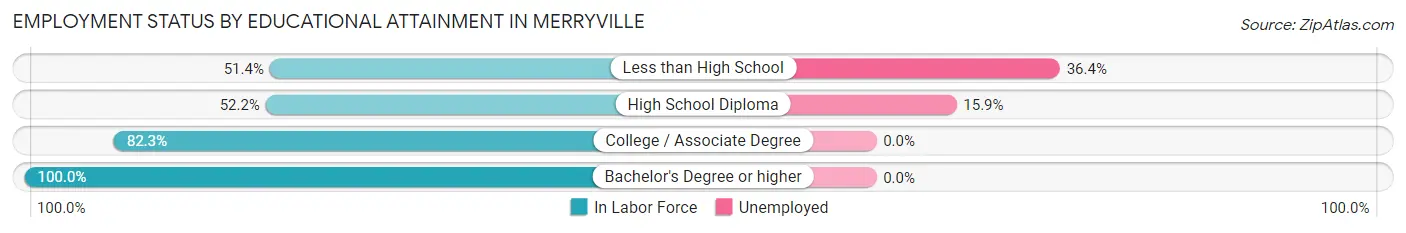
| Educational Attainment | In Labor Force | Unemployed |
| Less than High School | 55 (51.4%) | 39 (36.4%) |
| High School Diploma | 107 (52.2%) | 33 (15.9%) |
| College / Associate Degree | 51 (82.3%) | 0 (0.0%) |
| Bachelor's Degree or higher | 35 (100.0%) | 0 (0.0%) |
| Total | 248 (60.6%) | 61 (14.9%) |
Employment Occupations by Sex in Merryville
Management, Business, Science and Arts Occupations
The most common Management, Business, Science and Arts occupations in Merryville are Management (12 | 3.7%), Health Diagnosing & Treating (8 | 2.5%), Health Technologists (8 | 2.5%), and Business & Financial (4 | 1.2%).
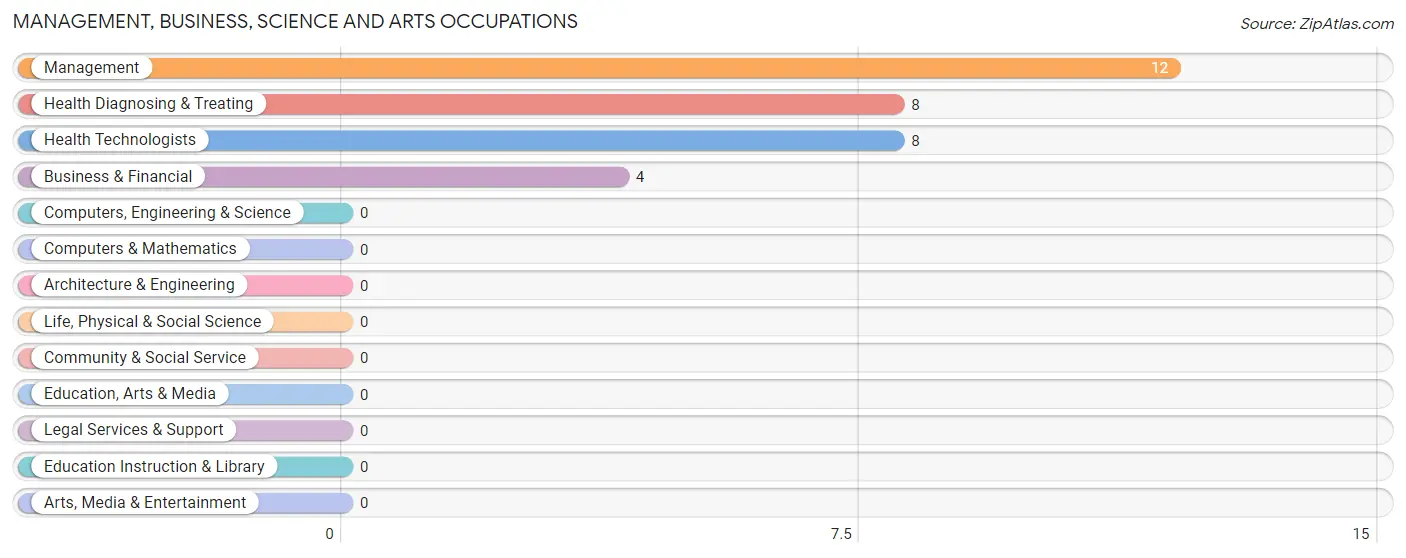
Management, Business, Science and Arts Occupations by Sex
Within the Management, Business, Science and Arts occupations in Merryville, the most male-oriented occupations are Health Diagnosing & Treating (100.0%), and Health Technologists (100.0%), while the most female-oriented occupations are Management (100.0%), and Business & Financial (100.0%).
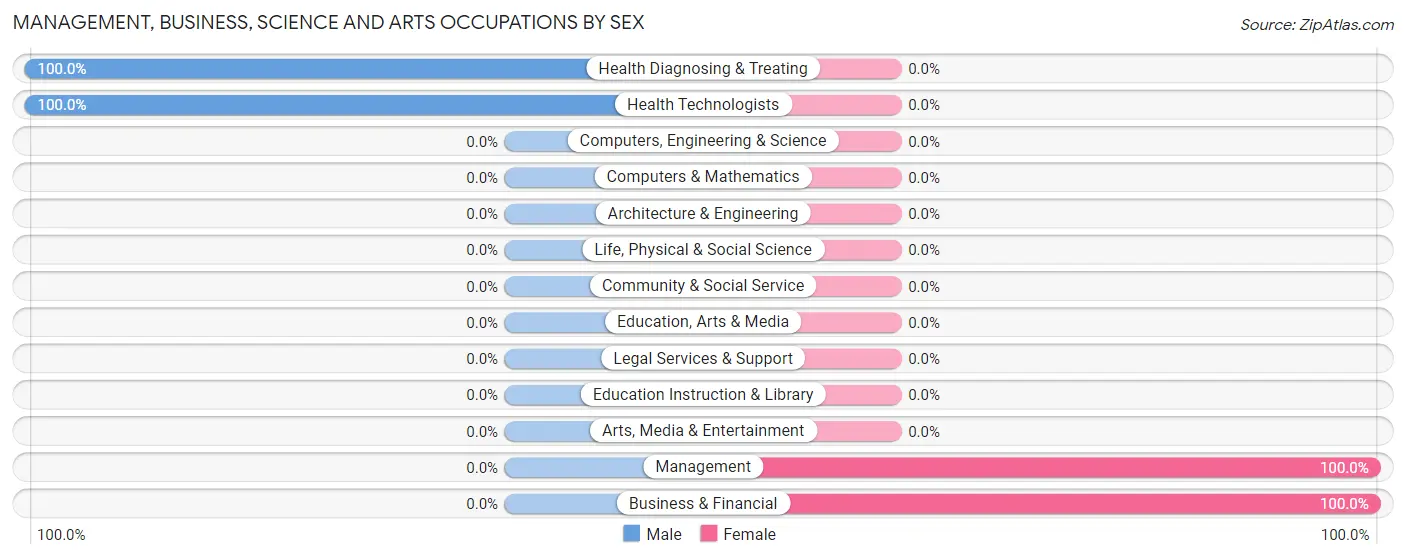
| Occupation | Male | Female |
| Management | 0 (0.0%) | 12 (100.0%) |
| Business & Financial | 0 (0.0%) | 4 (100.0%) |
| Computers, Engineering & Science | 0 (0.0%) | 0 (0.0%) |
| Computers & Mathematics | 0 (0.0%) | 0 (0.0%) |
| Architecture & Engineering | 0 (0.0%) | 0 (0.0%) |
| Life, Physical & Social Science | 0 (0.0%) | 0 (0.0%) |
| Community & Social Service | 0 (0.0%) | 0 (0.0%) |
| Education, Arts & Media | 0 (0.0%) | 0 (0.0%) |
| Legal Services & Support | 0 (0.0%) | 0 (0.0%) |
| Education Instruction & Library | 0 (0.0%) | 0 (0.0%) |
| Arts, Media & Entertainment | 0 (0.0%) | 0 (0.0%) |
| Health Diagnosing & Treating | 8 (100.0%) | 0 (0.0%) |
| Health Technologists | 8 (100.0%) | 0 (0.0%) |
| Total (Category) | 8 (33.3%) | 16 (66.7%) |
| Total (Overall) | 190 (58.5%) | 135 (41.5%) |
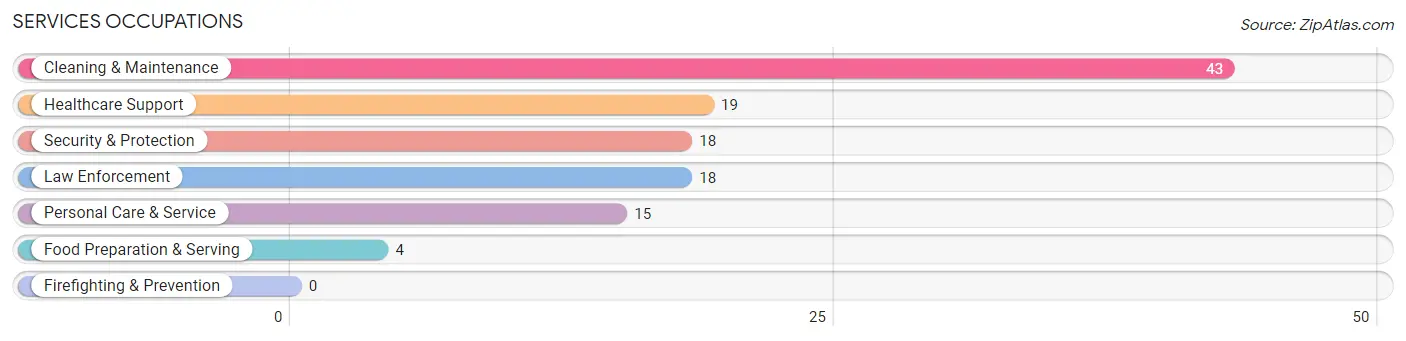
Services Occupations
The most common Services occupations in Merryville are Cleaning & Maintenance (43 | 13.2%), Healthcare Support (19 | 5.9%), Security & Protection (18 | 5.5%), Law Enforcement (18 | 5.5%), and Personal Care & Service (15 | 4.6%).
Services Occupations by Sex
Within the Services occupations in Merryville, the most male-oriented occupations are Security & Protection (83.3%), Law Enforcement (83.3%), and Cleaning & Maintenance (62.8%), while the most female-oriented occupations are Healthcare Support (100.0%), Food Preparation & Serving (100.0%), and Personal Care & Service (100.0%).
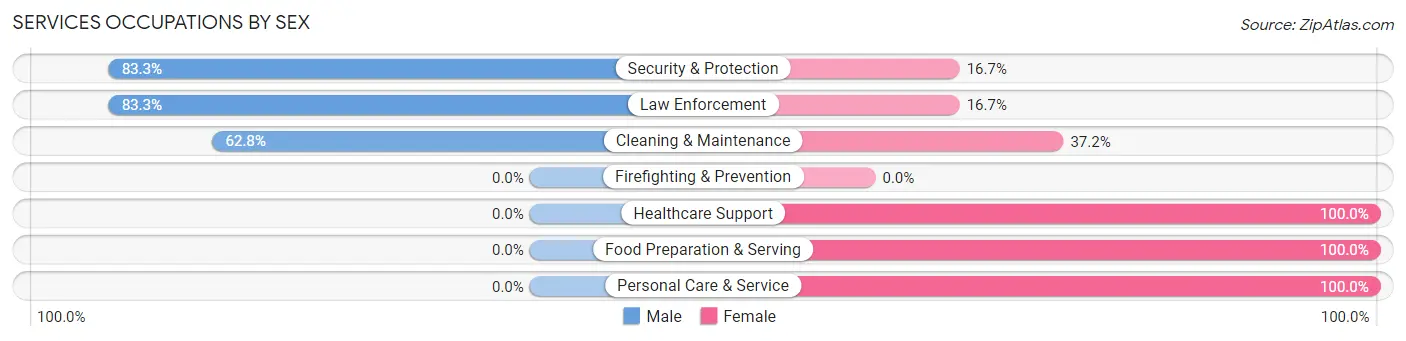
| Occupation | Male | Female |
| Healthcare Support | 0 (0.0%) | 19 (100.0%) |
| Security & Protection | 15 (83.3%) | 3 (16.7%) |
| Firefighting & Prevention | 0 (0.0%) | 0 (0.0%) |
| Law Enforcement | 15 (83.3%) | 3 (16.7%) |
| Food Preparation & Serving | 0 (0.0%) | 4 (100.0%) |
| Cleaning & Maintenance | 27 (62.8%) | 16 (37.2%) |
| Personal Care & Service | 0 (0.0%) | 15 (100.0%) |
| Total (Category) | 42 (42.4%) | 57 (57.6%) |
| Total (Overall) | 190 (58.5%) | 135 (41.5%) |
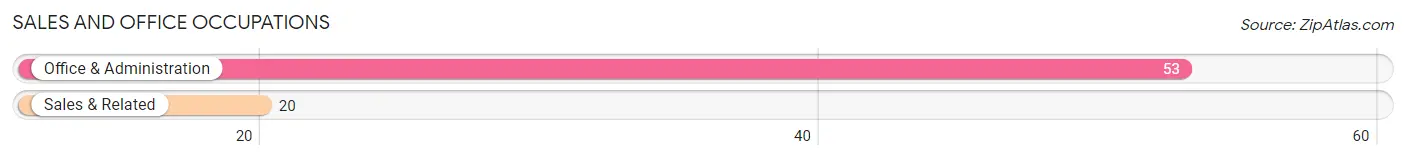
Sales and Office Occupations
The most common Sales and Office occupations in Merryville are Office & Administration (53 | 16.3%), and Sales & Related (20 | 6.1%).
Sales and Office Occupations by Sex
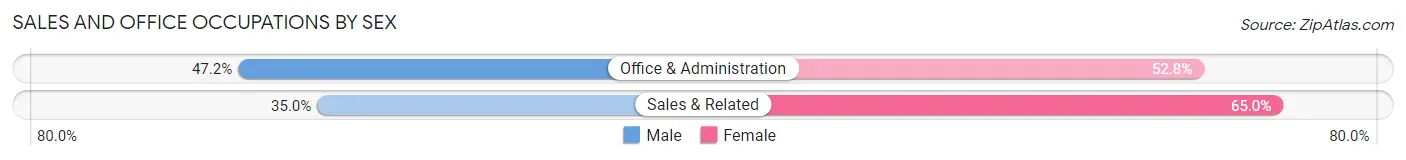
| Occupation | Male | Female |
| Sales & Related | 7 (35.0%) | 13 (65.0%) |
| Office & Administration | 25 (47.2%) | 28 (52.8%) |
| Total (Category) | 32 (43.8%) | 41 (56.2%) |
| Total (Overall) | 190 (58.5%) | 135 (41.5%) |
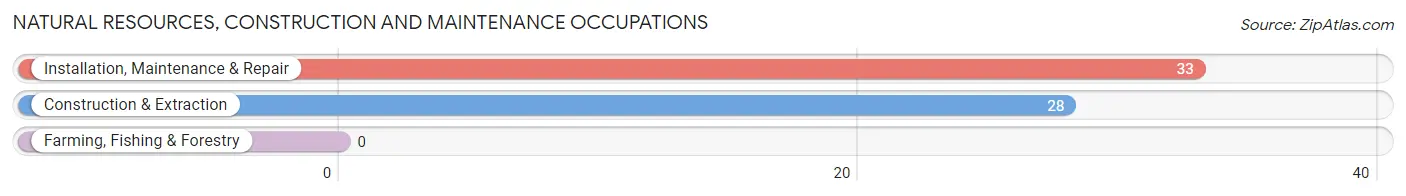
Natural Resources, Construction and Maintenance Occupations
The most common Natural Resources, Construction and Maintenance occupations in Merryville are Installation, Maintenance & Repair (33 | 10.2%), and Construction & Extraction (28 | 8.6%).
Natural Resources, Construction and Maintenance Occupations by Sex
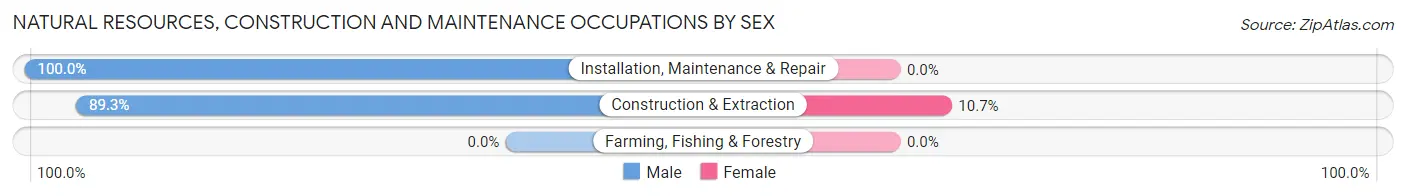
| Occupation | Male | Female |
| Farming, Fishing & Forestry | 0 (0.0%) | 0 (0.0%) |
| Construction & Extraction | 25 (89.3%) | 3 (10.7%) |
| Installation, Maintenance & Repair | 33 (100.0%) | 0 (0.0%) |
| Total (Category) | 58 (95.1%) | 3 (4.9%) |
| Total (Overall) | 190 (58.5%) | 135 (41.5%) |
Production, Transportation and Moving Occupations
The most common Production, Transportation and Moving occupations in Merryville are Transportation (31 | 9.5%), Production (20 | 6.1%), and Material Moving (17 | 5.2%).
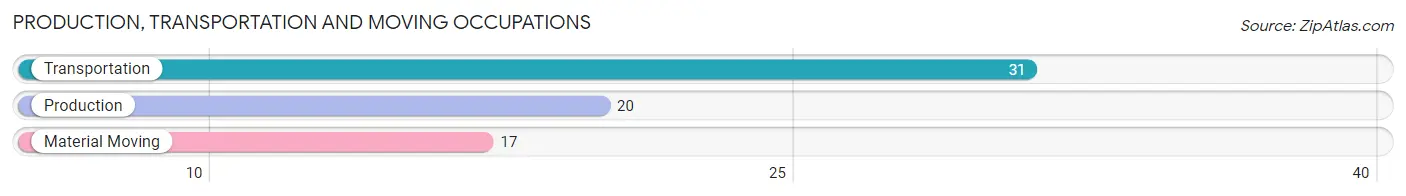
Production, Transportation and Moving Occupations by Sex
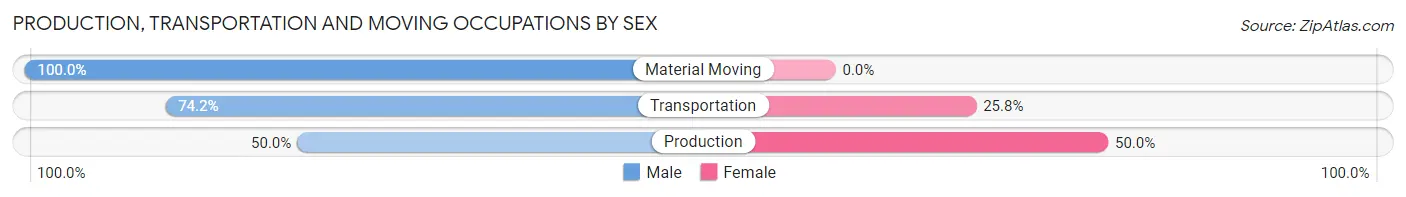
| Occupation | Male | Female |
| Production | 10 (50.0%) | 10 (50.0%) |
| Transportation | 23 (74.2%) | 8 (25.8%) |
| Material Moving | 17 (100.0%) | 0 (0.0%) |
| Total (Category) | 50 (73.5%) | 18 (26.5%) |
| Total (Overall) | 190 (58.5%) | 135 (41.5%) |
Employment Industries by Sex in Merryville
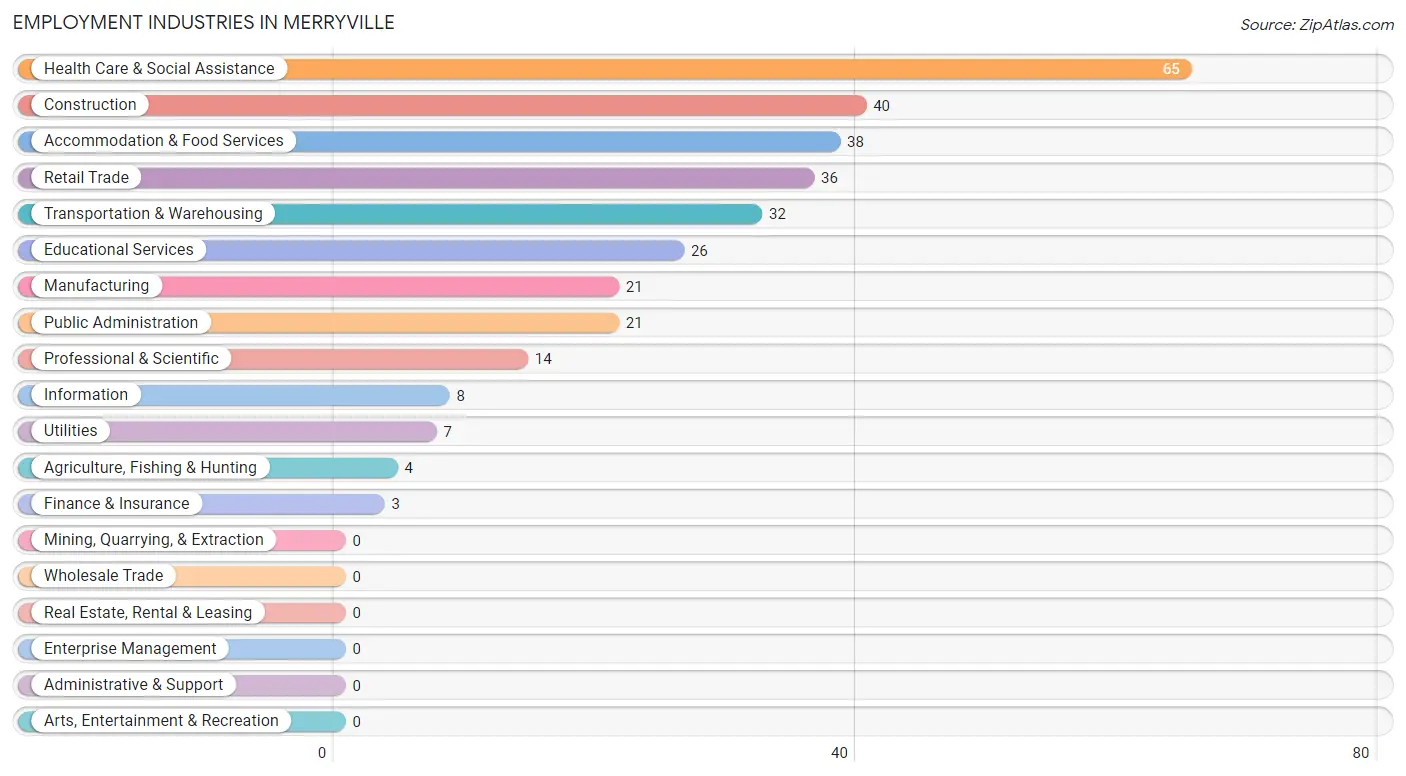
Employment Industries in Merryville
The major employment industries in Merryville include Health Care & Social Assistance (65 | 20.0%), Construction (40 | 12.3%), Accommodation & Food Services (38 | 11.7%), Retail Trade (36 | 11.1%), and Transportation & Warehousing (32 | 9.9%).
Employment Industries by Sex in Merryville
The Merryville industries that see more men than women are Agriculture, Fishing & Hunting (100.0%), Construction (100.0%), and Manufacturing (100.0%), whereas the industries that tend to have a higher number of women are Information (100.0%), Finance & Insurance (100.0%), and Health Care & Social Assistance (83.1%).
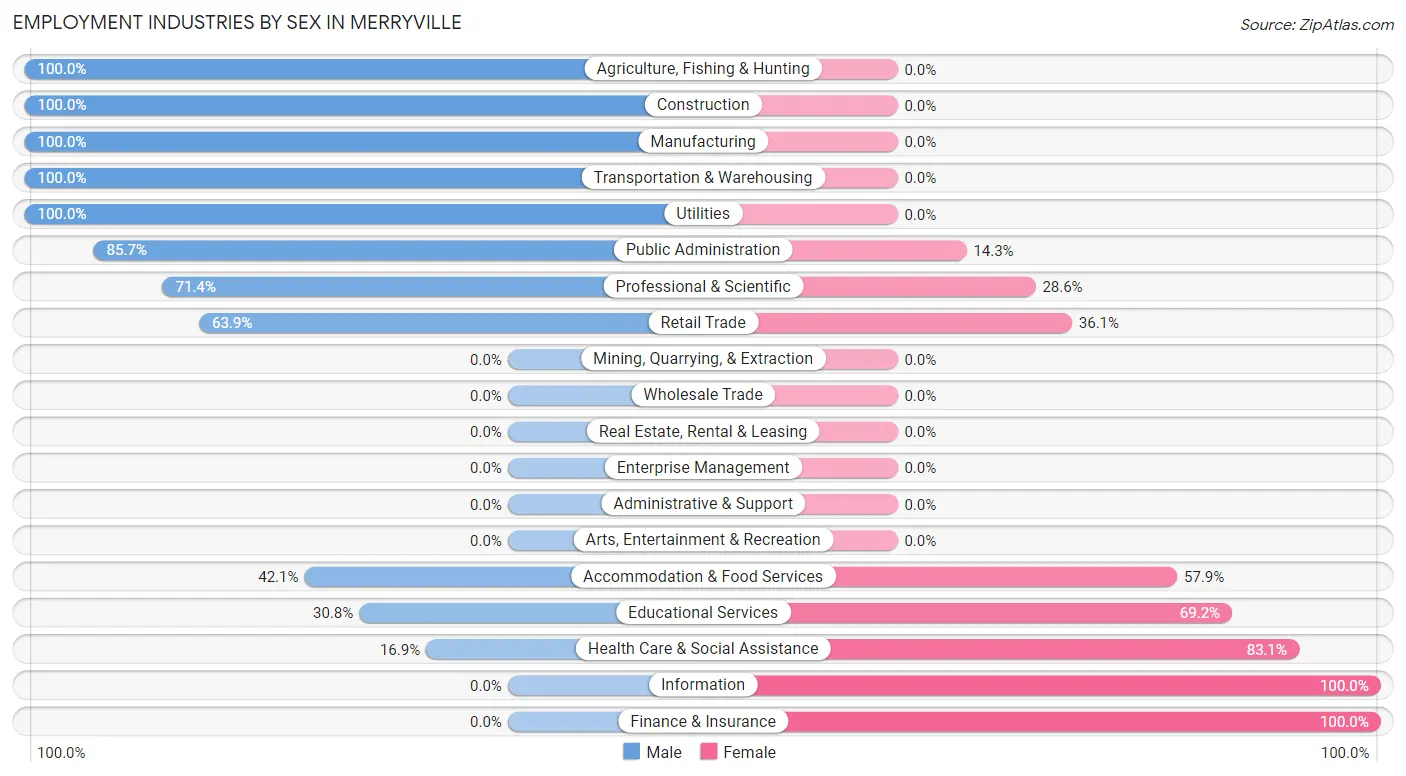
| Industry | Male | Female |
| Agriculture, Fishing & Hunting | 4 (100.0%) | 0 (0.0%) |
| Mining, Quarrying, & Extraction | 0 (0.0%) | 0 (0.0%) |
| Construction | 40 (100.0%) | 0 (0.0%) |
| Manufacturing | 21 (100.0%) | 0 (0.0%) |
| Wholesale Trade | 0 (0.0%) | 0 (0.0%) |
| Retail Trade | 23 (63.9%) | 13 (36.1%) |
| Transportation & Warehousing | 32 (100.0%) | 0 (0.0%) |
| Utilities | 7 (100.0%) | 0 (0.0%) |
| Information | 0 (0.0%) | 8 (100.0%) |
| Finance & Insurance | 0 (0.0%) | 3 (100.0%) |
| Real Estate, Rental & Leasing | 0 (0.0%) | 0 (0.0%) |
| Professional & Scientific | 10 (71.4%) | 4 (28.6%) |
| Enterprise Management | 0 (0.0%) | 0 (0.0%) |
| Administrative & Support | 0 (0.0%) | 0 (0.0%) |
| Educational Services | 8 (30.8%) | 18 (69.2%) |
| Health Care & Social Assistance | 11 (16.9%) | 54 (83.1%) |
| Arts, Entertainment & Recreation | 0 (0.0%) | 0 (0.0%) |
| Accommodation & Food Services | 16 (42.1%) | 22 (57.9%) |
| Public Administration | 18 (85.7%) | 3 (14.3%) |
| Total | 190 (58.5%) | 135 (41.5%) |
Education in Merryville
School Enrollment in Merryville
The most common levels of schooling among the 199 students in Merryville are elementary school (63 | 31.7%), high school (54 | 27.1%), and middle school (49 | 24.6%).
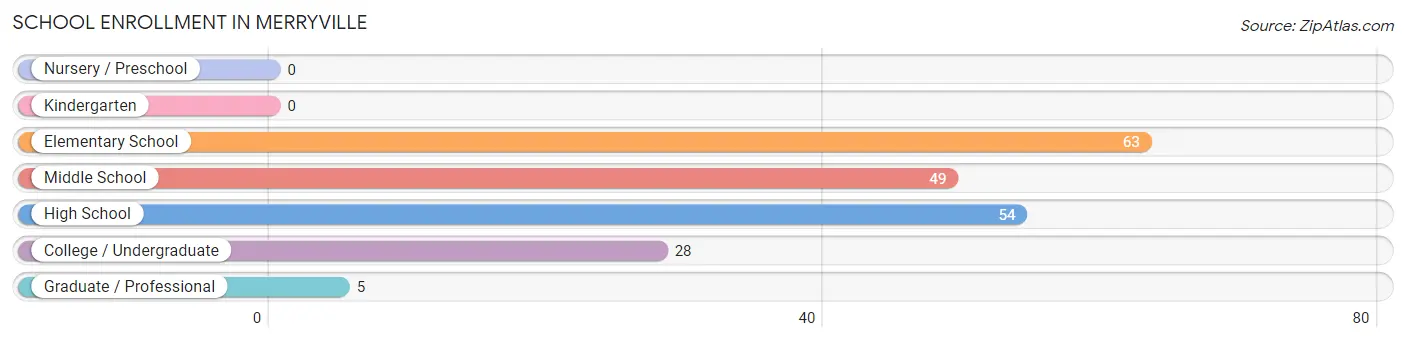
| School Level | # Students | % Students |
| Nursery / Preschool | 0 | 0.0% |
| Kindergarten | 0 | 0.0% |
| Elementary School | 63 | 31.7% |
| Middle School | 49 | 24.6% |
| High School | 54 | 27.1% |
| College / Undergraduate | 28 | 14.1% |
| Graduate / Professional | 5 | 2.5% |
| Total | 199 | 100.0% |
School Enrollment by Age by Funding Source in Merryville
Out of a total of 199 students who are enrolled in schools in Merryville, 21 (10.6%) attend a private institution, while the remaining 178 (89.4%) are enrolled in public schools. The age group of 18 to 19 year olds has the highest likelihood of being enrolled in private schools, with 5 (45.5% in the age bracket) enrolled. Conversely, the age group of 5 to 9 year old has the lowest likelihood of being enrolled in a private school, with 55 (100.0% in the age bracket) attending a public institution.
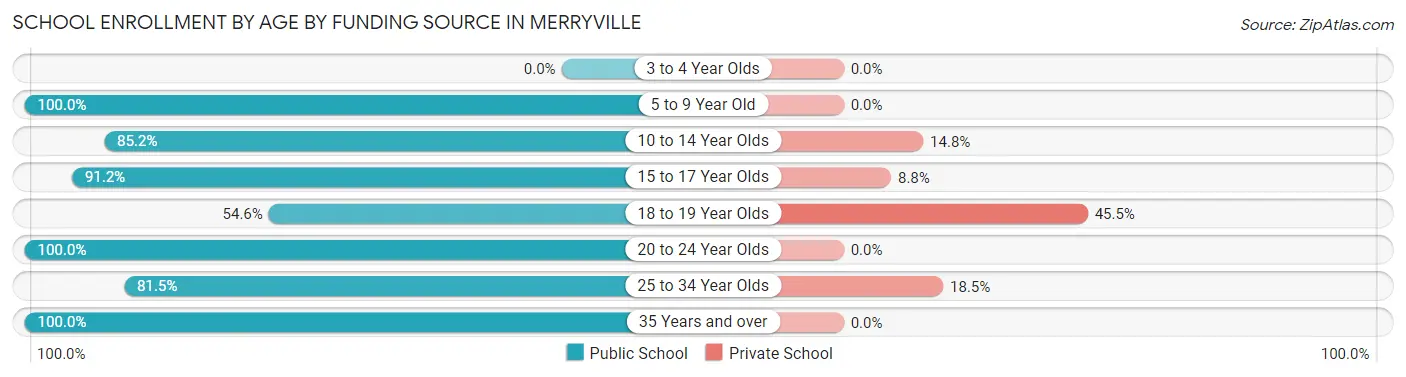
| Age Bracket | Public School | Private School |
| 3 to 4 Year Olds | 0 (0.0%) | 0 (0.0%) |
| 5 to 9 Year Old | 55 (100.0%) | 0 (0.0%) |
| 10 to 14 Year Olds | 46 (85.2%) | 8 (14.8%) |
| 15 to 17 Year Olds | 31 (91.2%) | 3 (8.8%) |
| 18 to 19 Year Olds | 6 (54.5%) | 5 (45.5%) |
| 20 to 24 Year Olds | 15 (100.0%) | 0 (0.0%) |
| 25 to 34 Year Olds | 22 (81.5%) | 5 (18.5%) |
| 35 Years and over | 3 (100.0%) | 0 (0.0%) |
| Total | 178 (89.4%) | 21 (10.6%) |
Educational Attainment by Field of Study in Merryville
Business (15 | 36.6%), science & technology (7 | 17.1%), arts & humanities (6 | 14.6%), literature & languages (5 | 12.2%), and engineering (4 | 9.8%) are the most common fields of study among 41 individuals in Merryville who have obtained a bachelor's degree or higher.
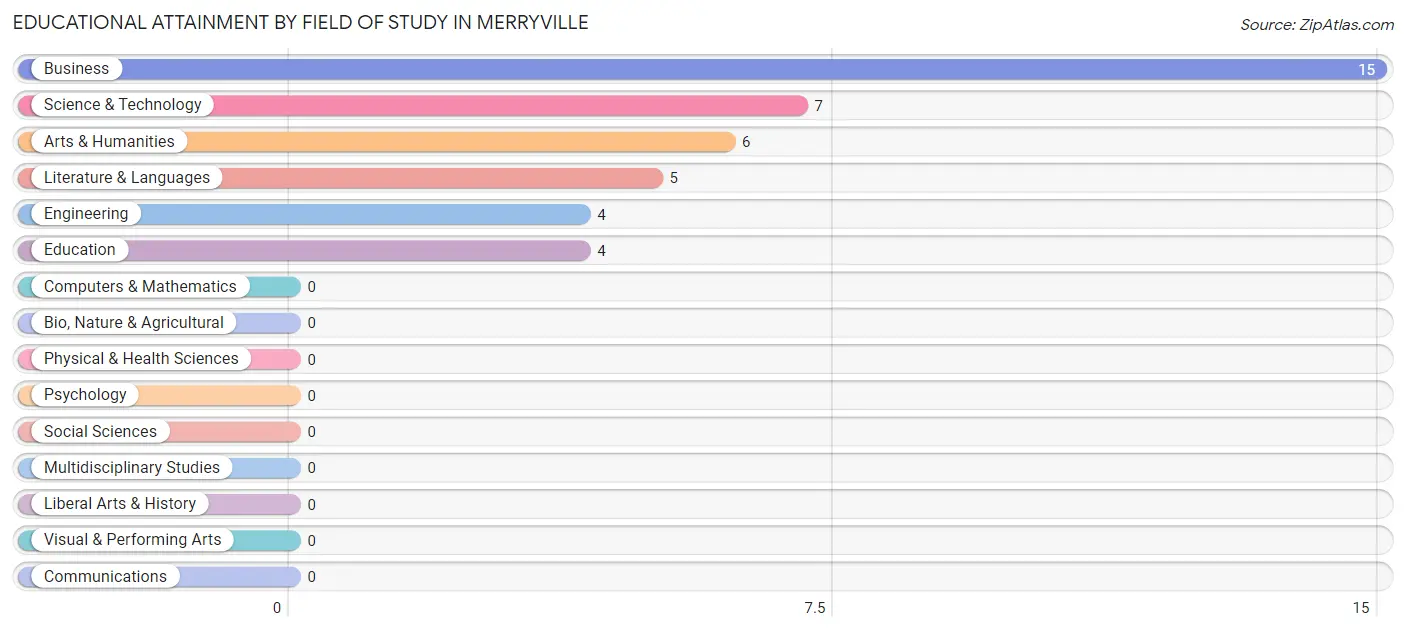
| Field of Study | # Graduates | % Graduates |
| Computers & Mathematics | 0 | 0.0% |
| Bio, Nature & Agricultural | 0 | 0.0% |
| Physical & Health Sciences | 0 | 0.0% |
| Psychology | 0 | 0.0% |
| Social Sciences | 0 | 0.0% |
| Engineering | 4 | 9.8% |
| Multidisciplinary Studies | 0 | 0.0% |
| Science & Technology | 7 | 17.1% |
| Business | 15 | 36.6% |
| Education | 4 | 9.8% |
| Literature & Languages | 5 | 12.2% |
| Liberal Arts & History | 0 | 0.0% |
| Visual & Performing Arts | 0 | 0.0% |
| Communications | 0 | 0.0% |
| Arts & Humanities | 6 | 14.6% |
| Total | 41 | 100.0% |
Transportation & Commute in Merryville
Vehicle Availability by Sex in Merryville
The most prevalent vehicle ownership categories in Merryville are males with 2 vehicles (72, accounting for 38.7%) and females with 2 vehicles (44, making up 53.3%).
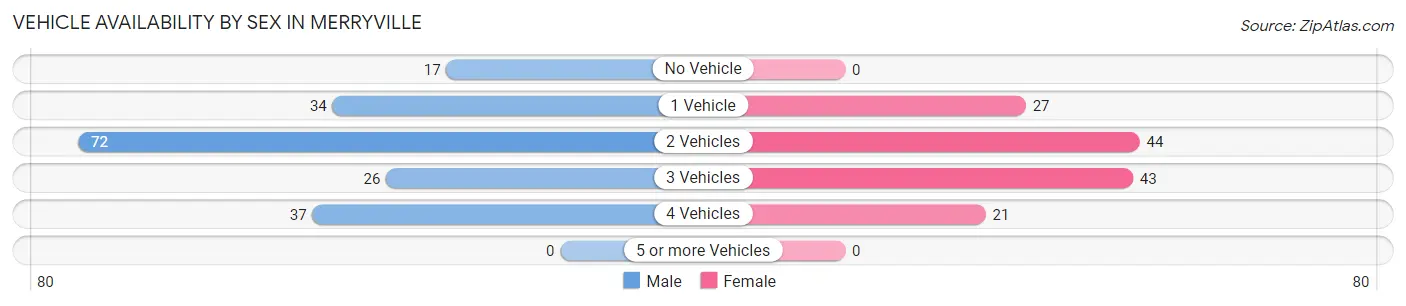
| Vehicles Available | Male | Female |
| No Vehicle | 17 (9.1%) | 0 (0.0%) |
| 1 Vehicle | 34 (18.3%) | 27 (20.0%) |
| 2 Vehicles | 72 (38.7%) | 44 (32.6%) |
| 3 Vehicles | 26 (14.0%) | 43 (31.9%) |
| 4 Vehicles | 37 (19.9%) | 21 (15.6%) |
| 5 or more Vehicles | 0 (0.0%) | 0 (0.0%) |
| Total | 186 (100.0%) | 135 (100.0%) |
Commute Time in Merryville
The most frequently occuring commute durations in Merryville are less than 5 minutes (70 commuters, 22.4%), 25 to 29 minutes (47 commuters, 15.1%), and 20 to 24 minutes (40 commuters, 12.8%).
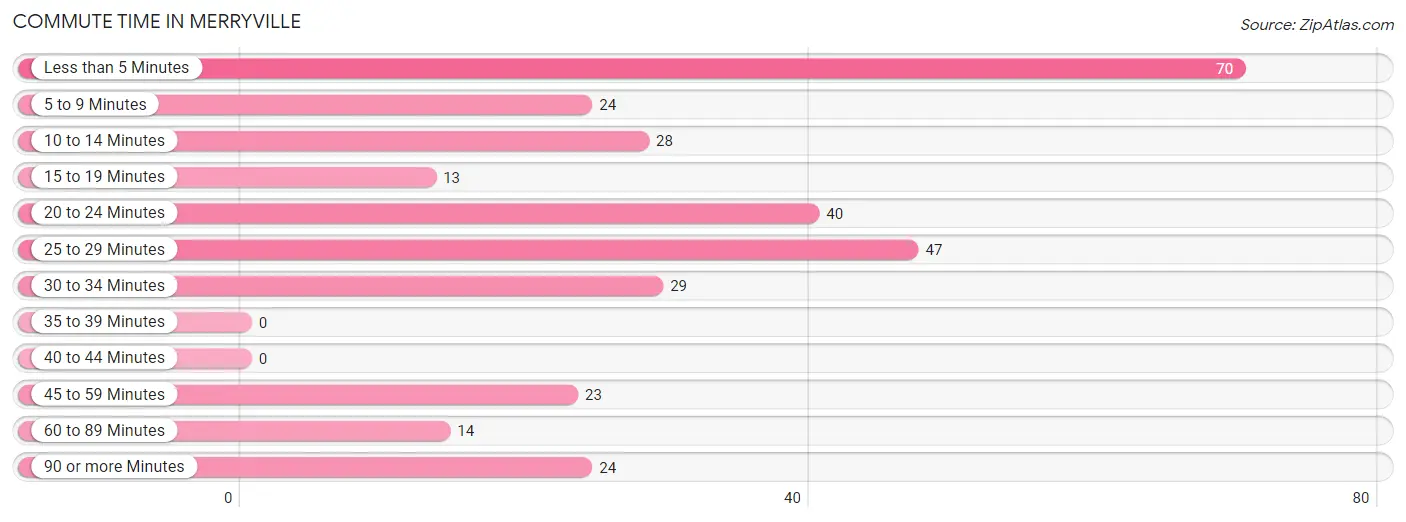
| Commute Time | # Commuters | % Commuters |
| Less than 5 Minutes | 70 | 22.4% |
| 5 to 9 Minutes | 24 | 7.7% |
| 10 to 14 Minutes | 28 | 9.0% |
| 15 to 19 Minutes | 13 | 4.2% |
| 20 to 24 Minutes | 40 | 12.8% |
| 25 to 29 Minutes | 47 | 15.1% |
| 30 to 34 Minutes | 29 | 9.3% |
| 35 to 39 Minutes | 0 | 0.0% |
| 40 to 44 Minutes | 0 | 0.0% |
| 45 to 59 Minutes | 23 | 7.4% |
| 60 to 89 Minutes | 14 | 4.5% |
| 90 or more Minutes | 24 | 7.7% |
Commute Time by Sex in Merryville
The most common commute times in Merryville are 25 to 29 minutes (26 commuters, 14.3%) for males and less than 5 minutes (50 commuters, 38.5%) for females.
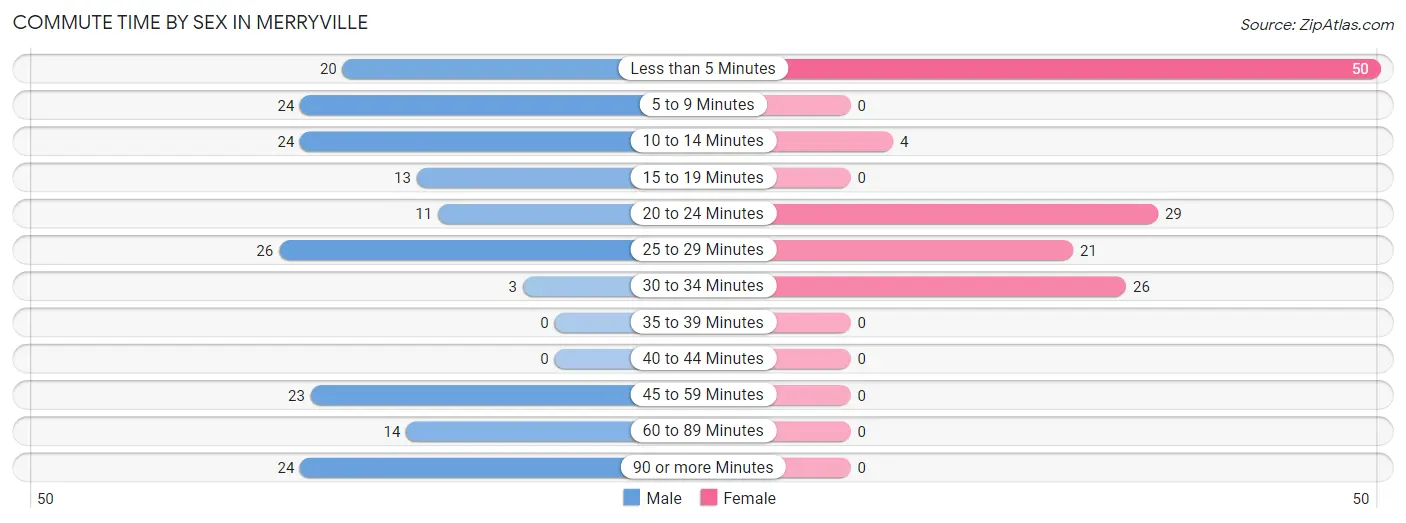
| Commute Time | Male | Female |
| Less than 5 Minutes | 20 (11.0%) | 50 (38.5%) |
| 5 to 9 Minutes | 24 (13.2%) | 0 (0.0%) |
| 10 to 14 Minutes | 24 (13.2%) | 4 (3.1%) |
| 15 to 19 Minutes | 13 (7.1%) | 0 (0.0%) |
| 20 to 24 Minutes | 11 (6.0%) | 29 (22.3%) |
| 25 to 29 Minutes | 26 (14.3%) | 21 (16.2%) |
| 30 to 34 Minutes | 3 (1.7%) | 26 (20.0%) |
| 35 to 39 Minutes | 0 (0.0%) | 0 (0.0%) |
| 40 to 44 Minutes | 0 (0.0%) | 0 (0.0%) |
| 45 to 59 Minutes | 23 (12.6%) | 0 (0.0%) |
| 60 to 89 Minutes | 14 (7.7%) | 0 (0.0%) |
| 90 or more Minutes | 24 (13.2%) | 0 (0.0%) |
Time of Departure to Work by Sex in Merryville
The most frequent times of departure to work in Merryville are 8:00 AM to 8:29 AM (35, 19.2%) for males and 6:00 AM to 6:29 AM (29, 22.3%) for females.
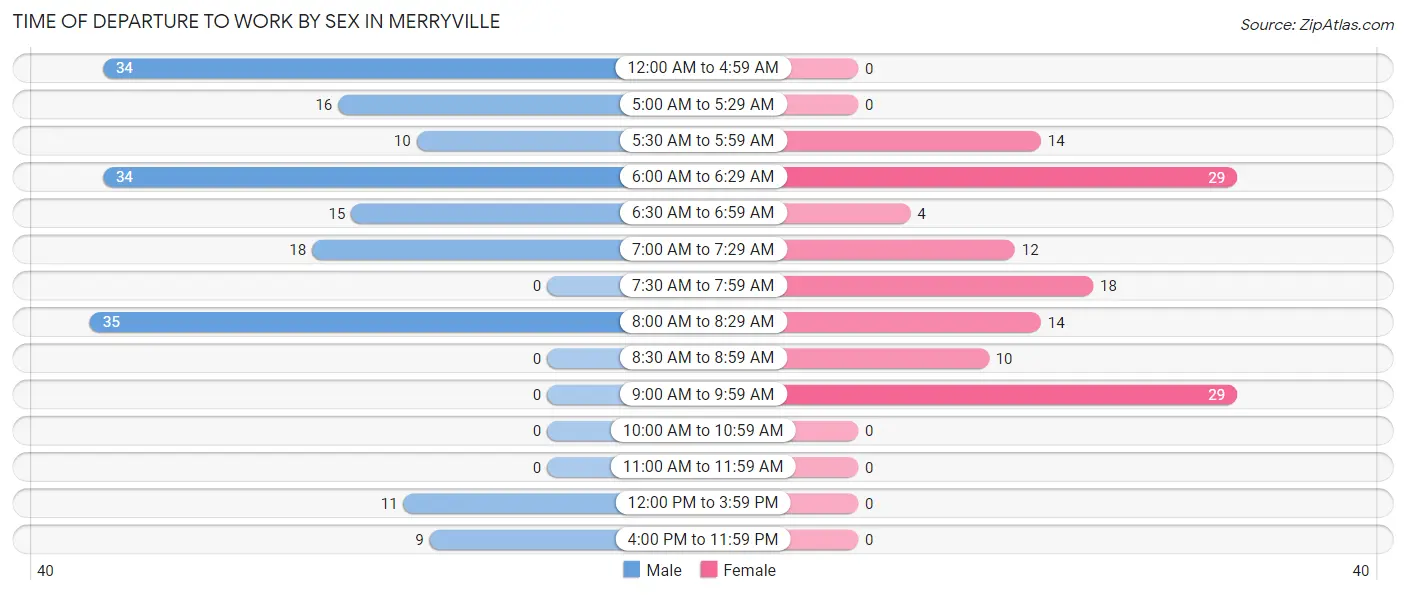
| Time of Departure | Male | Female |
| 12:00 AM to 4:59 AM | 34 (18.7%) | 0 (0.0%) |
| 5:00 AM to 5:29 AM | 16 (8.8%) | 0 (0.0%) |
| 5:30 AM to 5:59 AM | 10 (5.5%) | 14 (10.8%) |
| 6:00 AM to 6:29 AM | 34 (18.7%) | 29 (22.3%) |
| 6:30 AM to 6:59 AM | 15 (8.2%) | 4 (3.1%) |
| 7:00 AM to 7:29 AM | 18 (9.9%) | 12 (9.2%) |
| 7:30 AM to 7:59 AM | 0 (0.0%) | 18 (13.9%) |
| 8:00 AM to 8:29 AM | 35 (19.2%) | 14 (10.8%) |
| 8:30 AM to 8:59 AM | 0 (0.0%) | 10 (7.7%) |
| 9:00 AM to 9:59 AM | 0 (0.0%) | 29 (22.3%) |
| 10:00 AM to 10:59 AM | 0 (0.0%) | 0 (0.0%) |
| 11:00 AM to 11:59 AM | 0 (0.0%) | 0 (0.0%) |
| 12:00 PM to 3:59 PM | 11 (6.0%) | 0 (0.0%) |
| 4:00 PM to 11:59 PM | 9 (5.0%) | 0 (0.0%) |
| Total | 182 (100.0%) | 130 (100.0%) |
Housing Occupancy in Merryville
Occupancy by Ownership in Merryville
Of the total 354 dwellings in Merryville, owner-occupied units account for 204 (57.6%), while renter-occupied units make up 150 (42.4%).
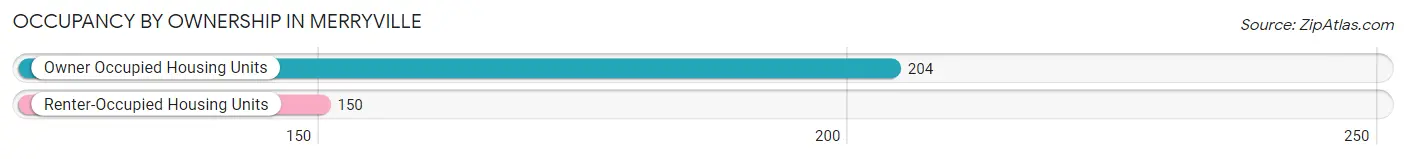
| Occupancy | # Housing Units | % Housing Units |
| Owner Occupied Housing Units | 204 | 57.6% |
| Renter-Occupied Housing Units | 150 | 42.4% |
| Total Occupied Housing Units | 354 | 100.0% |
Occupancy by Household Size in Merryville
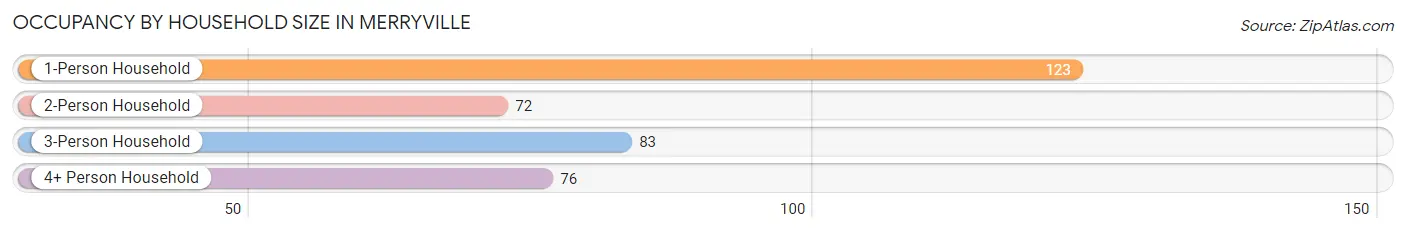
| Household Size | # Housing Units | % Housing Units |
| 1-Person Household | 123 | 34.7% |
| 2-Person Household | 72 | 20.3% |
| 3-Person Household | 83 | 23.4% |
| 4+ Person Household | 76 | 21.5% |
| Total Housing Units | 354 | 100.0% |
Occupancy by Ownership by Household Size in Merryville
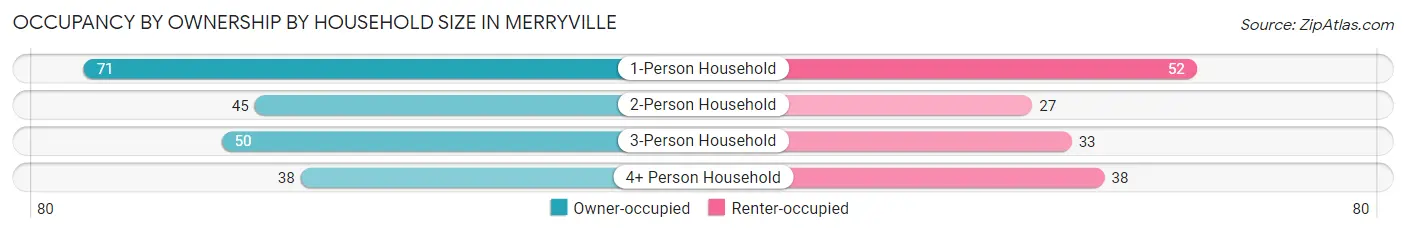
| Household Size | Owner-occupied | Renter-occupied |
| 1-Person Household | 71 (57.7%) | 52 (42.3%) |
| 2-Person Household | 45 (62.5%) | 27 (37.5%) |
| 3-Person Household | 50 (60.2%) | 33 (39.8%) |
| 4+ Person Household | 38 (50.0%) | 38 (50.0%) |
| Total Housing Units | 204 (57.6%) | 150 (42.4%) |
Occupancy by Educational Attainment in Merryville
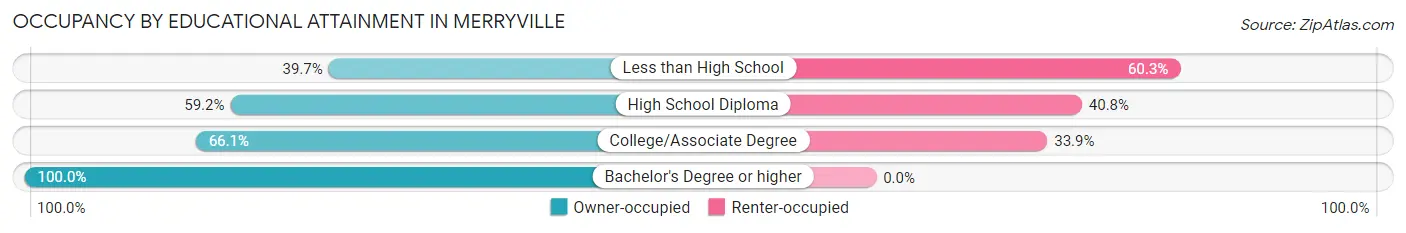
| Household Size | Owner-occupied | Renter-occupied |
| Less than High School | 31 (39.7%) | 47 (60.3%) |
| High School Diploma | 122 (59.2%) | 84 (40.8%) |
| College/Associate Degree | 37 (66.1%) | 19 (33.9%) |
| Bachelor's Degree or higher | 14 (100.0%) | 0 (0.0%) |
Occupancy by Age of Householder in Merryville
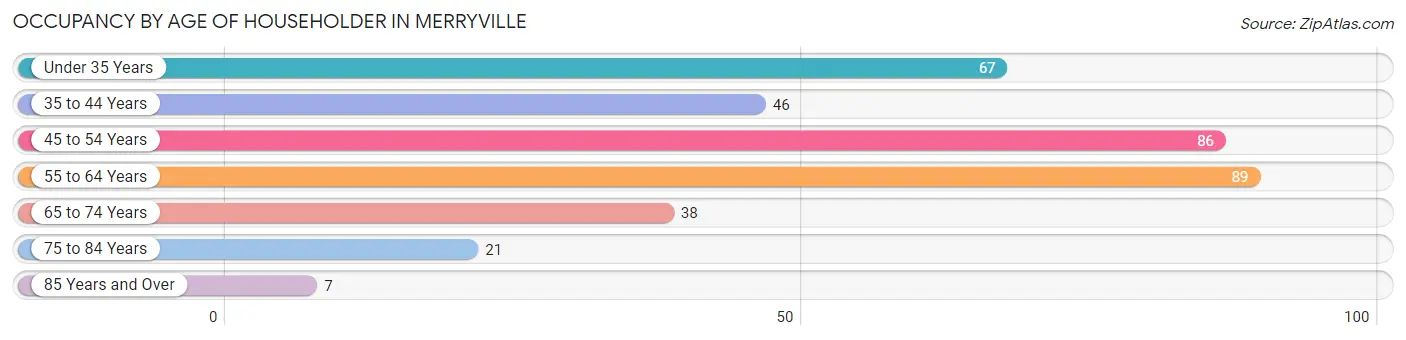
| Age Bracket | # Households | % Households |
| Under 35 Years | 67 | 18.9% |
| 35 to 44 Years | 46 | 13.0% |
| 45 to 54 Years | 86 | 24.3% |
| 55 to 64 Years | 89 | 25.1% |
| 65 to 74 Years | 38 | 10.7% |
| 75 to 84 Years | 21 | 5.9% |
| 85 Years and Over | 7 | 2.0% |
| Total | 354 | 100.0% |
Housing Finances in Merryville
Median Income by Occupancy in Merryville
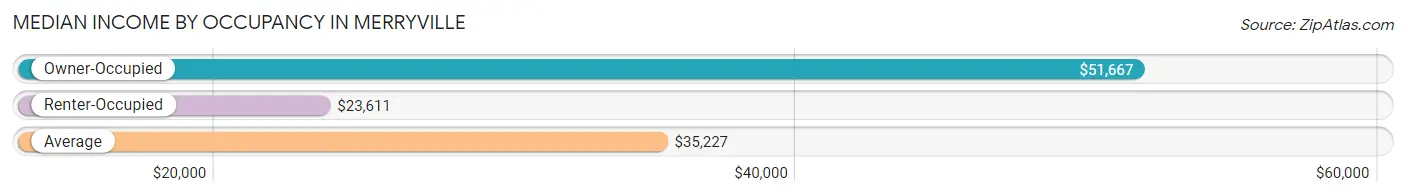
| Occupancy Type | # Households | Median Income |
| Owner-Occupied | 204 (57.6%) | $51,667 |
| Renter-Occupied | 150 (42.4%) | $23,611 |
| Average | 354 (100.0%) | $35,227 |
Occupancy by Householder Income Bracket in Merryville
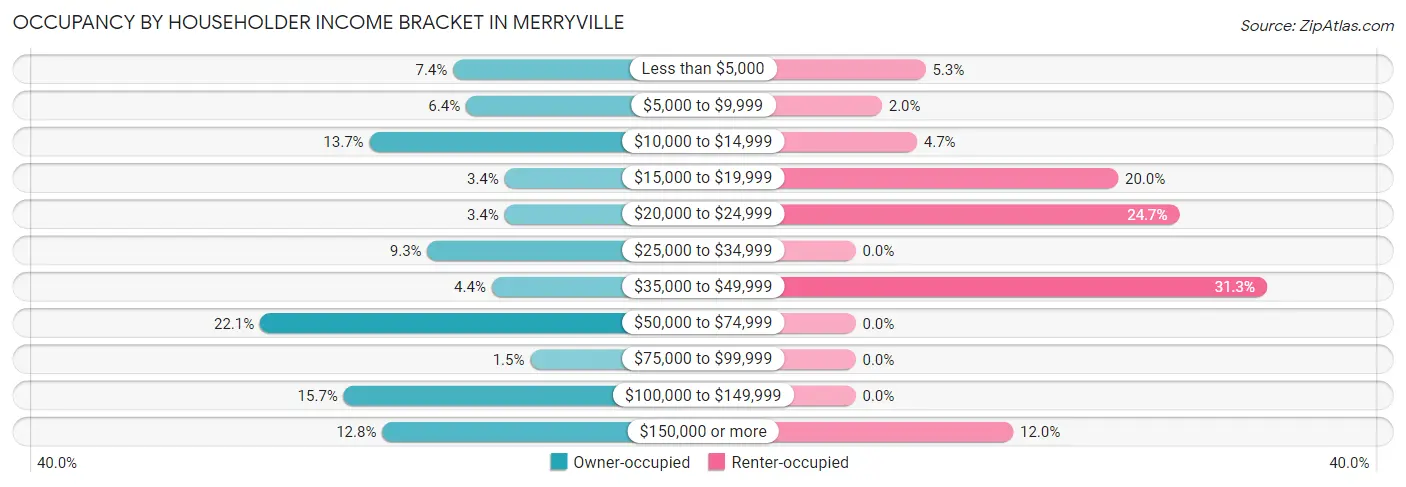
| Income Bracket | Owner-occupied | Renter-occupied |
| Less than $5,000 | 15 (7.3%) | 8 (5.3%) |
| $5,000 to $9,999 | 13 (6.4%) | 3 (2.0%) |
| $10,000 to $14,999 | 28 (13.7%) | 7 (4.7%) |
| $15,000 to $19,999 | 7 (3.4%) | 30 (20.0%) |
| $20,000 to $24,999 | 7 (3.4%) | 37 (24.7%) |
| $25,000 to $34,999 | 19 (9.3%) | 0 (0.0%) |
| $35,000 to $49,999 | 9 (4.4%) | 47 (31.3%) |
| $50,000 to $74,999 | 45 (22.1%) | 0 (0.0%) |
| $75,000 to $99,999 | 3 (1.5%) | 0 (0.0%) |
| $100,000 to $149,999 | 32 (15.7%) | 0 (0.0%) |
| $150,000 or more | 26 (12.8%) | 18 (12.0%) |
| Total | 204 (100.0%) | 150 (100.0%) |
Monthly Housing Cost Tiers in Merryville
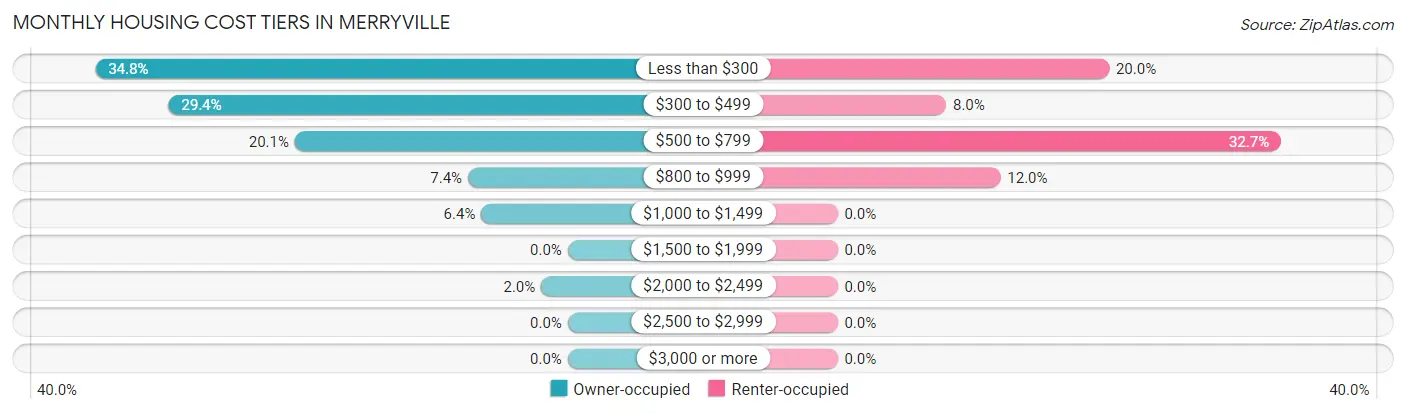
| Monthly Cost | Owner-occupied | Renter-occupied |
| Less than $300 | 71 (34.8%) | 30 (20.0%) |
| $300 to $499 | 60 (29.4%) | 12 (8.0%) |
| $500 to $799 | 41 (20.1%) | 49 (32.7%) |
| $800 to $999 | 15 (7.3%) | 18 (12.0%) |
| $1,000 to $1,499 | 13 (6.4%) | 0 (0.0%) |
| $1,500 to $1,999 | 0 (0.0%) | 0 (0.0%) |
| $2,000 to $2,499 | 4 (2.0%) | 0 (0.0%) |
| $2,500 to $2,999 | 0 (0.0%) | 0 (0.0%) |
| $3,000 or more | 0 (0.0%) | 0 (0.0%) |
| Total | 204 (100.0%) | 150 (100.0%) |
Physical Housing Characteristics in Merryville
Housing Structures in Merryville
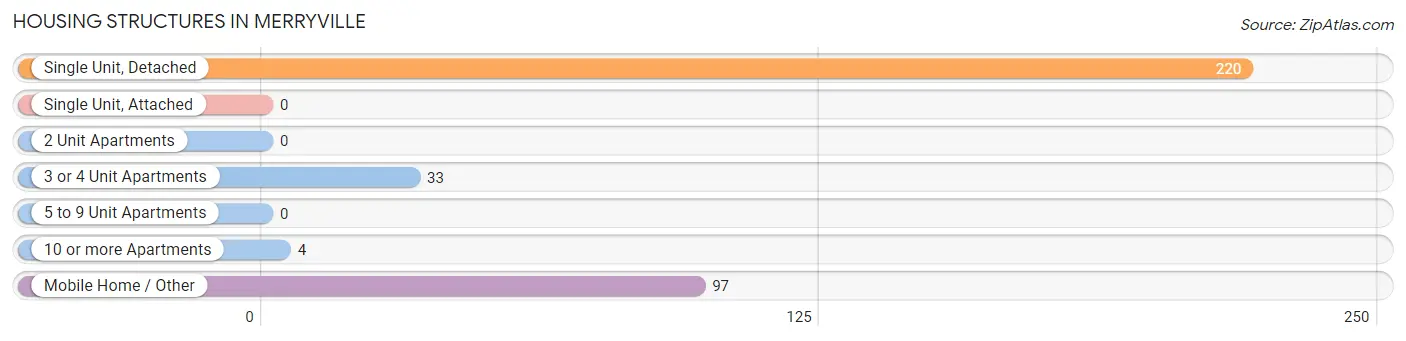
| Structure Type | # Housing Units | % Housing Units |
| Single Unit, Detached | 220 | 62.2% |
| Single Unit, Attached | 0 | 0.0% |
| 2 Unit Apartments | 0 | 0.0% |
| 3 or 4 Unit Apartments | 33 | 9.3% |
| 5 to 9 Unit Apartments | 0 | 0.0% |
| 10 or more Apartments | 4 | 1.1% |
| Mobile Home / Other | 97 | 27.4% |
| Total | 354 | 100.0% |
Housing Structures by Occupancy in Merryville
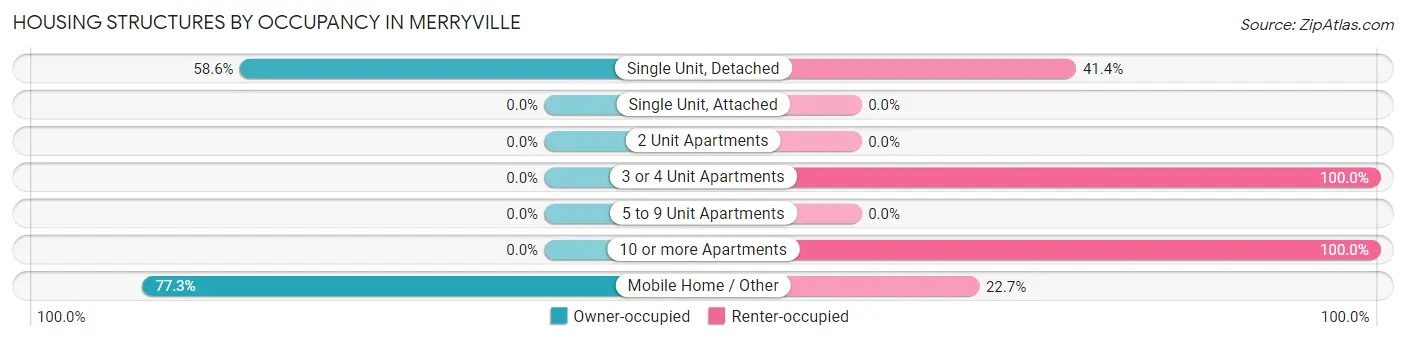
| Structure Type | Owner-occupied | Renter-occupied |
| Single Unit, Detached | 129 (58.6%) | 91 (41.4%) |
| Single Unit, Attached | 0 (0.0%) | 0 (0.0%) |
| 2 Unit Apartments | 0 (0.0%) | 0 (0.0%) |
| 3 or 4 Unit Apartments | 0 (0.0%) | 33 (100.0%) |
| 5 to 9 Unit Apartments | 0 (0.0%) | 0 (0.0%) |
| 10 or more Apartments | 0 (0.0%) | 4 (100.0%) |
| Mobile Home / Other | 75 (77.3%) | 22 (22.7%) |
| Total | 204 (57.6%) | 150 (42.4%) |
Housing Structures by Number of Rooms in Merryville
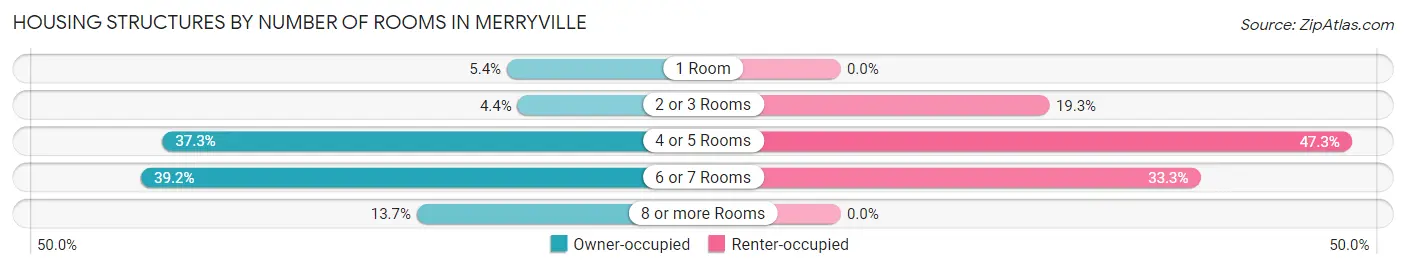
| Number of Rooms | Owner-occupied | Renter-occupied |
| 1 Room | 11 (5.4%) | 0 (0.0%) |
| 2 or 3 Rooms | 9 (4.4%) | 29 (19.3%) |
| 4 or 5 Rooms | 76 (37.2%) | 71 (47.3%) |
| 6 or 7 Rooms | 80 (39.2%) | 50 (33.3%) |
| 8 or more Rooms | 28 (13.7%) | 0 (0.0%) |
| Total | 204 (100.0%) | 150 (100.0%) |
Housing Structure by Heating Type in Merryville
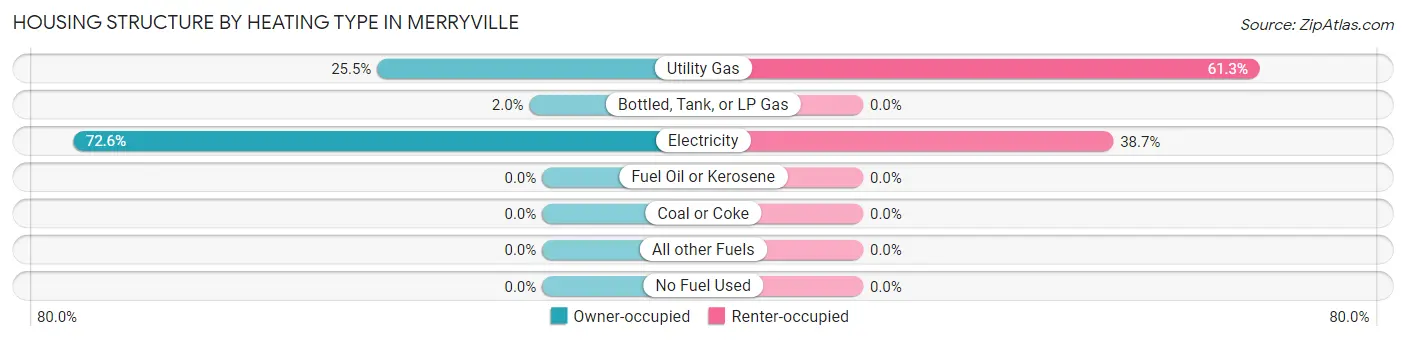
| Heating Type | Owner-occupied | Renter-occupied |
| Utility Gas | 52 (25.5%) | 92 (61.3%) |
| Bottled, Tank, or LP Gas | 4 (2.0%) | 0 (0.0%) |
| Electricity | 148 (72.6%) | 58 (38.7%) |
| Fuel Oil or Kerosene | 0 (0.0%) | 0 (0.0%) |
| Coal or Coke | 0 (0.0%) | 0 (0.0%) |
| All other Fuels | 0 (0.0%) | 0 (0.0%) |
| No Fuel Used | 0 (0.0%) | 0 (0.0%) |
| Total | 204 (100.0%) | 150 (100.0%) |
Household Vehicle Usage in Merryville
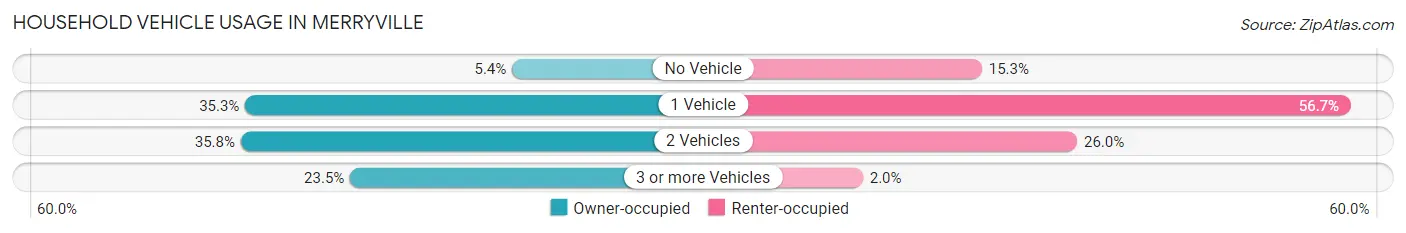
| Vehicles per Household | Owner-occupied | Renter-occupied |
| No Vehicle | 11 (5.4%) | 23 (15.3%) |
| 1 Vehicle | 72 (35.3%) | 85 (56.7%) |
| 2 Vehicles | 73 (35.8%) | 39 (26.0%) |
| 3 or more Vehicles | 48 (23.5%) | 3 (2.0%) |
| Total | 204 (100.0%) | 150 (100.0%) |
Real Estate & Mortgages in Merryville
Real Estate and Mortgage Overview in Merryville
| Characteristic | Without Mortgage | With Mortgage |
| Housing Units | 160 | 44 |
| Median Property Value | $121,200 | $75,000 |
| Median Household Income | - | - |
| Monthly Housing Costs | $338 | $0 |
| Real Estate Taxes | $199 | $12 |
Property Value by Mortgage Status in Merryville
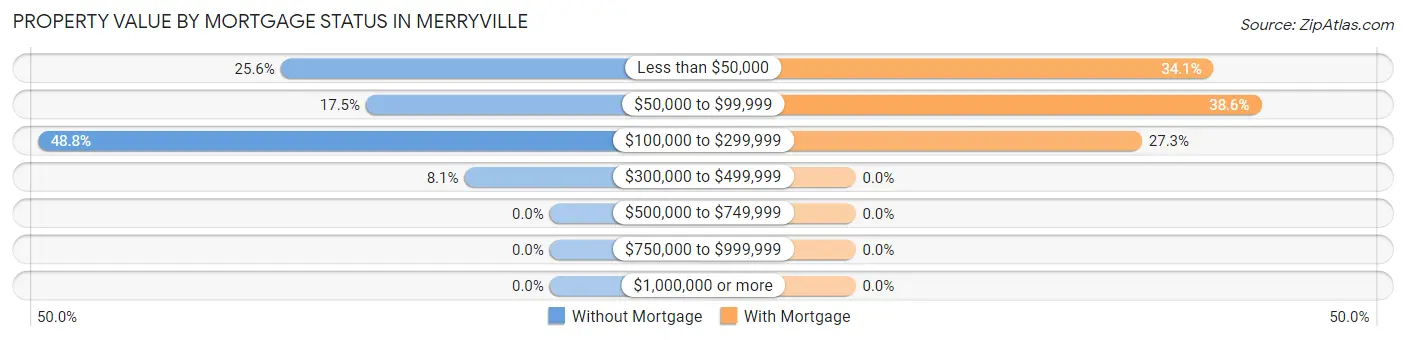
| Property Value | Without Mortgage | With Mortgage |
| Less than $50,000 | 41 (25.6%) | 15 (34.1%) |
| $50,000 to $99,999 | 28 (17.5%) | 17 (38.6%) |
| $100,000 to $299,999 | 78 (48.7%) | 12 (27.3%) |
| $300,000 to $499,999 | 13 (8.1%) | 0 (0.0%) |
| $500,000 to $749,999 | 0 (0.0%) | 0 (0.0%) |
| $750,000 to $999,999 | 0 (0.0%) | 0 (0.0%) |
| $1,000,000 or more | 0 (0.0%) | 0 (0.0%) |
| Total | 160 (100.0%) | 44 (100.0%) |
Household Income by Mortgage Status in Merryville
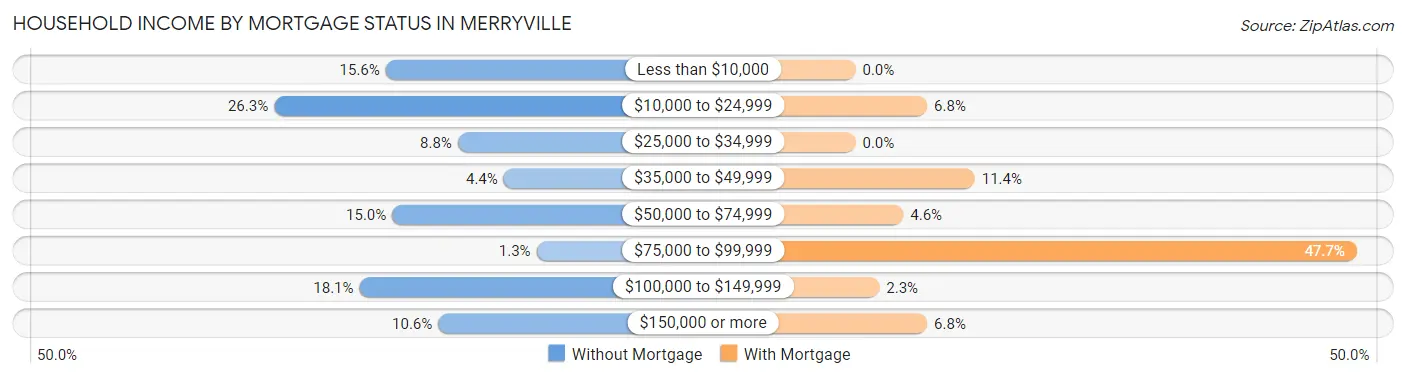
| Household Income | Without Mortgage | With Mortgage |
| Less than $10,000 | 25 (15.6%) | 0 (0.0%) |
| $10,000 to $24,999 | 42 (26.3%) | 3 (6.8%) |
| $25,000 to $34,999 | 14 (8.7%) | 0 (0.0%) |
| $35,000 to $49,999 | 7 (4.4%) | 5 (11.4%) |
| $50,000 to $74,999 | 24 (15.0%) | 2 (4.5%) |
| $75,000 to $99,999 | 2 (1.3%) | 21 (47.7%) |
| $100,000 to $149,999 | 29 (18.1%) | 1 (2.3%) |
| $150,000 or more | 17 (10.6%) | 3 (6.8%) |
| Total | 160 (100.0%) | 44 (100.0%) |
Property Value to Household Income Ratio in Merryville
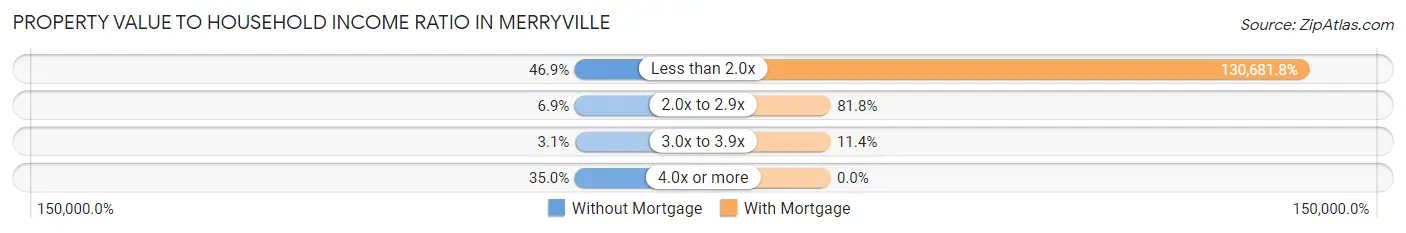
| Value-to-Income Ratio | Without Mortgage | With Mortgage |
| Less than 2.0x | 75 (46.9%) | 57,500 (130,681.8%) |
| 2.0x to 2.9x | 11 (6.9%) | 36 (81.8%) |
| 3.0x to 3.9x | 5 (3.1%) | 5 (11.4%) |
| 4.0x or more | 56 (35.0%) | 0 (0.0%) |
| Total | 160 (100.0%) | 44 (100.0%) |
Real Estate Taxes by Mortgage Status in Merryville
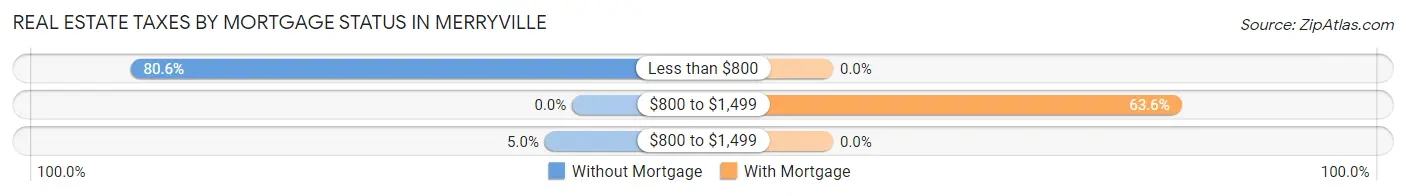
| Property Taxes | Without Mortgage | With Mortgage |
| Less than $800 | 129 (80.6%) | 0 (0.0%) |
| $800 to $1,499 | 0 (0.0%) | 28 (63.6%) |
| $800 to $1,499 | 8 (5.0%) | 0 (0.0%) |
| Total | 160 (100.0%) | 44 (100.0%) |
Health & Disability in Merryville
Health Insurance Coverage by Age in Merryville
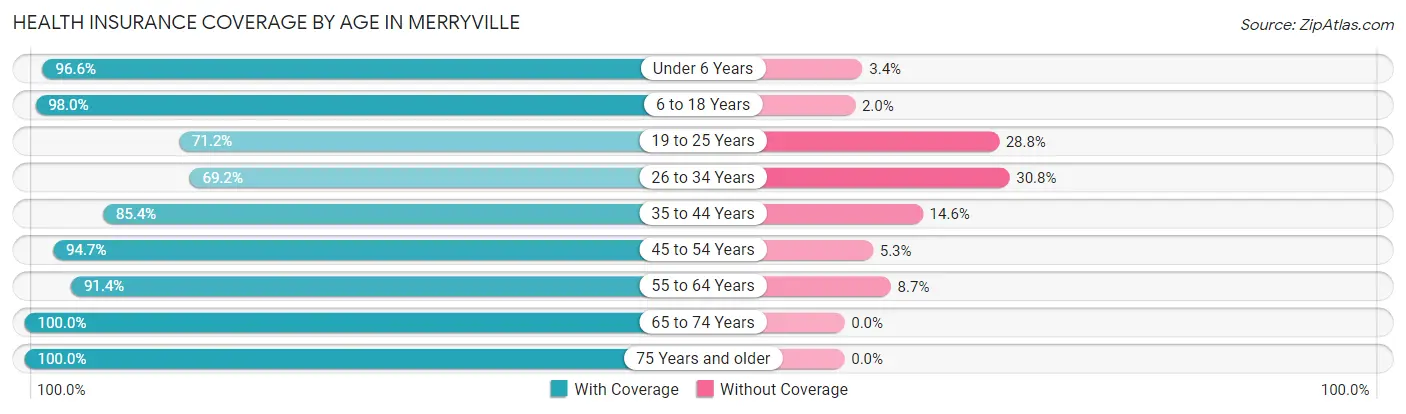
| Age Bracket | With Coverage | Without Coverage |
| Under 6 Years | 86 (96.6%) | 3 (3.4%) |
| 6 to 18 Years | 148 (98.0%) | 3 (2.0%) |
| 19 to 25 Years | 94 (71.2%) | 38 (28.8%) |
| 26 to 34 Years | 54 (69.2%) | 24 (30.8%) |
| 35 to 44 Years | 76 (85.4%) | 13 (14.6%) |
| 45 to 54 Years | 107 (94.7%) | 6 (5.3%) |
| 55 to 64 Years | 95 (91.3%) | 9 (8.6%) |
| 65 to 74 Years | 85 (100.0%) | 0 (0.0%) |
| 75 Years and older | 46 (100.0%) | 0 (0.0%) |
| Total | 791 (89.2%) | 96 (10.8%) |
Health Insurance Coverage by Citizenship Status in Merryville
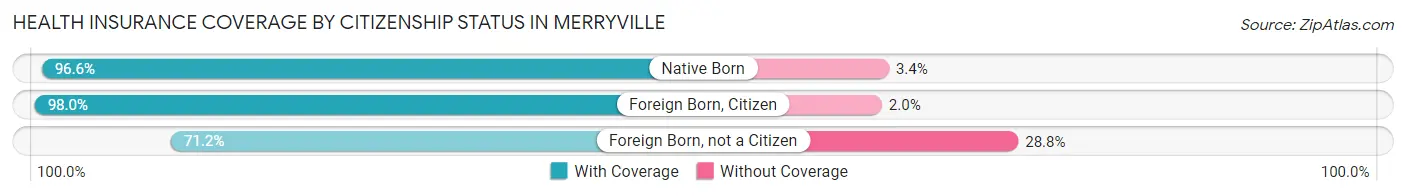
| Citizenship Status | With Coverage | Without Coverage |
| Native Born | 86 (96.6%) | 3 (3.4%) |
| Foreign Born, Citizen | 148 (98.0%) | 3 (2.0%) |
| Foreign Born, not a Citizen | 94 (71.2%) | 38 (28.8%) |
Health Insurance Coverage by Household Income in Merryville
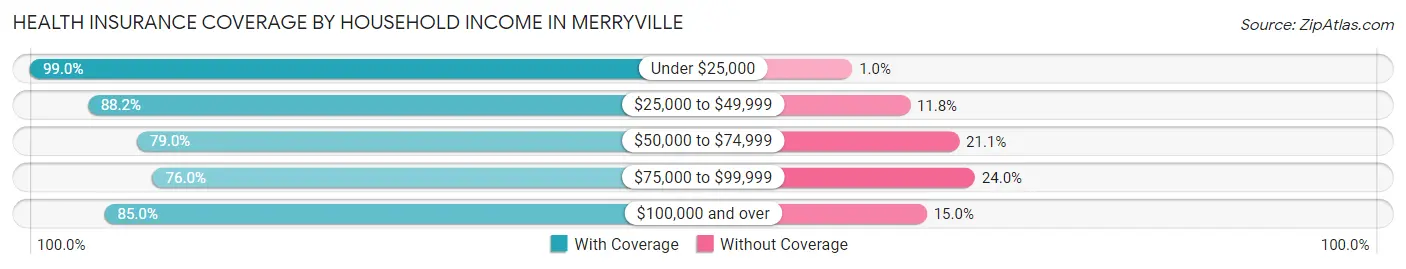
| Household Income | With Coverage | Without Coverage |
| Under $25,000 | 293 (99.0%) | 3 (1.0%) |
| $25,000 to $49,999 | 164 (88.2%) | 22 (11.8%) |
| $50,000 to $74,999 | 105 (78.9%) | 28 (21.0%) |
| $75,000 to $99,999 | 19 (76.0%) | 6 (24.0%) |
| $100,000 and over | 210 (85.0%) | 37 (15.0%) |
Public vs Private Health Insurance Coverage by Age in Merryville
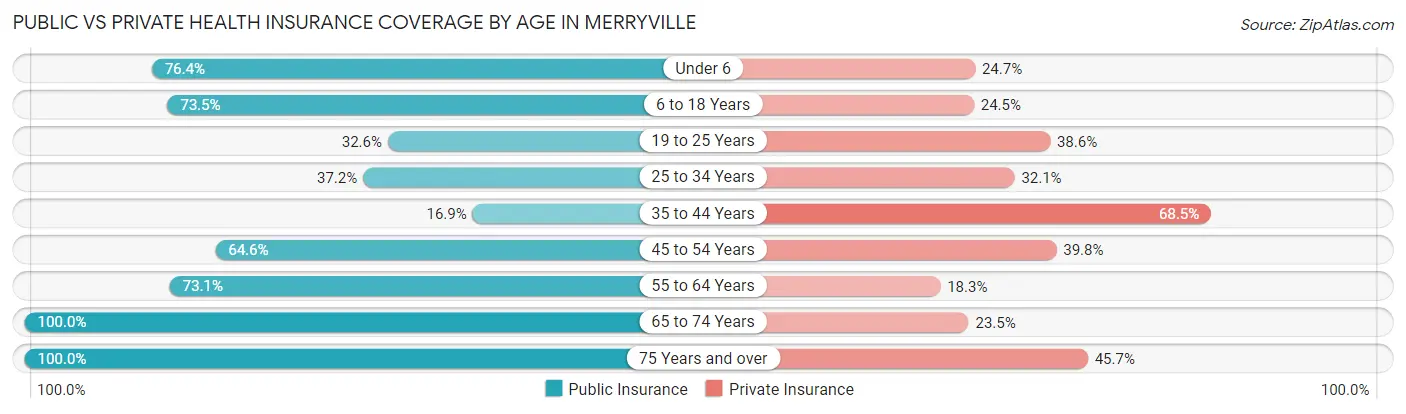
| Age Bracket | Public Insurance | Private Insurance |
| Under 6 | 68 (76.4%) | 22 (24.7%) |
| 6 to 18 Years | 111 (73.5%) | 37 (24.5%) |
| 19 to 25 Years | 43 (32.6%) | 51 (38.6%) |
| 25 to 34 Years | 29 (37.2%) | 25 (32.1%) |
| 35 to 44 Years | 15 (16.9%) | 61 (68.5%) |
| 45 to 54 Years | 73 (64.6%) | 45 (39.8%) |
| 55 to 64 Years | 76 (73.1%) | 19 (18.3%) |
| 65 to 74 Years | 85 (100.0%) | 20 (23.5%) |
| 75 Years and over | 46 (100.0%) | 21 (45.7%) |
| Total | 546 (61.6%) | 301 (33.9%) |
Disability Status by Sex by Age in Merryville
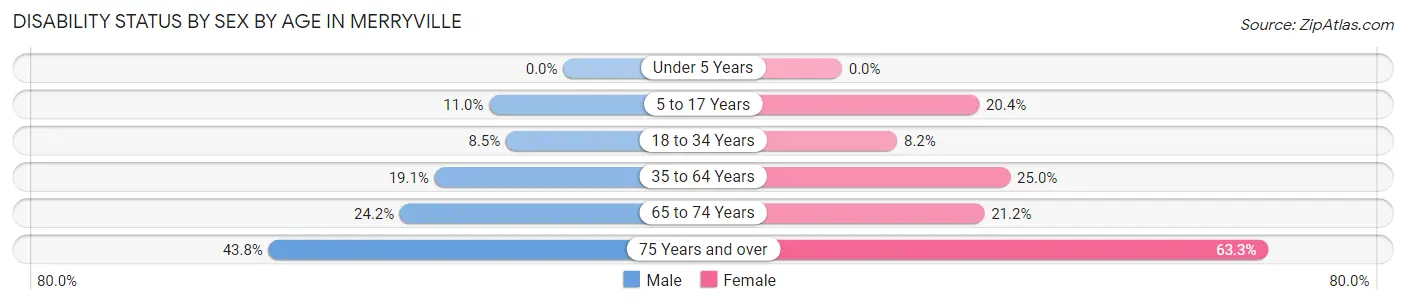
| Age Bracket | Male | Female |
| Under 5 Years | 0 (0.0%) | 0 (0.0%) |
| 5 to 17 Years | 10 (11.0%) | 11 (20.4%) |
| 18 to 34 Years | 8 (8.5%) | 10 (8.2%) |
| 35 to 64 Years | 34 (19.1%) | 32 (25.0%) |
| 65 to 74 Years | 8 (24.2%) | 11 (21.1%) |
| 75 Years and over | 7 (43.8%) | 19 (63.3%) |
Disability Class by Sex by Age in Merryville
Disability Class: Hearing Difficulty
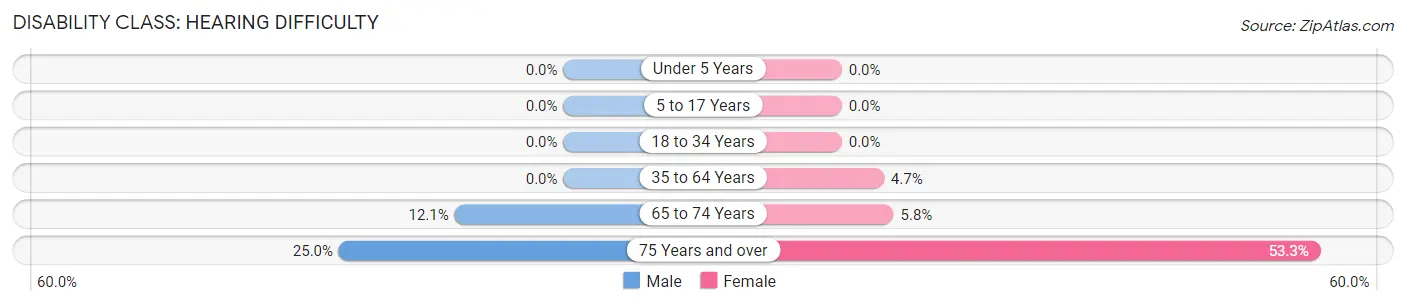
| Age Bracket | Male | Female |
| Under 5 Years | 0 (0.0%) | 0 (0.0%) |
| 5 to 17 Years | 0 (0.0%) | 0 (0.0%) |
| 18 to 34 Years | 0 (0.0%) | 0 (0.0%) |
| 35 to 64 Years | 0 (0.0%) | 6 (4.7%) |
| 65 to 74 Years | 4 (12.1%) | 3 (5.8%) |
| 75 Years and over | 4 (25.0%) | 16 (53.3%) |
Disability Class: Vision Difficulty
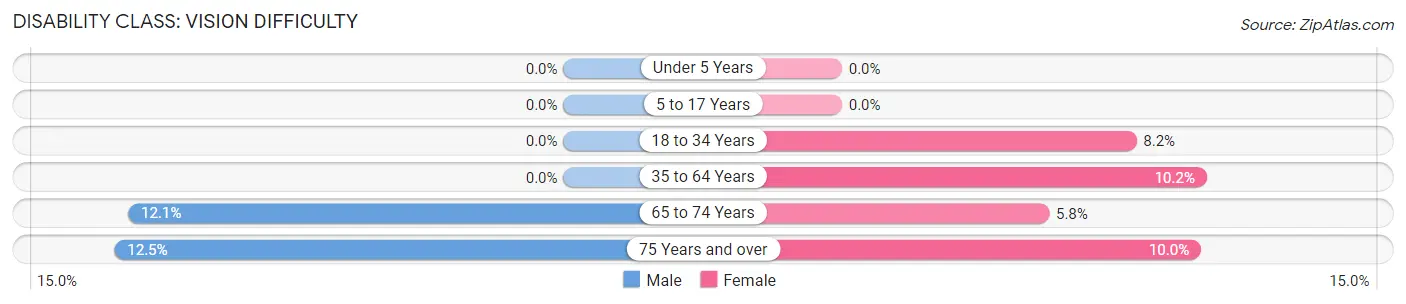
| Age Bracket | Male | Female |
| Under 5 Years | 0 (0.0%) | 0 (0.0%) |
| 5 to 17 Years | 0 (0.0%) | 0 (0.0%) |
| 18 to 34 Years | 0 (0.0%) | 10 (8.2%) |
| 35 to 64 Years | 0 (0.0%) | 13 (10.2%) |
| 65 to 74 Years | 4 (12.1%) | 3 (5.8%) |
| 75 Years and over | 2 (12.5%) | 3 (10.0%) |
Disability Class: Cognitive Difficulty
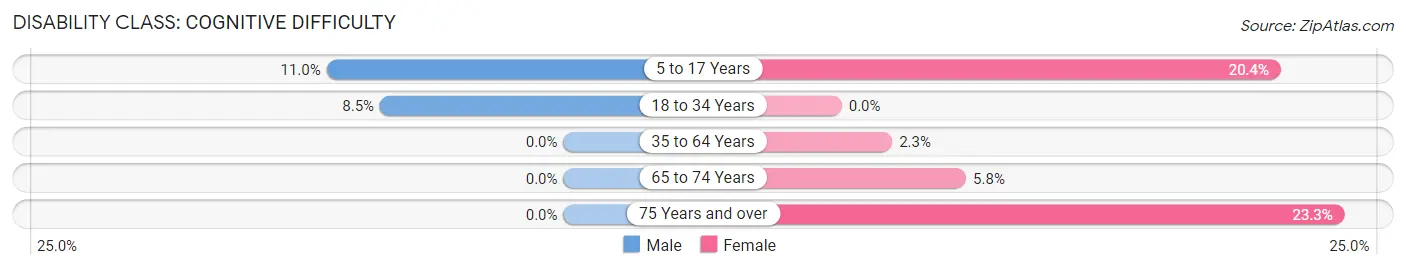
| Age Bracket | Male | Female |
| 5 to 17 Years | 10 (11.0%) | 11 (20.4%) |
| 18 to 34 Years | 8 (8.5%) | 0 (0.0%) |
| 35 to 64 Years | 0 (0.0%) | 3 (2.3%) |
| 65 to 74 Years | 0 (0.0%) | 3 (5.8%) |
| 75 Years and over | 0 (0.0%) | 7 (23.3%) |
Disability Class: Ambulatory Difficulty
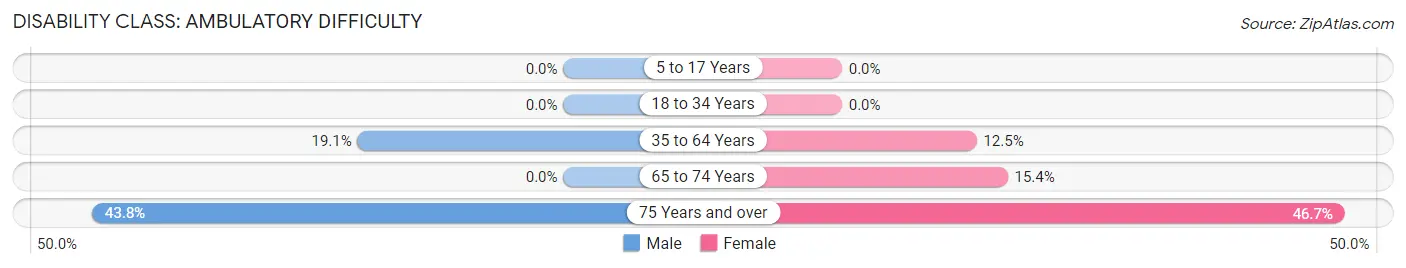
| Age Bracket | Male | Female |
| 5 to 17 Years | 0 (0.0%) | 0 (0.0%) |
| 18 to 34 Years | 0 (0.0%) | 0 (0.0%) |
| 35 to 64 Years | 34 (19.1%) | 16 (12.5%) |
| 65 to 74 Years | 0 (0.0%) | 8 (15.4%) |
| 75 Years and over | 7 (43.8%) | 14 (46.7%) |
Disability Class: Self-Care Difficulty
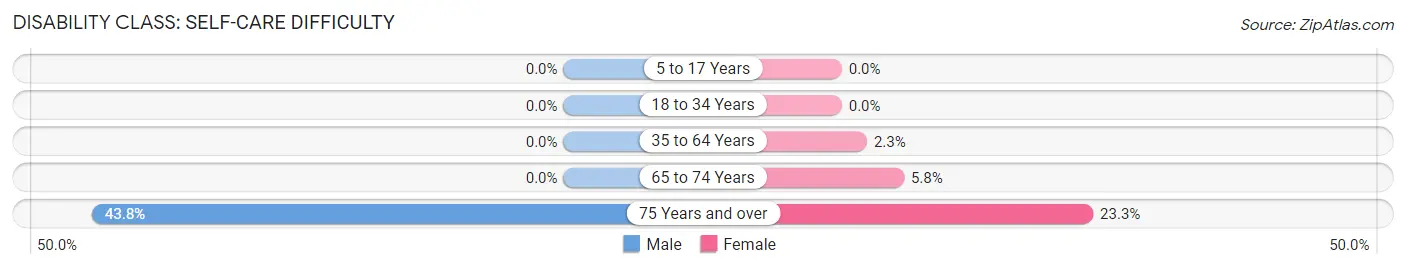
| Age Bracket | Male | Female |
| 5 to 17 Years | 0 (0.0%) | 0 (0.0%) |
| 18 to 34 Years | 0 (0.0%) | 0 (0.0%) |
| 35 to 64 Years | 0 (0.0%) | 3 (2.3%) |
| 65 to 74 Years | 0 (0.0%) | 3 (5.8%) |
| 75 Years and over | 7 (43.8%) | 7 (23.3%) |
Technology Access in Merryville
Computing Device Access in Merryville
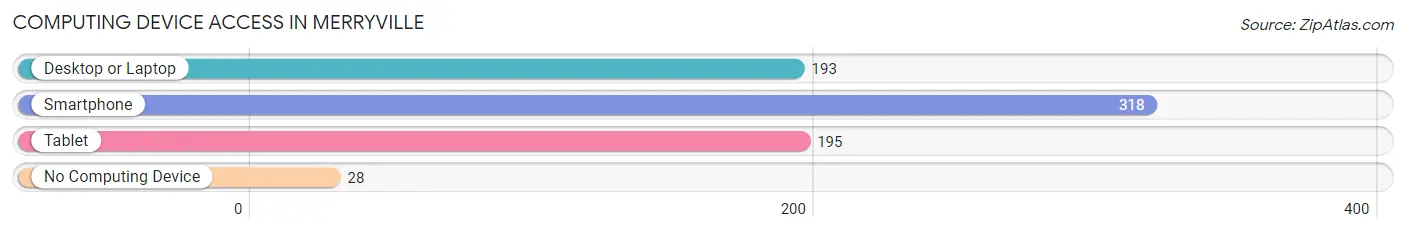
| Device Type | # Households | % Households |
| Desktop or Laptop | 193 | 54.5% |
| Smartphone | 318 | 89.8% |
| Tablet | 195 | 55.1% |
| No Computing Device | 28 | 7.9% |
| Total | 354 | 100.0% |
Internet Access in Merryville
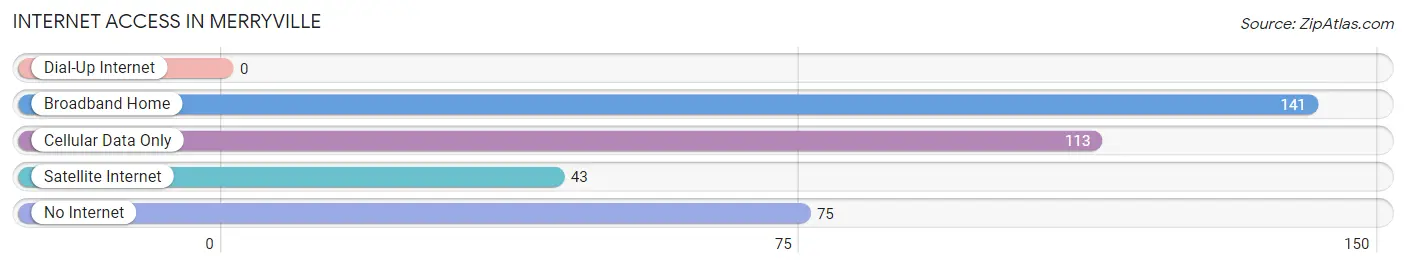
| Internet Type | # Households | % Households |
| Dial-Up Internet | 0 | 0.0% |
| Broadband Home | 141 | 39.8% |
| Cellular Data Only | 113 | 31.9% |
| Satellite Internet | 43 | 12.1% |
| No Internet | 75 | 21.2% |
| Total | 354 | 100.0% |
Merryville Summary
Merryville is a small town located in Beauregard Parish, Louisiana. It is situated in the western part of the state, approximately 30 miles east of the Texas border. The town has a population of 1,845 people, according to the 2010 census.
History
Merryville was founded in 1883 by a group of settlers from Mississippi. The town was named after the first postmaster, William Merry. The town was originally a farming community, but it soon became a center for the lumber industry. The town was incorporated in 1891.
In the early 1900s, the town experienced a period of growth and prosperity. The lumber industry was booming, and the town was home to several sawmills. The town also had a cotton gin, a grist mill, and a brick factory.
In the 1920s, the Great Depression hit the town hard. Many of the businesses closed, and the population declined. The town was able to survive, however, and it continued to be a center for the lumber industry.
In the 1950s, the town experienced a period of growth and prosperity once again. The lumber industry was still booming, and the town was home to several sawmills. The town also had a cotton gin, a grist mill, and a brick factory.
Geography
Merryville is located in the western part of Beauregard Parish, Louisiana. It is situated approximately 30 miles east of the Texas border. The town is located in the Kisatchie National Forest, and it is surrounded by pine forests and rolling hills. The town is located near the Sabine River, which is a major tributary of the Red River.
The climate in Merryville is humid subtropical, with hot summers and mild winters. The average annual temperature is 68 degrees Fahrenheit. The average annual precipitation is 52 inches.
Economy
Merryville’s economy is largely based on the lumber industry. The town is home to several sawmills, and it is a major supplier of lumber to the surrounding area. The town also has a cotton gin, a grist mill, and a brick factory.
The town is also home to several small businesses, including restaurants, retail stores, and service providers. The town is also home to a few manufacturing companies, including a furniture manufacturer and a metal fabrication company.
Demographics
According to the 2010 census, the population of Merryville is 1,845 people. The town is predominantly white, with a small African American population. The median household income is $31,250, and the median home value is $90,000.
The town is served by the Beauregard Parish School District. The town has one elementary school, one middle school, and one high school. The town also has a public library and a community center.
Conclusion
Merryville is a small town located in Beauregard Parish, Louisiana. It is situated in the western part of the state, approximately 30 miles east of the Texas border. The town has a population of 1,845 people, according to the 2010 census. The town’s economy is largely based on the lumber industry, and it is also home to several small businesses. The town is served by the Beauregard Parish School District, and it has a public library and a community center.
Common Questions
What is Per Capita Income in Merryville?
Per Capita income in Merryville is $24,399.
What is the Median Family Income in Merryville?
Median Family Income in Merryville is $46,719.
What is the Median Household income in Merryville?
Median Household Income in Merryville is $35,227.
What is Income or Wage Gap in Merryville?
Income or Wage Gap in Merryville is 52.6%.
Women in Merryville earn 47.4 cents for every dollar earned by a man.
What is Family Income Deficit in Merryville?
Family Income Deficit in Merryville is $10,298.
Families that are below poverty line in Merryville earn $10,298 less on average than the poverty threshold level.
What is Inequality or Gini Index in Merryville?
Inequality or Gini Index in Merryville is 0.55.
What is the Total Population of Merryville?
Total Population of Merryville is 918.
What is the Total Male Population of Merryville?
Total Male Population of Merryville is 460.
What is the Total Female Population of Merryville?
Total Female Population of Merryville is 458.
What is the Ratio of Males per 100 Females in Merryville?
There are 100.44 Males per 100 Females in Merryville.
What is the Ratio of Females per 100 Males in Merryville?
There are 99.57 Females per 100 Males in Merryville.
What is the Median Population Age in Merryville?
Median Population Age in Merryville is 36.1 Years.
What is the Average Family Size in Merryville
Average Family Size in Merryville is 3.2 People.
What is the Average Household Size in Merryville
Average Household Size in Merryville is 2.5 People.
How Large is the Labor Force in Merryville?
There are 387 People in the Labor Forcein in Merryville.
What is the Percentage of People in the Labor Force in Merryville?
55.4% of People are in the Labor Force in Merryville.
What is the Unemployment Rate in Merryville?
Unemployment Rate in Merryville is 16.0%.