Welcome, LA Map & Demographics
Welcome Map
Welcome Overview
$31,062
PER CAPITA INCOME
$48,026
AVG FAMILY INCOME
$53,780
AVG HOUSEHOLD INCOME
81.0%
WAGE / INCOME GAP [ % ]
19.0¢/ $1
WAGE / INCOME GAP [ $ ]
0.38
INEQUALITY / GINI INDEX
832
TOTAL POPULATION
356
MALE POPULATION
476
FEMALE POPULATION
74.79
MALES / 100 FEMALES
133.71
FEMALES / 100 MALES
39.6
MEDIAN AGE
3.3
AVG FAMILY SIZE
2.4
AVG HOUSEHOLD SIZE
394
LABOR FORCE [ PEOPLE ]
61.8%
PERCENT IN LABOR FORCE
Income in Welcome
Income Overview in Welcome
Per Capita Income in Welcome is $31,062, while median incomes of families and households are $48,026 and $53,780 respectively.
| Characteristic | Number | Measure |
| Per Capita Income | 832 | $31,062 |
| Median Family Income | 198 | $48,026 |
| Mean Family Income | 198 | $56,858 |
| Median Household Income | 351 | $53,780 |
| Mean Household Income | 351 | $71,776 |
| Income Deficit | 198 | $0 |
| Wage / Income Gap (%) | 832 | 80.98% |
| Wage / Income Gap ($) | 832 | 19.02¢ per $1 |
| Gini / Inequality Index | 832 | 0.38 |
Earnings by Sex in Welcome
Average Earnings in Welcome are $32,313, $145,429 for men and $27,656 for women, a difference of 81.0%.
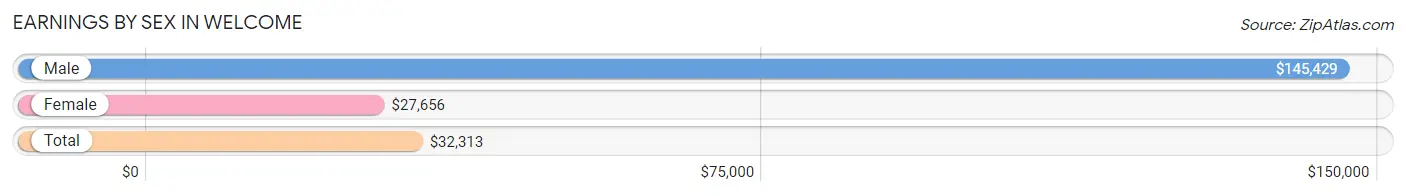
| Sex | Number | Average Earnings |
| Male | 116 (29.0%) | $145,429 |
| Female | 284 (71.0%) | $27,656 |
| Total | 400 (100.0%) | $32,313 |
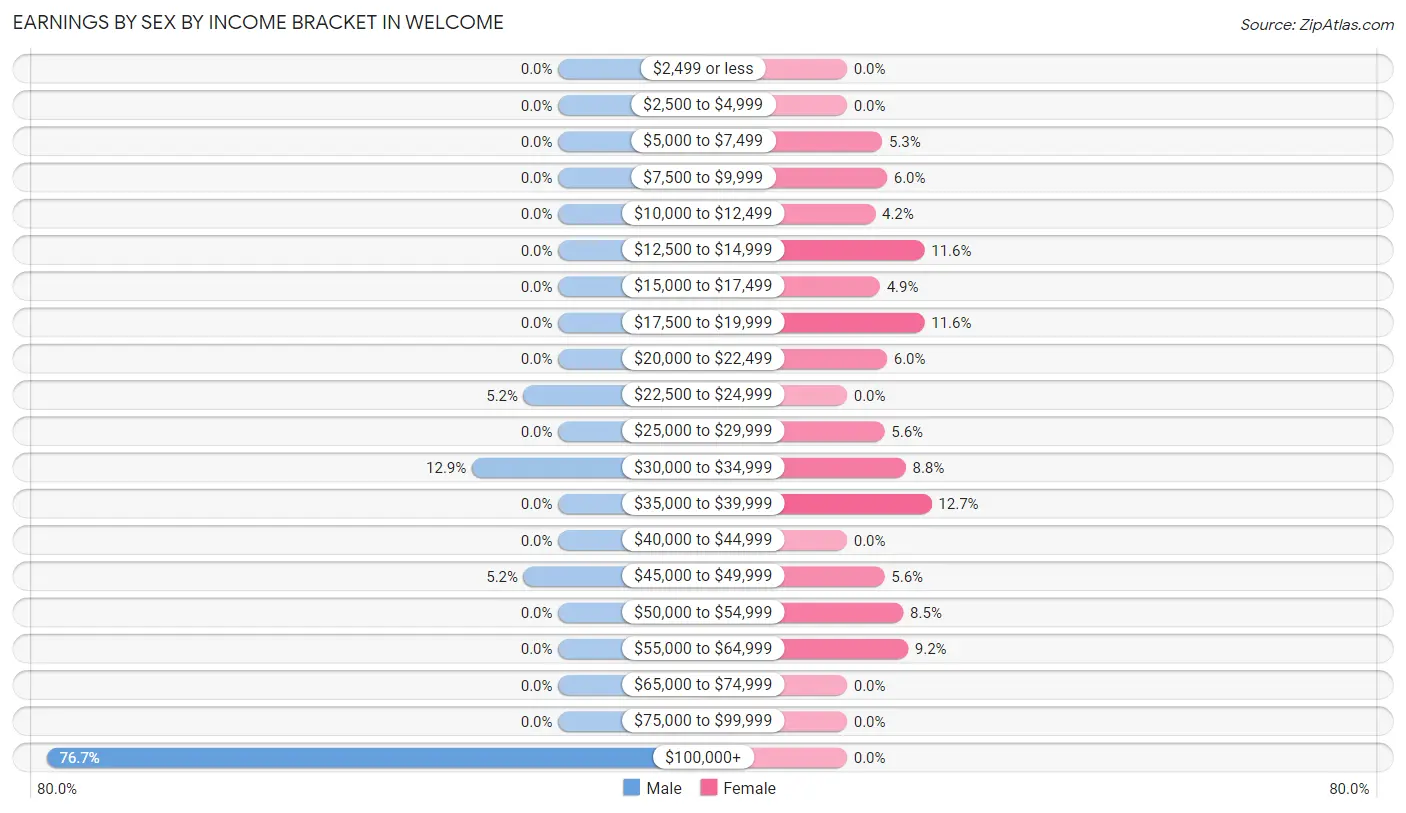
Earnings by Sex by Income Bracket in Welcome
The most common earnings brackets in Welcome are $100,000+ for men (89 | 76.7%) and $35,000 to $39,999 for women (36 | 12.7%).
| Income | Male | Female |
| $2,499 or less | 0 (0.0%) | 0 (0.0%) |
| $2,500 to $4,999 | 0 (0.0%) | 0 (0.0%) |
| $5,000 to $7,499 | 0 (0.0%) | 15 (5.3%) |
| $7,500 to $9,999 | 0 (0.0%) | 17 (6.0%) |
| $10,000 to $12,499 | 0 (0.0%) | 12 (4.2%) |
| $12,500 to $14,999 | 0 (0.0%) | 33 (11.6%) |
| $15,000 to $17,499 | 0 (0.0%) | 14 (4.9%) |
| $17,500 to $19,999 | 0 (0.0%) | 33 (11.6%) |
| $20,000 to $22,499 | 0 (0.0%) | 17 (6.0%) |
| $22,500 to $24,999 | 6 (5.2%) | 0 (0.0%) |
| $25,000 to $29,999 | 0 (0.0%) | 16 (5.6%) |
| $30,000 to $34,999 | 15 (12.9%) | 25 (8.8%) |
| $35,000 to $39,999 | 0 (0.0%) | 36 (12.7%) |
| $40,000 to $44,999 | 0 (0.0%) | 0 (0.0%) |
| $45,000 to $49,999 | 6 (5.2%) | 16 (5.6%) |
| $50,000 to $54,999 | 0 (0.0%) | 24 (8.5%) |
| $55,000 to $64,999 | 0 (0.0%) | 26 (9.1%) |
| $65,000 to $74,999 | 0 (0.0%) | 0 (0.0%) |
| $75,000 to $99,999 | 0 (0.0%) | 0 (0.0%) |
| $100,000+ | 89 (76.7%) | 0 (0.0%) |
| Total | 116 (100.0%) | 284 (100.0%) |
Earnings by Sex by Educational Attainment in Welcome
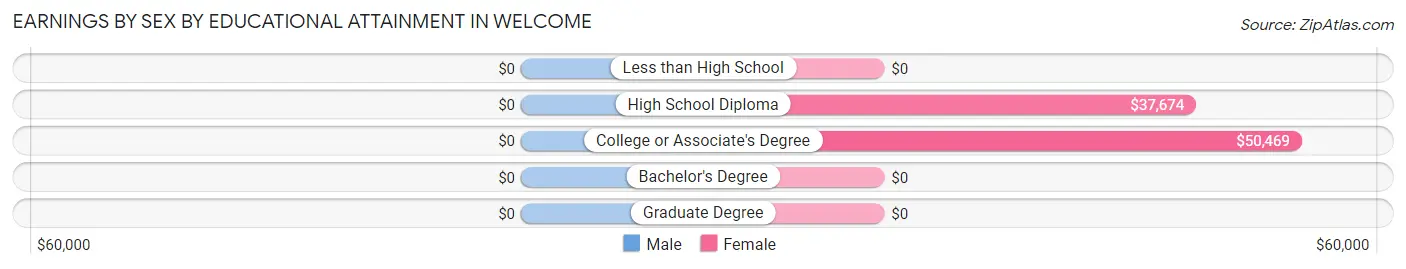
| Educational Attainment | Male Income | Female Income |
| Less than High School | - | - |
| High School Diploma | - | - |
| College or Associate's Degree | - | - |
| Bachelor's Degree | - | - |
| Graduate Degree | - | - |
| Total | $145,429 | $38,125 |
Family Income in Welcome
Family Income Brackets in Welcome
According to the Welcome family income data, there are 55 families falling into the $35,000 to $49,999 income range, which is the most common income bracket and makes up 27.8% of all families.
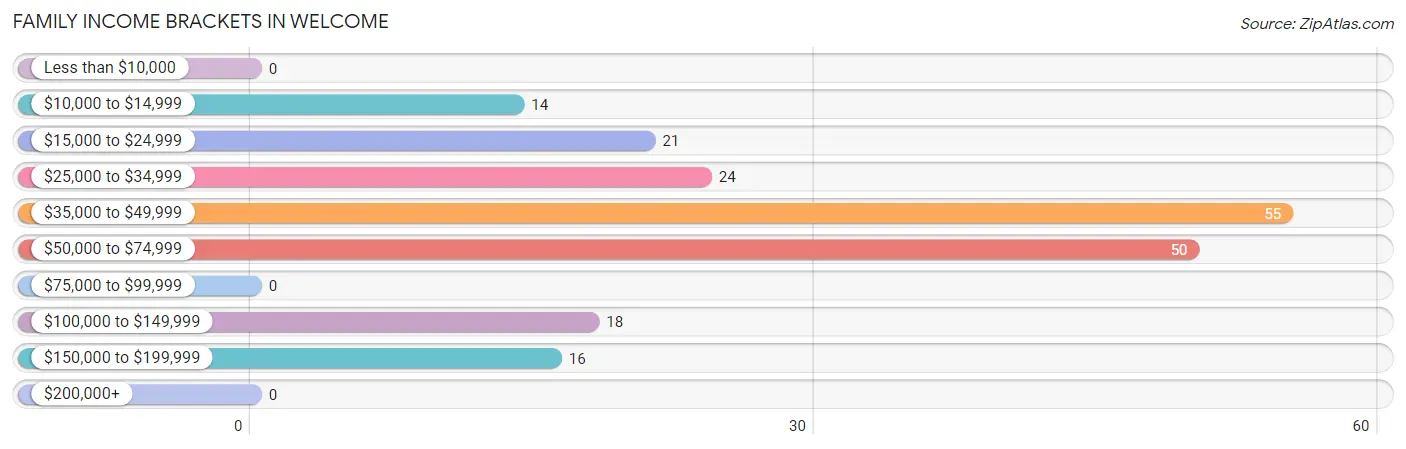
| Income Bracket | # Families | % Families |
| Less than $10,000 | 0 | 0.0% |
| $10,000 to $14,999 | 14 | 7.1% |
| $15,000 to $24,999 | 21 | 10.6% |
| $25,000 to $34,999 | 24 | 12.1% |
| $35,000 to $49,999 | 55 | 27.8% |
| $50,000 to $74,999 | 50 | 25.3% |
| $75,000 to $99,999 | 0 | 0.0% |
| $100,000 to $149,999 | 18 | 9.1% |
| $150,000 to $199,999 | 16 | 8.1% |
| $200,000+ | 0 | 0.0% |
Family Income by Famaliy Size in Welcome
2-person families (93 | 47.0%) account for the highest median family income in Welcome with $52,083 per family, while 2-person families (93 | 47.0%) have the highest median income of $26,042 per family member.
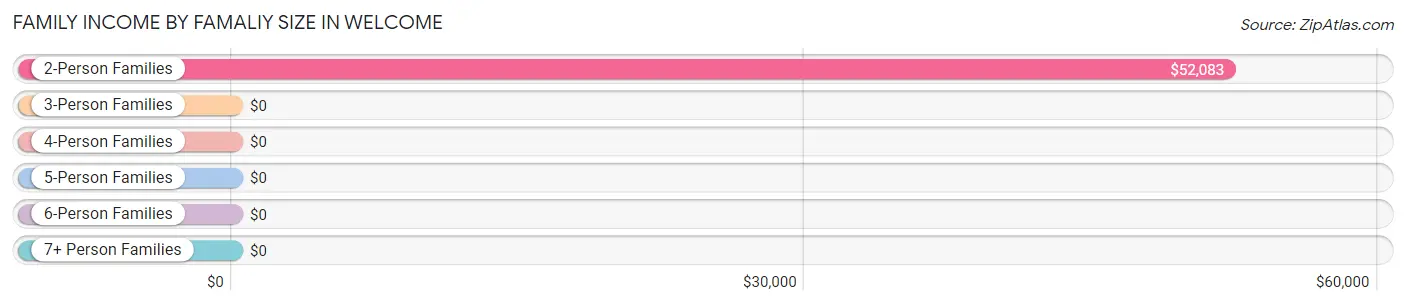
| Income Bracket | # Families | Median Income |
| 2-Person Families | 93 (47.0%) | $52,083 |
| 3-Person Families | 33 (16.7%) | $0 |
| 4-Person Families | 44 (22.2%) | $0 |
| 5-Person Families | 28 (14.1%) | $0 |
| 6-Person Families | 0 (0.0%) | $0 |
| 7+ Person Families | 0 (0.0%) | $0 |
| Total | 198 (100.0%) | $48,026 |
Family Income by Number of Earners in Welcome
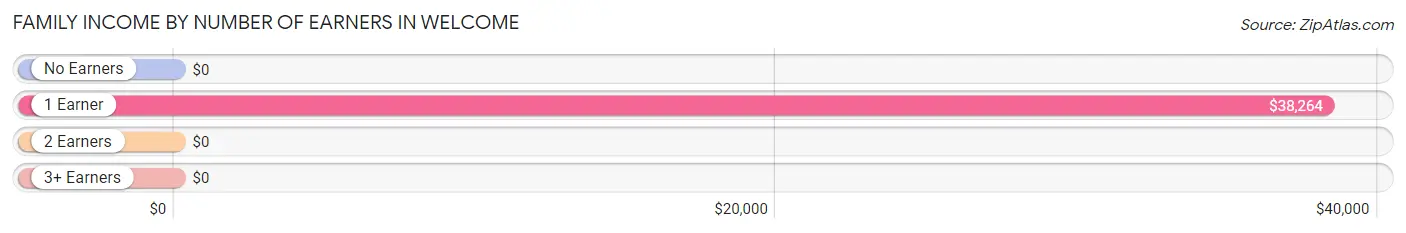
| Number of Earners | # Families | Median Income |
| No Earners | 52 (26.3%) | $0 |
| 1 Earner | 82 (41.4%) | $38,264 |
| 2 Earners | 31 (15.7%) | $0 |
| 3+ Earners | 33 (16.7%) | $0 |
| Total | 198 (100.0%) | $48,026 |
Household Income in Welcome
Household Income Brackets in Welcome
With 132 households falling in the category, the $50,000 to $74,999 income range is the most frequent in Welcome, accounting for 37.6% of all households.
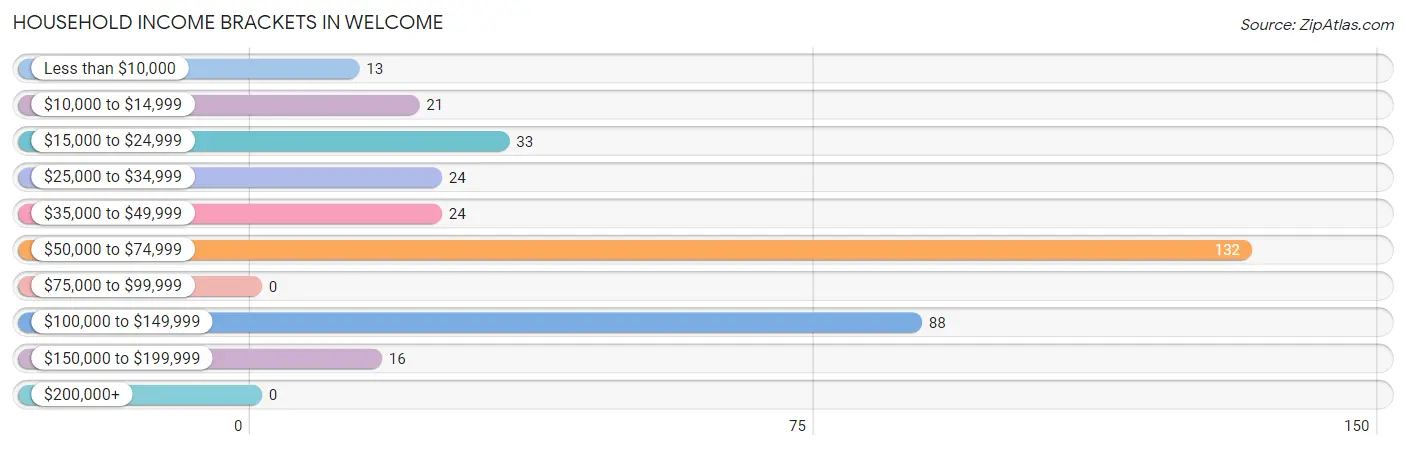
| Income Bracket | # Households | % Households |
| Less than $10,000 | 13 | 3.7% |
| $10,000 to $14,999 | 21 | 6.0% |
| $15,000 to $24,999 | 33 | 9.4% |
| $25,000 to $34,999 | 24 | 6.8% |
| $35,000 to $49,999 | 24 | 6.8% |
| $50,000 to $74,999 | 132 | 37.6% |
| $75,000 to $99,999 | 0 | 0.0% |
| $100,000 to $149,999 | 88 | 25.1% |
| $150,000 to $199,999 | 16 | 4.6% |
| $200,000+ | 0 | 0.0% |
Household Income by Householder Age in Welcome
The median household income in Welcome is $53,780, with the highest median household income of $52,308 found in the 45 to 64 years age bracket for the primary householder. A total of 102 households (29.1%) fall into this category.
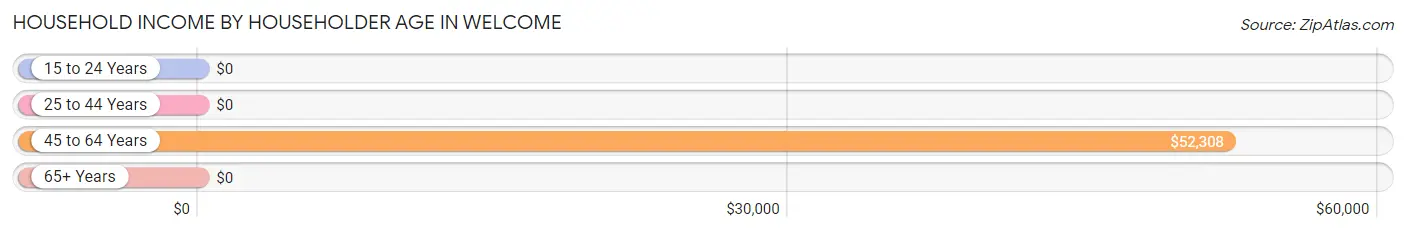
| Income Bracket | # Households | Median Income |
| 15 to 24 Years | 0 (0.0%) | $0 |
| 25 to 44 Years | 175 (49.9%) | $0 |
| 45 to 64 Years | 102 (29.1%) | $52,308 |
| 65+ Years | 74 (21.1%) | $0 |
| Total | 351 (100.0%) | $53,780 |
Poverty in Welcome
Income Below Poverty by Sex and Age in Welcome
With 35.1% poverty level for males and 12.8% for females among the residents of Welcome, 12 to 14 year old males and 6 to 11 year old females are the most vulnerable to poverty, with 17 males (100.0%) and 13 females (100.0%) in their respective age groups living below the poverty level.
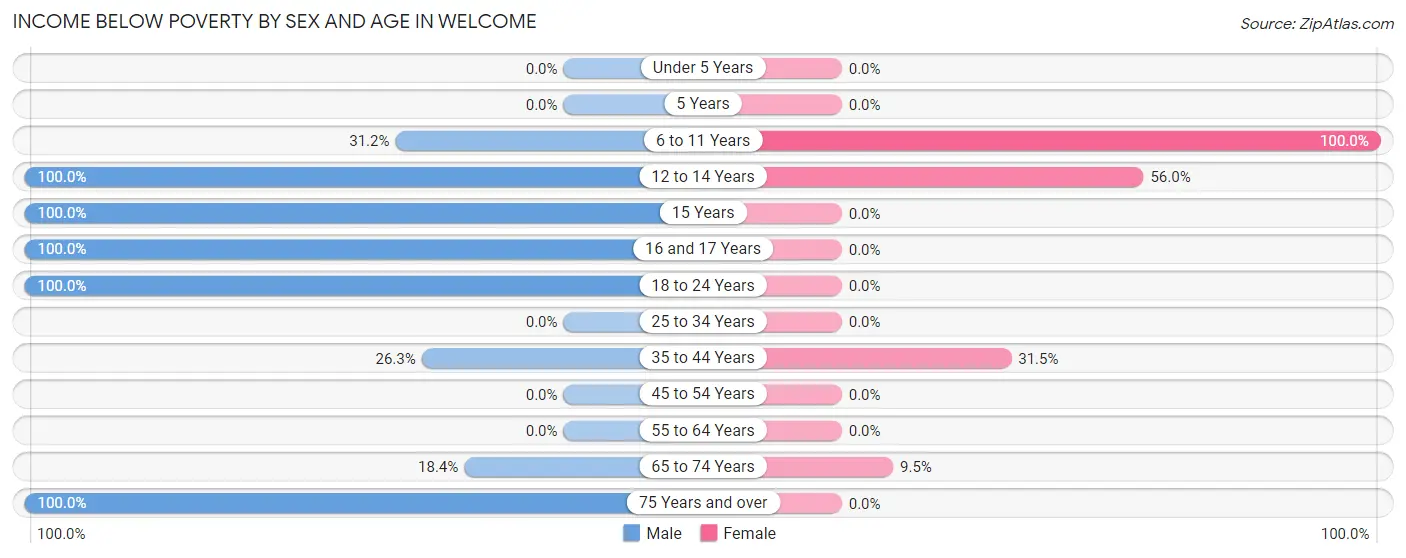
| Age Bracket | Male | Female |
| Under 5 Years | 0 (0.0%) | 0 (0.0%) |
| 5 Years | 0 (0.0%) | 0 (0.0%) |
| 6 to 11 Years | 34 (31.2%) | 13 (100.0%) |
| 12 to 14 Years | 17 (100.0%) | 14 (56.0%) |
| 15 Years | 11 (100.0%) | 0 (0.0%) |
| 16 and 17 Years | 10 (100.0%) | 0 (0.0%) |
| 18 to 24 Years | 14 (100.0%) | 0 (0.0%) |
| 25 to 34 Years | 0 (0.0%) | 0 (0.0%) |
| 35 to 44 Years | 25 (26.3%) | 28 (31.5%) |
| 45 to 54 Years | 0 (0.0%) | 0 (0.0%) |
| 55 to 64 Years | 0 (0.0%) | 0 (0.0%) |
| 65 to 74 Years | 7 (18.4%) | 6 (9.5%) |
| 75 Years and over | 7 (100.0%) | 0 (0.0%) |
| Total | 125 (35.1%) | 61 (12.8%) |
Income Above Poverty by Sex and Age in Welcome
According to the poverty statistics in Welcome, males aged 45 to 54 years and females aged under 5 years are the age groups that are most secure financially, with 100.0% of males and 100.0% of females in these age groups living above the poverty line.
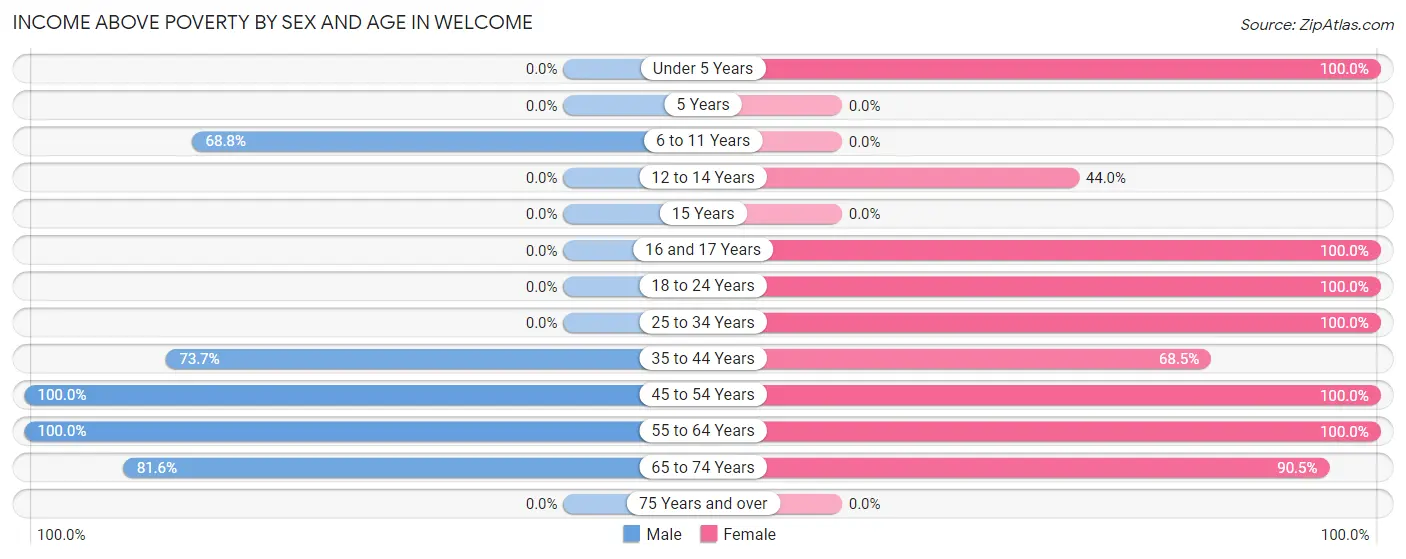
| Age Bracket | Male | Female |
| Under 5 Years | 0 (0.0%) | 19 (100.0%) |
| 5 Years | 0 (0.0%) | 0 (0.0%) |
| 6 to 11 Years | 75 (68.8%) | 0 (0.0%) |
| 12 to 14 Years | 0 (0.0%) | 11 (44.0%) |
| 15 Years | 0 (0.0%) | 0 (0.0%) |
| 16 and 17 Years | 0 (0.0%) | 6 (100.0%) |
| 18 to 24 Years | 0 (0.0%) | 98 (100.0%) |
| 25 to 34 Years | 0 (0.0%) | 16 (100.0%) |
| 35 to 44 Years | 70 (73.7%) | 61 (68.5%) |
| 45 to 54 Years | 30 (100.0%) | 119 (100.0%) |
| 55 to 64 Years | 25 (100.0%) | 28 (100.0%) |
| 65 to 74 Years | 31 (81.6%) | 57 (90.5%) |
| 75 Years and over | 0 (0.0%) | 0 (0.0%) |
| Total | 231 (64.9%) | 415 (87.2%) |
Income Below Poverty Among Married-Couple Families in Welcome
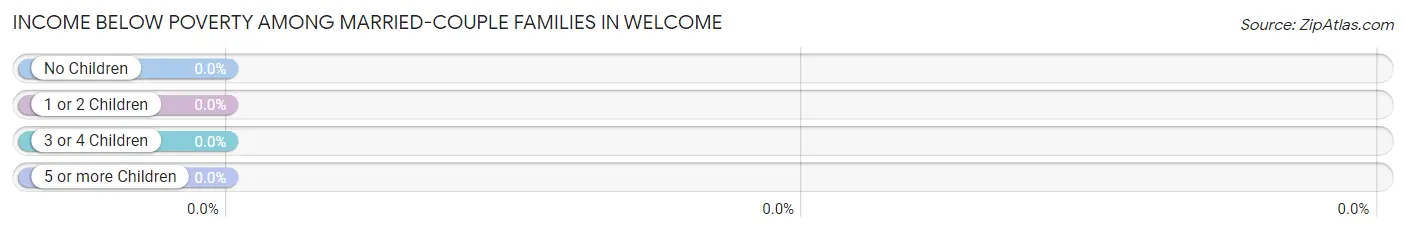
| Children | Above Poverty | Below Poverty |
| No Children | 65 (100.0%) | 0 (0.0%) |
| 1 or 2 Children | 0 (0.0%) | 0 (0.0%) |
| 3 or 4 Children | 0 (0.0%) | 0 (0.0%) |
| 5 or more Children | 0 (0.0%) | 0 (0.0%) |
| Total | 65 (100.0%) | 0 (0.0%) |
Income Below Poverty Among Single-Parent Households in Welcome
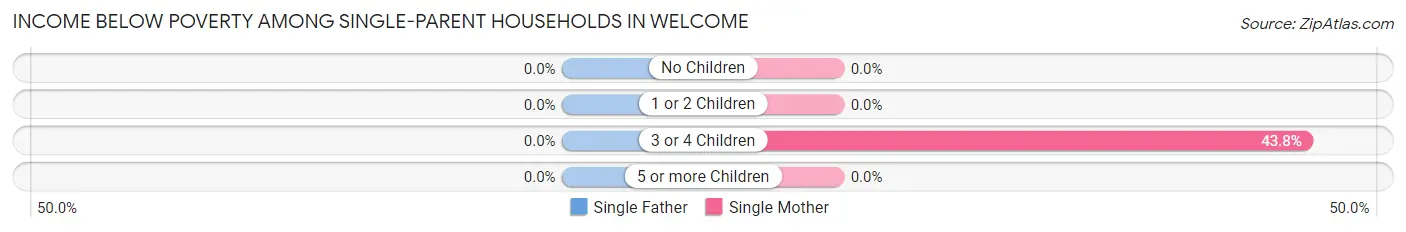
| Children | Single Father | Single Mother |
| No Children | 0 (0.0%) | 0 (0.0%) |
| 1 or 2 Children | 0 (0.0%) | 0 (0.0%) |
| 3 or 4 Children | 0 (0.0%) | 28 (43.8%) |
| 5 or more Children | 0 (0.0%) | 0 (0.0%) |
| Total | 0 (0.0%) | 28 (21.0%) |
Income Below Poverty Among Married-Couple vs Single-Parent Households in Welcome
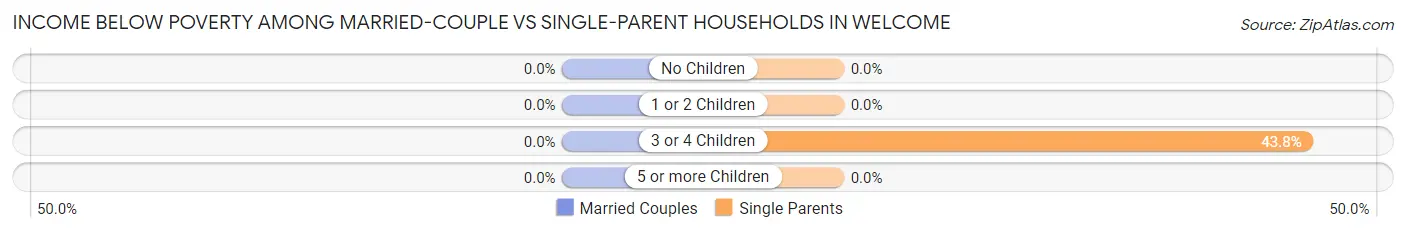
| Children | Married-Couple Families | Single-Parent Households |
| No Children | 0 (0.0%) | 0 (0.0%) |
| 1 or 2 Children | 0 (0.0%) | 0 (0.0%) |
| 3 or 4 Children | 0 (0.0%) | 28 (43.8%) |
| 5 or more Children | 0 (0.0%) | 0 (0.0%) |
| Total | 0 (0.0%) | 28 (21.0%) |
Race in Welcome
The most populous races in Welcome are Black / African American (741 | 89.1%), and Two or more Races (91 | 10.9%).
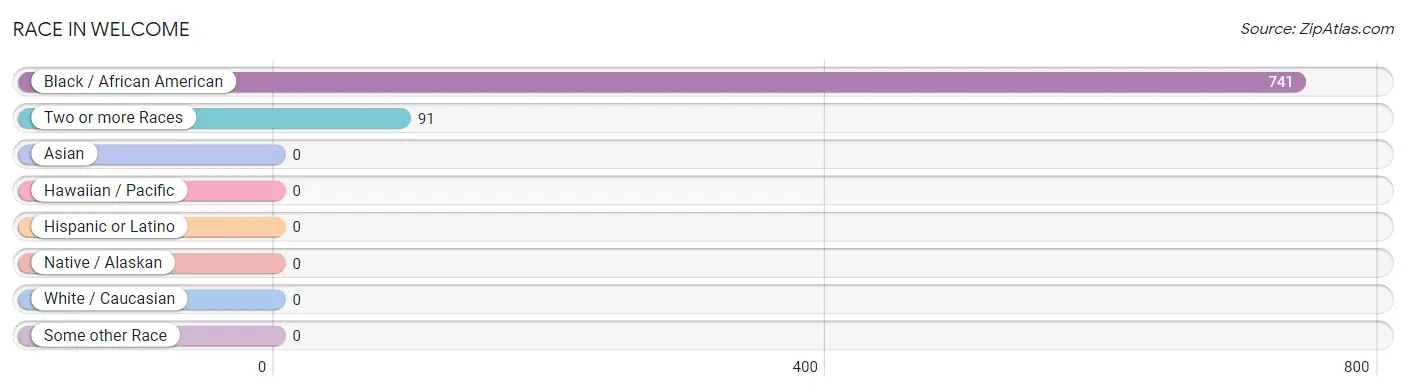
| Race | # Population | % Population |
| Asian | 0 | 0.0% |
| Black / African American | 741 | 89.1% |
| Hawaiian / Pacific | 0 | 0.0% |
| Hispanic or Latino | 0 | 0.0% |
| Native / Alaskan | 0 | 0.0% |
| White / Caucasian | 0 | 0.0% |
| Two or more Races | 91 | 10.9% |
| Some other Race | 0 | 0.0% |
| Total | 832 | 100.0% |
Ancestry in Welcome
The most populous ancestries reported in Welcome are French (25 | 3.0%), and American (7 | 0.8%), together accounting for 3.8% of all Welcome residents.
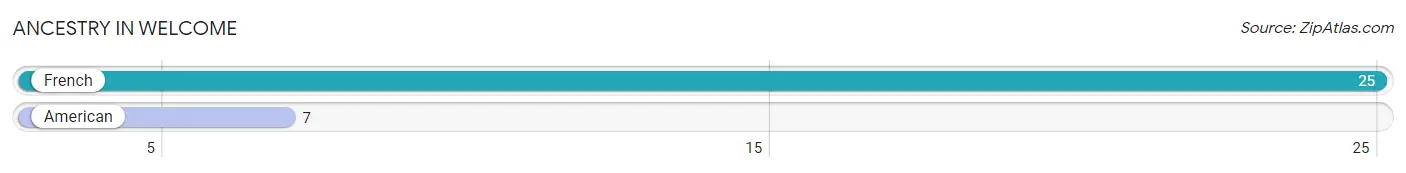
| Ancestry | # Population | % Population |
| American | 7 | 0.8% |
| French | 25 | 3.0% | View All 2 Rows |
Immigrants in Welcome

| Immigration Origin | # Population | % Population | View All 0 Rows |
Sex and Age in Welcome
Sex and Age in Welcome
The most populous age groups in Welcome are 40 to 44 Years (70 | 19.7%) for men and 50 to 54 Years (102 | 21.4%) for women.
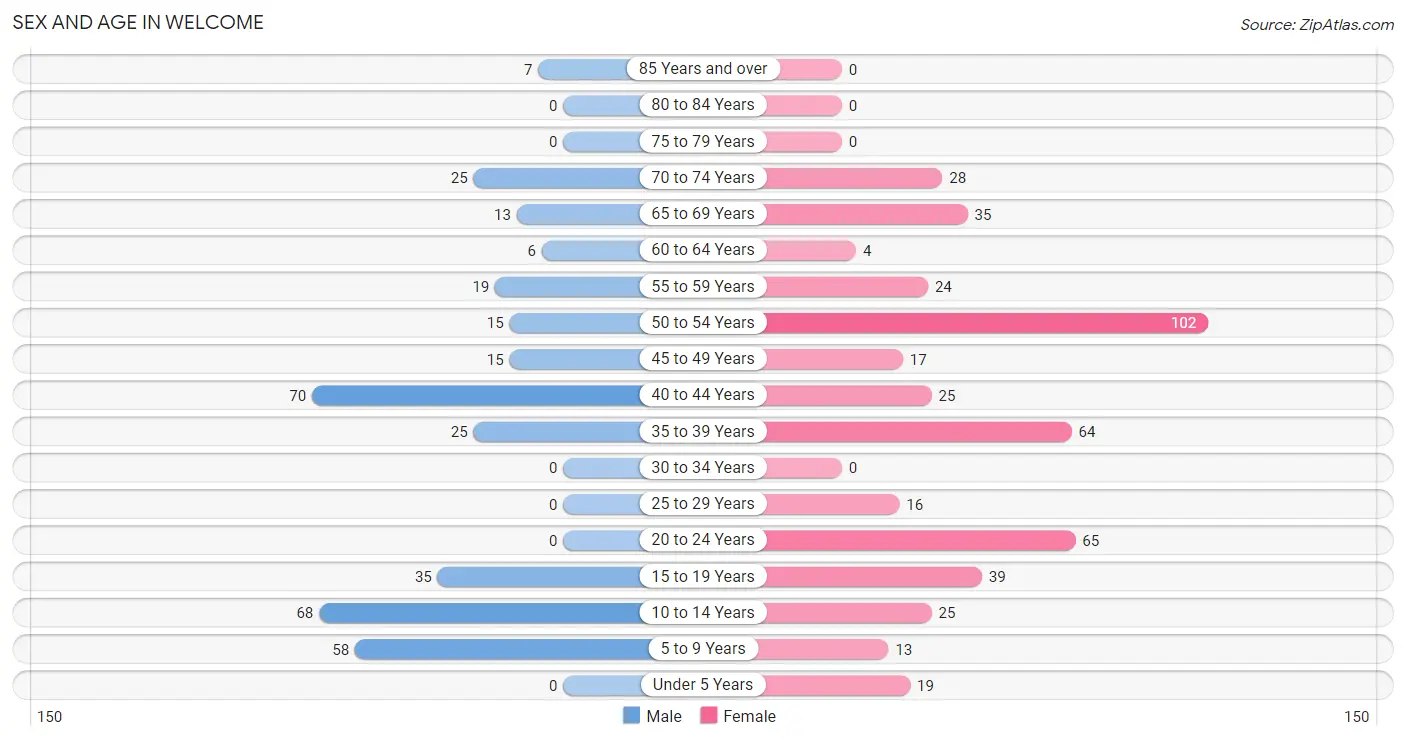
| Age Bracket | Male | Female |
| Under 5 Years | 0 (0.0%) | 19 (4.0%) |
| 5 to 9 Years | 58 (16.3%) | 13 (2.7%) |
| 10 to 14 Years | 68 (19.1%) | 25 (5.2%) |
| 15 to 19 Years | 35 (9.8%) | 39 (8.2%) |
| 20 to 24 Years | 0 (0.0%) | 65 (13.7%) |
| 25 to 29 Years | 0 (0.0%) | 16 (3.4%) |
| 30 to 34 Years | 0 (0.0%) | 0 (0.0%) |
| 35 to 39 Years | 25 (7.0%) | 64 (13.5%) |
| 40 to 44 Years | 70 (19.7%) | 25 (5.2%) |
| 45 to 49 Years | 15 (4.2%) | 17 (3.6%) |
| 50 to 54 Years | 15 (4.2%) | 102 (21.4%) |
| 55 to 59 Years | 19 (5.3%) | 24 (5.0%) |
| 60 to 64 Years | 6 (1.7%) | 4 (0.8%) |
| 65 to 69 Years | 13 (3.6%) | 35 (7.3%) |
| 70 to 74 Years | 25 (7.0%) | 28 (5.9%) |
| 75 to 79 Years | 0 (0.0%) | 0 (0.0%) |
| 80 to 84 Years | 0 (0.0%) | 0 (0.0%) |
| 85 Years and over | 7 (2.0%) | 0 (0.0%) |
| Total | 356 (100.0%) | 476 (100.0%) |
Families and Households in Welcome
Median Family Size in Welcome
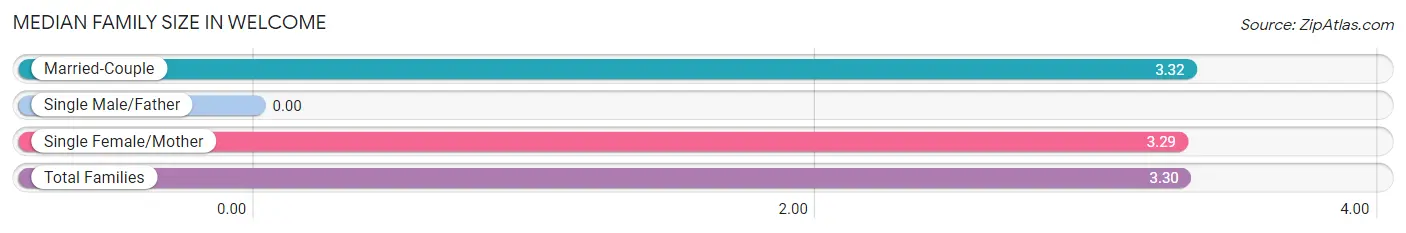
| Family Type | # Families | Family Size |
| Married-Couple | 65 (32.8%) | 3.32 |
| Single Male/Father | 0 (0.0%) | - |
| Single Female/Mother | 133 (67.2%) | 3.29 |
| Total Families | 198 (100.0%) | 3.30 |
Median Household Size in Welcome
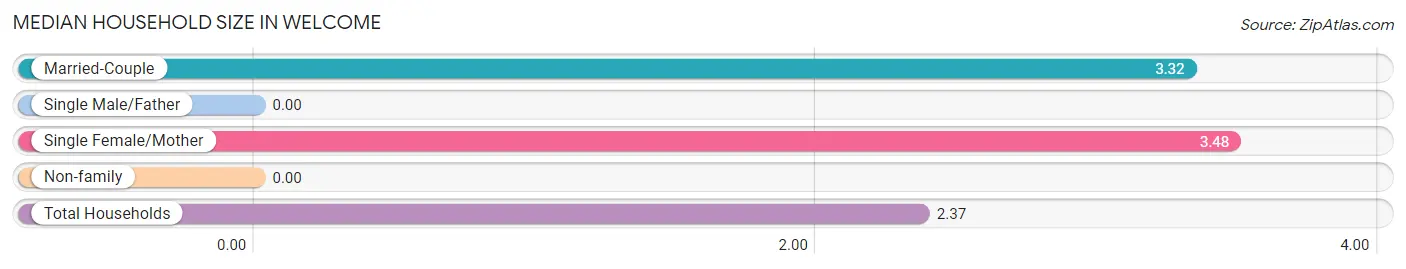
| Household Type | # Households | Household Size |
| Married-Couple | 65 (18.5%) | 3.32 |
| Single Male/Father | 0 (0.0%) | - |
| Single Female/Mother | 133 (37.9%) | 3.48 |
| Non-family | 153 (43.6%) | - |
| Total Households | 351 (100.0%) | 2.37 |
Household Size by Marriage Status in Welcome
Out of a total of 351 households in Welcome, 198 (56.4%) are family households, while 153 (43.6%) are nonfamily households. The most numerous type of family households are 2-person households, comprising 93, and the most common type of nonfamily households are 1-person households, comprising 153.
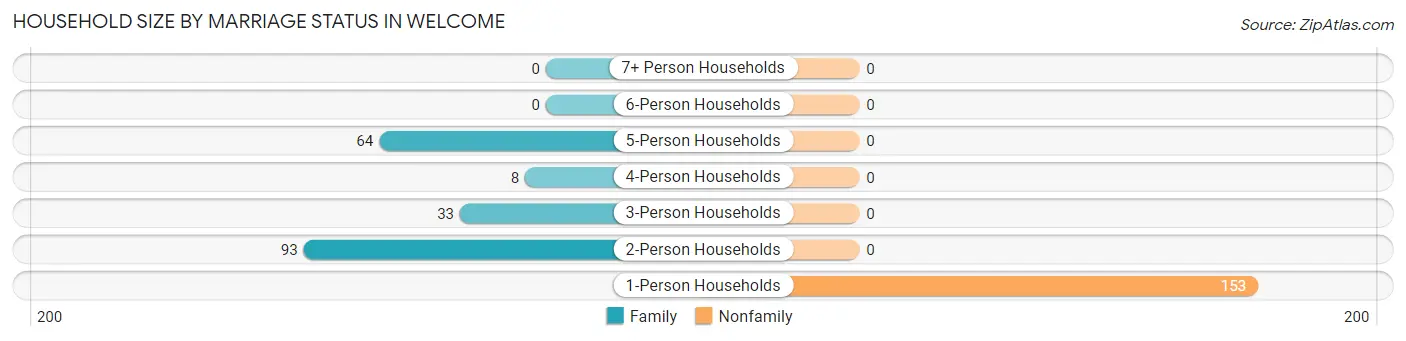
| Household Size | Family Households | Nonfamily Households |
| 1-Person Households | - | 153 (43.6%) |
| 2-Person Households | 93 (26.5%) | 0 (0.0%) |
| 3-Person Households | 33 (9.4%) | 0 (0.0%) |
| 4-Person Households | 8 (2.3%) | 0 (0.0%) |
| 5-Person Households | 64 (18.2%) | 0 (0.0%) |
| 6-Person Households | 0 (0.0%) | 0 (0.0%) |
| 7+ Person Households | 0 (0.0%) | 0 (0.0%) |
| Total | 198 (56.4%) | 153 (43.6%) |
Female Fertility in Welcome
Fertility by Age in Welcome
| Age Bracket | Women with Births | Births / 1,000 Women |
| 15 to 19 years | 0 (0.0%) | 0.0 |
| 20 to 34 years | 0 (0.0%) | 0.0 |
| 35 to 50 years | 0 (0.0%) | 0.0 |
| Total | 0 (0.0%) | 0.0 |
Fertility by Age by Marriage Status in Welcome
| Age Bracket | Married | Unmarried |
| 15 to 19 years | 0 (0.0%) | 0 (0.0%) |
| 20 to 34 years | 0 (0.0%) | 0 (0.0%) |
| 35 to 50 years | 0 (0.0%) | 0 (0.0%) |
| Total | 0 (0.0%) | 0 (0.0%) |
Fertility by Education in Welcome
| Educational Attainment | Women with Births | Births / 1,000 Women |
| Less than High School | 0 (0.0%) | 0.0 |
| High School Diploma | 0 (0.0%) | 0.0 |
| College or Associate's Degree | 0 (0.0%) | 0.0 |
| Bachelor's Degree | 0 (0.0%) | 0.0 |
| Graduate Degree | 0 (0.0%) | 0.0 |
| Total | 0 (0.0%) | 0.0 |
Fertility by Education by Marriage Status in Welcome
| Educational Attainment | Married | Unmarried |
| Less than High School | 0 (0.0%) | 0 (0.0%) |
| High School Diploma | 0 (0.0%) | 0 (0.0%) |
| College or Associate's Degree | 0 (0.0%) | 0 (0.0%) |
| Bachelor's Degree | 0 (0.0%) | 0 (0.0%) |
| Graduate Degree | 0 (0.0%) | 0 (0.0%) |
| Total | 0 (0.0%) | 0 (0.0%) |
Employment Characteristics in Welcome
Employment by Class of Employer in Welcome
Among the 394 employed individuals in Welcome, private company employees (371 | 94.2%), and local government employees (23 | 5.8%) make up the most common classes of employment.
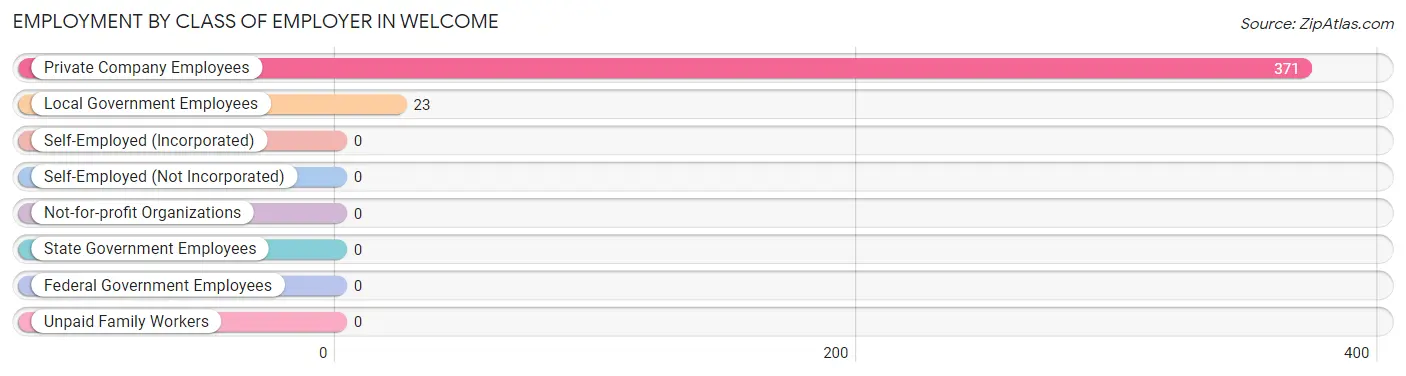
| Employer Class | # Employees | % Employees |
| Private Company Employees | 371 | 94.2% |
| Self-Employed (Incorporated) | 0 | 0.0% |
| Self-Employed (Not Incorporated) | 0 | 0.0% |
| Not-for-profit Organizations | 0 | 0.0% |
| Local Government Employees | 23 | 5.8% |
| State Government Employees | 0 | 0.0% |
| Federal Government Employees | 0 | 0.0% |
| Unpaid Family Workers | 0 | 0.0% |
| Total | 394 | 100.0% |
Employment Status by Age in Welcome
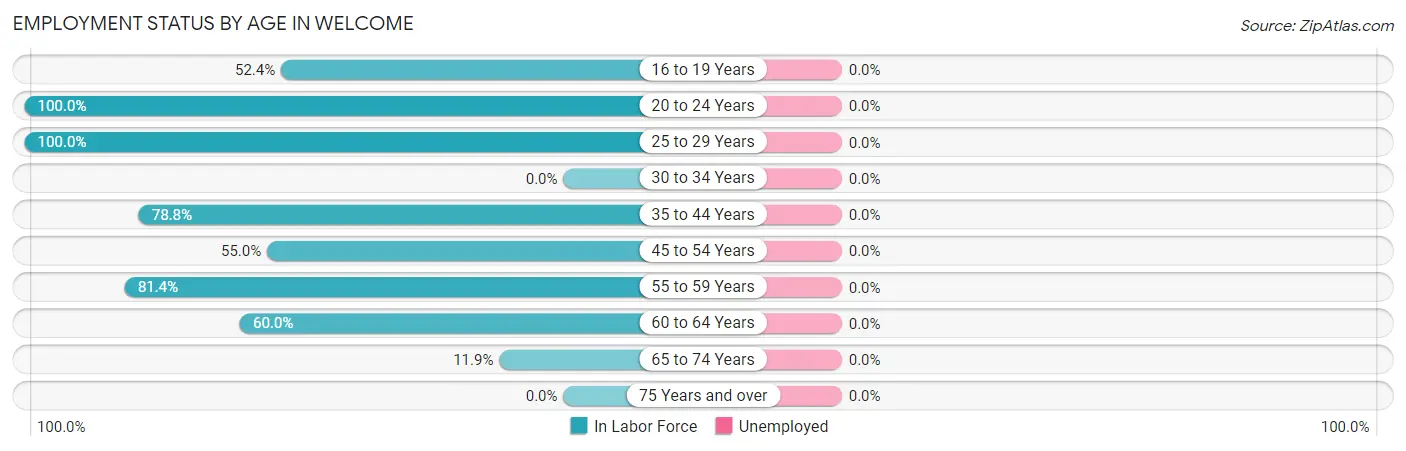
| Age Bracket | In Labor Force | Unemployed |
| 16 to 19 Years | 33 (52.4%) | 0 (0.0%) |
| 20 to 24 Years | 65 (100.0%) | 0 (0.0%) |
| 25 to 29 Years | 16 (100.0%) | 0 (0.0%) |
| 30 to 34 Years | 0 (0.0%) | 0 (0.0%) |
| 35 to 44 Years | 145 (78.8%) | 0 (0.0%) |
| 45 to 54 Years | 82 (55.0%) | 0 (0.0%) |
| 55 to 59 Years | 35 (81.4%) | 0 (0.0%) |
| 60 to 64 Years | 6 (60.0%) | 0 (0.0%) |
| 65 to 74 Years | 12 (11.9%) | 0 (0.0%) |
| 75 Years and over | 0 (0.0%) | 0 (0.0%) |
| Total | 394 (61.8%) | 0 (0.0%) |
Employment Status by Educational Attainment in Welcome
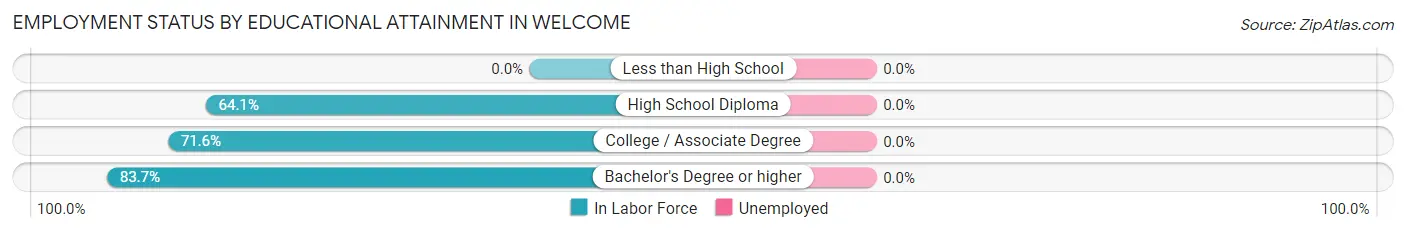
| Educational Attainment | In Labor Force | Unemployed |
| Less than High School | 0 (0.0%) | 0 (0.0%) |
| High School Diploma | 82 (64.1%) | 0 (0.0%) |
| College / Associate Degree | 161 (71.6%) | 0 (0.0%) |
| Bachelor's Degree or higher | 41 (83.7%) | 0 (0.0%) |
| Total | 284 (70.6%) | 0 (0.0%) |
Employment Occupations by Sex in Welcome
Management, Business, Science and Arts Occupations
The most common Management, Business, Science and Arts occupations in Welcome are Management (112 | 28.4%), Community & Social Service (33 | 8.4%), and Education Instruction & Library (33 | 8.4%).
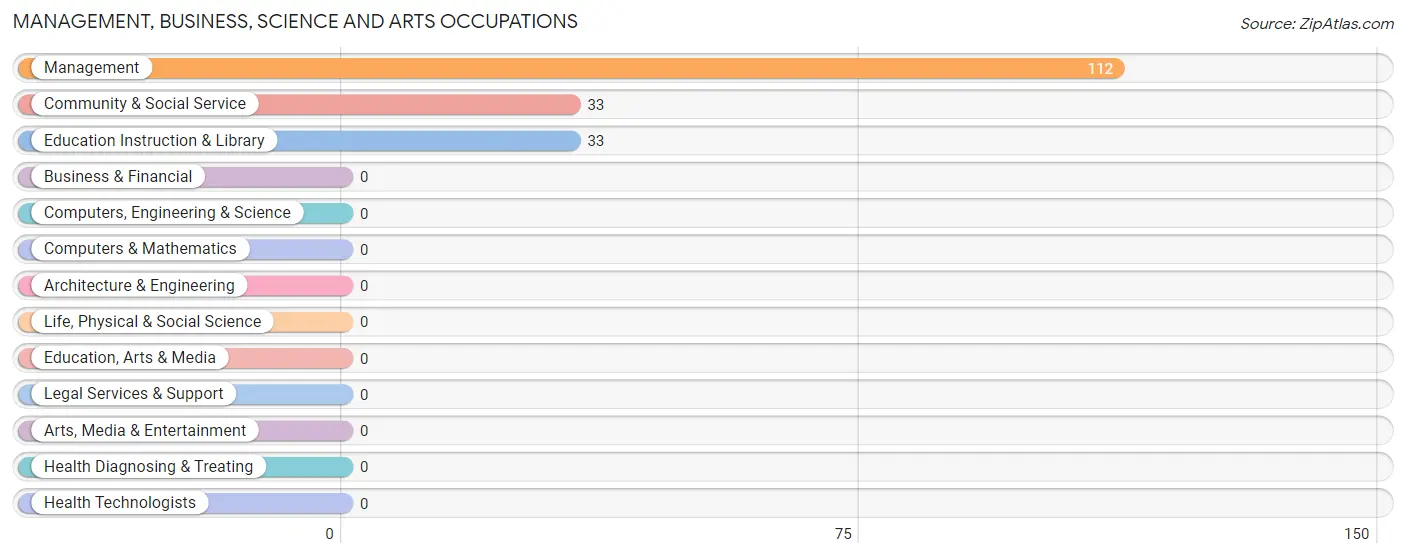
Management, Business, Science and Arts Occupations by Sex
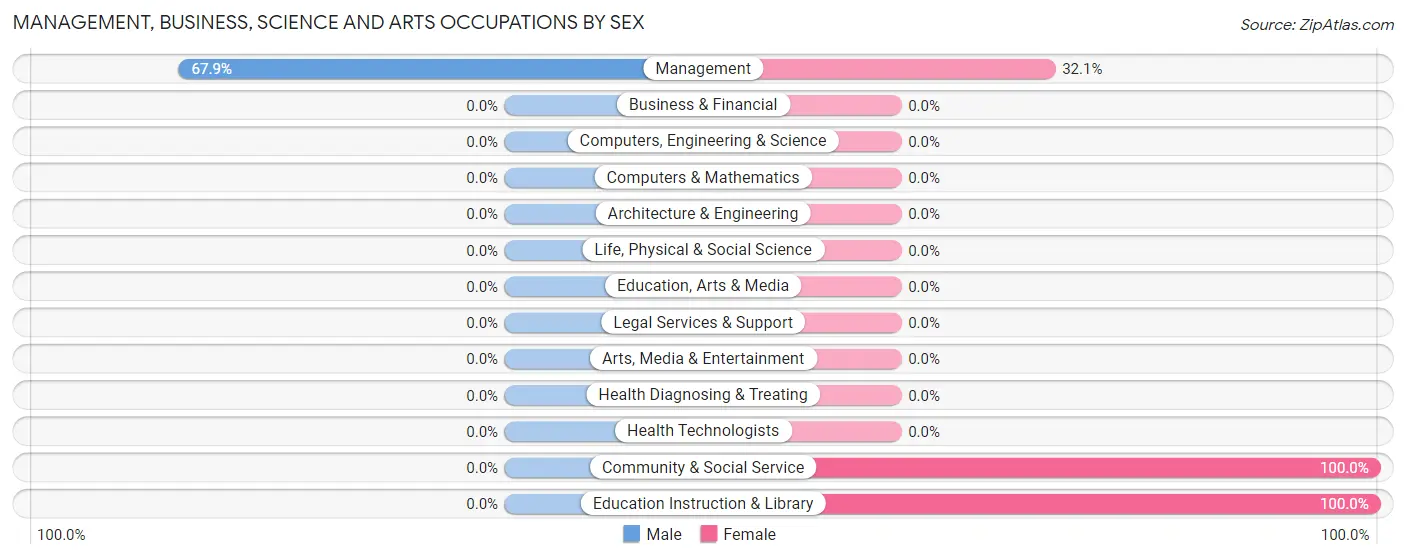
| Occupation | Male | Female |
| Management | 76 (67.9%) | 36 (32.1%) |
| Business & Financial | 0 (0.0%) | 0 (0.0%) |
| Computers, Engineering & Science | 0 (0.0%) | 0 (0.0%) |
| Computers & Mathematics | 0 (0.0%) | 0 (0.0%) |
| Architecture & Engineering | 0 (0.0%) | 0 (0.0%) |
| Life, Physical & Social Science | 0 (0.0%) | 0 (0.0%) |
| Community & Social Service | 0 (0.0%) | 33 (100.0%) |
| Education, Arts & Media | 0 (0.0%) | 0 (0.0%) |
| Legal Services & Support | 0 (0.0%) | 0 (0.0%) |
| Education Instruction & Library | 0 (0.0%) | 33 (100.0%) |
| Arts, Media & Entertainment | 0 (0.0%) | 0 (0.0%) |
| Health Diagnosing & Treating | 0 (0.0%) | 0 (0.0%) |
| Health Technologists | 0 (0.0%) | 0 (0.0%) |
| Total (Category) | 76 (52.4%) | 69 (47.6%) |
| Total (Overall) | 110 (27.9%) | 284 (72.1%) |
Services Occupations
The most common Services occupations in Welcome are Security & Protection (26 | 6.6%), Firefighting & Prevention (26 | 6.6%), Cleaning & Maintenance (17 | 4.3%), Personal Care & Service (17 | 4.3%), and Food Preparation & Serving (12 | 3.0%).
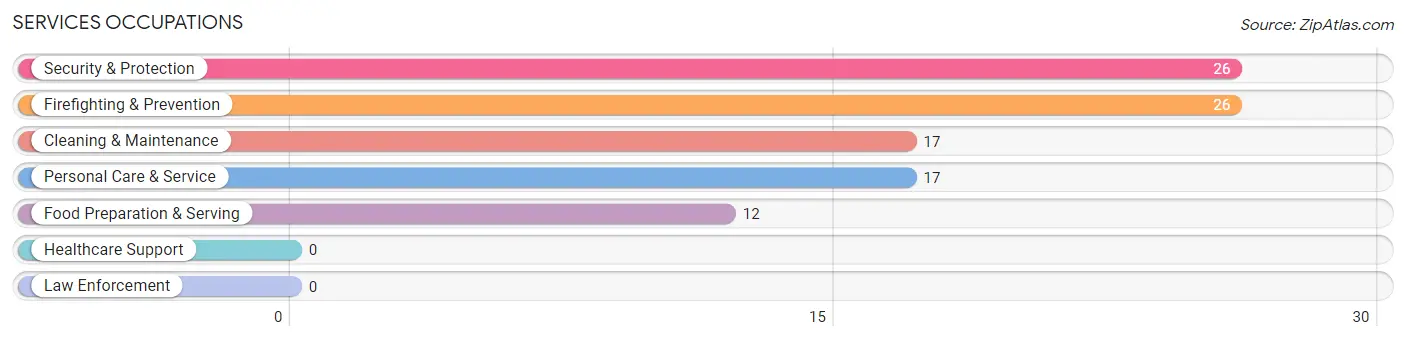
Services Occupations by Sex
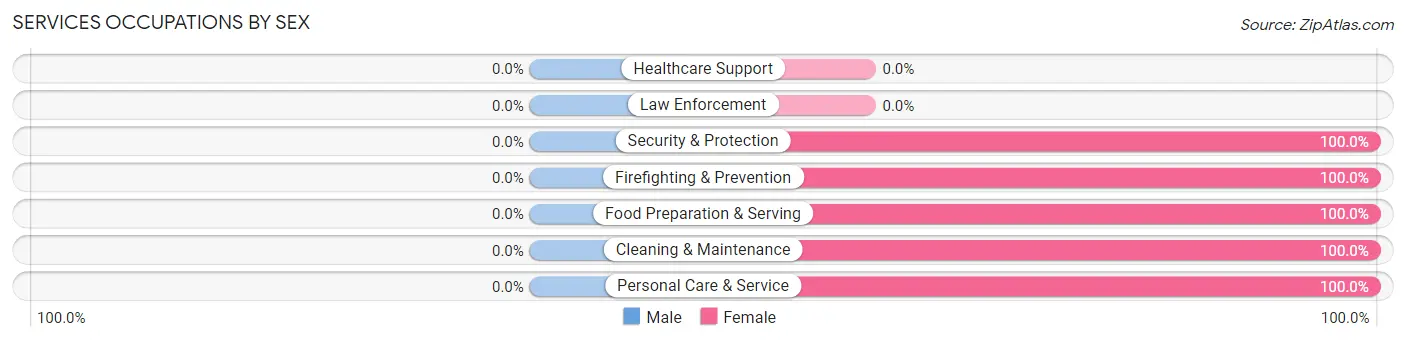
| Occupation | Male | Female |
| Healthcare Support | 0 (0.0%) | 0 (0.0%) |
| Security & Protection | 0 (0.0%) | 26 (100.0%) |
| Firefighting & Prevention | 0 (0.0%) | 26 (100.0%) |
| Law Enforcement | 0 (0.0%) | 0 (0.0%) |
| Food Preparation & Serving | 0 (0.0%) | 12 (100.0%) |
| Cleaning & Maintenance | 0 (0.0%) | 17 (100.0%) |
| Personal Care & Service | 0 (0.0%) | 17 (100.0%) |
| Total (Category) | 0 (0.0%) | 72 (100.0%) |
| Total (Overall) | 110 (27.9%) | 284 (72.1%) |
Sales and Office Occupations
The most common Sales and Office occupations in Welcome are Sales & Related (87 | 22.1%), and Office & Administration (31 | 7.9%).
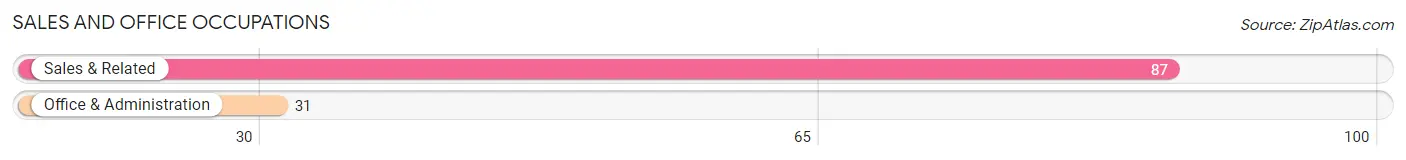
Sales and Office Occupations by Sex
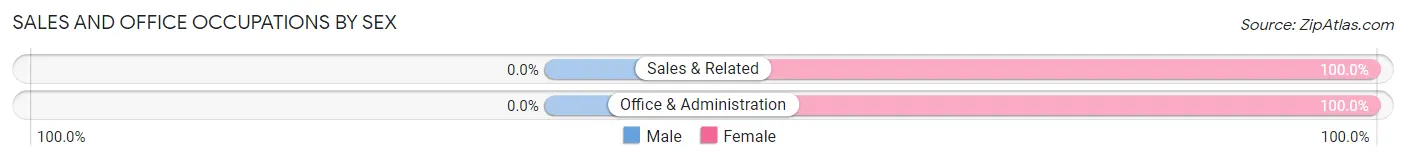
| Occupation | Male | Female |
| Sales & Related | 0 (0.0%) | 87 (100.0%) |
| Office & Administration | 0 (0.0%) | 31 (100.0%) |
| Total (Category) | 0 (0.0%) | 118 (100.0%) |
| Total (Overall) | 110 (27.9%) | 284 (72.1%) |
Natural Resources, Construction and Maintenance Occupations
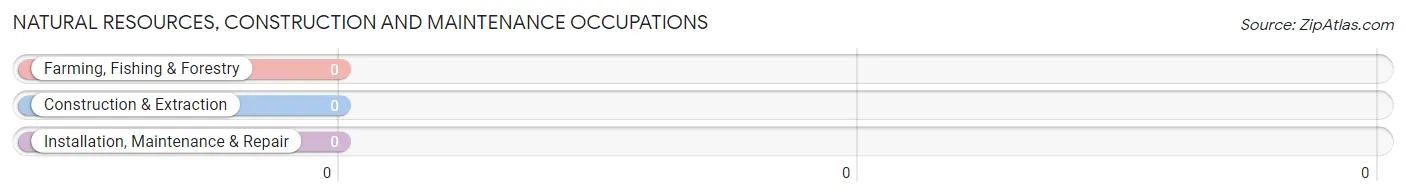
Natural Resources, Construction and Maintenance Occupations by Sex
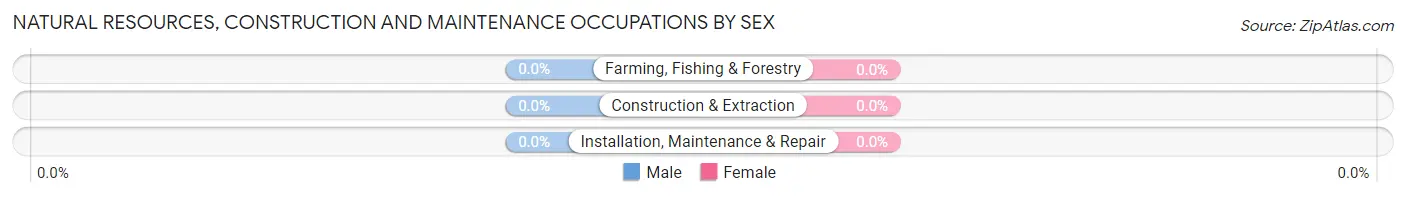
| Occupation | Male | Female |
| Farming, Fishing & Forestry | 0 (0.0%) | 0 (0.0%) |
| Construction & Extraction | 0 (0.0%) | 0 (0.0%) |
| Installation, Maintenance & Repair | 0 (0.0%) | 0 (0.0%) |
| Total (Category) | 0 (0.0%) | 0 (0.0%) |
| Total (Overall) | 110 (27.9%) | 284 (72.1%) |
Production, Transportation and Moving Occupations
The most common Production, Transportation and Moving occupations in Welcome are Production (34 | 8.6%), and Transportation (25 | 6.4%).
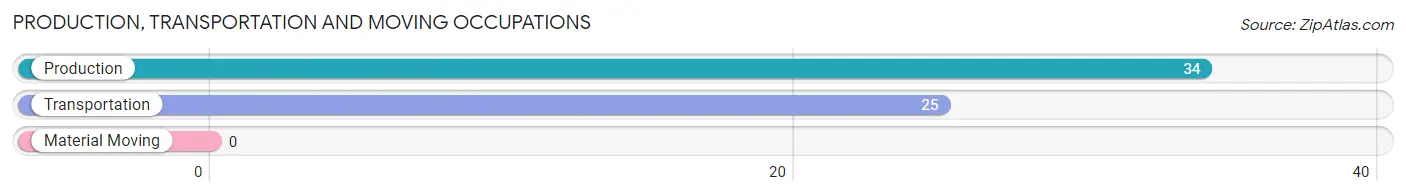
Production, Transportation and Moving Occupations by Sex
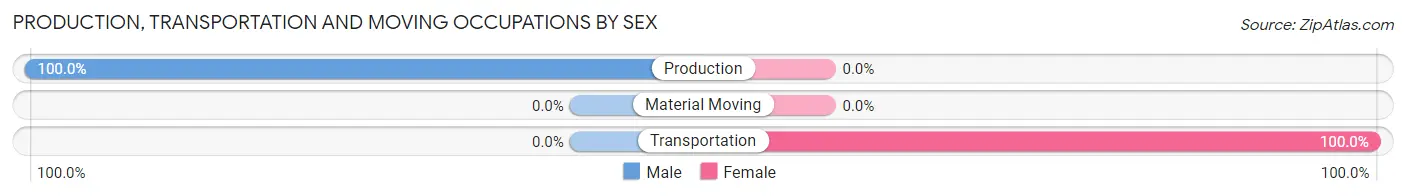
| Occupation | Male | Female |
| Production | 34 (100.0%) | 0 (0.0%) |
| Transportation | 0 (0.0%) | 25 (100.0%) |
| Material Moving | 0 (0.0%) | 0 (0.0%) |
| Total (Category) | 34 (57.6%) | 25 (42.4%) |
| Total (Overall) | 110 (27.9%) | 284 (72.1%) |
Employment Industries by Sex in Welcome
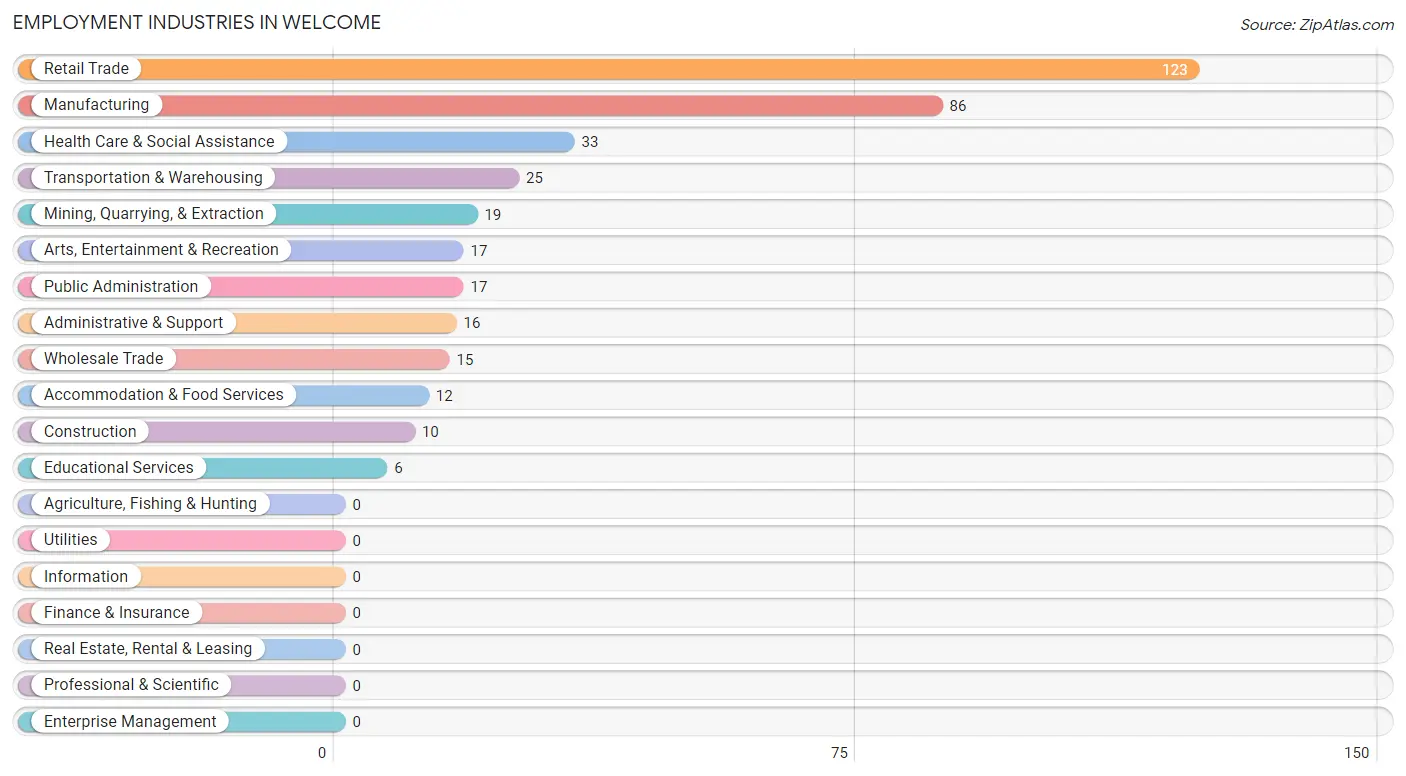
Employment Industries in Welcome
The major employment industries in Welcome include Retail Trade (123 | 31.2%), Manufacturing (86 | 21.8%), Health Care & Social Assistance (33 | 8.4%), Transportation & Warehousing (25 | 6.4%), and Mining, Quarrying, & Extraction (19 | 4.8%).
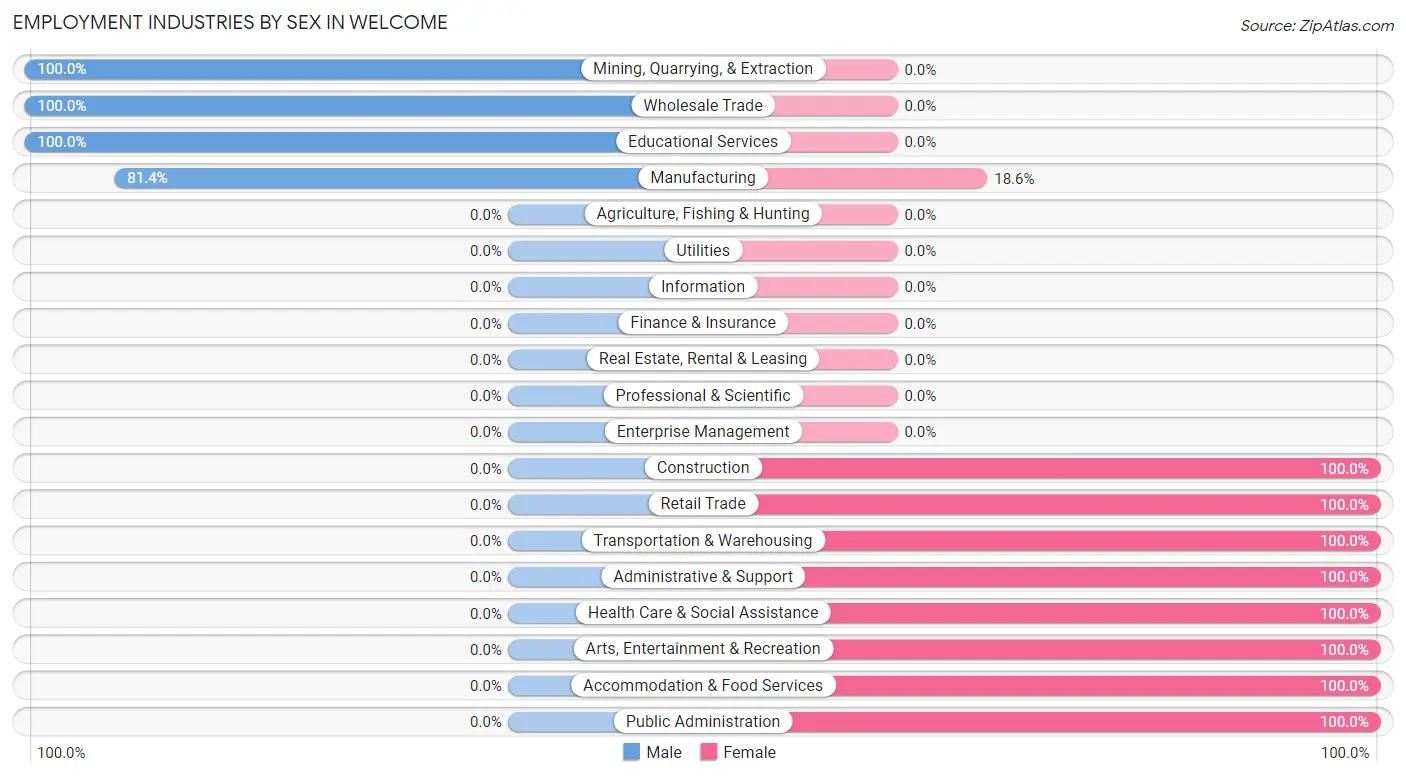
Employment Industries by Sex in Welcome
The Welcome industries that see more men than women are Mining, Quarrying, & Extraction (100.0%), Wholesale Trade (100.0%), and Educational Services (100.0%), whereas the industries that tend to have a higher number of women are Construction (100.0%), Retail Trade (100.0%), and Transportation & Warehousing (100.0%).
| Industry | Male | Female |
| Agriculture, Fishing & Hunting | 0 (0.0%) | 0 (0.0%) |
| Mining, Quarrying, & Extraction | 19 (100.0%) | 0 (0.0%) |
| Construction | 0 (0.0%) | 10 (100.0%) |
| Manufacturing | 70 (81.4%) | 16 (18.6%) |
| Wholesale Trade | 15 (100.0%) | 0 (0.0%) |
| Retail Trade | 0 (0.0%) | 123 (100.0%) |
| Transportation & Warehousing | 0 (0.0%) | 25 (100.0%) |
| Utilities | 0 (0.0%) | 0 (0.0%) |
| Information | 0 (0.0%) | 0 (0.0%) |
| Finance & Insurance | 0 (0.0%) | 0 (0.0%) |
| Real Estate, Rental & Leasing | 0 (0.0%) | 0 (0.0%) |
| Professional & Scientific | 0 (0.0%) | 0 (0.0%) |
| Enterprise Management | 0 (0.0%) | 0 (0.0%) |
| Administrative & Support | 0 (0.0%) | 16 (100.0%) |
| Educational Services | 6 (100.0%) | 0 (0.0%) |
| Health Care & Social Assistance | 0 (0.0%) | 33 (100.0%) |
| Arts, Entertainment & Recreation | 0 (0.0%) | 17 (100.0%) |
| Accommodation & Food Services | 0 (0.0%) | 12 (100.0%) |
| Public Administration | 0 (0.0%) | 17 (100.0%) |
| Total | 110 (27.9%) | 284 (72.1%) |
Education in Welcome
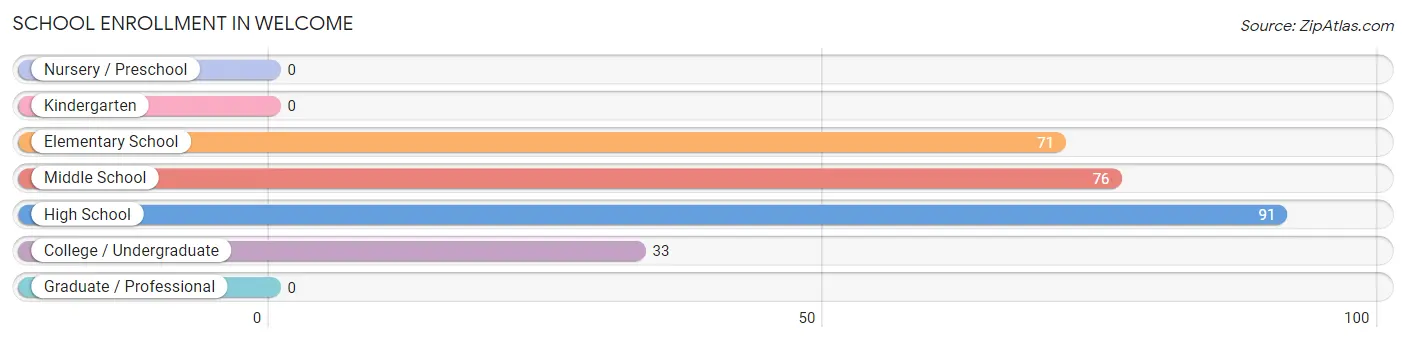
School Enrollment in Welcome
The most common levels of schooling among the 271 students in Welcome are high school (91 | 33.6%), middle school (76 | 28.0%), and elementary school (71 | 26.2%).
| School Level | # Students | % Students |
| Nursery / Preschool | 0 | 0.0% |
| Kindergarten | 0 | 0.0% |
| Elementary School | 71 | 26.2% |
| Middle School | 76 | 28.0% |
| High School | 91 | 33.6% |
| College / Undergraduate | 33 | 12.2% |
| Graduate / Professional | 0 | 0.0% |
| Total | 271 | 100.0% |
School Enrollment by Age by Funding Source in Welcome
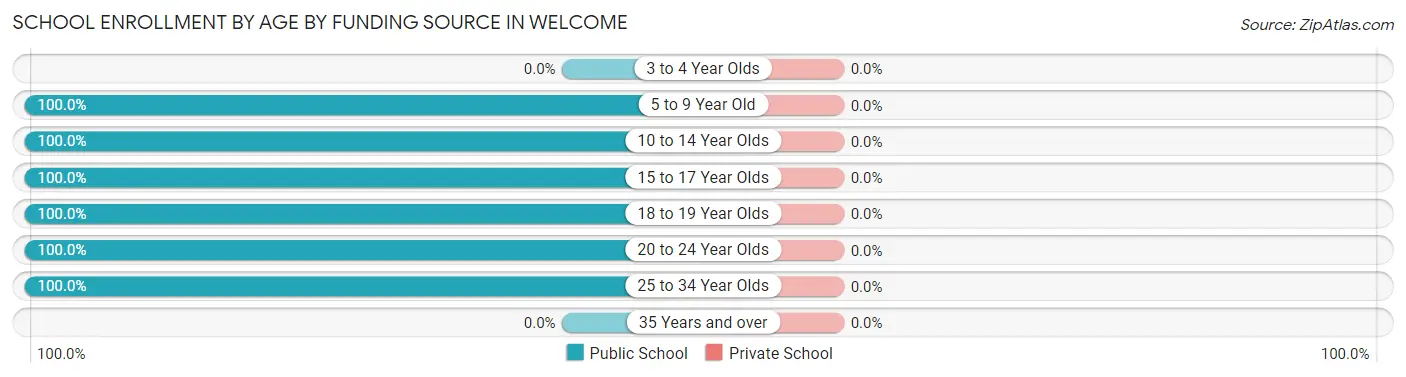
| Age Bracket | Public School | Private School |
| 3 to 4 Year Olds | 0 (0.0%) | 0 (0.0%) |
| 5 to 9 Year Old | 71 (100.0%) | 0 (0.0%) |
| 10 to 14 Year Olds | 93 (100.0%) | 0 (0.0%) |
| 15 to 17 Year Olds | 27 (100.0%) | 0 (0.0%) |
| 18 to 19 Year Olds | 47 (100.0%) | 0 (0.0%) |
| 20 to 24 Year Olds | 17 (100.0%) | 0 (0.0%) |
| 25 to 34 Year Olds | 16 (100.0%) | 0 (0.0%) |
| 35 Years and over | 0 (0.0%) | 0 (0.0%) |
| Total | 271 (100.0%) | 0 (0.0%) |
Educational Attainment by Field of Study in Welcome
Education (38 | 37.2%), engineering (25 | 24.5%), liberal arts & history (16 | 15.7%), literature & languages (12 | 11.8%), and business (11 | 10.8%) are the most common fields of study among 102 individuals in Welcome who have obtained a bachelor's degree or higher.
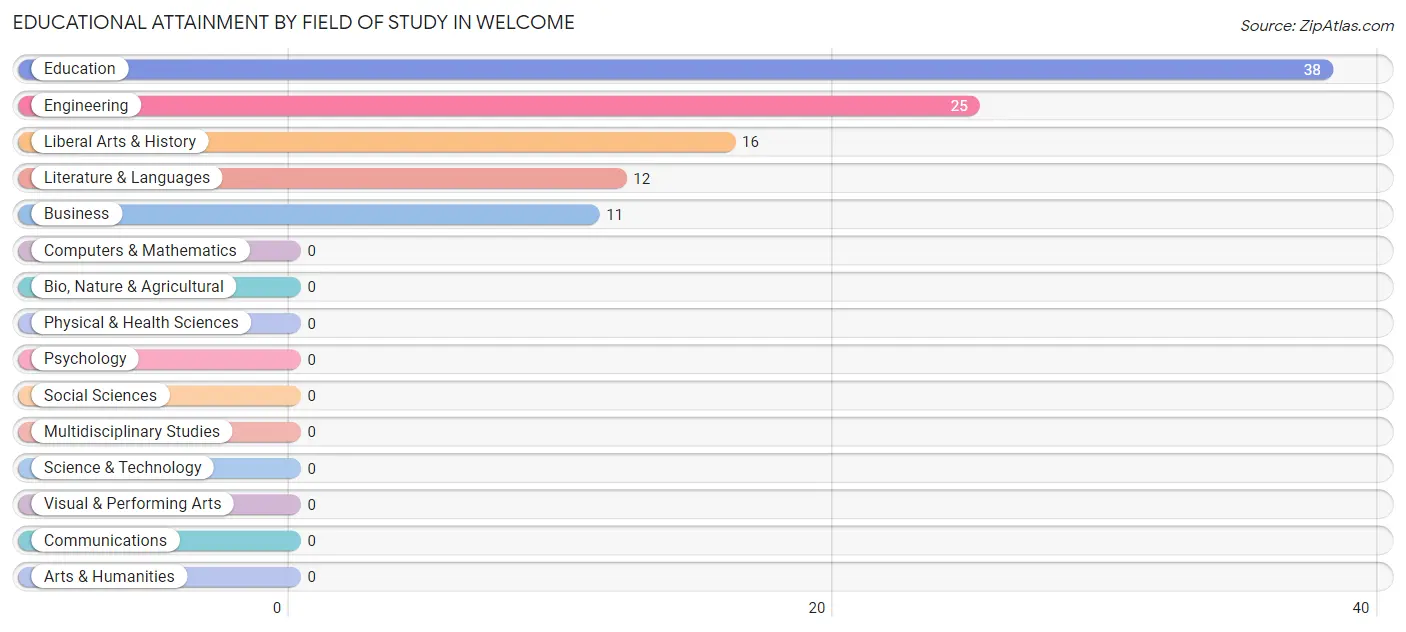
| Field of Study | # Graduates | % Graduates |
| Computers & Mathematics | 0 | 0.0% |
| Bio, Nature & Agricultural | 0 | 0.0% |
| Physical & Health Sciences | 0 | 0.0% |
| Psychology | 0 | 0.0% |
| Social Sciences | 0 | 0.0% |
| Engineering | 25 | 24.5% |
| Multidisciplinary Studies | 0 | 0.0% |
| Science & Technology | 0 | 0.0% |
| Business | 11 | 10.8% |
| Education | 38 | 37.2% |
| Literature & Languages | 12 | 11.8% |
| Liberal Arts & History | 16 | 15.7% |
| Visual & Performing Arts | 0 | 0.0% |
| Communications | 0 | 0.0% |
| Arts & Humanities | 0 | 0.0% |
| Total | 102 | 100.0% |
Transportation & Commute in Welcome
Vehicle Availability by Sex in Welcome
The most prevalent vehicle ownership categories in Welcome are males with 3 vehicles (91, accounting for 82.7%) and females with 3 vehicles (108, making up 32.0%).
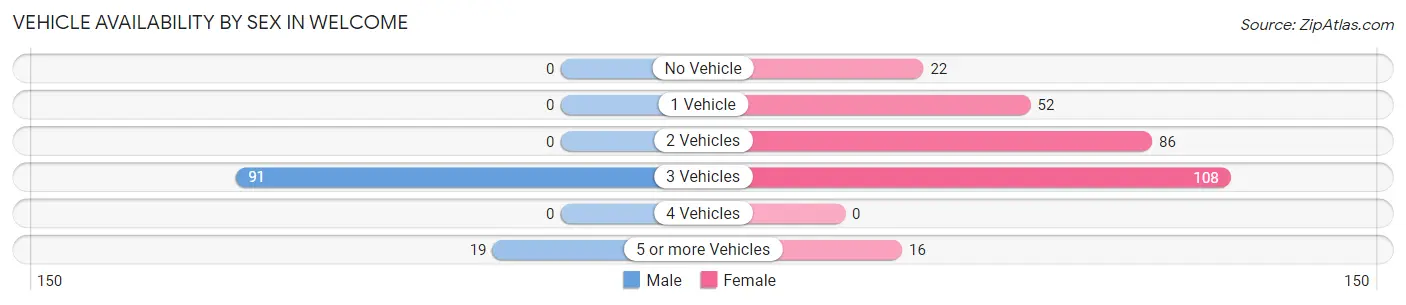
| Vehicles Available | Male | Female |
| No Vehicle | 0 (0.0%) | 22 (7.7%) |
| 1 Vehicle | 0 (0.0%) | 52 (18.3%) |
| 2 Vehicles | 0 (0.0%) | 86 (30.3%) |
| 3 Vehicles | 91 (82.7%) | 108 (38.0%) |
| 4 Vehicles | 0 (0.0%) | 0 (0.0%) |
| 5 or more Vehicles | 19 (17.3%) | 16 (5.6%) |
| Total | 110 (100.0%) | 284 (100.0%) |
Commute Time in Welcome
The most frequently occuring commute durations in Welcome are 60 to 89 minutes (120 commuters, 30.5%), 30 to 34 minutes (106 commuters, 26.9%), and 20 to 24 minutes (67 commuters, 17.0%).
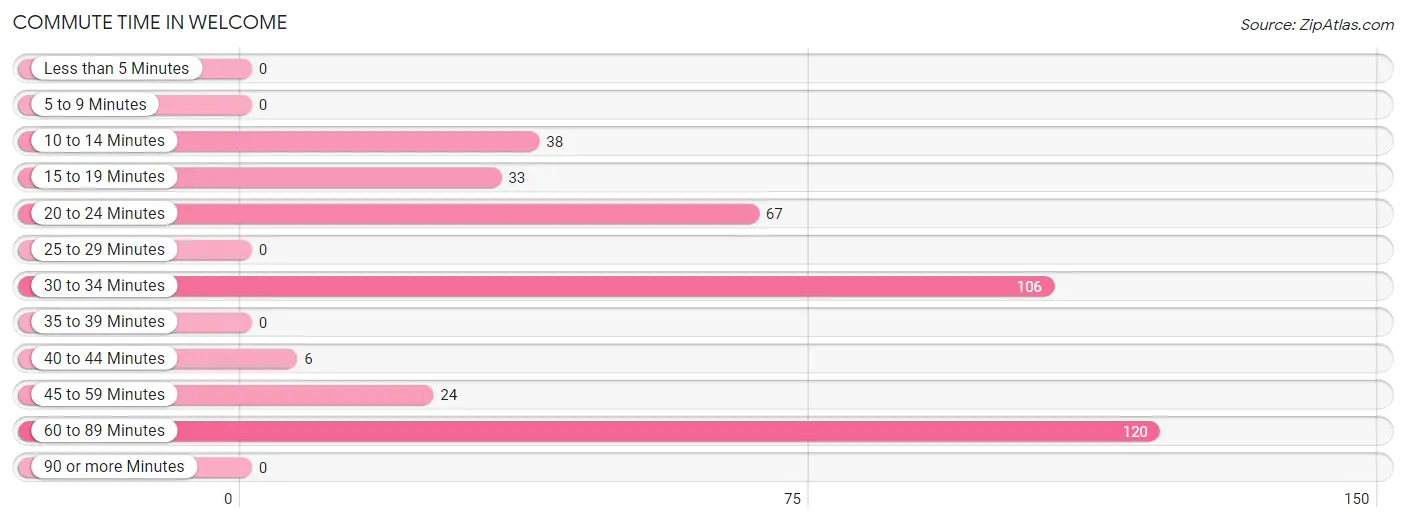
| Commute Time | # Commuters | % Commuters |
| Less than 5 Minutes | 0 | 0.0% |
| 5 to 9 Minutes | 0 | 0.0% |
| 10 to 14 Minutes | 38 | 9.6% |
| 15 to 19 Minutes | 33 | 8.4% |
| 20 to 24 Minutes | 67 | 17.0% |
| 25 to 29 Minutes | 0 | 0.0% |
| 30 to 34 Minutes | 106 | 26.9% |
| 35 to 39 Minutes | 0 | 0.0% |
| 40 to 44 Minutes | 6 | 1.5% |
| 45 to 59 Minutes | 24 | 6.1% |
| 60 to 89 Minutes | 120 | 30.5% |
| 90 or more Minutes | 0 | 0.0% |
Commute Time by Sex in Welcome
The most common commute times in Welcome are 60 to 89 minutes (70 commuters, 63.6%) for males and 30 to 34 minutes (106 commuters, 37.3%) for females.
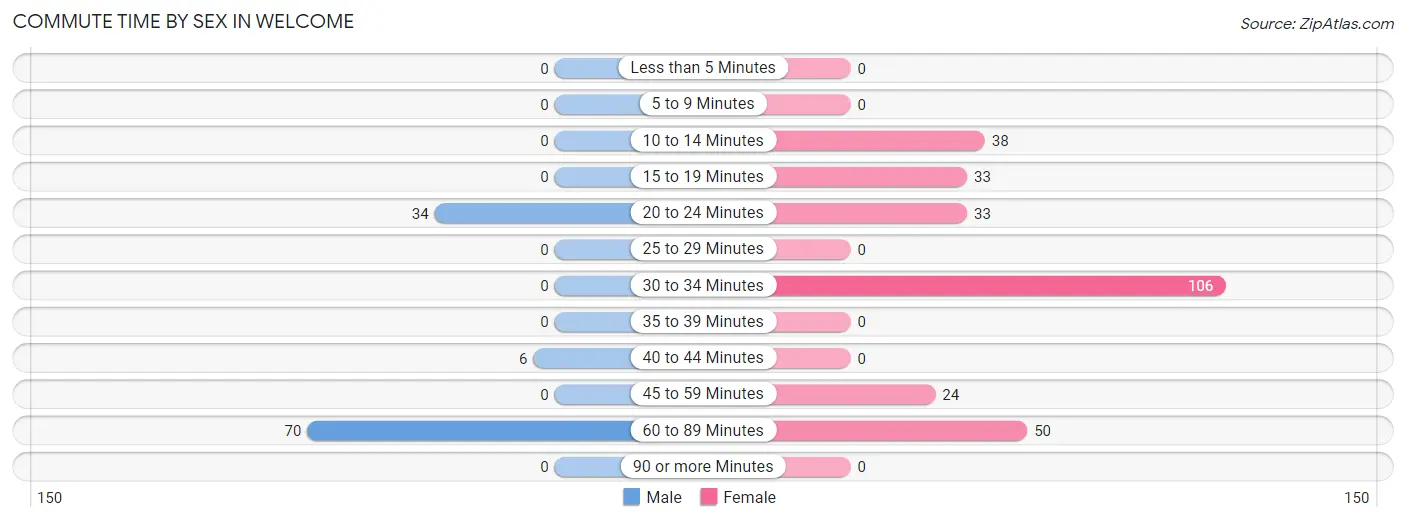
| Commute Time | Male | Female |
| Less than 5 Minutes | 0 (0.0%) | 0 (0.0%) |
| 5 to 9 Minutes | 0 (0.0%) | 0 (0.0%) |
| 10 to 14 Minutes | 0 (0.0%) | 38 (13.4%) |
| 15 to 19 Minutes | 0 (0.0%) | 33 (11.6%) |
| 20 to 24 Minutes | 34 (30.9%) | 33 (11.6%) |
| 25 to 29 Minutes | 0 (0.0%) | 0 (0.0%) |
| 30 to 34 Minutes | 0 (0.0%) | 106 (37.3%) |
| 35 to 39 Minutes | 0 (0.0%) | 0 (0.0%) |
| 40 to 44 Minutes | 6 (5.4%) | 0 (0.0%) |
| 45 to 59 Minutes | 0 (0.0%) | 24 (8.5%) |
| 60 to 89 Minutes | 70 (63.6%) | 50 (17.6%) |
| 90 or more Minutes | 0 (0.0%) | 0 (0.0%) |
Time of Departure to Work by Sex in Welcome
The most frequent times of departure to work in Welcome are 12:00 AM to 4:59 AM (104, 94.6%) for males and 7:30 AM to 7:59 AM (65, 22.9%) for females.
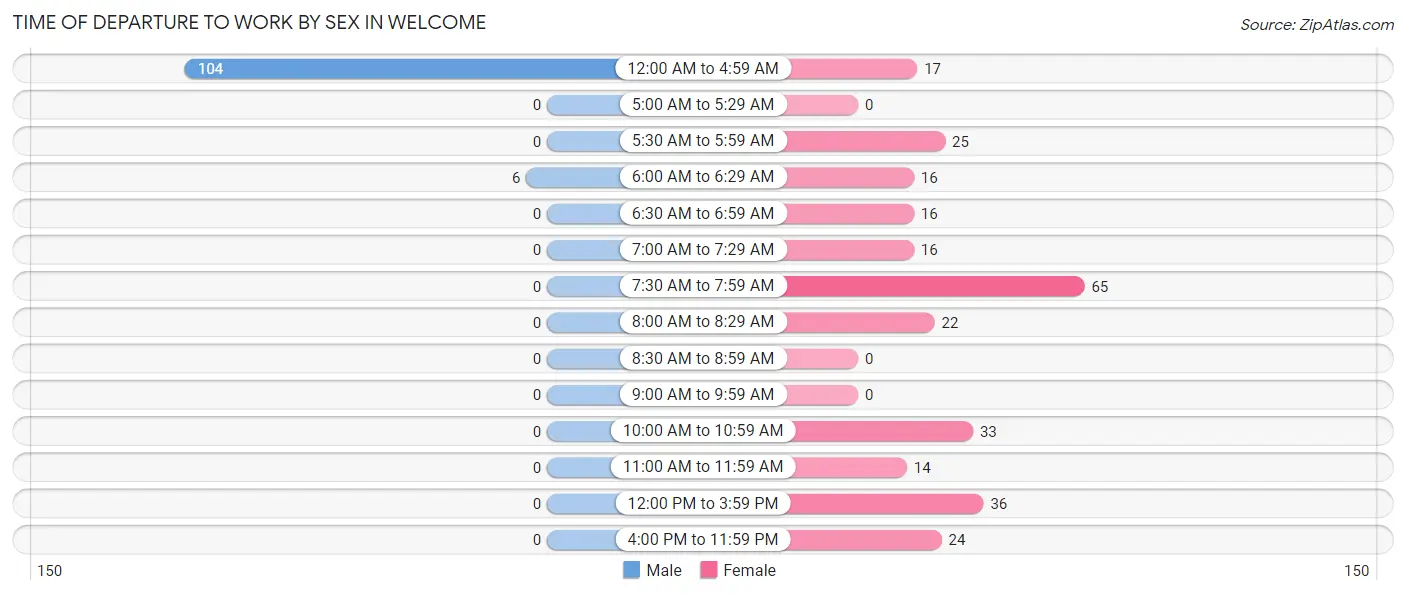
| Time of Departure | Male | Female |
| 12:00 AM to 4:59 AM | 104 (94.6%) | 17 (6.0%) |
| 5:00 AM to 5:29 AM | 0 (0.0%) | 0 (0.0%) |
| 5:30 AM to 5:59 AM | 0 (0.0%) | 25 (8.8%) |
| 6:00 AM to 6:29 AM | 6 (5.4%) | 16 (5.6%) |
| 6:30 AM to 6:59 AM | 0 (0.0%) | 16 (5.6%) |
| 7:00 AM to 7:29 AM | 0 (0.0%) | 16 (5.6%) |
| 7:30 AM to 7:59 AM | 0 (0.0%) | 65 (22.9%) |
| 8:00 AM to 8:29 AM | 0 (0.0%) | 22 (7.7%) |
| 8:30 AM to 8:59 AM | 0 (0.0%) | 0 (0.0%) |
| 9:00 AM to 9:59 AM | 0 (0.0%) | 0 (0.0%) |
| 10:00 AM to 10:59 AM | 0 (0.0%) | 33 (11.6%) |
| 11:00 AM to 11:59 AM | 0 (0.0%) | 14 (4.9%) |
| 12:00 PM to 3:59 PM | 0 (0.0%) | 36 (12.7%) |
| 4:00 PM to 11:59 PM | 0 (0.0%) | 24 (8.5%) |
| Total | 110 (100.0%) | 284 (100.0%) |
Housing Occupancy in Welcome
Occupancy by Ownership in Welcome
Of the total 351 dwellings in Welcome, owner-occupied units account for 227 (64.7%), while renter-occupied units make up 124 (35.3%).
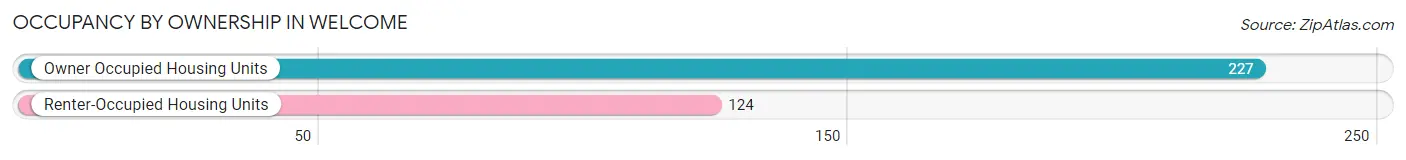
| Occupancy | # Housing Units | % Housing Units |
| Owner Occupied Housing Units | 227 | 64.7% |
| Renter-Occupied Housing Units | 124 | 35.3% |
| Total Occupied Housing Units | 351 | 100.0% |
Occupancy by Household Size in Welcome
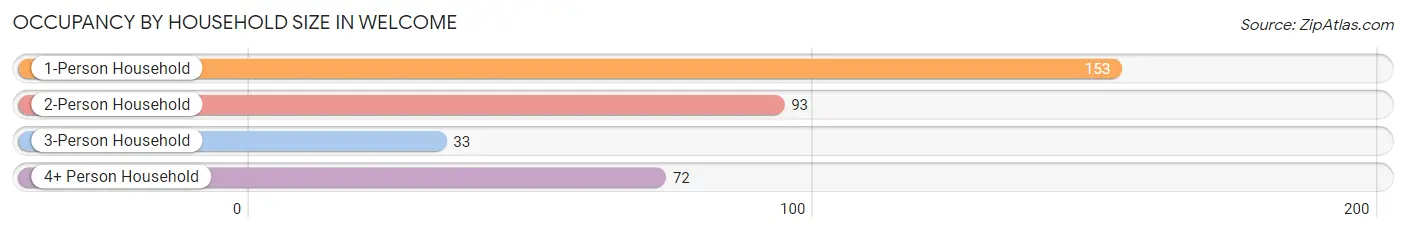
| Household Size | # Housing Units | % Housing Units |
| 1-Person Household | 153 | 43.6% |
| 2-Person Household | 93 | 26.5% |
| 3-Person Household | 33 | 9.4% |
| 4+ Person Household | 72 | 20.5% |
| Total Housing Units | 351 | 100.0% |
Occupancy by Ownership by Household Size in Welcome
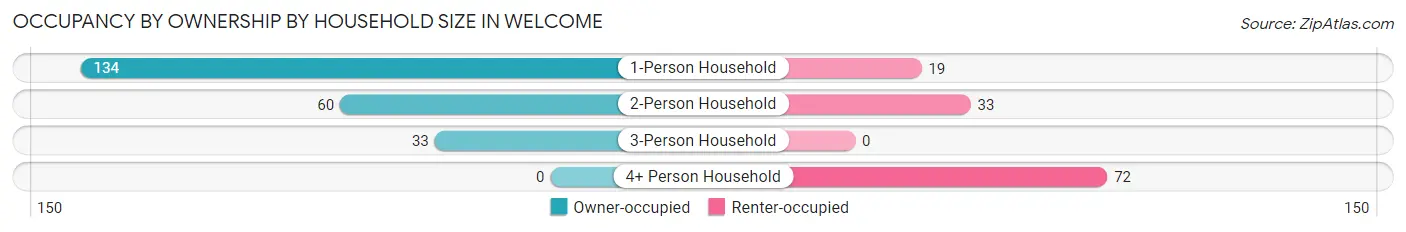
| Household Size | Owner-occupied | Renter-occupied |
| 1-Person Household | 134 (87.6%) | 19 (12.4%) |
| 2-Person Household | 60 (64.5%) | 33 (35.5%) |
| 3-Person Household | 33 (100.0%) | 0 (0.0%) |
| 4+ Person Household | 0 (0.0%) | 72 (100.0%) |
| Total Housing Units | 227 (64.7%) | 124 (35.3%) |
Occupancy by Educational Attainment in Welcome
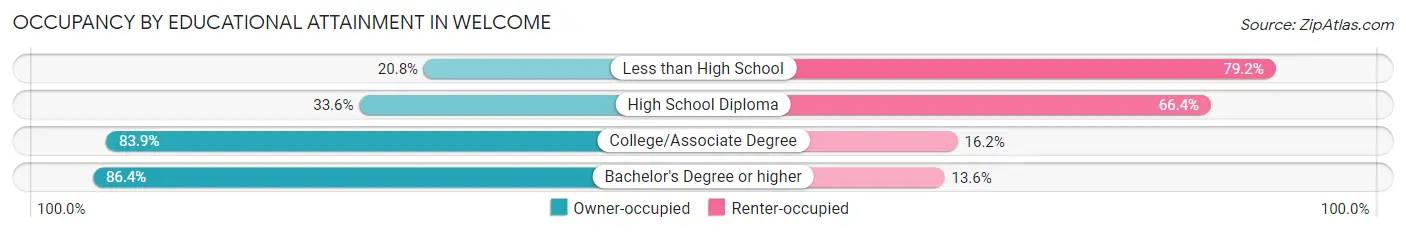
| Household Size | Owner-occupied | Renter-occupied |
| Less than High School | 5 (20.8%) | 19 (79.2%) |
| High School Diploma | 36 (33.6%) | 71 (66.4%) |
| College/Associate Degree | 135 (83.9%) | 26 (16.2%) |
| Bachelor's Degree or higher | 51 (86.4%) | 8 (13.6%) |
Occupancy by Age of Householder in Welcome
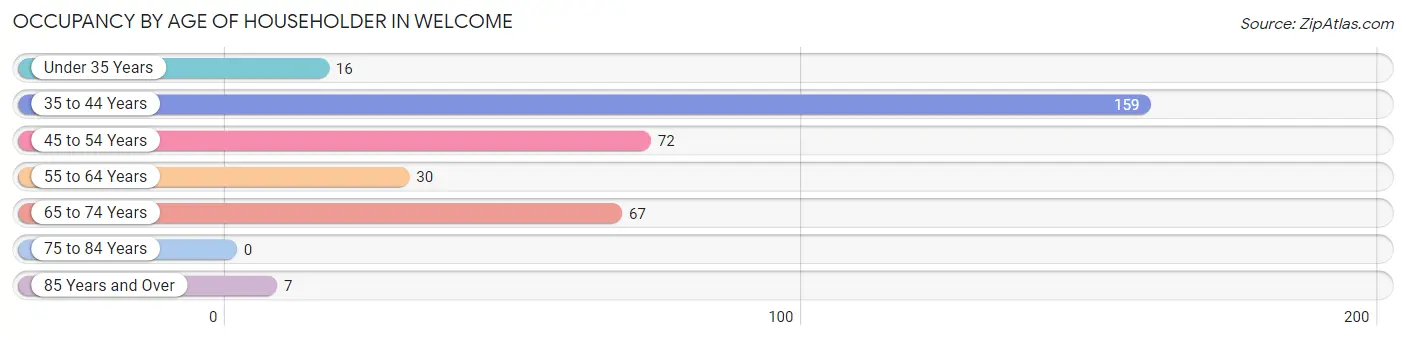
| Age Bracket | # Households | % Households |
| Under 35 Years | 16 | 4.6% |
| 35 to 44 Years | 159 | 45.3% |
| 45 to 54 Years | 72 | 20.5% |
| 55 to 64 Years | 30 | 8.6% |
| 65 to 74 Years | 67 | 19.1% |
| 75 to 84 Years | 0 | 0.0% |
| 85 Years and Over | 7 | 2.0% |
| Total | 351 | 100.0% |
Housing Finances in Welcome
Median Income by Occupancy in Welcome
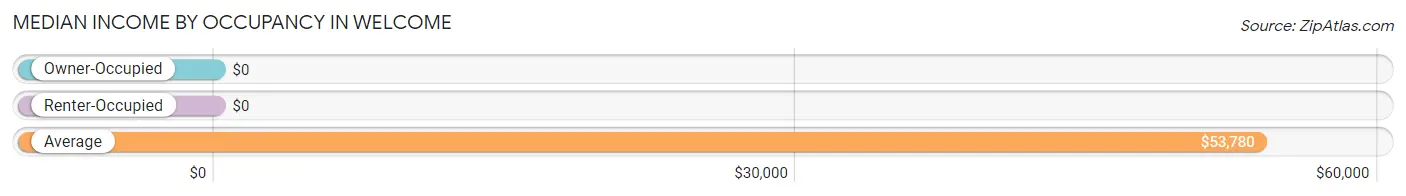
| Occupancy Type | # Households | Median Income |
| Owner-Occupied | 227 (64.7%) | $0 |
| Renter-Occupied | 124 (35.3%) | $0 |
| Average | 351 (100.0%) | $53,780 |
Occupancy by Householder Income Bracket in Welcome
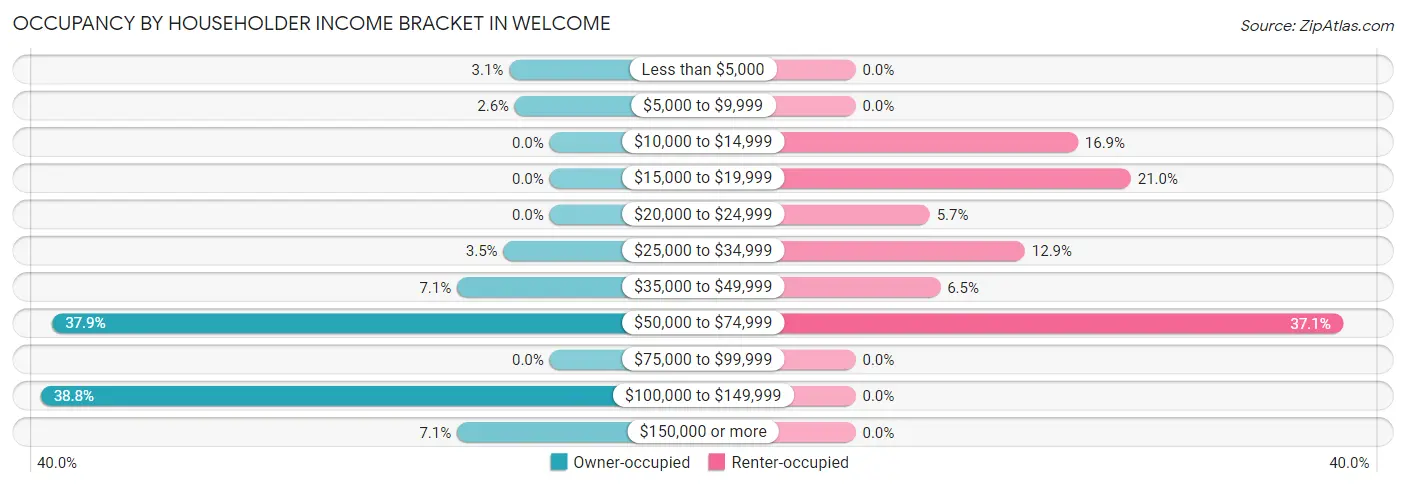
| Income Bracket | Owner-occupied | Renter-occupied |
| Less than $5,000 | 7 (3.1%) | 0 (0.0%) |
| $5,000 to $9,999 | 6 (2.6%) | 0 (0.0%) |
| $10,000 to $14,999 | 0 (0.0%) | 21 (16.9%) |
| $15,000 to $19,999 | 0 (0.0%) | 26 (21.0%) |
| $20,000 to $24,999 | 0 (0.0%) | 7 (5.7%) |
| $25,000 to $34,999 | 8 (3.5%) | 16 (12.9%) |
| $35,000 to $49,999 | 16 (7.0%) | 8 (6.5%) |
| $50,000 to $74,999 | 86 (37.9%) | 46 (37.1%) |
| $75,000 to $99,999 | 0 (0.0%) | 0 (0.0%) |
| $100,000 to $149,999 | 88 (38.8%) | 0 (0.0%) |
| $150,000 or more | 16 (7.0%) | 0 (0.0%) |
| Total | 227 (100.0%) | 124 (100.0%) |
Monthly Housing Cost Tiers in Welcome
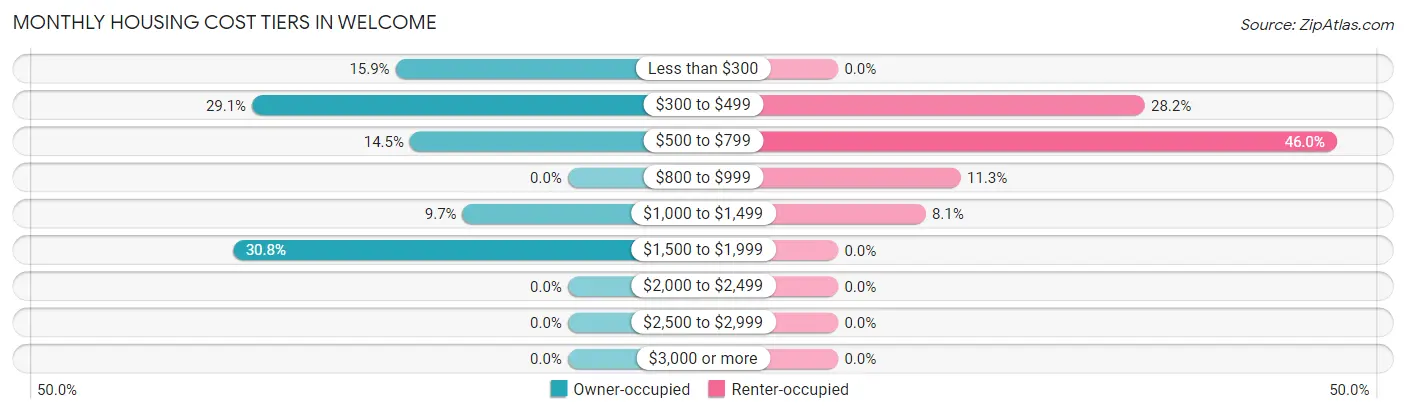
| Monthly Cost | Owner-occupied | Renter-occupied |
| Less than $300 | 36 (15.9%) | 0 (0.0%) |
| $300 to $499 | 66 (29.1%) | 35 (28.2%) |
| $500 to $799 | 33 (14.5%) | 57 (46.0%) |
| $800 to $999 | 0 (0.0%) | 14 (11.3%) |
| $1,000 to $1,499 | 22 (9.7%) | 10 (8.1%) |
| $1,500 to $1,999 | 70 (30.8%) | 0 (0.0%) |
| $2,000 to $2,499 | 0 (0.0%) | 0 (0.0%) |
| $2,500 to $2,999 | 0 (0.0%) | 0 (0.0%) |
| $3,000 or more | 0 (0.0%) | 0 (0.0%) |
| Total | 227 (100.0%) | 124 (100.0%) |
Physical Housing Characteristics in Welcome
Housing Structures in Welcome
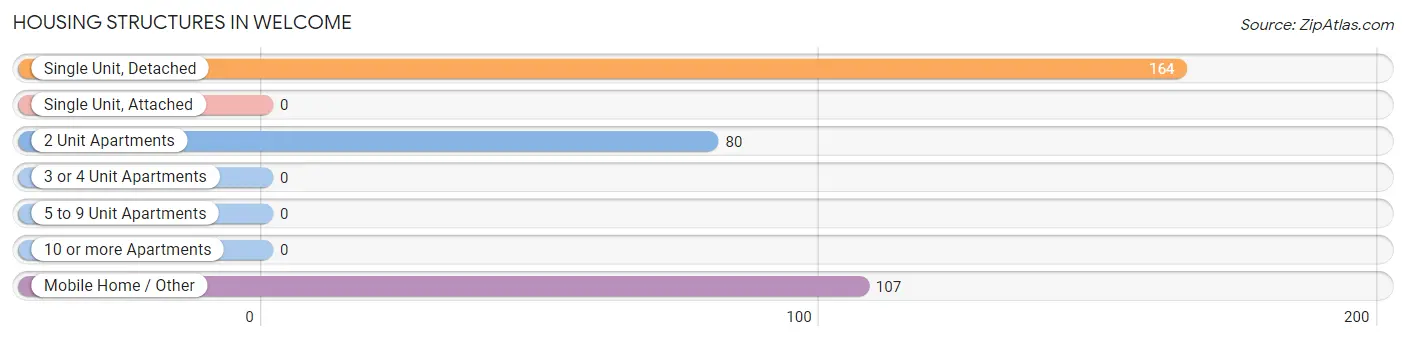
| Structure Type | # Housing Units | % Housing Units |
| Single Unit, Detached | 164 | 46.7% |
| Single Unit, Attached | 0 | 0.0% |
| 2 Unit Apartments | 80 | 22.8% |
| 3 or 4 Unit Apartments | 0 | 0.0% |
| 5 to 9 Unit Apartments | 0 | 0.0% |
| 10 or more Apartments | 0 | 0.0% |
| Mobile Home / Other | 107 | 30.5% |
| Total | 351 | 100.0% |
Housing Structures by Occupancy in Welcome
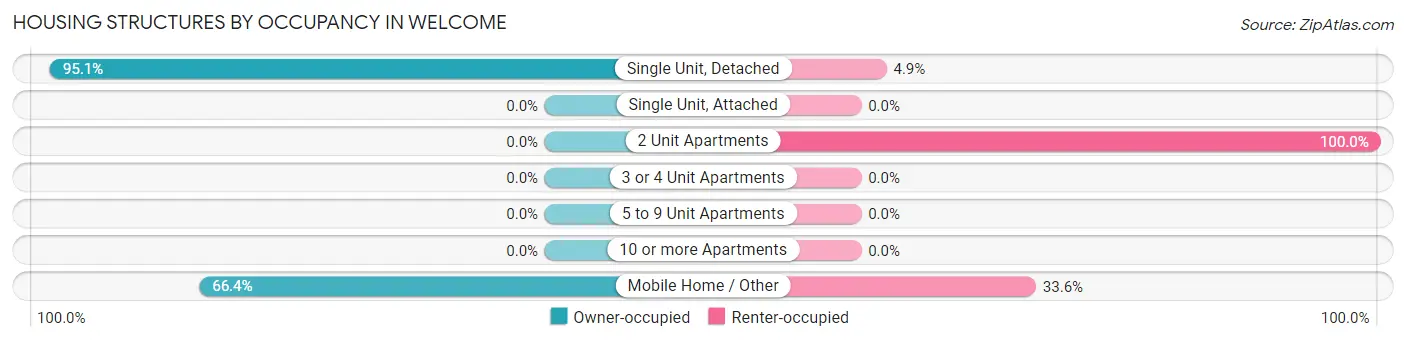
| Structure Type | Owner-occupied | Renter-occupied |
| Single Unit, Detached | 156 (95.1%) | 8 (4.9%) |
| Single Unit, Attached | 0 (0.0%) | 0 (0.0%) |
| 2 Unit Apartments | 0 (0.0%) | 80 (100.0%) |
| 3 or 4 Unit Apartments | 0 (0.0%) | 0 (0.0%) |
| 5 to 9 Unit Apartments | 0 (0.0%) | 0 (0.0%) |
| 10 or more Apartments | 0 (0.0%) | 0 (0.0%) |
| Mobile Home / Other | 71 (66.4%) | 36 (33.6%) |
| Total | 227 (64.7%) | 124 (35.3%) |
Housing Structures by Number of Rooms in Welcome
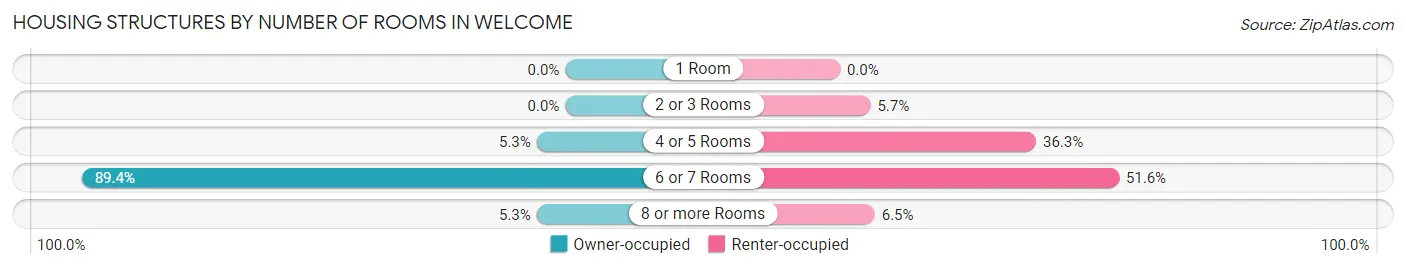
| Number of Rooms | Owner-occupied | Renter-occupied |
| 1 Room | 0 (0.0%) | 0 (0.0%) |
| 2 or 3 Rooms | 0 (0.0%) | 7 (5.7%) |
| 4 or 5 Rooms | 12 (5.3%) | 45 (36.3%) |
| 6 or 7 Rooms | 203 (89.4%) | 64 (51.6%) |
| 8 or more Rooms | 12 (5.3%) | 8 (6.5%) |
| Total | 227 (100.0%) | 124 (100.0%) |
Housing Structure by Heating Type in Welcome
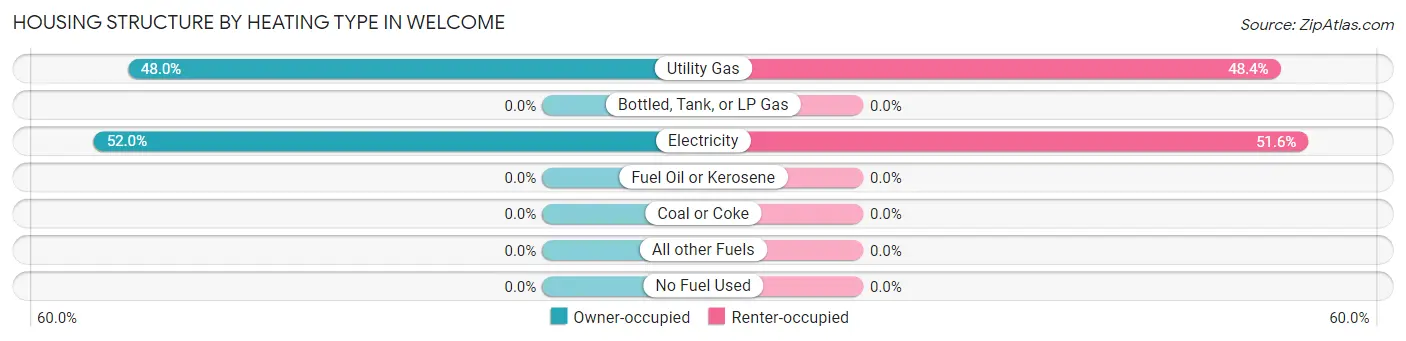
| Heating Type | Owner-occupied | Renter-occupied |
| Utility Gas | 109 (48.0%) | 60 (48.4%) |
| Bottled, Tank, or LP Gas | 0 (0.0%) | 0 (0.0%) |
| Electricity | 118 (52.0%) | 64 (51.6%) |
| Fuel Oil or Kerosene | 0 (0.0%) | 0 (0.0%) |
| Coal or Coke | 0 (0.0%) | 0 (0.0%) |
| All other Fuels | 0 (0.0%) | 0 (0.0%) |
| No Fuel Used | 0 (0.0%) | 0 (0.0%) |
| Total | 227 (100.0%) | 124 (100.0%) |
Household Vehicle Usage in Welcome
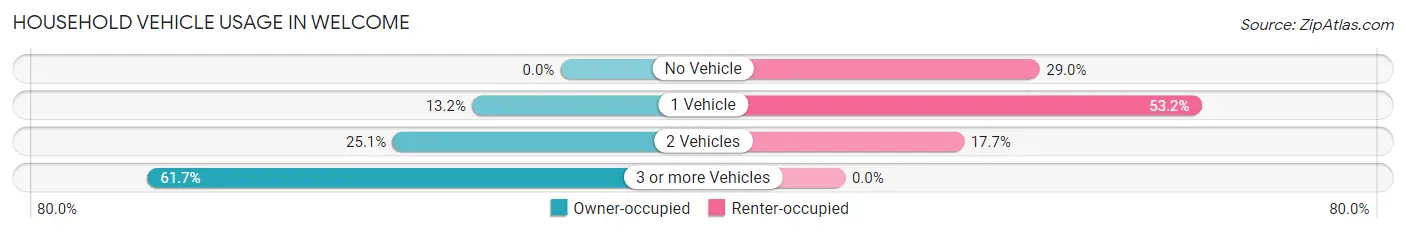
| Vehicles per Household | Owner-occupied | Renter-occupied |
| No Vehicle | 0 (0.0%) | 36 (29.0%) |
| 1 Vehicle | 30 (13.2%) | 66 (53.2%) |
| 2 Vehicles | 57 (25.1%) | 22 (17.7%) |
| 3 or more Vehicles | 140 (61.7%) | 0 (0.0%) |
| Total | 227 (100.0%) | 124 (100.0%) |
Real Estate & Mortgages in Welcome
Real Estate and Mortgage Overview in Welcome
| Characteristic | Without Mortgage | With Mortgage |
| Housing Units | 135 | 92 |
| Median Property Value | $98,100 | $165,100 |
| Median Household Income | $51,955 | $0 |
| Monthly Housing Costs | $407 | $0 |
| Real Estate Taxes | $780 | $0 |
Property Value by Mortgage Status in Welcome
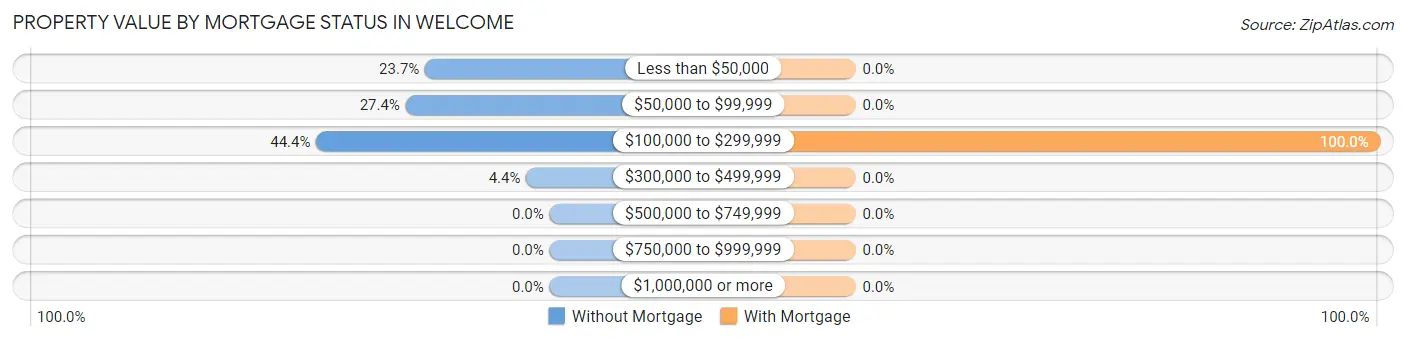
| Property Value | Without Mortgage | With Mortgage |
| Less than $50,000 | 32 (23.7%) | 0 (0.0%) |
| $50,000 to $99,999 | 37 (27.4%) | 0 (0.0%) |
| $100,000 to $299,999 | 60 (44.4%) | 92 (100.0%) |
| $300,000 to $499,999 | 6 (4.4%) | 0 (0.0%) |
| $500,000 to $749,999 | 0 (0.0%) | 0 (0.0%) |
| $750,000 to $999,999 | 0 (0.0%) | 0 (0.0%) |
| $1,000,000 or more | 0 (0.0%) | 0 (0.0%) |
| Total | 135 (100.0%) | 92 (100.0%) |
Household Income by Mortgage Status in Welcome
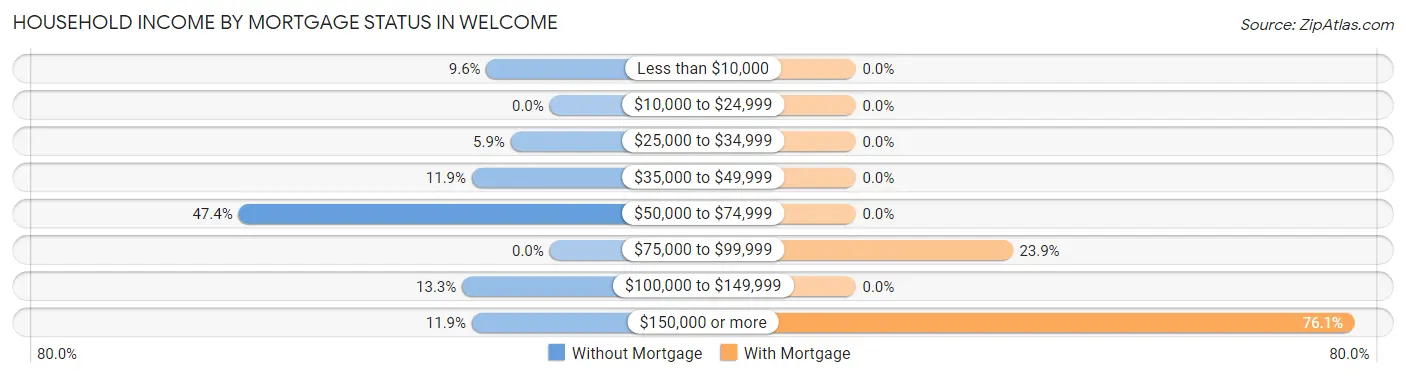
| Household Income | Without Mortgage | With Mortgage |
| Less than $10,000 | 13 (9.6%) | 0 (0.0%) |
| $10,000 to $24,999 | 0 (0.0%) | 0 (0.0%) |
| $25,000 to $34,999 | 8 (5.9%) | 0 (0.0%) |
| $35,000 to $49,999 | 16 (11.8%) | 0 (0.0%) |
| $50,000 to $74,999 | 64 (47.4%) | 0 (0.0%) |
| $75,000 to $99,999 | 0 (0.0%) | 22 (23.9%) |
| $100,000 to $149,999 | 18 (13.3%) | 0 (0.0%) |
| $150,000 or more | 16 (11.8%) | 70 (76.1%) |
| Total | 135 (100.0%) | 92 (100.0%) |
Property Value to Household Income Ratio in Welcome
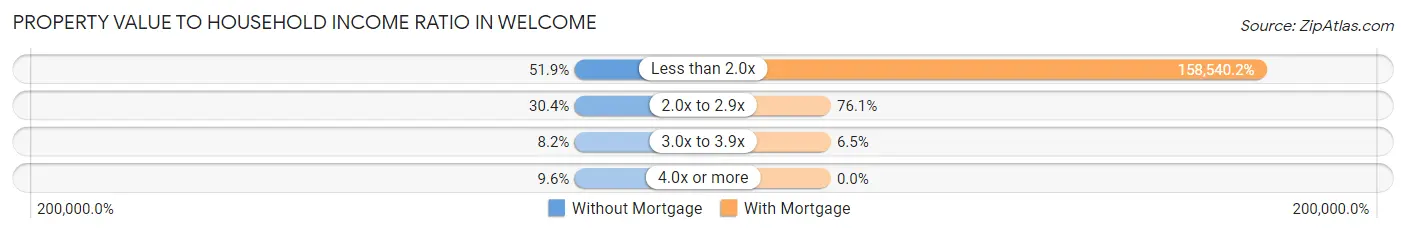
| Value-to-Income Ratio | Without Mortgage | With Mortgage |
| Less than 2.0x | 70 (51.8%) | 145,857 (158,540.2%) |
| 2.0x to 2.9x | 41 (30.4%) | 70 (76.1%) |
| 3.0x to 3.9x | 11 (8.2%) | 6 (6.5%) |
| 4.0x or more | 13 (9.6%) | 0 (0.0%) |
| Total | 135 (100.0%) | 92 (100.0%) |
Real Estate Taxes by Mortgage Status in Welcome
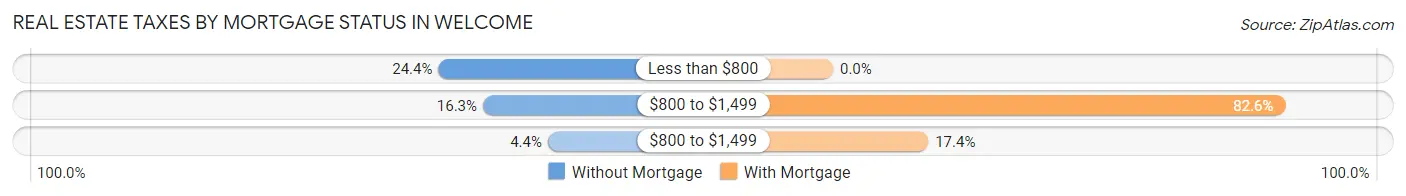
| Property Taxes | Without Mortgage | With Mortgage |
| Less than $800 | 33 (24.4%) | 0 (0.0%) |
| $800 to $1,499 | 22 (16.3%) | 76 (82.6%) |
| $800 to $1,499 | 6 (4.4%) | 16 (17.4%) |
| Total | 135 (100.0%) | 92 (100.0%) |
Health & Disability in Welcome
Health Insurance Coverage by Age in Welcome
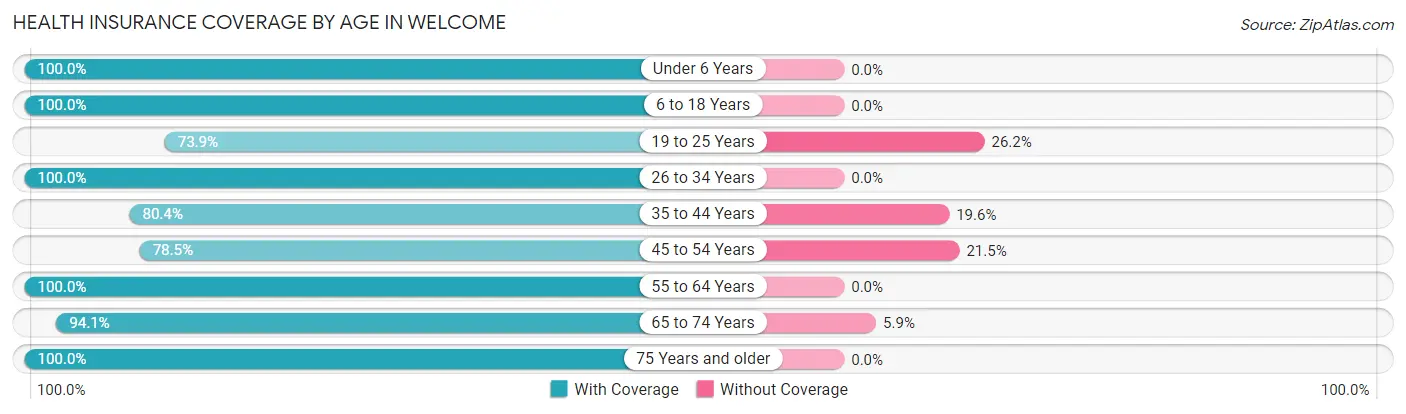
| Age Bracket | With Coverage | Without Coverage |
| Under 6 Years | 19 (100.0%) | 0 (0.0%) |
| 6 to 18 Years | 238 (100.0%) | 0 (0.0%) |
| 19 to 25 Years | 48 (73.9%) | 17 (26.2%) |
| 26 to 34 Years | 16 (100.0%) | 0 (0.0%) |
| 35 to 44 Years | 148 (80.4%) | 36 (19.6%) |
| 45 to 54 Years | 117 (78.5%) | 32 (21.5%) |
| 55 to 64 Years | 53 (100.0%) | 0 (0.0%) |
| 65 to 74 Years | 95 (94.1%) | 6 (5.9%) |
| 75 Years and older | 7 (100.0%) | 0 (0.0%) |
| Total | 741 (89.1%) | 91 (10.9%) |
Health Insurance Coverage by Citizenship Status in Welcome
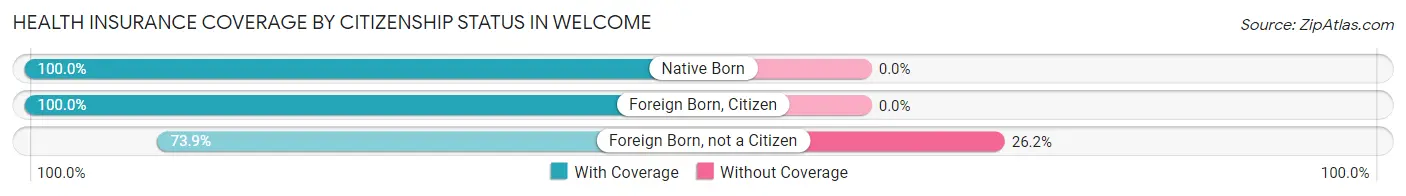
| Citizenship Status | With Coverage | Without Coverage |
| Native Born | 19 (100.0%) | 0 (0.0%) |
| Foreign Born, Citizen | 238 (100.0%) | 0 (0.0%) |
| Foreign Born, not a Citizen | 48 (73.9%) | 17 (26.2%) |
Health Insurance Coverage by Household Income in Welcome
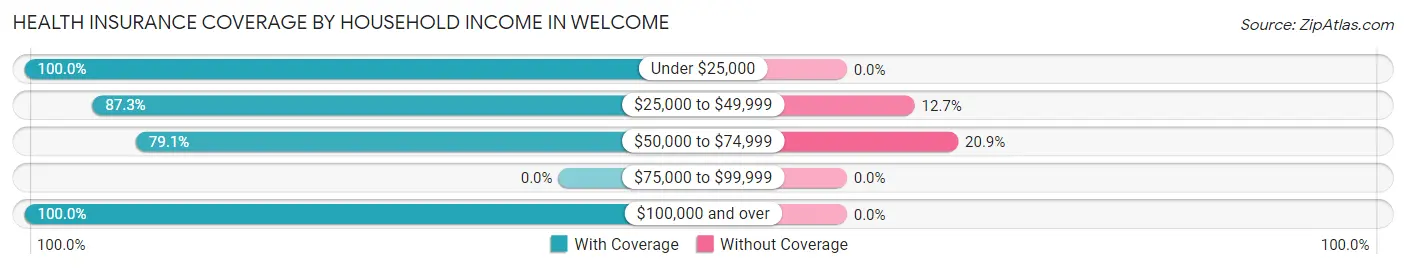
| Household Income | With Coverage | Without Coverage |
| Under $25,000 | 186 (100.0%) | 0 (0.0%) |
| $25,000 to $49,999 | 158 (87.3%) | 23 (12.7%) |
| $50,000 to $74,999 | 258 (79.1%) | 68 (20.9%) |
| $75,000 to $99,999 | 0 (0.0%) | 0 (0.0%) |
| $100,000 and over | 139 (100.0%) | 0 (0.0%) |
Public vs Private Health Insurance Coverage by Age in Welcome
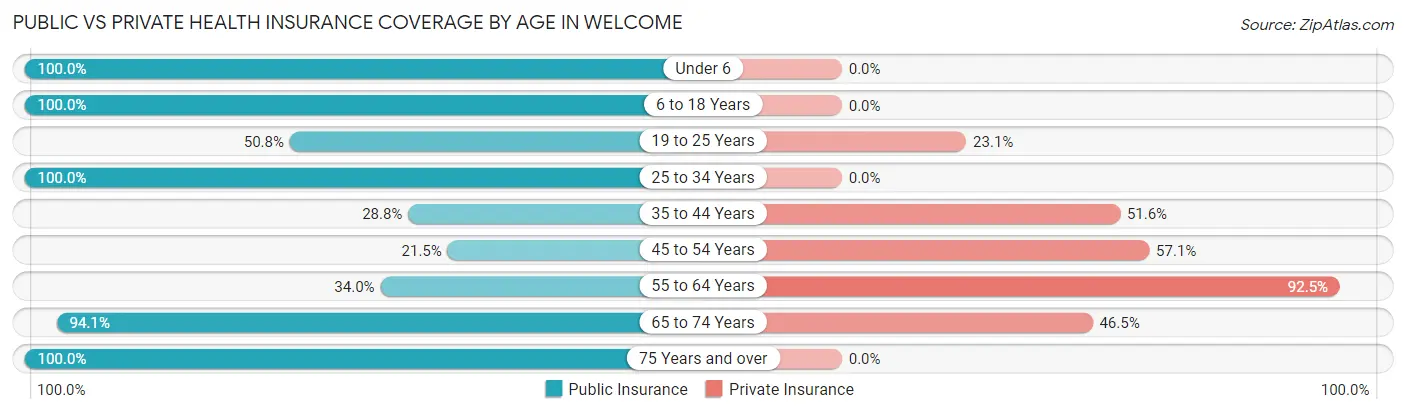
| Age Bracket | Public Insurance | Private Insurance |
| Under 6 | 19 (100.0%) | 0 (0.0%) |
| 6 to 18 Years | 238 (100.0%) | 0 (0.0%) |
| 19 to 25 Years | 33 (50.8%) | 15 (23.1%) |
| 25 to 34 Years | 16 (100.0%) | 0 (0.0%) |
| 35 to 44 Years | 53 (28.8%) | 95 (51.6%) |
| 45 to 54 Years | 32 (21.5%) | 85 (57.1%) |
| 55 to 64 Years | 18 (34.0%) | 49 (92.4%) |
| 65 to 74 Years | 95 (94.1%) | 47 (46.5%) |
| 75 Years and over | 7 (100.0%) | 0 (0.0%) |
| Total | 511 (61.4%) | 291 (35.0%) |
Disability Status by Sex by Age in Welcome
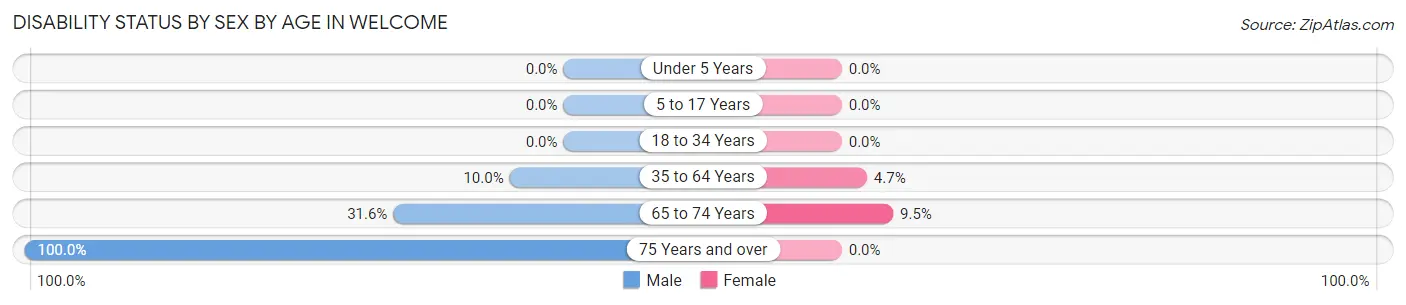
| Age Bracket | Male | Female |
| Under 5 Years | 0 (0.0%) | 0 (0.0%) |
| 5 to 17 Years | 0 (0.0%) | 0 (0.0%) |
| 18 to 34 Years | 0 (0.0%) | 0 (0.0%) |
| 35 to 64 Years | 15 (10.0%) | 11 (4.7%) |
| 65 to 74 Years | 12 (31.6%) | 6 (9.5%) |
| 75 Years and over | 7 (100.0%) | 0 (0.0%) |
Disability Class by Sex by Age in Welcome
Disability Class: Hearing Difficulty
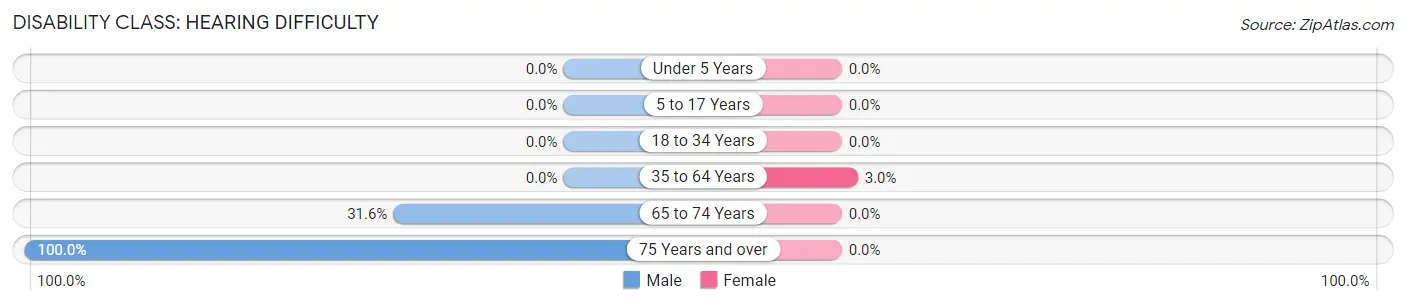
| Age Bracket | Male | Female |
| Under 5 Years | 0 (0.0%) | 0 (0.0%) |
| 5 to 17 Years | 0 (0.0%) | 0 (0.0%) |
| 18 to 34 Years | 0 (0.0%) | 0 (0.0%) |
| 35 to 64 Years | 0 (0.0%) | 7 (3.0%) |
| 65 to 74 Years | 12 (31.6%) | 0 (0.0%) |
| 75 Years and over | 7 (100.0%) | 0 (0.0%) |
Disability Class: Vision Difficulty
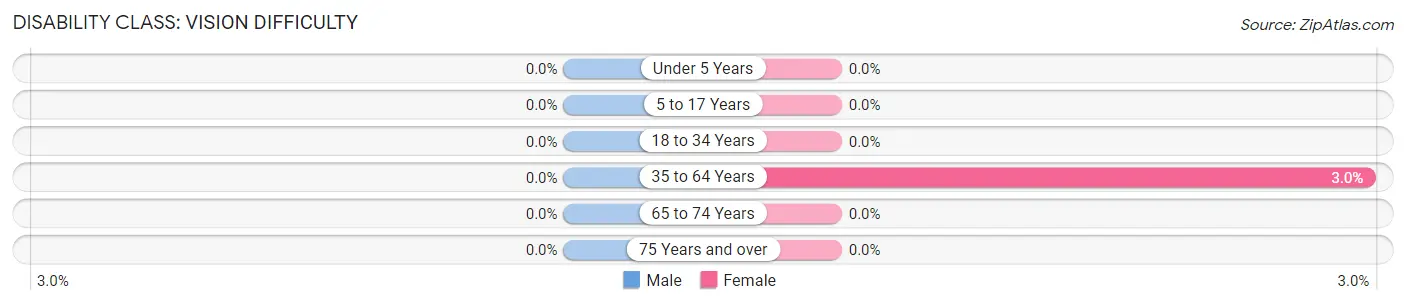
| Age Bracket | Male | Female |
| Under 5 Years | 0 (0.0%) | 0 (0.0%) |
| 5 to 17 Years | 0 (0.0%) | 0 (0.0%) |
| 18 to 34 Years | 0 (0.0%) | 0 (0.0%) |
| 35 to 64 Years | 0 (0.0%) | 7 (3.0%) |
| 65 to 74 Years | 0 (0.0%) | 0 (0.0%) |
| 75 Years and over | 0 (0.0%) | 0 (0.0%) |
Disability Class: Cognitive Difficulty
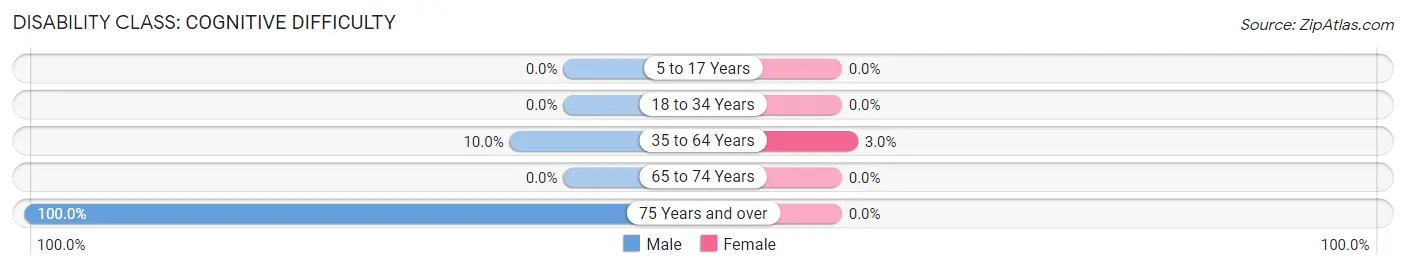
| Age Bracket | Male | Female |
| 5 to 17 Years | 0 (0.0%) | 0 (0.0%) |
| 18 to 34 Years | 0 (0.0%) | 0 (0.0%) |
| 35 to 64 Years | 15 (10.0%) | 7 (3.0%) |
| 65 to 74 Years | 0 (0.0%) | 0 (0.0%) |
| 75 Years and over | 7 (100.0%) | 0 (0.0%) |
Disability Class: Ambulatory Difficulty
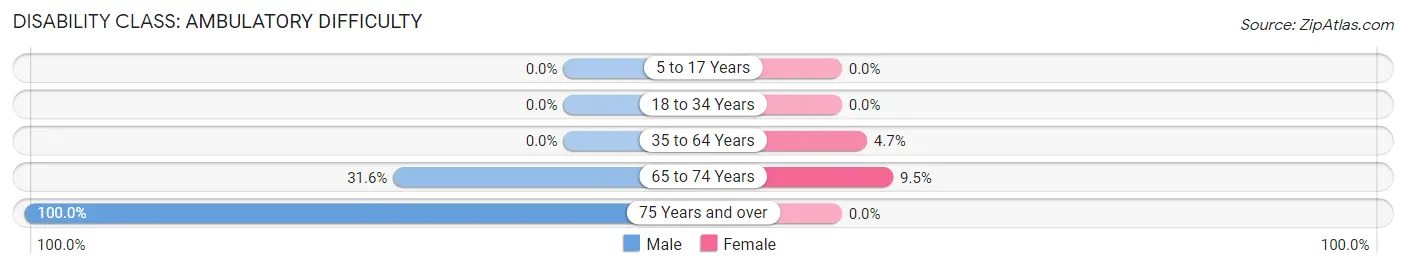
| Age Bracket | Male | Female |
| 5 to 17 Years | 0 (0.0%) | 0 (0.0%) |
| 18 to 34 Years | 0 (0.0%) | 0 (0.0%) |
| 35 to 64 Years | 0 (0.0%) | 11 (4.7%) |
| 65 to 74 Years | 12 (31.6%) | 6 (9.5%) |
| 75 Years and over | 7 (100.0%) | 0 (0.0%) |
Disability Class: Self-Care Difficulty
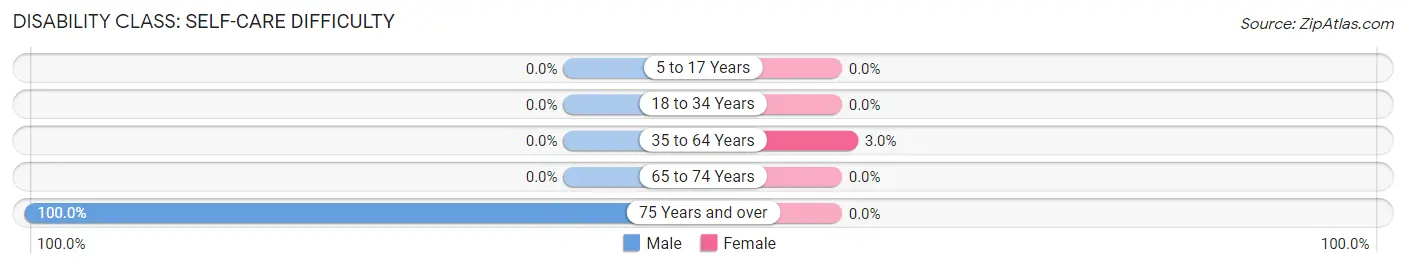
| Age Bracket | Male | Female |
| 5 to 17 Years | 0 (0.0%) | 0 (0.0%) |
| 18 to 34 Years | 0 (0.0%) | 0 (0.0%) |
| 35 to 64 Years | 0 (0.0%) | 7 (3.0%) |
| 65 to 74 Years | 0 (0.0%) | 0 (0.0%) |
| 75 Years and over | 7 (100.0%) | 0 (0.0%) |
Technology Access in Welcome
Computing Device Access in Welcome
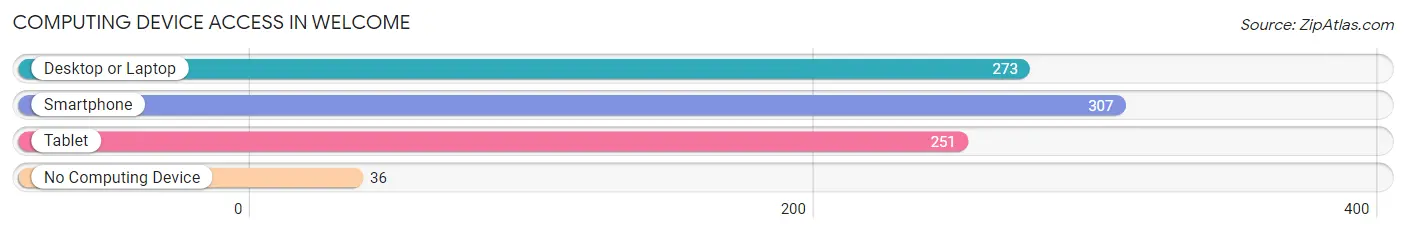
| Device Type | # Households | % Households |
| Desktop or Laptop | 273 | 77.8% |
| Smartphone | 307 | 87.5% |
| Tablet | 251 | 71.5% |
| No Computing Device | 36 | 10.3% |
| Total | 351 | 100.0% |
Internet Access in Welcome
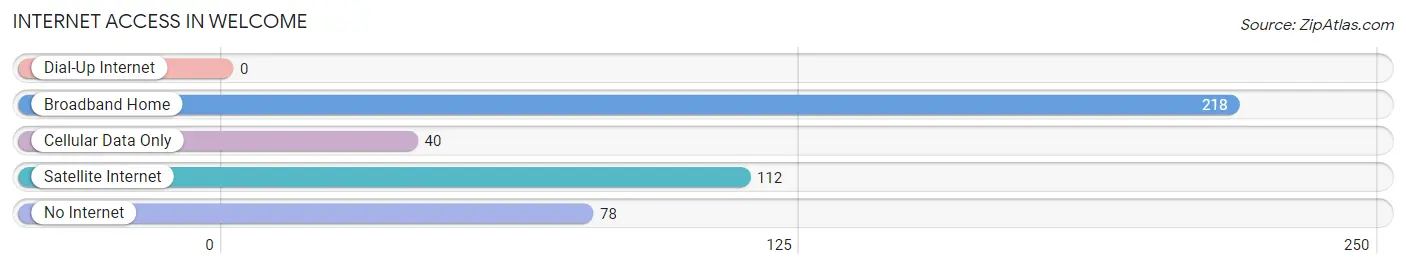
| Internet Type | # Households | % Households |
| Dial-Up Internet | 0 | 0.0% |
| Broadband Home | 218 | 62.1% |
| Cellular Data Only | 40 | 11.4% |
| Satellite Internet | 112 | 31.9% |
| No Internet | 78 | 22.2% |
| Total | 351 | 100.0% |
Welcome Summary
Los Angeles, California, is the second-largest city in the United States and the largest city in the state of California. It is located in the southern part of the state, on the Pacific coast, and is the center of the Greater Los Angeles Area, the second-largest metropolitan area in the United States. Los Angeles is a major global city, with a diverse population, a strong economy, and a vibrant culture.
Geography
Los Angeles is located in the southwestern part of the state of California, on the Pacific coast. It is bordered by the San Gabriel Mountains to the north, the Santa Monica Mountains to the south, and the Pacific Ocean to the west. The city covers an area of 502 square miles, and is divided into four distinct regions: the San Fernando Valley, the Conejo Valley, the San Gabriel Valley, and the South Bay.
The city is home to a number of rivers, including the Los Angeles River, the San Gabriel River, and the Santa Ana River. The Los Angeles River is the largest river in the city, and is the main source of water for the city.
Climate
Los Angeles has a Mediterranean climate, with warm, dry summers and mild, wet winters. The average temperature in the city is around 70°F, with temperatures rarely dropping below 50°F or rising above 90°F. The city receives an average of 15 inches of rain per year, with most of the rain falling between November and March.
Demographics
As of 2019, the population of Los Angeles was estimated to be 4,000,000. The city is home to a diverse population, with people from all over the world. The largest ethnic groups in the city are Hispanic or Latino (47.7%), White (29.2%), Asian (11.2%), and African American (9.2%).
Economy
Los Angeles is a major economic center, with a strong and diverse economy. The city is home to a number of major industries, including entertainment, technology, finance, manufacturing, and tourism. The city is also home to a number of major corporations, including The Walt Disney Company, Warner Bros., and Universal Pictures.
The city is also home to a number of major universities, including the University of California, Los Angeles, the University of Southern California, and California State University, Los Angeles.
Los Angeles is a major tourist destination, with millions of visitors each year. The city is home to a number of popular attractions, including the Hollywood Walk of Fame, the Griffith Observatory, and the Santa Monica Pier.
Conclusion
Los Angeles is a major global city, with a diverse population, a strong economy, and a vibrant culture. The city is home to a number of major industries, universities, and attractions, and is a major tourist destination. Los Angeles is a city of opportunity, with a bright future ahead.
Common Questions
What is Per Capita Income in Welcome?
Per Capita income in Welcome is $31,062.
What is the Median Family Income in Welcome?
Median Family Income in Welcome is $48,026.
What is the Median Household income in Welcome?
Median Household Income in Welcome is $53,780.
What is Income or Wage Gap in Welcome?
Income or Wage Gap in Welcome is 81.0%.
Women in Welcome earn 19.0 cents for every dollar earned by a man.
What is Inequality or Gini Index in Welcome?
Inequality or Gini Index in Welcome is 0.38.
What is the Total Population of Welcome?
Total Population of Welcome is 832.
What is the Total Male Population of Welcome?
Total Male Population of Welcome is 356.
What is the Total Female Population of Welcome?
Total Female Population of Welcome is 476.
What is the Ratio of Males per 100 Females in Welcome?
There are 74.79 Males per 100 Females in Welcome.
What is the Ratio of Females per 100 Males in Welcome?
There are 133.71 Females per 100 Males in Welcome.
What is the Median Population Age in Welcome?
Median Population Age in Welcome is 39.6 Years.
What is the Average Family Size in Welcome
Average Family Size in Welcome is 3.3 People.
What is the Average Household Size in Welcome
Average Household Size in Welcome is 2.4 People.
How Large is the Labor Force in Welcome?
There are 394 People in the Labor Forcein in Welcome.
What is the Percentage of People in the Labor Force in Welcome?
61.8% of People are in the Labor Force in Welcome.