Lucky, LA Map & Demographics
Lucky Map
Lucky Overview
$22,586
PER CAPITA INCOME
$41,250
AVG FAMILY INCOME
$22,500
AVG HOUSEHOLD INCOME
55.4%
WAGE / INCOME GAP [ % ]
44.6¢/ $1
WAGE / INCOME GAP [ $ ]
0.49
INEQUALITY / GINI INDEX
155
TOTAL POPULATION
71
MALE POPULATION
84
FEMALE POPULATION
84.52
MALES / 100 FEMALES
118.31
FEMALES / 100 MALES
42.6
MEDIAN AGE
2.9
AVG FAMILY SIZE
1.9
AVG HOUSEHOLD SIZE
65
LABOR FORCE [ PEOPLE ]
46.4%
PERCENT IN LABOR FORCE
3.1%
UNEMPLOYMENT RATE
Income in Lucky
Income Overview in Lucky
Per Capita Income in Lucky is $22,586, while median incomes of families and households are $41,250 and $22,500 respectively.
| Characteristic | Number | Measure |
| Per Capita Income | 155 | $22,586 |
| Median Family Income | 35 | $41,250 |
| Mean Family Income | 35 | $64,143 |
| Median Household Income | 84 | $22,500 |
| Mean Household Income | 84 | $40,176 |
| Income Deficit | 35 | $0 |
| Wage / Income Gap (%) | 155 | 55.36% |
| Wage / Income Gap ($) | 155 | 44.64¢ per $1 |
| Gini / Inequality Index | 155 | 0.49 |
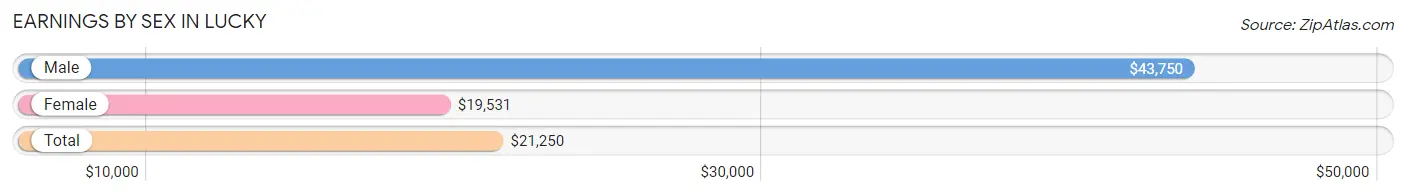
Earnings by Sex in Lucky
Average Earnings in Lucky are $21,250, $43,750 for men and $19,531 for women, a difference of 55.4%.
| Sex | Number | Average Earnings |
| Male | 37 (56.1%) | $43,750 |
| Female | 29 (43.9%) | $19,531 |
| Total | 66 (100.0%) | $21,250 |
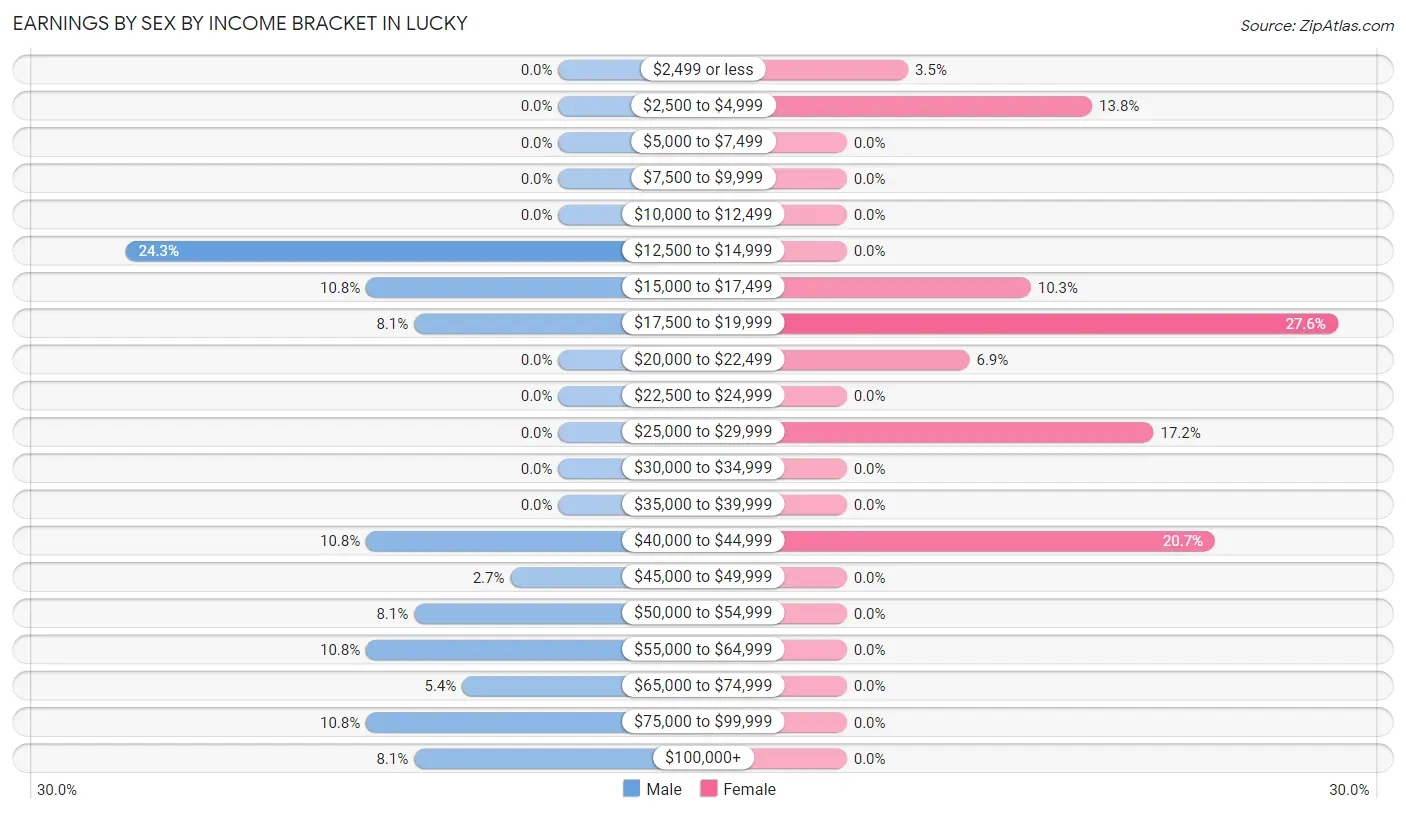
Earnings by Sex by Income Bracket in Lucky
The most common earnings brackets in Lucky are $12,500 to $14,999 for men (9 | 24.3%) and $17,500 to $19,999 for women (8 | 27.6%).
| Income | Male | Female |
| $2,499 or less | 0 (0.0%) | 1 (3.5%) |
| $2,500 to $4,999 | 0 (0.0%) | 4 (13.8%) |
| $5,000 to $7,499 | 0 (0.0%) | 0 (0.0%) |
| $7,500 to $9,999 | 0 (0.0%) | 0 (0.0%) |
| $10,000 to $12,499 | 0 (0.0%) | 0 (0.0%) |
| $12,500 to $14,999 | 9 (24.3%) | 0 (0.0%) |
| $15,000 to $17,499 | 4 (10.8%) | 3 (10.3%) |
| $17,500 to $19,999 | 3 (8.1%) | 8 (27.6%) |
| $20,000 to $22,499 | 0 (0.0%) | 2 (6.9%) |
| $22,500 to $24,999 | 0 (0.0%) | 0 (0.0%) |
| $25,000 to $29,999 | 0 (0.0%) | 5 (17.2%) |
| $30,000 to $34,999 | 0 (0.0%) | 0 (0.0%) |
| $35,000 to $39,999 | 0 (0.0%) | 0 (0.0%) |
| $40,000 to $44,999 | 4 (10.8%) | 6 (20.7%) |
| $45,000 to $49,999 | 1 (2.7%) | 0 (0.0%) |
| $50,000 to $54,999 | 3 (8.1%) | 0 (0.0%) |
| $55,000 to $64,999 | 4 (10.8%) | 0 (0.0%) |
| $65,000 to $74,999 | 2 (5.4%) | 0 (0.0%) |
| $75,000 to $99,999 | 4 (10.8%) | 0 (0.0%) |
| $100,000+ | 3 (8.1%) | 0 (0.0%) |
| Total | 37 (100.0%) | 29 (100.0%) |
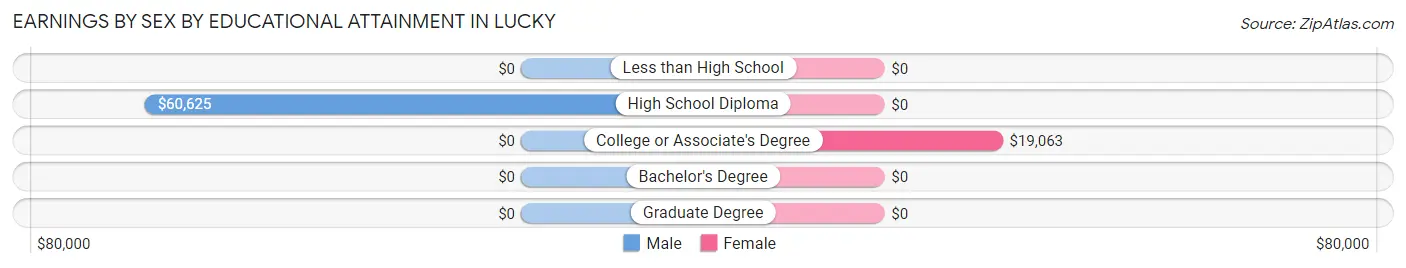
Earnings by Sex by Educational Attainment in Lucky
Average earnings in Lucky are $45,000 for men and $19,375 for women, a difference of 56.9%. Men with an educational attainment of high school diploma enjoy the highest average annual earnings of $60,625, while those with high school diploma education earn the least with $60,625. Women with an educational attainment of college or associate's degree earn the most with the average annual earnings of $19,063, while those with college or associate's degree education have the smallest earnings of $19,063.
| Educational Attainment | Male Income | Female Income |
| Less than High School | - | - |
| High School Diploma | $60,625 | $0 |
| College or Associate's Degree | - | - |
| Bachelor's Degree | - | - |
| Graduate Degree | - | - |
| Total | $45,000 | $19,375 |
Family Income in Lucky
Family Income Brackets in Lucky
According to the Lucky family income data, there are 8 families falling into the $35,000 to $49,999 income range, which is the most common income bracket and makes up 22.9% of all families.
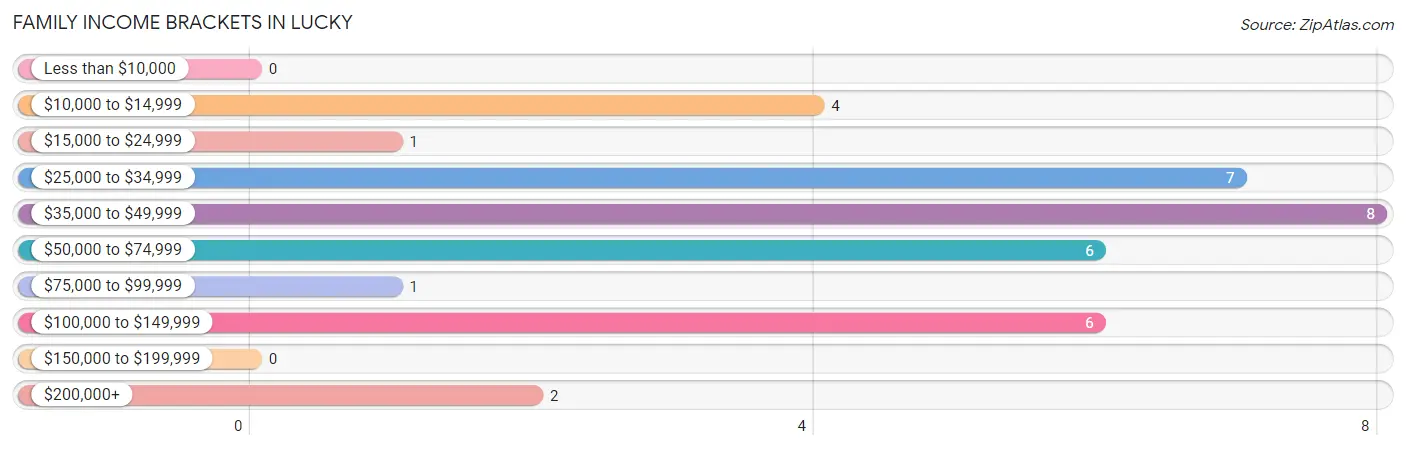
| Income Bracket | # Families | % Families |
| Less than $10,000 | 0 | 0.0% |
| $10,000 to $14,999 | 4 | 11.4% |
| $15,000 to $24,999 | 1 | 2.9% |
| $25,000 to $34,999 | 7 | 20.0% |
| $35,000 to $49,999 | 8 | 22.9% |
| $50,000 to $74,999 | 6 | 17.1% |
| $75,000 to $99,999 | 1 | 2.9% |
| $100,000 to $149,999 | 6 | 17.1% |
| $150,000 to $199,999 | 0 | 0.0% |
| $200,000+ | 2 | 5.7% |
Family Income by Famaliy Size in Lucky
3-person families (13 | 37.1%) account for the highest median family income in Lucky with $66,250 per family, while 3-person families (13 | 37.1%) have the highest median income of $22,083 per family member.
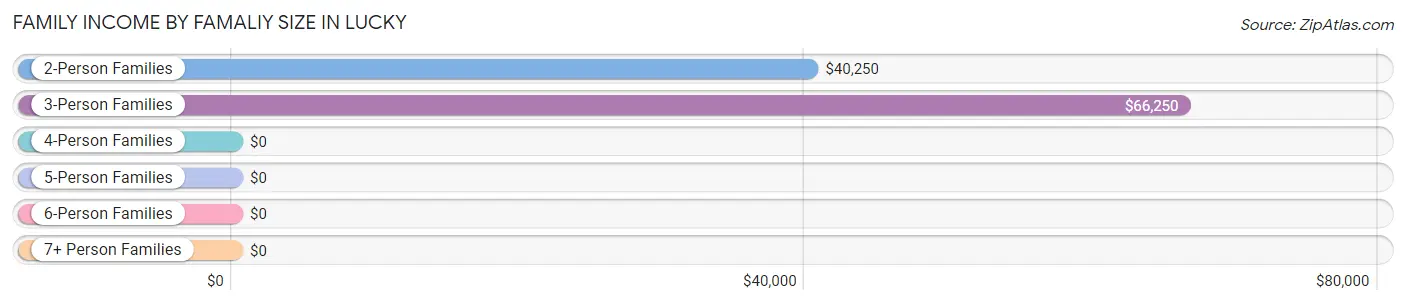
| Income Bracket | # Families | Median Income |
| 2-Person Families | 17 (48.6%) | $40,250 |
| 3-Person Families | 13 (37.1%) | $66,250 |
| 4-Person Families | 3 (8.6%) | $0 |
| 5-Person Families | 2 (5.7%) | $0 |
| 6-Person Families | 0 (0.0%) | $0 |
| 7+ Person Families | 0 (0.0%) | $0 |
| Total | 35 (100.0%) | $41,250 |
Family Income by Number of Earners in Lucky
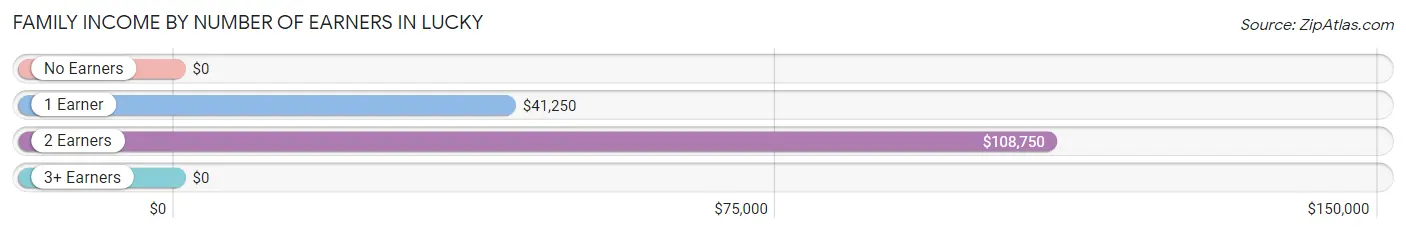
| Number of Earners | # Families | Median Income |
| No Earners | 6 (17.1%) | $0 |
| 1 Earner | 19 (54.3%) | $41,250 |
| 2 Earners | 10 (28.6%) | $108,750 |
| 3+ Earners | 0 (0.0%) | $0 |
| Total | 35 (100.0%) | $41,250 |
Household Income in Lucky
Household Income Brackets in Lucky
With 23 households falling in the category, the $10,000 to $14,999 income range is the most frequent in Lucky, accounting for 27.4% of all households.
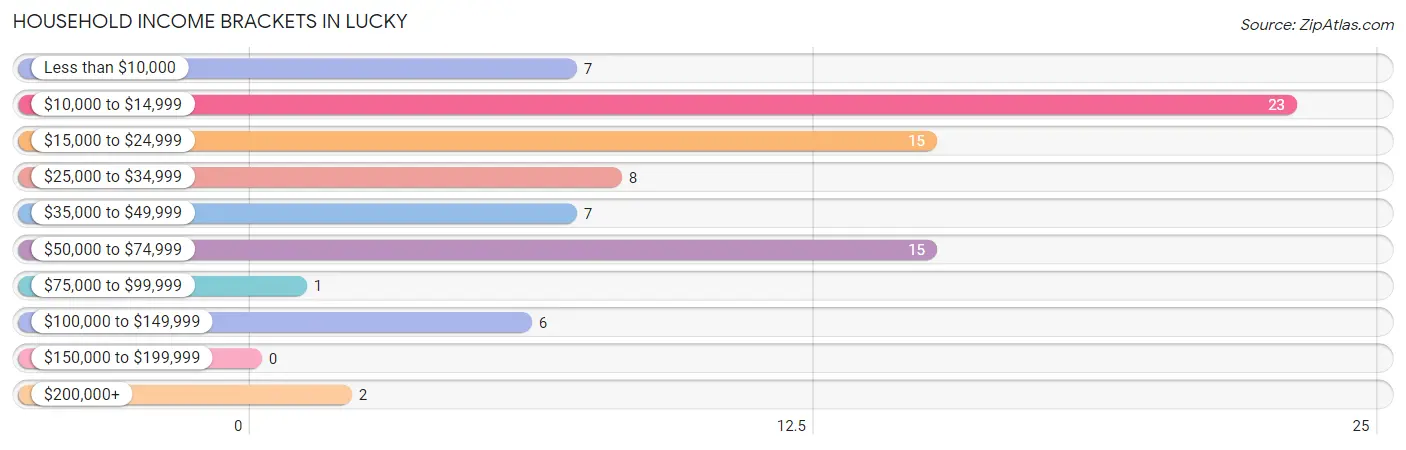
| Income Bracket | # Households | % Households |
| Less than $10,000 | 7 | 8.3% |
| $10,000 to $14,999 | 23 | 27.4% |
| $15,000 to $24,999 | 15 | 17.9% |
| $25,000 to $34,999 | 8 | 9.5% |
| $35,000 to $49,999 | 7 | 8.3% |
| $50,000 to $74,999 | 15 | 17.9% |
| $75,000 to $99,999 | 1 | 1.2% |
| $100,000 to $149,999 | 6 | 7.1% |
| $150,000 to $199,999 | 0 | 0.0% |
| $200,000+ | 2 | 2.4% |
Household Income by Householder Age in Lucky
The median household income in Lucky is $22,500, with the highest median household income of $21,000 found in the 65+ years age bracket for the primary householder. A total of 26 households (30.9%) fall into this category.
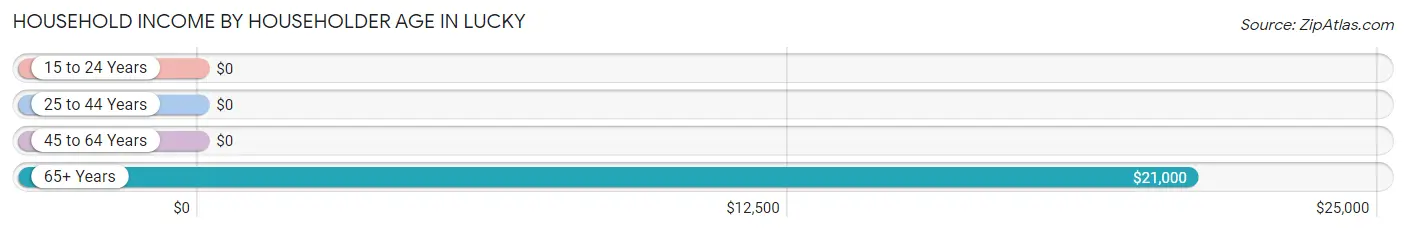
| Income Bracket | # Households | Median Income |
| 15 to 24 Years | 0 (0.0%) | $0 |
| 25 to 44 Years | 28 (33.3%) | $0 |
| 45 to 64 Years | 30 (35.7%) | $0 |
| 65+ Years | 26 (30.9%) | $21,000 |
| Total | 84 (100.0%) | $22,500 |
Poverty in Lucky
Income Below Poverty by Sex and Age in Lucky
With 18.3% poverty level for males and 34.5% for females among the residents of Lucky, 35 to 44 year old males and 25 to 34 year old females are the most vulnerable to poverty, with 7 males (46.7%) and 6 females (85.7%) in their respective age groups living below the poverty level.
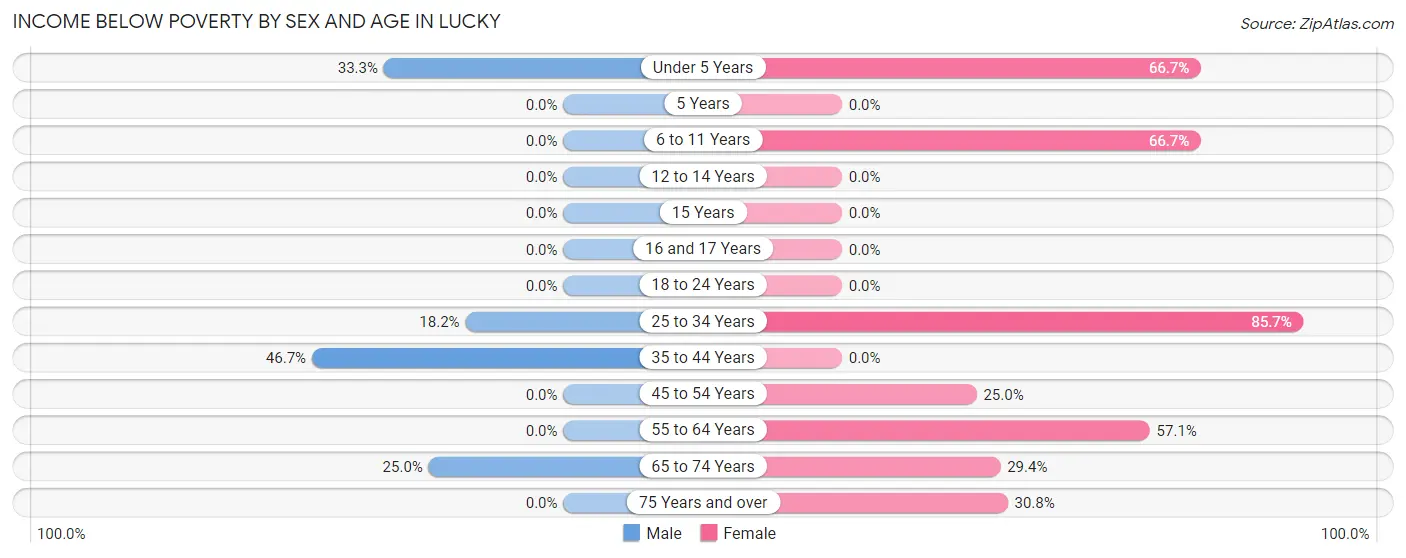
| Age Bracket | Male | Female |
| Under 5 Years | 2 (33.3%) | 2 (66.7%) |
| 5 Years | 0 (0.0%) | 0 (0.0%) |
| 6 to 11 Years | 0 (0.0%) | 2 (66.7%) |
| 12 to 14 Years | 0 (0.0%) | 0 (0.0%) |
| 15 Years | 0 (0.0%) | 0 (0.0%) |
| 16 and 17 Years | 0 (0.0%) | 0 (0.0%) |
| 18 to 24 Years | 0 (0.0%) | 0 (0.0%) |
| 25 to 34 Years | 2 (18.2%) | 6 (85.7%) |
| 35 to 44 Years | 7 (46.7%) | 0 (0.0%) |
| 45 to 54 Years | 0 (0.0%) | 2 (25.0%) |
| 55 to 64 Years | 0 (0.0%) | 8 (57.1%) |
| 65 to 74 Years | 2 (25.0%) | 5 (29.4%) |
| 75 Years and over | 0 (0.0%) | 4 (30.8%) |
| Total | 13 (18.3%) | 29 (34.5%) |
Income Above Poverty by Sex and Age in Lucky
According to the poverty statistics in Lucky, males aged 6 to 11 years and females aged 5 years are the age groups that are most secure financially, with 100.0% of males and 100.0% of females in these age groups living above the poverty line.
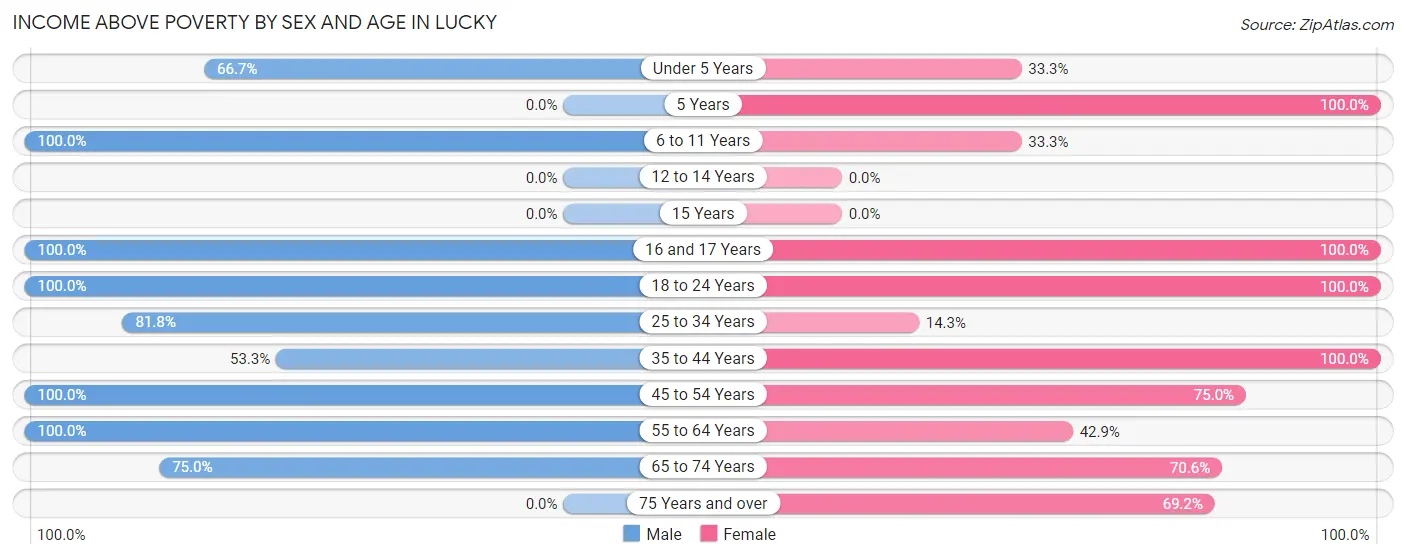
| Age Bracket | Male | Female |
| Under 5 Years | 4 (66.7%) | 1 (33.3%) |
| 5 Years | 0 (0.0%) | 1 (100.0%) |
| 6 to 11 Years | 2 (100.0%) | 1 (33.3%) |
| 12 to 14 Years | 0 (0.0%) | 0 (0.0%) |
| 15 Years | 0 (0.0%) | 0 (0.0%) |
| 16 and 17 Years | 10 (100.0%) | 1 (100.0%) |
| 18 to 24 Years | 5 (100.0%) | 2 (100.0%) |
| 25 to 34 Years | 9 (81.8%) | 1 (14.3%) |
| 35 to 44 Years | 8 (53.3%) | 15 (100.0%) |
| 45 to 54 Years | 5 (100.0%) | 6 (75.0%) |
| 55 to 64 Years | 9 (100.0%) | 6 (42.9%) |
| 65 to 74 Years | 6 (75.0%) | 12 (70.6%) |
| 75 Years and over | 0 (0.0%) | 9 (69.2%) |
| Total | 58 (81.7%) | 55 (65.5%) |
Income Below Poverty Among Married-Couple Families in Lucky
The poverty statistics for married-couple families in Lucky show that 12.5% or 2 of the total 16 families live below the poverty line. Families with 3 or 4 children have the highest poverty rate of 100.0%, comprising of 2 families. On the other hand, families with no children have the lowest poverty rate of 0.0%, which includes 0 families.
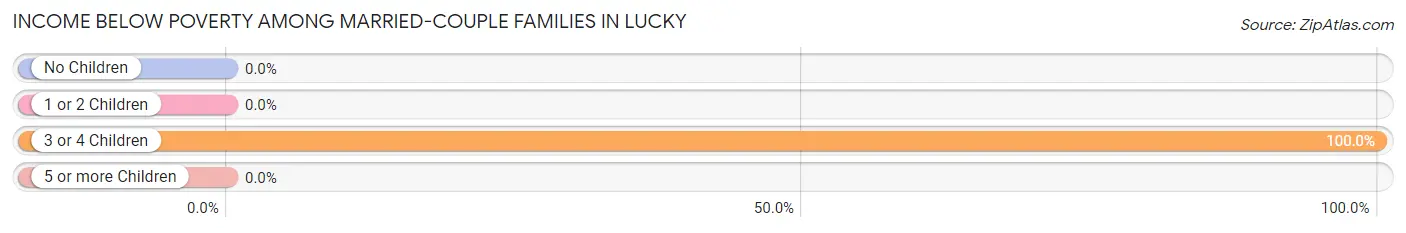
| Children | Above Poverty | Below Poverty |
| No Children | 7 (100.0%) | 0 (0.0%) |
| 1 or 2 Children | 7 (100.0%) | 0 (0.0%) |
| 3 or 4 Children | 0 (0.0%) | 2 (100.0%) |
| 5 or more Children | 0 (0.0%) | 0 (0.0%) |
| Total | 14 (87.5%) | 2 (12.5%) |
Income Below Poverty Among Single-Parent Households in Lucky
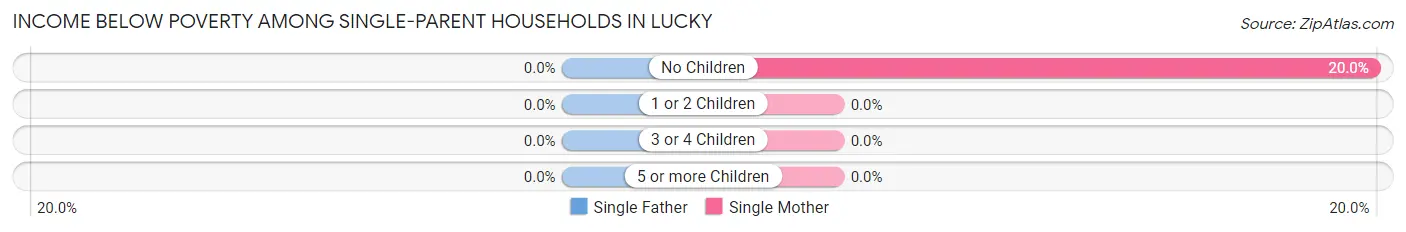
| Children | Single Father | Single Mother |
| No Children | 0 (0.0%) | 2 (20.0%) |
| 1 or 2 Children | 0 (0.0%) | 0 (0.0%) |
| 3 or 4 Children | 0 (0.0%) | 0 (0.0%) |
| 5 or more Children | 0 (0.0%) | 0 (0.0%) |
| Total | 0 (0.0%) | 2 (11.8%) |
Income Below Poverty Among Married-Couple vs Single-Parent Households in Lucky
The poverty data for Lucky shows that 2 of the married-couple family households (12.5%) and 2 of the single-parent households (10.5%) are living below the poverty level. Within the married-couple family households, those with 3 or 4 children have the highest poverty rate, with 2 households (100.0%) falling below the poverty line. Among the single-parent households, those with no children have the highest poverty rate, with 2 household (20.0%) living below poverty.
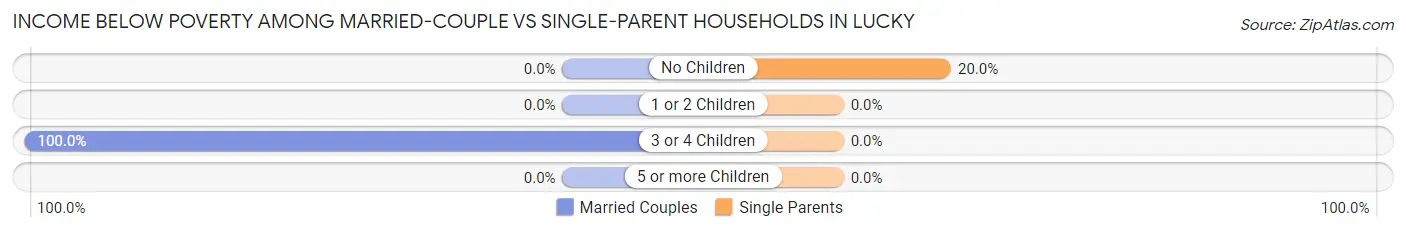
| Children | Married-Couple Families | Single-Parent Households |
| No Children | 0 (0.0%) | 2 (20.0%) |
| 1 or 2 Children | 0 (0.0%) | 0 (0.0%) |
| 3 or 4 Children | 2 (100.0%) | 0 (0.0%) |
| 5 or more Children | 0 (0.0%) | 0 (0.0%) |
| Total | 2 (12.5%) | 2 (10.5%) |
Race in Lucky
The most populous races in Lucky are Black / African American (81 | 52.3%), White / Caucasian (71 | 45.8%), and Asian (2 | 1.3%).
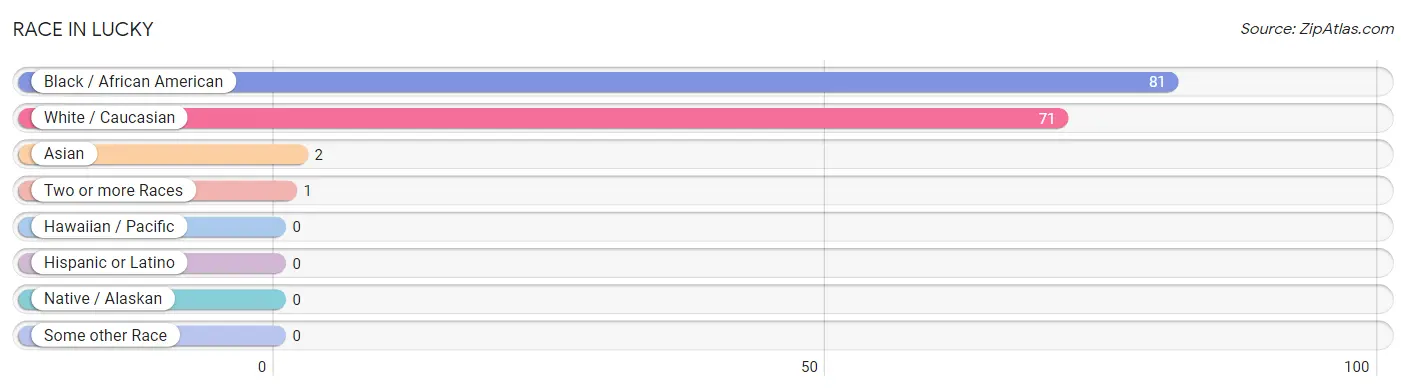
| Race | # Population | % Population |
| Asian | 2 | 1.3% |
| Black / African American | 81 | 52.3% |
| Hawaiian / Pacific | 0 | 0.0% |
| Hispanic or Latino | 0 | 0.0% |
| Native / Alaskan | 0 | 0.0% |
| White / Caucasian | 71 | 45.8% |
| Two or more Races | 1 | 0.6% |
| Some other Race | 0 | 0.0% |
| Total | 155 | 100.0% |
Ancestry in Lucky
The most populous ancestries reported in Lucky are American (27 | 17.4%), English (13 | 8.4%), Irish (12 | 7.7%), German (4 | 2.6%), and Korean (3 | 1.9%), together accounting for 38.1% of all Lucky residents.
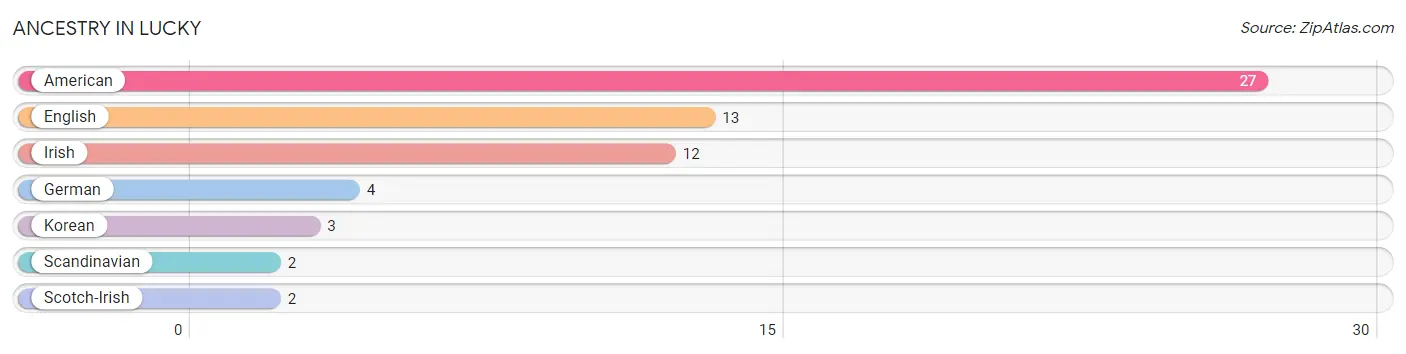
| Ancestry | # Population | % Population |
| American | 27 | 17.4% |
| English | 13 | 8.4% |
| German | 4 | 2.6% |
| Irish | 12 | 7.7% |
| Korean | 3 | 1.9% |
| Scandinavian | 2 | 1.3% |
| Scotch-Irish | 2 | 1.3% | View All 7 Rows |
Immigrants in Lucky
The most numerous immigrant groups reported in Lucky came from Asia (2 | 1.3%), Cambodia (2 | 1.3%), and South Eastern Asia (2 | 1.3%), together accounting for 3.9% of all Lucky residents.
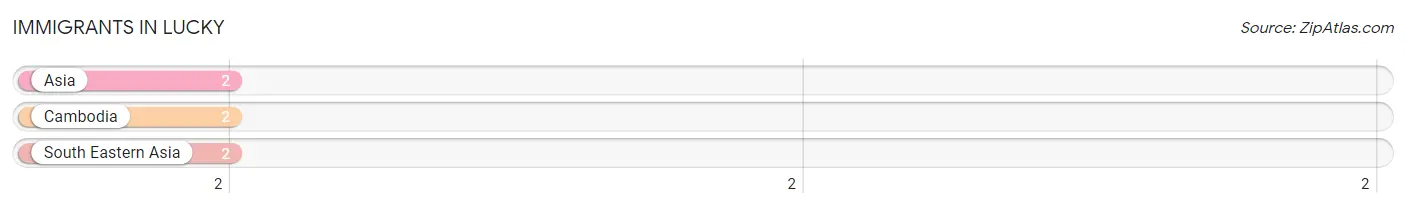
| Immigration Origin | # Population | % Population |
| Asia | 2 | 1.3% |
| Cambodia | 2 | 1.3% |
| South Eastern Asia | 2 | 1.3% | View All 3 Rows |
Sex and Age in Lucky
Sex and Age in Lucky
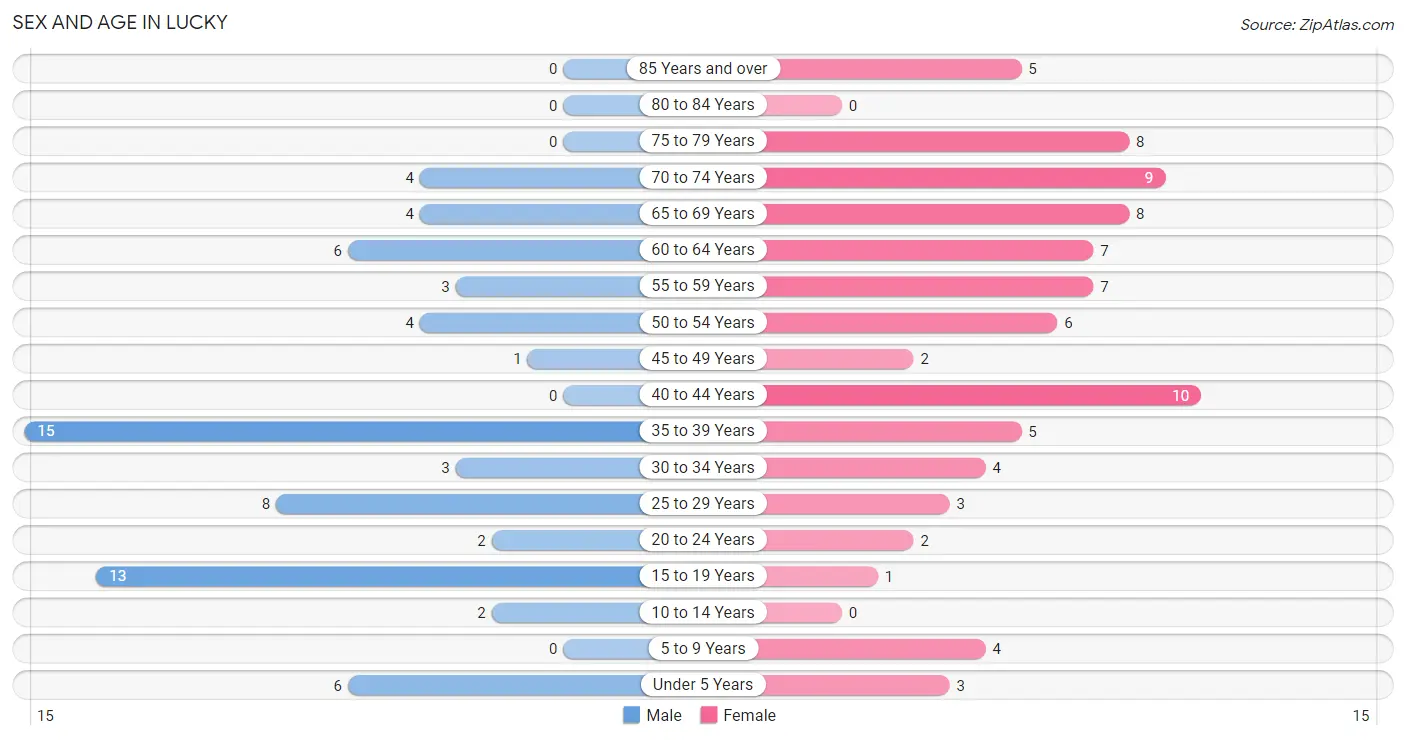
The most populous age groups in Lucky are 35 to 39 Years (15 | 21.1%) for men and 40 to 44 Years (10 | 11.9%) for women.
| Age Bracket | Male | Female |
| Under 5 Years | 6 (8.5%) | 3 (3.6%) |
| 5 to 9 Years | 0 (0.0%) | 4 (4.8%) |
| 10 to 14 Years | 2 (2.8%) | 0 (0.0%) |
| 15 to 19 Years | 13 (18.3%) | 1 (1.2%) |
| 20 to 24 Years | 2 (2.8%) | 2 (2.4%) |
| 25 to 29 Years | 8 (11.3%) | 3 (3.6%) |
| 30 to 34 Years | 3 (4.2%) | 4 (4.8%) |
| 35 to 39 Years | 15 (21.1%) | 5 (5.9%) |
| 40 to 44 Years | 0 (0.0%) | 10 (11.9%) |
| 45 to 49 Years | 1 (1.4%) | 2 (2.4%) |
| 50 to 54 Years | 4 (5.6%) | 6 (7.1%) |
| 55 to 59 Years | 3 (4.2%) | 7 (8.3%) |
| 60 to 64 Years | 6 (8.5%) | 7 (8.3%) |
| 65 to 69 Years | 4 (5.6%) | 8 (9.5%) |
| 70 to 74 Years | 4 (5.6%) | 9 (10.7%) |
| 75 to 79 Years | 0 (0.0%) | 8 (9.5%) |
| 80 to 84 Years | 0 (0.0%) | 0 (0.0%) |
| 85 Years and over | 0 (0.0%) | 5 (5.9%) |
| Total | 71 (100.0%) | 84 (100.0%) |
Families and Households in Lucky
Median Family Size in Lucky
The median family size in Lucky is 2.86 persons per family, with married-couple families (16 | 45.7%) accounting for the largest median family size of 3.13 persons per family. On the other hand, single male/father families (2 | 5.7%) represent the smallest median family size with 2.50 persons per family.
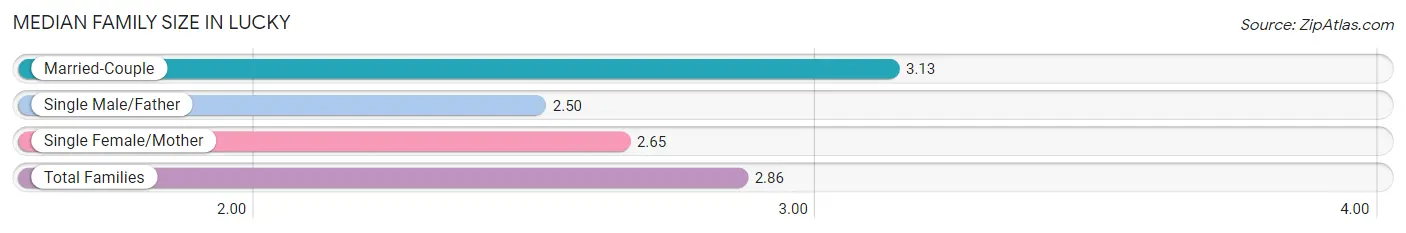
| Family Type | # Families | Family Size |
| Married-Couple | 16 (45.7%) | 3.13 |
| Single Male/Father | 2 (5.7%) | 2.50 |
| Single Female/Mother | 17 (48.6%) | 2.65 |
| Total Families | 35 (100.0%) | 2.86 |
Median Household Size in Lucky
The median household size in Lucky is 1.85 persons per household, with married-couple households (16 | 19.1%) accounting for the largest median household size of 3.13 persons per household. non-family households (49 | 58.3%) represent the smallest median household size with 1.04 persons per household.
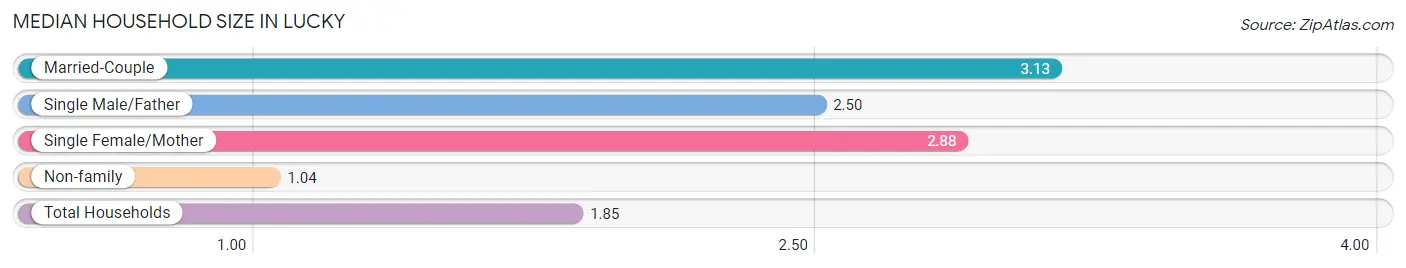
| Household Type | # Households | Household Size |
| Married-Couple | 16 (19.1%) | 3.13 |
| Single Male/Father | 2 (2.4%) | 2.50 |
| Single Female/Mother | 17 (20.2%) | 2.88 |
| Non-family | 49 (58.3%) | 1.04 |
| Total Households | 84 (100.0%) | 1.85 |
Household Size by Marriage Status in Lucky
Out of a total of 84 households in Lucky, 35 (41.7%) are family households, while 49 (58.3%) are nonfamily households. The most numerous type of family households are 3-person households, comprising 18, and the most common type of nonfamily households are 1-person households, comprising 48.
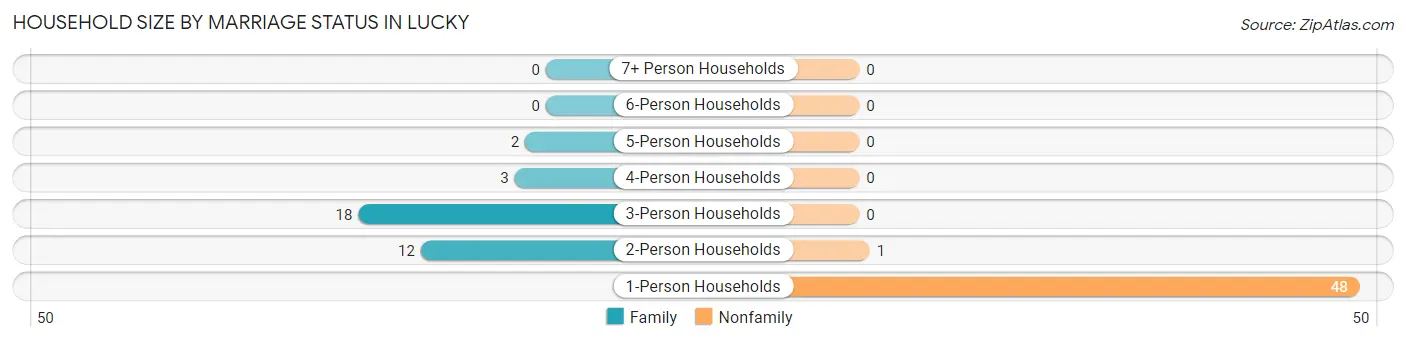
| Household Size | Family Households | Nonfamily Households |
| 1-Person Households | - | 48 (57.1%) |
| 2-Person Households | 12 (14.3%) | 1 (1.2%) |
| 3-Person Households | 18 (21.4%) | 0 (0.0%) |
| 4-Person Households | 3 (3.6%) | 0 (0.0%) |
| 5-Person Households | 2 (2.4%) | 0 (0.0%) |
| 6-Person Households | 0 (0.0%) | 0 (0.0%) |
| 7+ Person Households | 0 (0.0%) | 0 (0.0%) |
| Total | 35 (41.7%) | 49 (58.3%) |
Female Fertility in Lucky
Fertility by Age in Lucky
Average fertility rate in Lucky is 133.0 births per 1,000 women. Women in the age bracket of 20 to 34 years have the highest fertility rate with 444.0 births per 1,000 women. Women in the age bracket of 20 to 34 years acount for 100.0% of all women with births.
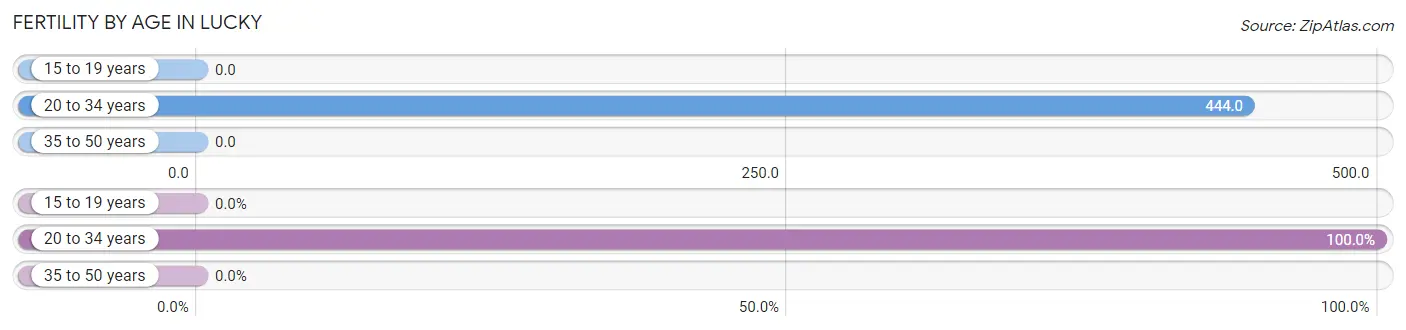
| Age Bracket | Women with Births | Births / 1,000 Women |
| 15 to 19 years | 0 (0.0%) | 0.0 |
| 20 to 34 years | 4 (100.0%) | 444.0 |
| 35 to 50 years | 0 (0.0%) | 0.0 |
| Total | 4 (100.0%) | 133.0 |
Fertility by Age by Marriage Status in Lucky
50.0% of women with births (4) in Lucky are married. The highest percentage of unmarried women with births falls into 20 to 34 years age bracket with 50.0% of them unmarried at the time of birth, while the lowest percentage of unmarried women with births belong to 20 to 34 years age bracket with 50.0% of them unmarried.
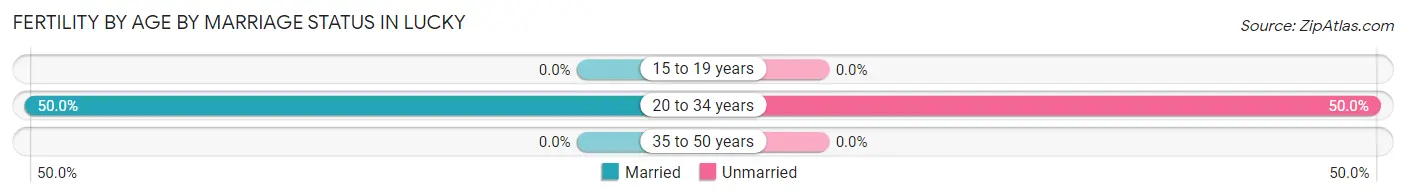
| Age Bracket | Married | Unmarried |
| 15 to 19 years | 0 (0.0%) | 0 (0.0%) |
| 20 to 34 years | 2 (50.0%) | 2 (50.0%) |
| 35 to 50 years | 0 (0.0%) | 0 (0.0%) |
| Total | 2 (50.0%) | 2 (50.0%) |
Fertility by Education in Lucky
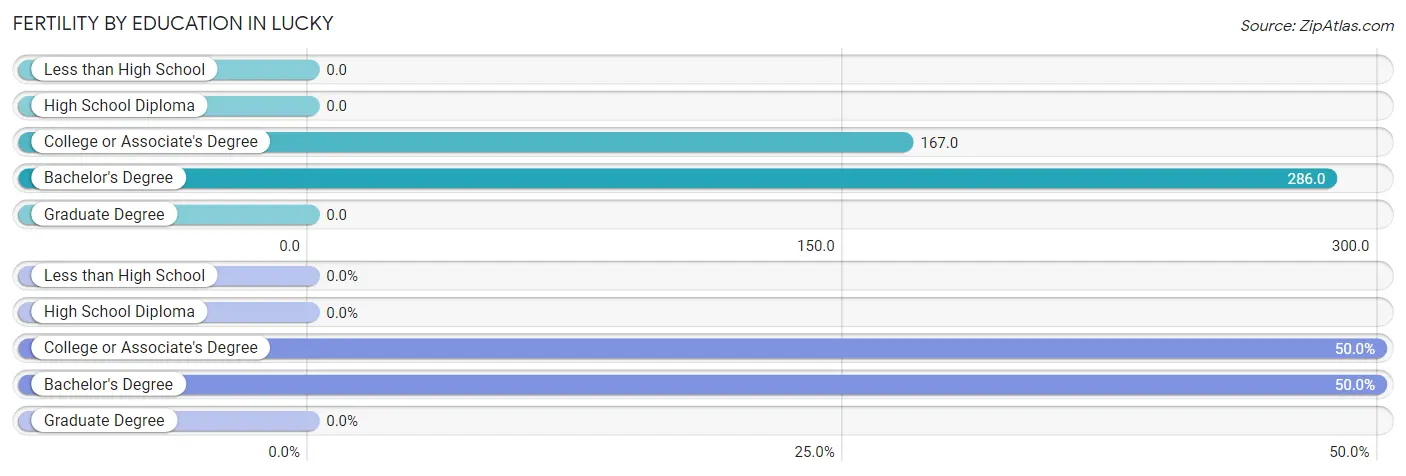
| Educational Attainment | Women with Births | Births / 1,000 Women |
| Less than High School | 0 (0.0%) | 0.0 |
| High School Diploma | 0 (0.0%) | 0.0 |
| College or Associate's Degree | 2 (50.0%) | 167.0 |
| Bachelor's Degree | 2 (50.0%) | 286.0 |
| Graduate Degree | 0 (0.0%) | 0.0 |
| Total | 4 (100.0%) | 133.0 |
Fertility by Education by Marriage Status in Lucky
50.0% of women with births in Lucky are unmarried. Women with the educational attainment of bachelor's degree are most likely to be married with 100.0% of them married at childbirth, while women with the educational attainment of college or associate's degree are least likely to be married with 100.0% of them unmarried at childbirth.
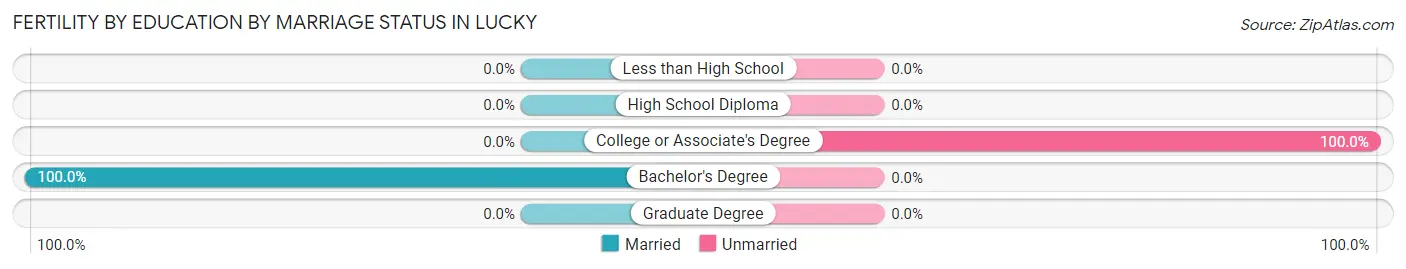
| Educational Attainment | Married | Unmarried |
| Less than High School | 0 (0.0%) | 0 (0.0%) |
| High School Diploma | 0 (0.0%) | 0 (0.0%) |
| College or Associate's Degree | 0 (0.0%) | 2 (100.0%) |
| Bachelor's Degree | 2 (100.0%) | 0 (0.0%) |
| Graduate Degree | 0 (0.0%) | 0 (0.0%) |
| Total | 2 (50.0%) | 2 (50.0%) |
Employment Characteristics in Lucky
Employment by Class of Employer in Lucky
Among the 63 employed individuals in Lucky, private company employees (36 | 57.1%), local government employees (14 | 22.2%), and state government employees (9 | 14.3%) make up the most common classes of employment.
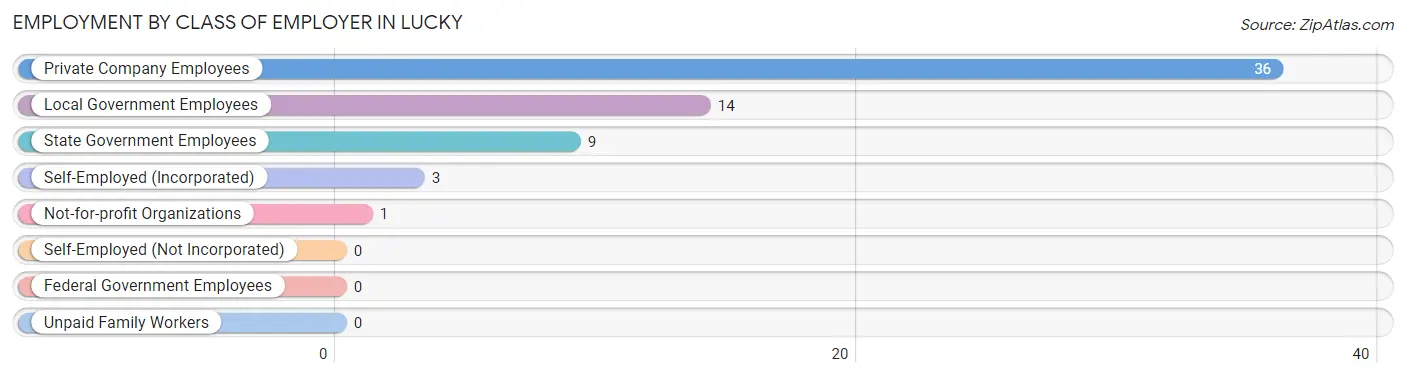
| Employer Class | # Employees | % Employees |
| Private Company Employees | 36 | 57.1% |
| Self-Employed (Incorporated) | 3 | 4.8% |
| Self-Employed (Not Incorporated) | 0 | 0.0% |
| Not-for-profit Organizations | 1 | 1.6% |
| Local Government Employees | 14 | 22.2% |
| State Government Employees | 9 | 14.3% |
| Federal Government Employees | 0 | 0.0% |
| Unpaid Family Workers | 0 | 0.0% |
| Total | 63 | 100.0% |
Employment Status by Age in Lucky
According to the labor force statistics for Lucky, out of the total population over 16 years of age (140), 46.4% or 65 individuals are in the labor force, with 3.1% or 2 of them unemployed. The age group with the highest labor force participation rate is 35 to 44 years, with 100.0% or 30 individuals in the labor force. Within the labor force, the 20 to 24 years age range has the highest percentage of unemployed individuals, with 100.0% or 2 of them being unemployed.
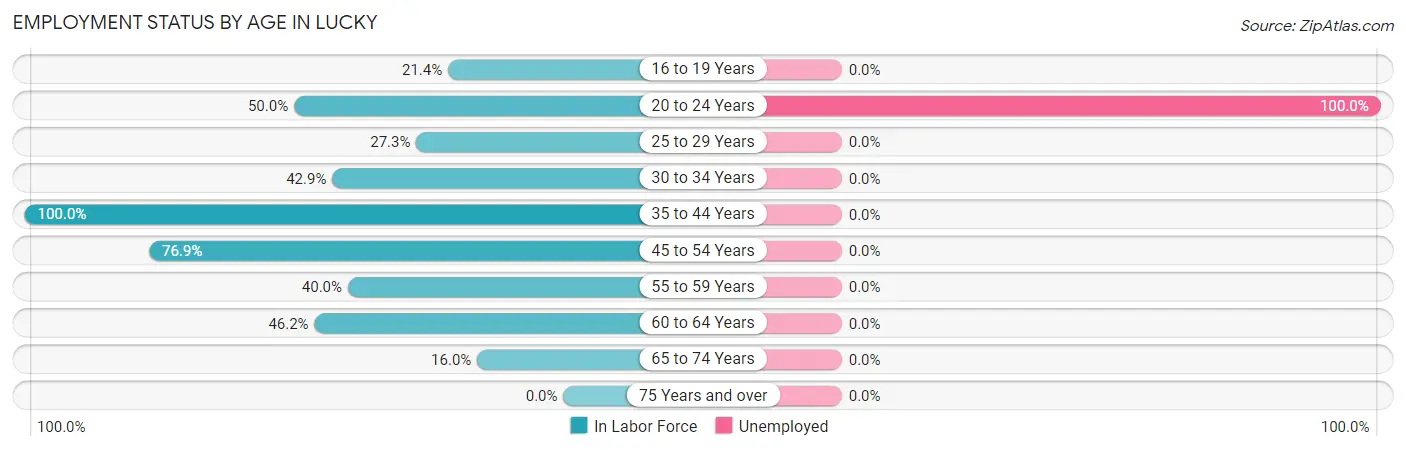
| Age Bracket | In Labor Force | Unemployed |
| 16 to 19 Years | 3 (21.4%) | 0 (0.0%) |
| 20 to 24 Years | 2 (50.0%) | 2 (100.0%) |
| 25 to 29 Years | 3 (27.3%) | 0 (0.0%) |
| 30 to 34 Years | 3 (42.9%) | 0 (0.0%) |
| 35 to 44 Years | 30 (100.0%) | 0 (0.0%) |
| 45 to 54 Years | 10 (76.9%) | 0 (0.0%) |
| 55 to 59 Years | 4 (40.0%) | 0 (0.0%) |
| 60 to 64 Years | 6 (46.2%) | 0 (0.0%) |
| 65 to 74 Years | 4 (16.0%) | 0 (0.0%) |
| 75 Years and over | 0 (0.0%) | 0 (0.0%) |
| Total | 65 (46.4%) | 2 (3.1%) |
Employment Status by Educational Attainment in Lucky
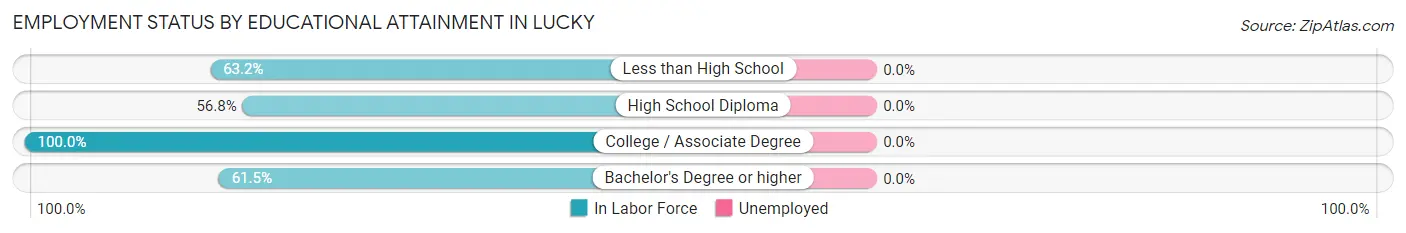
| Educational Attainment | In Labor Force | Unemployed |
| Less than High School | 12 (63.2%) | 0 (0.0%) |
| High School Diploma | 21 (56.8%) | 0 (0.0%) |
| College / Associate Degree | 15 (100.0%) | 0 (0.0%) |
| Bachelor's Degree or higher | 8 (61.5%) | 0 (0.0%) |
| Total | 56 (66.7%) | 0 (0.0%) |
Employment Occupations by Sex in Lucky
Management, Business, Science and Arts Occupations
The most common Management, Business, Science and Arts occupations in Lucky are Health Diagnosing & Treating (9 | 14.3%), Management (6 | 9.5%), and Business & Financial (1 | 1.6%).
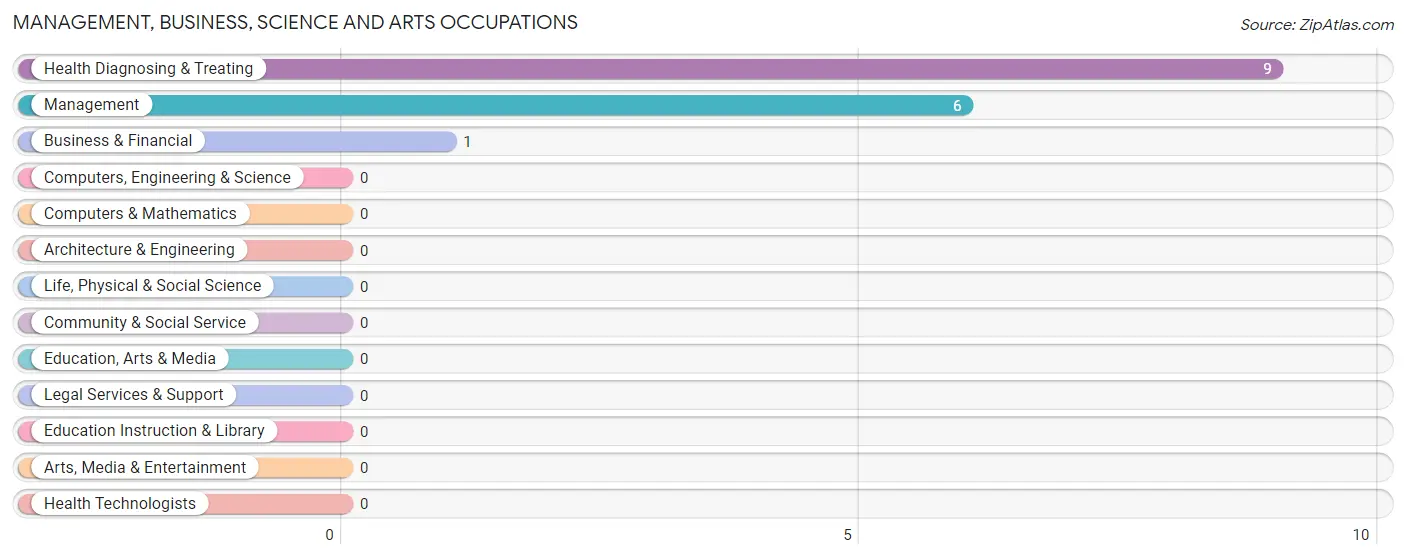
Management, Business, Science and Arts Occupations by Sex
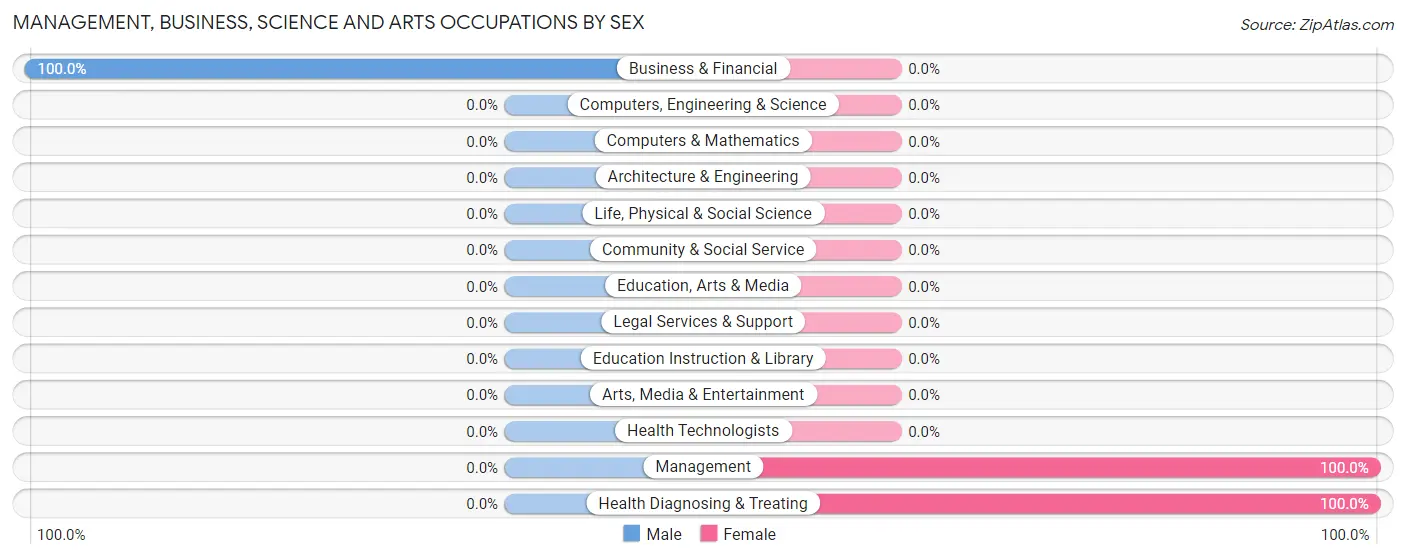
| Occupation | Male | Female |
| Management | 0 (0.0%) | 6 (100.0%) |
| Business & Financial | 1 (100.0%) | 0 (0.0%) |
| Computers, Engineering & Science | 0 (0.0%) | 0 (0.0%) |
| Computers & Mathematics | 0 (0.0%) | 0 (0.0%) |
| Architecture & Engineering | 0 (0.0%) | 0 (0.0%) |
| Life, Physical & Social Science | 0 (0.0%) | 0 (0.0%) |
| Community & Social Service | 0 (0.0%) | 0 (0.0%) |
| Education, Arts & Media | 0 (0.0%) | 0 (0.0%) |
| Legal Services & Support | 0 (0.0%) | 0 (0.0%) |
| Education Instruction & Library | 0 (0.0%) | 0 (0.0%) |
| Arts, Media & Entertainment | 0 (0.0%) | 0 (0.0%) |
| Health Diagnosing & Treating | 0 (0.0%) | 9 (100.0%) |
| Health Technologists | 0 (0.0%) | 0 (0.0%) |
| Total (Category) | 1 (6.2%) | 15 (93.8%) |
| Total (Overall) | 37 (58.7%) | 26 (41.3%) |
Services Occupations
The most common Services occupations in Lucky are Security & Protection (12 | 19.1%), Law Enforcement (12 | 19.1%), and Healthcare Support (4 | 6.4%).
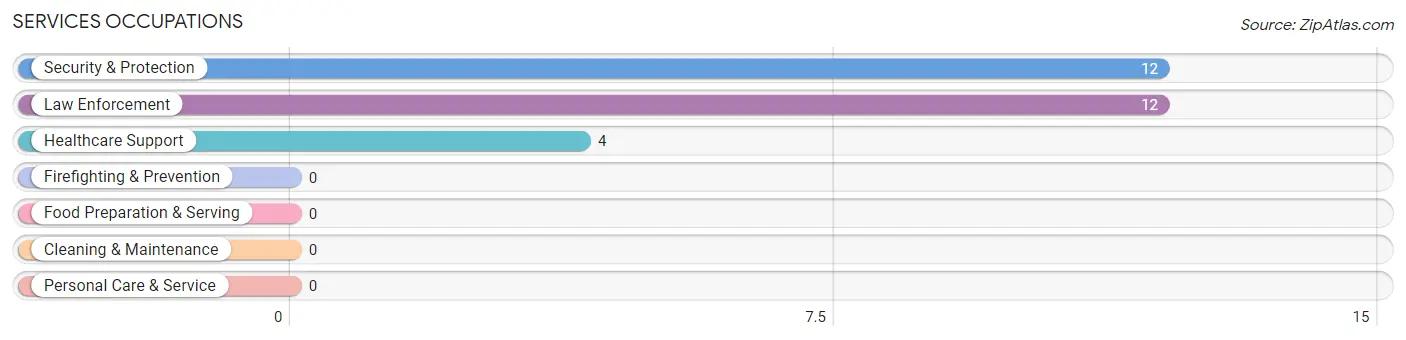
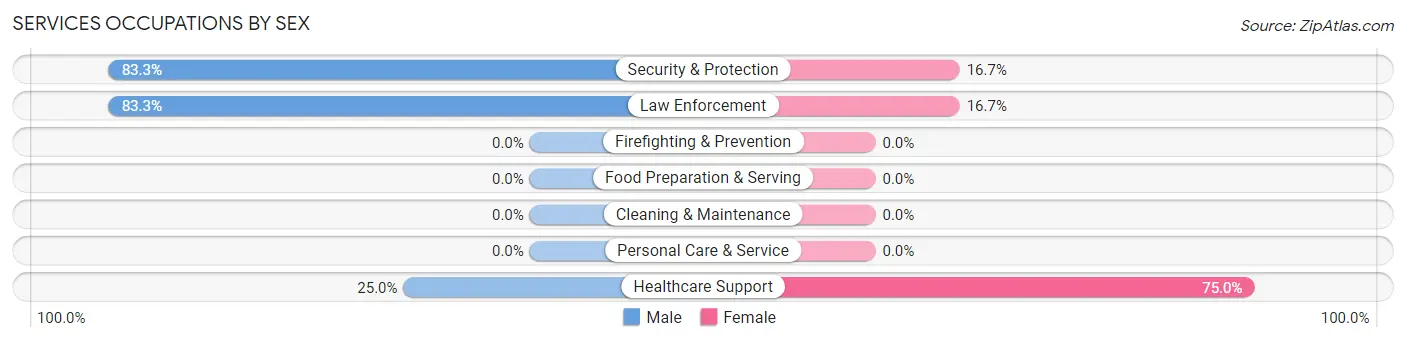
Services Occupations by Sex
Within the Services occupations in Lucky, the most male-oriented occupations are Security & Protection (83.3%), Law Enforcement (83.3%), and Healthcare Support (25.0%), while the most female-oriented occupations are Healthcare Support (75.0%), Security & Protection (16.7%), and Law Enforcement (16.7%).
| Occupation | Male | Female |
| Healthcare Support | 1 (25.0%) | 3 (75.0%) |
| Security & Protection | 10 (83.3%) | 2 (16.7%) |
| Firefighting & Prevention | 0 (0.0%) | 0 (0.0%) |
| Law Enforcement | 10 (83.3%) | 2 (16.7%) |
| Food Preparation & Serving | 0 (0.0%) | 0 (0.0%) |
| Cleaning & Maintenance | 0 (0.0%) | 0 (0.0%) |
| Personal Care & Service | 0 (0.0%) | 0 (0.0%) |
| Total (Category) | 11 (68.8%) | 5 (31.2%) |
| Total (Overall) | 37 (58.7%) | 26 (41.3%) |
Sales and Office Occupations
The most common Sales and Office occupations in Lucky are , and Office & Administration (2 | 3.2%).
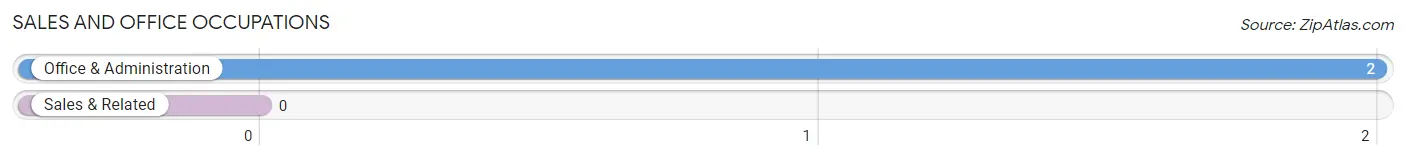
Sales and Office Occupations by Sex
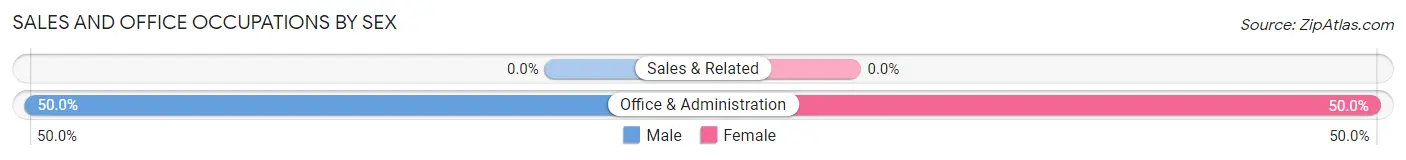
| Occupation | Male | Female |
| Sales & Related | 0 (0.0%) | 0 (0.0%) |
| Office & Administration | 1 (50.0%) | 1 (50.0%) |
| Total (Category) | 1 (50.0%) | 1 (50.0%) |
| Total (Overall) | 37 (58.7%) | 26 (41.3%) |
Natural Resources, Construction and Maintenance Occupations
The most common Natural Resources, Construction and Maintenance occupations in Lucky are , and Installation, Maintenance & Repair (4 | 6.4%).
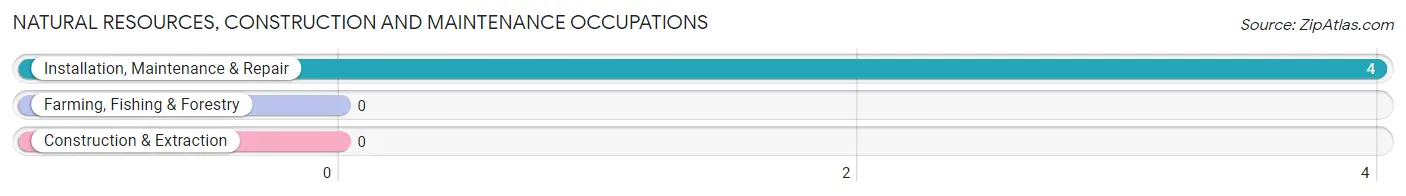
Natural Resources, Construction and Maintenance Occupations by Sex
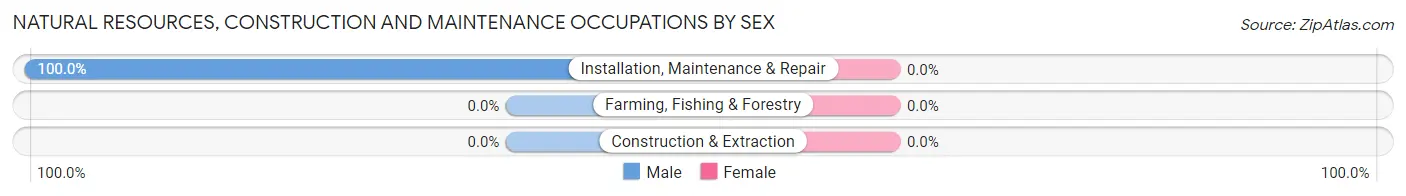
| Occupation | Male | Female |
| Farming, Fishing & Forestry | 0 (0.0%) | 0 (0.0%) |
| Construction & Extraction | 0 (0.0%) | 0 (0.0%) |
| Installation, Maintenance & Repair | 4 (100.0%) | 0 (0.0%) |
| Total (Category) | 4 (100.0%) | 0 (0.0%) |
| Total (Overall) | 37 (58.7%) | 26 (41.3%) |
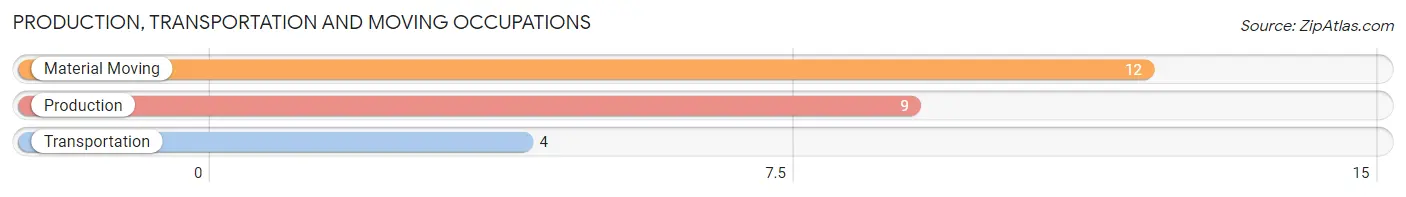
Production, Transportation and Moving Occupations
The most common Production, Transportation and Moving occupations in Lucky are Material Moving (12 | 19.1%), Production (9 | 14.3%), and Transportation (4 | 6.4%).
Production, Transportation and Moving Occupations by Sex
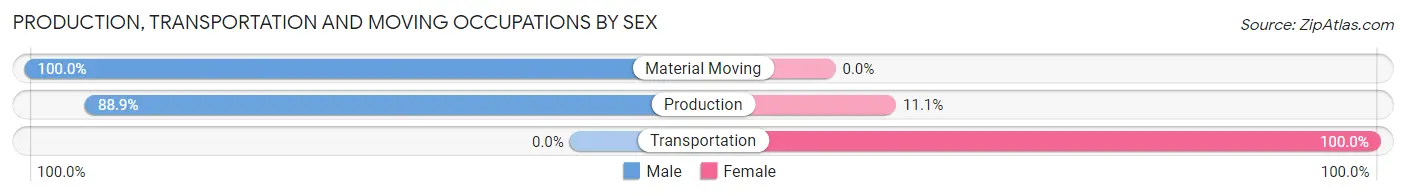
| Occupation | Male | Female |
| Production | 8 (88.9%) | 1 (11.1%) |
| Transportation | 0 (0.0%) | 4 (100.0%) |
| Material Moving | 12 (100.0%) | 0 (0.0%) |
| Total (Category) | 20 (80.0%) | 5 (20.0%) |
| Total (Overall) | 37 (58.7%) | 26 (41.3%) |
Employment Industries by Sex in Lucky
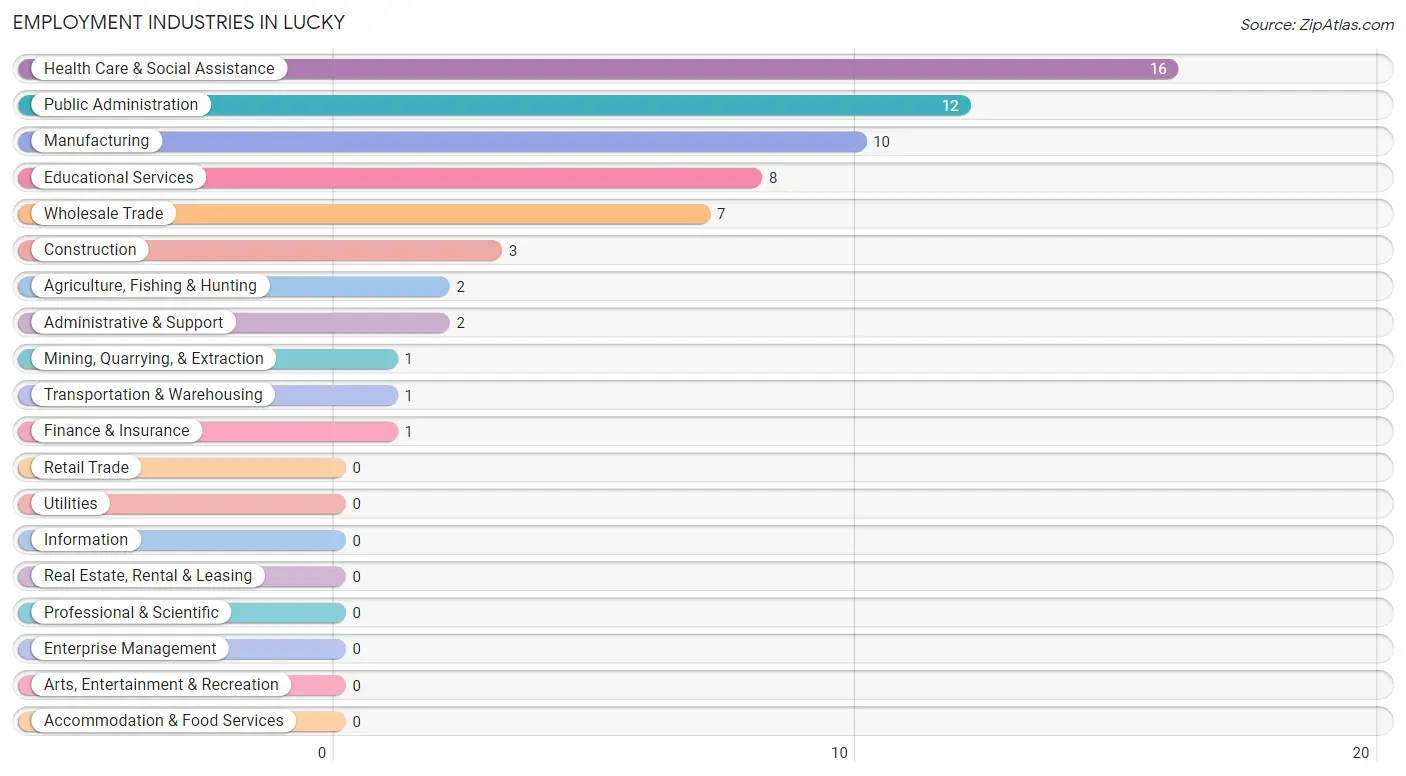
Employment Industries in Lucky
The major employment industries in Lucky include Health Care & Social Assistance (16 | 25.4%), Public Administration (12 | 19.1%), Manufacturing (10 | 15.9%), Educational Services (8 | 12.7%), and Wholesale Trade (7 | 11.1%).
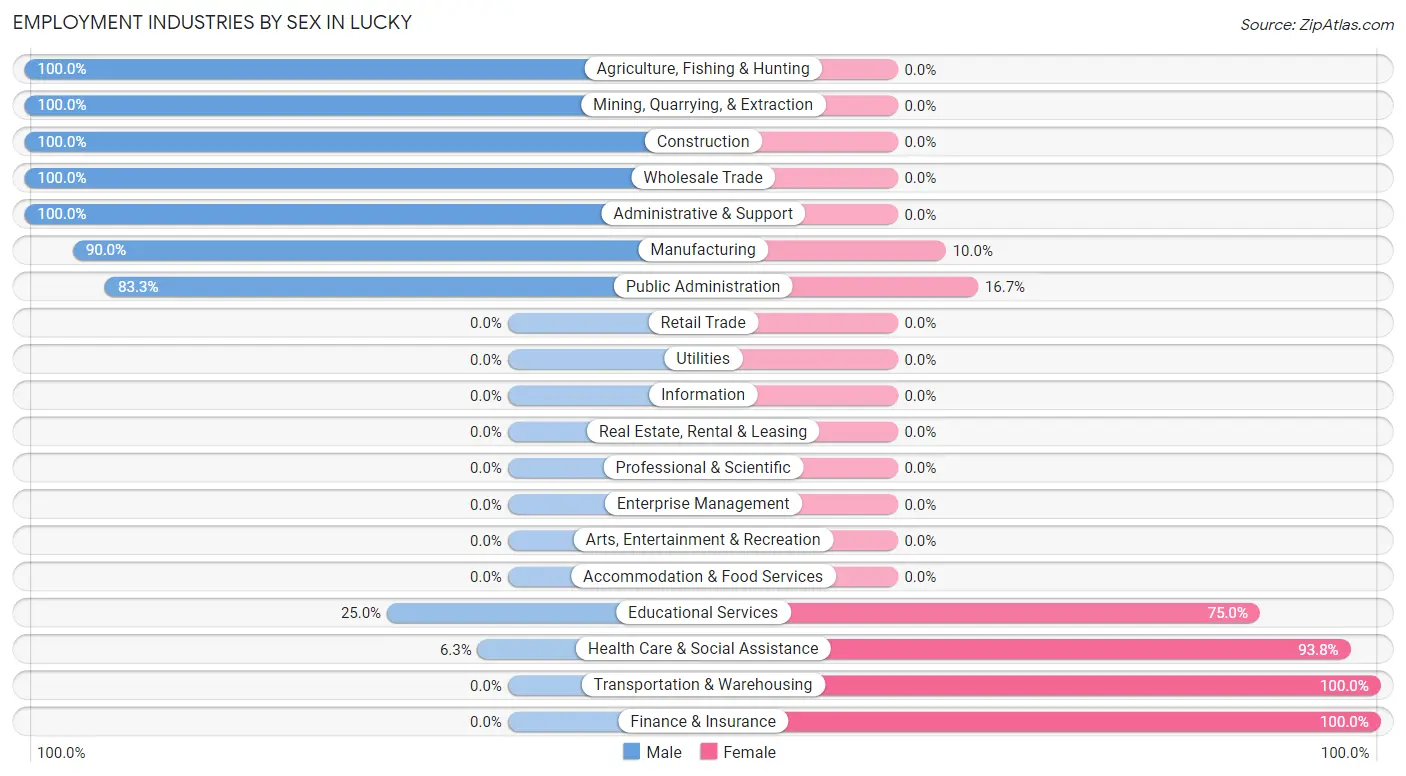
Employment Industries by Sex in Lucky
The Lucky industries that see more men than women are Agriculture, Fishing & Hunting (100.0%), Mining, Quarrying, & Extraction (100.0%), and Construction (100.0%), whereas the industries that tend to have a higher number of women are Transportation & Warehousing (100.0%), Finance & Insurance (100.0%), and Health Care & Social Assistance (93.8%).
| Industry | Male | Female |
| Agriculture, Fishing & Hunting | 2 (100.0%) | 0 (0.0%) |
| Mining, Quarrying, & Extraction | 1 (100.0%) | 0 (0.0%) |
| Construction | 3 (100.0%) | 0 (0.0%) |
| Manufacturing | 9 (90.0%) | 1 (10.0%) |
| Wholesale Trade | 7 (100.0%) | 0 (0.0%) |
| Retail Trade | 0 (0.0%) | 0 (0.0%) |
| Transportation & Warehousing | 0 (0.0%) | 1 (100.0%) |
| Utilities | 0 (0.0%) | 0 (0.0%) |
| Information | 0 (0.0%) | 0 (0.0%) |
| Finance & Insurance | 0 (0.0%) | 1 (100.0%) |
| Real Estate, Rental & Leasing | 0 (0.0%) | 0 (0.0%) |
| Professional & Scientific | 0 (0.0%) | 0 (0.0%) |
| Enterprise Management | 0 (0.0%) | 0 (0.0%) |
| Administrative & Support | 2 (100.0%) | 0 (0.0%) |
| Educational Services | 2 (25.0%) | 6 (75.0%) |
| Health Care & Social Assistance | 1 (6.2%) | 15 (93.8%) |
| Arts, Entertainment & Recreation | 0 (0.0%) | 0 (0.0%) |
| Accommodation & Food Services | 0 (0.0%) | 0 (0.0%) |
| Public Administration | 10 (83.3%) | 2 (16.7%) |
| Total | 37 (58.7%) | 26 (41.3%) |
Education in Lucky
School Enrollment in Lucky
The most common levels of schooling among the 19 students in Lucky are high school (11 | 57.9%), elementary school (5 | 26.3%), and graduate / professional (2 | 10.5%).
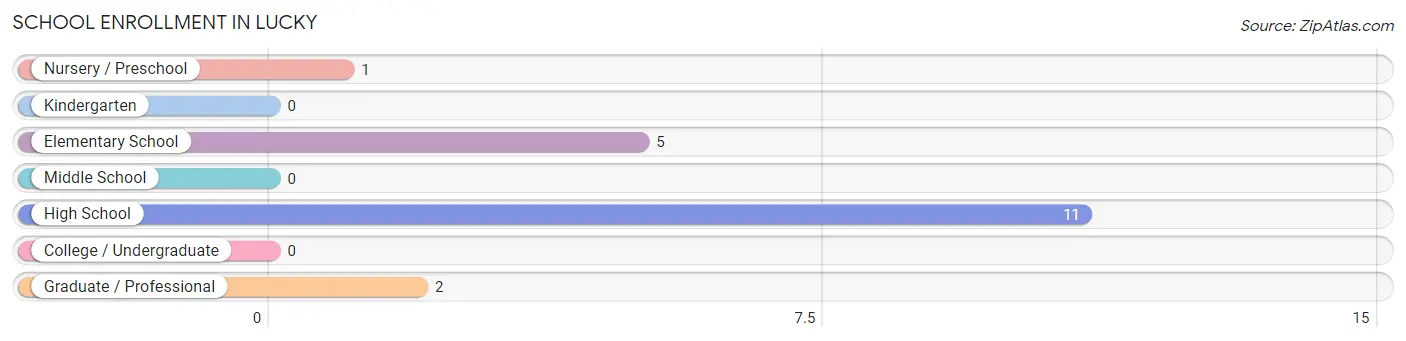
| School Level | # Students | % Students |
| Nursery / Preschool | 1 | 5.3% |
| Kindergarten | 0 | 0.0% |
| Elementary School | 5 | 26.3% |
| Middle School | 0 | 0.0% |
| High School | 11 | 57.9% |
| College / Undergraduate | 0 | 0.0% |
| Graduate / Professional | 2 | 10.5% |
| Total | 19 | 100.0% |
School Enrollment by Age by Funding Source in Lucky
Out of a total of 19 students who are enrolled in schools in Lucky, 4 (21.1%) attend a private institution, while the remaining 15 (78.9%) are enrolled in public schools. The age group of 35 years and over has the highest likelihood of being enrolled in private schools, with 2 (100.0% in the age bracket) enrolled. Conversely, the age group of 10 to 14 year olds has the lowest likelihood of being enrolled in a private school, with 2 (100.0% in the age bracket) attending a public institution.
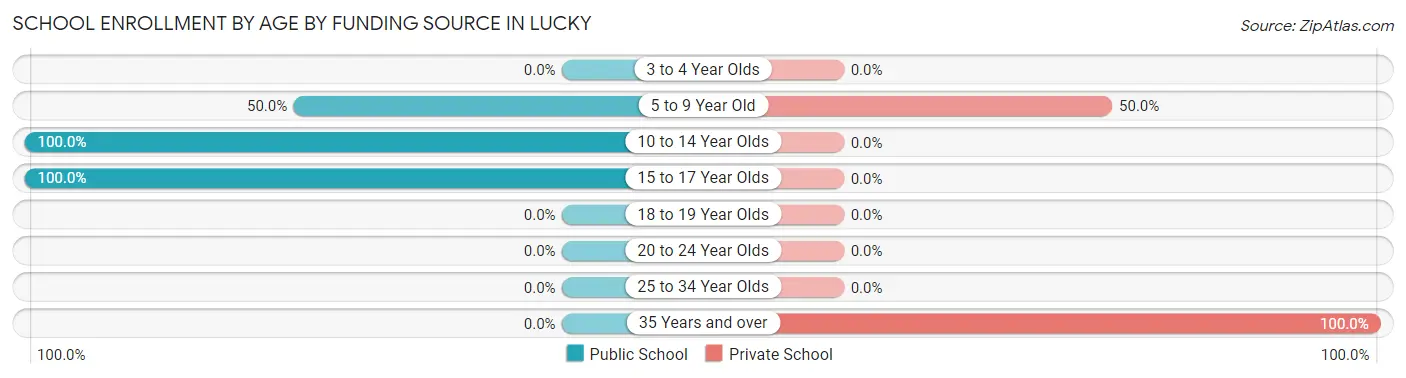
| Age Bracket | Public School | Private School |
| 3 to 4 Year Olds | 0 (0.0%) | 0 (0.0%) |
| 5 to 9 Year Old | 2 (50.0%) | 2 (50.0%) |
| 10 to 14 Year Olds | 2 (100.0%) | 0 (0.0%) |
| 15 to 17 Year Olds | 11 (100.0%) | 0 (0.0%) |
| 18 to 19 Year Olds | 0 (0.0%) | 0 (0.0%) |
| 20 to 24 Year Olds | 0 (0.0%) | 0 (0.0%) |
| 25 to 34 Year Olds | 0 (0.0%) | 0 (0.0%) |
| 35 Years and over | 0 (0.0%) | 2 (100.0%) |
| Total | 15 (78.9%) | 4 (21.1%) |
Educational Attainment by Field of Study in Lucky
Psychology (5 | 38.5%), liberal arts & history (4 | 30.8%), computers & mathematics (2 | 15.4%), and arts & humanities (2 | 15.4%) are the most common fields of study among 13 individuals in Lucky who have obtained a bachelor's degree or higher.
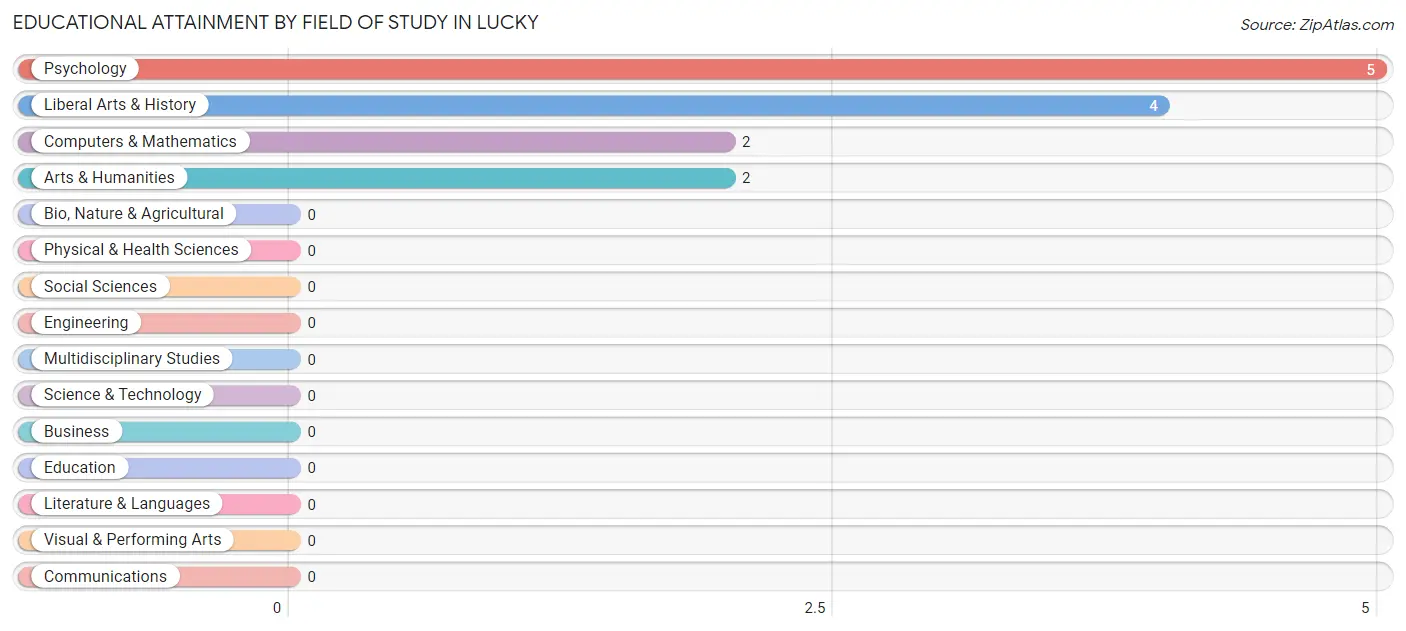
| Field of Study | # Graduates | % Graduates |
| Computers & Mathematics | 2 | 15.4% |
| Bio, Nature & Agricultural | 0 | 0.0% |
| Physical & Health Sciences | 0 | 0.0% |
| Psychology | 5 | 38.5% |
| Social Sciences | 0 | 0.0% |
| Engineering | 0 | 0.0% |
| Multidisciplinary Studies | 0 | 0.0% |
| Science & Technology | 0 | 0.0% |
| Business | 0 | 0.0% |
| Education | 0 | 0.0% |
| Literature & Languages | 0 | 0.0% |
| Liberal Arts & History | 4 | 30.8% |
| Visual & Performing Arts | 0 | 0.0% |
| Communications | 0 | 0.0% |
| Arts & Humanities | 2 | 15.4% |
| Total | 13 | 100.0% |
Transportation & Commute in Lucky
Vehicle Availability by Sex in Lucky
The most prevalent vehicle ownership categories in Lucky are males with 3 vehicles (13, accounting for 35.1%) and females with 3 vehicles (3, making up 50.0%).
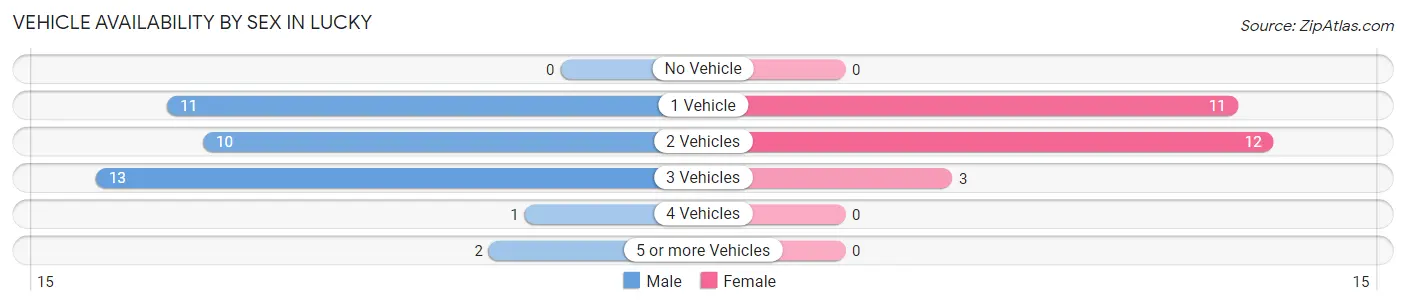
| Vehicles Available | Male | Female |
| No Vehicle | 0 (0.0%) | 0 (0.0%) |
| 1 Vehicle | 11 (29.7%) | 11 (42.3%) |
| 2 Vehicles | 10 (27.0%) | 12 (46.2%) |
| 3 Vehicles | 13 (35.1%) | 3 (11.5%) |
| 4 Vehicles | 1 (2.7%) | 0 (0.0%) |
| 5 or more Vehicles | 2 (5.4%) | 0 (0.0%) |
| Total | 37 (100.0%) | 26 (100.0%) |
Commute Time in Lucky
The most frequently occuring commute durations in Lucky are 30 to 34 minutes (12 commuters, 19.1%), 20 to 24 minutes (11 commuters, 17.5%), and 35 to 39 minutes (9 commuters, 14.3%).
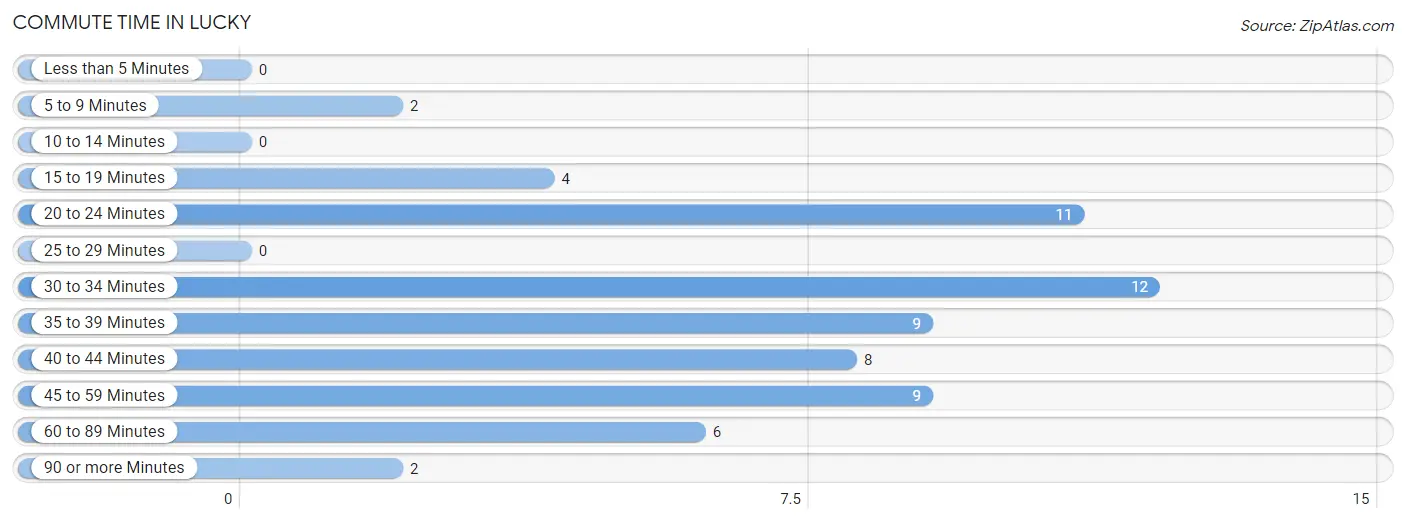
| Commute Time | # Commuters | % Commuters |
| Less than 5 Minutes | 0 | 0.0% |
| 5 to 9 Minutes | 2 | 3.2% |
| 10 to 14 Minutes | 0 | 0.0% |
| 15 to 19 Minutes | 4 | 6.4% |
| 20 to 24 Minutes | 11 | 17.5% |
| 25 to 29 Minutes | 0 | 0.0% |
| 30 to 34 Minutes | 12 | 19.1% |
| 35 to 39 Minutes | 9 | 14.3% |
| 40 to 44 Minutes | 8 | 12.7% |
| 45 to 59 Minutes | 9 | 14.3% |
| 60 to 89 Minutes | 6 | 9.5% |
| 90 or more Minutes | 2 | 3.2% |
Commute Time by Sex in Lucky
The most common commute times in Lucky are 30 to 34 minutes (10 commuters, 27.0%) for males and 20 to 24 minutes (9 commuters, 34.6%) for females.
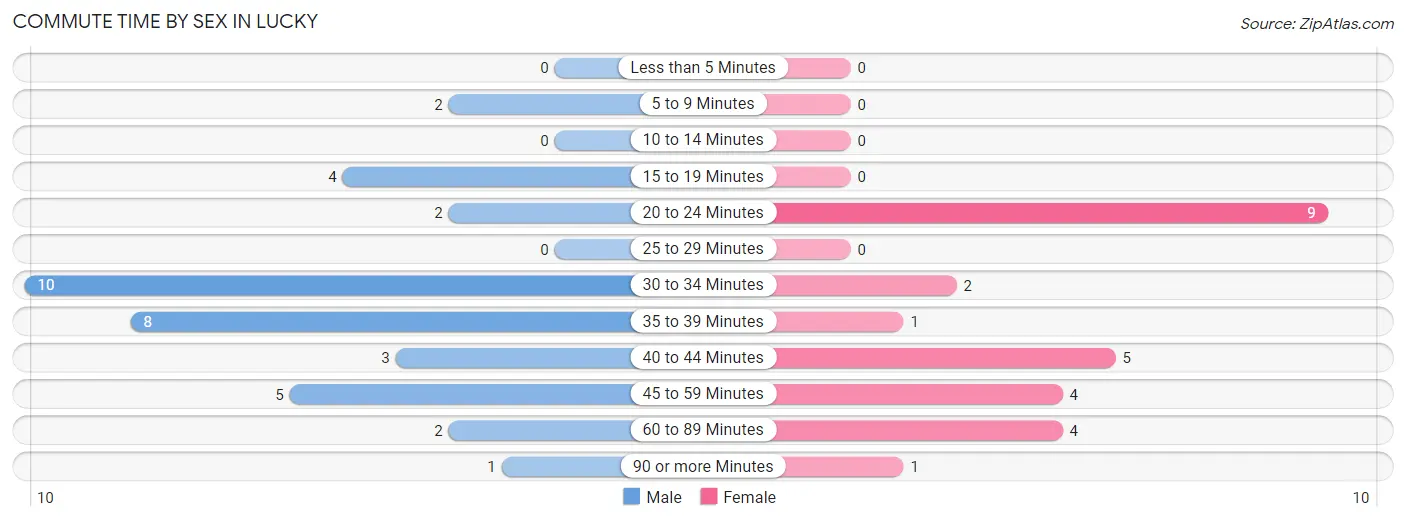
| Commute Time | Male | Female |
| Less than 5 Minutes | 0 (0.0%) | 0 (0.0%) |
| 5 to 9 Minutes | 2 (5.4%) | 0 (0.0%) |
| 10 to 14 Minutes | 0 (0.0%) | 0 (0.0%) |
| 15 to 19 Minutes | 4 (10.8%) | 0 (0.0%) |
| 20 to 24 Minutes | 2 (5.4%) | 9 (34.6%) |
| 25 to 29 Minutes | 0 (0.0%) | 0 (0.0%) |
| 30 to 34 Minutes | 10 (27.0%) | 2 (7.7%) |
| 35 to 39 Minutes | 8 (21.6%) | 1 (3.8%) |
| 40 to 44 Minutes | 3 (8.1%) | 5 (19.2%) |
| 45 to 59 Minutes | 5 (13.5%) | 4 (15.4%) |
| 60 to 89 Minutes | 2 (5.4%) | 4 (15.4%) |
| 90 or more Minutes | 1 (2.7%) | 1 (3.8%) |
Time of Departure to Work by Sex in Lucky
The most frequent times of departure to work in Lucky are 6:00 AM to 6:29 AM (7, 18.9%) for males and 7:00 AM to 7:29 AM (15, 57.7%) for females.
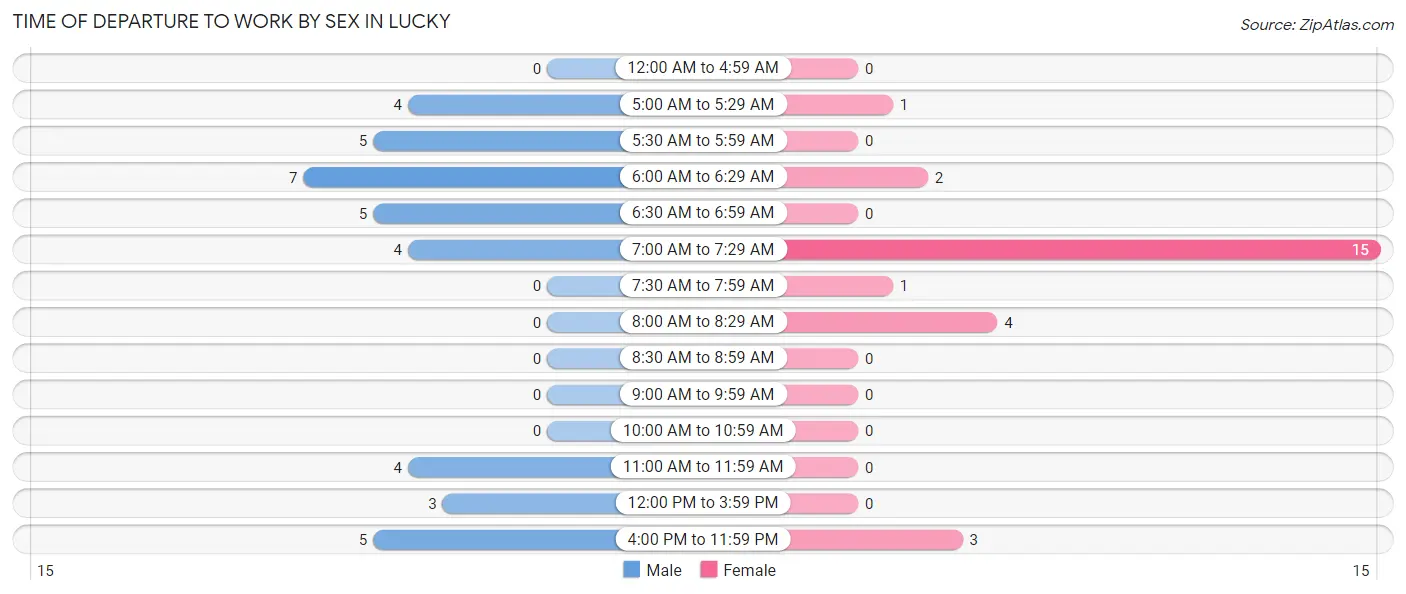
| Time of Departure | Male | Female |
| 12:00 AM to 4:59 AM | 0 (0.0%) | 0 (0.0%) |
| 5:00 AM to 5:29 AM | 4 (10.8%) | 1 (3.8%) |
| 5:30 AM to 5:59 AM | 5 (13.5%) | 0 (0.0%) |
| 6:00 AM to 6:29 AM | 7 (18.9%) | 2 (7.7%) |
| 6:30 AM to 6:59 AM | 5 (13.5%) | 0 (0.0%) |
| 7:00 AM to 7:29 AM | 4 (10.8%) | 15 (57.7%) |
| 7:30 AM to 7:59 AM | 0 (0.0%) | 1 (3.8%) |
| 8:00 AM to 8:29 AM | 0 (0.0%) | 4 (15.4%) |
| 8:30 AM to 8:59 AM | 0 (0.0%) | 0 (0.0%) |
| 9:00 AM to 9:59 AM | 0 (0.0%) | 0 (0.0%) |
| 10:00 AM to 10:59 AM | 0 (0.0%) | 0 (0.0%) |
| 11:00 AM to 11:59 AM | 4 (10.8%) | 0 (0.0%) |
| 12:00 PM to 3:59 PM | 3 (8.1%) | 0 (0.0%) |
| 4:00 PM to 11:59 PM | 5 (13.5%) | 3 (11.5%) |
| Total | 37 (100.0%) | 26 (100.0%) |
Housing Occupancy in Lucky
Occupancy by Ownership in Lucky
Of the total 84 dwellings in Lucky, owner-occupied units account for 61 (72.6%), while renter-occupied units make up 23 (27.4%).
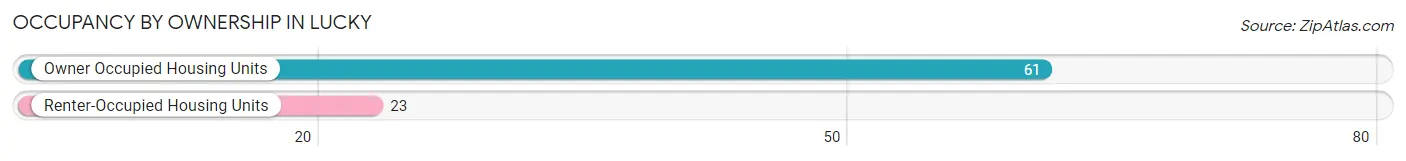
| Occupancy | # Housing Units | % Housing Units |
| Owner Occupied Housing Units | 61 | 72.6% |
| Renter-Occupied Housing Units | 23 | 27.4% |
| Total Occupied Housing Units | 84 | 100.0% |
Occupancy by Household Size in Lucky
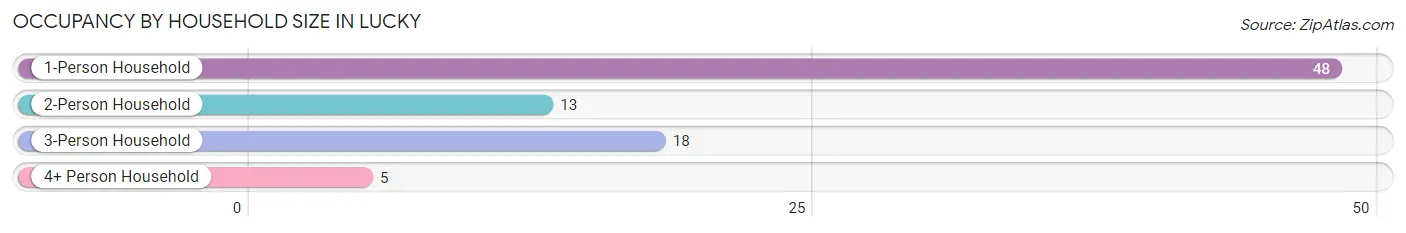
| Household Size | # Housing Units | % Housing Units |
| 1-Person Household | 48 | 57.1% |
| 2-Person Household | 13 | 15.5% |
| 3-Person Household | 18 | 21.4% |
| 4+ Person Household | 5 | 5.9% |
| Total Housing Units | 84 | 100.0% |
Occupancy by Ownership by Household Size in Lucky
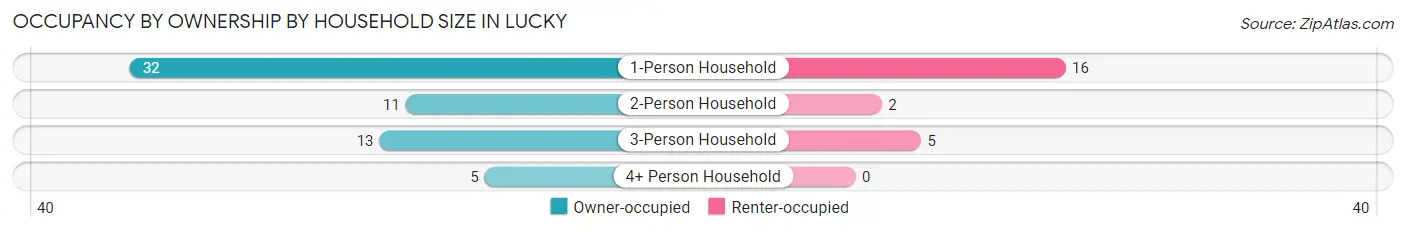
| Household Size | Owner-occupied | Renter-occupied |
| 1-Person Household | 32 (66.7%) | 16 (33.3%) |
| 2-Person Household | 11 (84.6%) | 2 (15.4%) |
| 3-Person Household | 13 (72.2%) | 5 (27.8%) |
| 4+ Person Household | 5 (100.0%) | 0 (0.0%) |
| Total Housing Units | 61 (72.6%) | 23 (27.4%) |
Occupancy by Educational Attainment in Lucky
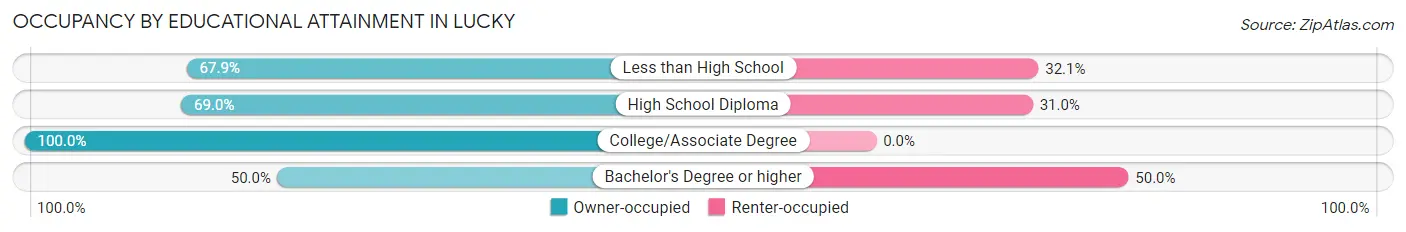
| Household Size | Owner-occupied | Renter-occupied |
| Less than High School | 19 (67.9%) | 9 (32.1%) |
| High School Diploma | 20 (69.0%) | 9 (31.0%) |
| College/Associate Degree | 17 (100.0%) | 0 (0.0%) |
| Bachelor's Degree or higher | 5 (50.0%) | 5 (50.0%) |
Occupancy by Age of Householder in Lucky
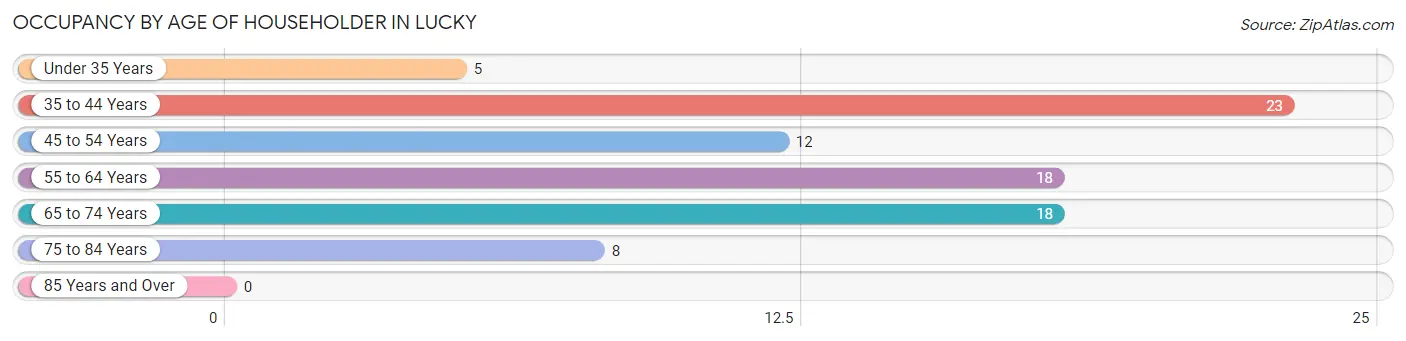
| Age Bracket | # Households | % Households |
| Under 35 Years | 5 | 5.9% |
| 35 to 44 Years | 23 | 27.4% |
| 45 to 54 Years | 12 | 14.3% |
| 55 to 64 Years | 18 | 21.4% |
| 65 to 74 Years | 18 | 21.4% |
| 75 to 84 Years | 8 | 9.5% |
| 85 Years and Over | 0 | 0.0% |
| Total | 84 | 100.0% |
Housing Finances in Lucky
Median Income by Occupancy in Lucky
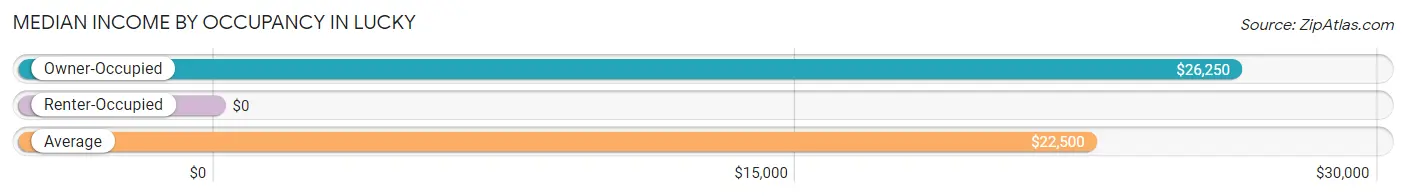
| Occupancy Type | # Households | Median Income |
| Owner-Occupied | 61 (72.6%) | $26,250 |
| Renter-Occupied | 23 (27.4%) | $0 |
| Average | 84 (100.0%) | $22,500 |
Occupancy by Householder Income Bracket in Lucky
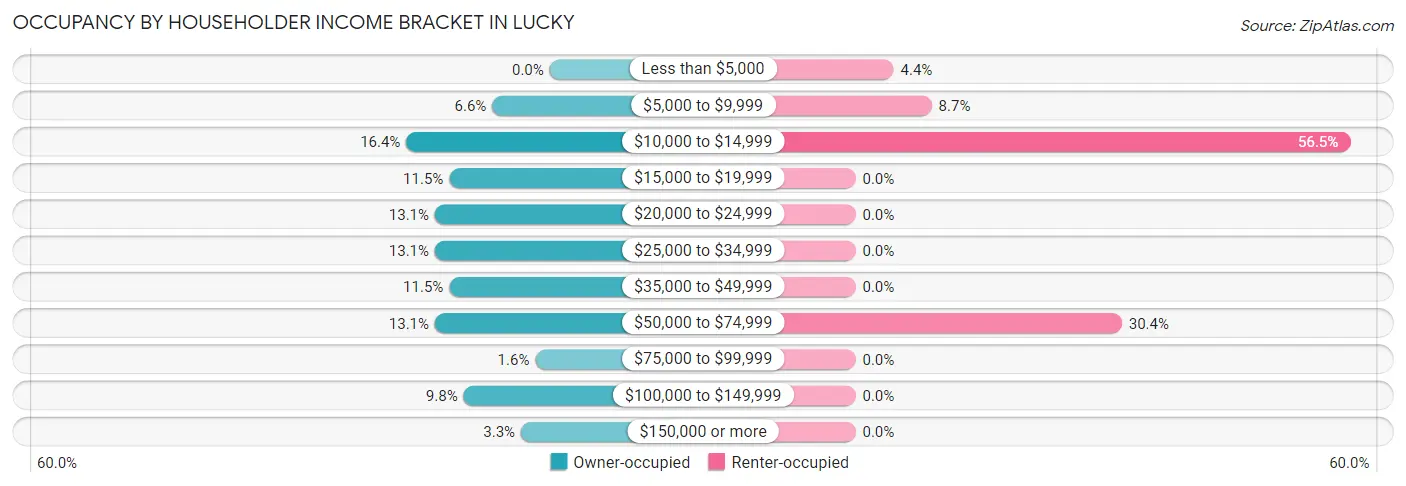
| Income Bracket | Owner-occupied | Renter-occupied |
| Less than $5,000 | 0 (0.0%) | 1 (4.3%) |
| $5,000 to $9,999 | 4 (6.6%) | 2 (8.7%) |
| $10,000 to $14,999 | 10 (16.4%) | 13 (56.5%) |
| $15,000 to $19,999 | 7 (11.5%) | 0 (0.0%) |
| $20,000 to $24,999 | 8 (13.1%) | 0 (0.0%) |
| $25,000 to $34,999 | 8 (13.1%) | 0 (0.0%) |
| $35,000 to $49,999 | 7 (11.5%) | 0 (0.0%) |
| $50,000 to $74,999 | 8 (13.1%) | 7 (30.4%) |
| $75,000 to $99,999 | 1 (1.6%) | 0 (0.0%) |
| $100,000 to $149,999 | 6 (9.8%) | 0 (0.0%) |
| $150,000 or more | 2 (3.3%) | 0 (0.0%) |
| Total | 61 (100.0%) | 23 (100.0%) |
Monthly Housing Cost Tiers in Lucky
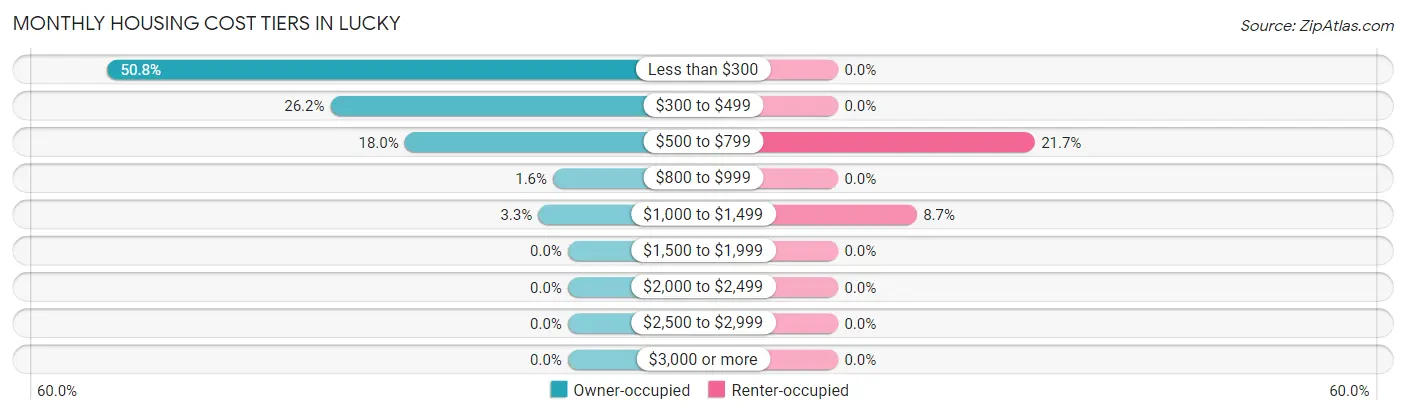
| Monthly Cost | Owner-occupied | Renter-occupied |
| Less than $300 | 31 (50.8%) | 0 (0.0%) |
| $300 to $499 | 16 (26.2%) | 0 (0.0%) |
| $500 to $799 | 11 (18.0%) | 5 (21.7%) |
| $800 to $999 | 1 (1.6%) | 0 (0.0%) |
| $1,000 to $1,499 | 2 (3.3%) | 2 (8.7%) |
| $1,500 to $1,999 | 0 (0.0%) | 0 (0.0%) |
| $2,000 to $2,499 | 0 (0.0%) | 0 (0.0%) |
| $2,500 to $2,999 | 0 (0.0%) | 0 (0.0%) |
| $3,000 or more | 0 (0.0%) | 0 (0.0%) |
| Total | 61 (100.0%) | 23 (100.0%) |
Physical Housing Characteristics in Lucky
Housing Structures in Lucky
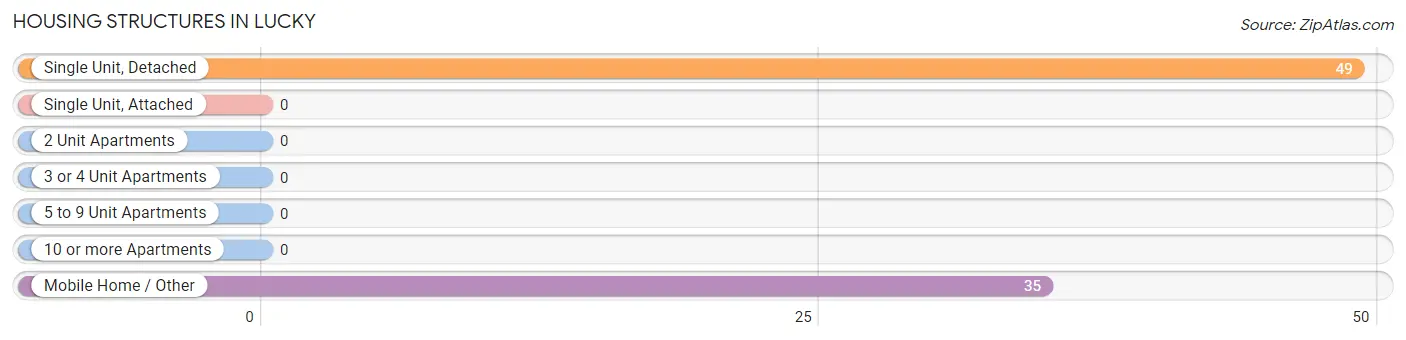
| Structure Type | # Housing Units | % Housing Units |
| Single Unit, Detached | 49 | 58.3% |
| Single Unit, Attached | 0 | 0.0% |
| 2 Unit Apartments | 0 | 0.0% |
| 3 or 4 Unit Apartments | 0 | 0.0% |
| 5 to 9 Unit Apartments | 0 | 0.0% |
| 10 or more Apartments | 0 | 0.0% |
| Mobile Home / Other | 35 | 41.7% |
| Total | 84 | 100.0% |
Housing Structures by Occupancy in Lucky
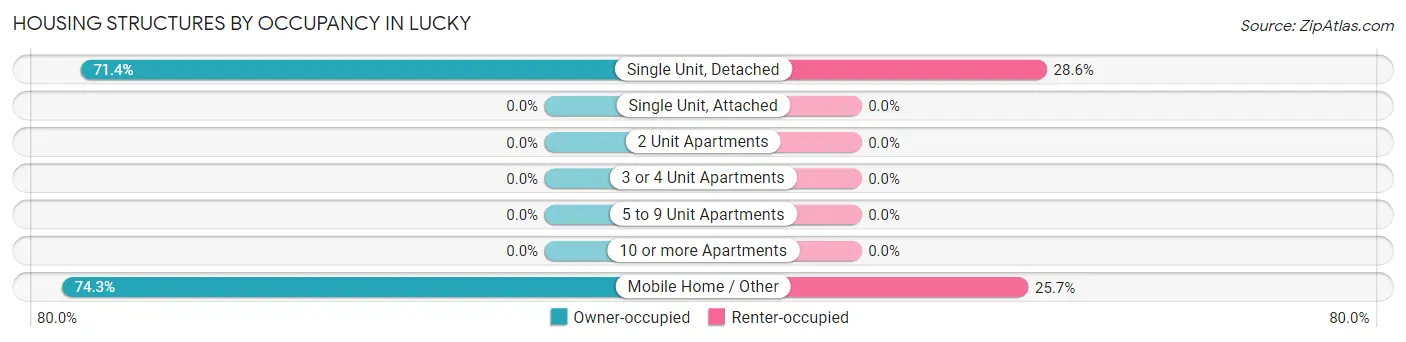
| Structure Type | Owner-occupied | Renter-occupied |
| Single Unit, Detached | 35 (71.4%) | 14 (28.6%) |
| Single Unit, Attached | 0 (0.0%) | 0 (0.0%) |
| 2 Unit Apartments | 0 (0.0%) | 0 (0.0%) |
| 3 or 4 Unit Apartments | 0 (0.0%) | 0 (0.0%) |
| 5 to 9 Unit Apartments | 0 (0.0%) | 0 (0.0%) |
| 10 or more Apartments | 0 (0.0%) | 0 (0.0%) |
| Mobile Home / Other | 26 (74.3%) | 9 (25.7%) |
| Total | 61 (72.6%) | 23 (27.4%) |
Housing Structures by Number of Rooms in Lucky
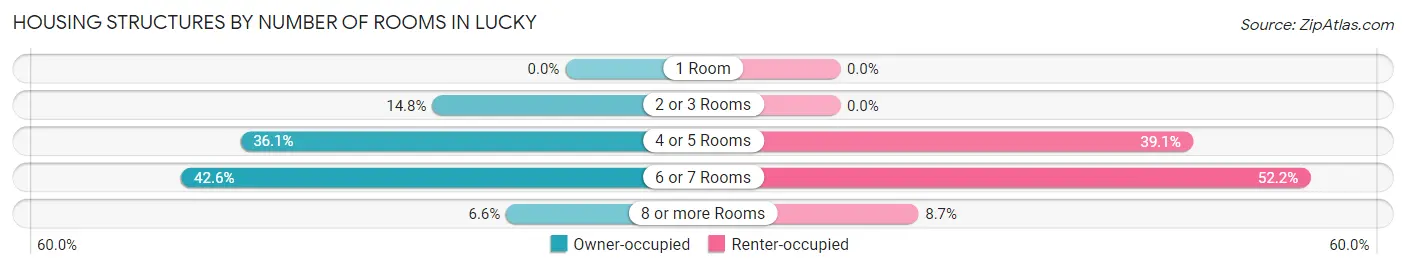
| Number of Rooms | Owner-occupied | Renter-occupied |
| 1 Room | 0 (0.0%) | 0 (0.0%) |
| 2 or 3 Rooms | 9 (14.7%) | 0 (0.0%) |
| 4 or 5 Rooms | 22 (36.1%) | 9 (39.1%) |
| 6 or 7 Rooms | 26 (42.6%) | 12 (52.2%) |
| 8 or more Rooms | 4 (6.6%) | 2 (8.7%) |
| Total | 61 (100.0%) | 23 (100.0%) |
Housing Structure by Heating Type in Lucky
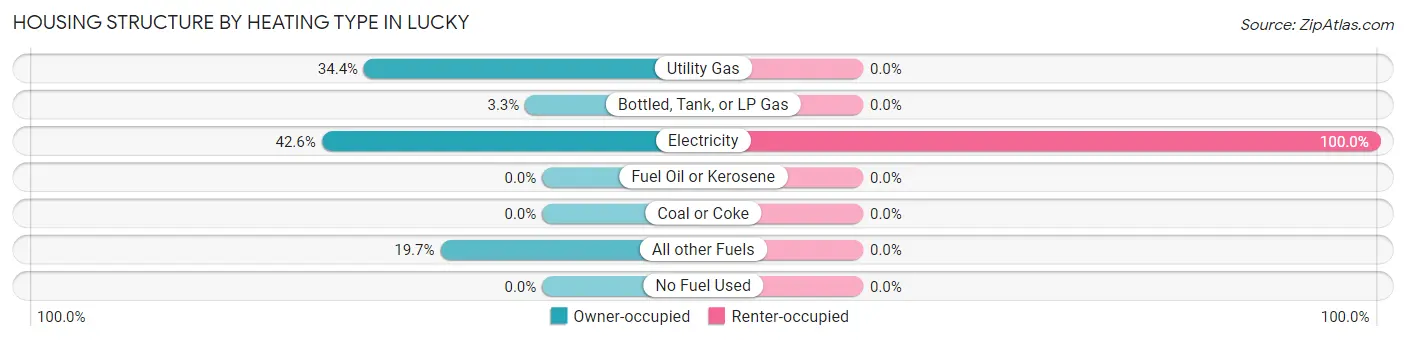
| Heating Type | Owner-occupied | Renter-occupied |
| Utility Gas | 21 (34.4%) | 0 (0.0%) |
| Bottled, Tank, or LP Gas | 2 (3.3%) | 0 (0.0%) |
| Electricity | 26 (42.6%) | 23 (100.0%) |
| Fuel Oil or Kerosene | 0 (0.0%) | 0 (0.0%) |
| Coal or Coke | 0 (0.0%) | 0 (0.0%) |
| All other Fuels | 12 (19.7%) | 0 (0.0%) |
| No Fuel Used | 0 (0.0%) | 0 (0.0%) |
| Total | 61 (100.0%) | 23 (100.0%) |
Household Vehicle Usage in Lucky
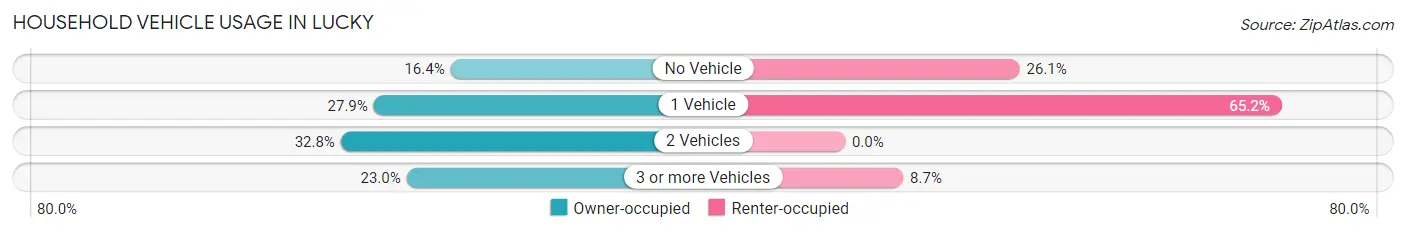
| Vehicles per Household | Owner-occupied | Renter-occupied |
| No Vehicle | 10 (16.4%) | 6 (26.1%) |
| 1 Vehicle | 17 (27.9%) | 15 (65.2%) |
| 2 Vehicles | 20 (32.8%) | 0 (0.0%) |
| 3 or more Vehicles | 14 (23.0%) | 2 (8.7%) |
| Total | 61 (100.0%) | 23 (100.0%) |
Real Estate & Mortgages in Lucky
Real Estate and Mortgage Overview in Lucky
| Characteristic | Without Mortgage | With Mortgage |
| Housing Units | 51 | 10 |
| Median Property Value | $49,400 | $0 |
| Median Household Income | $27,917 | $0 |
| Monthly Housing Costs | $261 | $0 |
| Real Estate Taxes | $199 | $9 |
Property Value by Mortgage Status in Lucky
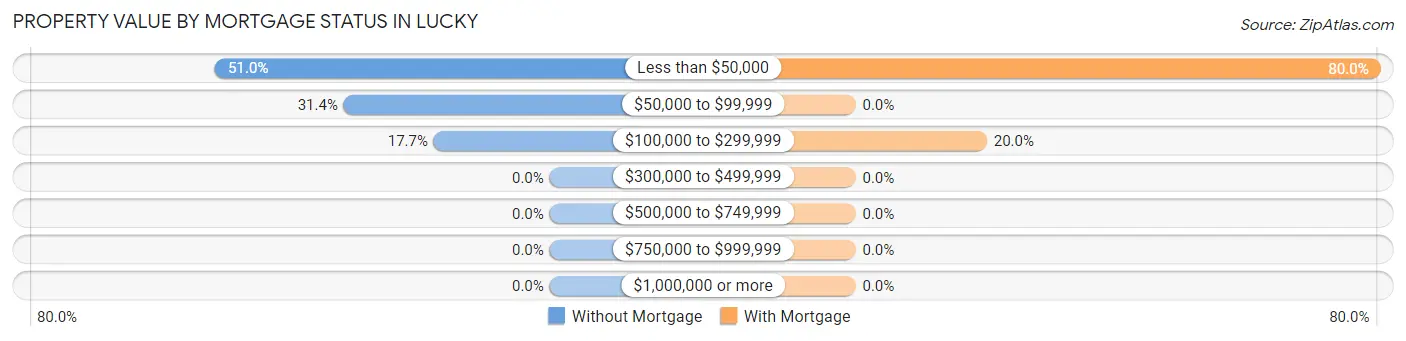
| Property Value | Without Mortgage | With Mortgage |
| Less than $50,000 | 26 (51.0%) | 8 (80.0%) |
| $50,000 to $99,999 | 16 (31.4%) | 0 (0.0%) |
| $100,000 to $299,999 | 9 (17.6%) | 2 (20.0%) |
| $300,000 to $499,999 | 0 (0.0%) | 0 (0.0%) |
| $500,000 to $749,999 | 0 (0.0%) | 0 (0.0%) |
| $750,000 to $999,999 | 0 (0.0%) | 0 (0.0%) |
| $1,000,000 or more | 0 (0.0%) | 0 (0.0%) |
| Total | 51 (100.0%) | 10 (100.0%) |
Household Income by Mortgage Status in Lucky
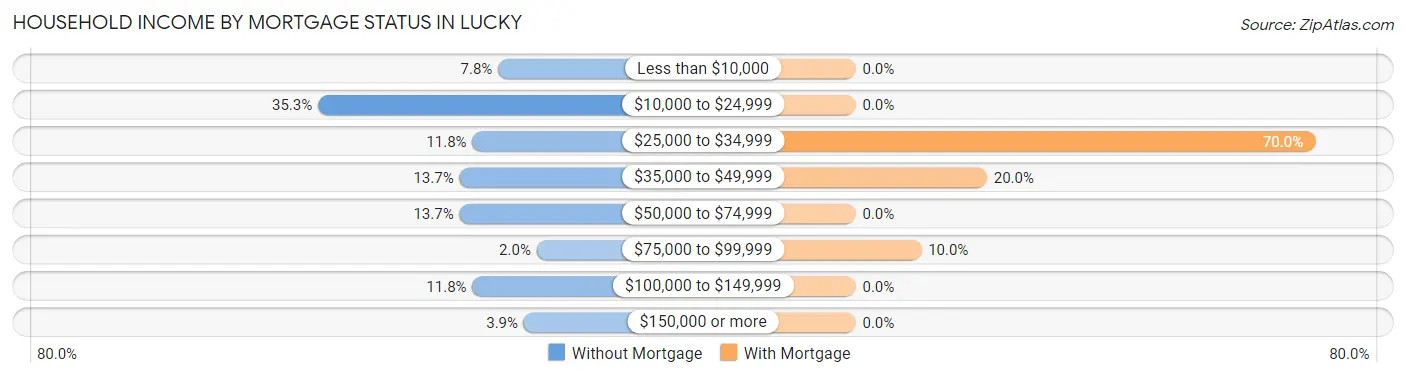
| Household Income | Without Mortgage | With Mortgage |
| Less than $10,000 | 4 (7.8%) | 0 (0.0%) |
| $10,000 to $24,999 | 18 (35.3%) | 0 (0.0%) |
| $25,000 to $34,999 | 6 (11.8%) | 7 (70.0%) |
| $35,000 to $49,999 | 7 (13.7%) | 2 (20.0%) |
| $50,000 to $74,999 | 7 (13.7%) | 0 (0.0%) |
| $75,000 to $99,999 | 1 (2.0%) | 1 (10.0%) |
| $100,000 to $149,999 | 6 (11.8%) | 0 (0.0%) |
| $150,000 or more | 2 (3.9%) | 0 (0.0%) |
| Total | 51 (100.0%) | 10 (100.0%) |
Property Value to Household Income Ratio in Lucky
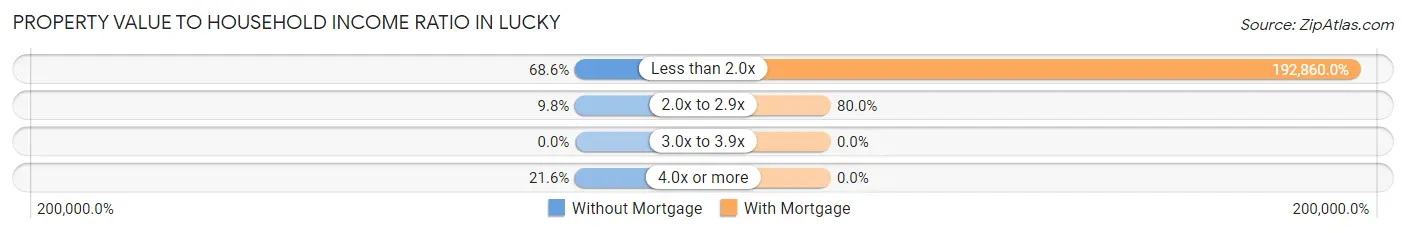
| Value-to-Income Ratio | Without Mortgage | With Mortgage |
| Less than 2.0x | 35 (68.6%) | 19,286 (192,860.0%) |
| 2.0x to 2.9x | 5 (9.8%) | 8 (80.0%) |
| 3.0x to 3.9x | 0 (0.0%) | 0 (0.0%) |
| 4.0x or more | 11 (21.6%) | 0 (0.0%) |
| Total | 51 (100.0%) | 10 (100.0%) |
Real Estate Taxes by Mortgage Status in Lucky
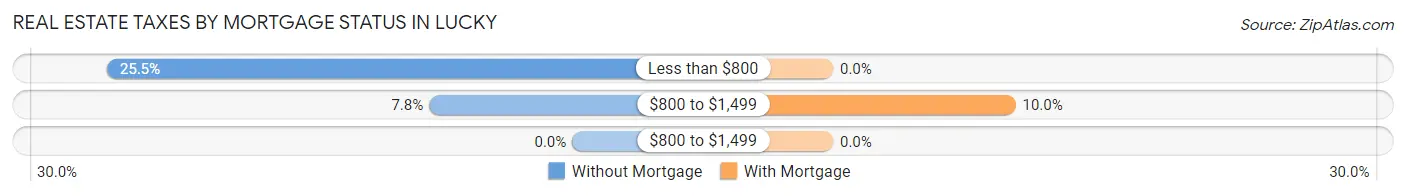
| Property Taxes | Without Mortgage | With Mortgage |
| Less than $800 | 13 (25.5%) | 0 (0.0%) |
| $800 to $1,499 | 4 (7.8%) | 1 (10.0%) |
| $800 to $1,499 | 0 (0.0%) | 0 (0.0%) |
| Total | 51 (100.0%) | 10 (100.0%) |
Health & Disability in Lucky
Health Insurance Coverage by Age in Lucky
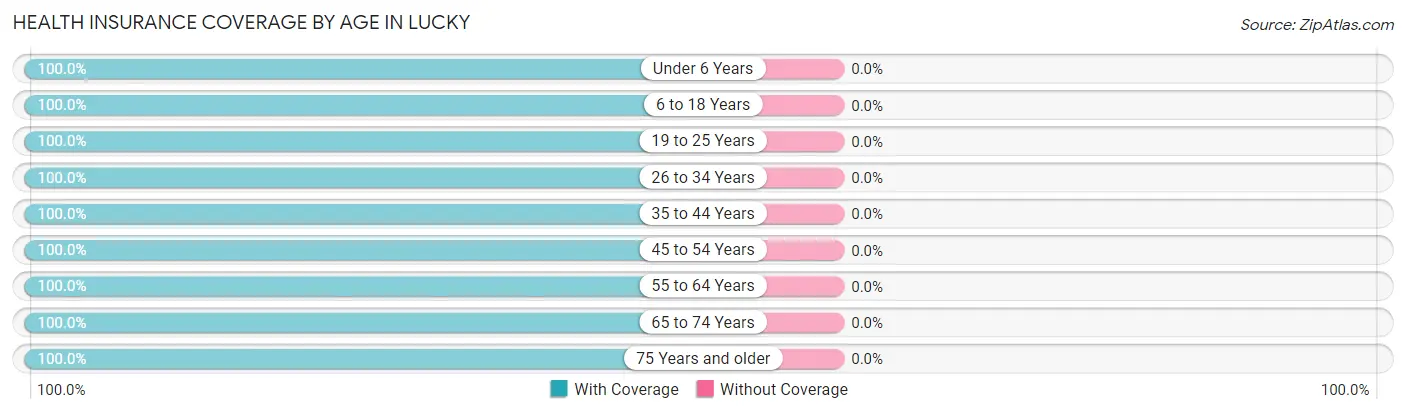
| Age Bracket | With Coverage | Without Coverage |
| Under 6 Years | 10 (100.0%) | 0 (0.0%) |
| 6 to 18 Years | 16 (100.0%) | 0 (0.0%) |
| 19 to 25 Years | 10 (100.0%) | 0 (0.0%) |
| 26 to 34 Years | 15 (100.0%) | 0 (0.0%) |
| 35 to 44 Years | 30 (100.0%) | 0 (0.0%) |
| 45 to 54 Years | 13 (100.0%) | 0 (0.0%) |
| 55 to 64 Years | 23 (100.0%) | 0 (0.0%) |
| 65 to 74 Years | 25 (100.0%) | 0 (0.0%) |
| 75 Years and older | 13 (100.0%) | 0 (0.0%) |
| Total | 155 (100.0%) | 0 (0.0%) |
Health Insurance Coverage by Citizenship Status in Lucky
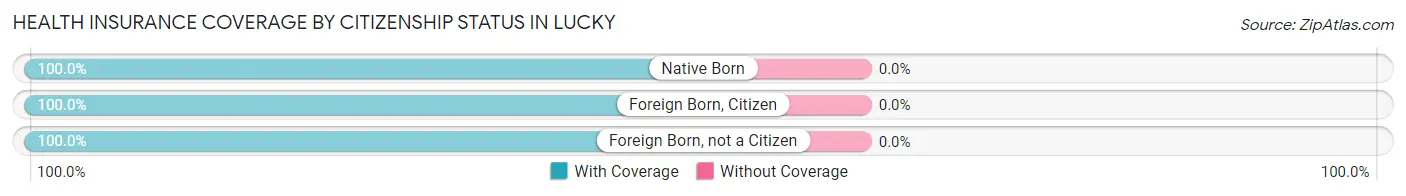
| Citizenship Status | With Coverage | Without Coverage |
| Native Born | 10 (100.0%) | 0 (0.0%) |
| Foreign Born, Citizen | 16 (100.0%) | 0 (0.0%) |
| Foreign Born, not a Citizen | 10 (100.0%) | 0 (0.0%) |
Health Insurance Coverage by Household Income in Lucky
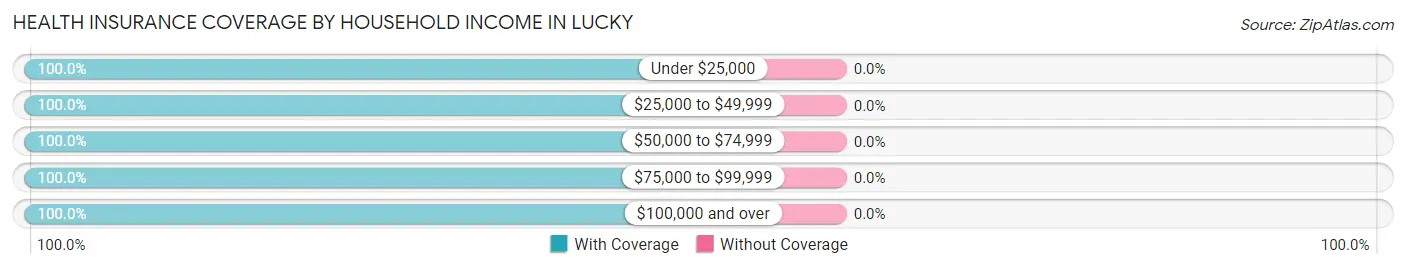
| Household Income | With Coverage | Without Coverage |
| Under $25,000 | 58 (100.0%) | 0 (0.0%) |
| $25,000 to $49,999 | 33 (100.0%) | 0 (0.0%) |
| $50,000 to $74,999 | 41 (100.0%) | 0 (0.0%) |
| $75,000 to $99,999 | 2 (100.0%) | 0 (0.0%) |
| $100,000 and over | 21 (100.0%) | 0 (0.0%) |
Public vs Private Health Insurance Coverage by Age in Lucky
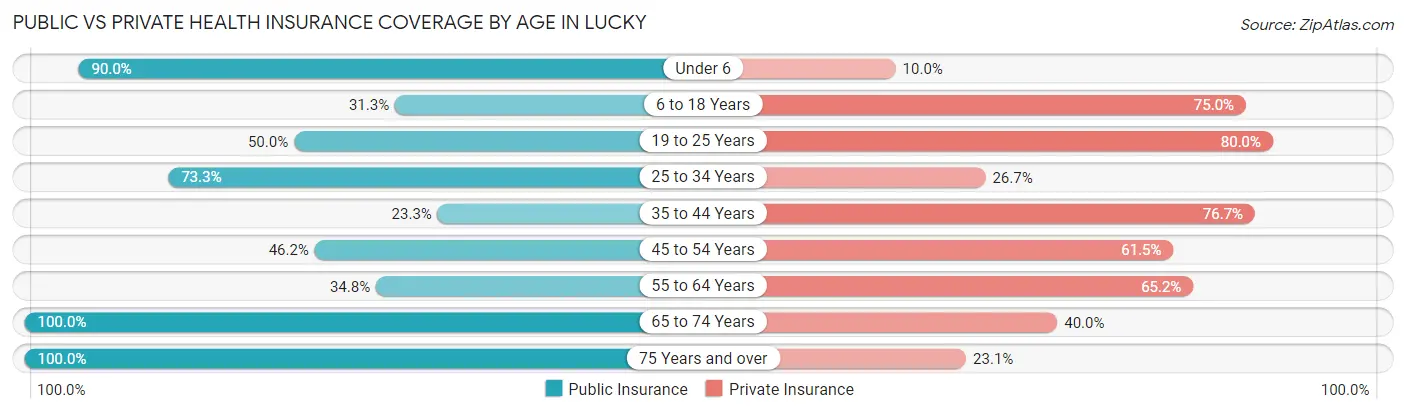
| Age Bracket | Public Insurance | Private Insurance |
| Under 6 | 9 (90.0%) | 1 (10.0%) |
| 6 to 18 Years | 5 (31.2%) | 12 (75.0%) |
| 19 to 25 Years | 5 (50.0%) | 8 (80.0%) |
| 25 to 34 Years | 11 (73.3%) | 4 (26.7%) |
| 35 to 44 Years | 7 (23.3%) | 23 (76.7%) |
| 45 to 54 Years | 6 (46.2%) | 8 (61.5%) |
| 55 to 64 Years | 8 (34.8%) | 15 (65.2%) |
| 65 to 74 Years | 25 (100.0%) | 10 (40.0%) |
| 75 Years and over | 13 (100.0%) | 3 (23.1%) |
| Total | 89 (57.4%) | 84 (54.2%) |
Disability Status by Sex by Age in Lucky
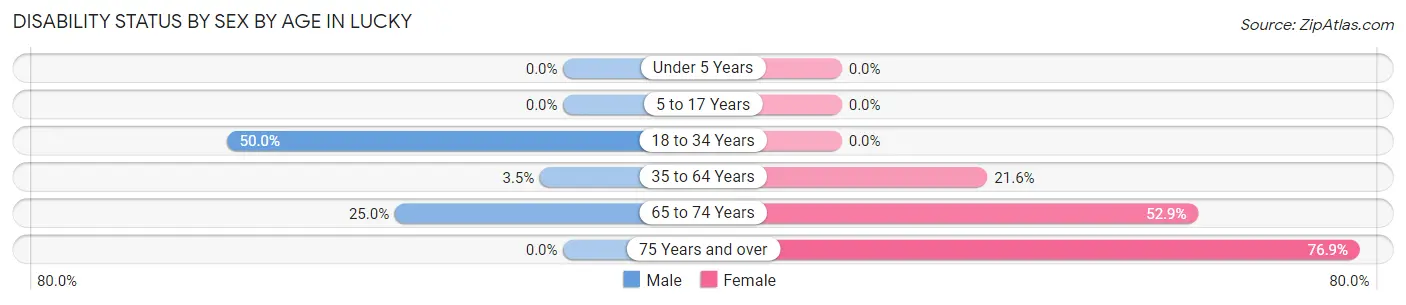
| Age Bracket | Male | Female |
| Under 5 Years | 0 (0.0%) | 0 (0.0%) |
| 5 to 17 Years | 0 (0.0%) | 0 (0.0%) |
| 18 to 34 Years | 8 (50.0%) | 0 (0.0%) |
| 35 to 64 Years | 1 (3.5%) | 8 (21.6%) |
| 65 to 74 Years | 2 (25.0%) | 9 (52.9%) |
| 75 Years and over | 0 (0.0%) | 10 (76.9%) |
Disability Class by Sex by Age in Lucky
Disability Class: Hearing Difficulty
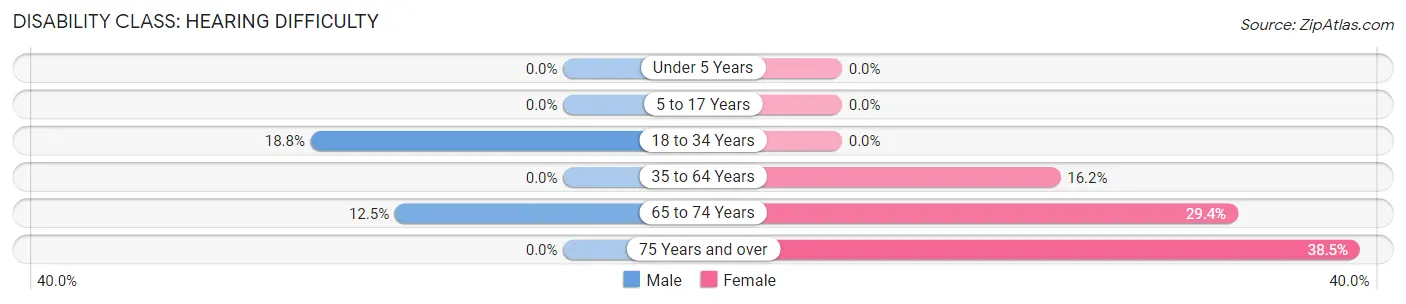
| Age Bracket | Male | Female |
| Under 5 Years | 0 (0.0%) | 0 (0.0%) |
| 5 to 17 Years | 0 (0.0%) | 0 (0.0%) |
| 18 to 34 Years | 3 (18.8%) | 0 (0.0%) |
| 35 to 64 Years | 0 (0.0%) | 6 (16.2%) |
| 65 to 74 Years | 1 (12.5%) | 5 (29.4%) |
| 75 Years and over | 0 (0.0%) | 5 (38.5%) |
Disability Class: Vision Difficulty
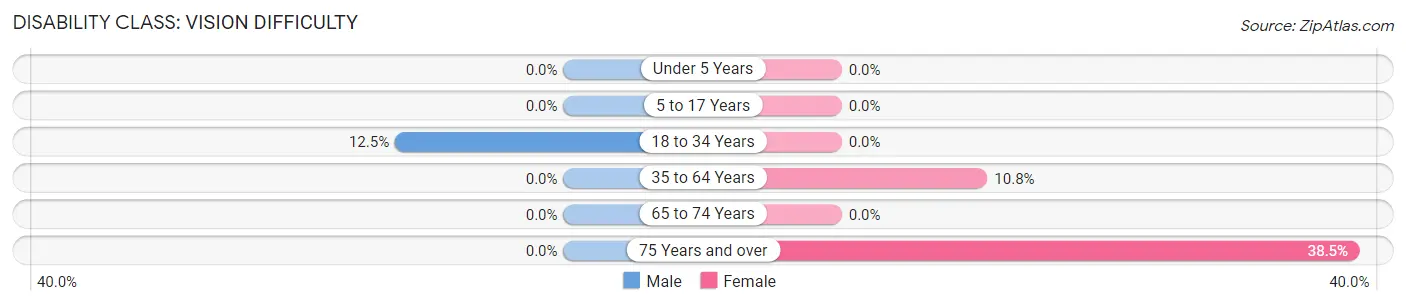
| Age Bracket | Male | Female |
| Under 5 Years | 0 (0.0%) | 0 (0.0%) |
| 5 to 17 Years | 0 (0.0%) | 0 (0.0%) |
| 18 to 34 Years | 2 (12.5%) | 0 (0.0%) |
| 35 to 64 Years | 0 (0.0%) | 4 (10.8%) |
| 65 to 74 Years | 0 (0.0%) | 0 (0.0%) |
| 75 Years and over | 0 (0.0%) | 5 (38.5%) |
Disability Class: Cognitive Difficulty
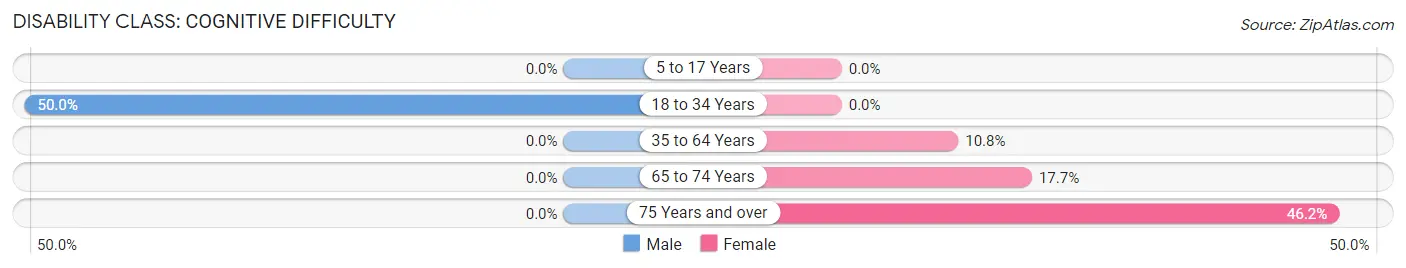
| Age Bracket | Male | Female |
| 5 to 17 Years | 0 (0.0%) | 0 (0.0%) |
| 18 to 34 Years | 8 (50.0%) | 0 (0.0%) |
| 35 to 64 Years | 0 (0.0%) | 4 (10.8%) |
| 65 to 74 Years | 0 (0.0%) | 3 (17.6%) |
| 75 Years and over | 0 (0.0%) | 6 (46.2%) |
Disability Class: Ambulatory Difficulty
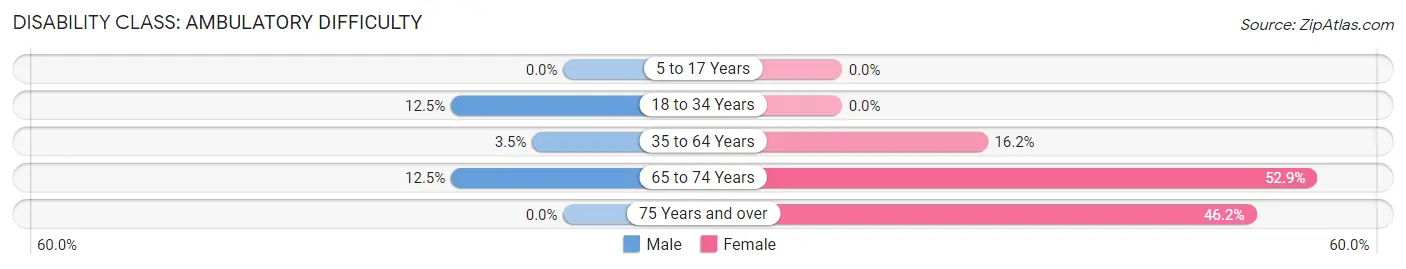
| Age Bracket | Male | Female |
| 5 to 17 Years | 0 (0.0%) | 0 (0.0%) |
| 18 to 34 Years | 2 (12.5%) | 0 (0.0%) |
| 35 to 64 Years | 1 (3.5%) | 6 (16.2%) |
| 65 to 74 Years | 1 (12.5%) | 9 (52.9%) |
| 75 Years and over | 0 (0.0%) | 6 (46.2%) |
Disability Class: Self-Care Difficulty
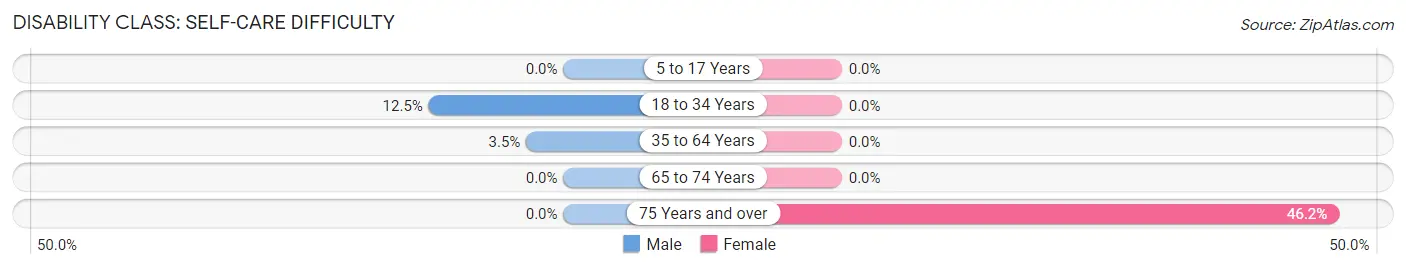
| Age Bracket | Male | Female |
| 5 to 17 Years | 0 (0.0%) | 0 (0.0%) |
| 18 to 34 Years | 2 (12.5%) | 0 (0.0%) |
| 35 to 64 Years | 1 (3.5%) | 0 (0.0%) |
| 65 to 74 Years | 0 (0.0%) | 0 (0.0%) |
| 75 Years and over | 0 (0.0%) | 6 (46.2%) |
Technology Access in Lucky
Computing Device Access in Lucky
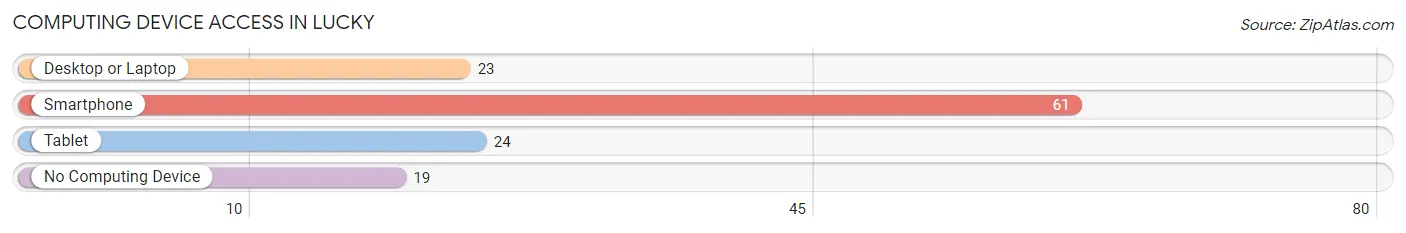
| Device Type | # Households | % Households |
| Desktop or Laptop | 23 | 27.4% |
| Smartphone | 61 | 72.6% |
| Tablet | 24 | 28.6% |
| No Computing Device | 19 | 22.6% |
| Total | 84 | 100.0% |
Internet Access in Lucky
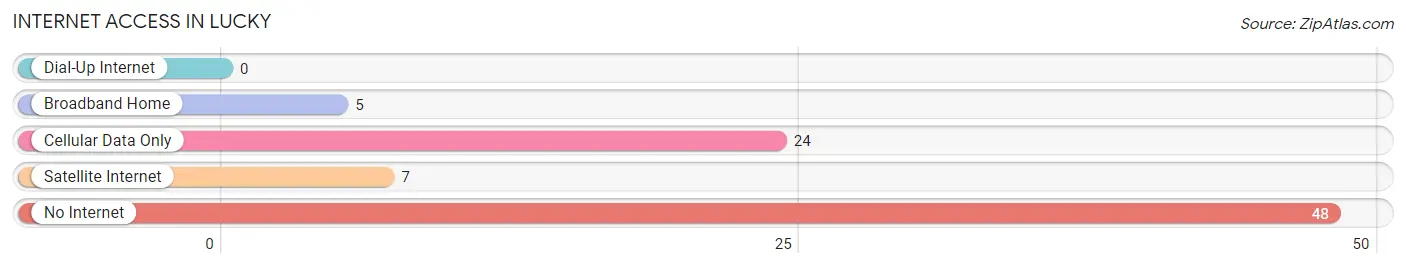
| Internet Type | # Households | % Households |
| Dial-Up Internet | 0 | 0.0% |
| Broadband Home | 5 | 5.9% |
| Cellular Data Only | 24 | 28.6% |
| Satellite Internet | 7 | 8.3% |
| No Internet | 48 | 57.1% |
| Total | 84 | 100.0% |
Lucky Summary
LA History
Los Angeles, or LA, is the second-largest city in the United States and the largest city in California. It is located in the southern part of the state, along the Pacific Ocean. The city was founded in 1781 by Spanish settlers, and it has a long and rich history.
The area that is now Los Angeles was originally inhabited by the Tongva people, who were hunter-gatherers. The Spanish arrived in the area in 1769, and they established the first mission in the area in 1771. The mission was called San Gabriel Arcangel, and it was the first of 21 missions that were established in California.
In 1781, the Spanish founded the city of Los Angeles. The city was named after the Virgin Mary, and it was the first city in California. The city grew quickly, and by the mid-1800s, it was the largest city in California.
In 1848, the United States acquired California from Mexico, and Los Angeles became part of the United States. The city continued to grow, and by the early 1900s, it was the largest city in the state.
In the early 1900s, Los Angeles was a major center of the film industry. The city was home to many of the major studios, and it was the birthplace of the Hollywood movie industry.
In the 1950s and 1960s, Los Angeles experienced a period of rapid growth. The city was transformed from a small city to a major metropolis. The population of the city grew from 1 million in 1950 to 3 million in 1970.
Today, Los Angeles is a major global city. It is home to a diverse population, and it is a major center of business, culture, and entertainment.
Geography
Los Angeles is located in the southern part of California, along the Pacific Ocean. The city is situated in a large basin, and it is surrounded by mountains on three sides. The city is divided into four distinct regions: the San Fernando Valley, the San Gabriel Valley, the Santa Monica Mountains, and the South Bay.
The San Fernando Valley is located in the northern part of the city, and it is home to many of the city’s suburbs. The San Gabriel Valley is located in the eastern part of the city, and it is home to many of the city’s major industries. The Santa Monica Mountains are located in the western part of the city, and they are home to many of the city’s beaches. The South Bay is located in the southern part of the city, and it is home to many of the city’s ports.
Economy
Los Angeles is a major center of business and industry. The city is home to many major corporations, and it is a major center of international trade. The city is also home to many major industries, including aerospace, entertainment, fashion, finance, and technology.
The city is also a major center of tourism. Los Angeles is home to many of the world’s most famous attractions, including Hollywood, Universal Studios, and Disneyland. The city is also home to many of the world’s most famous beaches, including Venice Beach and Santa Monica Beach.
Demographics
Los Angeles is a diverse city. The city is home to people from all over the world, and it is one of the most ethnically diverse cities in the United States. According to the 2010 census, the population of the city was 3,792,621.
The largest ethnic group in the city is Hispanic or Latino, which makes up 48.5% of the population. The second-largest ethnic group is White, which makes up 28.7% of the population. The third-largest ethnic group is Asian, which makes up 11.8% of the population.
Conclusion
Los Angeles is a major global city with a long and rich history. The city is home to a diverse population, and it is a major center of business, culture, and entertainment. The city is also a major center of tourism, and it is home to many of the world’s most famous attractions. Los Angeles is a vibrant and dynamic city, and it is one of the most exciting cities in the world.
Common Questions
What is Per Capita Income in Lucky?
Per Capita income in Lucky is $22,586.
What is the Median Family Income in Lucky?
Median Family Income in Lucky is $41,250.
What is the Median Household income in Lucky?
Median Household Income in Lucky is $22,500.
What is Income or Wage Gap in Lucky?
Income or Wage Gap in Lucky is 55.4%.
Women in Lucky earn 44.6 cents for every dollar earned by a man.
What is Inequality or Gini Index in Lucky?
Inequality or Gini Index in Lucky is 0.49.
What is the Total Population of Lucky?
Total Population of Lucky is 155.
What is the Total Male Population of Lucky?
Total Male Population of Lucky is 71.
What is the Total Female Population of Lucky?
Total Female Population of Lucky is 84.
What is the Ratio of Males per 100 Females in Lucky?
There are 84.52 Males per 100 Females in Lucky.
What is the Ratio of Females per 100 Males in Lucky?
There are 118.31 Females per 100 Males in Lucky.
What is the Median Population Age in Lucky?
Median Population Age in Lucky is 42.6 Years.
What is the Average Family Size in Lucky
Average Family Size in Lucky is 2.9 People.
What is the Average Household Size in Lucky
Average Household Size in Lucky is 1.9 People.
How Large is the Labor Force in Lucky?
There are 65 People in the Labor Forcein in Lucky.
What is the Percentage of People in the Labor Force in Lucky?
46.4% of People are in the Labor Force in Lucky.
What is the Unemployment Rate in Lucky?
Unemployment Rate in Lucky is 3.1%.