Wallace, LA Map & Demographics
Wallace Map
Wallace Overview
$23,877
PER CAPITA INCOME
$78,872
AVG FAMILY INCOME
$71,900
AVG HOUSEHOLD INCOME
0.35
INEQUALITY / GINI INDEX
1,485
TOTAL POPULATION
673
MALE POPULATION
812
FEMALE POPULATION
82.88
MALES / 100 FEMALES
120.65
FEMALES / 100 MALES
34.8
MEDIAN AGE
3.6
AVG FAMILY SIZE
3.3
AVG HOUSEHOLD SIZE
819
LABOR FORCE [ PEOPLE ]
70.4%
PERCENT IN LABOR FORCE
11.7%
UNEMPLOYMENT RATE
Income in Wallace
Income Overview in Wallace
Per Capita Income in Wallace is $23,877, while median incomes of families and households are $78,872 and $71,900 respectively.
| Characteristic | Number | Measure |
| Per Capita Income | 1,485 | $23,877 |
| Median Family Income | 369 | $78,872 |
| Mean Family Income | 369 | $81,353 |
| Median Household Income | 452 | $71,900 |
| Mean Household Income | 452 | $72,293 |
| Income Deficit | 369 | $0 |
| Wage / Income Gap (%) | 1,485 | 0.00% |
| Wage / Income Gap ($) | 1,485 | 100.00¢ per $1 |
| Gini / Inequality Index | 1,485 | 0.35 |
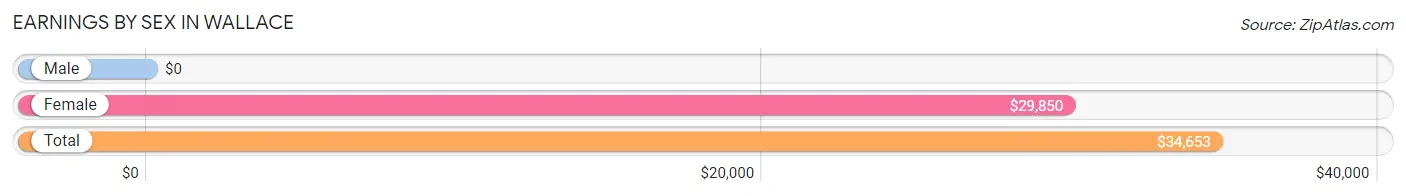
Earnings by Sex in Wallace
| Sex | Number | Average Earnings |
| Male | 345 (47.1%) | $0 |
| Female | 387 (52.9%) | $29,850 |
| Total | 732 (100.0%) | $34,653 |
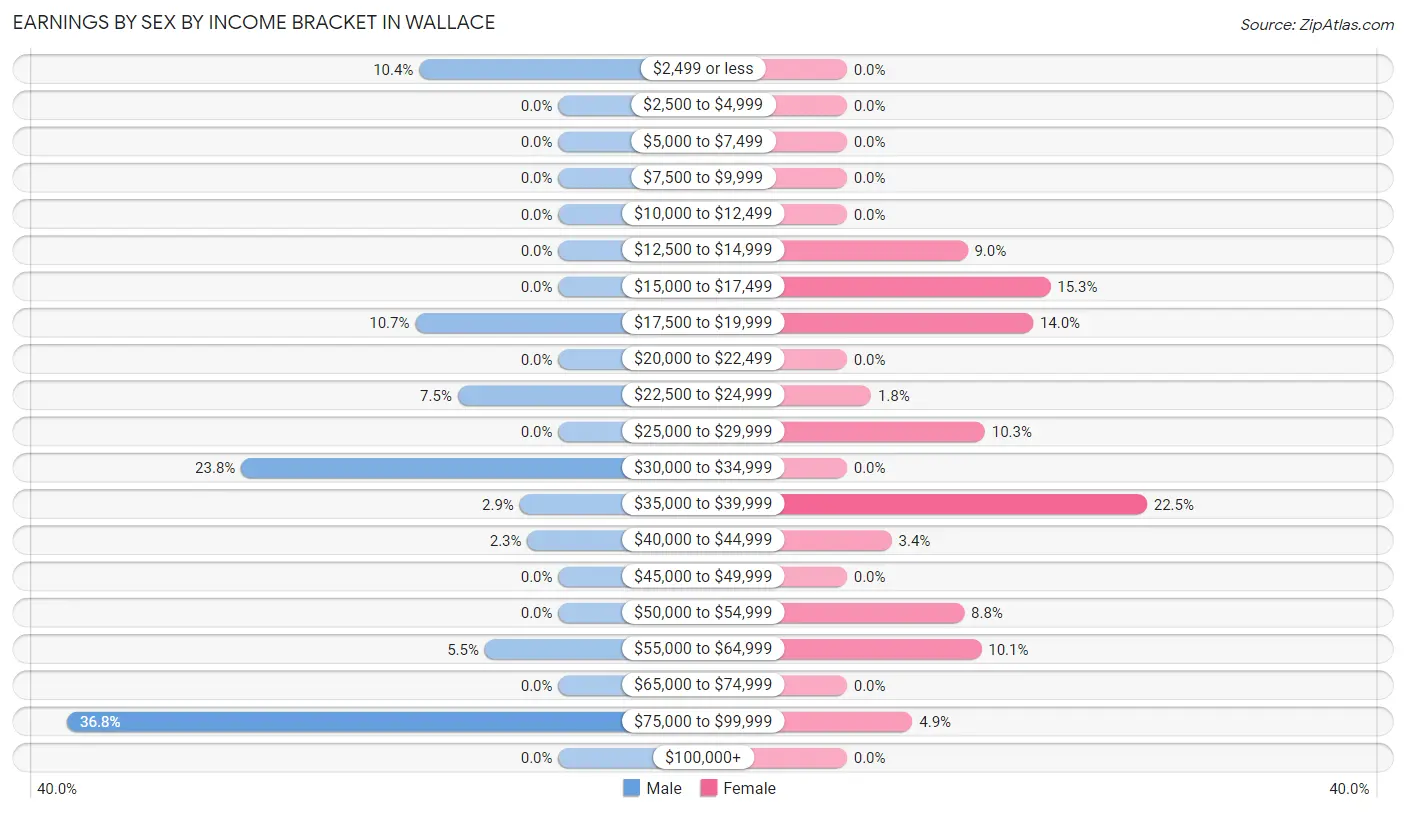
Earnings by Sex by Income Bracket in Wallace
The most common earnings brackets in Wallace are $75,000 to $99,999 for men (127 | 36.8%) and $35,000 to $39,999 for women (87 | 22.5%).
| Income | Male | Female |
| $2,499 or less | 36 (10.4%) | 0 (0.0%) |
| $2,500 to $4,999 | 0 (0.0%) | 0 (0.0%) |
| $5,000 to $7,499 | 0 (0.0%) | 0 (0.0%) |
| $7,500 to $9,999 | 0 (0.0%) | 0 (0.0%) |
| $10,000 to $12,499 | 0 (0.0%) | 0 (0.0%) |
| $12,500 to $14,999 | 0 (0.0%) | 35 (9.0%) |
| $15,000 to $17,499 | 0 (0.0%) | 59 (15.2%) |
| $17,500 to $19,999 | 37 (10.7%) | 54 (14.0%) |
| $20,000 to $22,499 | 0 (0.0%) | 0 (0.0%) |
| $22,500 to $24,999 | 26 (7.5%) | 7 (1.8%) |
| $25,000 to $29,999 | 0 (0.0%) | 40 (10.3%) |
| $30,000 to $34,999 | 82 (23.8%) | 0 (0.0%) |
| $35,000 to $39,999 | 10 (2.9%) | 87 (22.5%) |
| $40,000 to $44,999 | 8 (2.3%) | 13 (3.4%) |
| $45,000 to $49,999 | 0 (0.0%) | 0 (0.0%) |
| $50,000 to $54,999 | 0 (0.0%) | 34 (8.8%) |
| $55,000 to $64,999 | 19 (5.5%) | 39 (10.1%) |
| $65,000 to $74,999 | 0 (0.0%) | 0 (0.0%) |
| $75,000 to $99,999 | 127 (36.8%) | 19 (4.9%) |
| $100,000+ | 0 (0.0%) | 0 (0.0%) |
| Total | 345 (100.0%) | 387 (100.0%) |
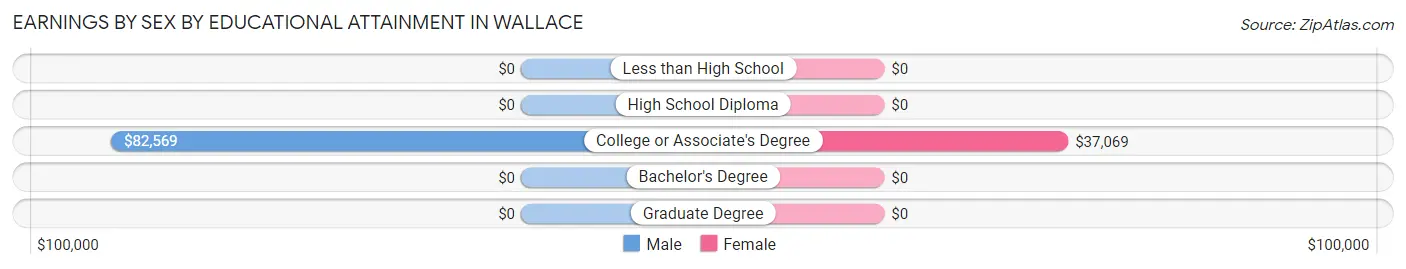
Earnings by Sex by Educational Attainment in Wallace
| Educational Attainment | Male Income | Female Income |
| Less than High School | - | - |
| High School Diploma | - | - |
| College or Associate's Degree | $82,569 | $37,069 |
| Bachelor's Degree | - | - |
| Graduate Degree | - | - |
| Total | - | - |
Family Income in Wallace
Family Income Brackets in Wallace
According to the Wallace family income data, there are 144 families falling into the $100,000 to $149,999 income range, which is the most common income bracket and makes up 39.0% of all families.
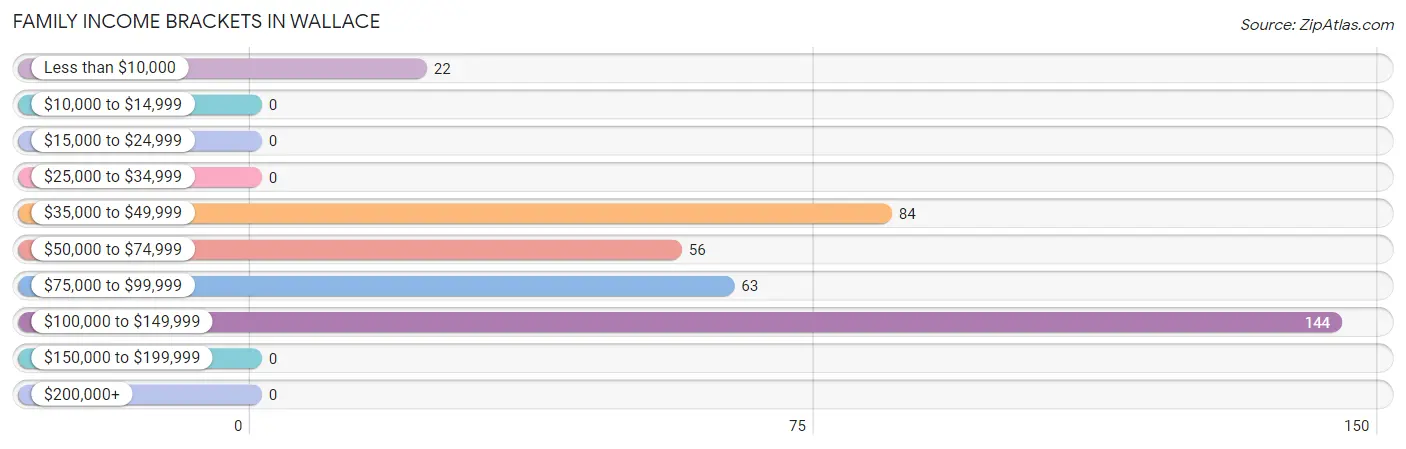
| Income Bracket | # Families | % Families |
| Less than $10,000 | 22 | 6.0% |
| $10,000 to $14,999 | 0 | 0.0% |
| $15,000 to $24,999 | 0 | 0.0% |
| $25,000 to $34,999 | 0 | 0.0% |
| $35,000 to $49,999 | 84 | 22.8% |
| $50,000 to $74,999 | 56 | 15.2% |
| $75,000 to $99,999 | 63 | 17.1% |
| $100,000 to $149,999 | 144 | 39.0% |
| $150,000 to $199,999 | 0 | 0.0% |
| $200,000+ | 0 | 0.0% |
Family Income by Famaliy Size in Wallace
3-person families (110 | 29.8%) account for the highest median family income in Wallace with $101,212 per family, while 2-person families (140 | 37.9%) have the highest median income of $34,688 per family member.
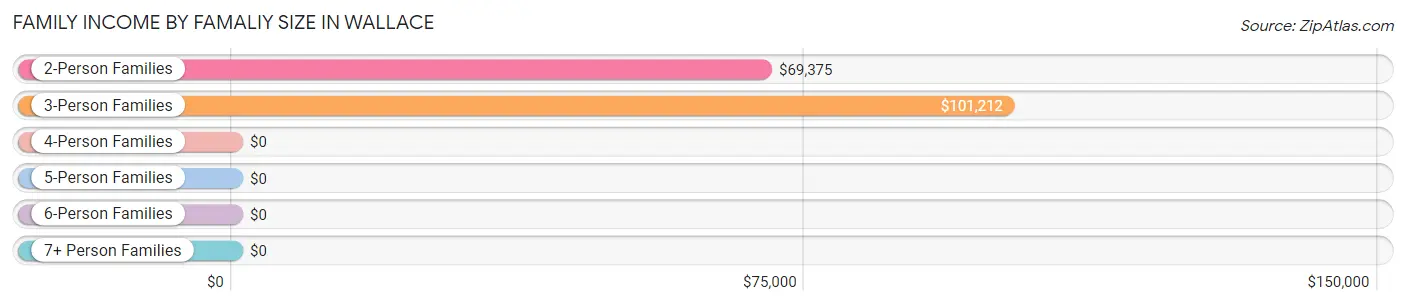
| Income Bracket | # Families | Median Income |
| 2-Person Families | 140 (37.9%) | $69,375 |
| 3-Person Families | 110 (29.8%) | $101,212 |
| 4-Person Families | 78 (21.1%) | $0 |
| 5-Person Families | 41 (11.1%) | $0 |
| 6-Person Families | 0 (0.0%) | $0 |
| 7+ Person Families | 0 (0.0%) | $0 |
| Total | 369 (100.0%) | $78,872 |
Family Income by Number of Earners in Wallace
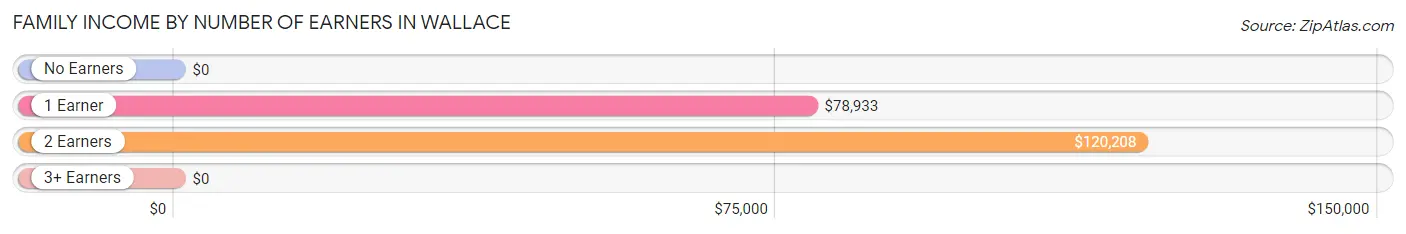
| Number of Earners | # Families | Median Income |
| No Earners | 22 (6.0%) | $0 |
| 1 Earner | 145 (39.3%) | $78,933 |
| 2 Earners | 202 (54.7%) | $120,208 |
| 3+ Earners | 0 (0.0%) | $0 |
| Total | 369 (100.0%) | $78,872 |
Household Income in Wallace
Household Income Brackets in Wallace
With 144 households falling in the category, the $100,000 to $149,999 income range is the most frequent in Wallace, accounting for 31.9% of all households.

| Income Bracket | # Households | % Households |
| Less than $10,000 | 22 | 4.9% |
| $10,000 to $14,999 | 0 | 0.0% |
| $15,000 to $24,999 | 83 | 18.4% |
| $25,000 to $34,999 | 0 | 0.0% |
| $35,000 to $49,999 | 84 | 18.6% |
| $50,000 to $74,999 | 43 | 9.5% |
| $75,000 to $99,999 | 76 | 16.8% |
| $100,000 to $149,999 | 144 | 31.9% |
| $150,000 to $199,999 | 0 | 0.0% |
| $200,000+ | 0 | 0.0% |
Household Income by Householder Age in Wallace
The median household income in Wallace is $71,900, with the highest median household income of $100,227 found in the 45 to 64 years age bracket for the primary householder. A total of 134 households (29.6%) fall into this category. Meanwhile, the 15 to 24 years age bracket for the primary householder has the lowest median household income of $0, with 72 households (15.9%) in this group.
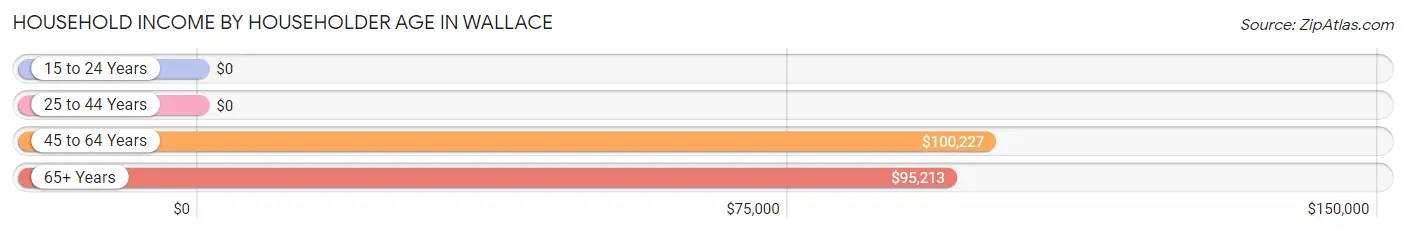
| Income Bracket | # Households | Median Income |
| 15 to 24 Years | 72 (15.9%) | $0 |
| 25 to 44 Years | 171 (37.8%) | $0 |
| 45 to 64 Years | 134 (29.6%) | $100,227 |
| 65+ Years | 75 (16.6%) | $95,213 |
| Total | 452 (100.0%) | $71,900 |
Poverty in Wallace
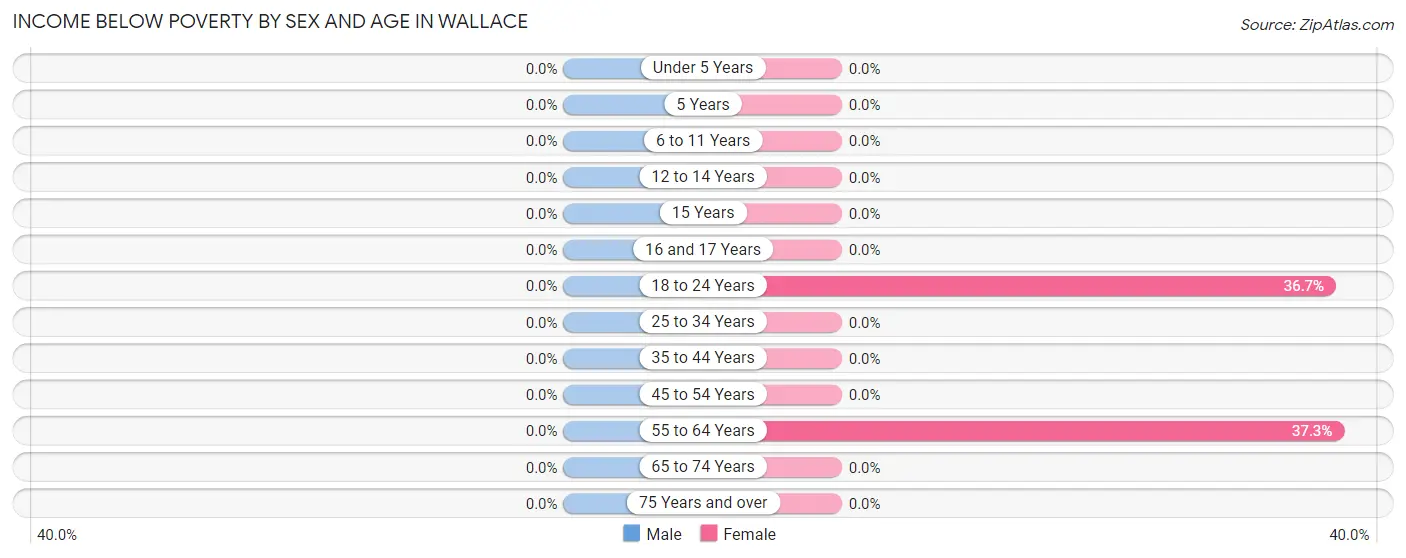
Income Below Poverty by Sex and Age in Wallace
| Age Bracket | Male | Female |
| Under 5 Years | 0 (0.0%) | 0 (0.0%) |
| 5 Years | 0 (0.0%) | 0 (0.0%) |
| 6 to 11 Years | 0 (0.0%) | 0 (0.0%) |
| 12 to 14 Years | 0 (0.0%) | 0 (0.0%) |
| 15 Years | 0 (0.0%) | 0 (0.0%) |
| 16 and 17 Years | 0 (0.0%) | 0 (0.0%) |
| 18 to 24 Years | 0 (0.0%) | 73 (36.7%) |
| 25 to 34 Years | 0 (0.0%) | 0 (0.0%) |
| 35 to 44 Years | 0 (0.0%) | 0 (0.0%) |
| 45 to 54 Years | 0 (0.0%) | 0 (0.0%) |
| 55 to 64 Years | 0 (0.0%) | 22 (37.3%) |
| 65 to 74 Years | 0 (0.0%) | 0 (0.0%) |
| 75 Years and over | 0 (0.0%) | 0 (0.0%) |
| Total | 0 (0.0%) | 95 (11.7%) |
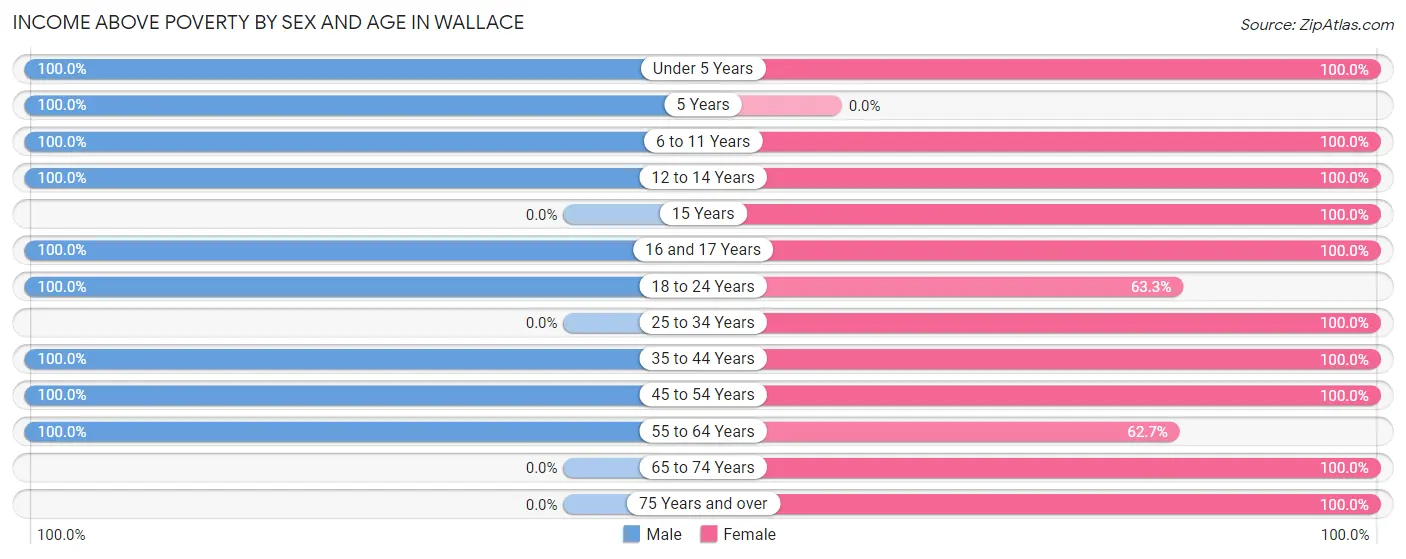
Income Above Poverty by Sex and Age in Wallace
According to the poverty statistics in Wallace, males aged under 5 years and females aged under 5 years are the age groups that are most secure financially, with 100.0% of males and 100.0% of females in these age groups living above the poverty line.
| Age Bracket | Male | Female |
| Under 5 Years | 65 (100.0%) | 44 (100.0%) |
| 5 Years | 52 (100.0%) | 0 (0.0%) |
| 6 to 11 Years | 10 (100.0%) | 63 (100.0%) |
| 12 to 14 Years | 31 (100.0%) | 48 (100.0%) |
| 15 Years | 0 (0.0%) | 8 (100.0%) |
| 16 and 17 Years | 29 (100.0%) | 31 (100.0%) |
| 18 to 24 Years | 53 (100.0%) | 126 (63.3%) |
| 25 to 34 Years | 0 (0.0%) | 119 (100.0%) |
| 35 to 44 Years | 101 (100.0%) | 69 (100.0%) |
| 45 to 54 Years | 202 (100.0%) | 90 (100.0%) |
| 55 to 64 Years | 130 (100.0%) | 37 (62.7%) |
| 65 to 74 Years | 0 (0.0%) | 32 (100.0%) |
| 75 Years and over | 0 (0.0%) | 50 (100.0%) |
| Total | 673 (100.0%) | 717 (88.3%) |
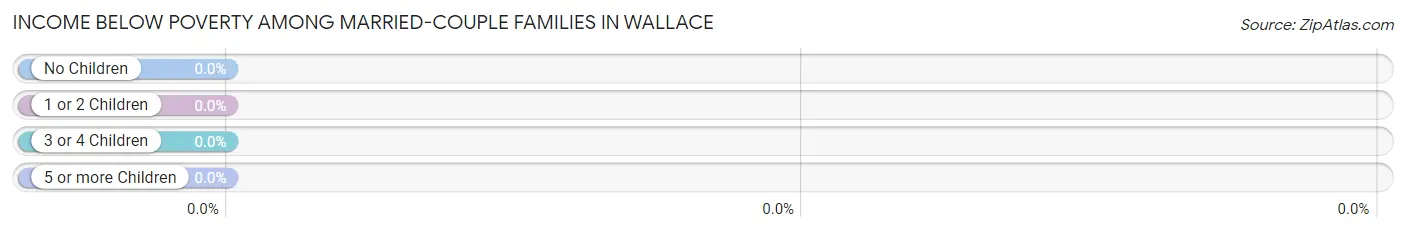
Income Below Poverty Among Married-Couple Families in Wallace
| Children | Above Poverty | Below Poverty |
| No Children | 51 (100.0%) | 0 (0.0%) |
| 1 or 2 Children | 159 (100.0%) | 0 (0.0%) |
| 3 or 4 Children | 0 (0.0%) | 0 (0.0%) |
| 5 or more Children | 0 (0.0%) | 0 (0.0%) |
| Total | 210 (100.0%) | 0 (0.0%) |
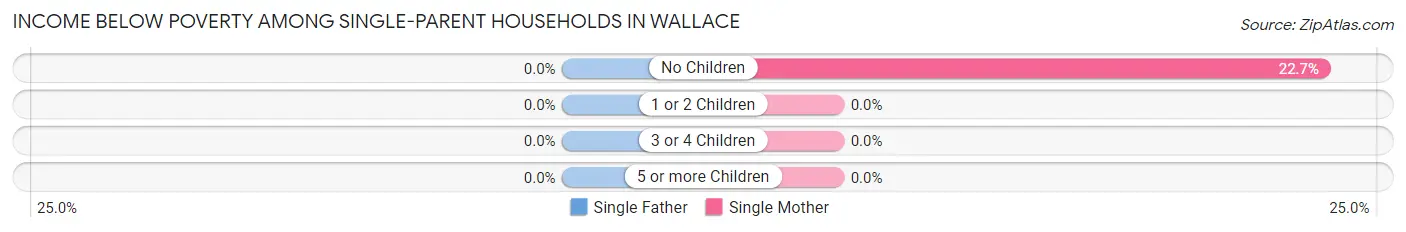
Income Below Poverty Among Single-Parent Households in Wallace
| Children | Single Father | Single Mother |
| No Children | 0 (0.0%) | 22 (22.7%) |
| 1 or 2 Children | 0 (0.0%) | 0 (0.0%) |
| 3 or 4 Children | 0 (0.0%) | 0 (0.0%) |
| 5 or more Children | 0 (0.0%) | 0 (0.0%) |
| Total | 0 (0.0%) | 22 (13.8%) |
Income Below Poverty Among Married-Couple vs Single-Parent Households in Wallace
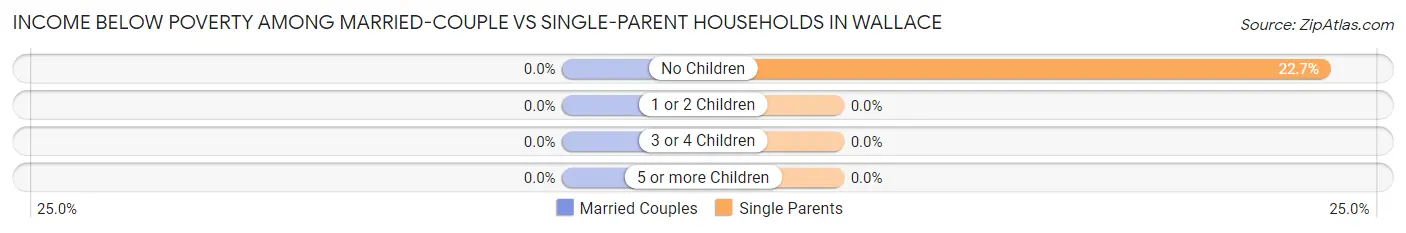
| Children | Married-Couple Families | Single-Parent Households |
| No Children | 0 (0.0%) | 22 (22.7%) |
| 1 or 2 Children | 0 (0.0%) | 0 (0.0%) |
| 3 or 4 Children | 0 (0.0%) | 0 (0.0%) |
| 5 or more Children | 0 (0.0%) | 0 (0.0%) |
| Total | 0 (0.0%) | 22 (13.8%) |
Race in Wallace
The most populous races in Wallace are Black / African American (1,381 | 93.0%), Hispanic or Latino (97 | 6.5%), and Two or more Races (84 | 5.7%).
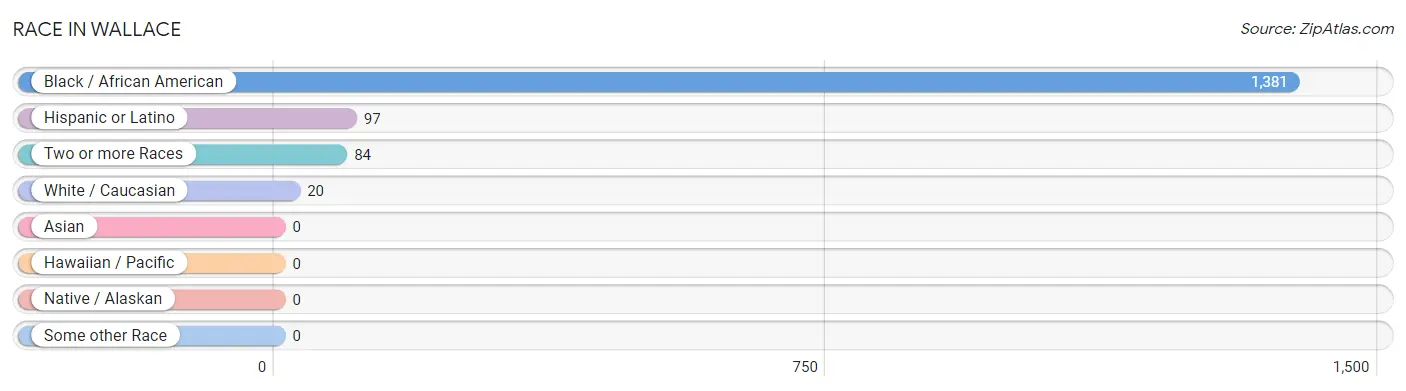
| Race | # Population | % Population |
| Asian | 0 | 0.0% |
| Black / African American | 1,381 | 93.0% |
| Hawaiian / Pacific | 0 | 0.0% |
| Hispanic or Latino | 97 | 6.5% |
| Native / Alaskan | 0 | 0.0% |
| White / Caucasian | 20 | 1.3% |
| Two or more Races | 84 | 5.7% |
| Some other Race | 0 | 0.0% |
| Total | 1,485 | 100.0% |
Ancestry in Wallace
The most populous ancestries reported in Wallace are Puerto Rican (84 | 5.7%), Mexican (13 | 0.9%), and German (6 | 0.4%), together accounting for 6.9% of all Wallace residents.
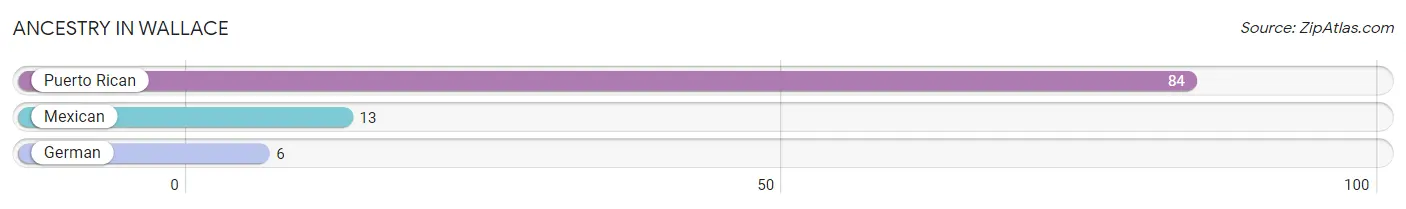
| Ancestry | # Population | % Population |
| German | 6 | 0.4% |
| Mexican | 13 | 0.9% |
| Puerto Rican | 84 | 5.7% | View All 3 Rows |
Immigrants in Wallace

| Immigration Origin | # Population | % Population | View All 0 Rows |
Sex and Age in Wallace
Sex and Age in Wallace
The most populous age groups in Wallace are 45 to 49 Years (115 | 17.1%) for men and 15 to 19 Years (133 | 16.4%) for women.
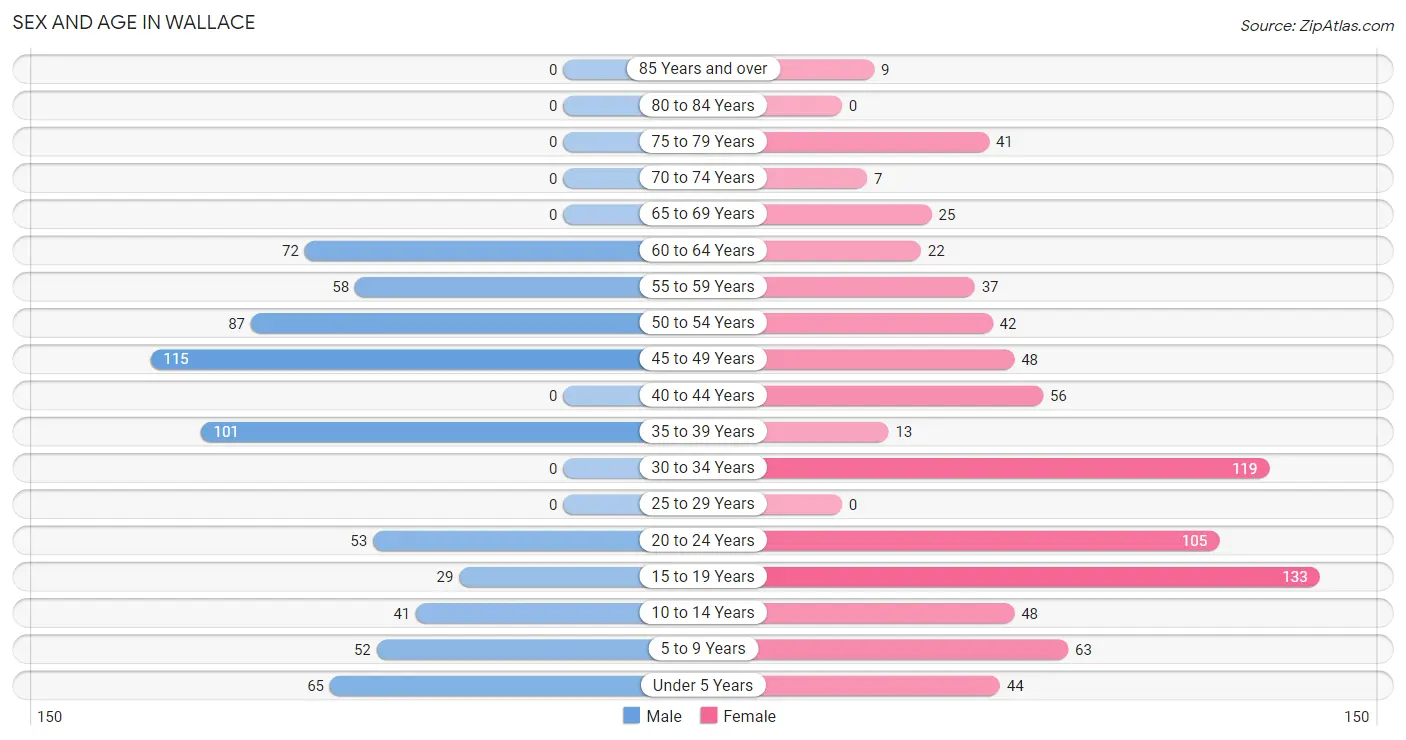
| Age Bracket | Male | Female |
| Under 5 Years | 65 (9.7%) | 44 (5.4%) |
| 5 to 9 Years | 52 (7.7%) | 63 (7.8%) |
| 10 to 14 Years | 41 (6.1%) | 48 (5.9%) |
| 15 to 19 Years | 29 (4.3%) | 133 (16.4%) |
| 20 to 24 Years | 53 (7.9%) | 105 (12.9%) |
| 25 to 29 Years | 0 (0.0%) | 0 (0.0%) |
| 30 to 34 Years | 0 (0.0%) | 119 (14.7%) |
| 35 to 39 Years | 101 (15.0%) | 13 (1.6%) |
| 40 to 44 Years | 0 (0.0%) | 56 (6.9%) |
| 45 to 49 Years | 115 (17.1%) | 48 (5.9%) |
| 50 to 54 Years | 87 (12.9%) | 42 (5.2%) |
| 55 to 59 Years | 58 (8.6%) | 37 (4.6%) |
| 60 to 64 Years | 72 (10.7%) | 22 (2.7%) |
| 65 to 69 Years | 0 (0.0%) | 25 (3.1%) |
| 70 to 74 Years | 0 (0.0%) | 7 (0.9%) |
| 75 to 79 Years | 0 (0.0%) | 41 (5.1%) |
| 80 to 84 Years | 0 (0.0%) | 0 (0.0%) |
| 85 Years and over | 0 (0.0%) | 9 (1.1%) |
| Total | 673 (100.0%) | 812 (100.0%) |
Families and Households in Wallace
Median Family Size in Wallace
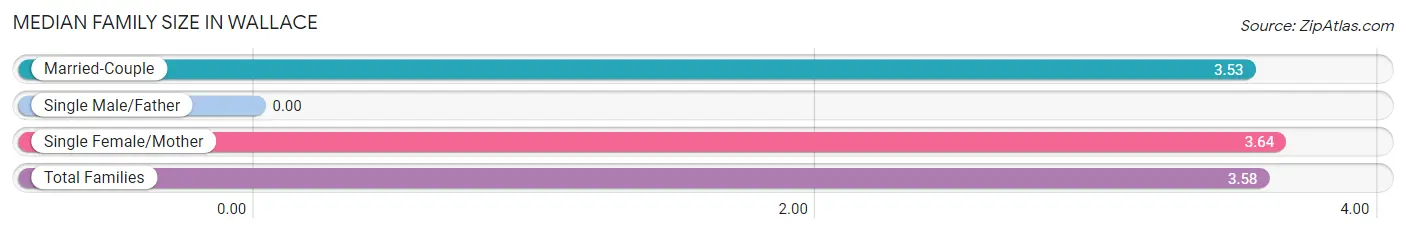
| Family Type | # Families | Family Size |
| Married-Couple | 210 (56.9%) | 3.53 |
| Single Male/Father | 0 (0.0%) | - |
| Single Female/Mother | 159 (43.1%) | 3.64 |
| Total Families | 369 (100.0%) | 3.58 |
Median Household Size in Wallace
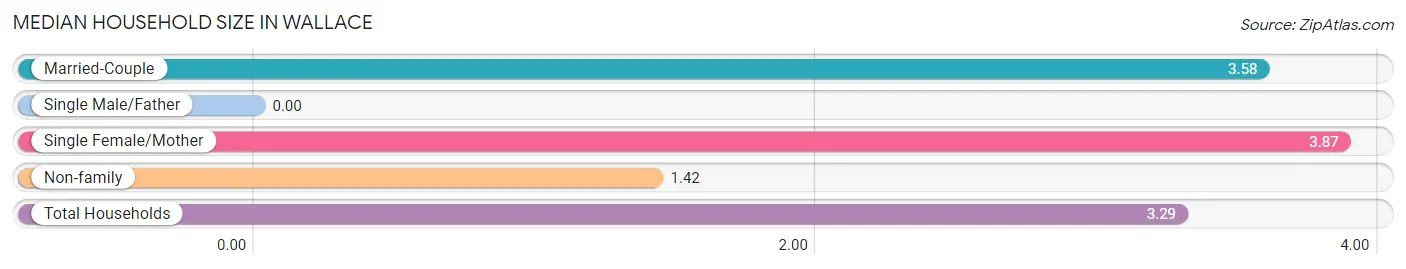
| Household Type | # Households | Household Size |
| Married-Couple | 210 (46.5%) | 3.58 |
| Single Male/Father | 0 (0.0%) | - |
| Single Female/Mother | 159 (35.2%) | 3.87 |
| Non-family | 83 (18.4%) | 1.42 |
| Total Households | 452 (100.0%) | 3.29 |
Household Size by Marriage Status in Wallace
Out of a total of 452 households in Wallace, 369 (81.6%) are family households, while 83 (18.4%) are nonfamily households. The most numerous type of family households are 2-person households, comprising 127, and the most common type of nonfamily households are 2-person households, comprising 59.
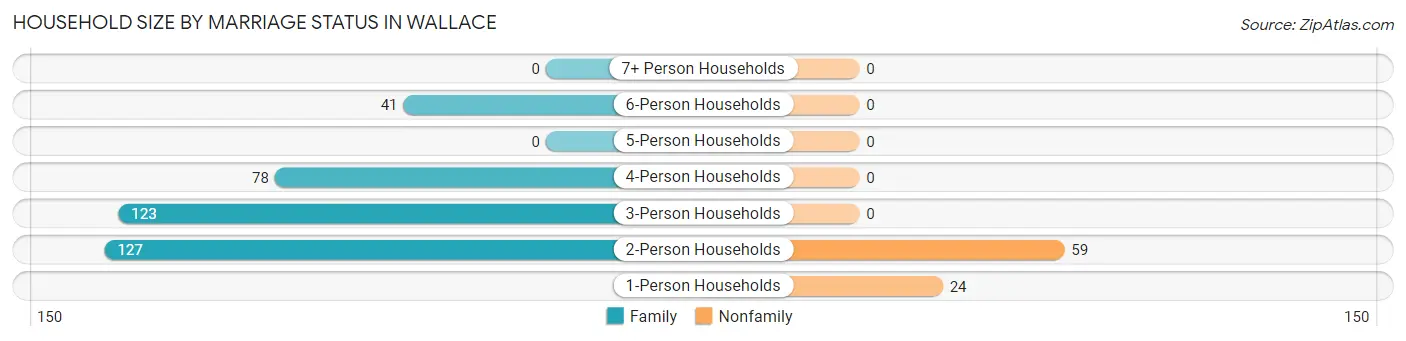
| Household Size | Family Households | Nonfamily Households |
| 1-Person Households | - | 24 (5.3%) |
| 2-Person Households | 127 (28.1%) | 59 (13.1%) |
| 3-Person Households | 123 (27.2%) | 0 (0.0%) |
| 4-Person Households | 78 (17.3%) | 0 (0.0%) |
| 5-Person Households | 0 (0.0%) | 0 (0.0%) |
| 6-Person Households | 41 (9.1%) | 0 (0.0%) |
| 7+ Person Households | 0 (0.0%) | 0 (0.0%) |
| Total | 369 (81.6%) | 83 (18.4%) |
Female Fertility in Wallace
Fertility by Age in Wallace
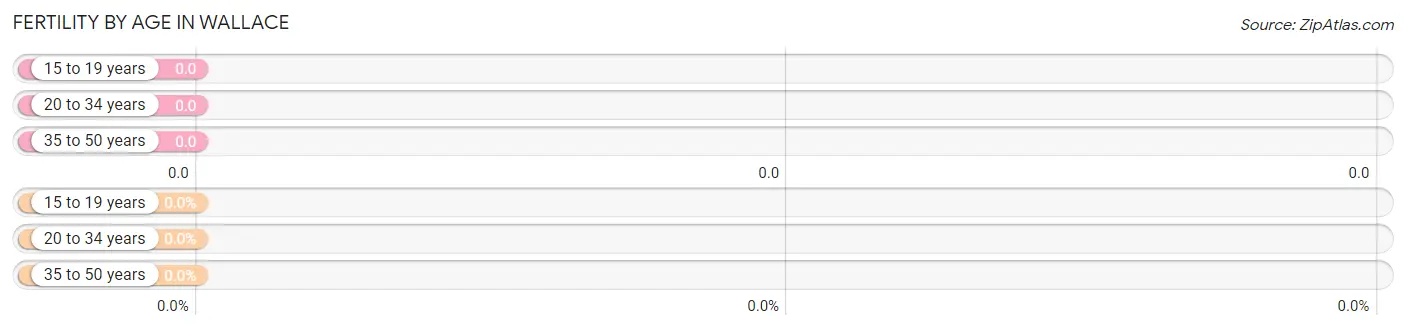
| Age Bracket | Women with Births | Births / 1,000 Women |
| 15 to 19 years | 0 (0.0%) | 0.0 |
| 20 to 34 years | 0 (0.0%) | 0.0 |
| 35 to 50 years | 0 (0.0%) | 0.0 |
| Total | 0 (0.0%) | 0.0 |
Fertility by Age by Marriage Status in Wallace
| Age Bracket | Married | Unmarried |
| 15 to 19 years | 0 (0.0%) | 0 (0.0%) |
| 20 to 34 years | 0 (0.0%) | 0 (0.0%) |
| 35 to 50 years | 0 (0.0%) | 0 (0.0%) |
| Total | 0 (0.0%) | 0 (0.0%) |
Fertility by Education in Wallace
| Educational Attainment | Women with Births | Births / 1,000 Women |
| Less than High School | 0 (0.0%) | 0.0 |
| High School Diploma | 0 (0.0%) | 0.0 |
| College or Associate's Degree | 0 (0.0%) | 0.0 |
| Bachelor's Degree | 0 (0.0%) | 0.0 |
| Graduate Degree | 0 (0.0%) | 0.0 |
| Total | 0 (0.0%) | 0.0 |
Fertility by Education by Marriage Status in Wallace
| Educational Attainment | Married | Unmarried |
| Less than High School | 0 (0.0%) | 0 (0.0%) |
| High School Diploma | 0 (0.0%) | 0 (0.0%) |
| College or Associate's Degree | 0 (0.0%) | 0 (0.0%) |
| Bachelor's Degree | 0 (0.0%) | 0 (0.0%) |
| Graduate Degree | 0 (0.0%) | 0 (0.0%) |
| Total | 0 (0.0%) | 0 (0.0%) |
Employment Characteristics in Wallace
Employment by Class of Employer in Wallace
Among the 704 employed individuals in Wallace, private company employees (565 | 80.3%), local government employees (101 | 14.3%), and state government employees (25 | 3.5%) make up the most common classes of employment.
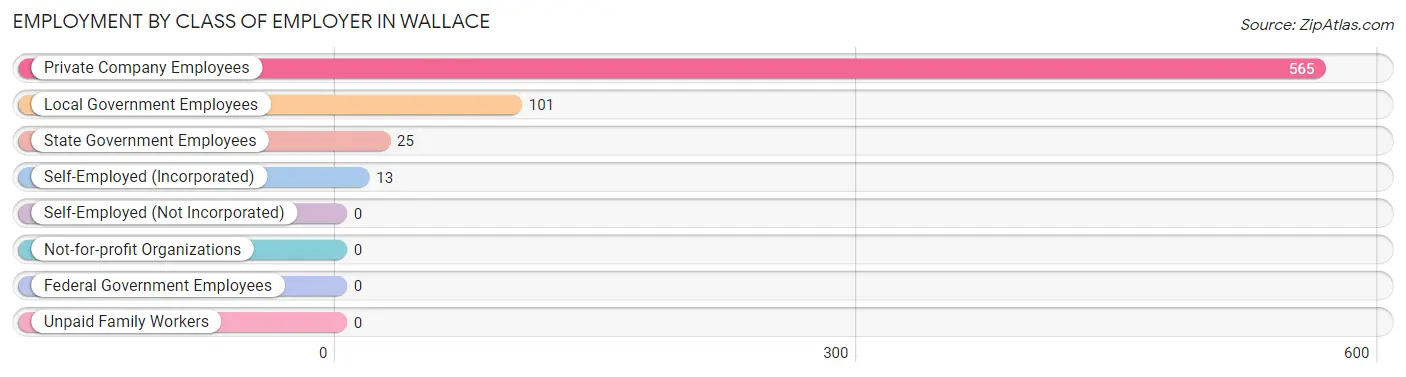
| Employer Class | # Employees | % Employees |
| Private Company Employees | 565 | 80.3% |
| Self-Employed (Incorporated) | 13 | 1.8% |
| Self-Employed (Not Incorporated) | 0 | 0.0% |
| Not-for-profit Organizations | 0 | 0.0% |
| Local Government Employees | 101 | 14.3% |
| State Government Employees | 25 | 3.5% |
| Federal Government Employees | 0 | 0.0% |
| Unpaid Family Workers | 0 | 0.0% |
| Total | 704 | 100.0% |
Employment Status by Age in Wallace
According to the labor force statistics for Wallace, out of the total population over 16 years of age (1,164), 70.4% or 819 individuals are in the labor force, with 11.7% or 96 of them unemployed. The age group with the highest labor force participation rate is 20 to 24 years, with 100.0% or 158 individuals in the labor force. Within the labor force, the 16 to 19 years age range has the highest percentage of unemployed individuals, with 49.6% or 58 of them being unemployed.
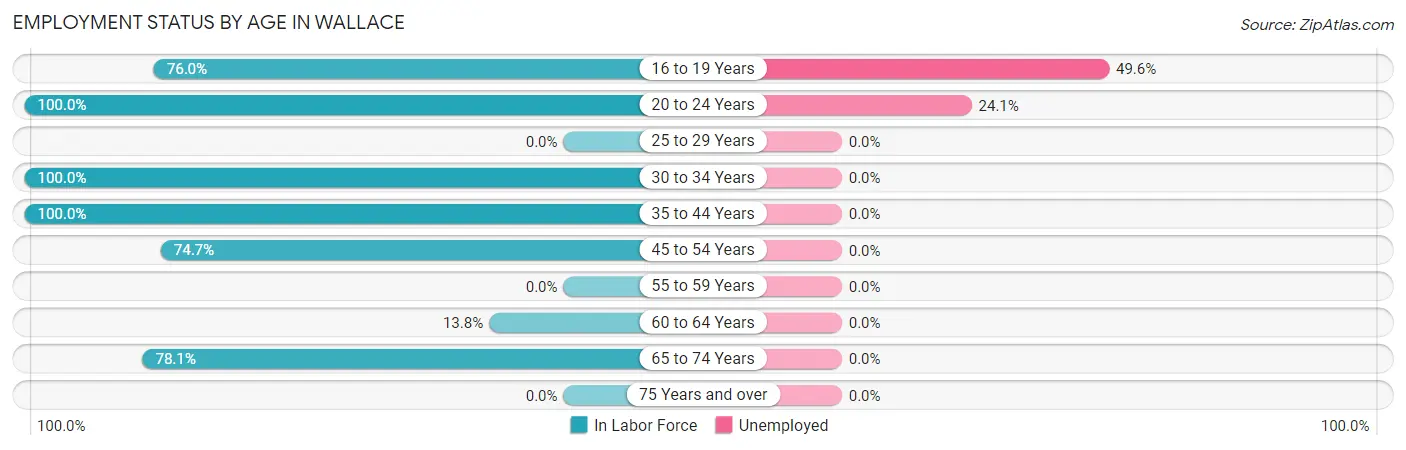
| Age Bracket | In Labor Force | Unemployed |
| 16 to 19 Years | 117 (76.0%) | 58 (49.6%) |
| 20 to 24 Years | 158 (100.0%) | 38 (24.1%) |
| 25 to 29 Years | 0 (0.0%) | 0 (0.0%) |
| 30 to 34 Years | 119 (100.0%) | 0 (0.0%) |
| 35 to 44 Years | 170 (100.0%) | 0 (0.0%) |
| 45 to 54 Years | 218 (74.7%) | 0 (0.0%) |
| 55 to 59 Years | 0 (0.0%) | 0 (0.0%) |
| 60 to 64 Years | 13 (13.8%) | 0 (0.0%) |
| 65 to 74 Years | 25 (78.1%) | 0 (0.0%) |
| 75 Years and over | 0 (0.0%) | 0 (0.0%) |
| Total | 819 (70.4%) | 96 (11.7%) |
Employment Status by Educational Attainment in Wallace
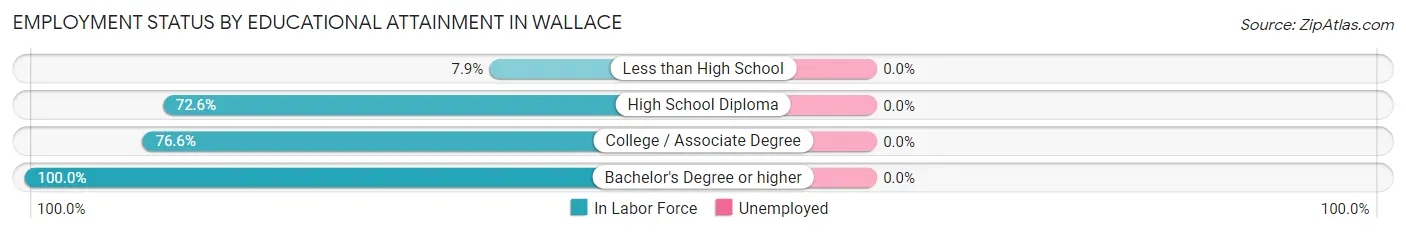
| Educational Attainment | In Labor Force | Unemployed |
| Less than High School | 10 (7.9%) | 0 (0.0%) |
| High School Diploma | 183 (72.6%) | 0 (0.0%) |
| College / Associate Degree | 210 (76.6%) | 0 (0.0%) |
| Bachelor's Degree or higher | 117 (100.0%) | 0 (0.0%) |
| Total | 520 (67.5%) | 0 (0.0%) |
Employment Occupations by Sex in Wallace
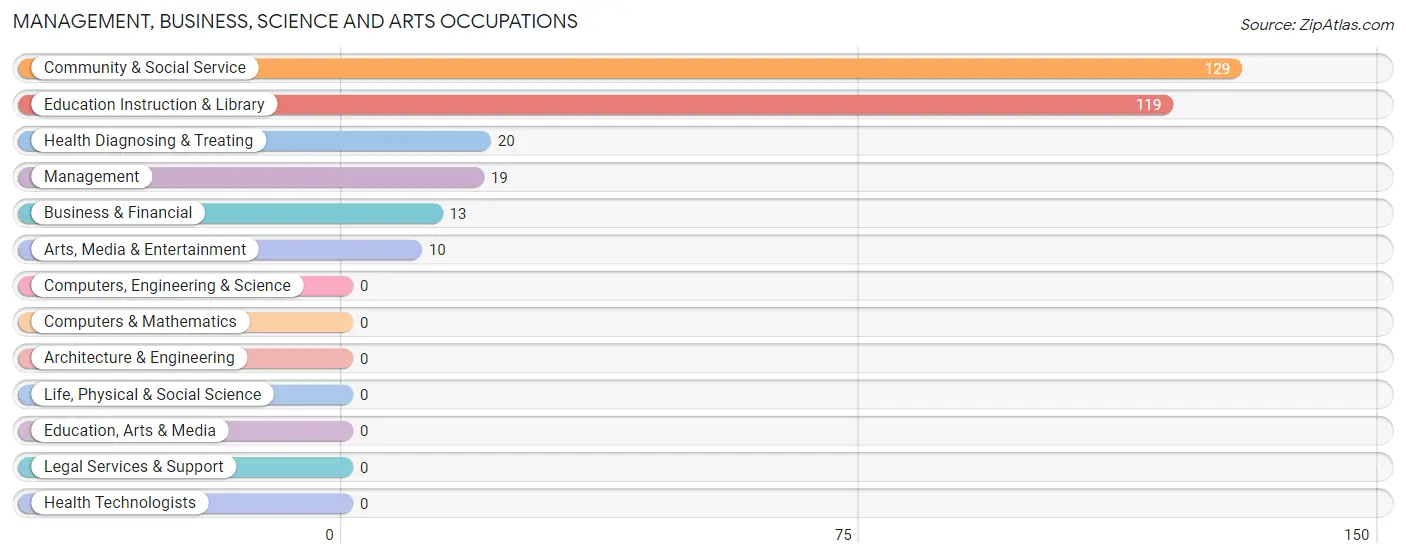
Management, Business, Science and Arts Occupations
The most common Management, Business, Science and Arts occupations in Wallace are Community & Social Service (129 | 17.8%), Education Instruction & Library (119 | 16.4%), Health Diagnosing & Treating (20 | 2.8%), Management (19 | 2.6%), and Business & Financial (13 | 1.8%).
Management, Business, Science and Arts Occupations by Sex
Within the Management, Business, Science and Arts occupations in Wallace, the most male-oriented occupations are Business & Financial (100.0%), Arts, Media & Entertainment (100.0%), and Community & Social Service (63.6%), while the most female-oriented occupations are Management (100.0%), Health Diagnosing & Treating (100.0%), and Education Instruction & Library (39.5%).
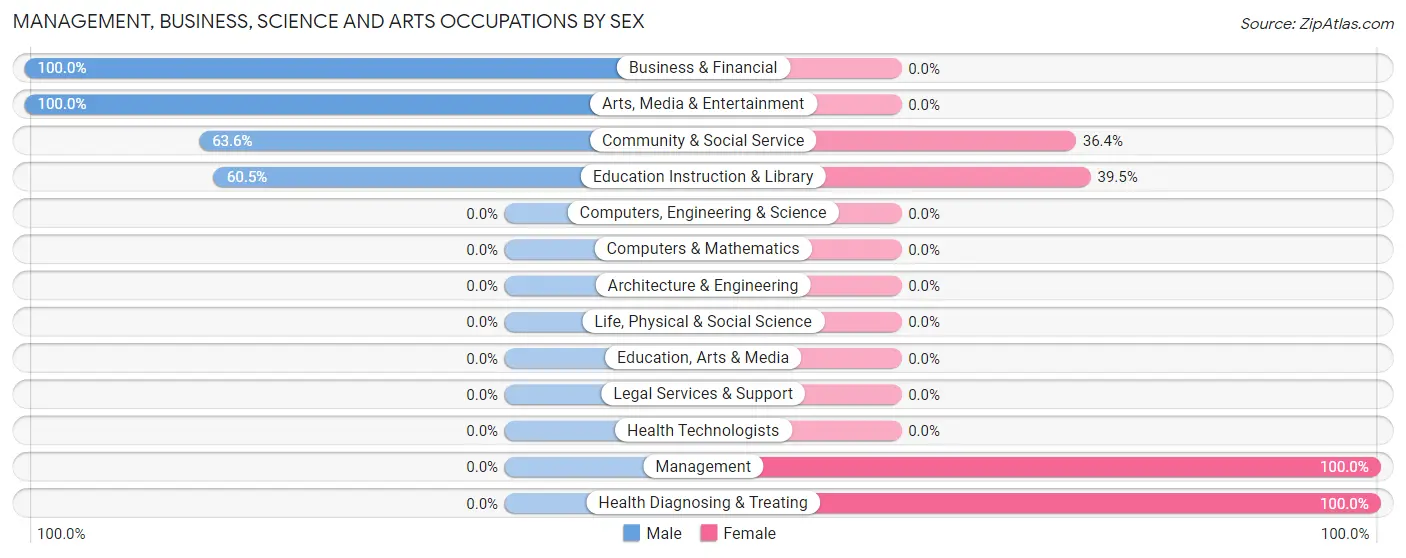
| Occupation | Male | Female |
| Management | 0 (0.0%) | 19 (100.0%) |
| Business & Financial | 13 (100.0%) | 0 (0.0%) |
| Computers, Engineering & Science | 0 (0.0%) | 0 (0.0%) |
| Computers & Mathematics | 0 (0.0%) | 0 (0.0%) |
| Architecture & Engineering | 0 (0.0%) | 0 (0.0%) |
| Life, Physical & Social Science | 0 (0.0%) | 0 (0.0%) |
| Community & Social Service | 82 (63.6%) | 47 (36.4%) |
| Education, Arts & Media | 0 (0.0%) | 0 (0.0%) |
| Legal Services & Support | 0 (0.0%) | 0 (0.0%) |
| Education Instruction & Library | 72 (60.5%) | 47 (39.5%) |
| Arts, Media & Entertainment | 10 (100.0%) | 0 (0.0%) |
| Health Diagnosing & Treating | 0 (0.0%) | 20 (100.0%) |
| Health Technologists | 0 (0.0%) | 0 (0.0%) |
| Total (Category) | 95 (52.5%) | 86 (47.5%) |
| Total (Overall) | 337 (46.6%) | 387 (53.4%) |
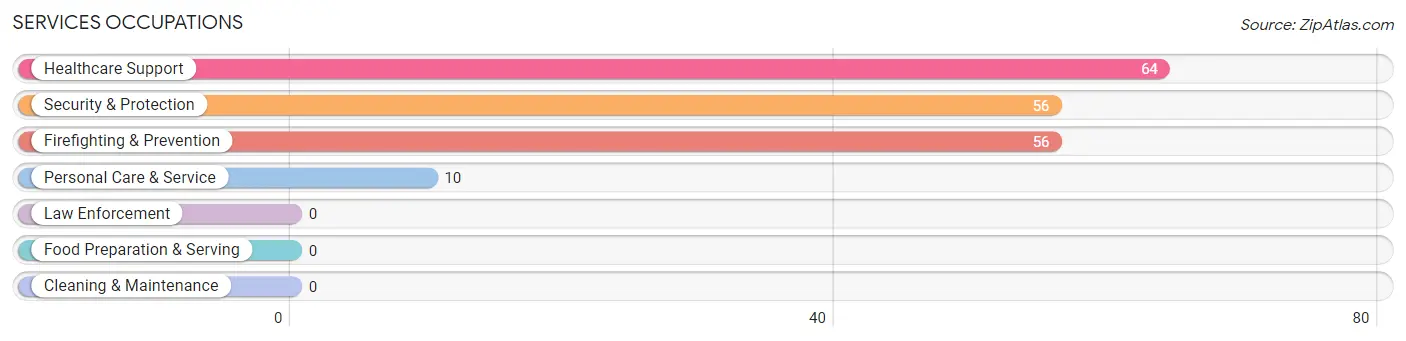
Services Occupations
The most common Services occupations in Wallace are Healthcare Support (64 | 8.8%), Security & Protection (56 | 7.7%), Firefighting & Prevention (56 | 7.7%), and Personal Care & Service (10 | 1.4%).
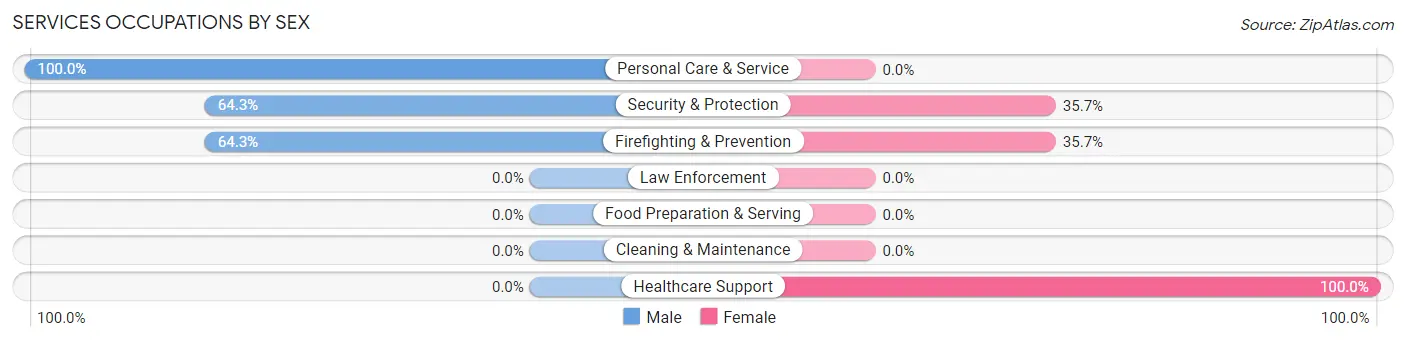
Services Occupations by Sex
Within the Services occupations in Wallace, the most male-oriented occupations are Personal Care & Service (100.0%), Security & Protection (64.3%), and Firefighting & Prevention (64.3%), while the most female-oriented occupations are Healthcare Support (100.0%), Security & Protection (35.7%), and Firefighting & Prevention (35.7%).
| Occupation | Male | Female |
| Healthcare Support | 0 (0.0%) | 64 (100.0%) |
| Security & Protection | 36 (64.3%) | 20 (35.7%) |
| Firefighting & Prevention | 36 (64.3%) | 20 (35.7%) |
| Law Enforcement | 0 (0.0%) | 0 (0.0%) |
| Food Preparation & Serving | 0 (0.0%) | 0 (0.0%) |
| Cleaning & Maintenance | 0 (0.0%) | 0 (0.0%) |
| Personal Care & Service | 10 (100.0%) | 0 (0.0%) |
| Total (Category) | 46 (35.4%) | 84 (64.6%) |
| Total (Overall) | 337 (46.6%) | 387 (53.4%) |
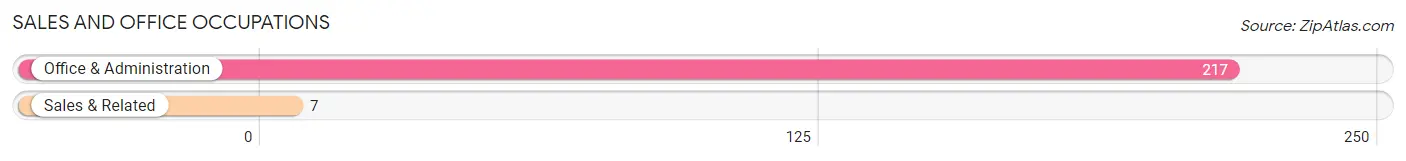
Sales and Office Occupations
The most common Sales and Office occupations in Wallace are Office & Administration (217 | 30.0%), and Sales & Related (7 | 1.0%).
Sales and Office Occupations by Sex

| Occupation | Male | Female |
| Sales & Related | 7 (100.0%) | 0 (0.0%) |
| Office & Administration | 0 (0.0%) | 217 (100.0%) |
| Total (Category) | 7 (3.1%) | 217 (96.9%) |
| Total (Overall) | 337 (46.6%) | 387 (53.4%) |
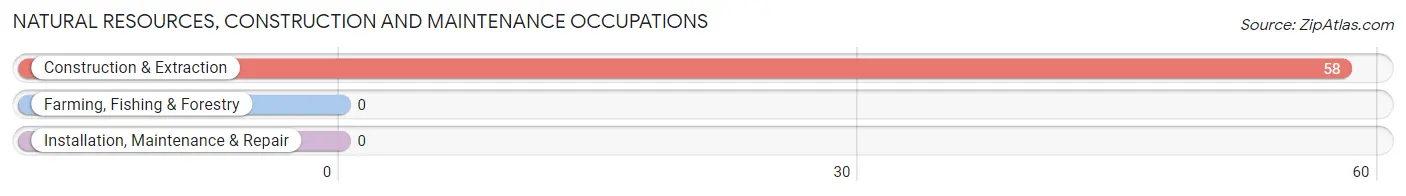
Natural Resources, Construction and Maintenance Occupations
The most common Natural Resources, Construction and Maintenance occupations in Wallace are , and Construction & Extraction (58 | 8.0%).
Natural Resources, Construction and Maintenance Occupations by Sex
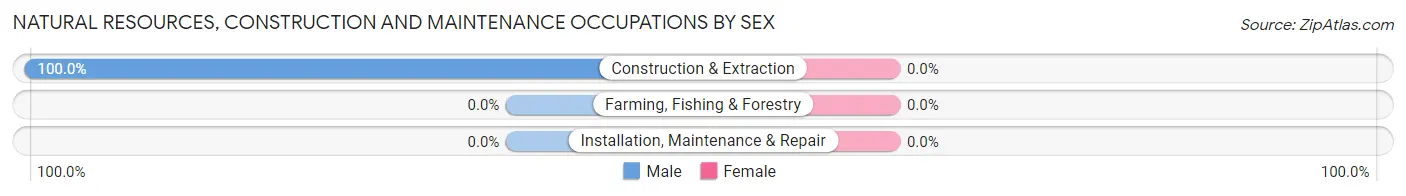
| Occupation | Male | Female |
| Farming, Fishing & Forestry | 0 (0.0%) | 0 (0.0%) |
| Construction & Extraction | 58 (100.0%) | 0 (0.0%) |
| Installation, Maintenance & Repair | 0 (0.0%) | 0 (0.0%) |
| Total (Category) | 58 (100.0%) | 0 (0.0%) |
| Total (Overall) | 337 (46.6%) | 387 (53.4%) |
Production, Transportation and Moving Occupations
The most common Production, Transportation and Moving occupations in Wallace are Production (66 | 9.1%), and Material Moving (65 | 9.0%).
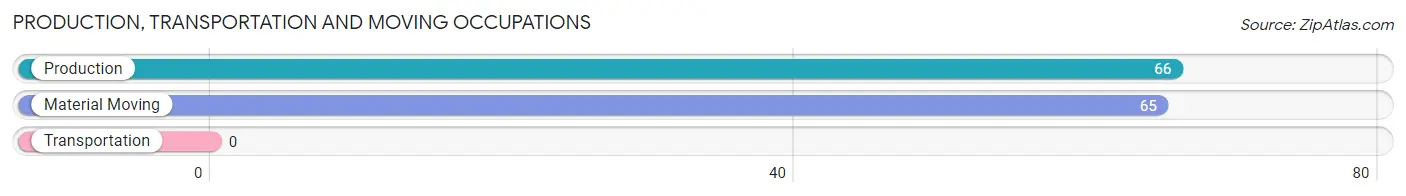
Production, Transportation and Moving Occupations by Sex
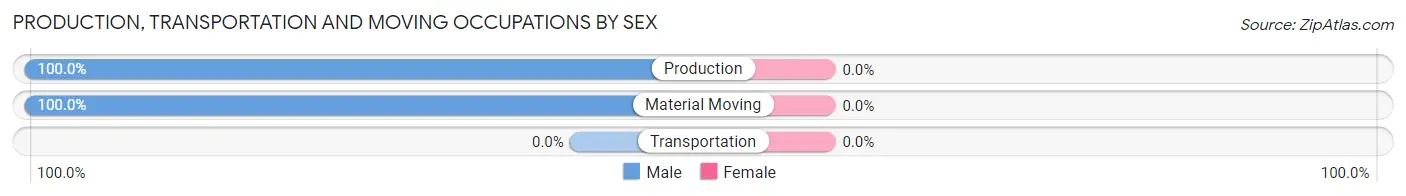
| Occupation | Male | Female |
| Production | 66 (100.0%) | 0 (0.0%) |
| Transportation | 0 (0.0%) | 0 (0.0%) |
| Material Moving | 65 (100.0%) | 0 (0.0%) |
| Total (Category) | 131 (100.0%) | 0 (0.0%) |
| Total (Overall) | 337 (46.6%) | 387 (53.4%) |
Employment Industries by Sex in Wallace
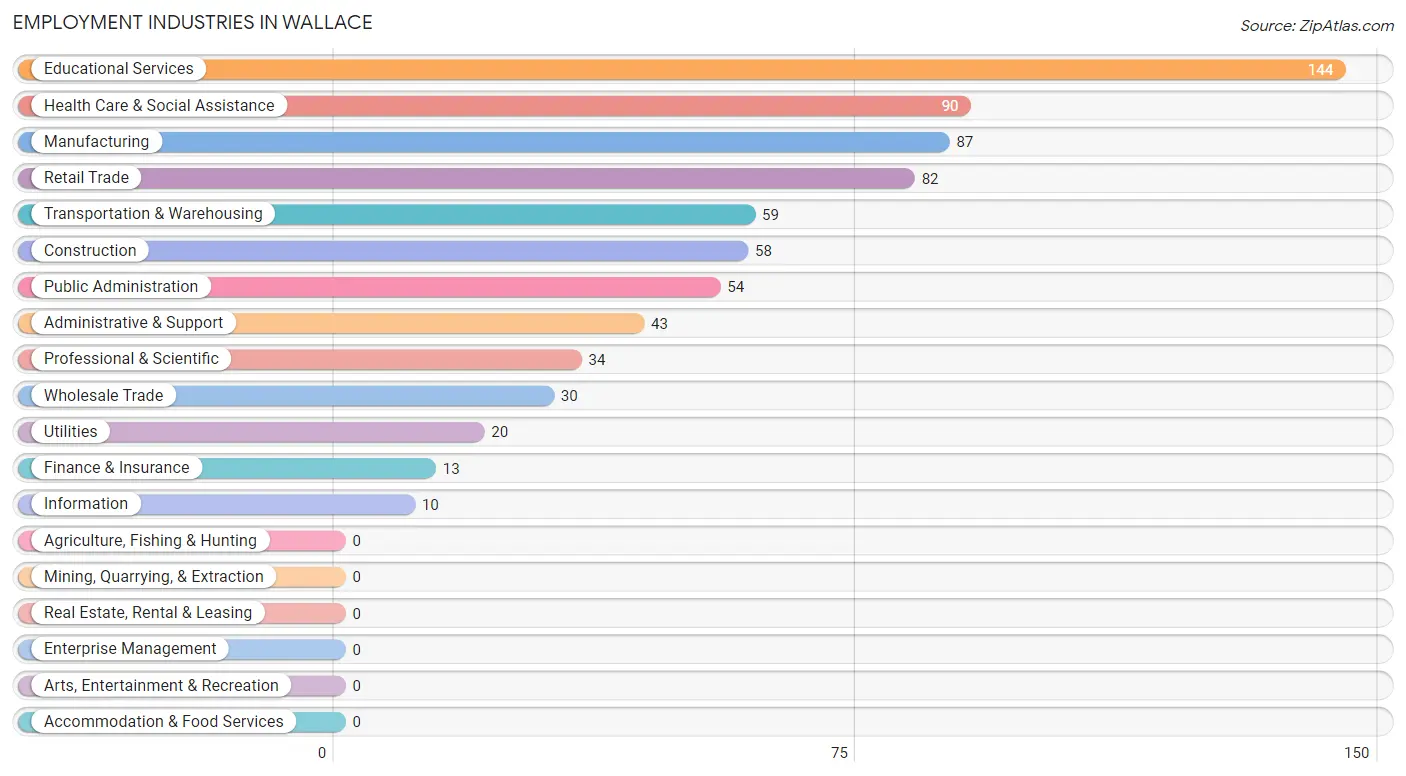
Employment Industries in Wallace
The major employment industries in Wallace include Educational Services (144 | 19.9%), Health Care & Social Assistance (90 | 12.4%), Manufacturing (87 | 12.0%), Retail Trade (82 | 11.3%), and Transportation & Warehousing (59 | 8.2%).
Employment Industries by Sex in Wallace
The Wallace industries that see more men than women are Construction (100.0%), Wholesale Trade (100.0%), and Information (100.0%), whereas the industries that tend to have a higher number of women are Transportation & Warehousing (100.0%), Utilities (100.0%), and Professional & Scientific (100.0%).
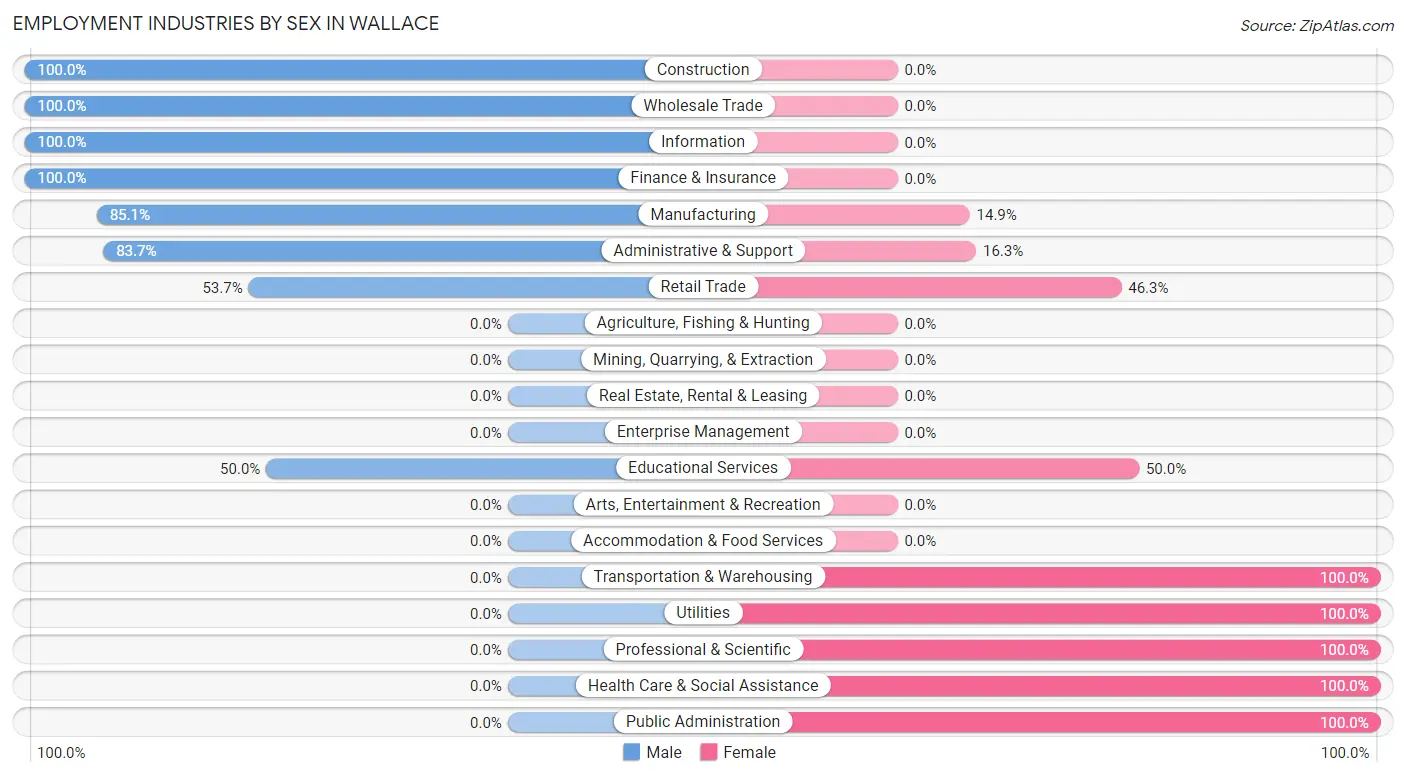
| Industry | Male | Female |
| Agriculture, Fishing & Hunting | 0 (0.0%) | 0 (0.0%) |
| Mining, Quarrying, & Extraction | 0 (0.0%) | 0 (0.0%) |
| Construction | 58 (100.0%) | 0 (0.0%) |
| Manufacturing | 74 (85.1%) | 13 (14.9%) |
| Wholesale Trade | 30 (100.0%) | 0 (0.0%) |
| Retail Trade | 44 (53.7%) | 38 (46.3%) |
| Transportation & Warehousing | 0 (0.0%) | 59 (100.0%) |
| Utilities | 0 (0.0%) | 20 (100.0%) |
| Information | 10 (100.0%) | 0 (0.0%) |
| Finance & Insurance | 13 (100.0%) | 0 (0.0%) |
| Real Estate, Rental & Leasing | 0 (0.0%) | 0 (0.0%) |
| Professional & Scientific | 0 (0.0%) | 34 (100.0%) |
| Enterprise Management | 0 (0.0%) | 0 (0.0%) |
| Administrative & Support | 36 (83.7%) | 7 (16.3%) |
| Educational Services | 72 (50.0%) | 72 (50.0%) |
| Health Care & Social Assistance | 0 (0.0%) | 90 (100.0%) |
| Arts, Entertainment & Recreation | 0 (0.0%) | 0 (0.0%) |
| Accommodation & Food Services | 0 (0.0%) | 0 (0.0%) |
| Public Administration | 0 (0.0%) | 54 (100.0%) |
| Total | 337 (46.6%) | 387 (53.4%) |
Education in Wallace
School Enrollment in Wallace
The most common levels of schooling among the 471 students in Wallace are college / undergraduate (129 | 27.4%), middle school (89 | 18.9%), and nursery / preschool (70 | 14.9%).
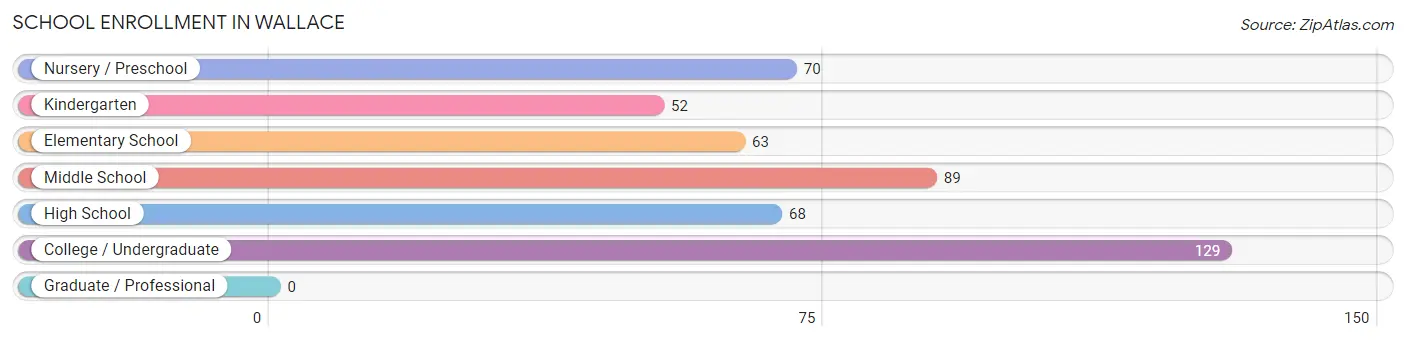
| School Level | # Students | % Students |
| Nursery / Preschool | 70 | 14.9% |
| Kindergarten | 52 | 11.0% |
| Elementary School | 63 | 13.4% |
| Middle School | 89 | 18.9% |
| High School | 68 | 14.4% |
| College / Undergraduate | 129 | 27.4% |
| Graduate / Professional | 0 | 0.0% |
| Total | 471 | 100.0% |
School Enrollment by Age by Funding Source in Wallace
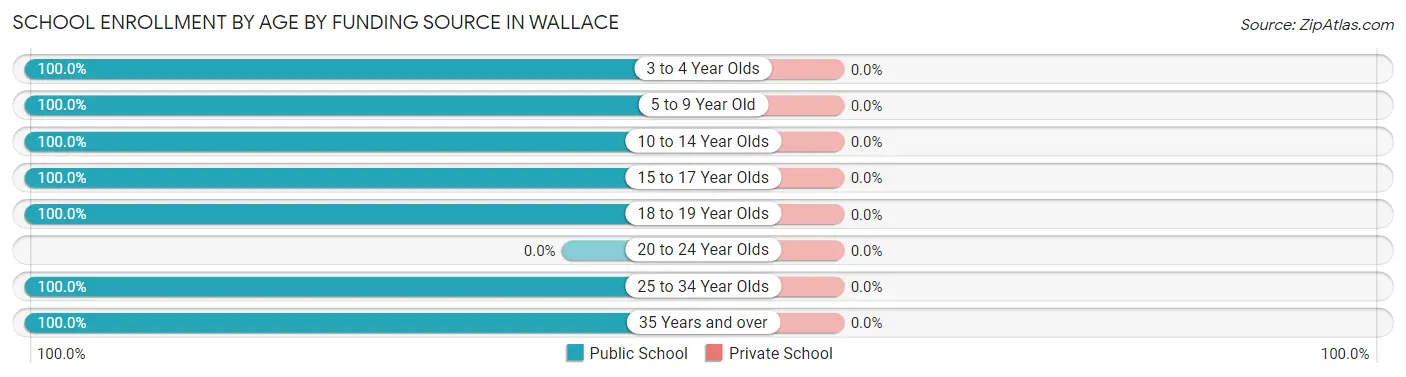
| Age Bracket | Public School | Private School |
| 3 to 4 Year Olds | 70 (100.0%) | 0 (0.0%) |
| 5 to 9 Year Old | 115 (100.0%) | 0 (0.0%) |
| 10 to 14 Year Olds | 89 (100.0%) | 0 (0.0%) |
| 15 to 17 Year Olds | 68 (100.0%) | 0 (0.0%) |
| 18 to 19 Year Olds | 94 (100.0%) | 0 (0.0%) |
| 20 to 24 Year Olds | 0 (0.0%) | 0 (0.0%) |
| 25 to 34 Year Olds | 20 (100.0%) | 0 (0.0%) |
| 35 Years and over | 15 (100.0%) | 0 (0.0%) |
| Total | 471 (100.0%) | 0 (0.0%) |
Educational Attainment by Field of Study in Wallace
Business (72 | 50.7%), visual & performing arts (32 | 22.5%), science & technology (25 | 17.6%), and education (13 | 9.1%) are the most common fields of study among 142 individuals in Wallace who have obtained a bachelor's degree or higher.
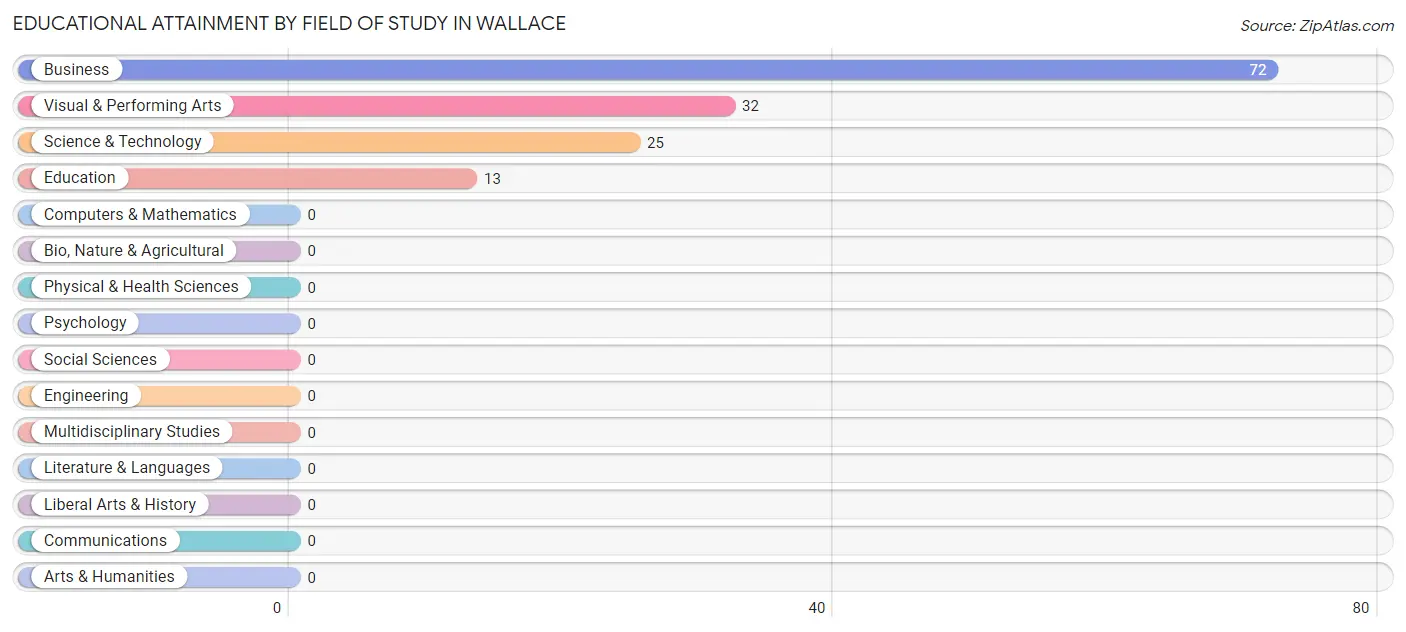
| Field of Study | # Graduates | % Graduates |
| Computers & Mathematics | 0 | 0.0% |
| Bio, Nature & Agricultural | 0 | 0.0% |
| Physical & Health Sciences | 0 | 0.0% |
| Psychology | 0 | 0.0% |
| Social Sciences | 0 | 0.0% |
| Engineering | 0 | 0.0% |
| Multidisciplinary Studies | 0 | 0.0% |
| Science & Technology | 25 | 17.6% |
| Business | 72 | 50.7% |
| Education | 13 | 9.1% |
| Literature & Languages | 0 | 0.0% |
| Liberal Arts & History | 0 | 0.0% |
| Visual & Performing Arts | 32 | 22.5% |
| Communications | 0 | 0.0% |
| Arts & Humanities | 0 | 0.0% |
| Total | 142 | 100.0% |
Transportation & Commute in Wallace
Vehicle Availability by Sex in Wallace
The most prevalent vehicle ownership categories in Wallace are males with 2 vehicles (133, accounting for 39.5%) and females with 2 vehicles (185, making up 36.2%).
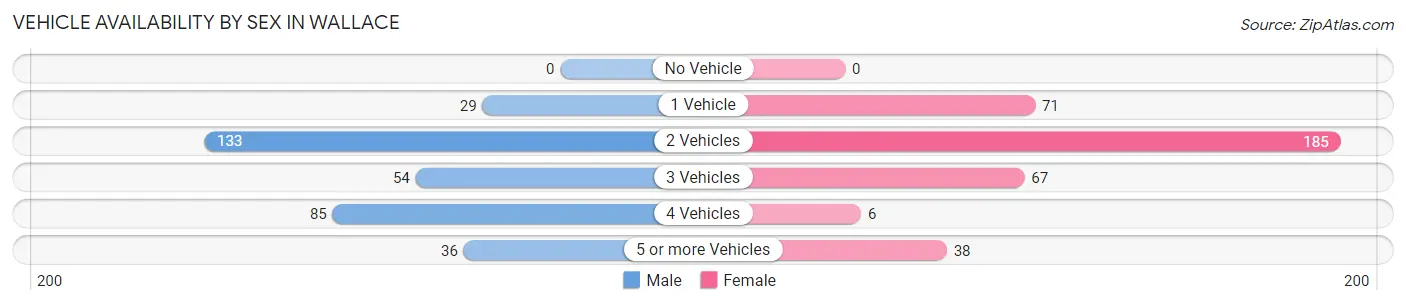
| Vehicles Available | Male | Female |
| No Vehicle | 0 (0.0%) | 0 (0.0%) |
| 1 Vehicle | 29 (8.6%) | 71 (19.4%) |
| 2 Vehicles | 133 (39.5%) | 185 (50.4%) |
| 3 Vehicles | 54 (16.0%) | 67 (18.3%) |
| 4 Vehicles | 85 (25.2%) | 6 (1.6%) |
| 5 or more Vehicles | 36 (10.7%) | 38 (10.3%) |
| Total | 337 (100.0%) | 367 (100.0%) |
Commute Time in Wallace
The most frequently occuring commute durations in Wallace are 30 to 34 minutes (240 commuters, 35.6%), 45 to 59 minutes (172 commuters, 25.5%), and 15 to 19 minutes (101 commuters, 15.0%).
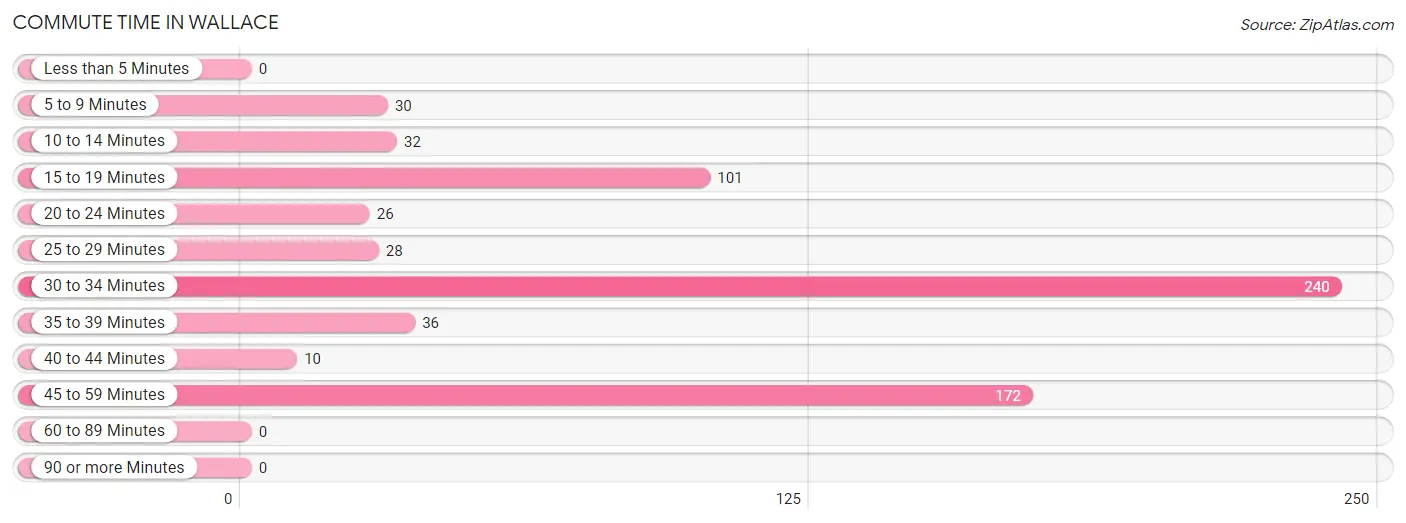
| Commute Time | # Commuters | % Commuters |
| Less than 5 Minutes | 0 | 0.0% |
| 5 to 9 Minutes | 30 | 4.4% |
| 10 to 14 Minutes | 32 | 4.7% |
| 15 to 19 Minutes | 101 | 15.0% |
| 20 to 24 Minutes | 26 | 3.8% |
| 25 to 29 Minutes | 28 | 4.2% |
| 30 to 34 Minutes | 240 | 35.6% |
| 35 to 39 Minutes | 36 | 5.3% |
| 40 to 44 Minutes | 10 | 1.5% |
| 45 to 59 Minutes | 172 | 25.5% |
| 60 to 89 Minutes | 0 | 0.0% |
| 90 or more Minutes | 0 | 0.0% |
Commute Time by Sex in Wallace
The most common commute times in Wallace are 30 to 34 minutes (108 commuters, 32.1%) for males and 30 to 34 minutes (132 commuters, 39.1%) for females.
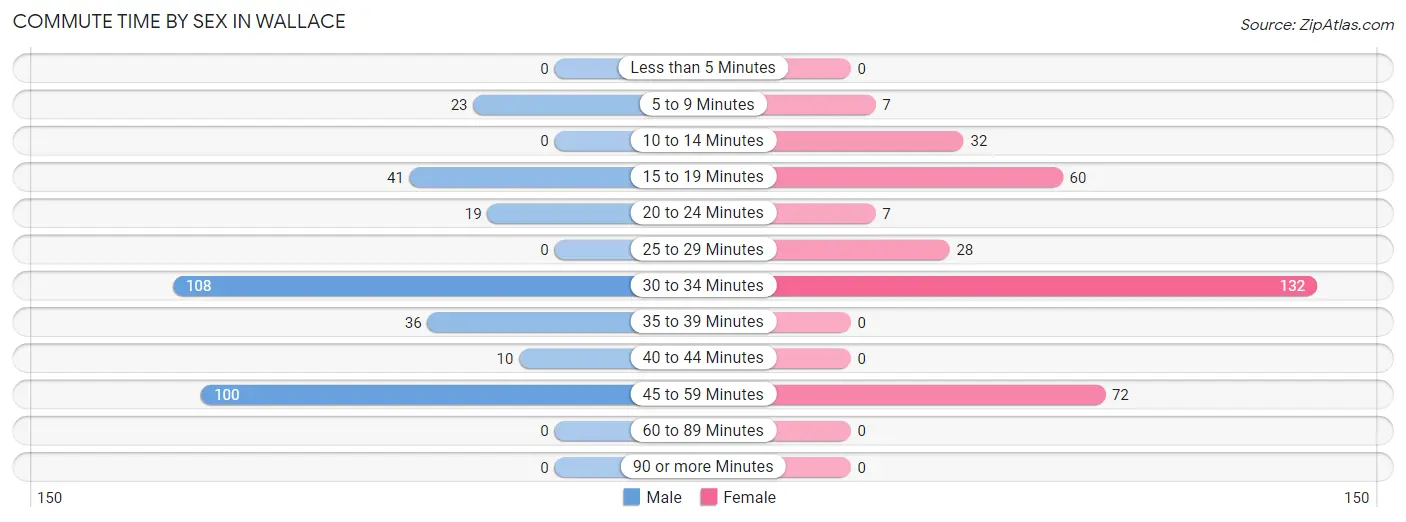
| Commute Time | Male | Female |
| Less than 5 Minutes | 0 (0.0%) | 0 (0.0%) |
| 5 to 9 Minutes | 23 (6.8%) | 7 (2.1%) |
| 10 to 14 Minutes | 0 (0.0%) | 32 (9.5%) |
| 15 to 19 Minutes | 41 (12.2%) | 60 (17.7%) |
| 20 to 24 Minutes | 19 (5.6%) | 7 (2.1%) |
| 25 to 29 Minutes | 0 (0.0%) | 28 (8.3%) |
| 30 to 34 Minutes | 108 (32.1%) | 132 (39.1%) |
| 35 to 39 Minutes | 36 (10.7%) | 0 (0.0%) |
| 40 to 44 Minutes | 10 (3.0%) | 0 (0.0%) |
| 45 to 59 Minutes | 100 (29.7%) | 72 (21.3%) |
| 60 to 89 Minutes | 0 (0.0%) | 0 (0.0%) |
| 90 or more Minutes | 0 (0.0%) | 0 (0.0%) |
Time of Departure to Work by Sex in Wallace
The most frequent times of departure to work in Wallace are 5:00 AM to 5:29 AM (98, 29.1%) for males and 8:00 AM to 8:29 AM (119, 35.2%) for females.
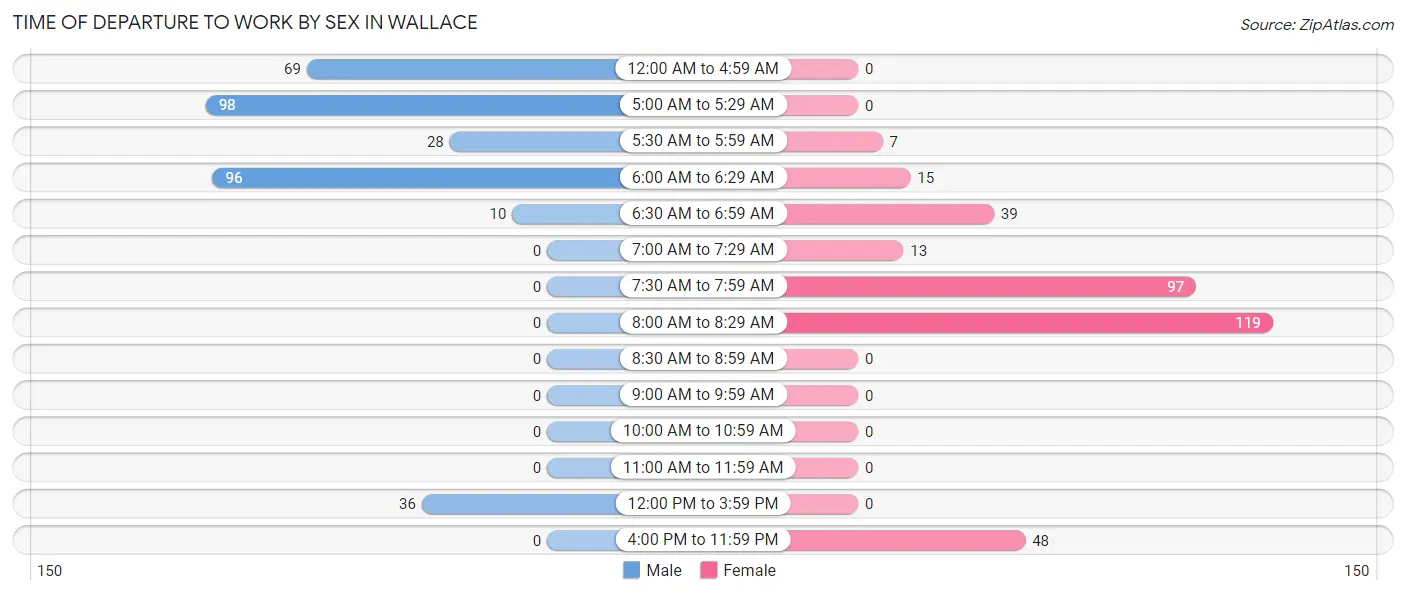
| Time of Departure | Male | Female |
| 12:00 AM to 4:59 AM | 69 (20.5%) | 0 (0.0%) |
| 5:00 AM to 5:29 AM | 98 (29.1%) | 0 (0.0%) |
| 5:30 AM to 5:59 AM | 28 (8.3%) | 7 (2.1%) |
| 6:00 AM to 6:29 AM | 96 (28.5%) | 15 (4.4%) |
| 6:30 AM to 6:59 AM | 10 (3.0%) | 39 (11.5%) |
| 7:00 AM to 7:29 AM | 0 (0.0%) | 13 (3.8%) |
| 7:30 AM to 7:59 AM | 0 (0.0%) | 97 (28.7%) |
| 8:00 AM to 8:29 AM | 0 (0.0%) | 119 (35.2%) |
| 8:30 AM to 8:59 AM | 0 (0.0%) | 0 (0.0%) |
| 9:00 AM to 9:59 AM | 0 (0.0%) | 0 (0.0%) |
| 10:00 AM to 10:59 AM | 0 (0.0%) | 0 (0.0%) |
| 11:00 AM to 11:59 AM | 0 (0.0%) | 0 (0.0%) |
| 12:00 PM to 3:59 PM | 36 (10.7%) | 0 (0.0%) |
| 4:00 PM to 11:59 PM | 0 (0.0%) | 48 (14.2%) |
| Total | 337 (100.0%) | 338 (100.0%) |
Housing Occupancy in Wallace
Occupancy by Ownership in Wallace
Of the total 452 dwellings in Wallace, owner-occupied units account for 299 (66.1%), while renter-occupied units make up 153 (33.9%).
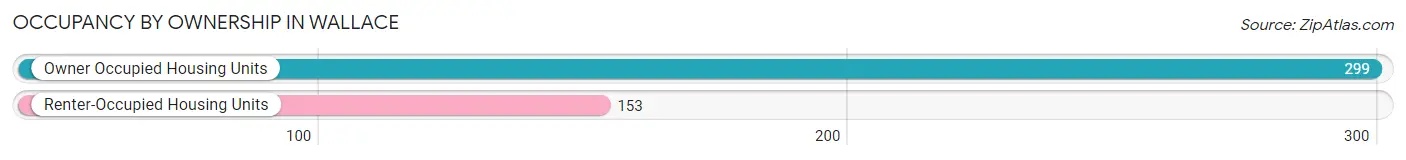
| Occupancy | # Housing Units | % Housing Units |
| Owner Occupied Housing Units | 299 | 66.1% |
| Renter-Occupied Housing Units | 153 | 33.9% |
| Total Occupied Housing Units | 452 | 100.0% |
Occupancy by Household Size in Wallace
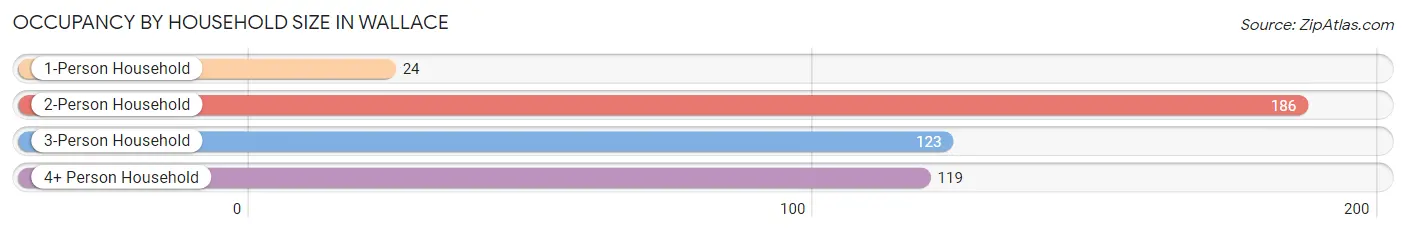
| Household Size | # Housing Units | % Housing Units |
| 1-Person Household | 24 | 5.3% |
| 2-Person Household | 186 | 41.1% |
| 3-Person Household | 123 | 27.2% |
| 4+ Person Household | 119 | 26.3% |
| Total Housing Units | 452 | 100.0% |
Occupancy by Ownership by Household Size in Wallace
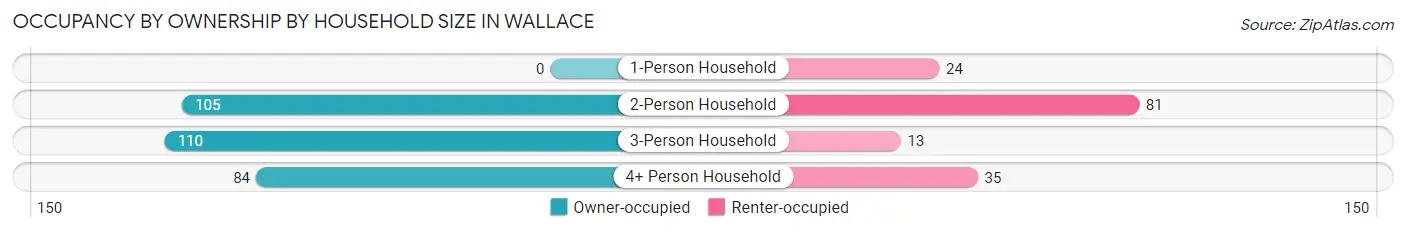
| Household Size | Owner-occupied | Renter-occupied |
| 1-Person Household | 0 (0.0%) | 24 (100.0%) |
| 2-Person Household | 105 (56.5%) | 81 (43.5%) |
| 3-Person Household | 110 (89.4%) | 13 (10.6%) |
| 4+ Person Household | 84 (70.6%) | 35 (29.4%) |
| Total Housing Units | 299 (66.1%) | 153 (33.9%) |
Occupancy by Educational Attainment in Wallace
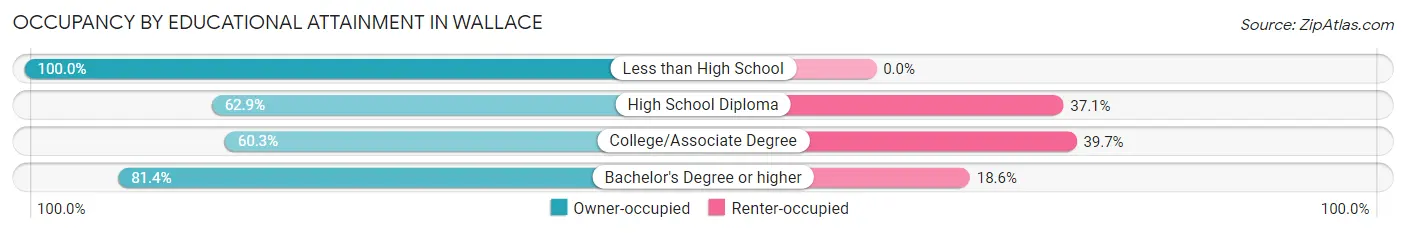
| Household Size | Owner-occupied | Renter-occupied |
| Less than High School | 19 (100.0%) | 0 (0.0%) |
| High School Diploma | 100 (62.9%) | 59 (37.1%) |
| College/Associate Degree | 123 (60.3%) | 81 (39.7%) |
| Bachelor's Degree or higher | 57 (81.4%) | 13 (18.6%) |
Occupancy by Age of Householder in Wallace
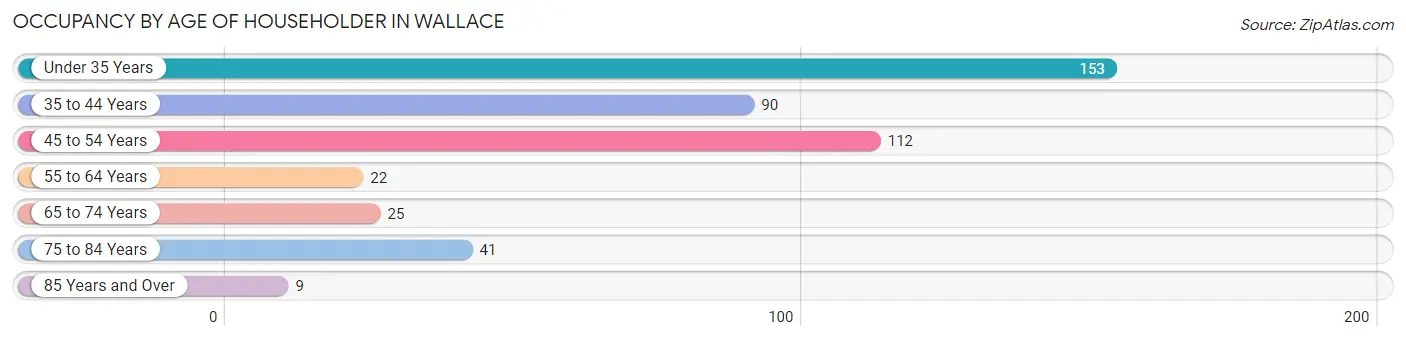
| Age Bracket | # Households | % Households |
| Under 35 Years | 153 | 33.9% |
| 35 to 44 Years | 90 | 19.9% |
| 45 to 54 Years | 112 | 24.8% |
| 55 to 64 Years | 22 | 4.9% |
| 65 to 74 Years | 25 | 5.5% |
| 75 to 84 Years | 41 | 9.1% |
| 85 Years and Over | 9 | 2.0% |
| Total | 452 | 100.0% |
Housing Finances in Wallace
Median Income by Occupancy in Wallace
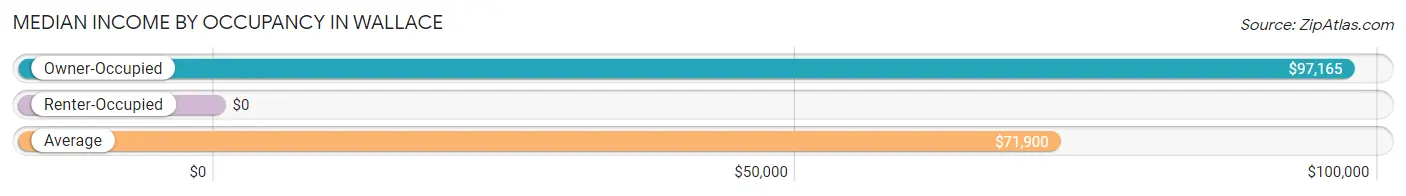
| Occupancy Type | # Households | Median Income |
| Owner-Occupied | 299 (66.1%) | $97,165 |
| Renter-Occupied | 153 (33.9%) | $0 |
| Average | 452 (100.0%) | $71,900 |
Occupancy by Householder Income Bracket in Wallace
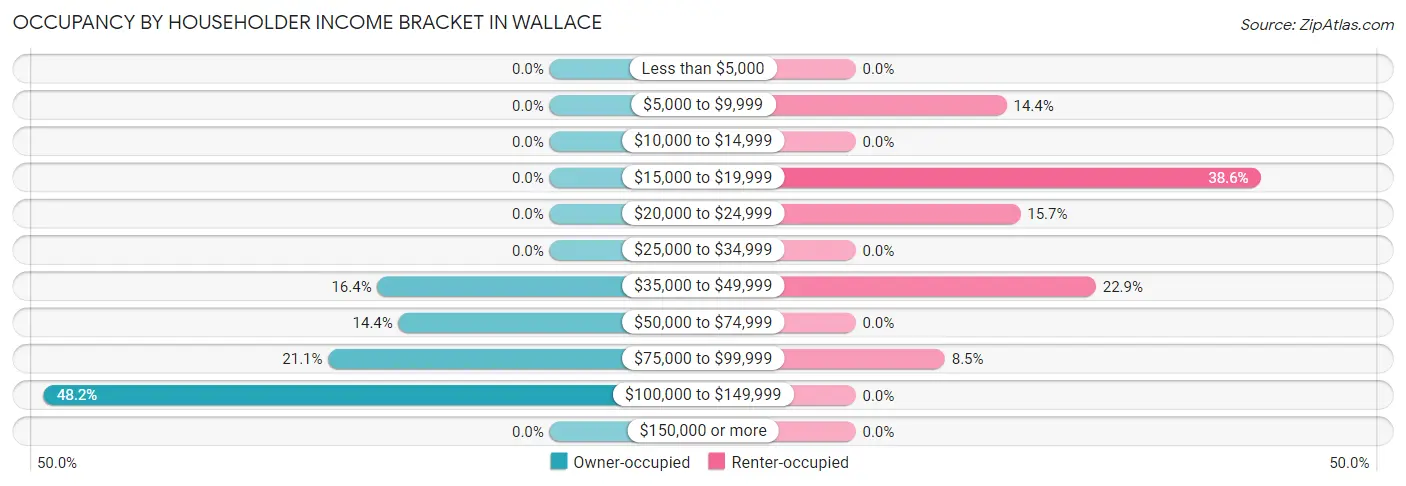
| Income Bracket | Owner-occupied | Renter-occupied |
| Less than $5,000 | 0 (0.0%) | 0 (0.0%) |
| $5,000 to $9,999 | 0 (0.0%) | 22 (14.4%) |
| $10,000 to $14,999 | 0 (0.0%) | 0 (0.0%) |
| $15,000 to $19,999 | 0 (0.0%) | 59 (38.6%) |
| $20,000 to $24,999 | 0 (0.0%) | 24 (15.7%) |
| $25,000 to $34,999 | 0 (0.0%) | 0 (0.0%) |
| $35,000 to $49,999 | 49 (16.4%) | 35 (22.9%) |
| $50,000 to $74,999 | 43 (14.4%) | 0 (0.0%) |
| $75,000 to $99,999 | 63 (21.1%) | 13 (8.5%) |
| $100,000 to $149,999 | 144 (48.2%) | 0 (0.0%) |
| $150,000 or more | 0 (0.0%) | 0 (0.0%) |
| Total | 299 (100.0%) | 153 (100.0%) |
Monthly Housing Cost Tiers in Wallace
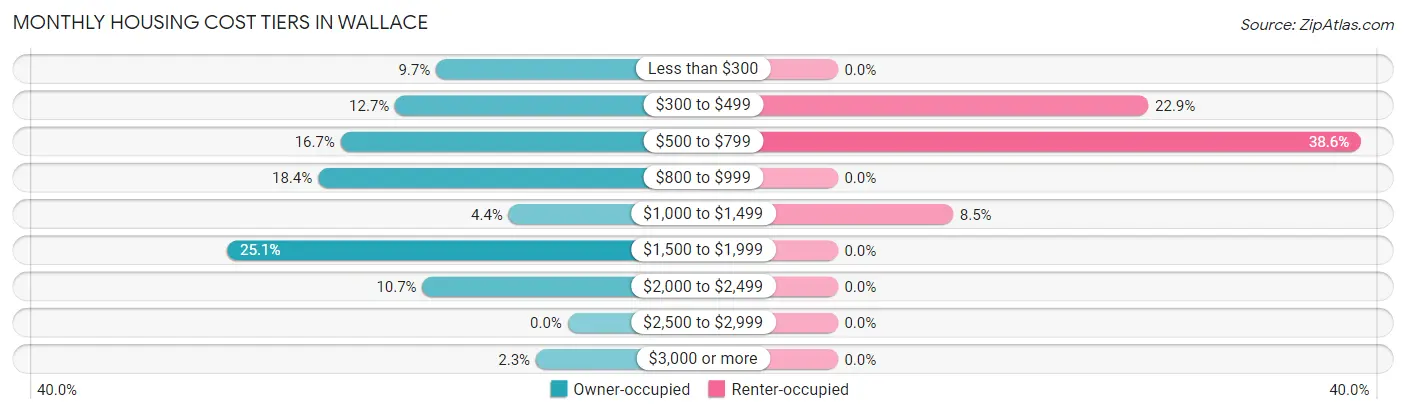
| Monthly Cost | Owner-occupied | Renter-occupied |
| Less than $300 | 29 (9.7%) | 0 (0.0%) |
| $300 to $499 | 38 (12.7%) | 35 (22.9%) |
| $500 to $799 | 50 (16.7%) | 59 (38.6%) |
| $800 to $999 | 55 (18.4%) | 0 (0.0%) |
| $1,000 to $1,499 | 13 (4.3%) | 13 (8.5%) |
| $1,500 to $1,999 | 75 (25.1%) | 0 (0.0%) |
| $2,000 to $2,499 | 32 (10.7%) | 0 (0.0%) |
| $2,500 to $2,999 | 0 (0.0%) | 0 (0.0%) |
| $3,000 or more | 7 (2.3%) | 0 (0.0%) |
| Total | 299 (100.0%) | 153 (100.0%) |
Physical Housing Characteristics in Wallace
Housing Structures in Wallace
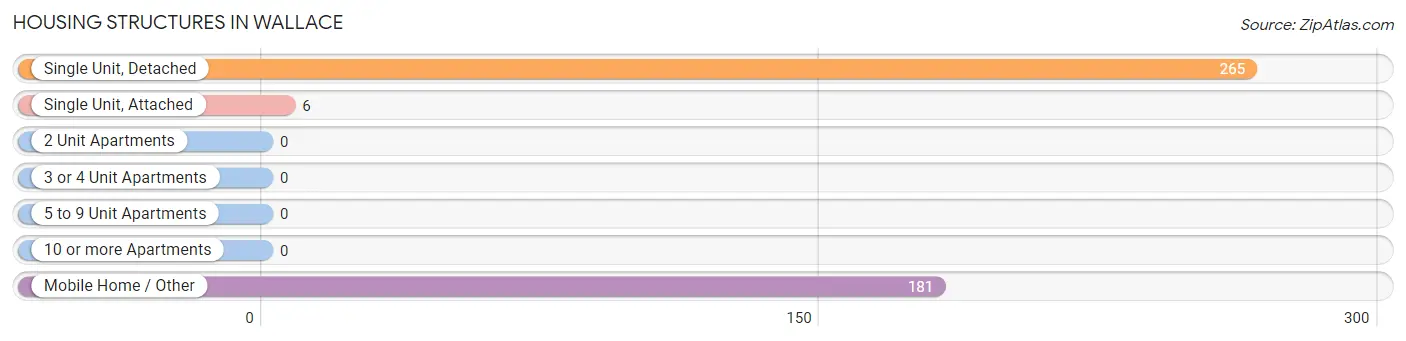
| Structure Type | # Housing Units | % Housing Units |
| Single Unit, Detached | 265 | 58.6% |
| Single Unit, Attached | 6 | 1.3% |
| 2 Unit Apartments | 0 | 0.0% |
| 3 or 4 Unit Apartments | 0 | 0.0% |
| 5 to 9 Unit Apartments | 0 | 0.0% |
| 10 or more Apartments | 0 | 0.0% |
| Mobile Home / Other | 181 | 40.0% |
| Total | 452 | 100.0% |
Housing Structures by Occupancy in Wallace
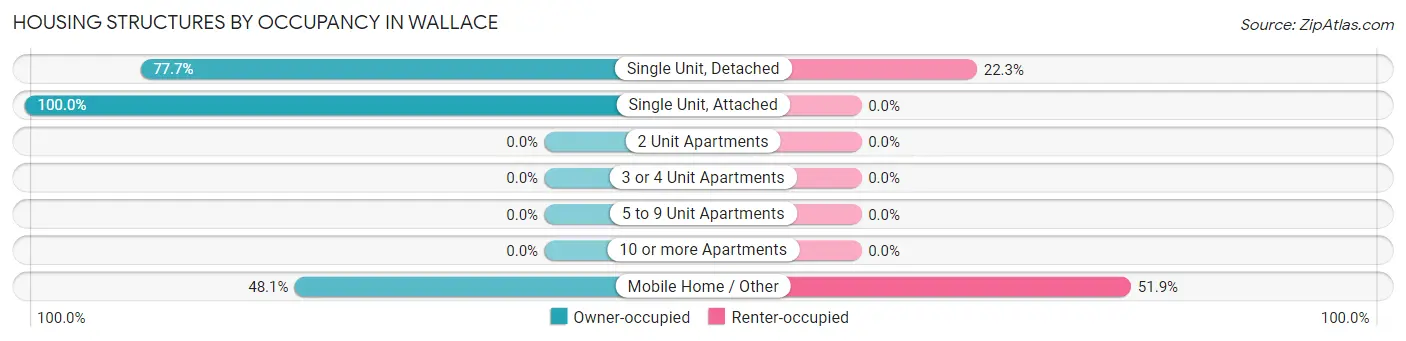
| Structure Type | Owner-occupied | Renter-occupied |
| Single Unit, Detached | 206 (77.7%) | 59 (22.3%) |
| Single Unit, Attached | 6 (100.0%) | 0 (0.0%) |
| 2 Unit Apartments | 0 (0.0%) | 0 (0.0%) |
| 3 or 4 Unit Apartments | 0 (0.0%) | 0 (0.0%) |
| 5 to 9 Unit Apartments | 0 (0.0%) | 0 (0.0%) |
| 10 or more Apartments | 0 (0.0%) | 0 (0.0%) |
| Mobile Home / Other | 87 (48.1%) | 94 (51.9%) |
| Total | 299 (66.1%) | 153 (33.9%) |
Housing Structures by Number of Rooms in Wallace
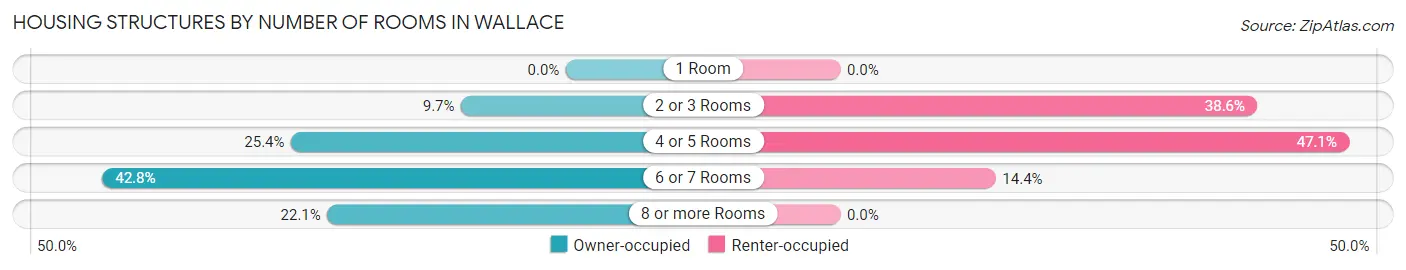
| Number of Rooms | Owner-occupied | Renter-occupied |
| 1 Room | 0 (0.0%) | 0 (0.0%) |
| 2 or 3 Rooms | 29 (9.7%) | 59 (38.6%) |
| 4 or 5 Rooms | 76 (25.4%) | 72 (47.1%) |
| 6 or 7 Rooms | 128 (42.8%) | 22 (14.4%) |
| 8 or more Rooms | 66 (22.1%) | 0 (0.0%) |
| Total | 299 (100.0%) | 153 (100.0%) |
Housing Structure by Heating Type in Wallace
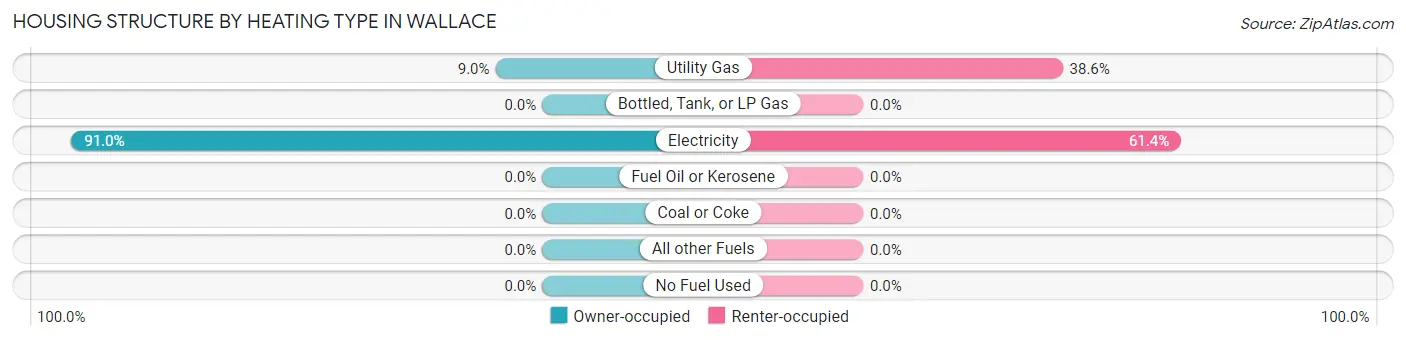
| Heating Type | Owner-occupied | Renter-occupied |
| Utility Gas | 27 (9.0%) | 59 (38.6%) |
| Bottled, Tank, or LP Gas | 0 (0.0%) | 0 (0.0%) |
| Electricity | 272 (91.0%) | 94 (61.4%) |
| Fuel Oil or Kerosene | 0 (0.0%) | 0 (0.0%) |
| Coal or Coke | 0 (0.0%) | 0 (0.0%) |
| All other Fuels | 0 (0.0%) | 0 (0.0%) |
| No Fuel Used | 0 (0.0%) | 0 (0.0%) |
| Total | 299 (100.0%) | 153 (100.0%) |
Household Vehicle Usage in Wallace
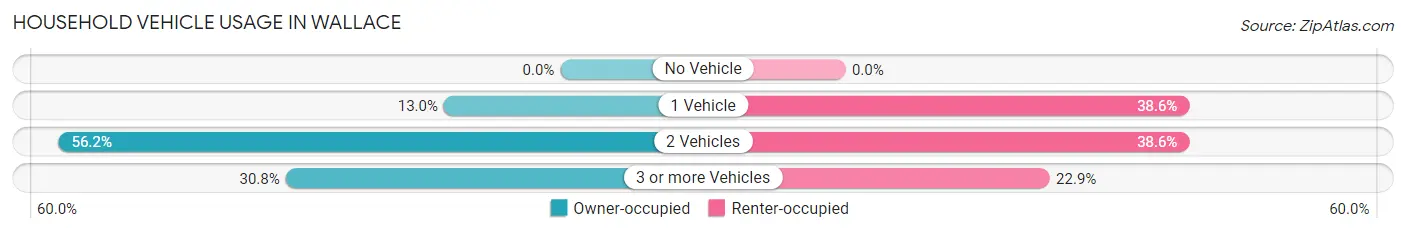
| Vehicles per Household | Owner-occupied | Renter-occupied |
| No Vehicle | 0 (0.0%) | 0 (0.0%) |
| 1 Vehicle | 39 (13.0%) | 59 (38.6%) |
| 2 Vehicles | 168 (56.2%) | 59 (38.6%) |
| 3 or more Vehicles | 92 (30.8%) | 35 (22.9%) |
| Total | 299 (100.0%) | 153 (100.0%) |
Real Estate & Mortgages in Wallace
Real Estate and Mortgage Overview in Wallace
| Characteristic | Without Mortgage | With Mortgage |
| Housing Units | 117 | 182 |
| Median Property Value | - | - |
| Median Household Income | - | - |
| Monthly Housing Costs | $415 | $7 |
| Real Estate Taxes | - | - |
Property Value by Mortgage Status in Wallace
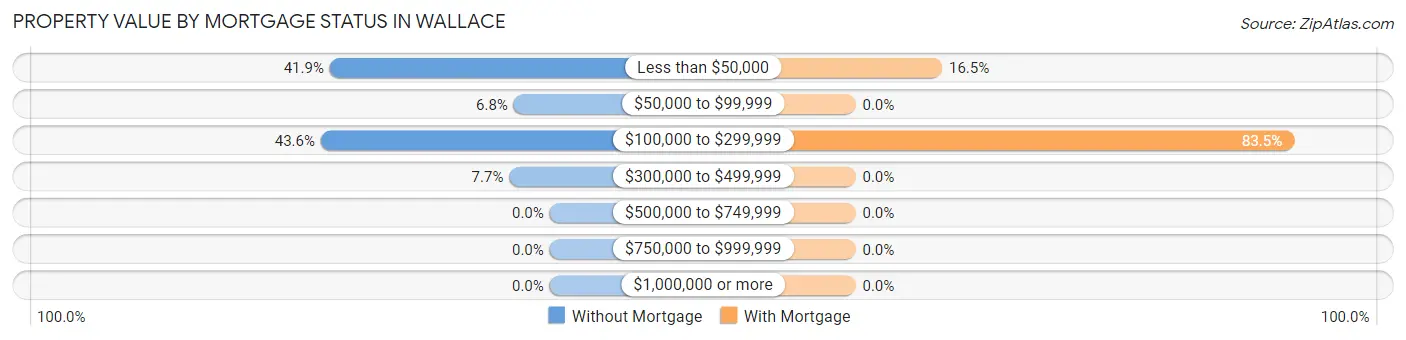
| Property Value | Without Mortgage | With Mortgage |
| Less than $50,000 | 49 (41.9%) | 30 (16.5%) |
| $50,000 to $99,999 | 8 (6.8%) | 0 (0.0%) |
| $100,000 to $299,999 | 51 (43.6%) | 152 (83.5%) |
| $300,000 to $499,999 | 9 (7.7%) | 0 (0.0%) |
| $500,000 to $749,999 | 0 (0.0%) | 0 (0.0%) |
| $750,000 to $999,999 | 0 (0.0%) | 0 (0.0%) |
| $1,000,000 or more | 0 (0.0%) | 0 (0.0%) |
| Total | 117 (100.0%) | 182 (100.0%) |
Household Income by Mortgage Status in Wallace
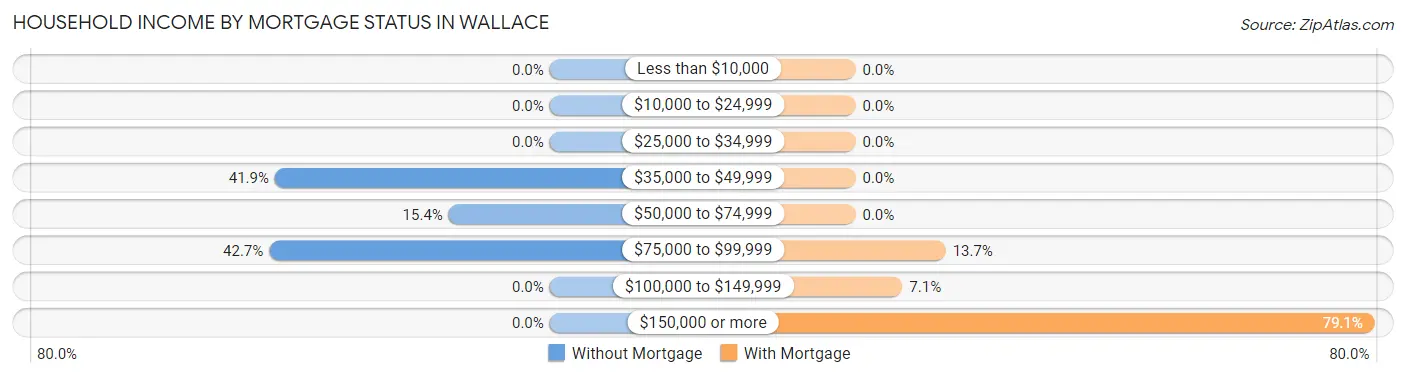
| Household Income | Without Mortgage | With Mortgage |
| Less than $10,000 | 0 (0.0%) | 0 (0.0%) |
| $10,000 to $24,999 | 0 (0.0%) | 0 (0.0%) |
| $25,000 to $34,999 | 0 (0.0%) | 0 (0.0%) |
| $35,000 to $49,999 | 49 (41.9%) | 0 (0.0%) |
| $50,000 to $74,999 | 18 (15.4%) | 0 (0.0%) |
| $75,000 to $99,999 | 50 (42.7%) | 25 (13.7%) |
| $100,000 to $149,999 | 0 (0.0%) | 13 (7.1%) |
| $150,000 or more | 0 (0.0%) | 144 (79.1%) |
| Total | 117 (100.0%) | 182 (100.0%) |
Property Value to Household Income Ratio in Wallace
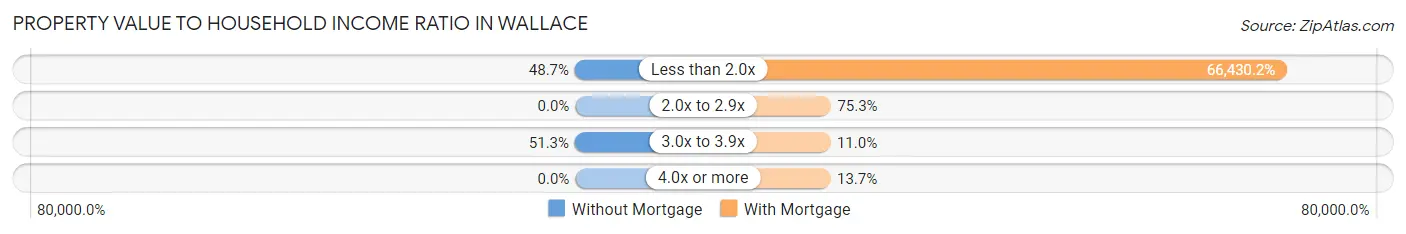
| Value-to-Income Ratio | Without Mortgage | With Mortgage |
| Less than 2.0x | 57 (48.7%) | 120,903 (66,430.2%) |
| 2.0x to 2.9x | 0 (0.0%) | 137 (75.3%) |
| 3.0x to 3.9x | 60 (51.3%) | 20 (11.0%) |
| 4.0x or more | 0 (0.0%) | 25 (13.7%) |
| Total | 117 (100.0%) | 182 (100.0%) |
Real Estate Taxes by Mortgage Status in Wallace
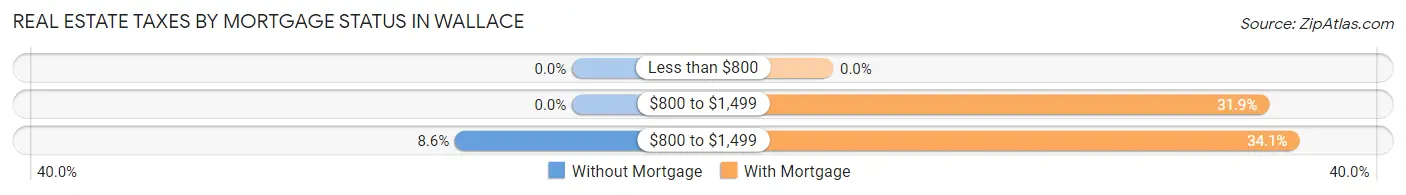
| Property Taxes | Without Mortgage | With Mortgage |
| Less than $800 | 0 (0.0%) | 0 (0.0%) |
| $800 to $1,499 | 0 (0.0%) | 58 (31.9%) |
| $800 to $1,499 | 10 (8.6%) | 62 (34.1%) |
| Total | 117 (100.0%) | 182 (100.0%) |
Health & Disability in Wallace
Health Insurance Coverage by Age in Wallace
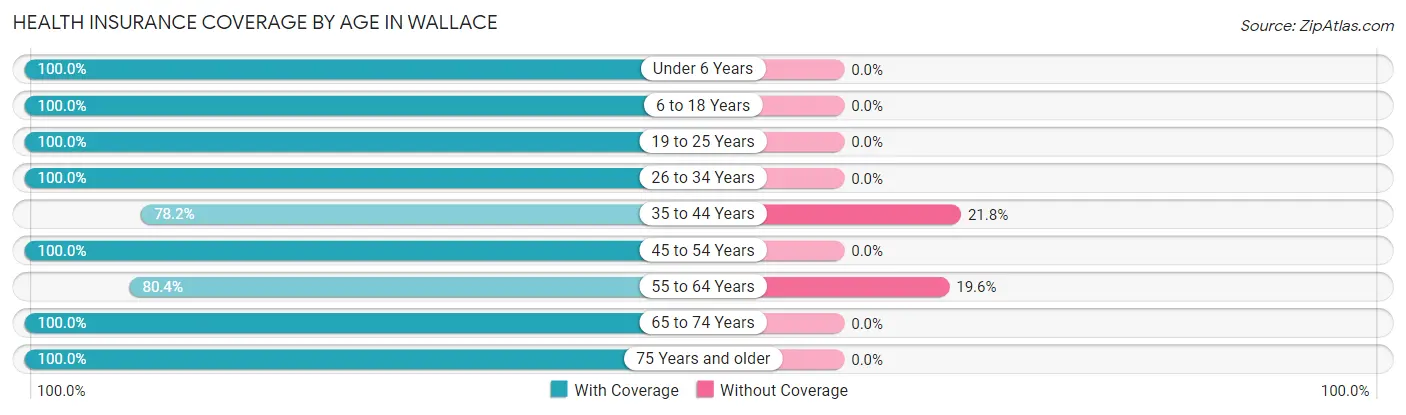
| Age Bracket | With Coverage | Without Coverage |
| Under 6 Years | 161 (100.0%) | 0 (0.0%) |
| 6 to 18 Years | 255 (100.0%) | 0 (0.0%) |
| 19 to 25 Years | 217 (100.0%) | 0 (0.0%) |
| 26 to 34 Years | 119 (100.0%) | 0 (0.0%) |
| 35 to 44 Years | 133 (78.2%) | 37 (21.8%) |
| 45 to 54 Years | 292 (100.0%) | 0 (0.0%) |
| 55 to 64 Years | 152 (80.4%) | 37 (19.6%) |
| 65 to 74 Years | 32 (100.0%) | 0 (0.0%) |
| 75 Years and older | 50 (100.0%) | 0 (0.0%) |
| Total | 1,411 (95.0%) | 74 (5.0%) |
Health Insurance Coverage by Citizenship Status in Wallace
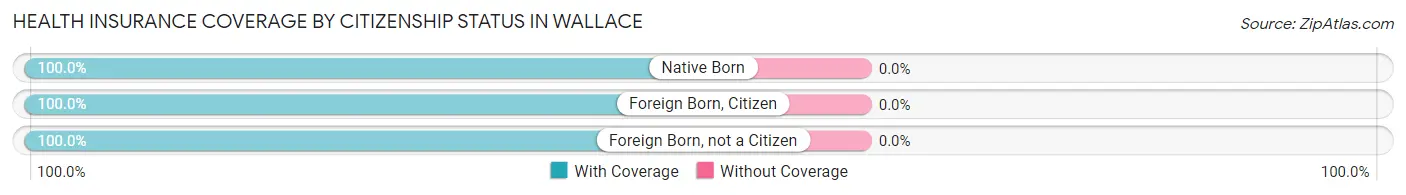
| Citizenship Status | With Coverage | Without Coverage |
| Native Born | 161 (100.0%) | 0 (0.0%) |
| Foreign Born, Citizen | 255 (100.0%) | 0 (0.0%) |
| Foreign Born, not a Citizen | 217 (100.0%) | 0 (0.0%) |
Health Insurance Coverage by Household Income in Wallace
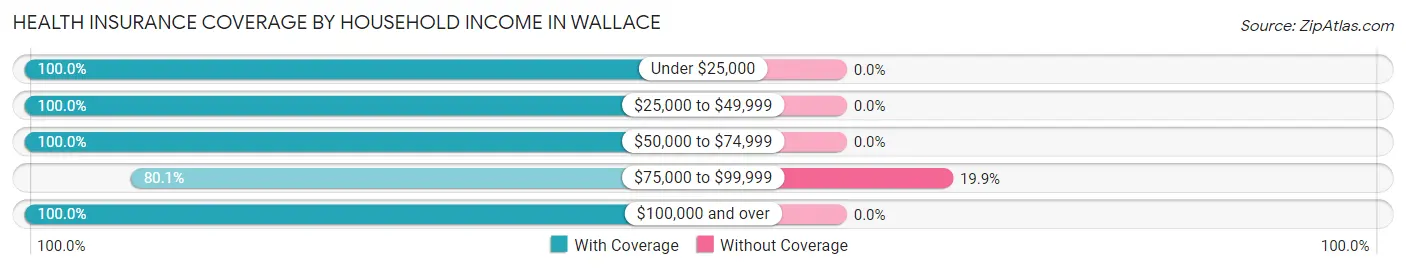
| Household Income | With Coverage | Without Coverage |
| Under $25,000 | 178 (100.0%) | 0 (0.0%) |
| $25,000 to $49,999 | 261 (100.0%) | 0 (0.0%) |
| $50,000 to $74,999 | 109 (100.0%) | 0 (0.0%) |
| $75,000 to $99,999 | 298 (80.1%) | 74 (19.9%) |
| $100,000 and over | 565 (100.0%) | 0 (0.0%) |
Public vs Private Health Insurance Coverage by Age in Wallace
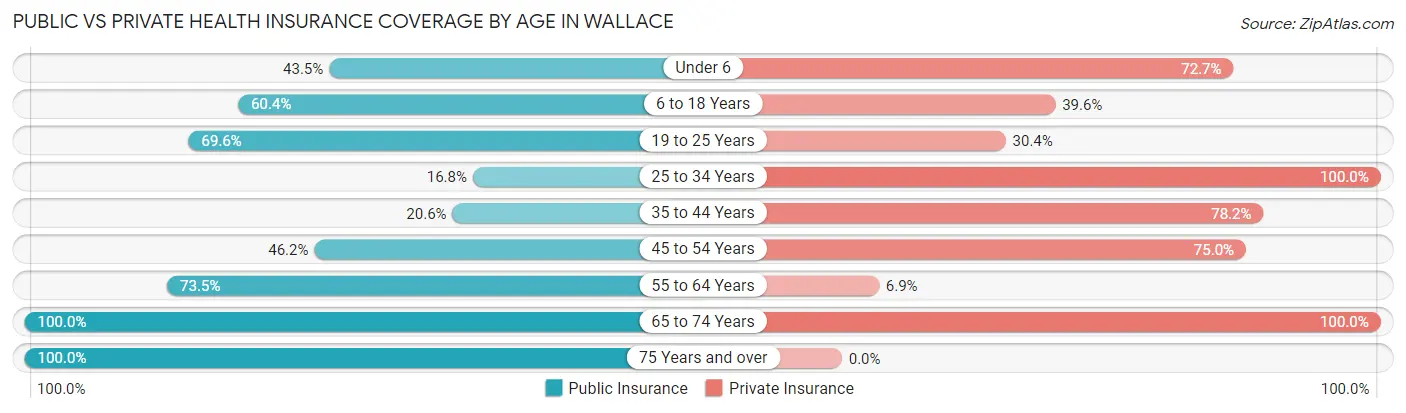
| Age Bracket | Public Insurance | Private Insurance |
| Under 6 | 70 (43.5%) | 117 (72.7%) |
| 6 to 18 Years | 154 (60.4%) | 101 (39.6%) |
| 19 to 25 Years | 151 (69.6%) | 66 (30.4%) |
| 25 to 34 Years | 20 (16.8%) | 119 (100.0%) |
| 35 to 44 Years | 35 (20.6%) | 133 (78.2%) |
| 45 to 54 Years | 135 (46.2%) | 219 (75.0%) |
| 55 to 64 Years | 139 (73.5%) | 13 (6.9%) |
| 65 to 74 Years | 32 (100.0%) | 32 (100.0%) |
| 75 Years and over | 50 (100.0%) | 0 (0.0%) |
| Total | 786 (52.9%) | 800 (53.9%) |
Disability Status by Sex by Age in Wallace
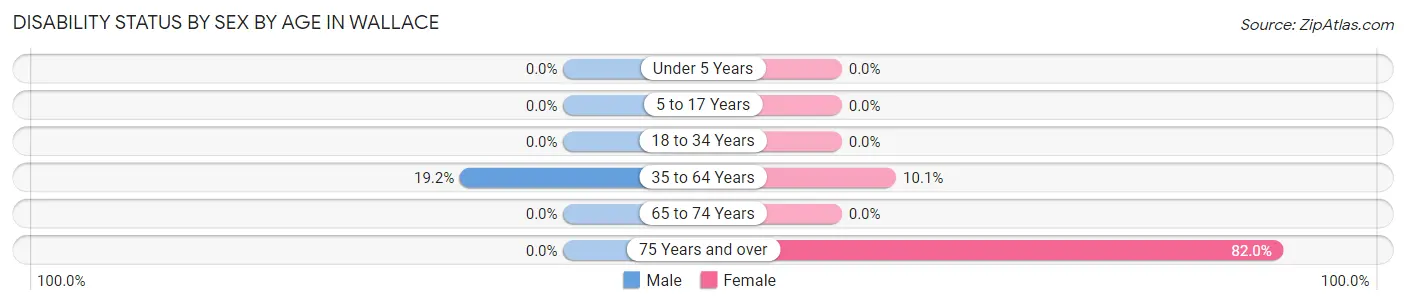
| Age Bracket | Male | Female |
| Under 5 Years | 0 (0.0%) | 0 (0.0%) |
| 5 to 17 Years | 0 (0.0%) | 0 (0.0%) |
| 18 to 34 Years | 0 (0.0%) | 0 (0.0%) |
| 35 to 64 Years | 83 (19.2%) | 22 (10.1%) |
| 65 to 74 Years | 0 (0.0%) | 0 (0.0%) |
| 75 Years and over | 0 (0.0%) | 41 (82.0%) |
Disability Class by Sex by Age in Wallace
Disability Class: Hearing Difficulty
| Age Bracket | Male | Female |
| Under 5 Years | 0 (0.0%) | 0 (0.0%) |
| 5 to 17 Years | 0 (0.0%) | 0 (0.0%) |
| 18 to 34 Years | 0 (0.0%) | 0 (0.0%) |
| 35 to 64 Years | 0 (0.0%) | 0 (0.0%) |
| 65 to 74 Years | 0 (0.0%) | 0 (0.0%) |
| 75 Years and over | 0 (0.0%) | 0 (0.0%) |
Disability Class: Vision Difficulty
| Age Bracket | Male | Female |
| Under 5 Years | 0 (0.0%) | 0 (0.0%) |
| 5 to 17 Years | 0 (0.0%) | 0 (0.0%) |
| 18 to 34 Years | 0 (0.0%) | 0 (0.0%) |
| 35 to 64 Years | 0 (0.0%) | 0 (0.0%) |
| 65 to 74 Years | 0 (0.0%) | 0 (0.0%) |
| 75 Years and over | 0 (0.0%) | 0 (0.0%) |
Disability Class: Cognitive Difficulty
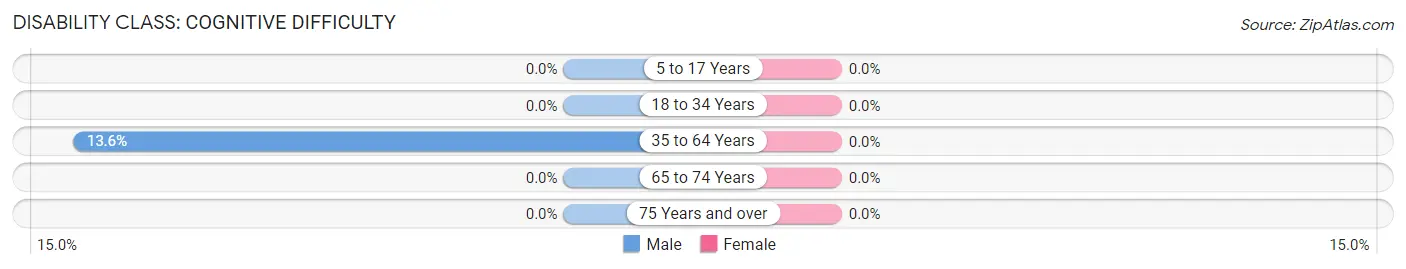
| Age Bracket | Male | Female |
| 5 to 17 Years | 0 (0.0%) | 0 (0.0%) |
| 18 to 34 Years | 0 (0.0%) | 0 (0.0%) |
| 35 to 64 Years | 59 (13.6%) | 0 (0.0%) |
| 65 to 74 Years | 0 (0.0%) | 0 (0.0%) |
| 75 Years and over | 0 (0.0%) | 0 (0.0%) |
Disability Class: Ambulatory Difficulty
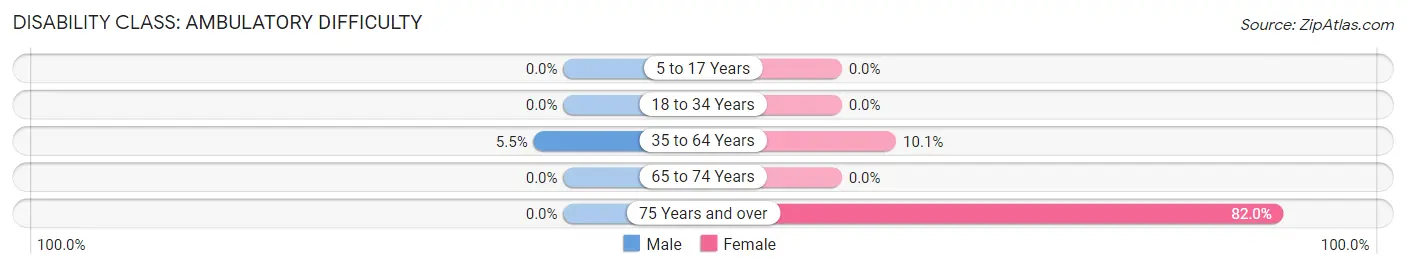
| Age Bracket | Male | Female |
| 5 to 17 Years | 0 (0.0%) | 0 (0.0%) |
| 18 to 34 Years | 0 (0.0%) | 0 (0.0%) |
| 35 to 64 Years | 24 (5.5%) | 22 (10.1%) |
| 65 to 74 Years | 0 (0.0%) | 0 (0.0%) |
| 75 Years and over | 0 (0.0%) | 41 (82.0%) |
Disability Class: Self-Care Difficulty

| Age Bracket | Male | Female |
| 5 to 17 Years | 0 (0.0%) | 0 (0.0%) |
| 18 to 34 Years | 0 (0.0%) | 0 (0.0%) |
| 35 to 64 Years | 24 (5.5%) | 0 (0.0%) |
| 65 to 74 Years | 0 (0.0%) | 0 (0.0%) |
| 75 Years and over | 0 (0.0%) | 0 (0.0%) |
Technology Access in Wallace
Computing Device Access in Wallace
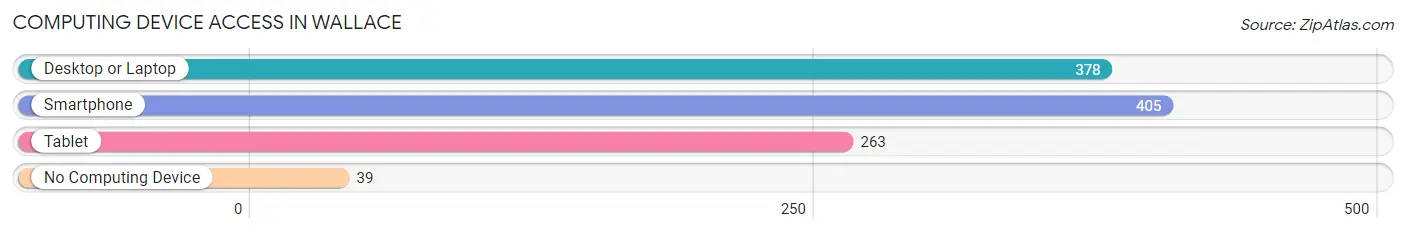
| Device Type | # Households | % Households |
| Desktop or Laptop | 378 | 83.6% |
| Smartphone | 405 | 89.6% |
| Tablet | 263 | 58.2% |
| No Computing Device | 39 | 8.6% |
| Total | 452 | 100.0% |
Internet Access in Wallace
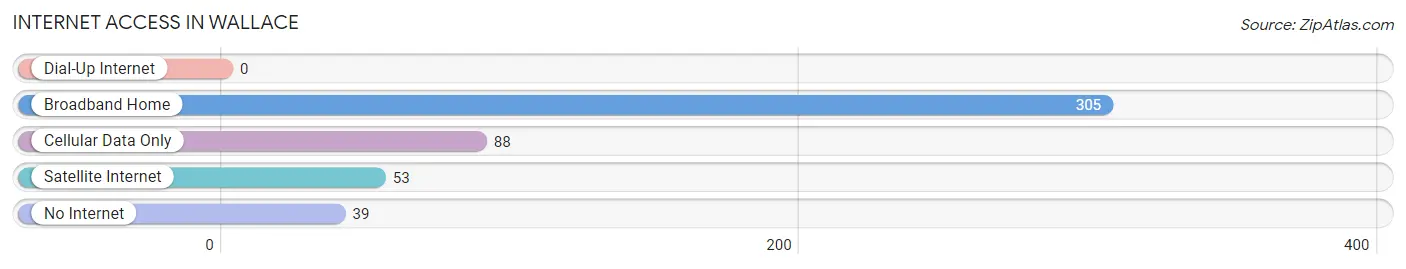
| Internet Type | # Households | % Households |
| Dial-Up Internet | 0 | 0.0% |
| Broadband Home | 305 | 67.5% |
| Cellular Data Only | 88 | 19.5% |
| Satellite Internet | 53 | 11.7% |
| No Internet | 39 | 8.6% |
| Total | 452 | 100.0% |
Wallace Summary
Wallace, Louisiana is a small town located in St. Mary Parish, Louisiana. It is situated on the banks of the Atchafalaya River, approximately 25 miles south of Morgan City. The town has a population of 1,845 people, according to the 2010 census.
History
Wallace was founded in 1883 by the Wallace family, who had moved to the area from Mississippi. The town was named after the family’s patriarch, William Wallace. The town was originally a farming community, but it soon became a center for the lumber industry. The Wallace Lumber Company was established in 1887 and was the largest employer in the area for many years.
In the early 1900s, Wallace began to experience a period of growth and prosperity. The town was incorporated in 1909 and the first mayor was elected in 1910. The town also saw the construction of a new school, a post office, and a railroad line.
In the 1920s, Wallace experienced a decline in population due to the Great Depression. The lumber industry also suffered during this time, and many of the town’s residents moved away in search of work.
In the 1950s, Wallace began to experience a resurgence in population and economic activity. The town was revitalized by the construction of a new bridge over the Atchafalaya River, which allowed for easier access to the nearby cities of Morgan City and Houma.
Geography
Wallace is located in St. Mary Parish, Louisiana. It is situated on the banks of the Atchafalaya River, approximately 25 miles south of Morgan City. The town has a total area of 1.2 square miles, all of which is land.
The town is located in a humid subtropical climate zone, with hot, humid summers and mild winters. The average temperature in the summer is around 90 degrees Fahrenheit, while the average temperature in the winter is around 50 degrees Fahrenheit.
Economy
The economy of Wallace is largely based on the lumber industry. The Wallace Lumber Company is the largest employer in the area, and it produces a variety of wood products. Other industries in the area include agriculture, fishing, and tourism.
The town also has a number of small businesses, including restaurants, retail stores, and service providers.
Demographics
According to the 2010 census, the population of Wallace was 1,845 people. The racial makeup of the town was 79.3% White, 17.2% African American, 0.7% Native American, 0.3% Asian, 0.1% Pacific Islander, and 2.4% from other races.
The median household income in Wallace was $30,938, and the median family income was $37,813. The per capita income was $15,945. Approximately 17.2% of the population was below the poverty line.
Common Questions
What is Per Capita Income in Wallace?
Per Capita income in Wallace is $23,877.
What is the Median Family Income in Wallace?
Median Family Income in Wallace is $78,872.
What is the Median Household income in Wallace?
Median Household Income in Wallace is $71,900.
What is Inequality or Gini Index in Wallace?
Inequality or Gini Index in Wallace is 0.35.
What is the Total Population of Wallace?
Total Population of Wallace is 1,485.
What is the Total Male Population of Wallace?
Total Male Population of Wallace is 673.
What is the Total Female Population of Wallace?
Total Female Population of Wallace is 812.
What is the Ratio of Males per 100 Females in Wallace?
There are 82.88 Males per 100 Females in Wallace.
What is the Ratio of Females per 100 Males in Wallace?
There are 120.65 Females per 100 Males in Wallace.
What is the Median Population Age in Wallace?
Median Population Age in Wallace is 34.8 Years.
What is the Average Family Size in Wallace
Average Family Size in Wallace is 3.6 People.
What is the Average Household Size in Wallace
Average Household Size in Wallace is 3.3 People.
How Large is the Labor Force in Wallace?
There are 819 People in the Labor Forcein in Wallace.
What is the Percentage of People in the Labor Force in Wallace?
70.4% of People are in the Labor Force in Wallace.
What is the Unemployment Rate in Wallace?
Unemployment Rate in Wallace is 11.7%.