Ferriday, LA Map & Demographics
Ferriday Map
Ferriday Overview
$12,772
PER CAPITA INCOME
$32,262
AVG FAMILY INCOME
$26,513
AVG HOUSEHOLD INCOME
42.8%
WAGE / INCOME GAP [ % ]
57.2¢/ $1
WAGE / INCOME GAP [ $ ]
0.51
INEQUALITY / GINI INDEX
3,192
TOTAL POPULATION
1,193
MALE POPULATION
1,999
FEMALE POPULATION
59.68
MALES / 100 FEMALES
167.56
FEMALES / 100 MALES
31.2
MEDIAN AGE
4.3
AVG FAMILY SIZE
3.1
AVG HOUSEHOLD SIZE
1,121
LABOR FORCE [ PEOPLE ]
51.5%
PERCENT IN LABOR FORCE
23.2%
UNEMPLOYMENT RATE
Ferriday Zip Codes
Ferriday Area Codes
Income in Ferriday
Income Overview in Ferriday
Per Capita Income in Ferriday is $12,772, while median incomes of families and households are $32,262 and $26,513 respectively.
| Characteristic | Number | Measure |
| Per Capita Income | 3,192 | $12,772 |
| Median Family Income | 628 | $32,262 |
| Mean Family Income | 628 | $45,557 |
| Median Household Income | 1,001 | $26,513 |
| Mean Household Income | 1,001 | $38,748 |
| Income Deficit | 628 | $0 |
| Wage / Income Gap (%) | 3,192 | 42.83% |
| Wage / Income Gap ($) | 3,192 | 57.17¢ per $1 |
| Gini / Inequality Index | 3,192 | 0.51 |
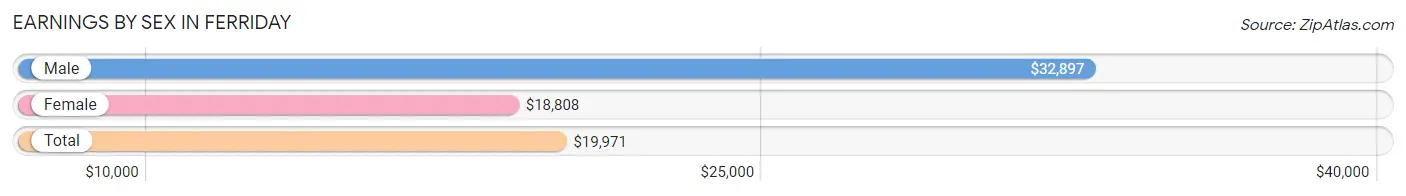
Earnings by Sex in Ferriday
Average Earnings in Ferriday are $19,971, $32,897 for men and $18,808 for women, a difference of 42.8%.
| Sex | Number | Average Earnings |
| Male | 360 (34.7%) | $32,897 |
| Female | 677 (65.3%) | $18,808 |
| Total | 1,037 (100.0%) | $19,971 |
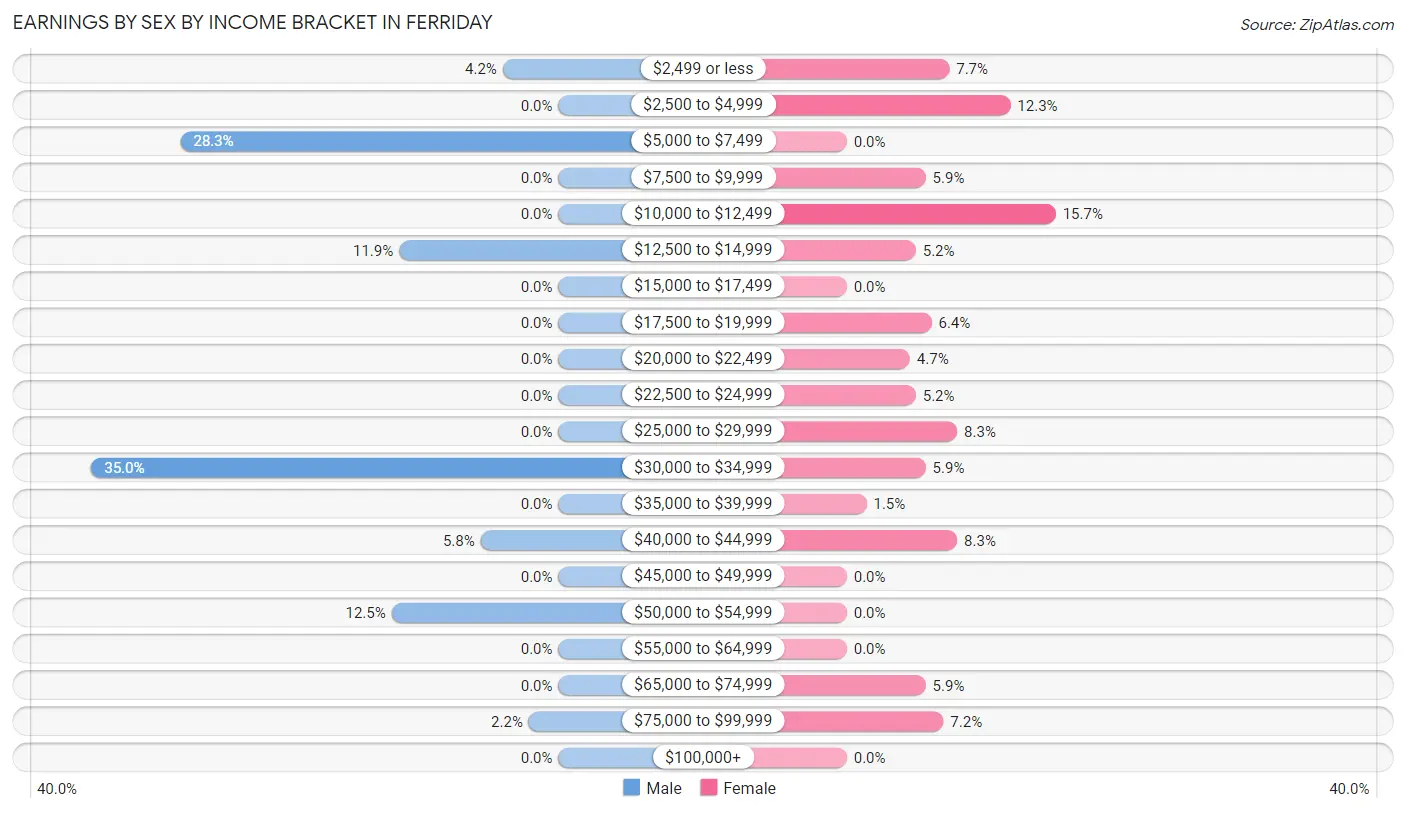
Earnings by Sex by Income Bracket in Ferriday
The most common earnings brackets in Ferriday are $30,000 to $34,999 for men (126 | 35.0%) and $10,000 to $12,499 for women (106 | 15.7%).
| Income | Male | Female |
| $2,499 or less | 15 (4.2%) | 52 (7.7%) |
| $2,500 to $4,999 | 0 (0.0%) | 83 (12.3%) |
| $5,000 to $7,499 | 102 (28.3%) | 0 (0.0%) |
| $7,500 to $9,999 | 0 (0.0%) | 40 (5.9%) |
| $10,000 to $12,499 | 0 (0.0%) | 106 (15.7%) |
| $12,500 to $14,999 | 43 (11.9%) | 35 (5.2%) |
| $15,000 to $17,499 | 0 (0.0%) | 0 (0.0%) |
| $17,500 to $19,999 | 0 (0.0%) | 43 (6.4%) |
| $20,000 to $22,499 | 0 (0.0%) | 32 (4.7%) |
| $22,500 to $24,999 | 0 (0.0%) | 35 (5.2%) |
| $25,000 to $29,999 | 0 (0.0%) | 56 (8.3%) |
| $30,000 to $34,999 | 126 (35.0%) | 40 (5.9%) |
| $35,000 to $39,999 | 0 (0.0%) | 10 (1.5%) |
| $40,000 to $44,999 | 21 (5.8%) | 56 (8.3%) |
| $45,000 to $49,999 | 0 (0.0%) | 0 (0.0%) |
| $50,000 to $54,999 | 45 (12.5%) | 0 (0.0%) |
| $55,000 to $64,999 | 0 (0.0%) | 0 (0.0%) |
| $65,000 to $74,999 | 0 (0.0%) | 40 (5.9%) |
| $75,000 to $99,999 | 8 (2.2%) | 49 (7.2%) |
| $100,000+ | 0 (0.0%) | 0 (0.0%) |
| Total | 360 (100.0%) | 677 (100.0%) |
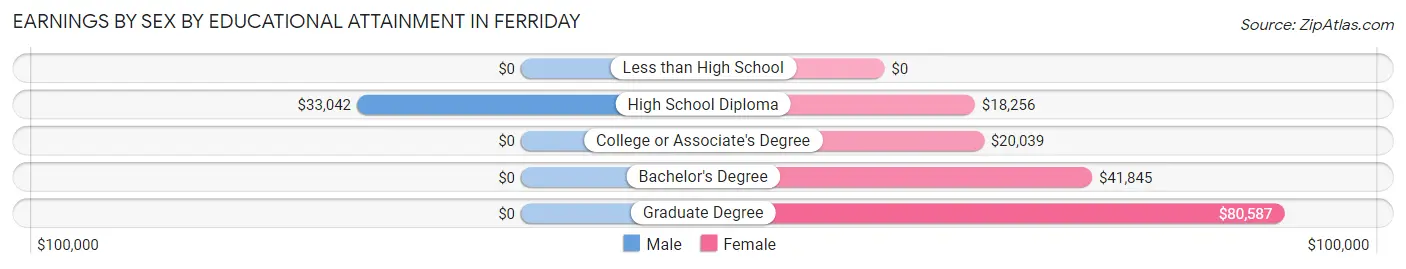
Earnings by Sex by Educational Attainment in Ferriday
Average earnings in Ferriday are $32,897 for men and $20,000 for women, a difference of 39.2%. Men with an educational attainment of high school diploma enjoy the highest average annual earnings of $33,042, while those with high school diploma education earn the least with $33,042. Women with an educational attainment of graduate degree earn the most with the average annual earnings of $80,587, while those with high school diploma education have the smallest earnings of $18,256.
| Educational Attainment | Male Income | Female Income |
| Less than High School | - | - |
| High School Diploma | $33,042 | $18,256 |
| College or Associate's Degree | - | - |
| Bachelor's Degree | - | - |
| Graduate Degree | - | - |
| Total | $32,897 | $20,000 |
Family Income in Ferriday
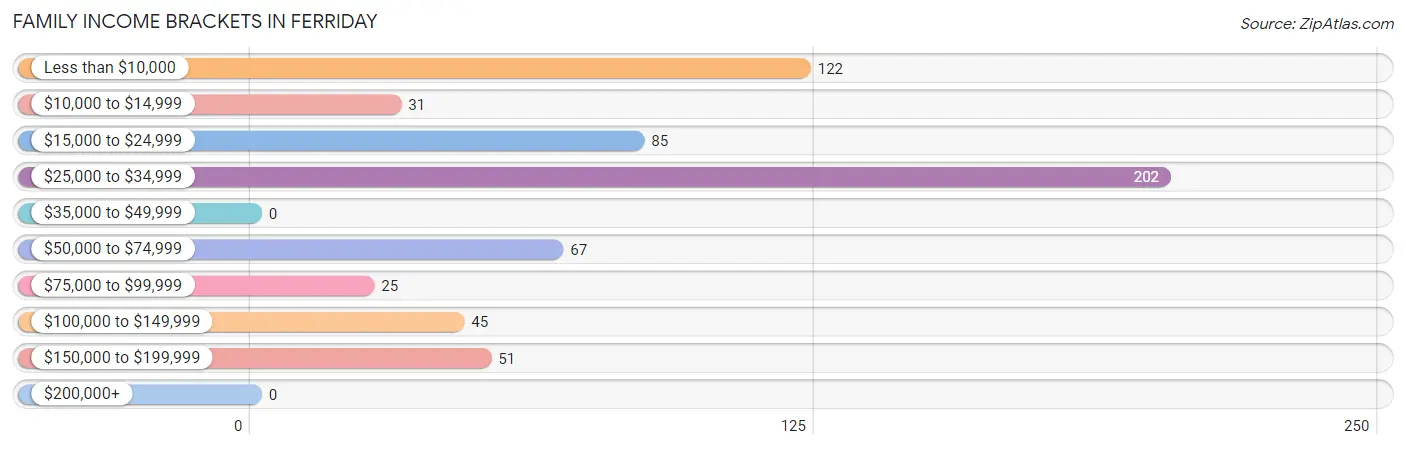
Family Income Brackets in Ferriday
According to the Ferriday family income data, there are 202 families falling into the $25,000 to $34,999 income range, which is the most common income bracket and makes up 32.2% of all families.
| Income Bracket | # Families | % Families |
| Less than $10,000 | 122 | 19.4% |
| $10,000 to $14,999 | 31 | 4.9% |
| $15,000 to $24,999 | 85 | 13.5% |
| $25,000 to $34,999 | 202 | 32.2% |
| $35,000 to $49,999 | 0 | 0.0% |
| $50,000 to $74,999 | 67 | 10.7% |
| $75,000 to $99,999 | 25 | 4.0% |
| $100,000 to $149,999 | 45 | 7.2% |
| $150,000 to $199,999 | 51 | 8.1% |
| $200,000+ | 0 | 0.0% |
Family Income by Famaliy Size in Ferriday
| Income Bracket | # Families | Median Income |
| 2-Person Families | 147 (23.4%) | $0 |
| 3-Person Families | 249 (39.7%) | $0 |
| 4-Person Families | 62 (9.9%) | $0 |
| 5-Person Families | 50 (8.0%) | $0 |
| 6-Person Families | 120 (19.1%) | $0 |
| 7+ Person Families | 0 (0.0%) | $0 |
| Total | 628 (100.0%) | $32,262 |
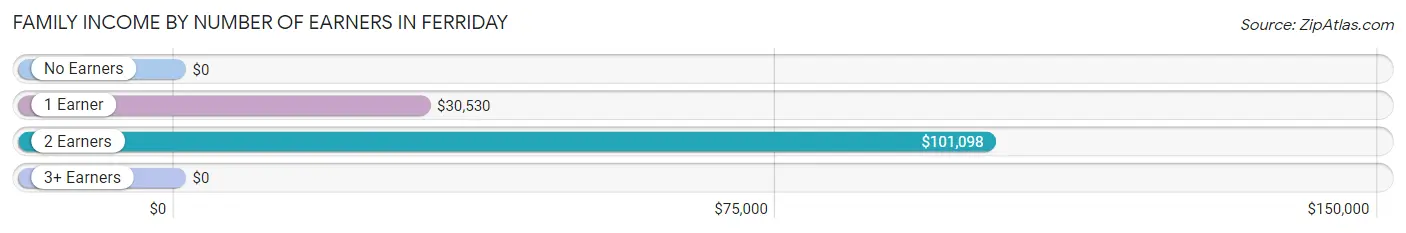
Family Income by Number of Earners in Ferriday
| Number of Earners | # Families | Median Income |
| No Earners | 51 (8.1%) | $0 |
| 1 Earner | 426 (67.8%) | $30,530 |
| 2 Earners | 139 (22.1%) | $101,098 |
| 3+ Earners | 12 (1.9%) | $0 |
| Total | 628 (100.0%) | $32,262 |
Household Income in Ferriday
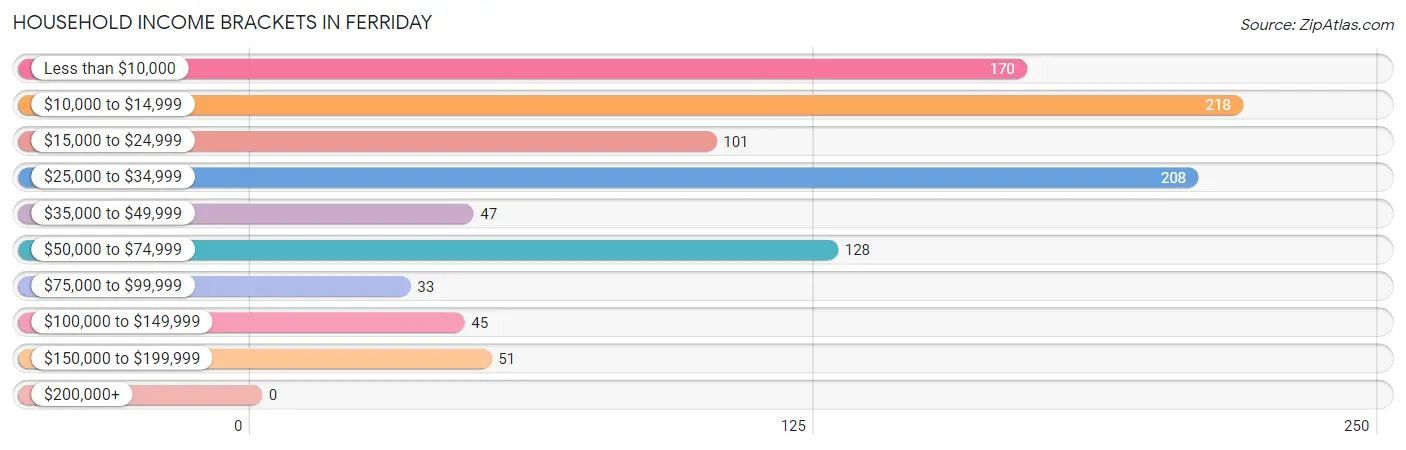
Household Income Brackets in Ferriday
With 218 households falling in the category, the $10,000 to $14,999 income range is the most frequent in Ferriday, accounting for 21.8% of all households.
| Income Bracket | # Households | % Households |
| Less than $10,000 | 170 | 17.0% |
| $10,000 to $14,999 | 218 | 21.8% |
| $15,000 to $24,999 | 101 | 10.1% |
| $25,000 to $34,999 | 208 | 20.8% |
| $35,000 to $49,999 | 47 | 4.7% |
| $50,000 to $74,999 | 128 | 12.8% |
| $75,000 to $99,999 | 33 | 3.3% |
| $100,000 to $149,999 | 45 | 4.5% |
| $150,000 to $199,999 | 51 | 5.1% |
| $200,000+ | 0 | 0.0% |
Household Income by Householder Age in Ferriday
The median household income in Ferriday is $26,513, with the highest median household income of $33,313 found in the 45 to 64 years age bracket for the primary householder. A total of 438 households (43.8%) fall into this category. Meanwhile, the 15 to 24 years age bracket for the primary householder has the lowest median household income of $0, with 10 households (1.0%) in this group.
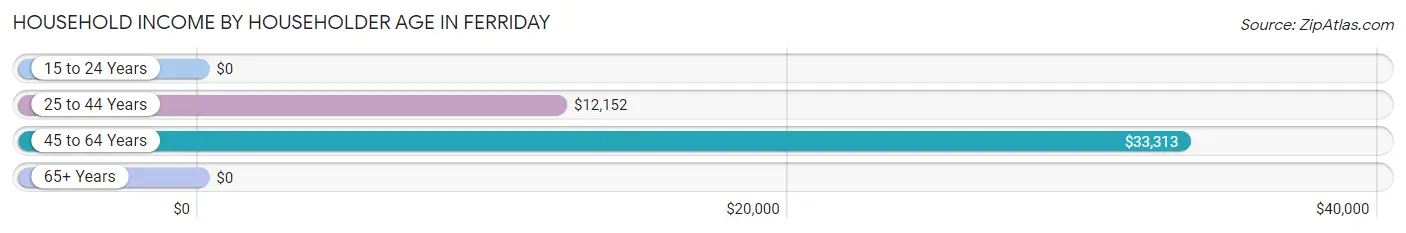
| Income Bracket | # Households | Median Income |
| 15 to 24 Years | 10 (1.0%) | $0 |
| 25 to 44 Years | 267 (26.7%) | $12,152 |
| 45 to 64 Years | 438 (43.8%) | $33,313 |
| 65+ Years | 286 (28.6%) | $0 |
| Total | 1,001 (100.0%) | $26,513 |
Poverty in Ferriday
Income Below Poverty by Sex and Age in Ferriday
With 70.6% poverty level for males and 60.0% for females among the residents of Ferriday, under 5 year old males and 5 year old females are the most vulnerable to poverty, with 39 males (100.0%) and 48 females (100.0%) in their respective age groups living below the poverty level.
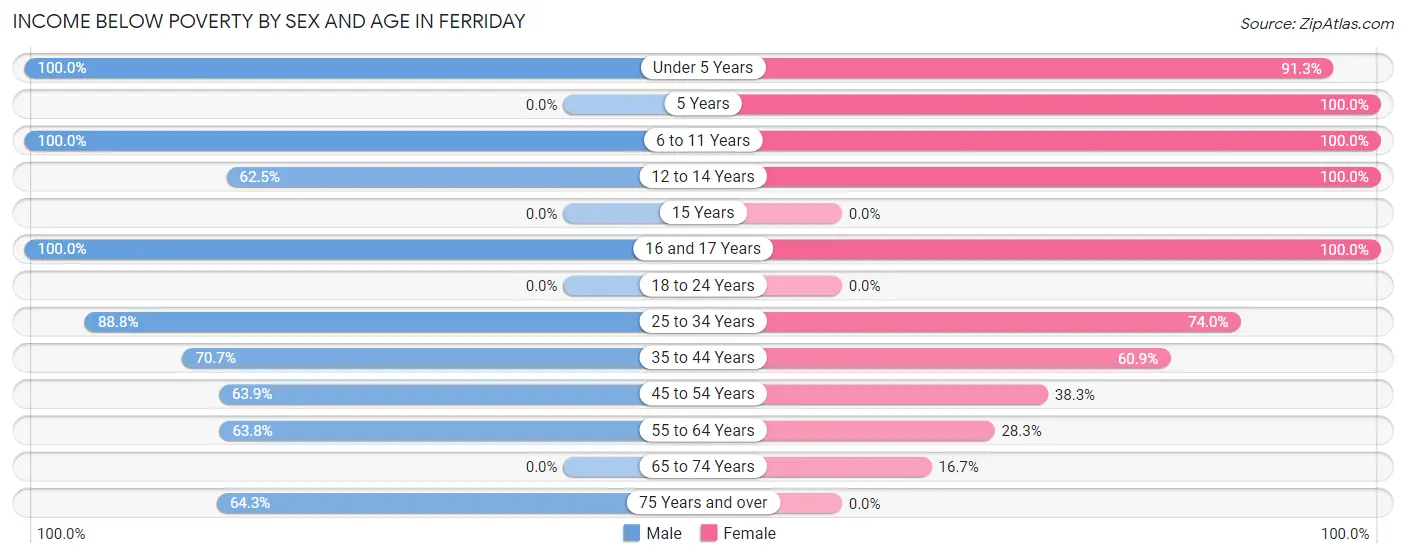
| Age Bracket | Male | Female |
| Under 5 Years | 39 (100.0%) | 209 (91.3%) |
| 5 Years | 0 (0.0%) | 48 (100.0%) |
| 6 to 11 Years | 277 (100.0%) | 178 (100.0%) |
| 12 to 14 Years | 30 (62.5%) | 196 (100.0%) |
| 15 Years | 0 (0.0%) | 0 (0.0%) |
| 16 and 17 Years | 23 (100.0%) | 26 (100.0%) |
| 18 to 24 Years | 0 (0.0%) | 0 (0.0%) |
| 25 to 34 Years | 166 (88.8%) | 267 (74.0%) |
| 35 to 44 Years | 123 (70.7%) | 67 (60.9%) |
| 45 to 54 Years | 23 (63.9%) | 101 (38.3%) |
| 55 to 64 Years | 120 (63.8%) | 70 (28.3%) |
| 65 to 74 Years | 0 (0.0%) | 19 (16.7%) |
| 75 Years and over | 27 (64.3%) | 0 (0.0%) |
| Total | 828 (70.6%) | 1,181 (60.0%) |
Income Above Poverty by Sex and Age in Ferriday
According to the poverty statistics in Ferriday, males aged 65 to 74 years and females aged 18 to 24 years are the age groups that are most secure financially, with 100.0% of males and 100.0% of females in these age groups living above the poverty line.
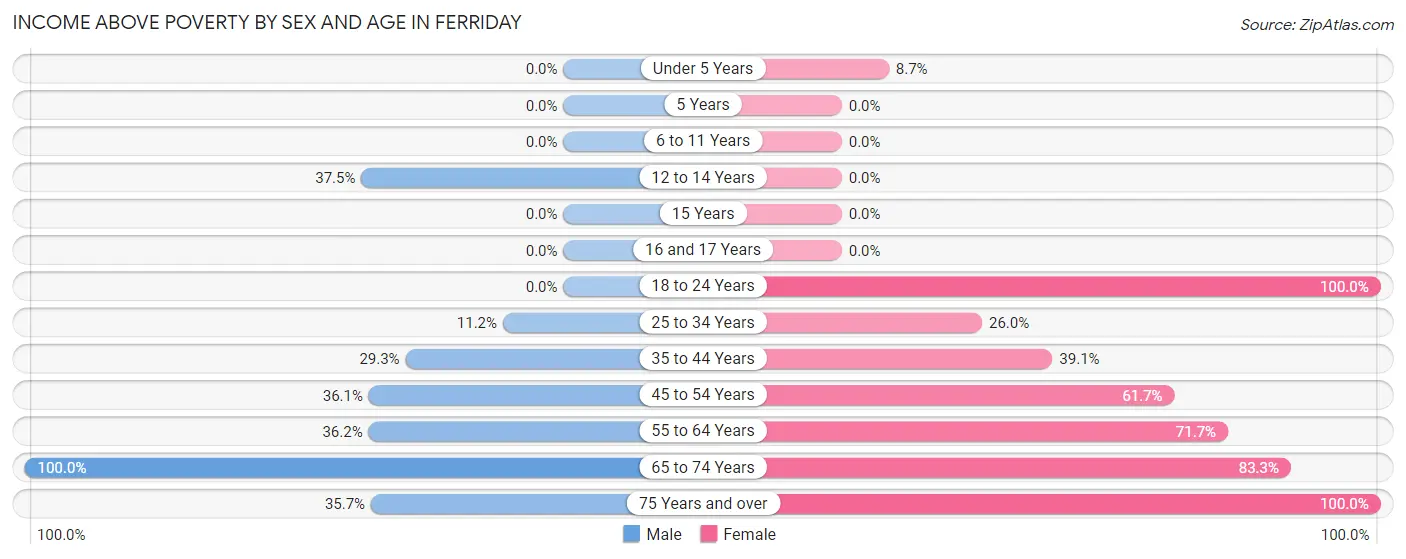
| Age Bracket | Male | Female |
| Under 5 Years | 0 (0.0%) | 20 (8.7%) |
| 5 Years | 0 (0.0%) | 0 (0.0%) |
| 6 to 11 Years | 0 (0.0%) | 0 (0.0%) |
| 12 to 14 Years | 18 (37.5%) | 0 (0.0%) |
| 15 Years | 0 (0.0%) | 0 (0.0%) |
| 16 and 17 Years | 0 (0.0%) | 0 (0.0%) |
| 18 to 24 Years | 0 (0.0%) | 148 (100.0%) |
| 25 to 34 Years | 21 (11.2%) | 94 (26.0%) |
| 35 to 44 Years | 51 (29.3%) | 43 (39.1%) |
| 45 to 54 Years | 13 (36.1%) | 163 (61.7%) |
| 55 to 64 Years | 68 (36.2%) | 177 (71.7%) |
| 65 to 74 Years | 159 (100.0%) | 95 (83.3%) |
| 75 Years and over | 15 (35.7%) | 46 (100.0%) |
| Total | 345 (29.4%) | 786 (40.0%) |
Income Below Poverty Among Married-Couple Families in Ferriday
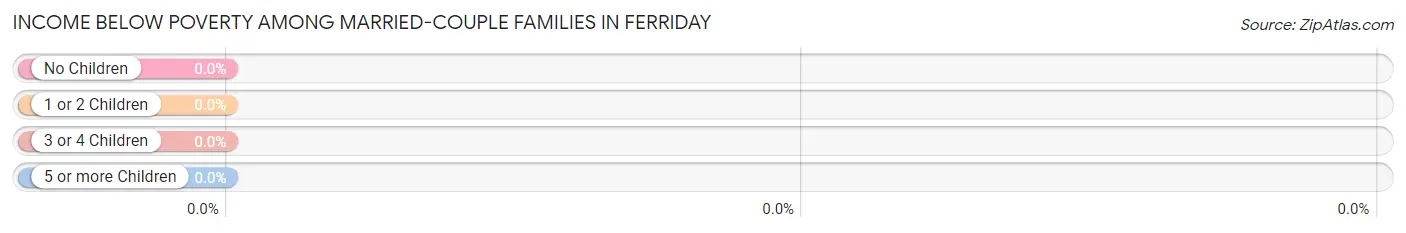
| Children | Above Poverty | Below Poverty |
| No Children | 129 (100.0%) | 0 (0.0%) |
| 1 or 2 Children | 0 (0.0%) | 0 (0.0%) |
| 3 or 4 Children | 0 (0.0%) | 0 (0.0%) |
| 5 or more Children | 0 (0.0%) | 0 (0.0%) |
| Total | 129 (100.0%) | 0 (0.0%) |
Income Below Poverty Among Single-Parent Households in Ferriday
According to the poverty data in Ferriday, 100.0% or 143 single-father households and 50.6% or 180 single-mother households are living below the poverty line. Among single-father households, those with no children have the highest poverty rate, with 23 households (100.0%) experiencing poverty. Likewise, among single-mother households, those with 3 or 4 children have the highest poverty rate, with 82 households (100.0%) falling below the poverty line.
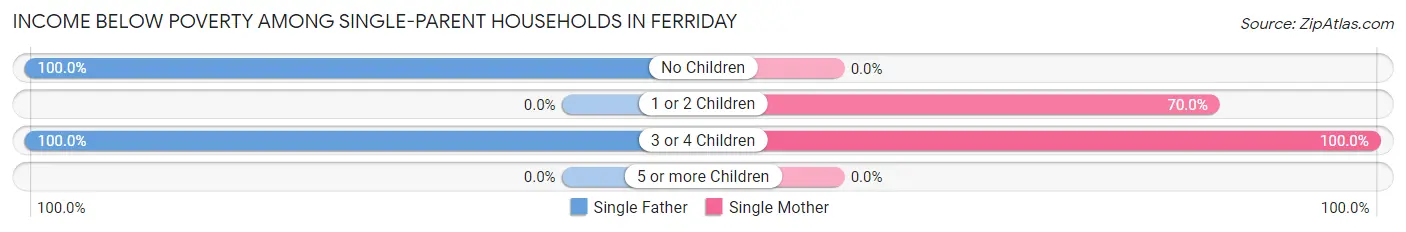
| Children | Single Father | Single Mother |
| No Children | 23 (100.0%) | 0 (0.0%) |
| 1 or 2 Children | 0 (0.0%) | 98 (70.0%) |
| 3 or 4 Children | 120 (100.0%) | 82 (100.0%) |
| 5 or more Children | 0 (0.0%) | 0 (0.0%) |
| Total | 143 (100.0%) | 180 (50.6%) |
Income Below Poverty Among Married-Couple vs Single-Parent Households in Ferriday
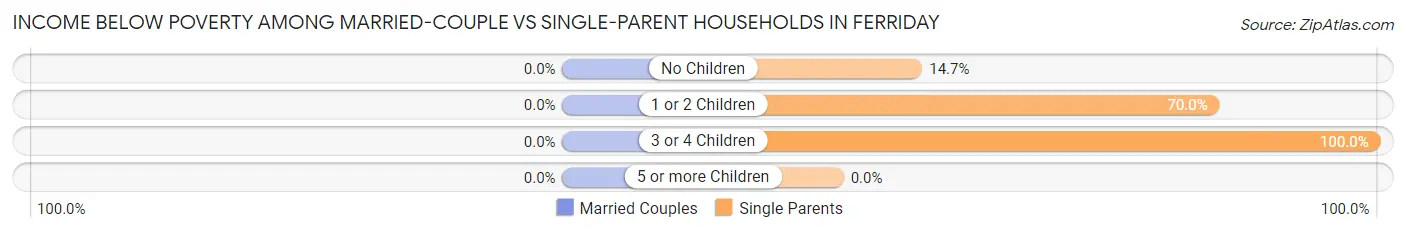
| Children | Married-Couple Families | Single-Parent Households |
| No Children | 0 (0.0%) | 23 (14.6%) |
| 1 or 2 Children | 0 (0.0%) | 98 (70.0%) |
| 3 or 4 Children | 0 (0.0%) | 202 (100.0%) |
| 5 or more Children | 0 (0.0%) | 0 (0.0%) |
| Total | 0 (0.0%) | 323 (64.7%) |
Race in Ferriday
The most populous races in Ferriday are Black / African American (2,303 | 72.2%), White / Caucasian (872 | 27.3%), and Two or more Races (17 | 0.5%).
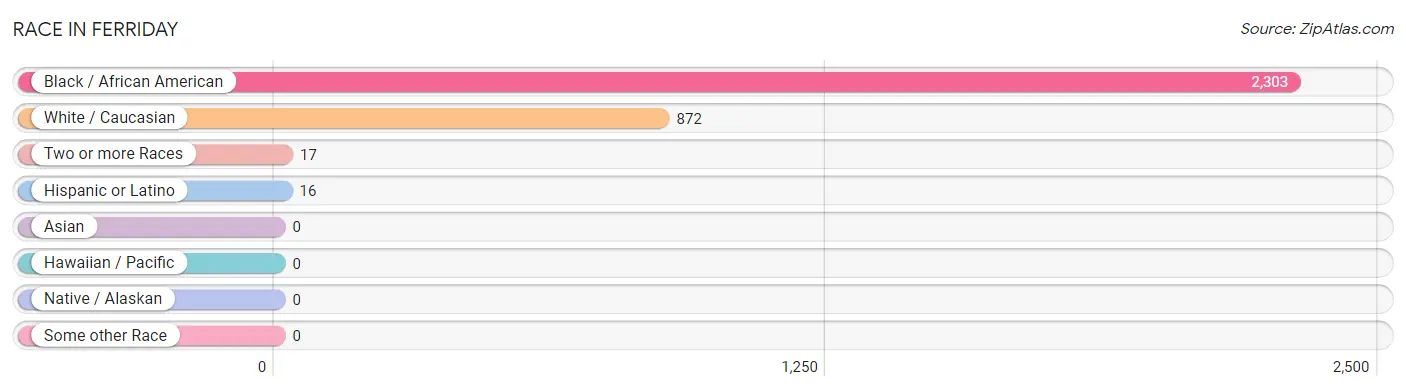
| Race | # Population | % Population |
| Asian | 0 | 0.0% |
| Black / African American | 2,303 | 72.2% |
| Hawaiian / Pacific | 0 | 0.0% |
| Hispanic or Latino | 16 | 0.5% |
| Native / Alaskan | 0 | 0.0% |
| White / Caucasian | 872 | 27.3% |
| Two or more Races | 17 | 0.5% |
| Some other Race | 0 | 0.0% |
| Total | 3,192 | 100.0% |
Ancestry in Ferriday
The most populous ancestries reported in Ferriday are Irish (707 | 22.2%), American (210 | 6.6%), French (99 | 3.1%), English (61 | 1.9%), and Italian (42 | 1.3%), together accounting for 35.1% of all Ferriday residents.
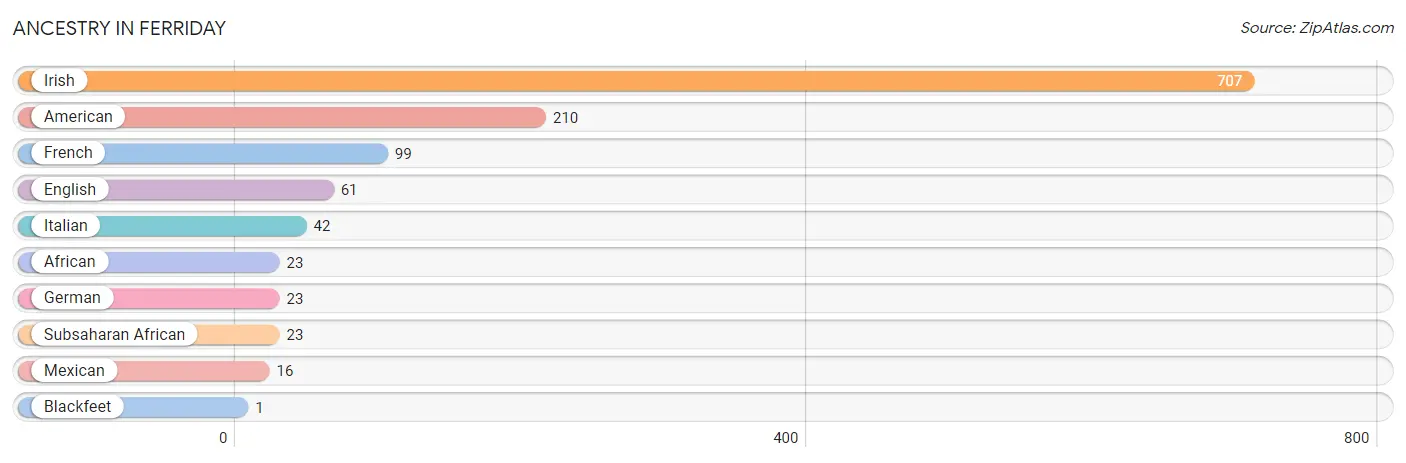
| Ancestry | # Population | % Population |
| African | 23 | 0.7% |
| American | 210 | 6.6% |
| Blackfeet | 1 | 0.0% |
| English | 61 | 1.9% |
| French | 99 | 3.1% |
| German | 23 | 0.7% |
| Irish | 707 | 22.2% |
| Italian | 42 | 1.3% |
| Mexican | 16 | 0.5% |
| Subsaharan African | 23 | 0.7% | View All 10 Rows |
Immigrants in Ferriday

| Immigration Origin | # Population | % Population | View All 0 Rows |
Sex and Age in Ferriday
Sex and Age in Ferriday
The most populous age groups in Ferriday are 5 to 9 Years (254 | 21.3%) for men and 10 to 14 Years (270 | 13.5%) for women.
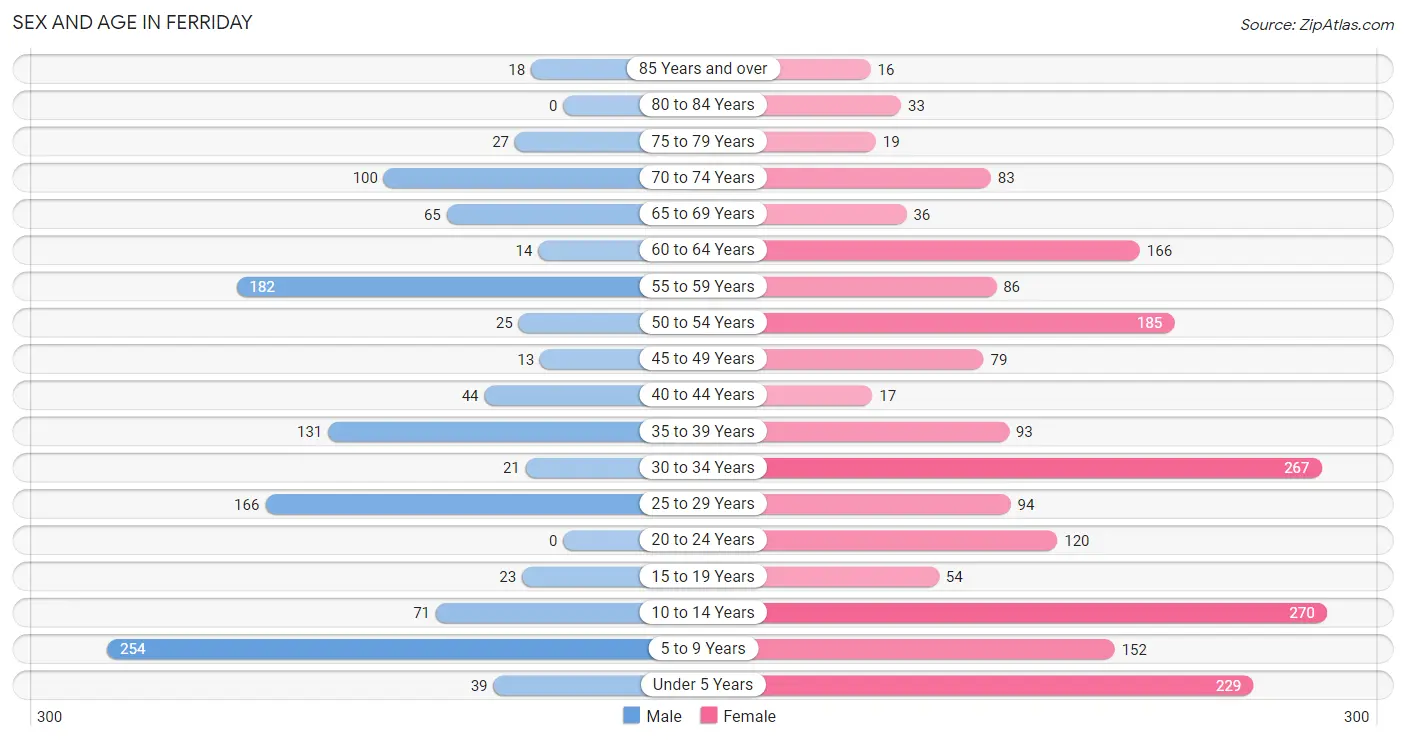
| Age Bracket | Male | Female |
| Under 5 Years | 39 (3.3%) | 229 (11.5%) |
| 5 to 9 Years | 254 (21.3%) | 152 (7.6%) |
| 10 to 14 Years | 71 (5.9%) | 270 (13.5%) |
| 15 to 19 Years | 23 (1.9%) | 54 (2.7%) |
| 20 to 24 Years | 0 (0.0%) | 120 (6.0%) |
| 25 to 29 Years | 166 (13.9%) | 94 (4.7%) |
| 30 to 34 Years | 21 (1.8%) | 267 (13.4%) |
| 35 to 39 Years | 131 (11.0%) | 93 (4.6%) |
| 40 to 44 Years | 44 (3.7%) | 17 (0.9%) |
| 45 to 49 Years | 13 (1.1%) | 79 (4.0%) |
| 50 to 54 Years | 25 (2.1%) | 185 (9.2%) |
| 55 to 59 Years | 182 (15.3%) | 86 (4.3%) |
| 60 to 64 Years | 14 (1.2%) | 166 (8.3%) |
| 65 to 69 Years | 65 (5.4%) | 36 (1.8%) |
| 70 to 74 Years | 100 (8.4%) | 83 (4.2%) |
| 75 to 79 Years | 27 (2.3%) | 19 (0.9%) |
| 80 to 84 Years | 0 (0.0%) | 33 (1.7%) |
| 85 Years and over | 18 (1.5%) | 16 (0.8%) |
| Total | 1,193 (100.0%) | 1,999 (100.0%) |
Families and Households in Ferriday
Median Family Size in Ferriday
The median family size in Ferriday is 4.30 persons per family, with single male/father families (143 | 22.8%) accounting for the largest median family size of 4.88 persons per family. On the other hand, married-couple families (129 | 20.5%) represent the smallest median family size with 2.56 persons per family.
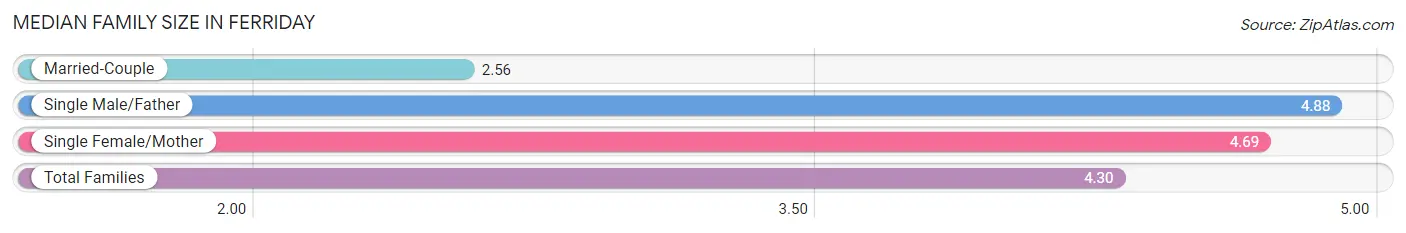
| Family Type | # Families | Family Size |
| Married-Couple | 129 (20.5%) | 2.56 |
| Single Male/Father | 143 (22.8%) | 4.88 |
| Single Female/Mother | 356 (56.7%) | 4.69 |
| Total Families | 628 (100.0%) | 4.30 |
Median Household Size in Ferriday
The median household size in Ferriday is 3.14 persons per household, with single male/father households (143 | 14.3%) accounting for the largest median household size of 4.88 persons per household. non-family households (373 | 37.3%) represent the smallest median household size with 1.03 persons per household.
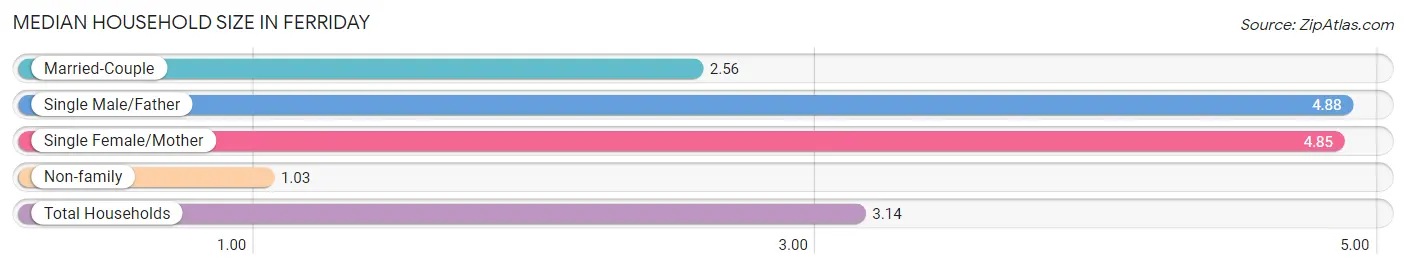
| Household Type | # Households | Household Size |
| Married-Couple | 129 (12.9%) | 2.56 |
| Single Male/Father | 143 (14.3%) | 4.88 |
| Single Female/Mother | 356 (35.6%) | 4.85 |
| Non-family | 373 (37.3%) | 1.03 |
| Total Households | 1,001 (100.0%) | 3.14 |
Household Size by Marriage Status in Ferriday
Out of a total of 1,001 households in Ferriday, 628 (62.7%) are family households, while 373 (37.3%) are nonfamily households. The most numerous type of family households are 3-person households, comprising 183, and the most common type of nonfamily households are 1-person households, comprising 363.
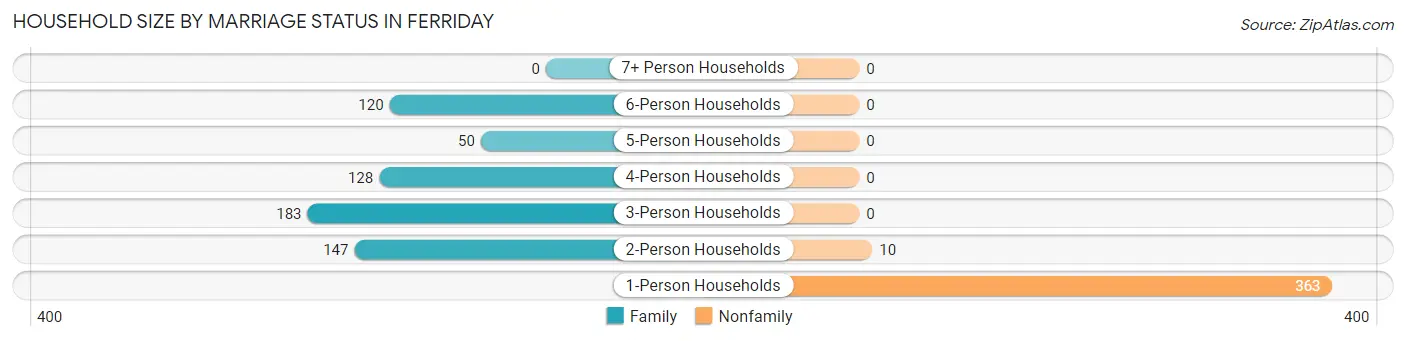
| Household Size | Family Households | Nonfamily Households |
| 1-Person Households | - | 363 (36.3%) |
| 2-Person Households | 147 (14.7%) | 10 (1.0%) |
| 3-Person Households | 183 (18.3%) | 0 (0.0%) |
| 4-Person Households | 128 (12.8%) | 0 (0.0%) |
| 5-Person Households | 50 (5.0%) | 0 (0.0%) |
| 6-Person Households | 120 (12.0%) | 0 (0.0%) |
| 7+ Person Households | 0 (0.0%) | 0 (0.0%) |
| Total | 628 (62.7%) | 373 (37.3%) |
Female Fertility in Ferriday
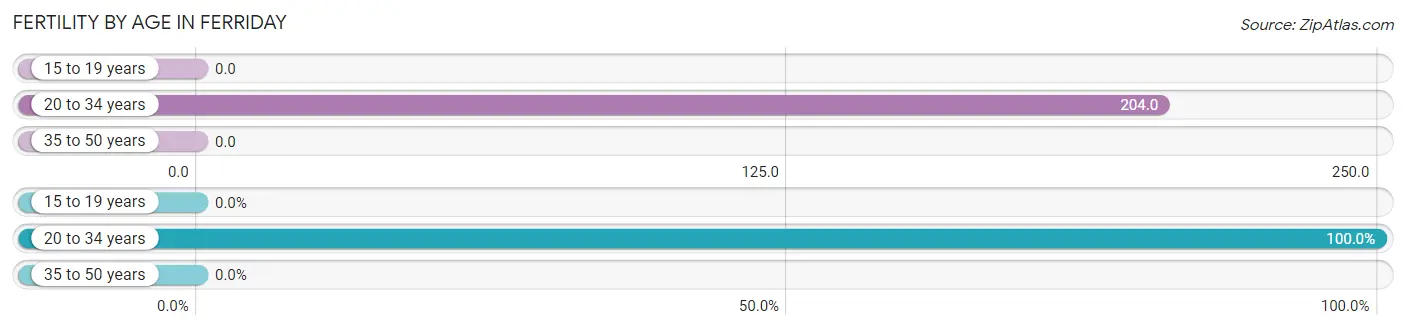
Fertility by Age in Ferriday
Average fertility rate in Ferriday is 124.0 births per 1,000 women. Women in the age bracket of 20 to 34 years have the highest fertility rate with 204.0 births per 1,000 women. Women in the age bracket of 20 to 34 years acount for 100.0% of all women with births.
| Age Bracket | Women with Births | Births / 1,000 Women |
| 15 to 19 years | 0 (0.0%) | 0.0 |
| 20 to 34 years | 98 (100.0%) | 204.0 |
| 35 to 50 years | 0 (0.0%) | 0.0 |
| Total | 98 (100.0%) | 124.0 |
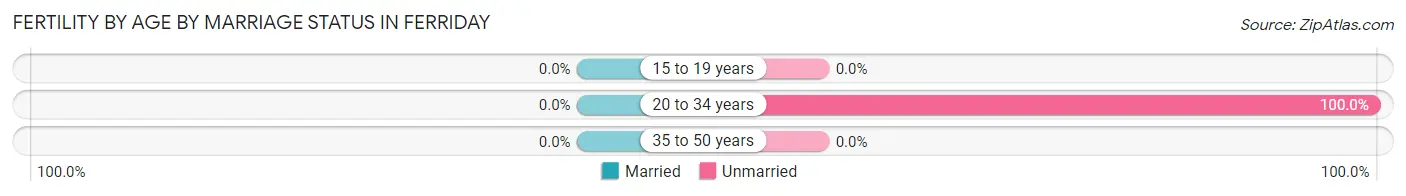
Fertility by Age by Marriage Status in Ferriday
| Age Bracket | Married | Unmarried |
| 15 to 19 years | 0 (0.0%) | 0 (0.0%) |
| 20 to 34 years | 0 (0.0%) | 98 (100.0%) |
| 35 to 50 years | 0 (0.0%) | 0 (0.0%) |
| Total | 0 (0.0%) | 98 (100.0%) |
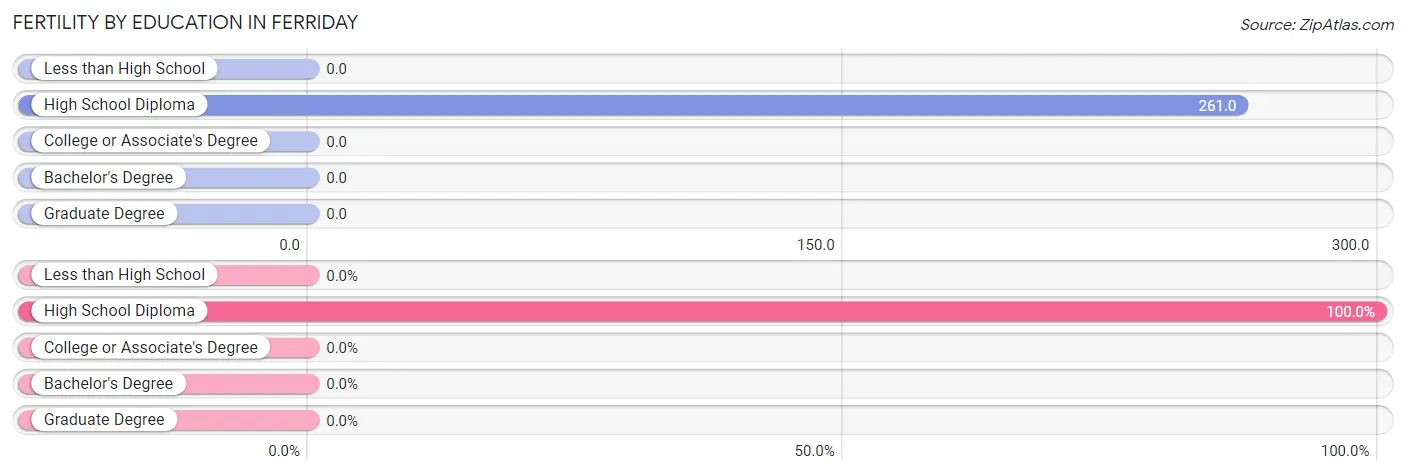
Fertility by Education in Ferriday
| Educational Attainment | Women with Births | Births / 1,000 Women |
| Less than High School | 0 (0.0%) | 0.0 |
| High School Diploma | 98 (100.0%) | 261.0 |
| College or Associate's Degree | 0 (0.0%) | 0.0 |
| Bachelor's Degree | 0 (0.0%) | 0.0 |
| Graduate Degree | 0 (0.0%) | 0.0 |
| Total | 98 (100.0%) | 124.0 |
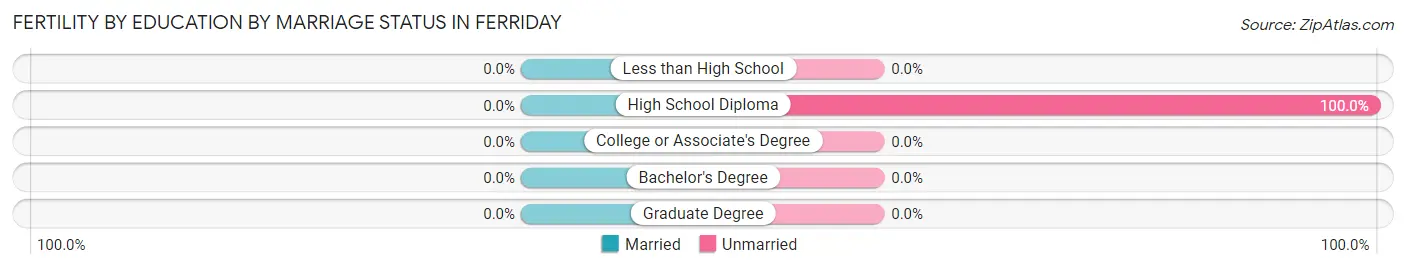
Fertility by Education by Marriage Status in Ferriday
| Educational Attainment | Married | Unmarried |
| Less than High School | 0 (0.0%) | 0 (0.0%) |
| High School Diploma | 0 (0.0%) | 98 (100.0%) |
| College or Associate's Degree | 0 (0.0%) | 0 (0.0%) |
| Bachelor's Degree | 0 (0.0%) | 0 (0.0%) |
| Graduate Degree | 0 (0.0%) | 0 (0.0%) |
| Total | 0 (0.0%) | 98 (100.0%) |
Employment Characteristics in Ferriday
Employment by Class of Employer in Ferriday
Among the 862 employed individuals in Ferriday, private company employees (502 | 58.2%), local government employees (186 | 21.6%), and self-employed (not incorporated) (90 | 10.4%) make up the most common classes of employment.
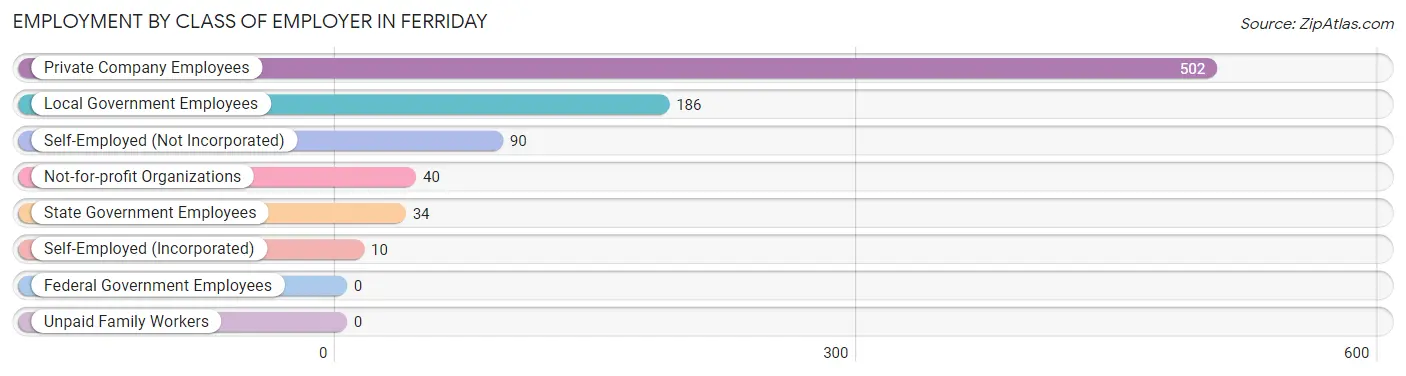
| Employer Class | # Employees | % Employees |
| Private Company Employees | 502 | 58.2% |
| Self-Employed (Incorporated) | 10 | 1.2% |
| Self-Employed (Not Incorporated) | 90 | 10.4% |
| Not-for-profit Organizations | 40 | 4.6% |
| Local Government Employees | 186 | 21.6% |
| State Government Employees | 34 | 3.9% |
| Federal Government Employees | 0 | 0.0% |
| Unpaid Family Workers | 0 | 0.0% |
| Total | 862 | 100.0% |
Employment Status by Age in Ferriday
According to the labor force statistics for Ferriday, out of the total population over 16 years of age (2,177), 51.5% or 1,121 individuals are in the labor force, with 23.2% or 260 of them unemployed. The age group with the highest labor force participation rate is 35 to 44 years, with 84.6% or 241 individuals in the labor force. Within the labor force, the 25 to 29 years age range has the highest percentage of unemployed individuals, with 79.4% or 166 of them being unemployed.
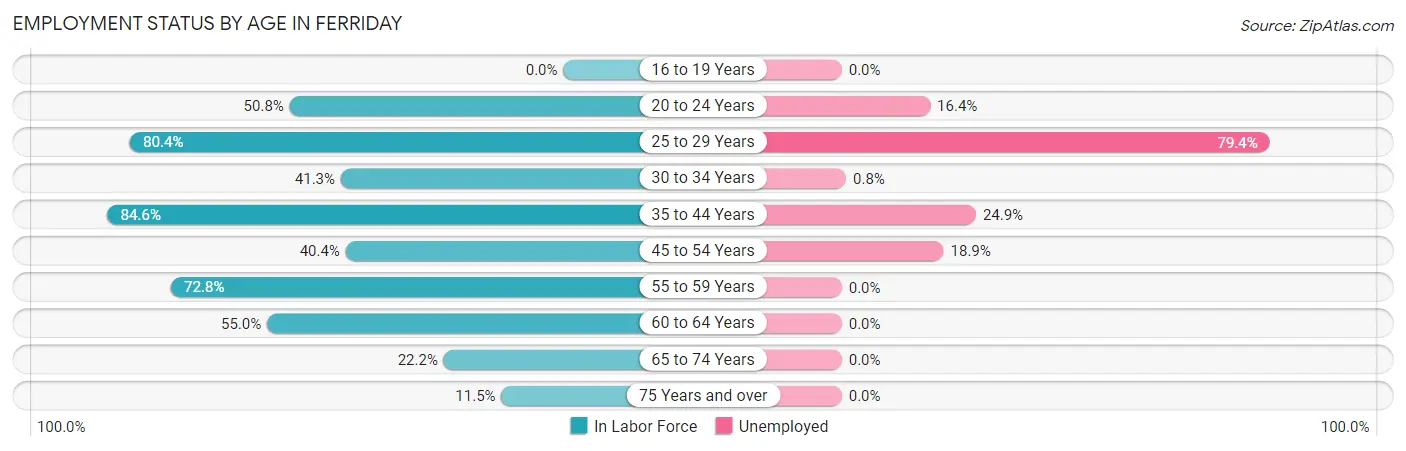
| Age Bracket | In Labor Force | Unemployed |
| 16 to 19 Years | 0 (0.0%) | 0 (0.0%) |
| 20 to 24 Years | 61 (50.8%) | 10 (16.4%) |
| 25 to 29 Years | 209 (80.4%) | 166 (79.4%) |
| 30 to 34 Years | 119 (41.3%) | 1 (0.8%) |
| 35 to 44 Years | 241 (84.6%) | 60 (24.9%) |
| 45 to 54 Years | 122 (40.4%) | 23 (18.9%) |
| 55 to 59 Years | 195 (72.8%) | 0 (0.0%) |
| 60 to 64 Years | 99 (55.0%) | 0 (0.0%) |
| 65 to 74 Years | 63 (22.2%) | 0 (0.0%) |
| 75 Years and over | 13 (11.5%) | 0 (0.0%) |
| Total | 1,121 (51.5%) | 260 (23.2%) |
Employment Status by Educational Attainment in Ferriday
According to labor force statistics for Ferriday, 62.2% of individuals (985) out of the total population between 25 and 64 years of age (1,583) are in the labor force, with 25.4% or 250 of them being unemployed. The group with the highest labor force participation rate are those with the educational attainment of bachelor's degree or higher, with 100.0% or 117 individuals in the labor force. Within the labor force, individuals with less than high school education have the highest percentage of unemployment, with 100.0% or 17 of them being unemployed.
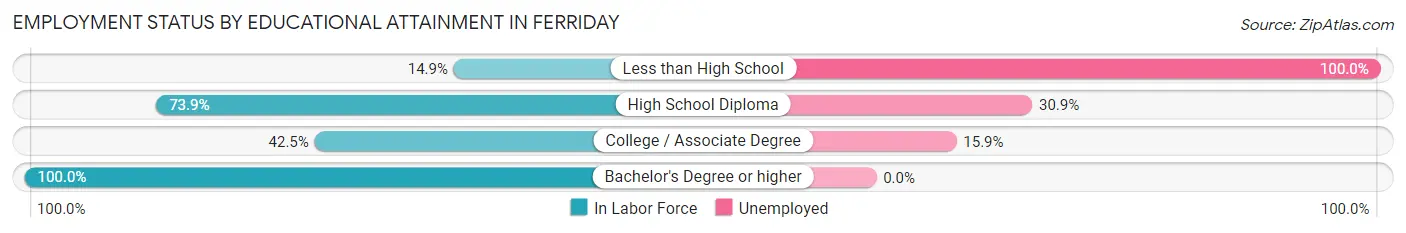
| Educational Attainment | In Labor Force | Unemployed |
| Less than High School | 17 (14.9%) | 114 (100.0%) |
| High School Diploma | 650 (73.9%) | 272 (30.9%) |
| College / Associate Degree | 201 (42.5%) | 75 (15.9%) |
| Bachelor's Degree or higher | 117 (100.0%) | 0 (0.0%) |
| Total | 985 (62.2%) | 402 (25.4%) |
Employment Occupations by Sex in Ferriday
Management, Business, Science and Arts Occupations
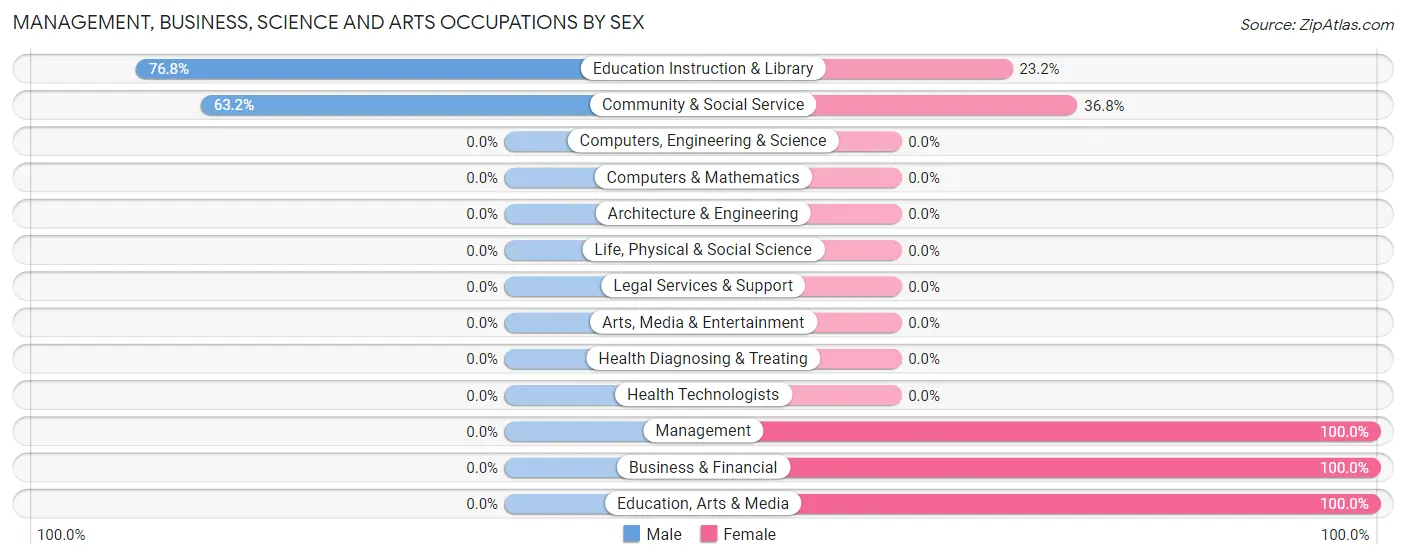
The most common Management, Business, Science and Arts occupations in Ferriday are Management (89 | 10.3%), Community & Social Service (68 | 7.9%), Education Instruction & Library (56 | 6.5%), Business & Financial (32 | 3.7%), and Education, Arts & Media (12 | 1.4%).
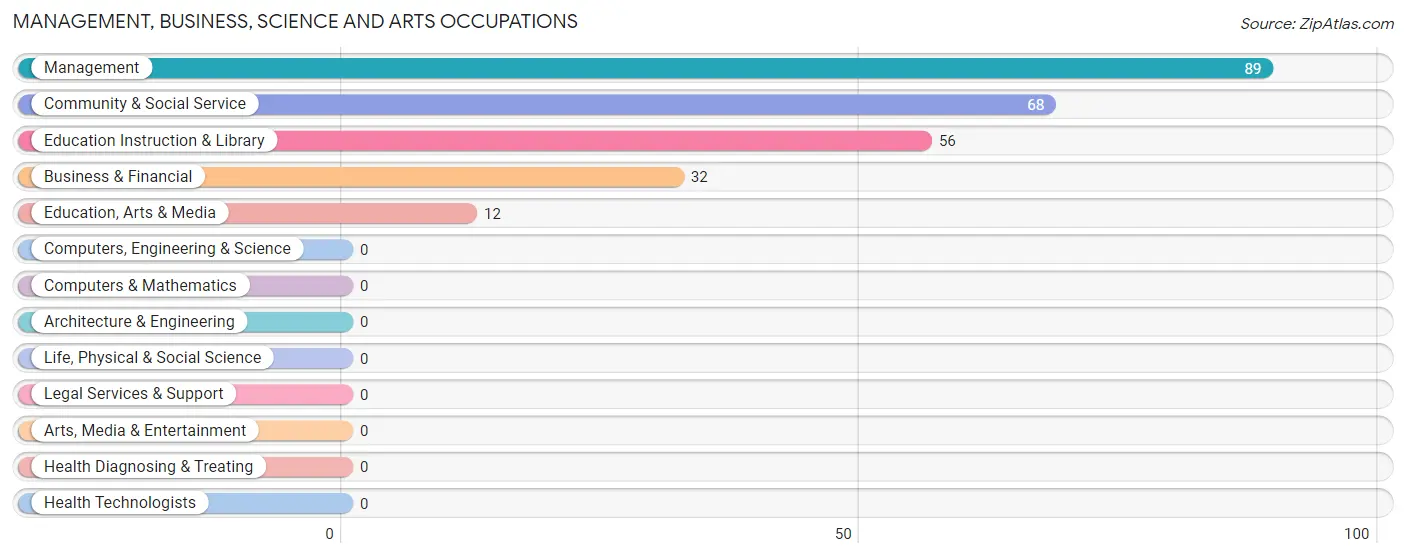
Management, Business, Science and Arts Occupations by Sex
Within the Management, Business, Science and Arts occupations in Ferriday, the most male-oriented occupations are Education Instruction & Library (76.8%), and Community & Social Service (63.2%), while the most female-oriented occupations are Management (100.0%), Business & Financial (100.0%), and Education, Arts & Media (100.0%).
| Occupation | Male | Female |
| Management | 0 (0.0%) | 89 (100.0%) |
| Business & Financial | 0 (0.0%) | 32 (100.0%) |
| Computers, Engineering & Science | 0 (0.0%) | 0 (0.0%) |
| Computers & Mathematics | 0 (0.0%) | 0 (0.0%) |
| Architecture & Engineering | 0 (0.0%) | 0 (0.0%) |
| Life, Physical & Social Science | 0 (0.0%) | 0 (0.0%) |
| Community & Social Service | 43 (63.2%) | 25 (36.8%) |
| Education, Arts & Media | 0 (0.0%) | 12 (100.0%) |
| Legal Services & Support | 0 (0.0%) | 0 (0.0%) |
| Education Instruction & Library | 43 (76.8%) | 13 (23.2%) |
| Arts, Media & Entertainment | 0 (0.0%) | 0 (0.0%) |
| Health Diagnosing & Treating | 0 (0.0%) | 0 (0.0%) |
| Health Technologists | 0 (0.0%) | 0 (0.0%) |
| Total (Category) | 43 (22.8%) | 146 (77.2%) |
| Total (Overall) | 309 (35.8%) | 553 (64.1%) |
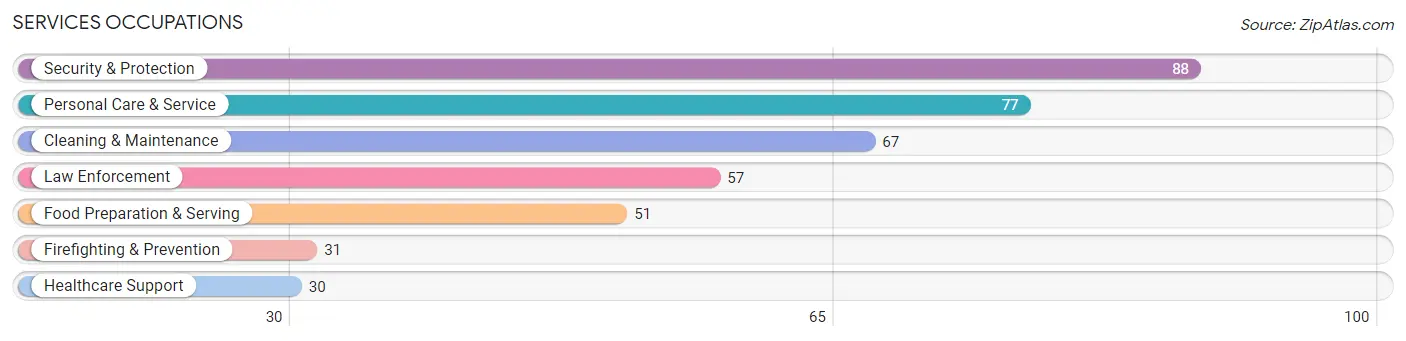
Services Occupations
The most common Services occupations in Ferriday are Security & Protection (88 | 10.2%), Personal Care & Service (77 | 8.9%), Cleaning & Maintenance (67 | 7.8%), Law Enforcement (57 | 6.6%), and Food Preparation & Serving (51 | 5.9%).
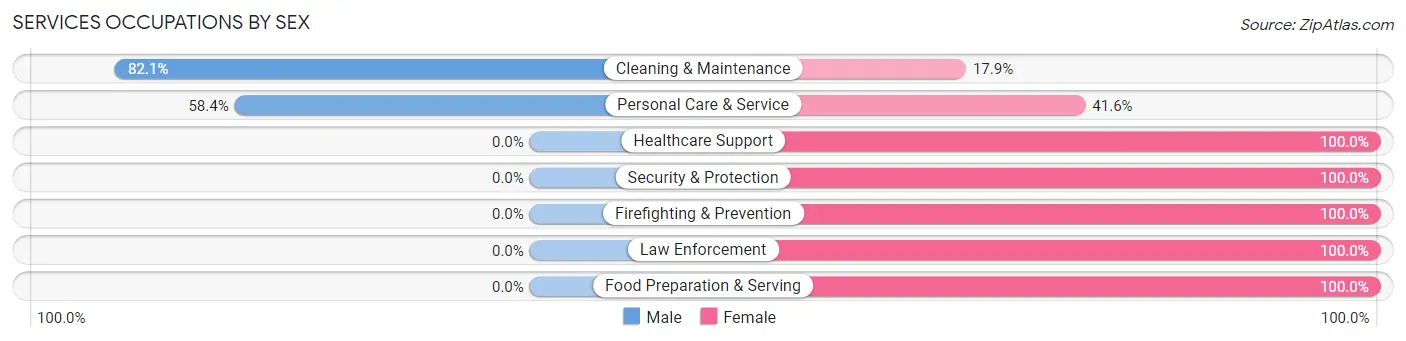
Services Occupations by Sex
Within the Services occupations in Ferriday, the most male-oriented occupations are Cleaning & Maintenance (82.1%), and Personal Care & Service (58.4%), while the most female-oriented occupations are Healthcare Support (100.0%), Security & Protection (100.0%), and Firefighting & Prevention (100.0%).
| Occupation | Male | Female |
| Healthcare Support | 0 (0.0%) | 30 (100.0%) |
| Security & Protection | 0 (0.0%) | 88 (100.0%) |
| Firefighting & Prevention | 0 (0.0%) | 31 (100.0%) |
| Law Enforcement | 0 (0.0%) | 57 (100.0%) |
| Food Preparation & Serving | 0 (0.0%) | 51 (100.0%) |
| Cleaning & Maintenance | 55 (82.1%) | 12 (17.9%) |
| Personal Care & Service | 45 (58.4%) | 32 (41.6%) |
| Total (Category) | 100 (32.0%) | 213 (68.0%) |
| Total (Overall) | 309 (35.8%) | 553 (64.1%) |
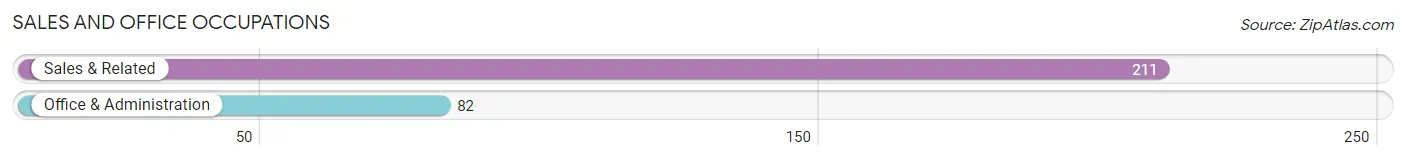
Sales and Office Occupations
The most common Sales and Office occupations in Ferriday are Sales & Related (211 | 24.5%), and Office & Administration (82 | 9.5%).
Sales and Office Occupations by Sex
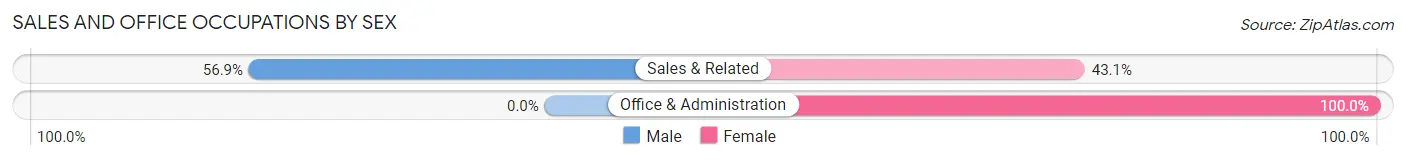
| Occupation | Male | Female |
| Sales & Related | 120 (56.9%) | 91 (43.1%) |
| Office & Administration | 0 (0.0%) | 82 (100.0%) |
| Total (Category) | 120 (41.0%) | 173 (59.0%) |
| Total (Overall) | 309 (35.8%) | 553 (64.1%) |
Natural Resources, Construction and Maintenance Occupations
The most common Natural Resources, Construction and Maintenance occupations in Ferriday are , and Farming, Fishing & Forestry (27 | 3.1%).
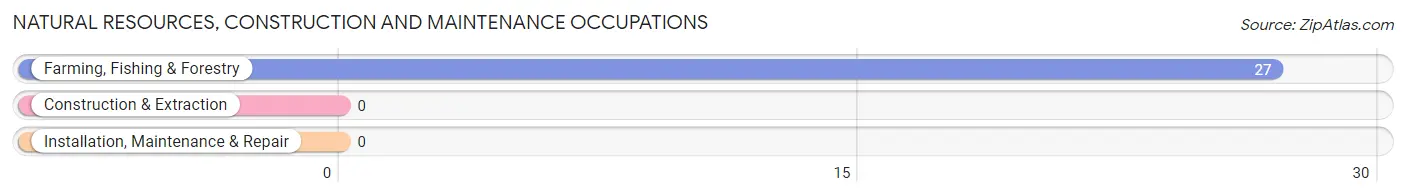
Natural Resources, Construction and Maintenance Occupations by Sex
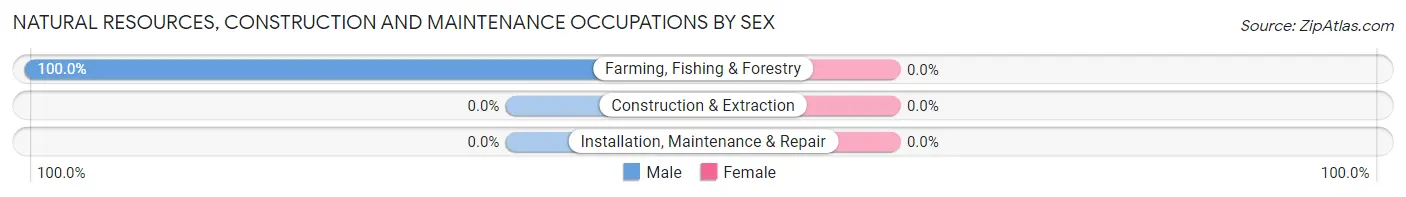
| Occupation | Male | Female |
| Farming, Fishing & Forestry | 27 (100.0%) | 0 (0.0%) |
| Construction & Extraction | 0 (0.0%) | 0 (0.0%) |
| Installation, Maintenance & Repair | 0 (0.0%) | 0 (0.0%) |
| Total (Category) | 27 (100.0%) | 0 (0.0%) |
| Total (Overall) | 309 (35.8%) | 553 (64.1%) |
Production, Transportation and Moving Occupations
The most common Production, Transportation and Moving occupations in Ferriday are Production (21 | 2.4%), Transportation (11 | 1.3%), and Material Moving (8 | 0.9%).
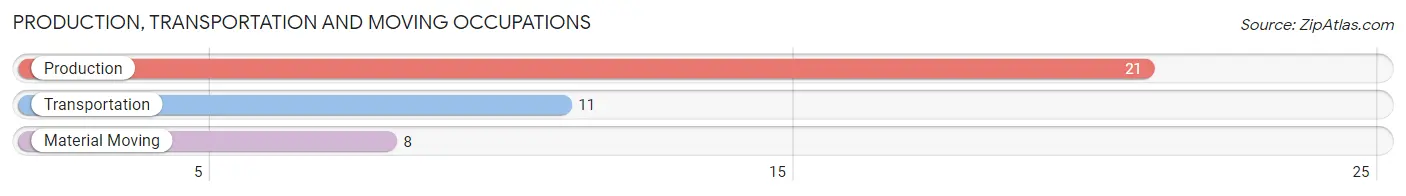
Production, Transportation and Moving Occupations by Sex
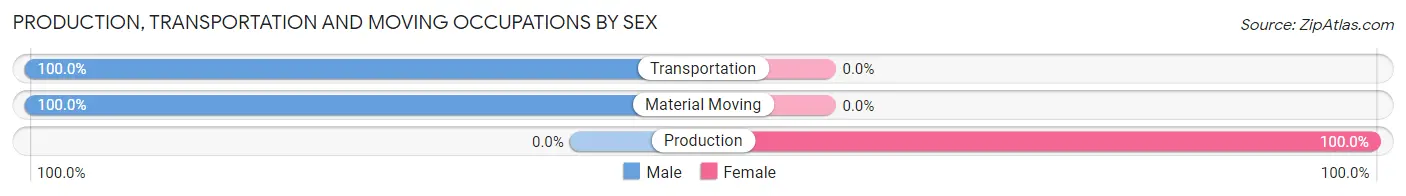
| Occupation | Male | Female |
| Production | 0 (0.0%) | 21 (100.0%) |
| Transportation | 11 (100.0%) | 0 (0.0%) |
| Material Moving | 8 (100.0%) | 0 (0.0%) |
| Total (Category) | 19 (47.5%) | 21 (52.5%) |
| Total (Overall) | 309 (35.8%) | 553 (64.1%) |
Employment Industries by Sex in Ferriday
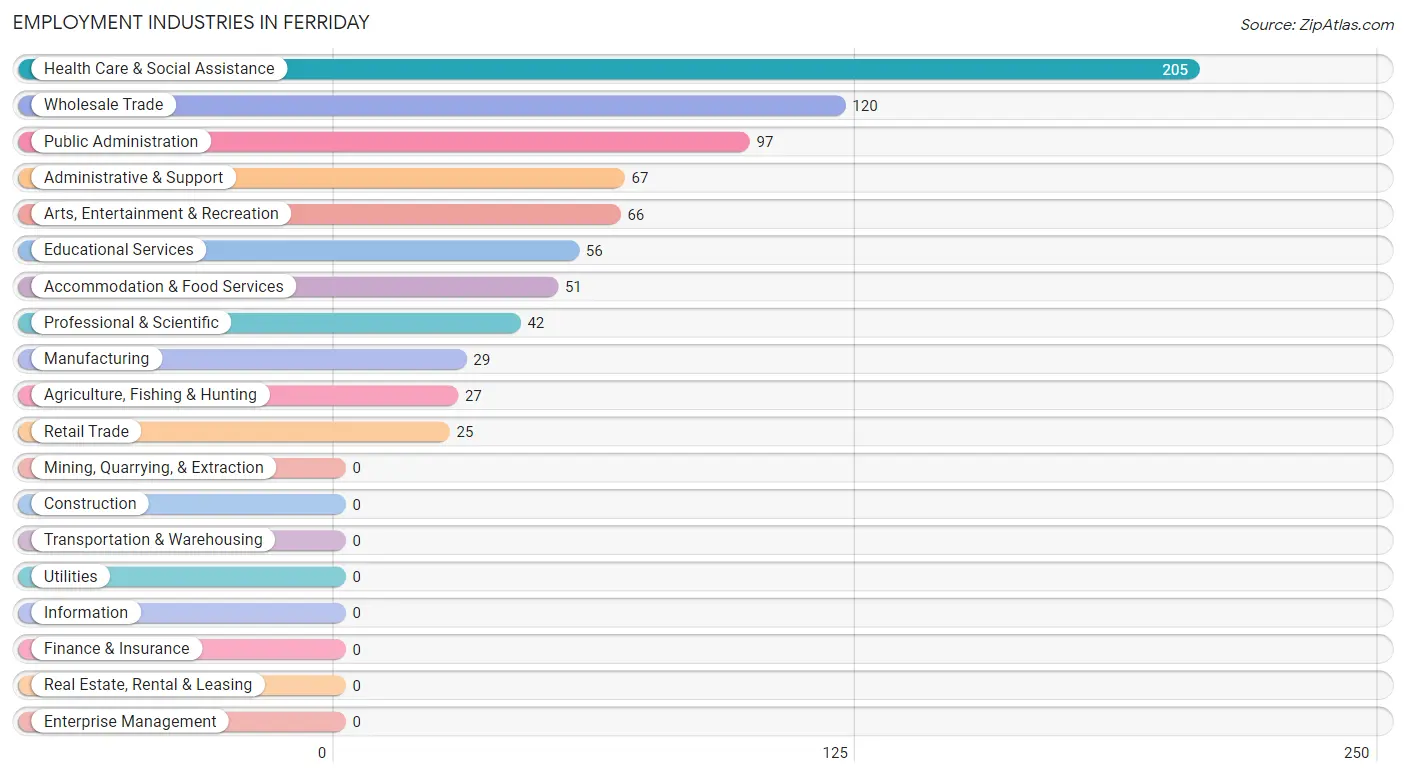
Employment Industries in Ferriday
The major employment industries in Ferriday include Health Care & Social Assistance (205 | 23.8%), Wholesale Trade (120 | 13.9%), Public Administration (97 | 11.3%), Administrative & Support (67 | 7.8%), and Arts, Entertainment & Recreation (66 | 7.7%).
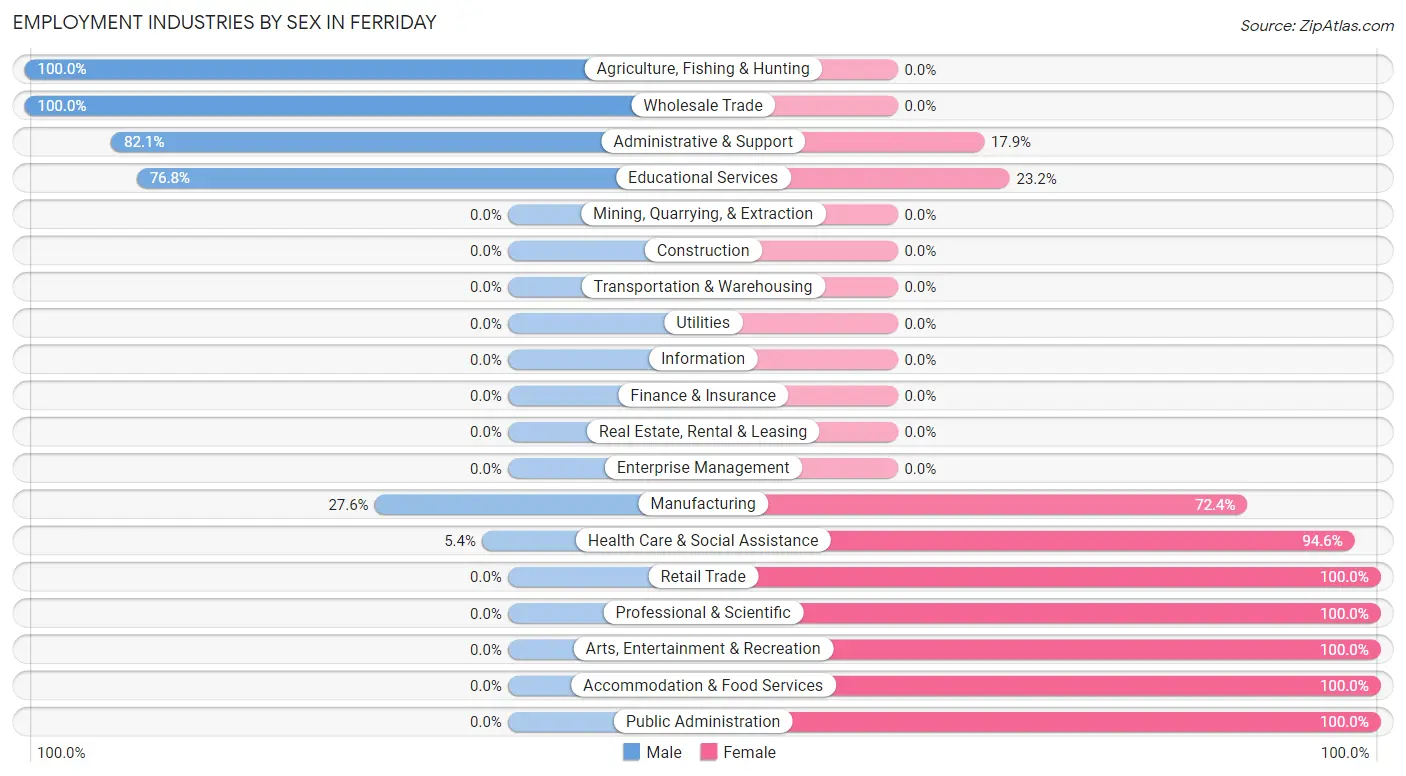
Employment Industries by Sex in Ferriday
The Ferriday industries that see more men than women are Agriculture, Fishing & Hunting (100.0%), Wholesale Trade (100.0%), and Administrative & Support (82.1%), whereas the industries that tend to have a higher number of women are Retail Trade (100.0%), Professional & Scientific (100.0%), and Arts, Entertainment & Recreation (100.0%).
| Industry | Male | Female |
| Agriculture, Fishing & Hunting | 27 (100.0%) | 0 (0.0%) |
| Mining, Quarrying, & Extraction | 0 (0.0%) | 0 (0.0%) |
| Construction | 0 (0.0%) | 0 (0.0%) |
| Manufacturing | 8 (27.6%) | 21 (72.4%) |
| Wholesale Trade | 120 (100.0%) | 0 (0.0%) |
| Retail Trade | 0 (0.0%) | 25 (100.0%) |
| Transportation & Warehousing | 0 (0.0%) | 0 (0.0%) |
| Utilities | 0 (0.0%) | 0 (0.0%) |
| Information | 0 (0.0%) | 0 (0.0%) |
| Finance & Insurance | 0 (0.0%) | 0 (0.0%) |
| Real Estate, Rental & Leasing | 0 (0.0%) | 0 (0.0%) |
| Professional & Scientific | 0 (0.0%) | 42 (100.0%) |
| Enterprise Management | 0 (0.0%) | 0 (0.0%) |
| Administrative & Support | 55 (82.1%) | 12 (17.9%) |
| Educational Services | 43 (76.8%) | 13 (23.2%) |
| Health Care & Social Assistance | 11 (5.4%) | 194 (94.6%) |
| Arts, Entertainment & Recreation | 0 (0.0%) | 66 (100.0%) |
| Accommodation & Food Services | 0 (0.0%) | 51 (100.0%) |
| Public Administration | 0 (0.0%) | 97 (100.0%) |
| Total | 309 (35.8%) | 553 (64.1%) |
Education in Ferriday
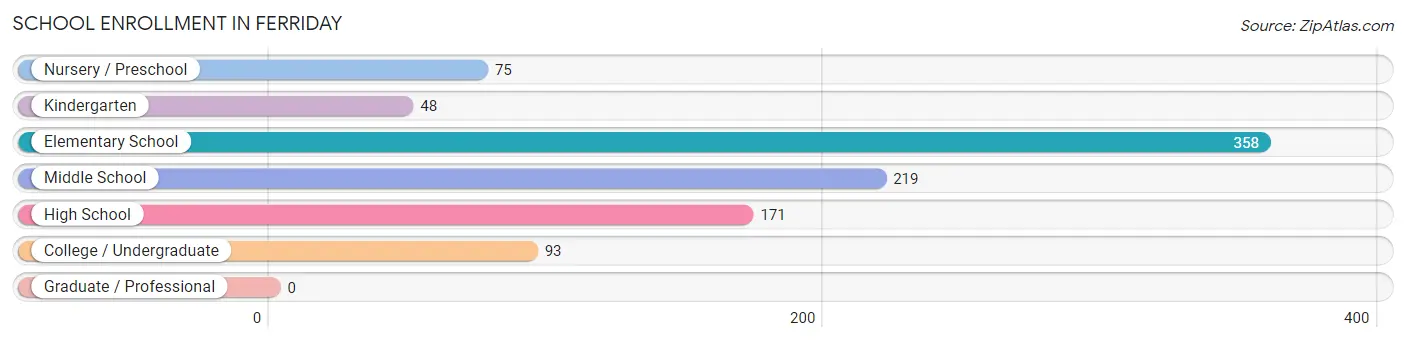
School Enrollment in Ferriday
The most common levels of schooling among the 964 students in Ferriday are elementary school (358 | 37.1%), middle school (219 | 22.7%), and high school (171 | 17.7%).
| School Level | # Students | % Students |
| Nursery / Preschool | 75 | 7.8% |
| Kindergarten | 48 | 5.0% |
| Elementary School | 358 | 37.1% |
| Middle School | 219 | 22.7% |
| High School | 171 | 17.7% |
| College / Undergraduate | 93 | 9.7% |
| Graduate / Professional | 0 | 0.0% |
| Total | 964 | 100.0% |
School Enrollment by Age by Funding Source in Ferriday
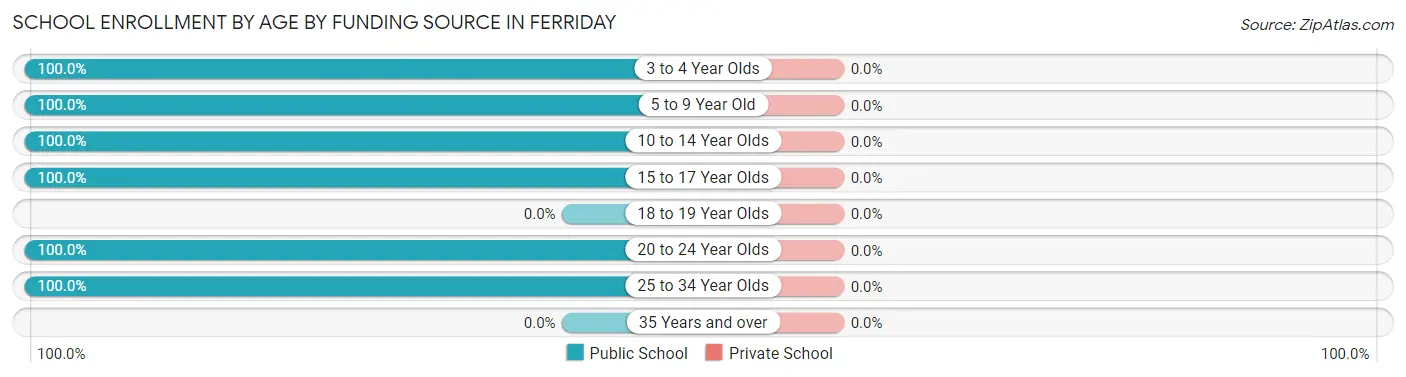
| Age Bracket | Public School | Private School |
| 3 to 4 Year Olds | 75 (100.0%) | 0 (0.0%) |
| 5 to 9 Year Old | 406 (100.0%) | 0 (0.0%) |
| 10 to 14 Year Olds | 341 (100.0%) | 0 (0.0%) |
| 15 to 17 Year Olds | 49 (100.0%) | 0 (0.0%) |
| 18 to 19 Year Olds | 0 (0.0%) | 0 (0.0%) |
| 20 to 24 Year Olds | 59 (100.0%) | 0 (0.0%) |
| 25 to 34 Year Olds | 34 (100.0%) | 0 (0.0%) |
| 35 Years and over | 0 (0.0%) | 0 (0.0%) |
| Total | 964 (100.0%) | 0 (0.0%) |
Educational Attainment by Field of Study in Ferriday
Business (96 | 39.0%), education (82 | 33.3%), arts & humanities (47 | 19.1%), and bio, nature & agricultural (21 | 8.5%) are the most common fields of study among 246 individuals in Ferriday who have obtained a bachelor's degree or higher.
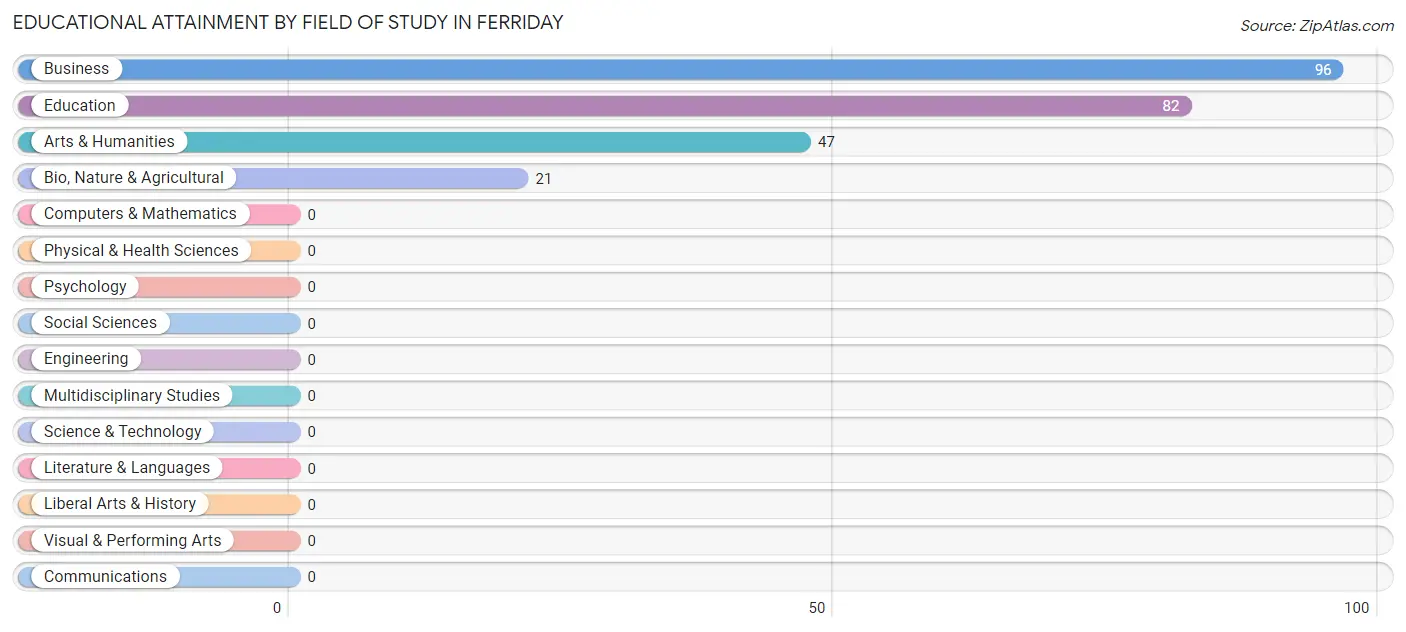
| Field of Study | # Graduates | % Graduates |
| Computers & Mathematics | 0 | 0.0% |
| Bio, Nature & Agricultural | 21 | 8.5% |
| Physical & Health Sciences | 0 | 0.0% |
| Psychology | 0 | 0.0% |
| Social Sciences | 0 | 0.0% |
| Engineering | 0 | 0.0% |
| Multidisciplinary Studies | 0 | 0.0% |
| Science & Technology | 0 | 0.0% |
| Business | 96 | 39.0% |
| Education | 82 | 33.3% |
| Literature & Languages | 0 | 0.0% |
| Liberal Arts & History | 0 | 0.0% |
| Visual & Performing Arts | 0 | 0.0% |
| Communications | 0 | 0.0% |
| Arts & Humanities | 47 | 19.1% |
| Total | 246 | 100.0% |
Transportation & Commute in Ferriday
Vehicle Availability by Sex in Ferriday
The most prevalent vehicle ownership categories in Ferriday are males with 2 vehicles (194, accounting for 62.8%) and females with 2 vehicles (235, making up 35.1%).
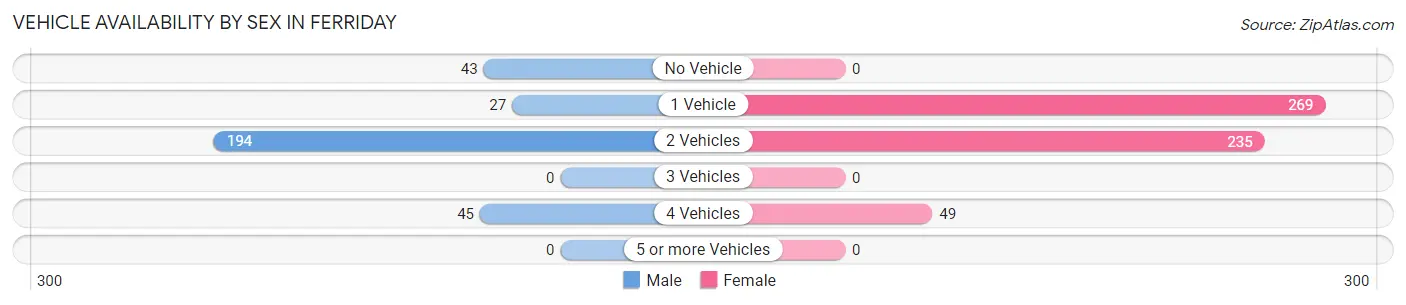
| Vehicles Available | Male | Female |
| No Vehicle | 43 (13.9%) | 0 (0.0%) |
| 1 Vehicle | 27 (8.7%) | 269 (48.6%) |
| 2 Vehicles | 194 (62.8%) | 235 (42.5%) |
| 3 Vehicles | 0 (0.0%) | 0 (0.0%) |
| 4 Vehicles | 45 (14.6%) | 49 (8.9%) |
| 5 or more Vehicles | 0 (0.0%) | 0 (0.0%) |
| Total | 309 (100.0%) | 553 (100.0%) |
Commute Time in Ferriday
The most frequently occuring commute durations in Ferriday are 30 to 34 minutes (244 commuters, 28.3%), less than 5 minutes (168 commuters, 19.5%), and 15 to 19 minutes (103 commuters, 11.9%).
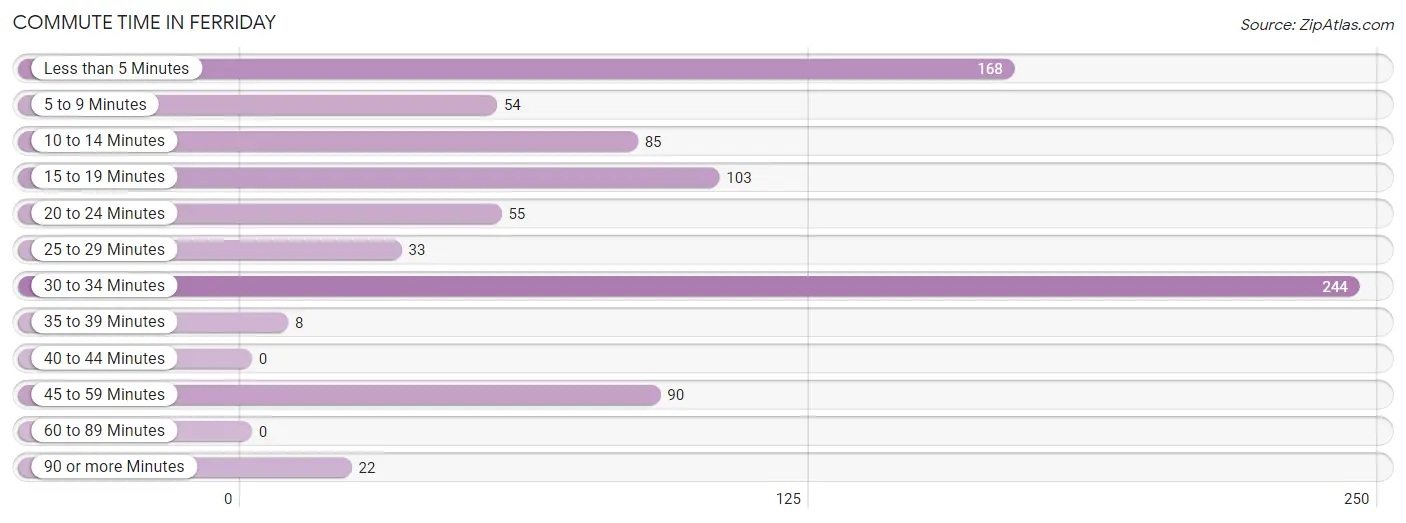
| Commute Time | # Commuters | % Commuters |
| Less than 5 Minutes | 168 | 19.5% |
| 5 to 9 Minutes | 54 | 6.3% |
| 10 to 14 Minutes | 85 | 9.9% |
| 15 to 19 Minutes | 103 | 11.9% |
| 20 to 24 Minutes | 55 | 6.4% |
| 25 to 29 Minutes | 33 | 3.8% |
| 30 to 34 Minutes | 244 | 28.3% |
| 35 to 39 Minutes | 8 | 0.9% |
| 40 to 44 Minutes | 0 | 0.0% |
| 45 to 59 Minutes | 90 | 10.4% |
| 60 to 89 Minutes | 0 | 0.0% |
| 90 or more Minutes | 22 | 2.5% |
Commute Time by Sex in Ferriday
The most common commute times in Ferriday are 30 to 34 minutes (165 commuters, 53.4%) for males and less than 5 minutes (125 commuters, 22.6%) for females.
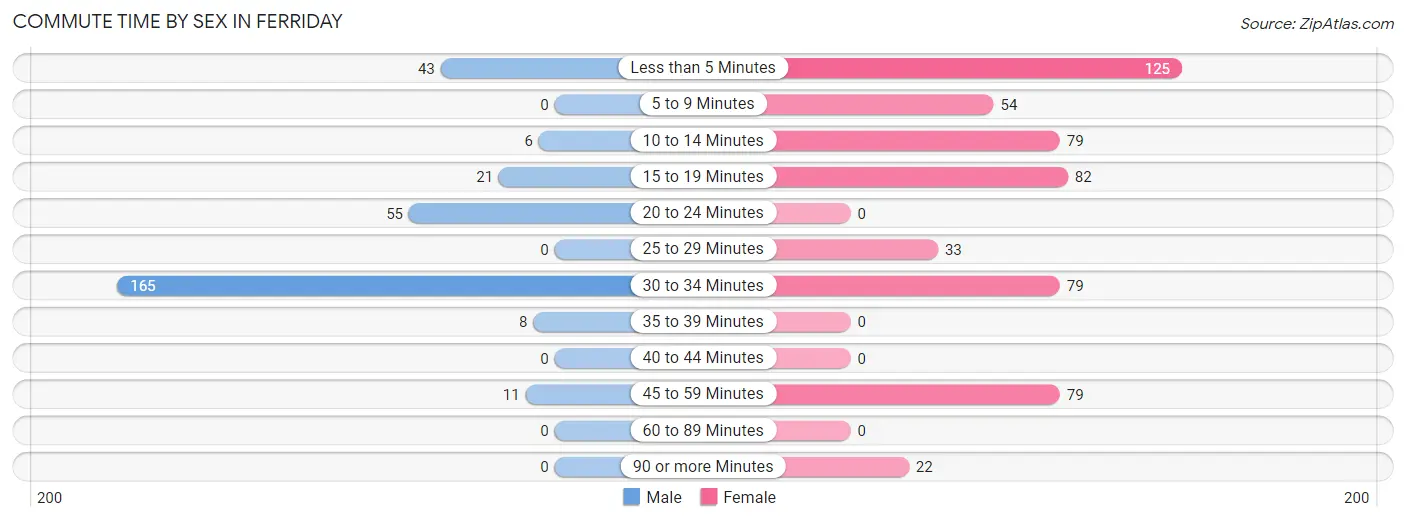
| Commute Time | Male | Female |
| Less than 5 Minutes | 43 (13.9%) | 125 (22.6%) |
| 5 to 9 Minutes | 0 (0.0%) | 54 (9.8%) |
| 10 to 14 Minutes | 6 (1.9%) | 79 (14.3%) |
| 15 to 19 Minutes | 21 (6.8%) | 82 (14.8%) |
| 20 to 24 Minutes | 55 (17.8%) | 0 (0.0%) |
| 25 to 29 Minutes | 0 (0.0%) | 33 (6.0%) |
| 30 to 34 Minutes | 165 (53.4%) | 79 (14.3%) |
| 35 to 39 Minutes | 8 (2.6%) | 0 (0.0%) |
| 40 to 44 Minutes | 0 (0.0%) | 0 (0.0%) |
| 45 to 59 Minutes | 11 (3.6%) | 79 (14.3%) |
| 60 to 89 Minutes | 0 (0.0%) | 0 (0.0%) |
| 90 or more Minutes | 0 (0.0%) | 22 (4.0%) |
Time of Departure to Work by Sex in Ferriday
The most frequent times of departure to work in Ferriday are 7:00 AM to 7:29 AM (207, 67.0%) for males and 9:00 AM to 9:59 AM (109, 19.7%) for females.
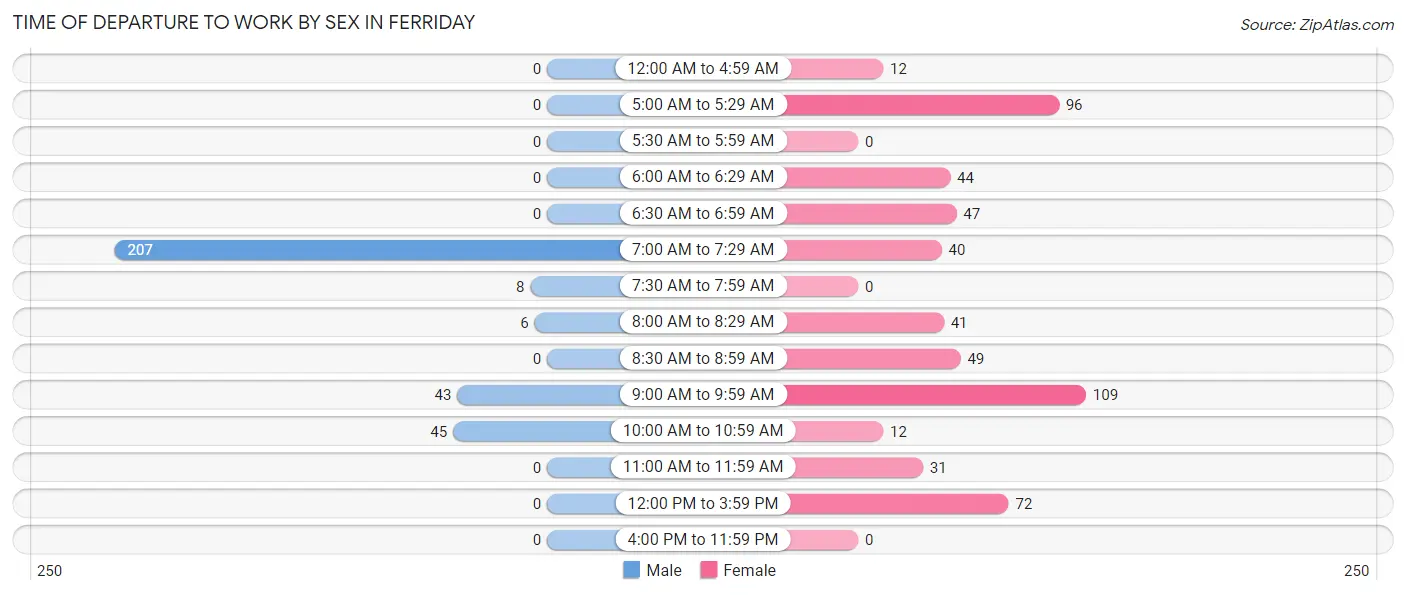
| Time of Departure | Male | Female |
| 12:00 AM to 4:59 AM | 0 (0.0%) | 12 (2.2%) |
| 5:00 AM to 5:29 AM | 0 (0.0%) | 96 (17.4%) |
| 5:30 AM to 5:59 AM | 0 (0.0%) | 0 (0.0%) |
| 6:00 AM to 6:29 AM | 0 (0.0%) | 44 (8.0%) |
| 6:30 AM to 6:59 AM | 0 (0.0%) | 47 (8.5%) |
| 7:00 AM to 7:29 AM | 207 (67.0%) | 40 (7.2%) |
| 7:30 AM to 7:59 AM | 8 (2.6%) | 0 (0.0%) |
| 8:00 AM to 8:29 AM | 6 (1.9%) | 41 (7.4%) |
| 8:30 AM to 8:59 AM | 0 (0.0%) | 49 (8.9%) |
| 9:00 AM to 9:59 AM | 43 (13.9%) | 109 (19.7%) |
| 10:00 AM to 10:59 AM | 45 (14.6%) | 12 (2.2%) |
| 11:00 AM to 11:59 AM | 0 (0.0%) | 31 (5.6%) |
| 12:00 PM to 3:59 PM | 0 (0.0%) | 72 (13.0%) |
| 4:00 PM to 11:59 PM | 0 (0.0%) | 0 (0.0%) |
| Total | 309 (100.0%) | 553 (100.0%) |
Housing Occupancy in Ferriday
Occupancy by Ownership in Ferriday
Of the total 1,001 dwellings in Ferriday, owner-occupied units account for 676 (67.5%), while renter-occupied units make up 325 (32.5%).
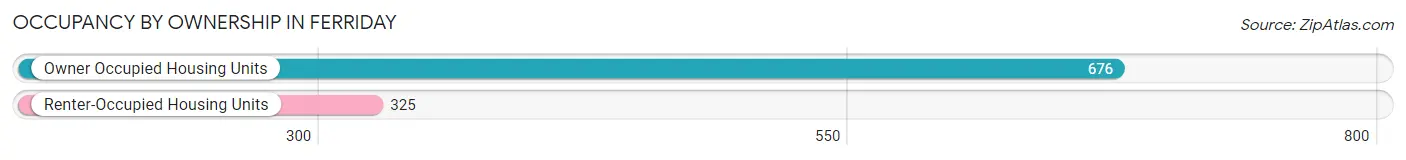
| Occupancy | # Housing Units | % Housing Units |
| Owner Occupied Housing Units | 676 | 67.5% |
| Renter-Occupied Housing Units | 325 | 32.5% |
| Total Occupied Housing Units | 1,001 | 100.0% |
Occupancy by Household Size in Ferriday
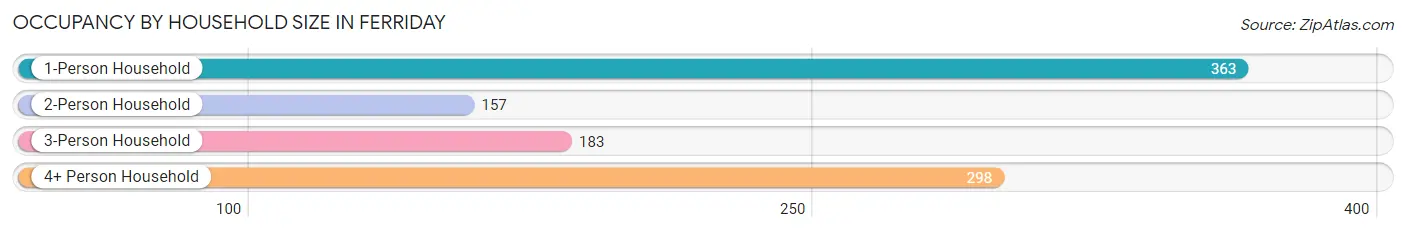
| Household Size | # Housing Units | % Housing Units |
| 1-Person Household | 363 | 36.3% |
| 2-Person Household | 157 | 15.7% |
| 3-Person Household | 183 | 18.3% |
| 4+ Person Household | 298 | 29.8% |
| Total Housing Units | 1,001 | 100.0% |
Occupancy by Ownership by Household Size in Ferriday
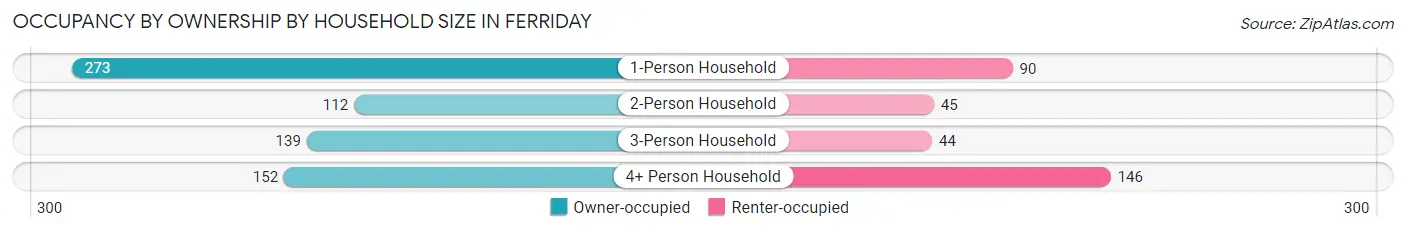
| Household Size | Owner-occupied | Renter-occupied |
| 1-Person Household | 273 (75.2%) | 90 (24.8%) |
| 2-Person Household | 112 (71.3%) | 45 (28.7%) |
| 3-Person Household | 139 (76.0%) | 44 (24.0%) |
| 4+ Person Household | 152 (51.0%) | 146 (49.0%) |
| Total Housing Units | 676 (67.5%) | 325 (32.5%) |
Occupancy by Educational Attainment in Ferriday
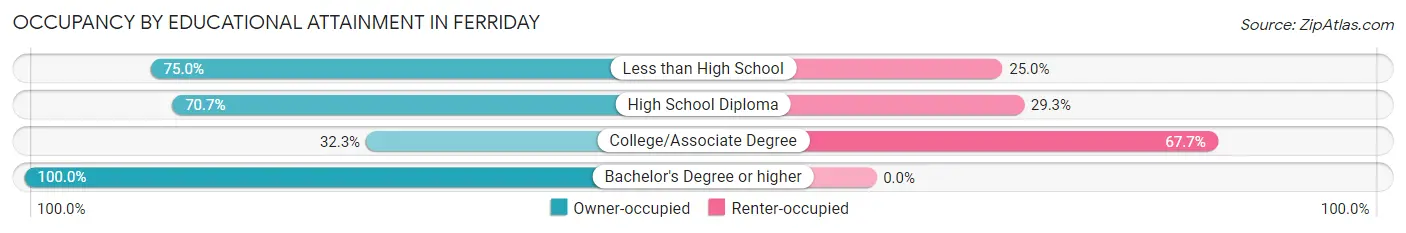
| Household Size | Owner-occupied | Renter-occupied |
| Less than High School | 96 (75.0%) | 32 (25.0%) |
| High School Diploma | 384 (70.7%) | 159 (29.3%) |
| College/Associate Degree | 64 (32.3%) | 134 (67.7%) |
| Bachelor's Degree or higher | 132 (100.0%) | 0 (0.0%) |
Occupancy by Age of Householder in Ferriday
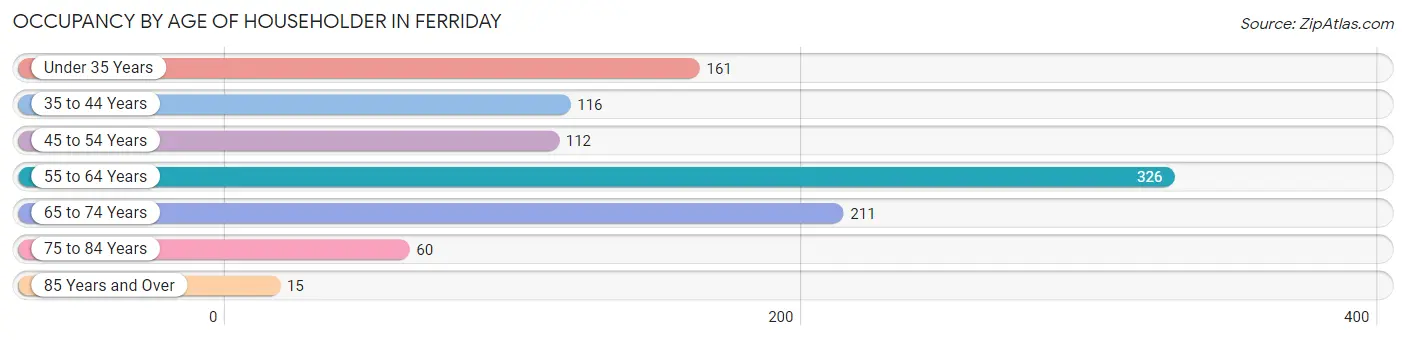
| Age Bracket | # Households | % Households |
| Under 35 Years | 161 | 16.1% |
| 35 to 44 Years | 116 | 11.6% |
| 45 to 54 Years | 112 | 11.2% |
| 55 to 64 Years | 326 | 32.6% |
| 65 to 74 Years | 211 | 21.1% |
| 75 to 84 Years | 60 | 6.0% |
| 85 Years and Over | 15 | 1.5% |
| Total | 1,001 | 100.0% |
Housing Finances in Ferriday
Median Income by Occupancy in Ferriday
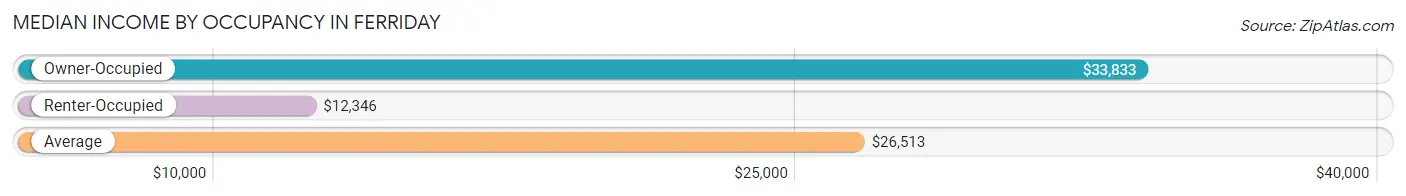
| Occupancy Type | # Households | Median Income |
| Owner-Occupied | 676 (67.5%) | $33,833 |
| Renter-Occupied | 325 (32.5%) | $12,346 |
| Average | 1,001 (100.0%) | $26,513 |
Occupancy by Householder Income Bracket in Ferriday
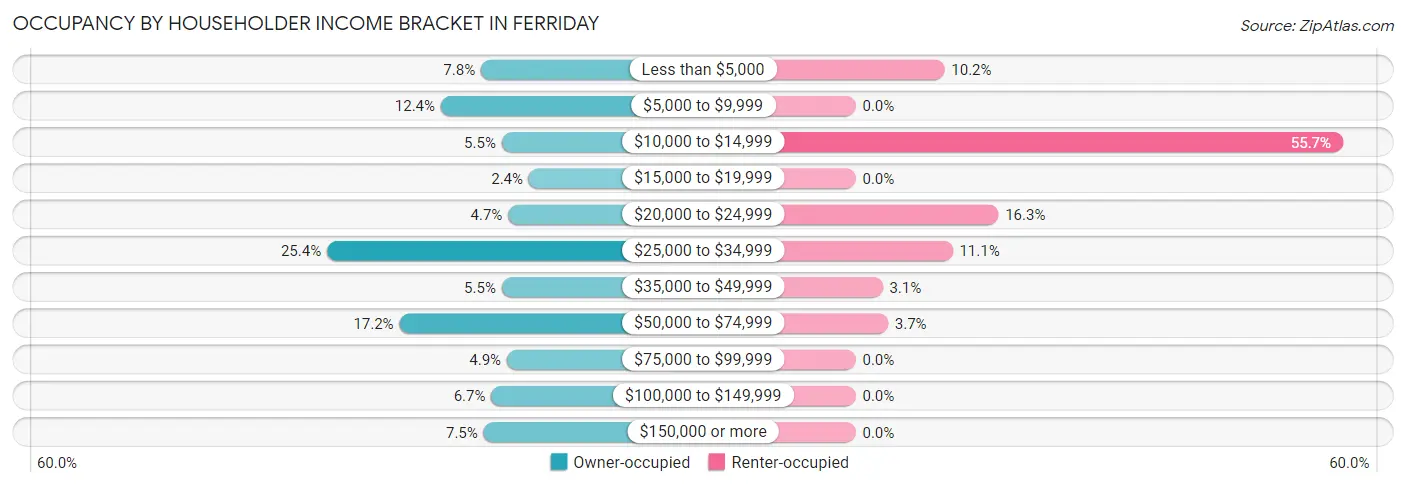
| Income Bracket | Owner-occupied | Renter-occupied |
| Less than $5,000 | 53 (7.8%) | 33 (10.2%) |
| $5,000 to $9,999 | 84 (12.4%) | 0 (0.0%) |
| $10,000 to $14,999 | 37 (5.5%) | 181 (55.7%) |
| $15,000 to $19,999 | 16 (2.4%) | 0 (0.0%) |
| $20,000 to $24,999 | 32 (4.7%) | 53 (16.3%) |
| $25,000 to $34,999 | 172 (25.4%) | 36 (11.1%) |
| $35,000 to $49,999 | 37 (5.5%) | 10 (3.1%) |
| $50,000 to $74,999 | 116 (17.2%) | 12 (3.7%) |
| $75,000 to $99,999 | 33 (4.9%) | 0 (0.0%) |
| $100,000 to $149,999 | 45 (6.7%) | 0 (0.0%) |
| $150,000 or more | 51 (7.5%) | 0 (0.0%) |
| Total | 676 (100.0%) | 325 (100.0%) |
Monthly Housing Cost Tiers in Ferriday
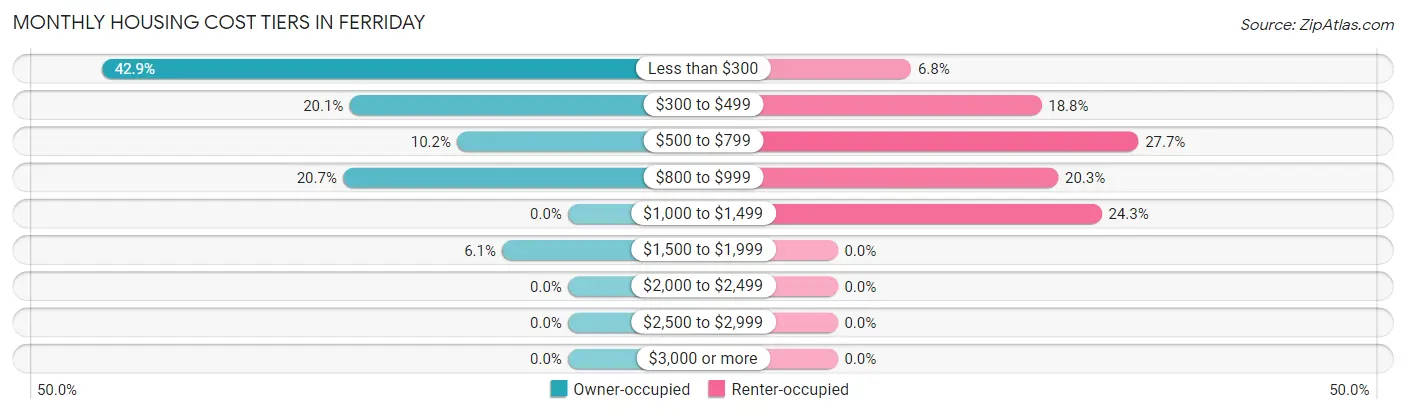
| Monthly Cost | Owner-occupied | Renter-occupied |
| Less than $300 | 290 (42.9%) | 22 (6.8%) |
| $300 to $499 | 136 (20.1%) | 61 (18.8%) |
| $500 to $799 | 69 (10.2%) | 90 (27.7%) |
| $800 to $999 | 140 (20.7%) | 66 (20.3%) |
| $1,000 to $1,499 | 0 (0.0%) | 79 (24.3%) |
| $1,500 to $1,999 | 41 (6.1%) | 0 (0.0%) |
| $2,000 to $2,499 | 0 (0.0%) | 0 (0.0%) |
| $2,500 to $2,999 | 0 (0.0%) | 0 (0.0%) |
| $3,000 or more | 0 (0.0%) | 0 (0.0%) |
| Total | 676 (100.0%) | 325 (100.0%) |
Physical Housing Characteristics in Ferriday
Housing Structures in Ferriday
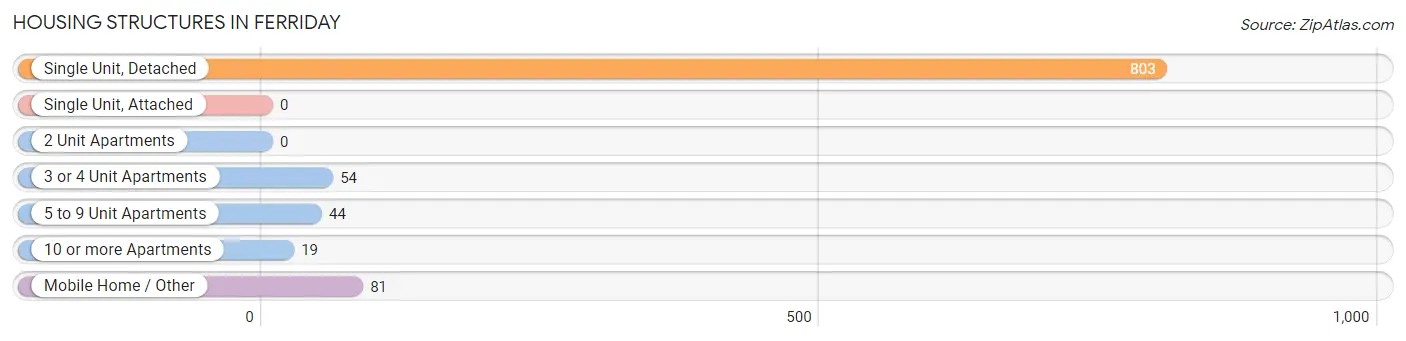
| Structure Type | # Housing Units | % Housing Units |
| Single Unit, Detached | 803 | 80.2% |
| Single Unit, Attached | 0 | 0.0% |
| 2 Unit Apartments | 0 | 0.0% |
| 3 or 4 Unit Apartments | 54 | 5.4% |
| 5 to 9 Unit Apartments | 44 | 4.4% |
| 10 or more Apartments | 19 | 1.9% |
| Mobile Home / Other | 81 | 8.1% |
| Total | 1,001 | 100.0% |
Housing Structures by Occupancy in Ferriday
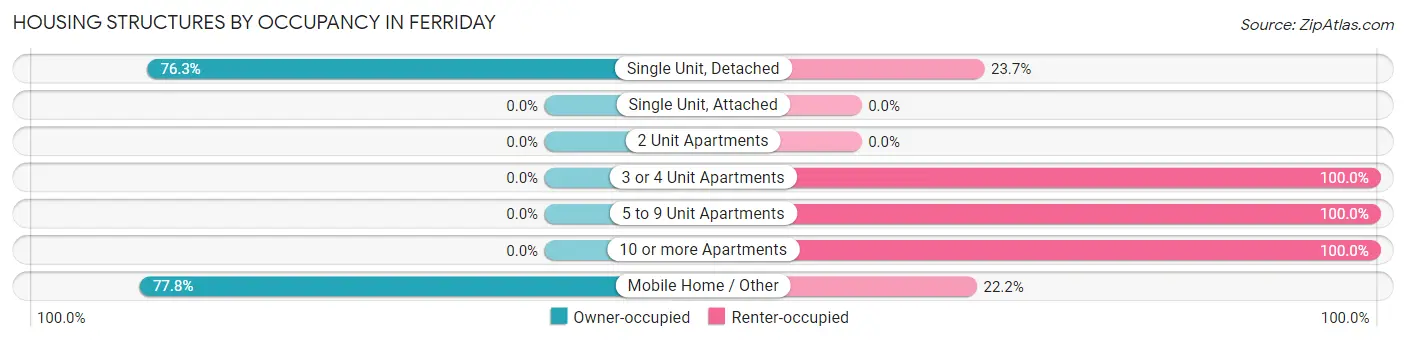
| Structure Type | Owner-occupied | Renter-occupied |
| Single Unit, Detached | 613 (76.3%) | 190 (23.7%) |
| Single Unit, Attached | 0 (0.0%) | 0 (0.0%) |
| 2 Unit Apartments | 0 (0.0%) | 0 (0.0%) |
| 3 or 4 Unit Apartments | 0 (0.0%) | 54 (100.0%) |
| 5 to 9 Unit Apartments | 0 (0.0%) | 44 (100.0%) |
| 10 or more Apartments | 0 (0.0%) | 19 (100.0%) |
| Mobile Home / Other | 63 (77.8%) | 18 (22.2%) |
| Total | 676 (67.5%) | 325 (32.5%) |
Housing Structures by Number of Rooms in Ferriday
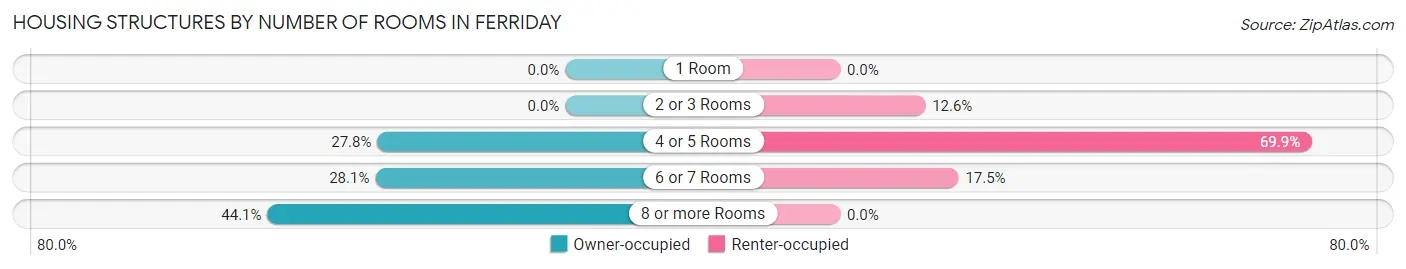
| Number of Rooms | Owner-occupied | Renter-occupied |
| 1 Room | 0 (0.0%) | 0 (0.0%) |
| 2 or 3 Rooms | 0 (0.0%) | 41 (12.6%) |
| 4 or 5 Rooms | 188 (27.8%) | 227 (69.9%) |
| 6 or 7 Rooms | 190 (28.1%) | 57 (17.5%) |
| 8 or more Rooms | 298 (44.1%) | 0 (0.0%) |
| Total | 676 (100.0%) | 325 (100.0%) |
Housing Structure by Heating Type in Ferriday
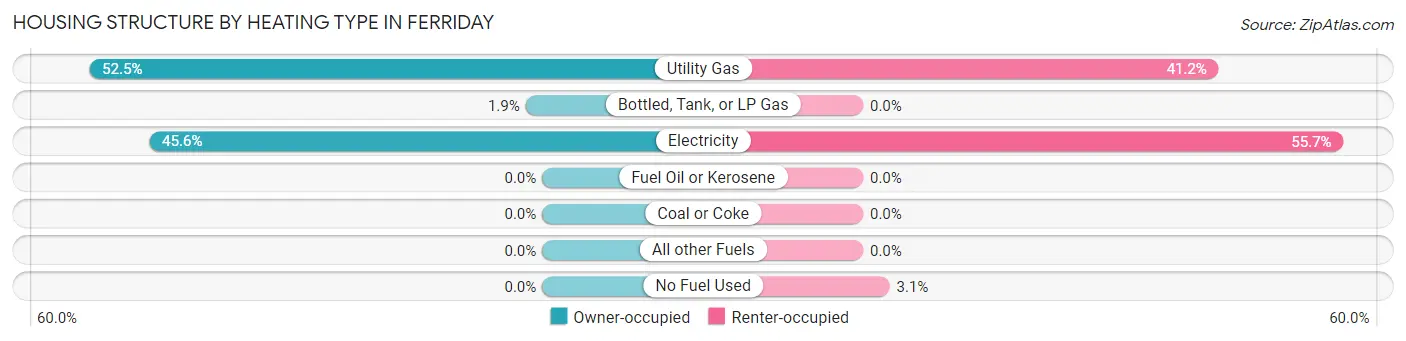
| Heating Type | Owner-occupied | Renter-occupied |
| Utility Gas | 355 (52.5%) | 134 (41.2%) |
| Bottled, Tank, or LP Gas | 13 (1.9%) | 0 (0.0%) |
| Electricity | 308 (45.6%) | 181 (55.7%) |
| Fuel Oil or Kerosene | 0 (0.0%) | 0 (0.0%) |
| Coal or Coke | 0 (0.0%) | 0 (0.0%) |
| All other Fuels | 0 (0.0%) | 0 (0.0%) |
| No Fuel Used | 0 (0.0%) | 10 (3.1%) |
| Total | 676 (100.0%) | 325 (100.0%) |
Household Vehicle Usage in Ferriday
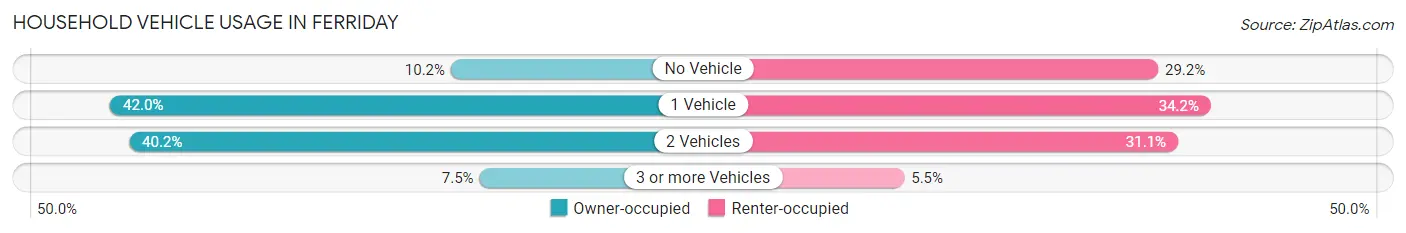
| Vehicles per Household | Owner-occupied | Renter-occupied |
| No Vehicle | 69 (10.2%) | 95 (29.2%) |
| 1 Vehicle | 284 (42.0%) | 111 (34.2%) |
| 2 Vehicles | 272 (40.2%) | 101 (31.1%) |
| 3 or more Vehicles | 51 (7.5%) | 18 (5.5%) |
| Total | 676 (100.0%) | 325 (100.0%) |
Real Estate & Mortgages in Ferriday
Real Estate and Mortgage Overview in Ferriday
| Characteristic | Without Mortgage | With Mortgage |
| Housing Units | 426 | 250 |
| Median Property Value | $72,200 | $128,300 |
| Median Household Income | $34,292 | $51 |
| Monthly Housing Costs | $240 | $0 |
| Real Estate Taxes | $199 | $83 |
Property Value by Mortgage Status in Ferriday
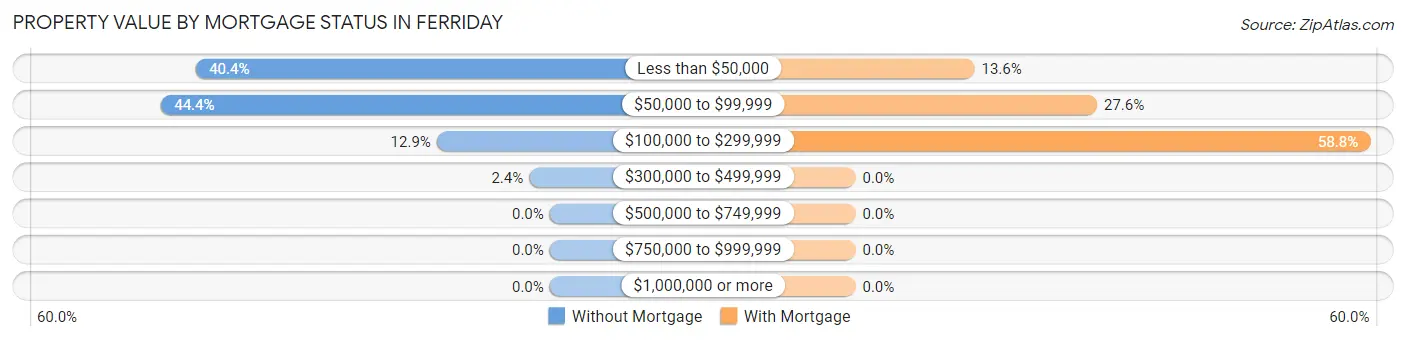
| Property Value | Without Mortgage | With Mortgage |
| Less than $50,000 | 172 (40.4%) | 34 (13.6%) |
| $50,000 to $99,999 | 189 (44.4%) | 69 (27.6%) |
| $100,000 to $299,999 | 55 (12.9%) | 147 (58.8%) |
| $300,000 to $499,999 | 10 (2.4%) | 0 (0.0%) |
| $500,000 to $749,999 | 0 (0.0%) | 0 (0.0%) |
| $750,000 to $999,999 | 0 (0.0%) | 0 (0.0%) |
| $1,000,000 or more | 0 (0.0%) | 0 (0.0%) |
| Total | 426 (100.0%) | 250 (100.0%) |
Household Income by Mortgage Status in Ferriday
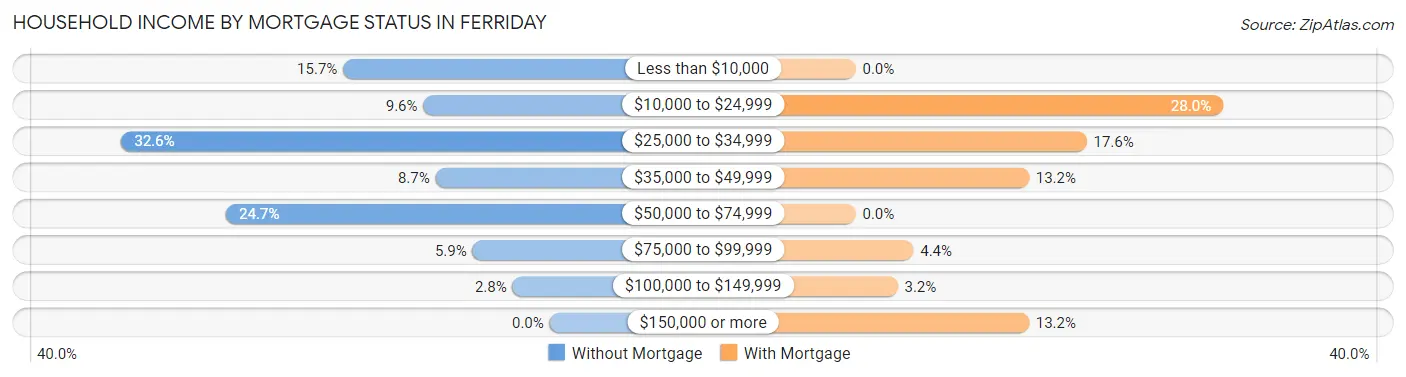
| Household Income | Without Mortgage | With Mortgage |
| Less than $10,000 | 67 (15.7%) | 0 (0.0%) |
| $10,000 to $24,999 | 41 (9.6%) | 70 (28.0%) |
| $25,000 to $34,999 | 139 (32.6%) | 44 (17.6%) |
| $35,000 to $49,999 | 37 (8.7%) | 33 (13.2%) |
| $50,000 to $74,999 | 105 (24.6%) | 0 (0.0%) |
| $75,000 to $99,999 | 25 (5.9%) | 11 (4.4%) |
| $100,000 to $149,999 | 12 (2.8%) | 8 (3.2%) |
| $150,000 or more | 0 (0.0%) | 33 (13.2%) |
| Total | 426 (100.0%) | 250 (100.0%) |
Property Value to Household Income Ratio in Ferriday
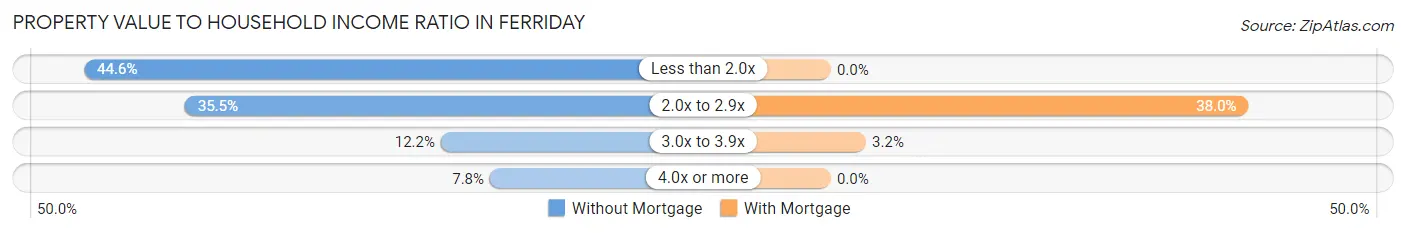
| Value-to-Income Ratio | Without Mortgage | With Mortgage |
| Less than 2.0x | 190 (44.6%) | 0 (0.0%) |
| 2.0x to 2.9x | 151 (35.4%) | 95 (38.0%) |
| 3.0x to 3.9x | 52 (12.2%) | 8 (3.2%) |
| 4.0x or more | 33 (7.7%) | 0 (0.0%) |
| Total | 426 (100.0%) | 250 (100.0%) |
Real Estate Taxes by Mortgage Status in Ferriday
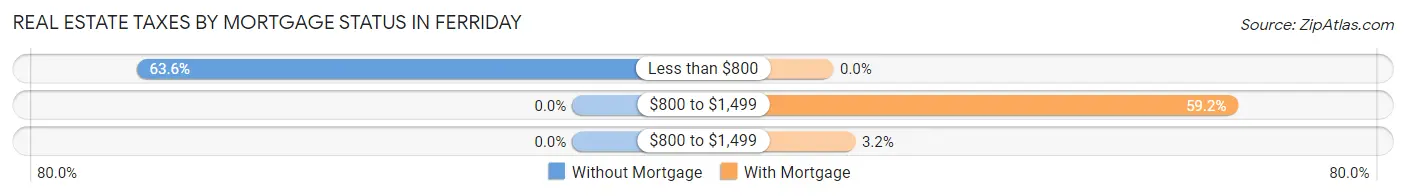
| Property Taxes | Without Mortgage | With Mortgage |
| Less than $800 | 271 (63.6%) | 0 (0.0%) |
| $800 to $1,499 | 0 (0.0%) | 148 (59.2%) |
| $800 to $1,499 | 0 (0.0%) | 8 (3.2%) |
| Total | 426 (100.0%) | 250 (100.0%) |
Health & Disability in Ferriday
Health Insurance Coverage by Age in Ferriday
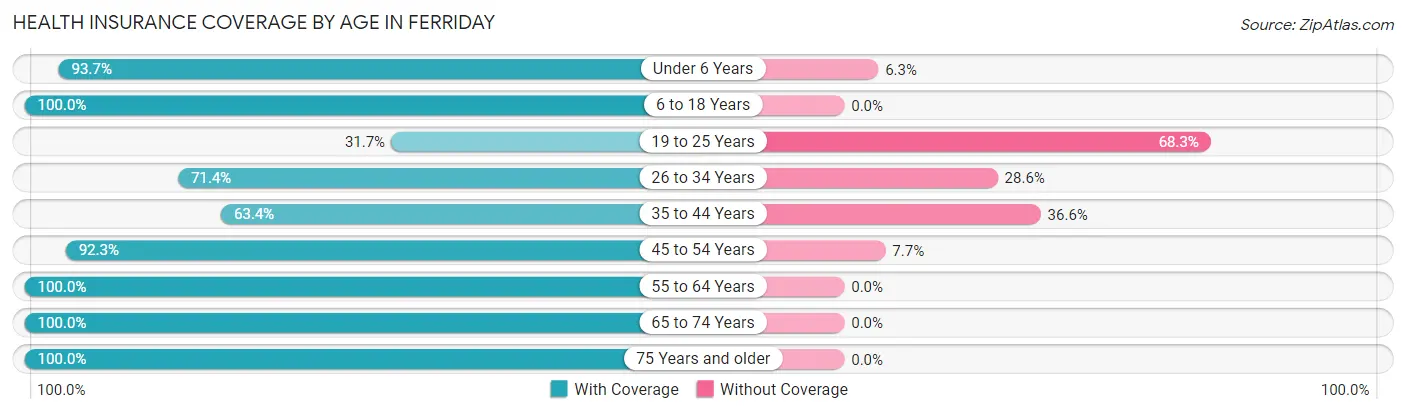
| Age Bracket | With Coverage | Without Coverage |
| Under 6 Years | 296 (93.7%) | 20 (6.3%) |
| 6 to 18 Years | 748 (100.0%) | 0 (0.0%) |
| 19 to 25 Years | 51 (31.7%) | 110 (68.3%) |
| 26 to 34 Years | 382 (71.4%) | 153 (28.6%) |
| 35 to 44 Years | 180 (63.4%) | 104 (36.6%) |
| 45 to 54 Years | 277 (92.3%) | 23 (7.7%) |
| 55 to 64 Years | 435 (100.0%) | 0 (0.0%) |
| 65 to 74 Years | 273 (100.0%) | 0 (0.0%) |
| 75 Years and older | 88 (100.0%) | 0 (0.0%) |
| Total | 2,730 (86.9%) | 410 (13.1%) |
Health Insurance Coverage by Citizenship Status in Ferriday
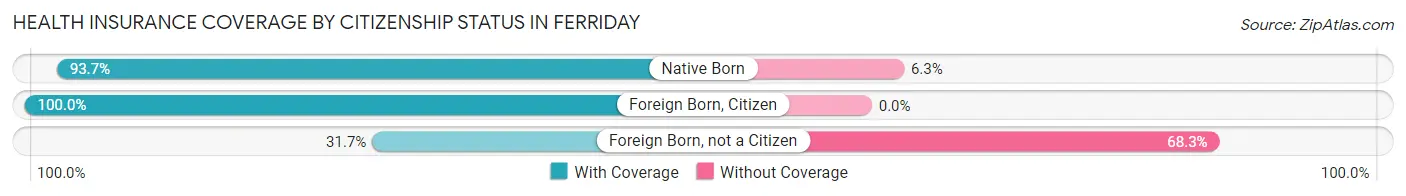
| Citizenship Status | With Coverage | Without Coverage |
| Native Born | 296 (93.7%) | 20 (6.3%) |
| Foreign Born, Citizen | 748 (100.0%) | 0 (0.0%) |
| Foreign Born, not a Citizen | 51 (31.7%) | 110 (68.3%) |
Health Insurance Coverage by Household Income in Ferriday
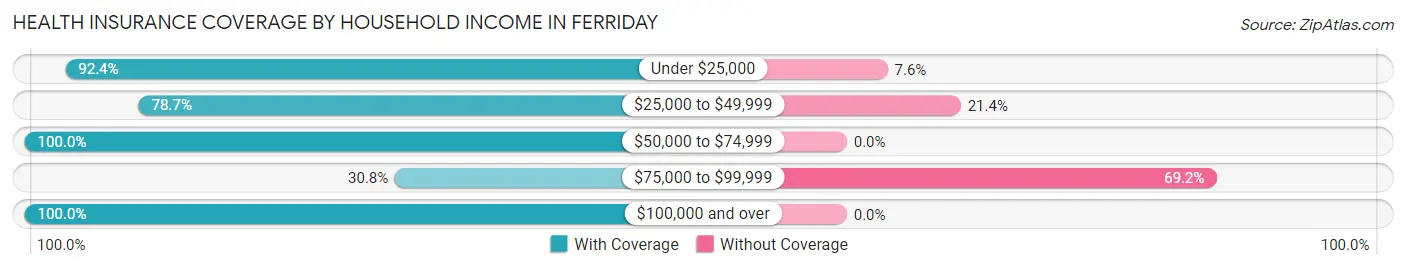
| Household Income | With Coverage | Without Coverage |
| Under $25,000 | 1,379 (92.4%) | 114 (7.6%) |
| $25,000 to $49,999 | 792 (78.6%) | 215 (21.3%) |
| $50,000 to $74,999 | 230 (100.0%) | 0 (0.0%) |
| $75,000 to $99,999 | 36 (30.8%) | 81 (69.2%) |
| $100,000 and over | 293 (100.0%) | 0 (0.0%) |
Public vs Private Health Insurance Coverage by Age in Ferriday
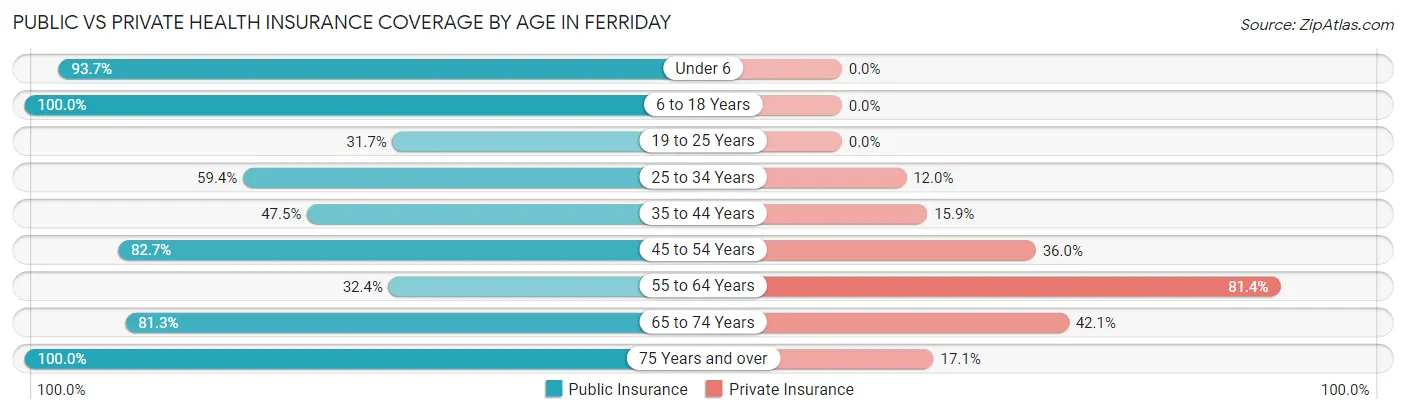
| Age Bracket | Public Insurance | Private Insurance |
| Under 6 | 296 (93.7%) | 0 (0.0%) |
| 6 to 18 Years | 748 (100.0%) | 0 (0.0%) |
| 19 to 25 Years | 51 (31.7%) | 0 (0.0%) |
| 25 to 34 Years | 318 (59.4%) | 64 (12.0%) |
| 35 to 44 Years | 135 (47.5%) | 45 (15.9%) |
| 45 to 54 Years | 248 (82.7%) | 108 (36.0%) |
| 55 to 64 Years | 141 (32.4%) | 354 (81.4%) |
| 65 to 74 Years | 222 (81.3%) | 115 (42.1%) |
| 75 Years and over | 88 (100.0%) | 15 (17.1%) |
| Total | 2,247 (71.6%) | 701 (22.3%) |
Disability Status by Sex by Age in Ferriday
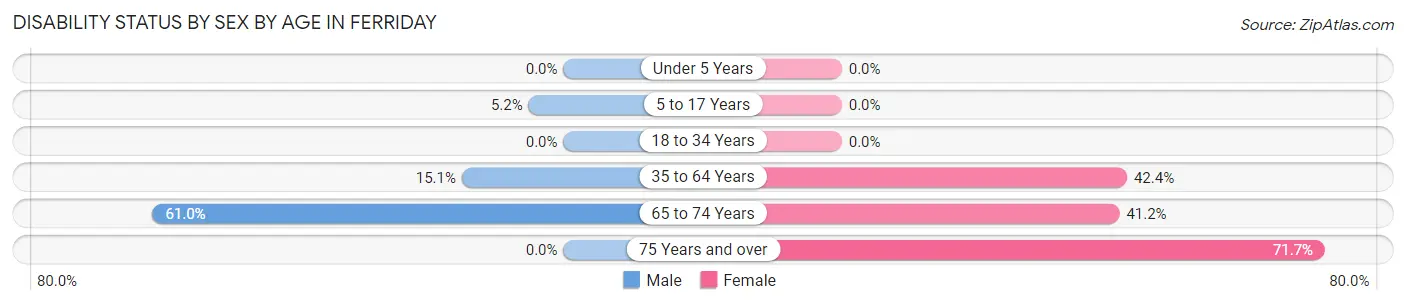
| Age Bracket | Male | Female |
| Under 5 Years | 0 (0.0%) | 0 (0.0%) |
| 5 to 17 Years | 18 (5.2%) | 0 (0.0%) |
| 18 to 34 Years | 0 (0.0%) | 0 (0.0%) |
| 35 to 64 Years | 60 (15.1%) | 263 (42.3%) |
| 65 to 74 Years | 97 (61.0%) | 47 (41.2%) |
| 75 Years and over | 0 (0.0%) | 33 (71.7%) |
Disability Class by Sex by Age in Ferriday
Disability Class: Hearing Difficulty
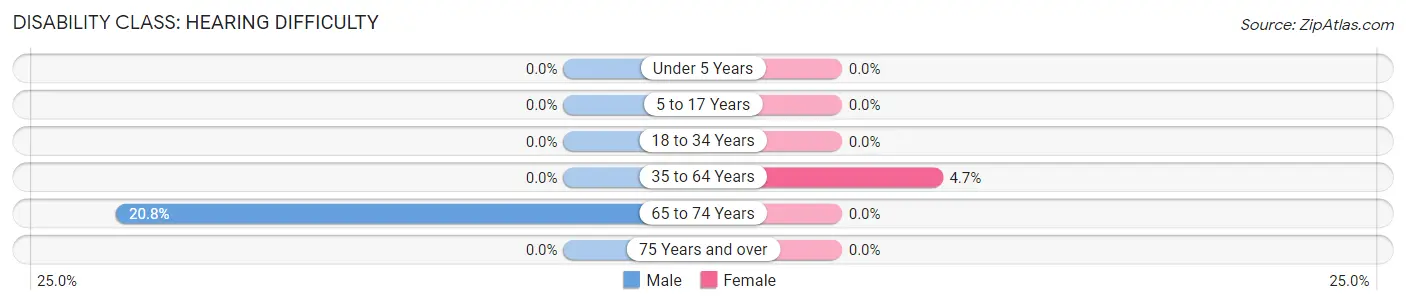
| Age Bracket | Male | Female |
| Under 5 Years | 0 (0.0%) | 0 (0.0%) |
| 5 to 17 Years | 0 (0.0%) | 0 (0.0%) |
| 18 to 34 Years | 0 (0.0%) | 0 (0.0%) |
| 35 to 64 Years | 0 (0.0%) | 29 (4.7%) |
| 65 to 74 Years | 33 (20.7%) | 0 (0.0%) |
| 75 Years and over | 0 (0.0%) | 0 (0.0%) |
Disability Class: Vision Difficulty
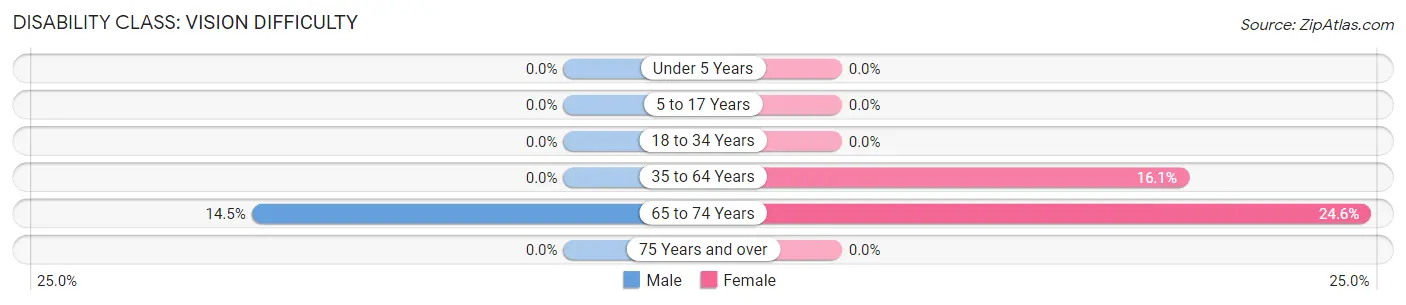
| Age Bracket | Male | Female |
| Under 5 Years | 0 (0.0%) | 0 (0.0%) |
| 5 to 17 Years | 0 (0.0%) | 0 (0.0%) |
| 18 to 34 Years | 0 (0.0%) | 0 (0.0%) |
| 35 to 64 Years | 0 (0.0%) | 100 (16.1%) |
| 65 to 74 Years | 23 (14.5%) | 28 (24.6%) |
| 75 Years and over | 0 (0.0%) | 0 (0.0%) |
Disability Class: Cognitive Difficulty
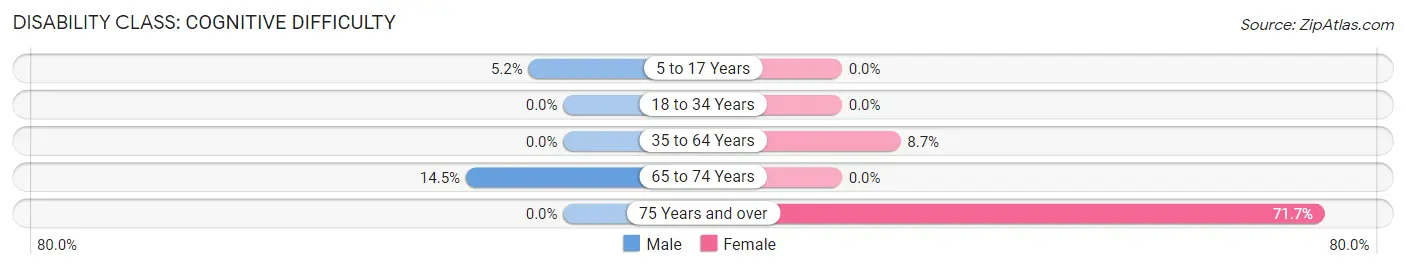
| Age Bracket | Male | Female |
| 5 to 17 Years | 18 (5.2%) | 0 (0.0%) |
| 18 to 34 Years | 0 (0.0%) | 0 (0.0%) |
| 35 to 64 Years | 0 (0.0%) | 54 (8.7%) |
| 65 to 74 Years | 23 (14.5%) | 0 (0.0%) |
| 75 Years and over | 0 (0.0%) | 33 (71.7%) |
Disability Class: Ambulatory Difficulty
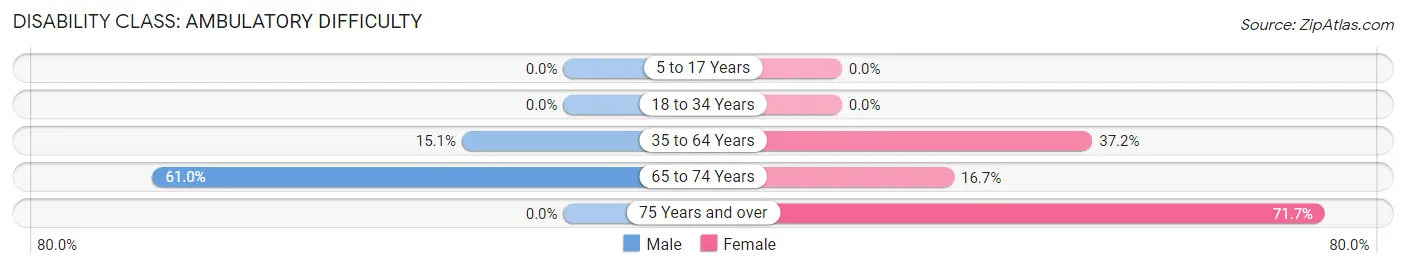
| Age Bracket | Male | Female |
| 5 to 17 Years | 0 (0.0%) | 0 (0.0%) |
| 18 to 34 Years | 0 (0.0%) | 0 (0.0%) |
| 35 to 64 Years | 60 (15.1%) | 231 (37.2%) |
| 65 to 74 Years | 97 (61.0%) | 19 (16.7%) |
| 75 Years and over | 0 (0.0%) | 33 (71.7%) |
Disability Class: Self-Care Difficulty
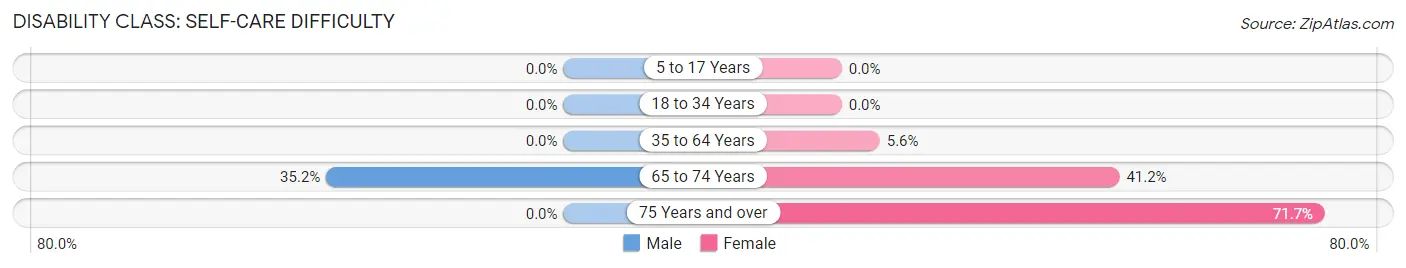
| Age Bracket | Male | Female |
| 5 to 17 Years | 0 (0.0%) | 0 (0.0%) |
| 18 to 34 Years | 0 (0.0%) | 0 (0.0%) |
| 35 to 64 Years | 0 (0.0%) | 35 (5.6%) |
| 65 to 74 Years | 56 (35.2%) | 47 (41.2%) |
| 75 Years and over | 0 (0.0%) | 33 (71.7%) |
Technology Access in Ferriday
Computing Device Access in Ferriday
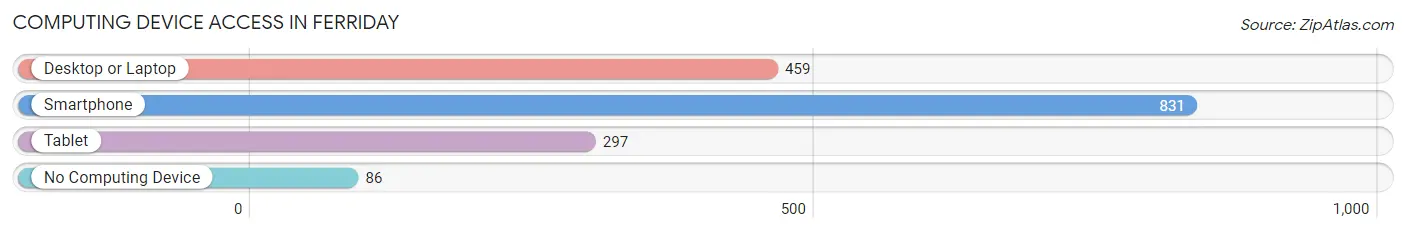
| Device Type | # Households | % Households |
| Desktop or Laptop | 459 | 45.9% |
| Smartphone | 831 | 83.0% |
| Tablet | 297 | 29.7% |
| No Computing Device | 86 | 8.6% |
| Total | 1,001 | 100.0% |
Internet Access in Ferriday
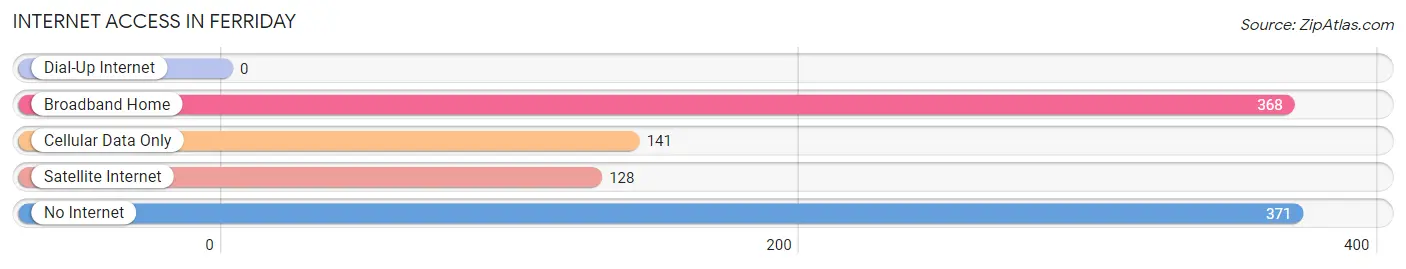
| Internet Type | # Households | % Households |
| Dial-Up Internet | 0 | 0.0% |
| Broadband Home | 368 | 36.8% |
| Cellular Data Only | 141 | 14.1% |
| Satellite Internet | 128 | 12.8% |
| No Internet | 371 | 37.1% |
| Total | 1,001 | 100.0% |
Ferriday Summary
Ferriday is a small town located in Concordia Parish, Louisiana. It is situated on the banks of the Mississippi River, approximately 30 miles south of Natchez, Mississippi. The town has a population of 2,723 people, according to the 2010 census.
History
Ferriday was founded in 1884 by two brothers, John and William Ferriday, who were originally from Scotland. The brothers purchased the land from the Choctaw Indians and named the town after their family. The town was incorporated in 1887 and quickly became a thriving agricultural center. The town was also known for its lumber industry, which provided jobs for many of the town’s residents.
In the early 1900s, Ferriday became a popular destination for tourists, who were drawn to the town’s natural beauty and its proximity to the Mississippi River. The town was also home to a number of famous musicians, including Jerry Lee Lewis, Mickey Gilley, and Jimmy Swaggart.
Geography
Ferriday is located in the northern part of Concordia Parish, Louisiana. It is situated on the banks of the Mississippi River, approximately 30 miles south of Natchez, Mississippi. The town is surrounded by a number of small towns and villages, including Clayton, Sicily Island, and Vidalia.
The town has a total area of 2.2 square miles, all of which is land. The terrain is mostly flat, with some rolling hills in the area. The climate is humid subtropical, with hot, humid summers and mild winters.
Economy
Ferriday’s economy is largely based on agriculture and tourism. The town is home to a number of farms, which produce a variety of crops, including cotton, corn, soybeans, and wheat. The town is also home to a number of tourist attractions, including the Ferriday Museum and the Delta Music Museum.
The town is also home to a number of small businesses, including restaurants, retail stores, and service providers. The town is also home to a number of manufacturing companies, which produce a variety of products, including furniture, clothing, and electronics.
Demographics
According to the 2010 census, Ferriday has a population of 2,723 people. The racial makeup of the town is 73.3% White, 24.2% African American, 0.3% Native American, 0.2% Asian, 0.1% Pacific Islander, and 1.9% from other races. The median household income is $25,938, and the median family income is $31,944.
Ferriday is a small town with a rich history and a vibrant economy. The town is home to a number of farms, businesses, and tourist attractions, and is a popular destination for visitors from all over the world. The town is also home to a number of famous musicians, including Jerry Lee Lewis, Mickey Gilley, and Jimmy Swaggart.
Common Questions
What is Per Capita Income in Ferriday?
Per Capita income in Ferriday is $12,772.
What is the Median Family Income in Ferriday?
Median Family Income in Ferriday is $32,262.
What is the Median Household income in Ferriday?
Median Household Income in Ferriday is $26,513.
What is Income or Wage Gap in Ferriday?
Income or Wage Gap in Ferriday is 42.8%.
Women in Ferriday earn 57.2 cents for every dollar earned by a man.
What is Inequality or Gini Index in Ferriday?
Inequality or Gini Index in Ferriday is 0.51.
What is the Total Population of Ferriday?
Total Population of Ferriday is 3,192.
What is the Total Male Population of Ferriday?
Total Male Population of Ferriday is 1,193.
What is the Total Female Population of Ferriday?
Total Female Population of Ferriday is 1,999.
What is the Ratio of Males per 100 Females in Ferriday?
There are 59.68 Males per 100 Females in Ferriday.
What is the Ratio of Females per 100 Males in Ferriday?
There are 167.56 Females per 100 Males in Ferriday.
What is the Median Population Age in Ferriday?
Median Population Age in Ferriday is 31.2 Years.
What is the Average Family Size in Ferriday
Average Family Size in Ferriday is 4.3 People.
What is the Average Household Size in Ferriday
Average Household Size in Ferriday is 3.1 People.
How Large is the Labor Force in Ferriday?
There are 1,121 People in the Labor Forcein in Ferriday.
What is the Percentage of People in the Labor Force in Ferriday?
51.5% of People are in the Labor Force in Ferriday.
What is the Unemployment Rate in Ferriday?
Unemployment Rate in Ferriday is 23.2%.