Zip Codes with the Highest Percentage of Population Employed in Security & Protection in Houma, LA
RELATED REPORTS & OPTIONS
Security & Protection
Houma
Compare Zip Codes
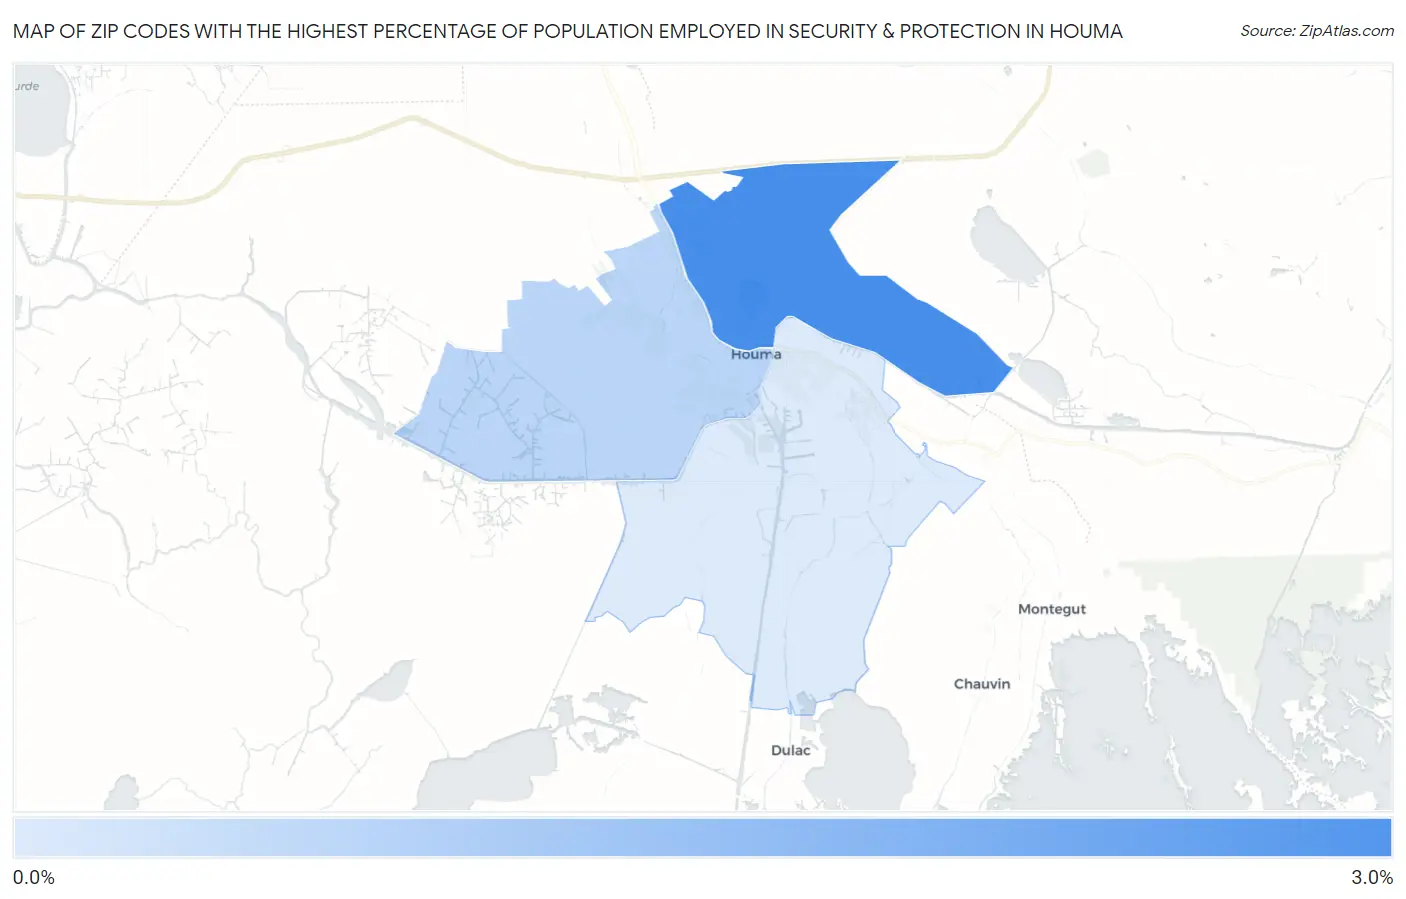
Map of Zip Codes with the Highest Percentage of Population Employed in Security & Protection in Houma
0.45%
2.8%
Zip Codes with the Highest Percentage of Population Employed in Security & Protection in Houma, LA
| Zip Code | % Employed | vs State | vs National | |
| 1. | 70364 | 2.8% | 2.6%(+0.171)#217 | 2.1%(+0.630)#8,198 |
| 2. | 70360 | 0.99% | 2.6%(-1.61)#361 | 2.1%(-1.16)#20,101 |
| 3. | 70363 | 0.45% | 2.6%(-2.15)#399 | 2.1%(-1.69)#23,474 |
1
Common Questions
What are the Top Zip Codes with the Highest Percentage of Population Employed in Security & Protection in Houma, LA?
Top Zip Codes with the Highest Percentage of Population Employed in Security & Protection in Houma, LA are:
What zip code has the Highest Percentage of Population Employed in Security & Protection in Houma, LA?
70364 has the Highest Percentage of Population Employed in Security & Protection in Houma, LA with 2.8%.
What is the Percentage of Population Employed in Security & Protection in Houma, LA?
Percentage of Population Employed in Security & Protection in Houma is 0.87%.
What is the Percentage of Population Employed in Security & Protection in Louisiana?
Percentage of Population Employed in Security & Protection in Louisiana is 2.6%.
What is the Percentage of Population Employed in Security & Protection in the United States?
Percentage of Population Employed in Security & Protection in the United States is 2.1%.