Strong City, KS Map & Demographics
Strong City Map
Strong City Overview
$29,165
PER CAPITA INCOME
$77,375
AVG FAMILY INCOME
$46,964
AVG HOUSEHOLD INCOME
18.0%
WAGE / INCOME GAP [ % ]
82.0¢/ $1
WAGE / INCOME GAP [ $ ]
0.40
INEQUALITY / GINI INDEX
465
TOTAL POPULATION
254
MALE POPULATION
211
FEMALE POPULATION
120.38
MALES / 100 FEMALES
83.07
FEMALES / 100 MALES
39.1
MEDIAN AGE
3.1
AVG FAMILY SIZE
2.1
AVG HOUSEHOLD SIZE
255
LABOR FORCE [ PEOPLE ]
68.2%
PERCENT IN LABOR FORCE
1.2%
UNEMPLOYMENT RATE
Strong City Zip Codes
Strong City Area Codes
Income in Strong City
Income Overview in Strong City
Per Capita Income in Strong City is $29,165, while median incomes of families and households are $77,375 and $46,964 respectively.
| Characteristic | Number | Measure |
| Per Capita Income | 465 | $29,165 |
| Median Family Income | 111 | $77,375 |
| Mean Family Income | 111 | $80,522 |
| Median Household Income | 217 | $46,964 |
| Mean Household Income | 217 | $56,708 |
| Income Deficit | 111 | $0 |
| Wage / Income Gap (%) | 465 | 17.99% |
| Wage / Income Gap ($) | 465 | 82.01¢ per $1 |
| Gini / Inequality Index | 465 | 0.40 |
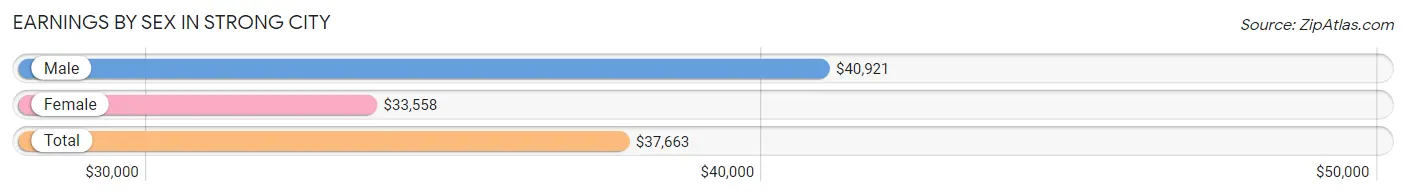
Earnings by Sex in Strong City
Average Earnings in Strong City are $37,663, $40,921 for men and $33,558 for women, a difference of 18.0%.
| Sex | Number | Average Earnings |
| Male | 166 (64.1%) | $40,921 |
| Female | 93 (35.9%) | $33,558 |
| Total | 259 (100.0%) | $37,663 |
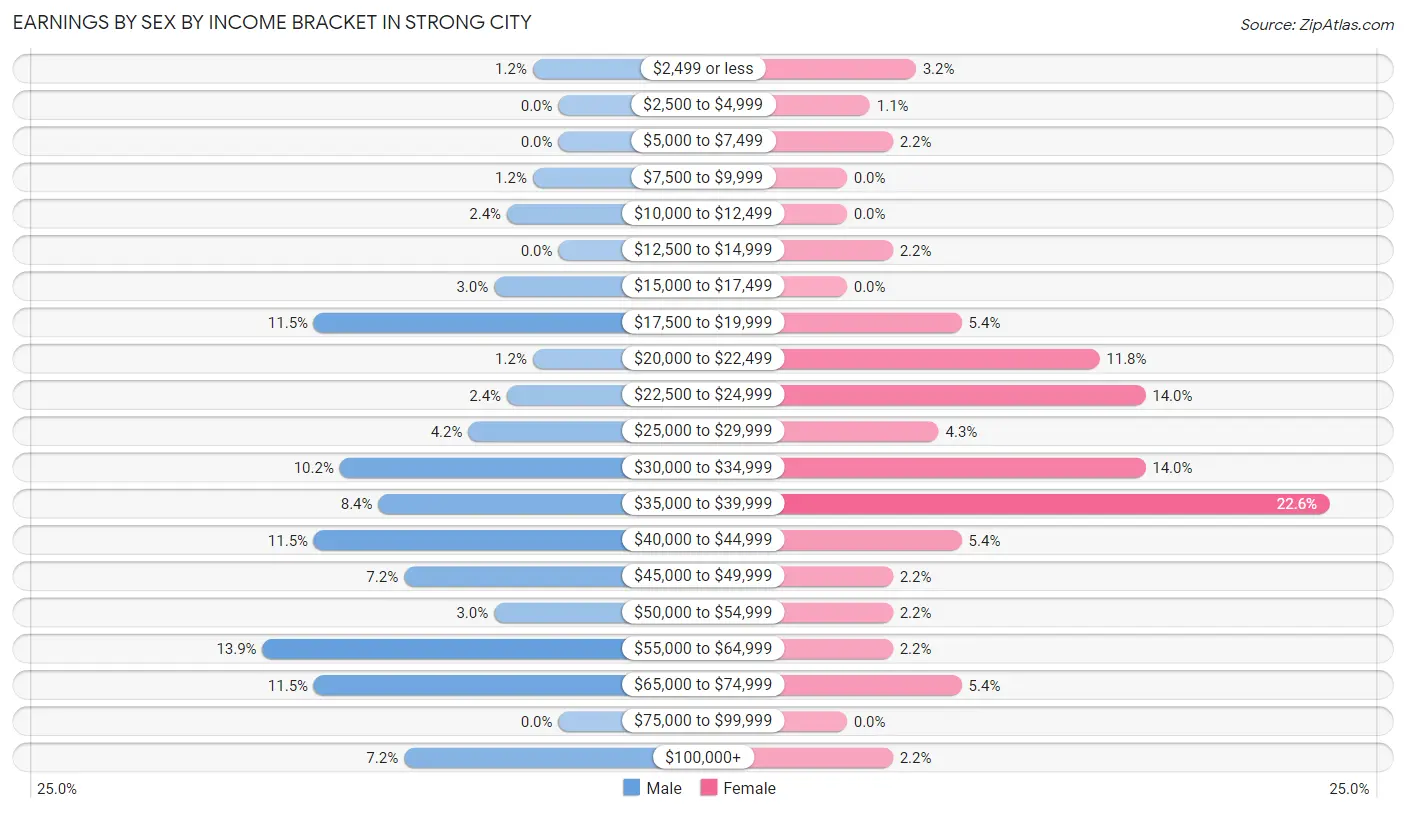
Earnings by Sex by Income Bracket in Strong City
The most common earnings brackets in Strong City are $55,000 to $64,999 for men (23 | 13.9%) and $35,000 to $39,999 for women (21 | 22.6%).
| Income | Male | Female |
| $2,499 or less | 2 (1.2%) | 3 (3.2%) |
| $2,500 to $4,999 | 0 (0.0%) | 1 (1.1%) |
| $5,000 to $7,499 | 0 (0.0%) | 2 (2.1%) |
| $7,500 to $9,999 | 2 (1.2%) | 0 (0.0%) |
| $10,000 to $12,499 | 4 (2.4%) | 0 (0.0%) |
| $12,500 to $14,999 | 0 (0.0%) | 2 (2.1%) |
| $15,000 to $17,499 | 5 (3.0%) | 0 (0.0%) |
| $17,500 to $19,999 | 19 (11.5%) | 5 (5.4%) |
| $20,000 to $22,499 | 2 (1.2%) | 11 (11.8%) |
| $22,500 to $24,999 | 4 (2.4%) | 13 (14.0%) |
| $25,000 to $29,999 | 7 (4.2%) | 4 (4.3%) |
| $30,000 to $34,999 | 17 (10.2%) | 13 (14.0%) |
| $35,000 to $39,999 | 14 (8.4%) | 21 (22.6%) |
| $40,000 to $44,999 | 19 (11.5%) | 5 (5.4%) |
| $45,000 to $49,999 | 12 (7.2%) | 2 (2.1%) |
| $50,000 to $54,999 | 5 (3.0%) | 2 (2.1%) |
| $55,000 to $64,999 | 23 (13.9%) | 2 (2.1%) |
| $65,000 to $74,999 | 19 (11.5%) | 5 (5.4%) |
| $75,000 to $99,999 | 0 (0.0%) | 0 (0.0%) |
| $100,000+ | 12 (7.2%) | 2 (2.1%) |
| Total | 166 (100.0%) | 93 (100.0%) |
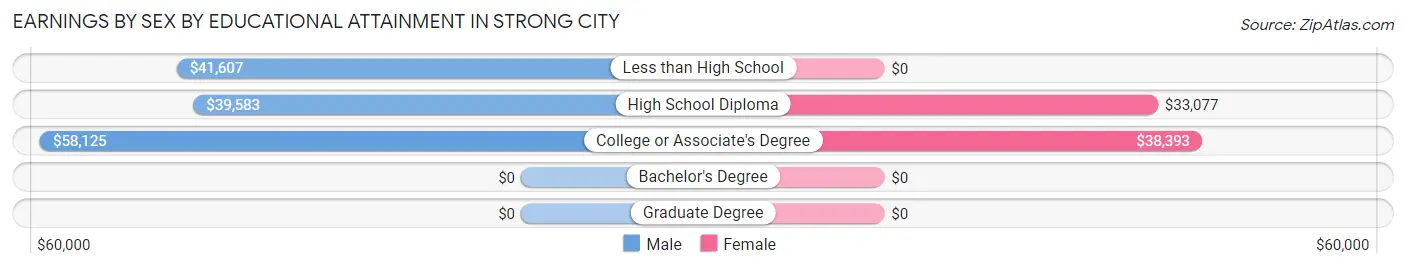
Earnings by Sex by Educational Attainment in Strong City
Average earnings in Strong City are $42,171 for men and $33,365 for women, a difference of 20.9%. Men with an educational attainment of college or associate's degree enjoy the highest average annual earnings of $58,125, while those with high school diploma education earn the least with $39,583. Women with an educational attainment of college or associate's degree earn the most with the average annual earnings of $38,393, while those with high school diploma education have the smallest earnings of $33,077.
| Educational Attainment | Male Income | Female Income |
| Less than High School | $41,607 | $0 |
| High School Diploma | $39,583 | $33,077 |
| College or Associate's Degree | $58,125 | $38,393 |
| Bachelor's Degree | - | - |
| Graduate Degree | - | - |
| Total | $42,171 | $33,365 |
Family Income in Strong City
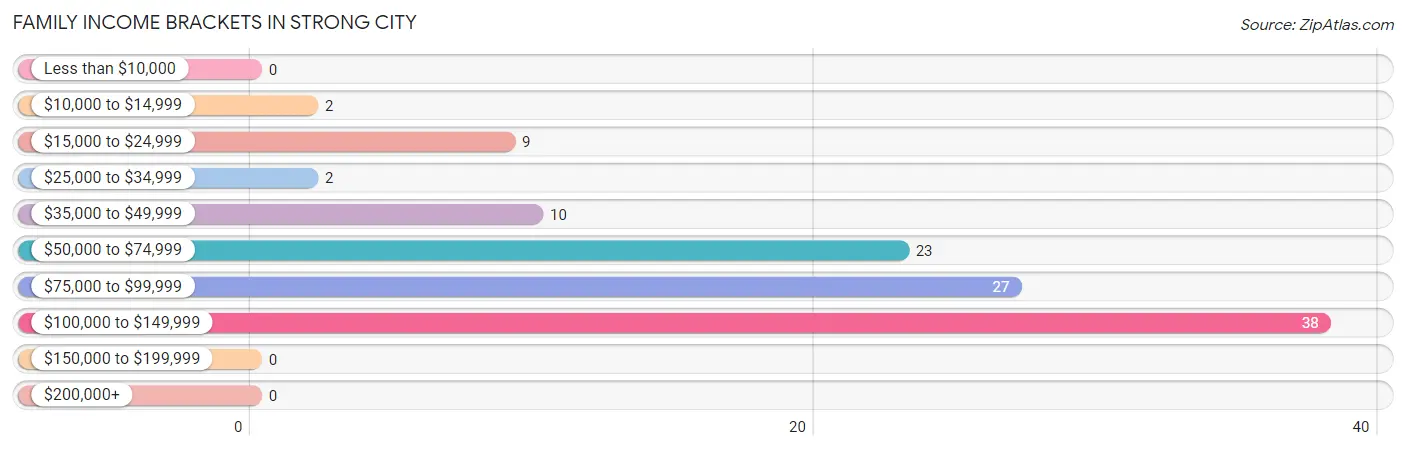
Family Income Brackets in Strong City
According to the Strong City family income data, there are 38 families falling into the $100,000 to $149,999 income range, which is the most common income bracket and makes up 34.2% of all families.
| Income Bracket | # Families | % Families |
| Less than $10,000 | 0 | 0.0% |
| $10,000 to $14,999 | 2 | 1.8% |
| $15,000 to $24,999 | 9 | 8.1% |
| $25,000 to $34,999 | 2 | 1.8% |
| $35,000 to $49,999 | 10 | 9.0% |
| $50,000 to $74,999 | 23 | 20.7% |
| $75,000 to $99,999 | 27 | 24.3% |
| $100,000 to $149,999 | 38 | 34.2% |
| $150,000 to $199,999 | 0 | 0.0% |
| $200,000+ | 0 | 0.0% |
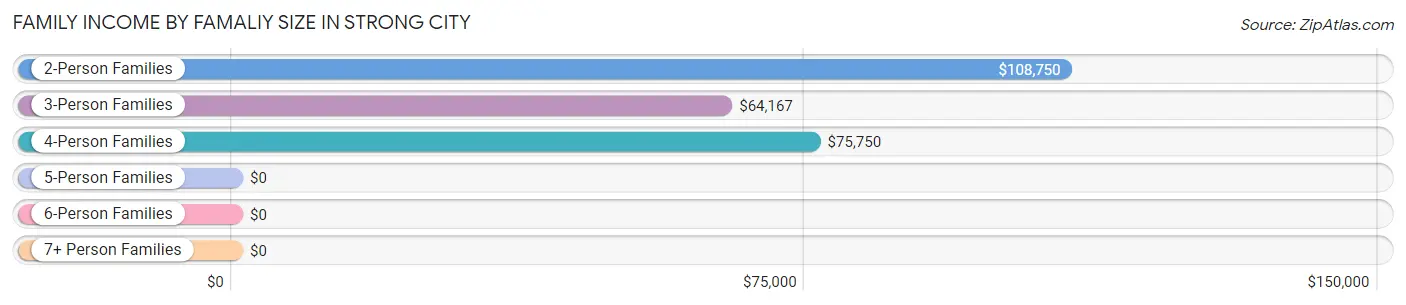
Family Income by Famaliy Size in Strong City
2-person families (48 | 43.2%) account for the highest median family income in Strong City with $108,750 per family, while 2-person families (48 | 43.2%) have the highest median income of $54,375 per family member.
| Income Bracket | # Families | Median Income |
| 2-Person Families | 48 (43.2%) | $108,750 |
| 3-Person Families | 28 (25.2%) | $64,167 |
| 4-Person Families | 28 (25.2%) | $75,750 |
| 5-Person Families | 4 (3.6%) | $0 |
| 6-Person Families | 3 (2.7%) | $0 |
| 7+ Person Families | 0 (0.0%) | $0 |
| Total | 111 (100.0%) | $77,375 |
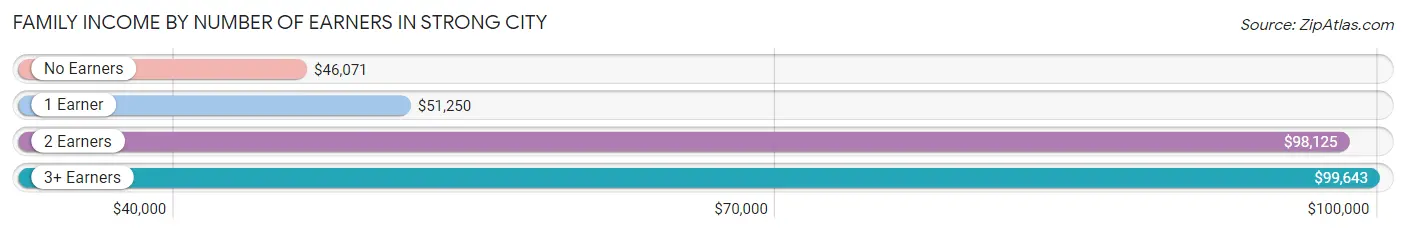
Family Income by Number of Earners in Strong City
The median family income in Strong City is $77,375, with families comprising 3+ earners (12) having the highest median family income of $99,643, while families with no earners (10) have the lowest median family income of $46,071, accounting for 10.8% and 9.0% of families, respectively.
| Number of Earners | # Families | Median Income |
| No Earners | 10 (9.0%) | $46,071 |
| 1 Earner | 29 (26.1%) | $51,250 |
| 2 Earners | 60 (54.0%) | $98,125 |
| 3+ Earners | 12 (10.8%) | $99,643 |
| Total | 111 (100.0%) | $77,375 |
Household Income in Strong City
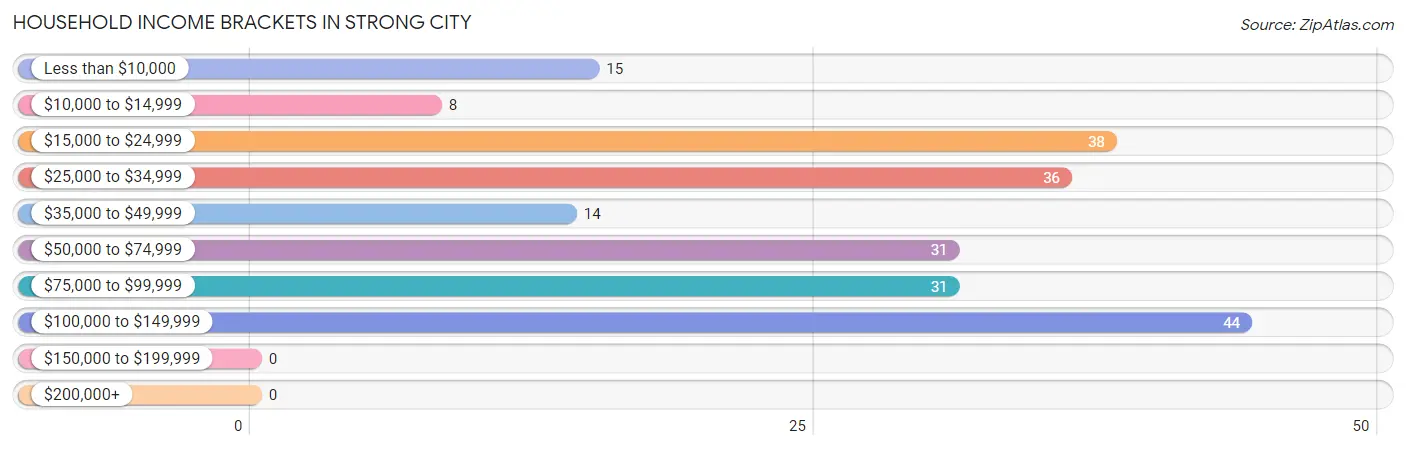
Household Income Brackets in Strong City
With 44 households falling in the category, the $100,000 to $149,999 income range is the most frequent in Strong City, accounting for 20.3% of all households.
| Income Bracket | # Households | % Households |
| Less than $10,000 | 15 | 6.9% |
| $10,000 to $14,999 | 8 | 3.7% |
| $15,000 to $24,999 | 38 | 17.5% |
| $25,000 to $34,999 | 36 | 16.6% |
| $35,000 to $49,999 | 14 | 6.5% |
| $50,000 to $74,999 | 31 | 14.3% |
| $75,000 to $99,999 | 31 | 14.3% |
| $100,000 to $149,999 | 44 | 20.3% |
| $150,000 to $199,999 | 0 | 0.0% |
| $200,000+ | 0 | 0.0% |
Household Income by Householder Age in Strong City
The median household income in Strong City is $46,964, with the highest median household income of $64,500 found in the 25 to 44 years age bracket for the primary householder. A total of 82 households (37.8%) fall into this category. Meanwhile, the 15 to 24 years age bracket for the primary householder has the lowest median household income of $0, with 24 households (11.1%) in this group.
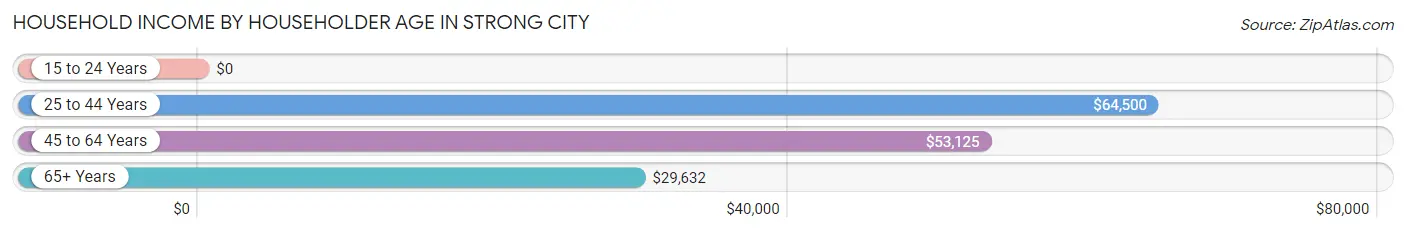
| Income Bracket | # Households | Median Income |
| 15 to 24 Years | 24 (11.1%) | $0 |
| 25 to 44 Years | 82 (37.8%) | $64,500 |
| 45 to 64 Years | 54 (24.9%) | $53,125 |
| 65+ Years | 57 (26.3%) | $29,632 |
| Total | 217 (100.0%) | $46,964 |
Poverty in Strong City
Income Below Poverty by Sex and Age in Strong City
With 7.5% poverty level for males and 8.1% for females among the residents of Strong City, 45 to 54 year old males and 5 year old females are the most vulnerable to poverty, with 8 males (40.0%) and 2 females (100.0%) in their respective age groups living below the poverty level.
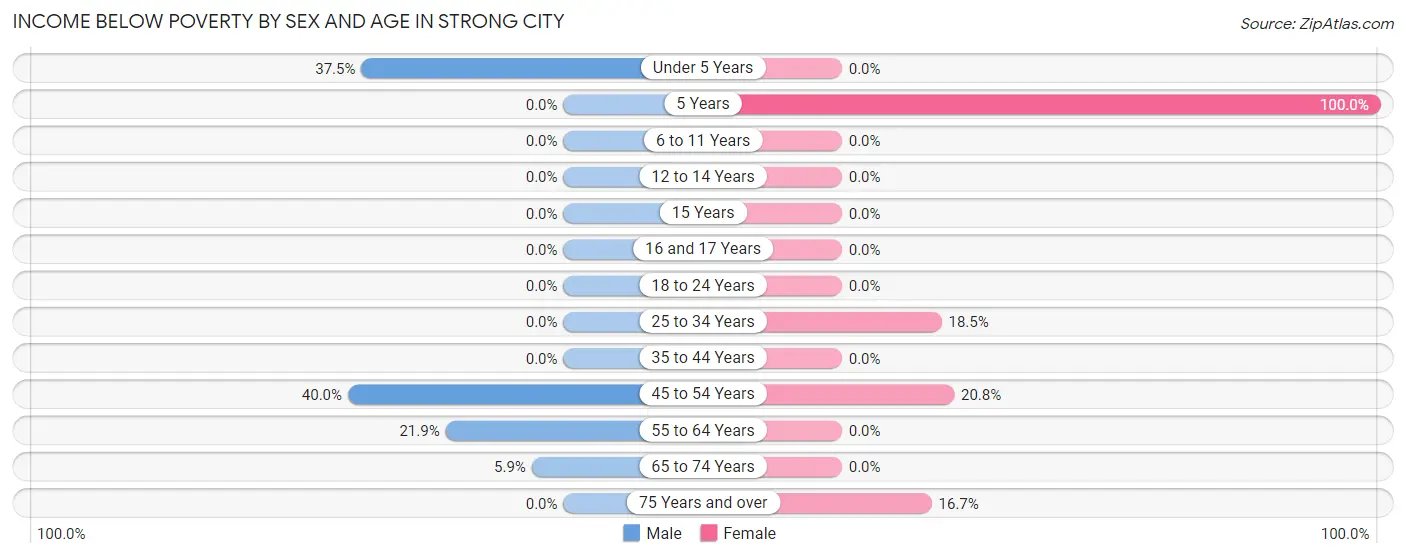
| Age Bracket | Male | Female |
| Under 5 Years | 3 (37.5%) | 0 (0.0%) |
| 5 Years | 0 (0.0%) | 2 (100.0%) |
| 6 to 11 Years | 0 (0.0%) | 0 (0.0%) |
| 12 to 14 Years | 0 (0.0%) | 0 (0.0%) |
| 15 Years | 0 (0.0%) | 0 (0.0%) |
| 16 and 17 Years | 0 (0.0%) | 0 (0.0%) |
| 18 to 24 Years | 0 (0.0%) | 0 (0.0%) |
| 25 to 34 Years | 0 (0.0%) | 5 (18.5%) |
| 35 to 44 Years | 0 (0.0%) | 0 (0.0%) |
| 45 to 54 Years | 8 (40.0%) | 5 (20.8%) |
| 55 to 64 Years | 7 (21.9%) | 0 (0.0%) |
| 65 to 74 Years | 1 (5.9%) | 0 (0.0%) |
| 75 Years and over | 0 (0.0%) | 5 (16.7%) |
| Total | 19 (7.5%) | 17 (8.1%) |
Income Above Poverty by Sex and Age in Strong City
According to the poverty statistics in Strong City, males aged 5 years and females aged under 5 years are the age groups that are most secure financially, with 100.0% of males and 100.0% of females in these age groups living above the poverty line.
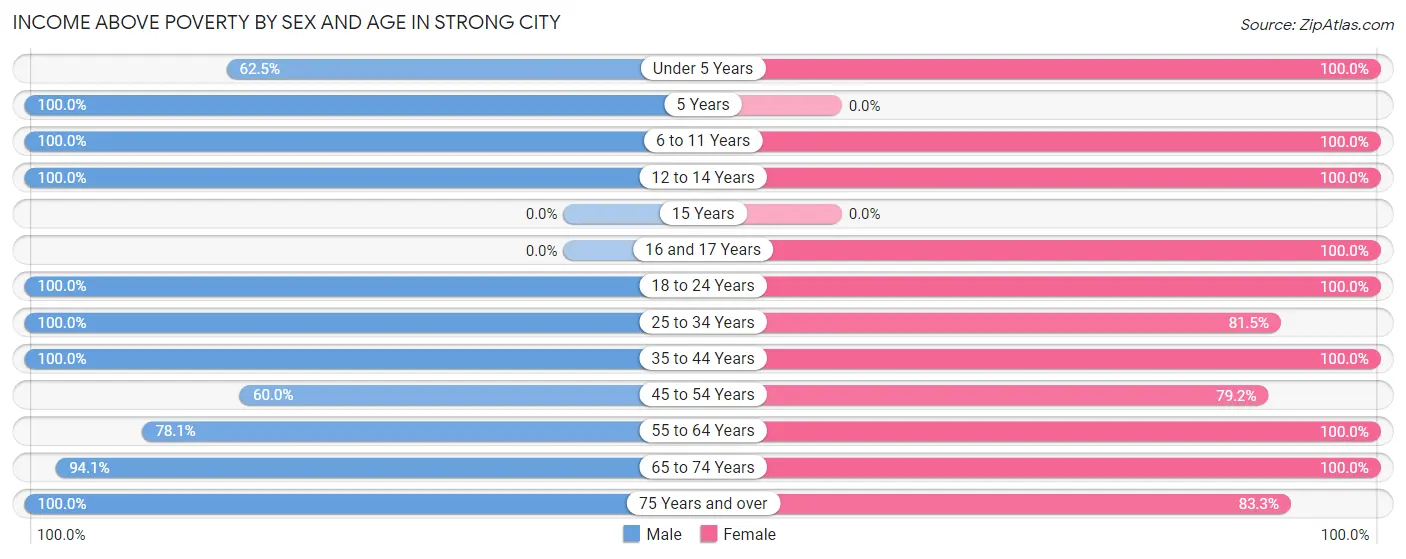
| Age Bracket | Male | Female |
| Under 5 Years | 5 (62.5%) | 20 (100.0%) |
| 5 Years | 3 (100.0%) | 0 (0.0%) |
| 6 to 11 Years | 26 (100.0%) | 23 (100.0%) |
| 12 to 14 Years | 1 (100.0%) | 8 (100.0%) |
| 15 Years | 0 (0.0%) | 0 (0.0%) |
| 16 and 17 Years | 0 (0.0%) | 2 (100.0%) |
| 18 to 24 Years | 25 (100.0%) | 7 (100.0%) |
| 25 to 34 Years | 62 (100.0%) | 22 (81.5%) |
| 35 to 44 Years | 57 (100.0%) | 24 (100.0%) |
| 45 to 54 Years | 12 (60.0%) | 19 (79.2%) |
| 55 to 64 Years | 25 (78.1%) | 18 (100.0%) |
| 65 to 74 Years | 16 (94.1%) | 26 (100.0%) |
| 75 Years and over | 3 (100.0%) | 25 (83.3%) |
| Total | 235 (92.5%) | 194 (91.9%) |
Income Below Poverty Among Married-Couple Families in Strong City
The poverty statistics for married-couple families in Strong City show that 2.7% or 2 of the total 75 families live below the poverty line. Families with no children have the highest poverty rate of 6.1%, comprising of 2 families. On the other hand, families with 1 or 2 children have the lowest poverty rate of 0.0%, which includes 0 families.
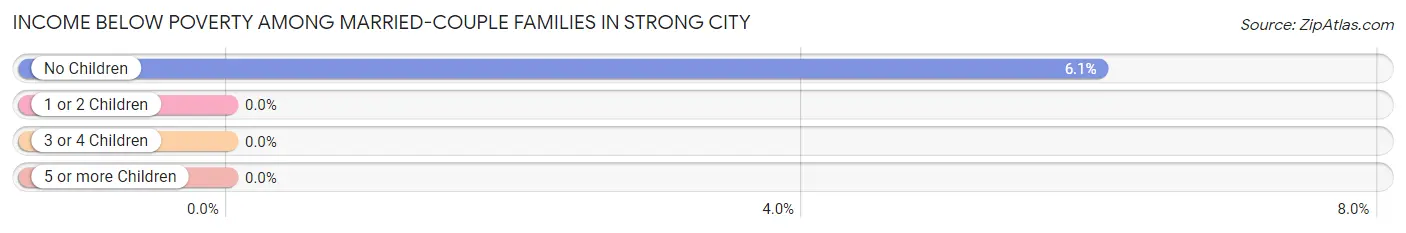
| Children | Above Poverty | Below Poverty |
| No Children | 31 (93.9%) | 2 (6.1%) |
| 1 or 2 Children | 37 (100.0%) | 0 (0.0%) |
| 3 or 4 Children | 5 (100.0%) | 0 (0.0%) |
| 5 or more Children | 0 (0.0%) | 0 (0.0%) |
| Total | 73 (97.3%) | 2 (2.7%) |
Income Below Poverty Among Single-Parent Households in Strong City
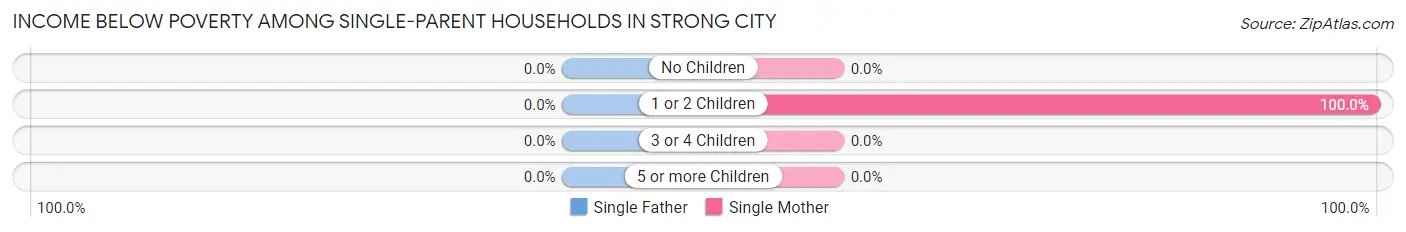
| Children | Single Father | Single Mother |
| No Children | 0 (0.0%) | 0 (0.0%) |
| 1 or 2 Children | 0 (0.0%) | 5 (100.0%) |
| 3 or 4 Children | 0 (0.0%) | 0 (0.0%) |
| 5 or more Children | 0 (0.0%) | 0 (0.0%) |
| Total | 0 (0.0%) | 5 (55.6%) |
Income Below Poverty Among Married-Couple vs Single-Parent Households in Strong City
The poverty data for Strong City shows that 2 of the married-couple family households (2.7%) and 5 of the single-parent households (13.9%) are living below the poverty level. Within the married-couple family households, those with no children have the highest poverty rate, with 2 households (6.1%) falling below the poverty line. Among the single-parent households, those with 1 or 2 children have the highest poverty rate, with 5 household (33.3%) living below poverty.
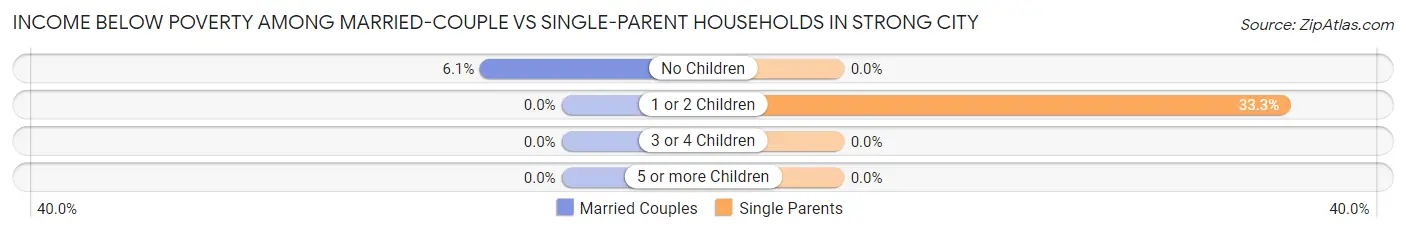
| Children | Married-Couple Families | Single-Parent Households |
| No Children | 2 (6.1%) | 0 (0.0%) |
| 1 or 2 Children | 0 (0.0%) | 5 (33.3%) |
| 3 or 4 Children | 0 (0.0%) | 0 (0.0%) |
| 5 or more Children | 0 (0.0%) | 0 (0.0%) |
| Total | 2 (2.7%) | 5 (13.9%) |
Race in Strong City
The most populous races in Strong City are White / Caucasian (426 | 91.6%), Two or more Races (25 | 5.4%), and Native / Alaskan (12 | 2.6%).
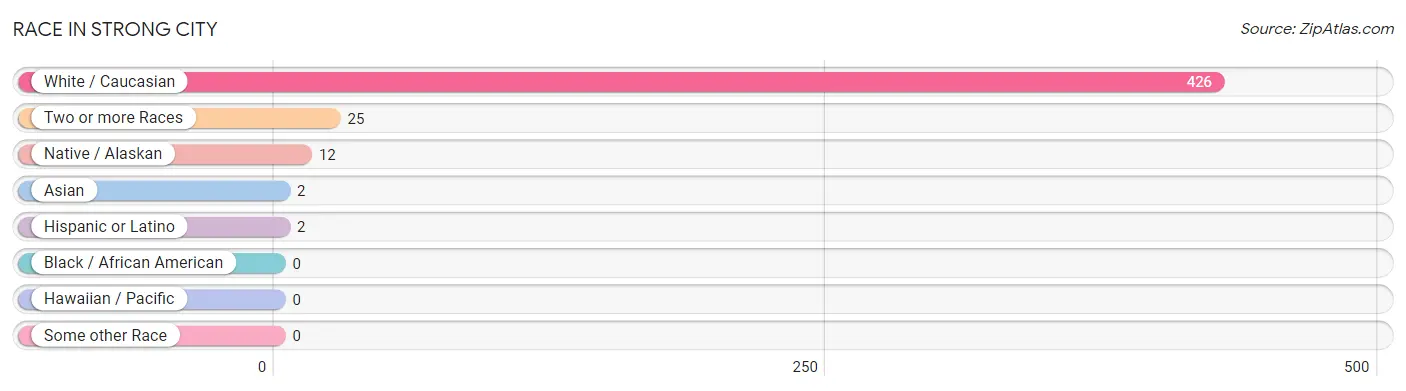
| Race | # Population | % Population |
| Asian | 2 | 0.4% |
| Black / African American | 0 | 0.0% |
| Hawaiian / Pacific | 0 | 0.0% |
| Hispanic or Latino | 2 | 0.4% |
| Native / Alaskan | 12 | 2.6% |
| White / Caucasian | 426 | 91.6% |
| Two or more Races | 25 | 5.4% |
| Some other Race | 0 | 0.0% |
| Total | 465 | 100.0% |
Ancestry in Strong City
The most populous ancestries reported in Strong City are German (154 | 33.1%), English (75 | 16.1%), Irish (45 | 9.7%), Swedish (37 | 8.0%), and Cherokee (31 | 6.7%), together accounting for 73.6% of all Strong City residents.
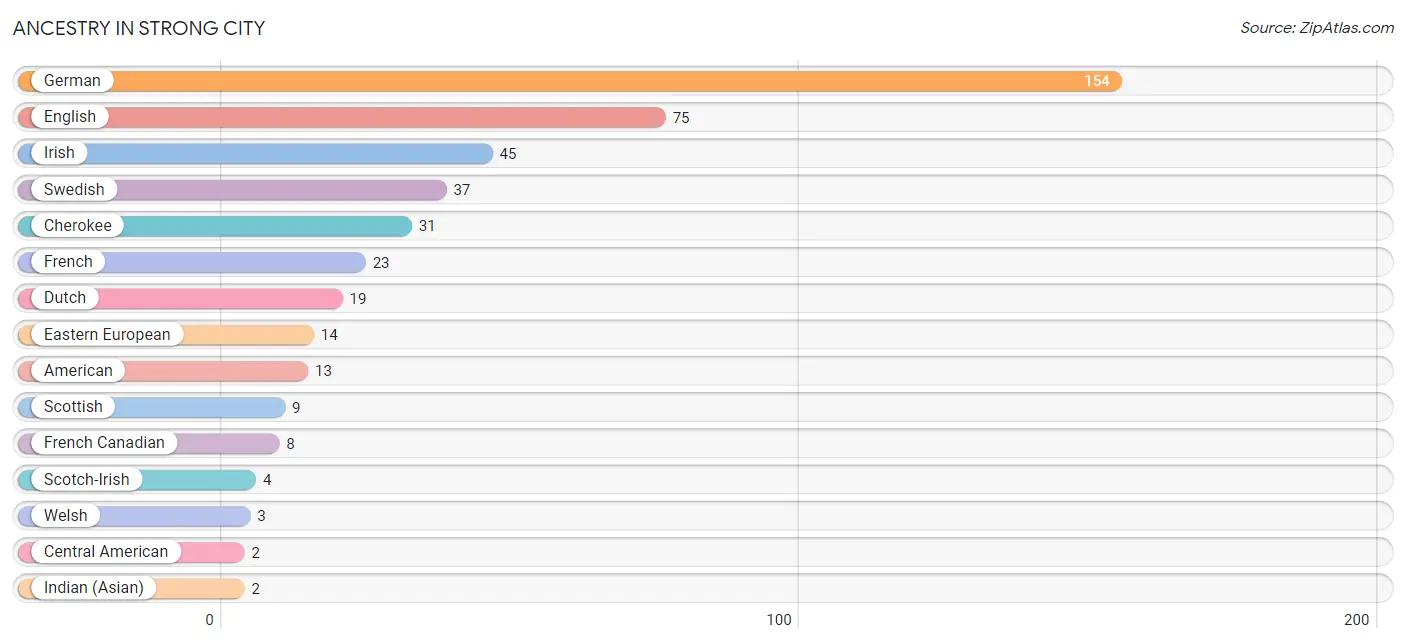
| Ancestry | # Population | % Population |
| American | 13 | 2.8% |
| Canadian | 1 | 0.2% |
| Central American | 2 | 0.4% |
| Cherokee | 31 | 6.7% |
| Danish | 1 | 0.2% |
| Dutch | 19 | 4.1% |
| Eastern European | 14 | 3.0% |
| English | 75 | 16.1% |
| French | 23 | 5.0% |
| French Canadian | 8 | 1.7% |
| German | 154 | 33.1% |
| Indian (Asian) | 2 | 0.4% |
| Irish | 45 | 9.7% |
| Panamanian | 2 | 0.4% |
| Polish | 2 | 0.4% |
| Scotch-Irish | 4 | 0.9% |
| Scottish | 9 | 1.9% |
| Sri Lankan | 1 | 0.2% |
| Swedish | 37 | 8.0% |
| Swiss | 1 | 0.2% |
| Welsh | 3 | 0.6% | View All 21 Rows |
Immigrants in Strong City
The most numerous immigrant groups reported in Strong City came from Europe (23 | 5.0%), Germany (23 | 5.0%), Western Europe (23 | 5.0%), Australia (2 | 0.4%), and Central America (2 | 0.4%), together accounting for 15.7% of all Strong City residents.
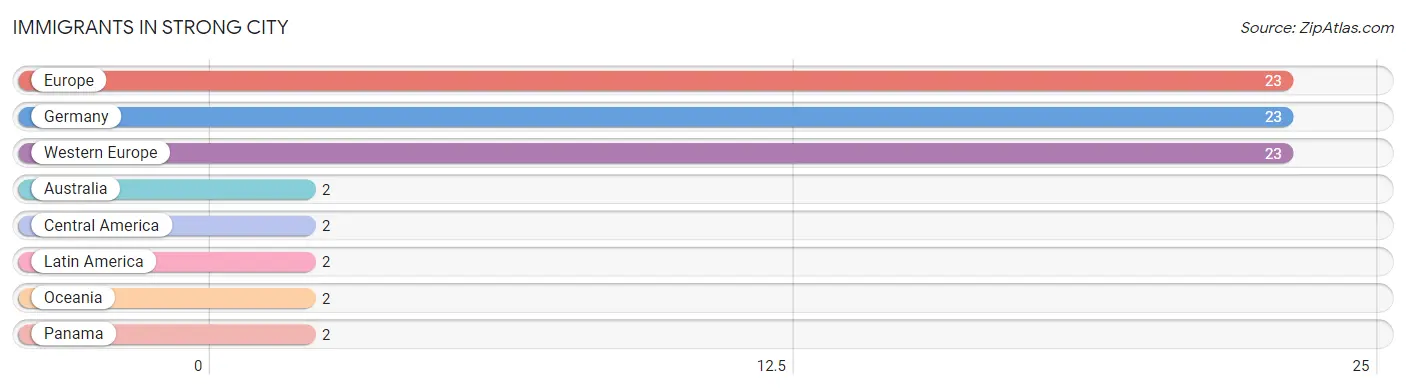
| Immigration Origin | # Population | % Population |
| Australia | 2 | 0.4% |
| Central America | 2 | 0.4% |
| Europe | 23 | 5.0% |
| Germany | 23 | 5.0% |
| Latin America | 2 | 0.4% |
| Oceania | 2 | 0.4% |
| Panama | 2 | 0.4% |
| Western Europe | 23 | 5.0% | View All 8 Rows |
Sex and Age in Strong City
Sex and Age in Strong City
The most populous age groups in Strong City are 40 to 44 Years (42 | 16.5%) for men and 85 Years and over (24 | 11.4%) for women.
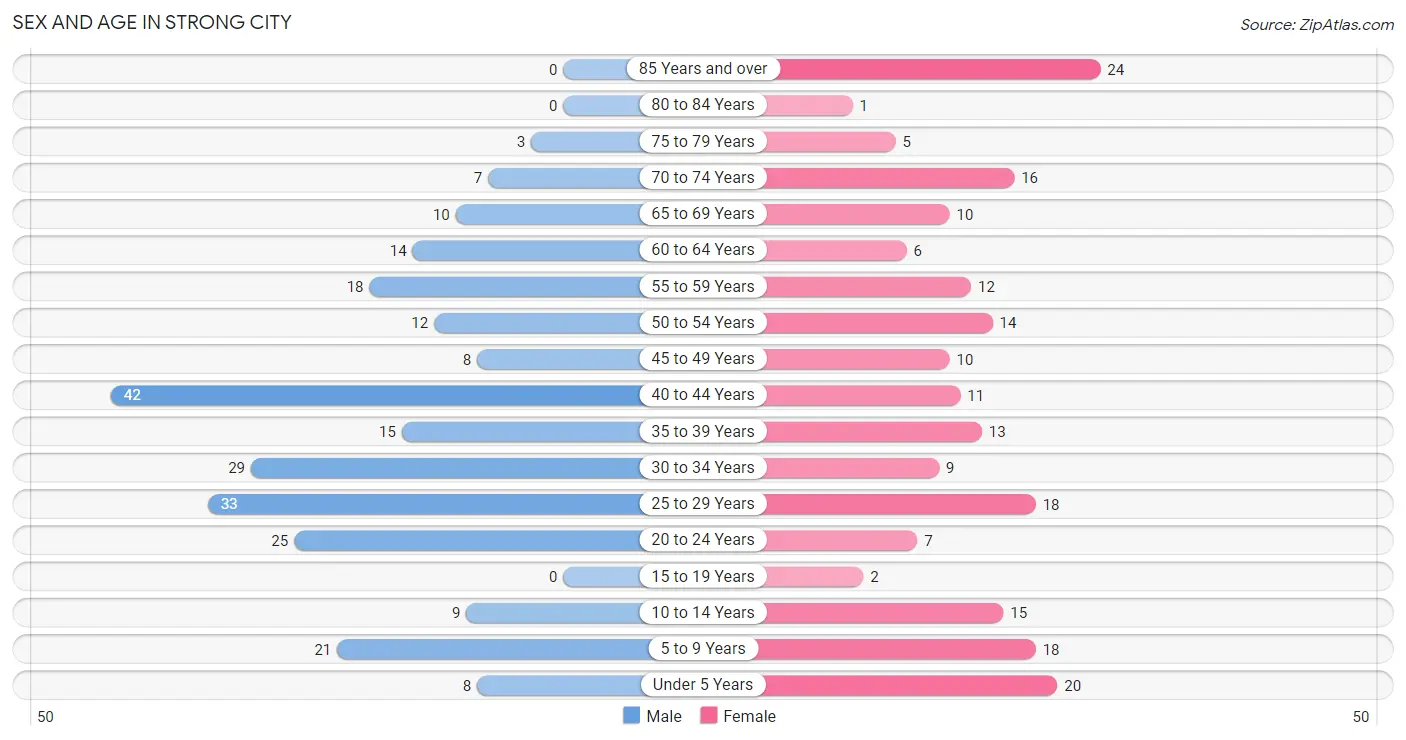
| Age Bracket | Male | Female |
| Under 5 Years | 8 (3.2%) | 20 (9.5%) |
| 5 to 9 Years | 21 (8.3%) | 18 (8.5%) |
| 10 to 14 Years | 9 (3.5%) | 15 (7.1%) |
| 15 to 19 Years | 0 (0.0%) | 2 (0.9%) |
| 20 to 24 Years | 25 (9.8%) | 7 (3.3%) |
| 25 to 29 Years | 33 (13.0%) | 18 (8.5%) |
| 30 to 34 Years | 29 (11.4%) | 9 (4.3%) |
| 35 to 39 Years | 15 (5.9%) | 13 (6.2%) |
| 40 to 44 Years | 42 (16.5%) | 11 (5.2%) |
| 45 to 49 Years | 8 (3.2%) | 10 (4.7%) |
| 50 to 54 Years | 12 (4.7%) | 14 (6.6%) |
| 55 to 59 Years | 18 (7.1%) | 12 (5.7%) |
| 60 to 64 Years | 14 (5.5%) | 6 (2.8%) |
| 65 to 69 Years | 10 (3.9%) | 10 (4.7%) |
| 70 to 74 Years | 7 (2.8%) | 16 (7.6%) |
| 75 to 79 Years | 3 (1.2%) | 5 (2.4%) |
| 80 to 84 Years | 0 (0.0%) | 1 (0.5%) |
| 85 Years and over | 0 (0.0%) | 24 (11.4%) |
| Total | 254 (100.0%) | 211 (100.0%) |
Families and Households in Strong City
Median Family Size in Strong City
The median family size in Strong City is 3.15 persons per family, with married-couple families (75 | 67.6%) accounting for the largest median family size of 3.61 persons per family. On the other hand, single male/father families (27 | 24.3%) represent the smallest median family size with 1.96 persons per family.
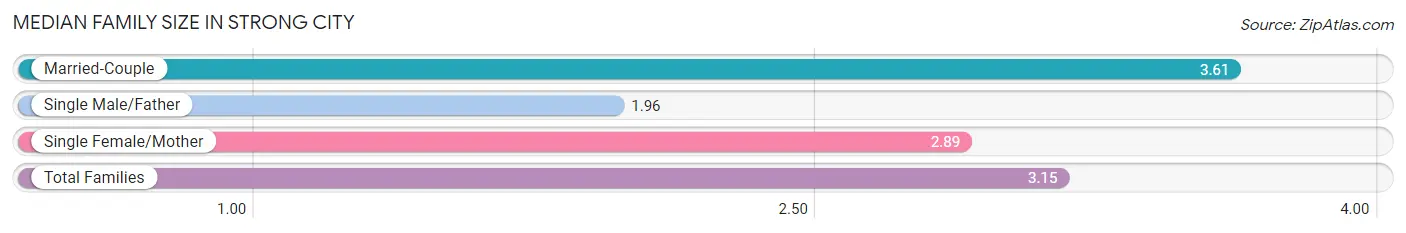
| Family Type | # Families | Family Size |
| Married-Couple | 75 (67.6%) | 3.61 |
| Single Male/Father | 27 (24.3%) | 1.96 |
| Single Female/Mother | 9 (8.1%) | 2.89 |
| Total Families | 111 (100.0%) | 3.15 |
Median Household Size in Strong City
The median household size in Strong City is 2.14 persons per household, with married-couple households (75 | 34.6%) accounting for the largest median household size of 3.61 persons per household. non-family households (106 | 48.8%) represent the smallest median household size with 1.08 persons per household.
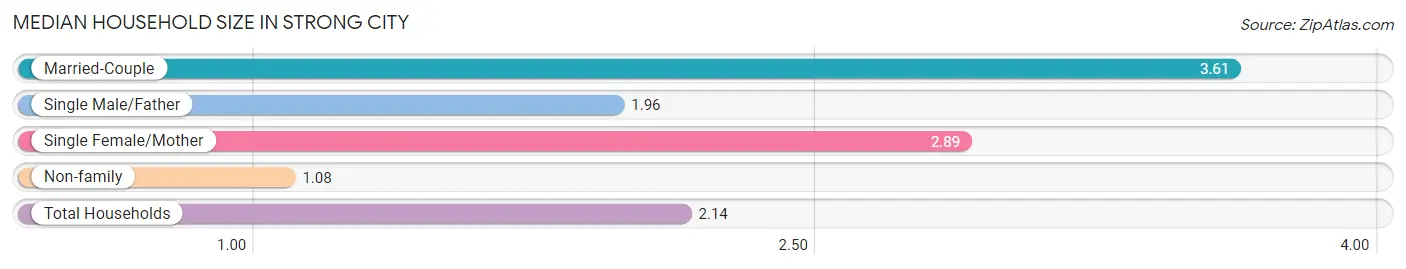
| Household Type | # Households | Household Size |
| Married-Couple | 75 (34.6%) | 3.61 |
| Single Male/Father | 27 (12.4%) | 1.96 |
| Single Female/Mother | 9 (4.2%) | 2.89 |
| Non-family | 106 (48.8%) | 1.08 |
| Total Households | 217 (100.0%) | 2.14 |
Household Size by Marriage Status in Strong City
Out of a total of 217 households in Strong City, 111 (51.1%) are family households, while 106 (48.8%) are nonfamily households. The most numerous type of family households are 2-person households, comprising 48, and the most common type of nonfamily households are 1-person households, comprising 96.
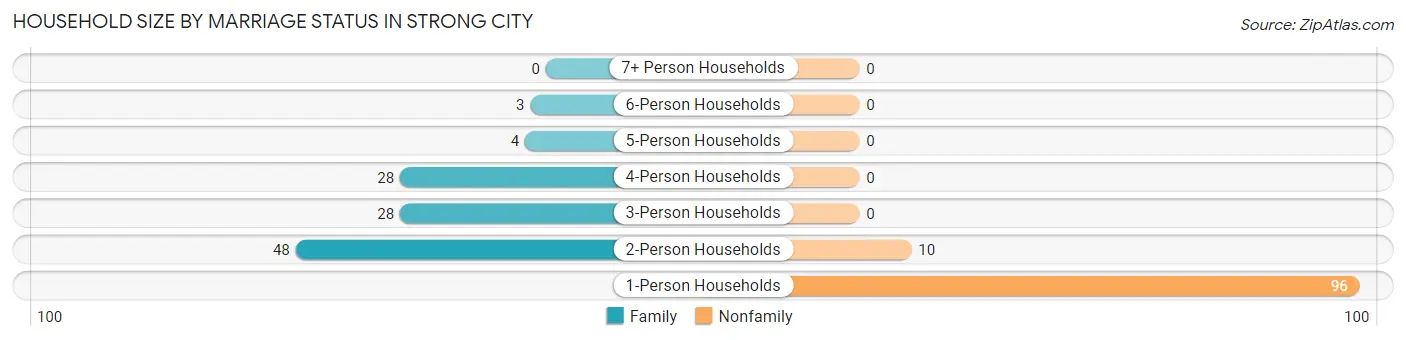
| Household Size | Family Households | Nonfamily Households |
| 1-Person Households | - | 96 (44.2%) |
| 2-Person Households | 48 (22.1%) | 10 (4.6%) |
| 3-Person Households | 28 (12.9%) | 0 (0.0%) |
| 4-Person Households | 28 (12.9%) | 0 (0.0%) |
| 5-Person Households | 4 (1.8%) | 0 (0.0%) |
| 6-Person Households | 3 (1.4%) | 0 (0.0%) |
| 7+ Person Households | 0 (0.0%) | 0 (0.0%) |
| Total | 111 (51.1%) | 106 (48.8%) |
Female Fertility in Strong City
Fertility by Age in Strong City
Average fertility rate in Strong City is 143.0 births per 1,000 women. Women in the age bracket of 20 to 34 years have the highest fertility rate with 294.0 births per 1,000 women. Women in the age bracket of 20 to 34 years acount for 100.0% of all women with births.
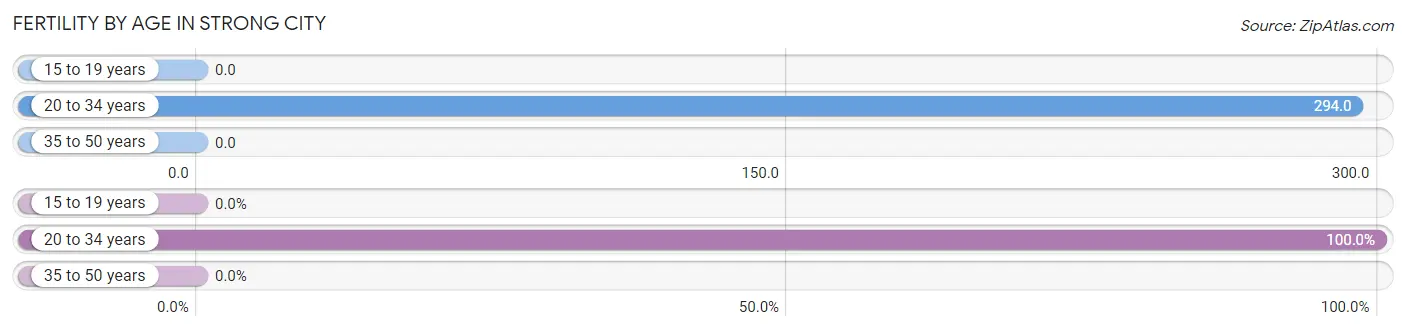
| Age Bracket | Women with Births | Births / 1,000 Women |
| 15 to 19 years | 0 (0.0%) | 0.0 |
| 20 to 34 years | 10 (100.0%) | 294.0 |
| 35 to 50 years | 0 (0.0%) | 0.0 |
| Total | 10 (100.0%) | 143.0 |
Fertility by Age by Marriage Status in Strong City
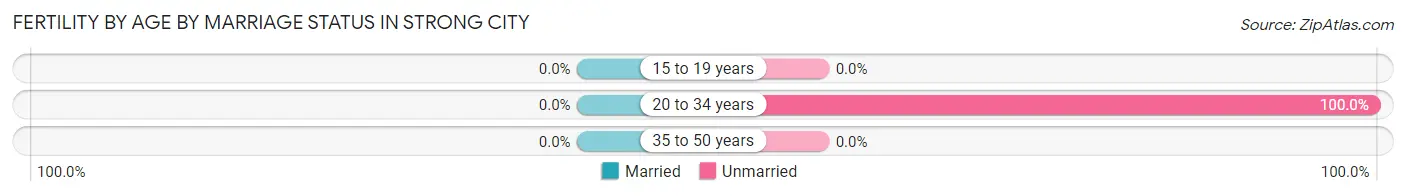
| Age Bracket | Married | Unmarried |
| 15 to 19 years | 0 (0.0%) | 0 (0.0%) |
| 20 to 34 years | 0 (0.0%) | 10 (100.0%) |
| 35 to 50 years | 0 (0.0%) | 0 (0.0%) |
| Total | 0 (0.0%) | 10 (100.0%) |
Fertility by Education in Strong City
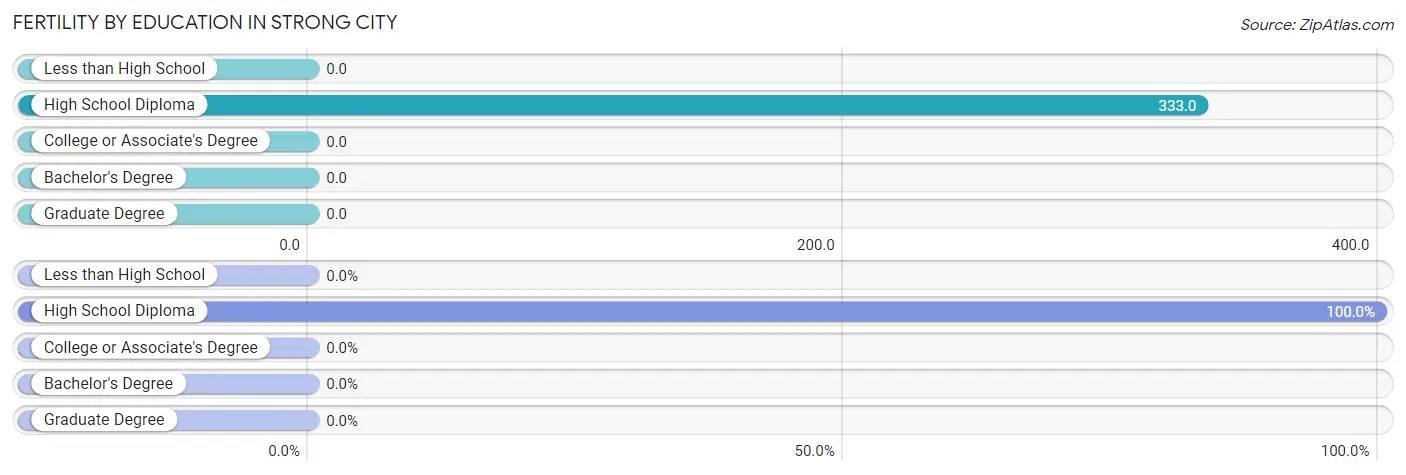
| Educational Attainment | Women with Births | Births / 1,000 Women |
| Less than High School | 0 (0.0%) | 0.0 |
| High School Diploma | 10 (100.0%) | 333.0 |
| College or Associate's Degree | 0 (0.0%) | 0.0 |
| Bachelor's Degree | 0 (0.0%) | 0.0 |
| Graduate Degree | 0 (0.0%) | 0.0 |
| Total | 10 (100.0%) | 143.0 |
Fertility by Education by Marriage Status in Strong City
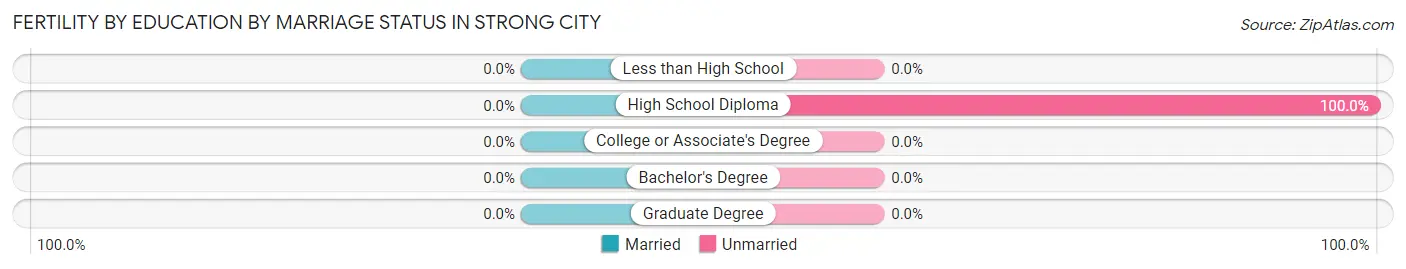
| Educational Attainment | Married | Unmarried |
| Less than High School | 0 (0.0%) | 0 (0.0%) |
| High School Diploma | 0 (0.0%) | 10 (100.0%) |
| College or Associate's Degree | 0 (0.0%) | 0 (0.0%) |
| Bachelor's Degree | 0 (0.0%) | 0 (0.0%) |
| Graduate Degree | 0 (0.0%) | 0 (0.0%) |
| Total | 0 (0.0%) | 10 (100.0%) |
Employment Characteristics in Strong City
Employment by Class of Employer in Strong City
Among the 247 employed individuals in Strong City, private company employees (177 | 71.7%), local government employees (36 | 14.6%), and self-employed (not incorporated) (16 | 6.5%) make up the most common classes of employment.
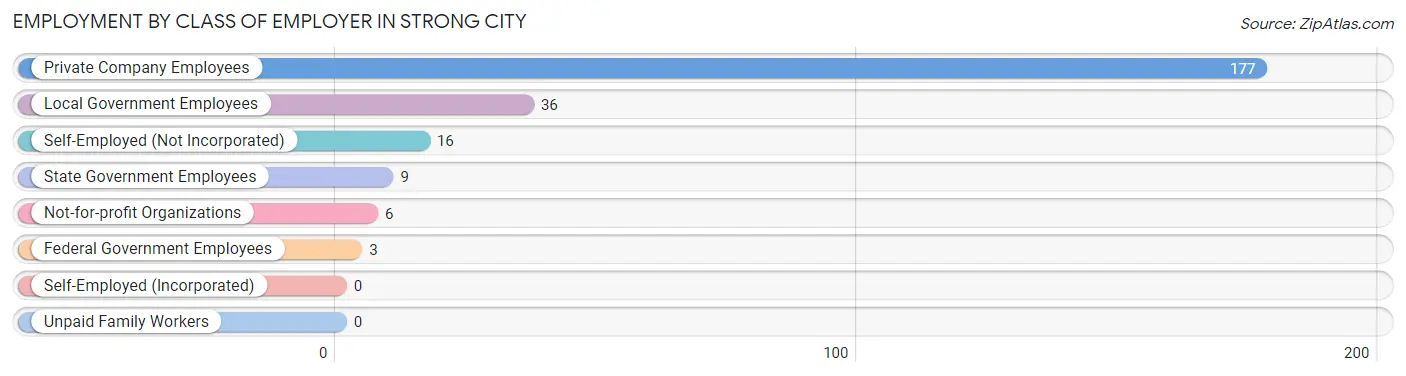
| Employer Class | # Employees | % Employees |
| Private Company Employees | 177 | 71.7% |
| Self-Employed (Incorporated) | 0 | 0.0% |
| Self-Employed (Not Incorporated) | 16 | 6.5% |
| Not-for-profit Organizations | 6 | 2.4% |
| Local Government Employees | 36 | 14.6% |
| State Government Employees | 9 | 3.6% |
| Federal Government Employees | 3 | 1.2% |
| Unpaid Family Workers | 0 | 0.0% |
| Total | 247 | 100.0% |
Employment Status by Age in Strong City
According to the labor force statistics for Strong City, out of the total population over 16 years of age (374), 68.2% or 255 individuals are in the labor force, with 1.2% or 3 of them unemployed. The age group with the highest labor force participation rate is 25 to 29 years, with 100.0% or 51 individuals in the labor force. Within the labor force, the 16 to 19 years age range has the highest percentage of unemployed individuals, with 100.0% or 1 of them being unemployed.
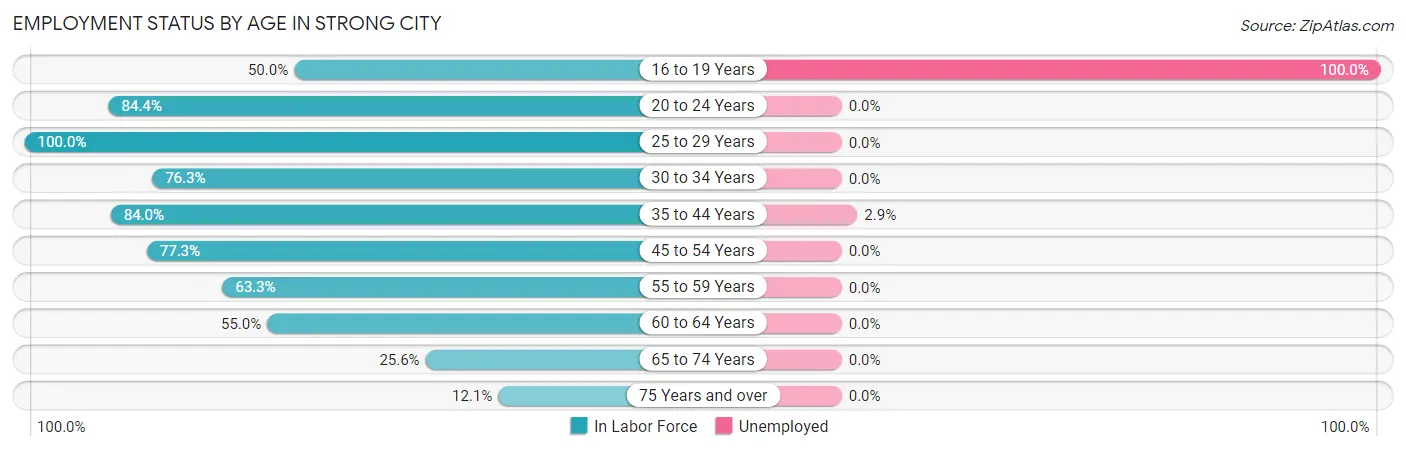
| Age Bracket | In Labor Force | Unemployed |
| 16 to 19 Years | 1 (50.0%) | 1 (100.0%) |
| 20 to 24 Years | 27 (84.4%) | 0 (0.0%) |
| 25 to 29 Years | 51 (100.0%) | 0 (0.0%) |
| 30 to 34 Years | 29 (76.3%) | 0 (0.0%) |
| 35 to 44 Years | 68 (84.0%) | 2 (2.9%) |
| 45 to 54 Years | 34 (77.3%) | 0 (0.0%) |
| 55 to 59 Years | 19 (63.3%) | 0 (0.0%) |
| 60 to 64 Years | 11 (55.0%) | 0 (0.0%) |
| 65 to 74 Years | 11 (25.6%) | 0 (0.0%) |
| 75 Years and over | 4 (12.1%) | 0 (0.0%) |
| Total | 255 (68.2%) | 3 (1.2%) |
Employment Status by Educational Attainment in Strong City
According to labor force statistics for Strong City, 80.3% of individuals (212) out of the total population between 25 and 64 years of age (264) are in the labor force, with 0.9% or 2 of them being unemployed. The group with the highest labor force participation rate are those with the educational attainment of college / associate degree, with 95.8% or 92 individuals in the labor force. Within the labor force, individuals with bachelor's degree or higher education have the highest percentage of unemployment, with 22.2% or 2 of them being unemployed.
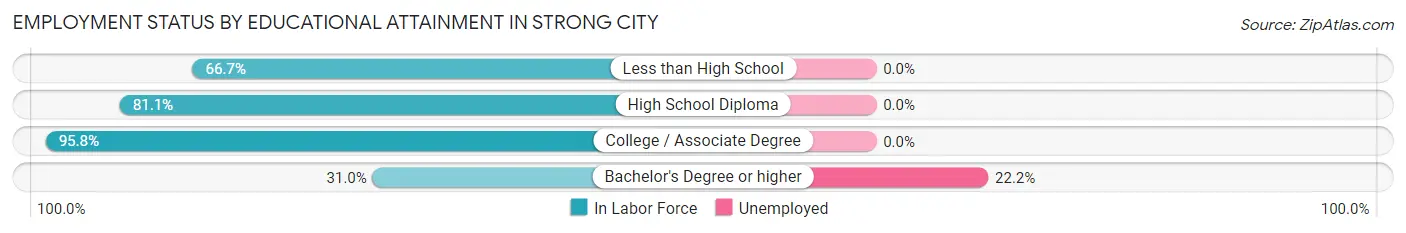
| Educational Attainment | In Labor Force | Unemployed |
| Less than High School | 8 (66.7%) | 0 (0.0%) |
| High School Diploma | 103 (81.1%) | 0 (0.0%) |
| College / Associate Degree | 92 (95.8%) | 0 (0.0%) |
| Bachelor's Degree or higher | 9 (31.0%) | 6 (22.2%) |
| Total | 212 (80.3%) | 2 (0.9%) |
Employment Occupations by Sex in Strong City
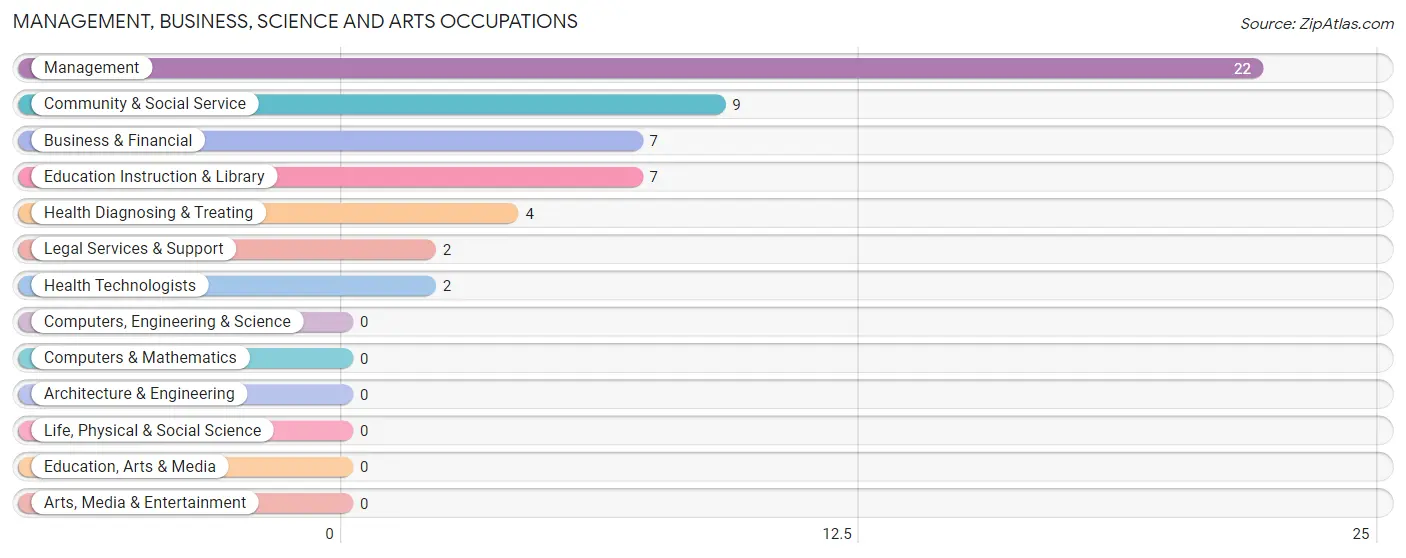
Management, Business, Science and Arts Occupations
The most common Management, Business, Science and Arts occupations in Strong City are Management (22 | 8.7%), Community & Social Service (9 | 3.6%), Business & Financial (7 | 2.8%), Education Instruction & Library (7 | 2.8%), and Health Diagnosing & Treating (4 | 1.6%).
Management, Business, Science and Arts Occupations by Sex
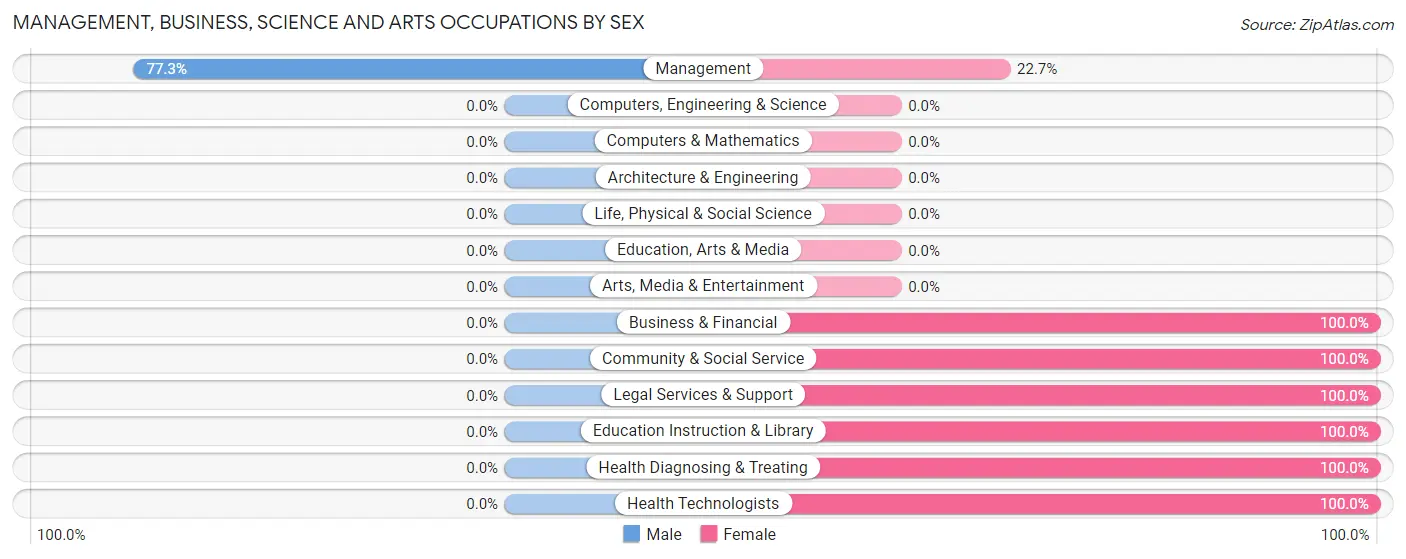
| Occupation | Male | Female |
| Management | 17 (77.3%) | 5 (22.7%) |
| Business & Financial | 0 (0.0%) | 7 (100.0%) |
| Computers, Engineering & Science | 0 (0.0%) | 0 (0.0%) |
| Computers & Mathematics | 0 (0.0%) | 0 (0.0%) |
| Architecture & Engineering | 0 (0.0%) | 0 (0.0%) |
| Life, Physical & Social Science | 0 (0.0%) | 0 (0.0%) |
| Community & Social Service | 0 (0.0%) | 9 (100.0%) |
| Education, Arts & Media | 0 (0.0%) | 0 (0.0%) |
| Legal Services & Support | 0 (0.0%) | 2 (100.0%) |
| Education Instruction & Library | 0 (0.0%) | 7 (100.0%) |
| Arts, Media & Entertainment | 0 (0.0%) | 0 (0.0%) |
| Health Diagnosing & Treating | 0 (0.0%) | 4 (100.0%) |
| Health Technologists | 0 (0.0%) | 2 (100.0%) |
| Total (Category) | 17 (40.5%) | 25 (59.5%) |
| Total (Overall) | 162 (64.3%) | 90 (35.7%) |
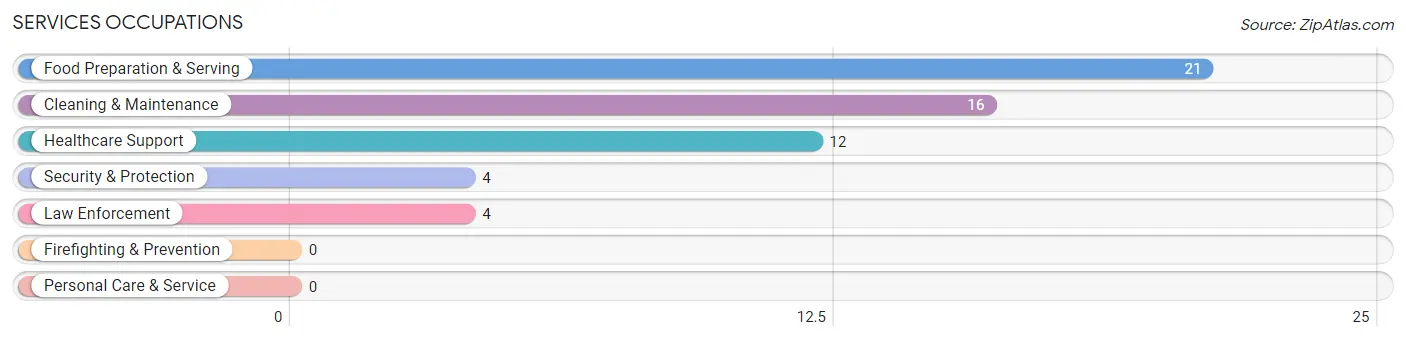
Services Occupations
The most common Services occupations in Strong City are Food Preparation & Serving (21 | 8.3%), Cleaning & Maintenance (16 | 6.4%), Healthcare Support (12 | 4.8%), Security & Protection (4 | 1.6%), and Law Enforcement (4 | 1.6%).
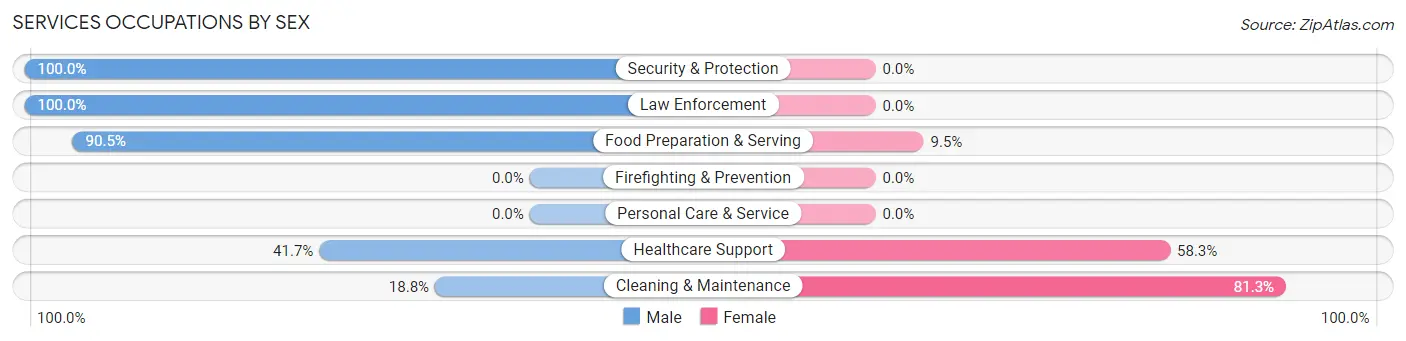
Services Occupations by Sex
Within the Services occupations in Strong City, the most male-oriented occupations are Security & Protection (100.0%), Law Enforcement (100.0%), and Food Preparation & Serving (90.5%), while the most female-oriented occupations are Cleaning & Maintenance (81.2%), Healthcare Support (58.3%), and Food Preparation & Serving (9.5%).
| Occupation | Male | Female |
| Healthcare Support | 5 (41.7%) | 7 (58.3%) |
| Security & Protection | 4 (100.0%) | 0 (0.0%) |
| Firefighting & Prevention | 0 (0.0%) | 0 (0.0%) |
| Law Enforcement | 4 (100.0%) | 0 (0.0%) |
| Food Preparation & Serving | 19 (90.5%) | 2 (9.5%) |
| Cleaning & Maintenance | 3 (18.8%) | 13 (81.2%) |
| Personal Care & Service | 0 (0.0%) | 0 (0.0%) |
| Total (Category) | 31 (58.5%) | 22 (41.5%) |
| Total (Overall) | 162 (64.3%) | 90 (35.7%) |
Sales and Office Occupations
The most common Sales and Office occupations in Strong City are Sales & Related (22 | 8.7%), and Office & Administration (17 | 6.8%).
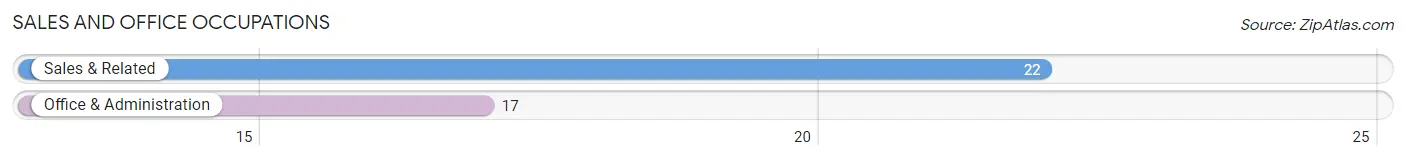
Sales and Office Occupations by Sex
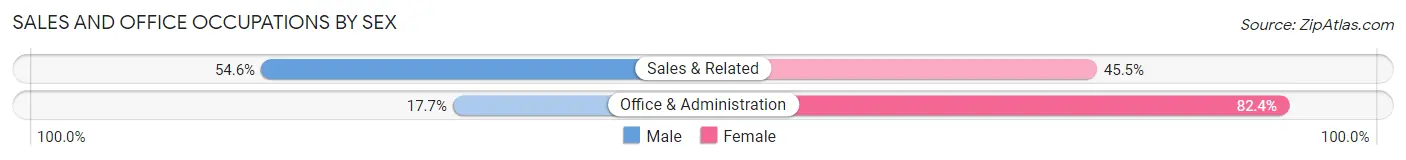
| Occupation | Male | Female |
| Sales & Related | 12 (54.5%) | 10 (45.5%) |
| Office & Administration | 3 (17.6%) | 14 (82.4%) |
| Total (Category) | 15 (38.5%) | 24 (61.5%) |
| Total (Overall) | 162 (64.3%) | 90 (35.7%) |
Natural Resources, Construction and Maintenance Occupations
The most common Natural Resources, Construction and Maintenance occupations in Strong City are Installation, Maintenance & Repair (24 | 9.5%), and Construction & Extraction (15 | 5.9%).
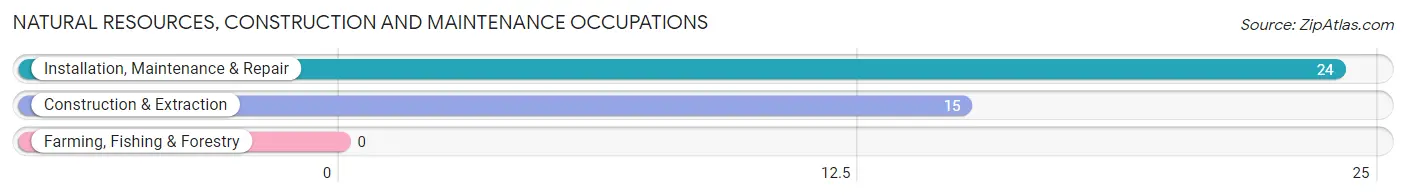
Natural Resources, Construction and Maintenance Occupations by Sex
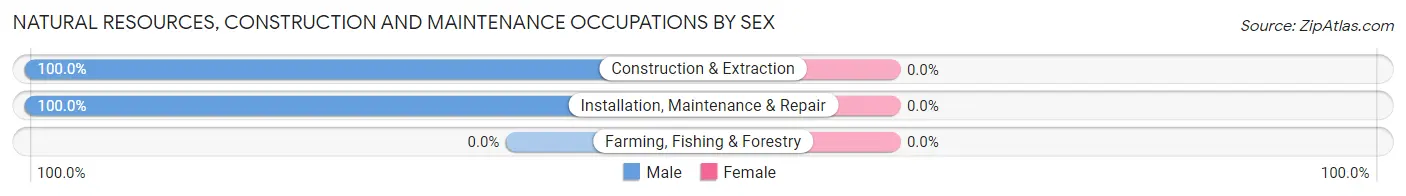
| Occupation | Male | Female |
| Farming, Fishing & Forestry | 0 (0.0%) | 0 (0.0%) |
| Construction & Extraction | 15 (100.0%) | 0 (0.0%) |
| Installation, Maintenance & Repair | 24 (100.0%) | 0 (0.0%) |
| Total (Category) | 39 (100.0%) | 0 (0.0%) |
| Total (Overall) | 162 (64.3%) | 90 (35.7%) |
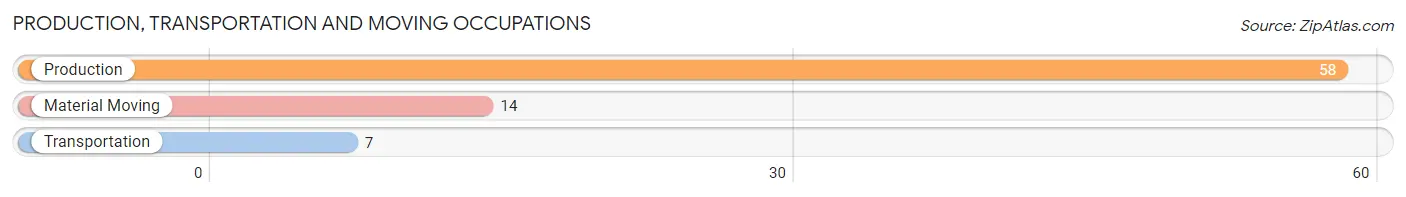
Production, Transportation and Moving Occupations
The most common Production, Transportation and Moving occupations in Strong City are Production (58 | 23.0%), Material Moving (14 | 5.6%), and Transportation (7 | 2.8%).
Production, Transportation and Moving Occupations by Sex
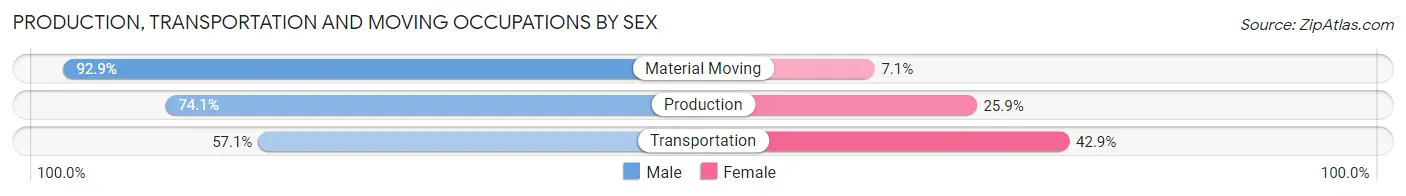
| Occupation | Male | Female |
| Production | 43 (74.1%) | 15 (25.9%) |
| Transportation | 4 (57.1%) | 3 (42.9%) |
| Material Moving | 13 (92.9%) | 1 (7.1%) |
| Total (Category) | 60 (75.9%) | 19 (24.0%) |
| Total (Overall) | 162 (64.3%) | 90 (35.7%) |
Employment Industries by Sex in Strong City
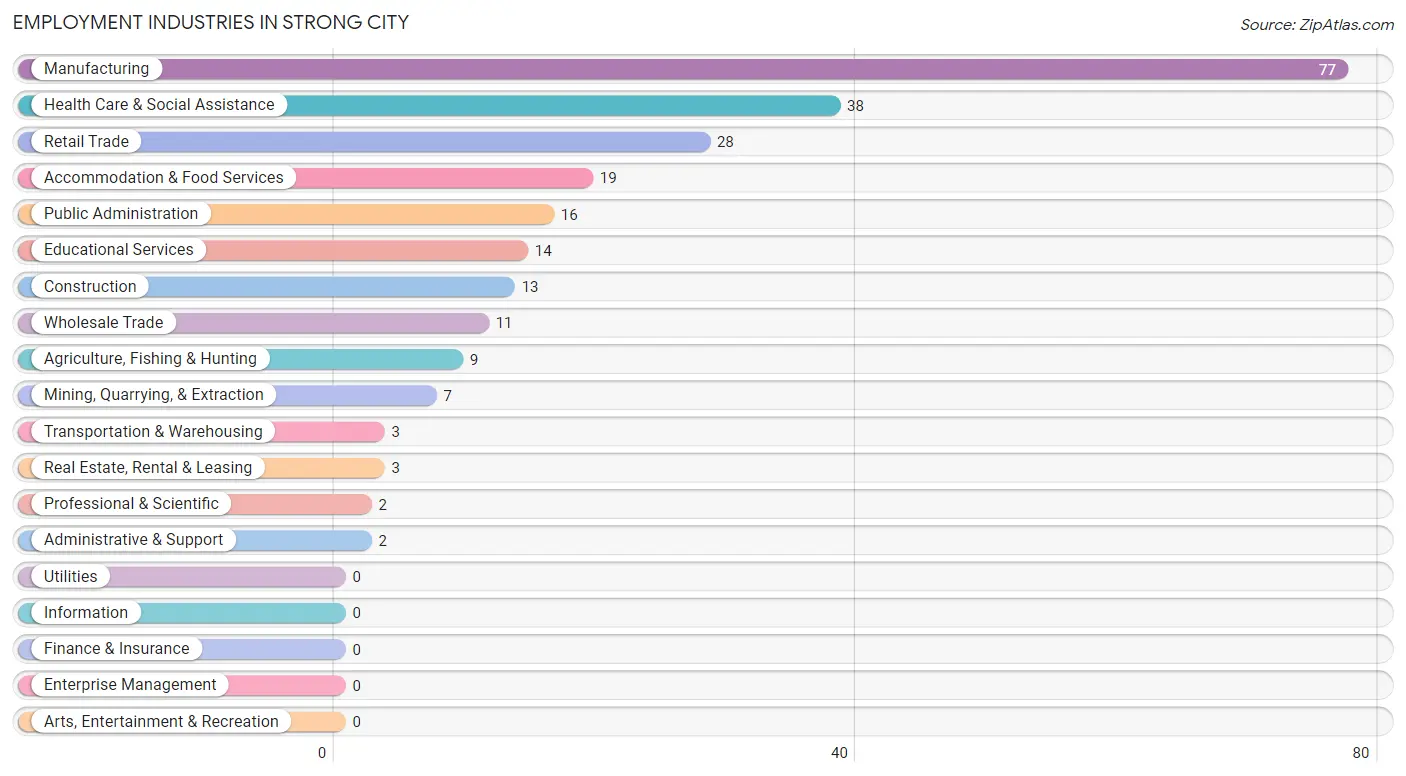
Employment Industries in Strong City
The major employment industries in Strong City include Manufacturing (77 | 30.6%), Health Care & Social Assistance (38 | 15.1%), Retail Trade (28 | 11.1%), Accommodation & Food Services (19 | 7.5%), and Public Administration (16 | 6.4%).
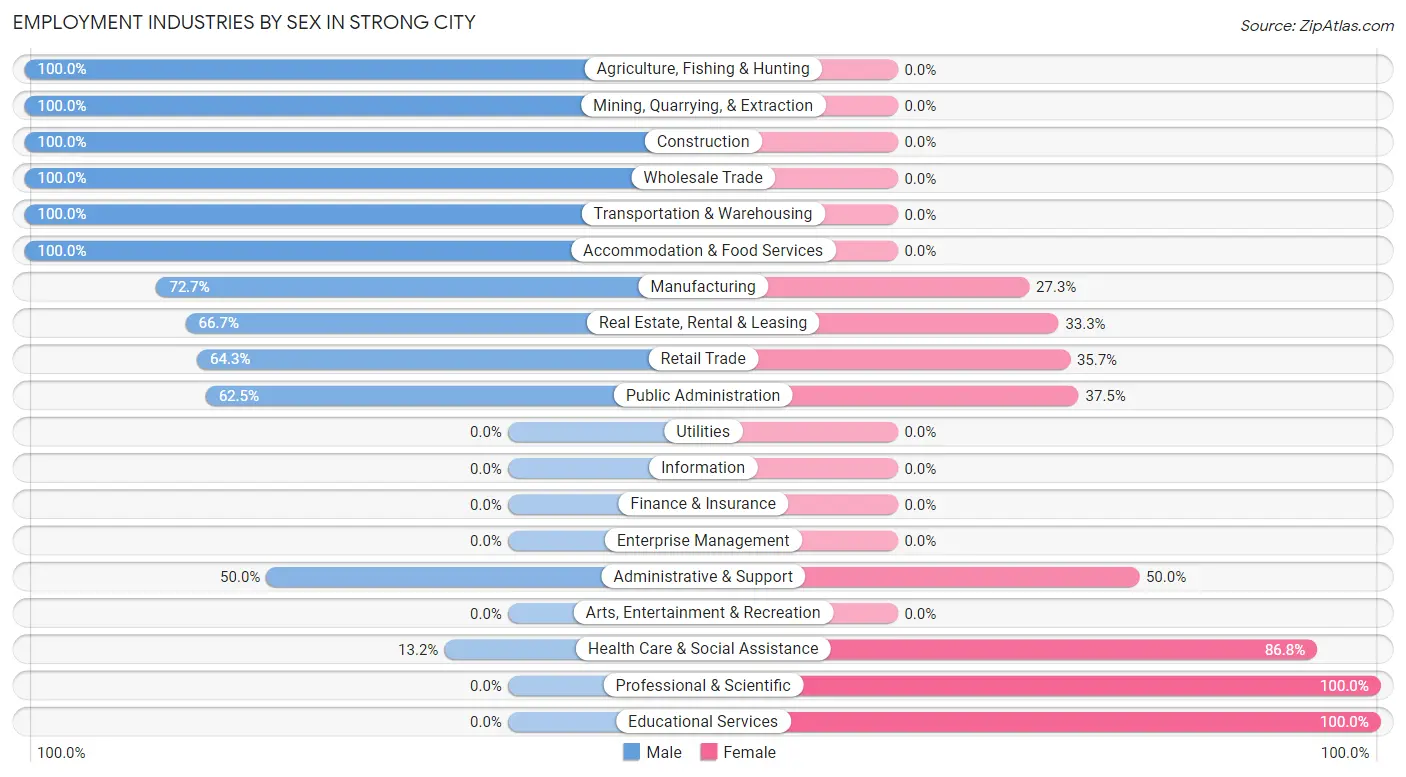
Employment Industries by Sex in Strong City
The Strong City industries that see more men than women are Agriculture, Fishing & Hunting (100.0%), Mining, Quarrying, & Extraction (100.0%), and Construction (100.0%), whereas the industries that tend to have a higher number of women are Professional & Scientific (100.0%), Educational Services (100.0%), and Health Care & Social Assistance (86.8%).
| Industry | Male | Female |
| Agriculture, Fishing & Hunting | 9 (100.0%) | 0 (0.0%) |
| Mining, Quarrying, & Extraction | 7 (100.0%) | 0 (0.0%) |
| Construction | 13 (100.0%) | 0 (0.0%) |
| Manufacturing | 56 (72.7%) | 21 (27.3%) |
| Wholesale Trade | 11 (100.0%) | 0 (0.0%) |
| Retail Trade | 18 (64.3%) | 10 (35.7%) |
| Transportation & Warehousing | 3 (100.0%) | 0 (0.0%) |
| Utilities | 0 (0.0%) | 0 (0.0%) |
| Information | 0 (0.0%) | 0 (0.0%) |
| Finance & Insurance | 0 (0.0%) | 0 (0.0%) |
| Real Estate, Rental & Leasing | 2 (66.7%) | 1 (33.3%) |
| Professional & Scientific | 0 (0.0%) | 2 (100.0%) |
| Enterprise Management | 0 (0.0%) | 0 (0.0%) |
| Administrative & Support | 1 (50.0%) | 1 (50.0%) |
| Educational Services | 0 (0.0%) | 14 (100.0%) |
| Health Care & Social Assistance | 5 (13.2%) | 33 (86.8%) |
| Arts, Entertainment & Recreation | 0 (0.0%) | 0 (0.0%) |
| Accommodation & Food Services | 19 (100.0%) | 0 (0.0%) |
| Public Administration | 10 (62.5%) | 6 (37.5%) |
| Total | 162 (64.3%) | 90 (35.7%) |
Education in Strong City
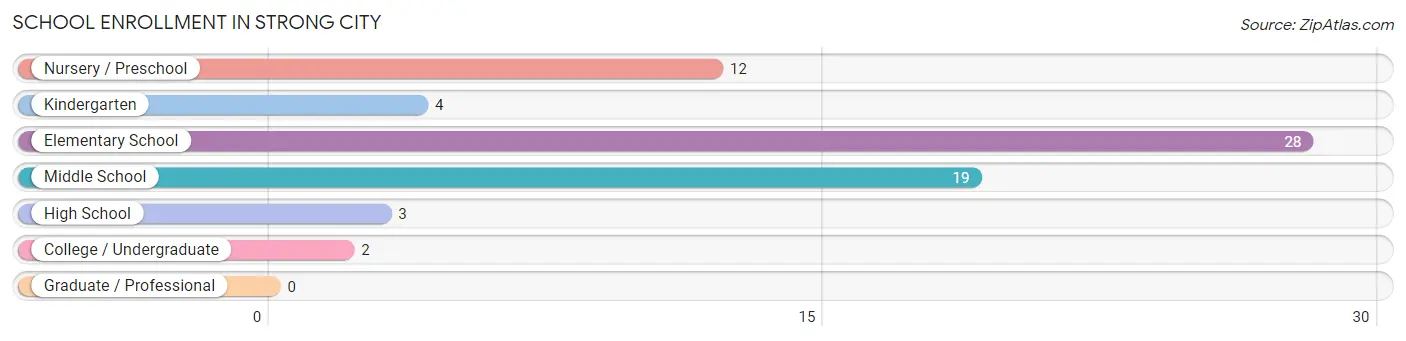
School Enrollment in Strong City
The most common levels of schooling among the 68 students in Strong City are elementary school (28 | 41.2%), middle school (19 | 27.9%), and nursery / preschool (12 | 17.6%).
| School Level | # Students | % Students |
| Nursery / Preschool | 12 | 17.6% |
| Kindergarten | 4 | 5.9% |
| Elementary School | 28 | 41.2% |
| Middle School | 19 | 27.9% |
| High School | 3 | 4.4% |
| College / Undergraduate | 2 | 2.9% |
| Graduate / Professional | 0 | 0.0% |
| Total | 68 | 100.0% |
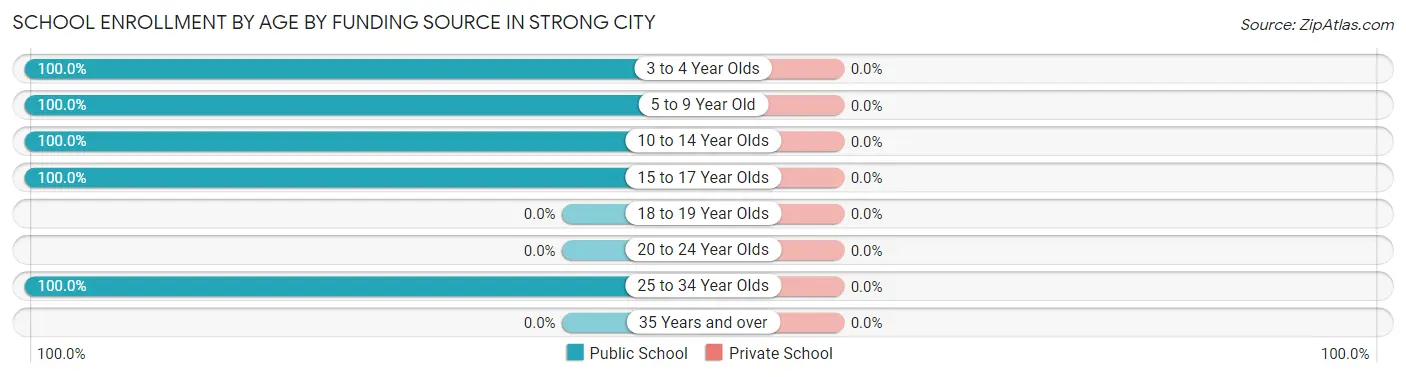
School Enrollment by Age by Funding Source in Strong City
| Age Bracket | Public School | Private School |
| 3 to 4 Year Olds | 10 (100.0%) | 0 (0.0%) |
| 5 to 9 Year Old | 30 (100.0%) | 0 (0.0%) |
| 10 to 14 Year Olds | 24 (100.0%) | 0 (0.0%) |
| 15 to 17 Year Olds | 2 (100.0%) | 0 (0.0%) |
| 18 to 19 Year Olds | 0 (0.0%) | 0 (0.0%) |
| 20 to 24 Year Olds | 0 (0.0%) | 0 (0.0%) |
| 25 to 34 Year Olds | 2 (100.0%) | 0 (0.0%) |
| 35 Years and over | 0 (0.0%) | 0 (0.0%) |
| Total | 68 (100.0%) | 0 (0.0%) |
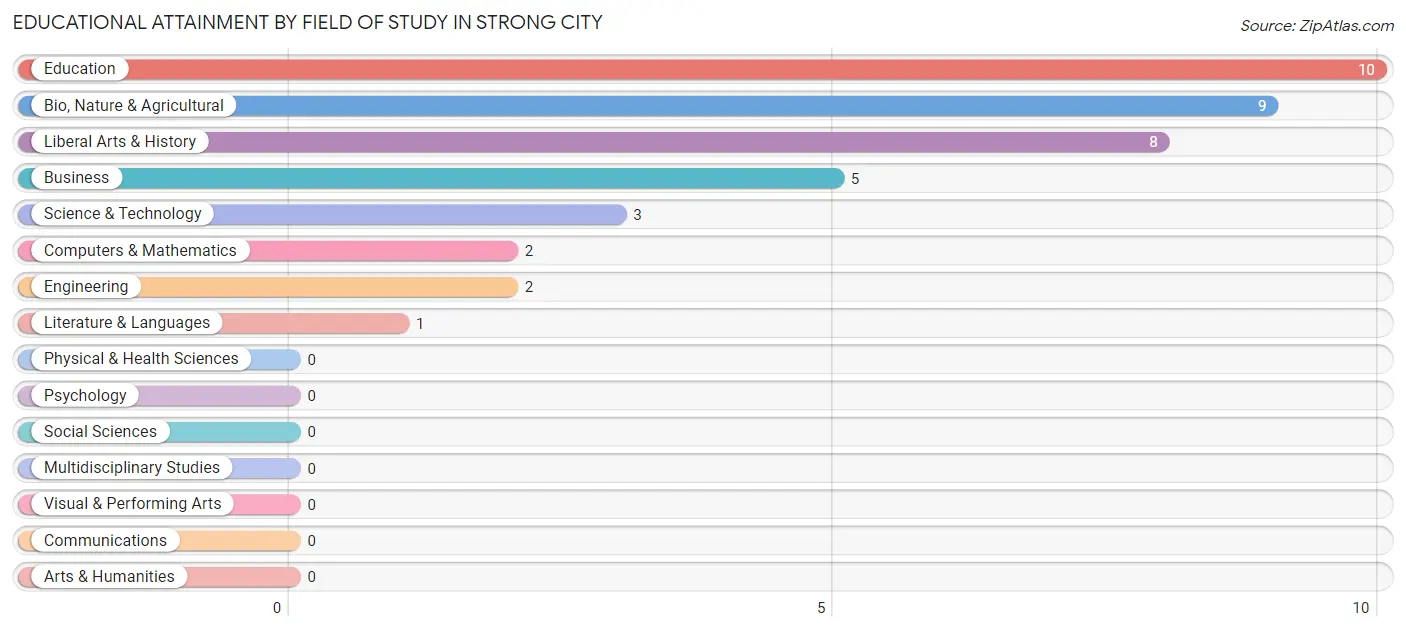
Educational Attainment by Field of Study in Strong City
Education (10 | 25.0%), bio, nature & agricultural (9 | 22.5%), liberal arts & history (8 | 20.0%), business (5 | 12.5%), and science & technology (3 | 7.5%) are the most common fields of study among 40 individuals in Strong City who have obtained a bachelor's degree or higher.
| Field of Study | # Graduates | % Graduates |
| Computers & Mathematics | 2 | 5.0% |
| Bio, Nature & Agricultural | 9 | 22.5% |
| Physical & Health Sciences | 0 | 0.0% |
| Psychology | 0 | 0.0% |
| Social Sciences | 0 | 0.0% |
| Engineering | 2 | 5.0% |
| Multidisciplinary Studies | 0 | 0.0% |
| Science & Technology | 3 | 7.5% |
| Business | 5 | 12.5% |
| Education | 10 | 25.0% |
| Literature & Languages | 1 | 2.5% |
| Liberal Arts & History | 8 | 20.0% |
| Visual & Performing Arts | 0 | 0.0% |
| Communications | 0 | 0.0% |
| Arts & Humanities | 0 | 0.0% |
| Total | 40 | 100.0% |
Transportation & Commute in Strong City
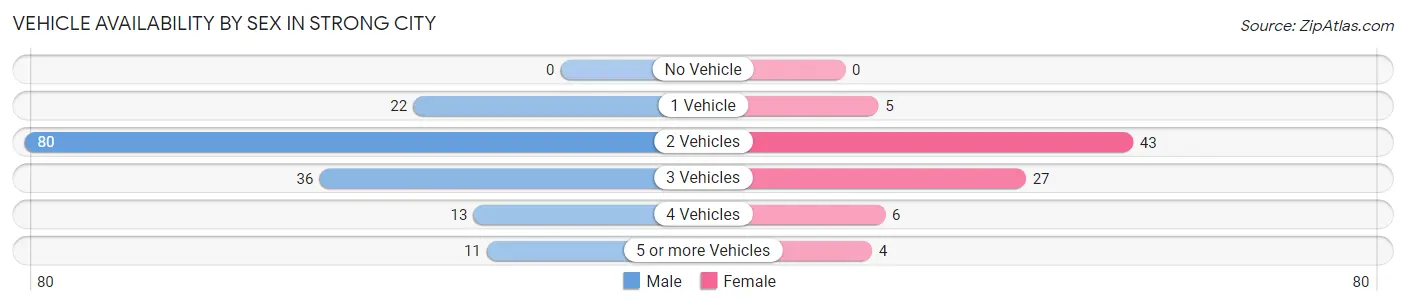
Vehicle Availability by Sex in Strong City
The most prevalent vehicle ownership categories in Strong City are males with 2 vehicles (80, accounting for 49.4%) and females with 2 vehicles (43, making up 94.1%).
| Vehicles Available | Male | Female |
| No Vehicle | 0 (0.0%) | 0 (0.0%) |
| 1 Vehicle | 22 (13.6%) | 5 (5.9%) |
| 2 Vehicles | 80 (49.4%) | 43 (50.6%) |
| 3 Vehicles | 36 (22.2%) | 27 (31.8%) |
| 4 Vehicles | 13 (8.0%) | 6 (7.1%) |
| 5 or more Vehicles | 11 (6.8%) | 4 (4.7%) |
| Total | 162 (100.0%) | 85 (100.0%) |
Commute Time in Strong City
The most frequently occuring commute durations in Strong City are less than 5 minutes (80 commuters, 34.5%), 5 to 9 minutes (71 commuters, 30.6%), and 20 to 24 minutes (25 commuters, 10.8%).
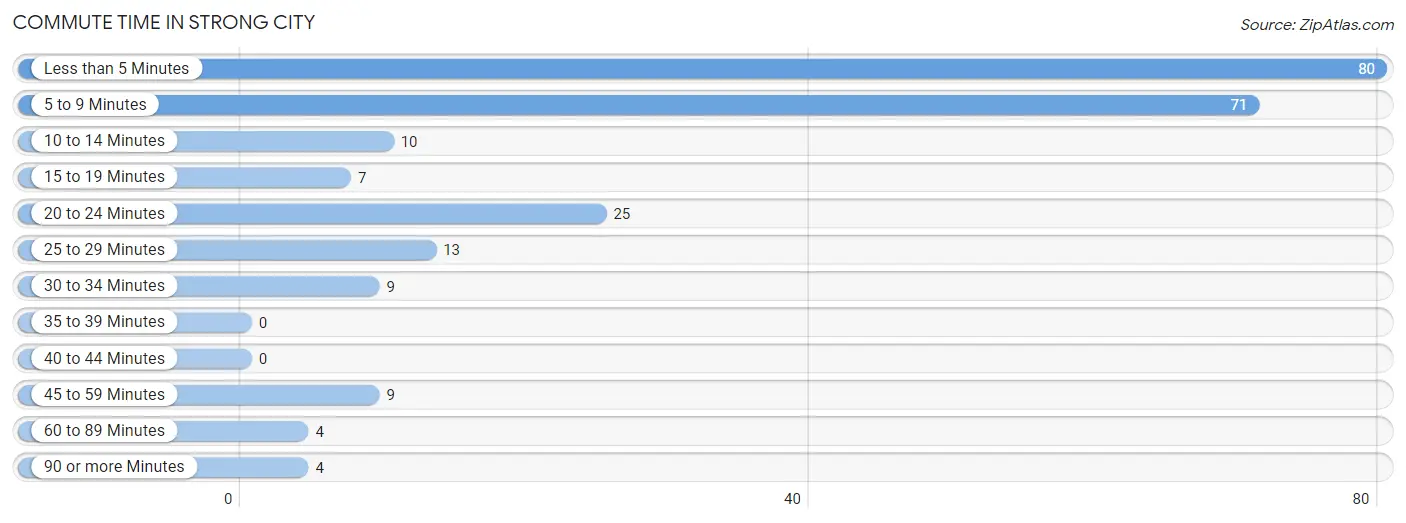
| Commute Time | # Commuters | % Commuters |
| Less than 5 Minutes | 80 | 34.5% |
| 5 to 9 Minutes | 71 | 30.6% |
| 10 to 14 Minutes | 10 | 4.3% |
| 15 to 19 Minutes | 7 | 3.0% |
| 20 to 24 Minutes | 25 | 10.8% |
| 25 to 29 Minutes | 13 | 5.6% |
| 30 to 34 Minutes | 9 | 3.9% |
| 35 to 39 Minutes | 0 | 0.0% |
| 40 to 44 Minutes | 0 | 0.0% |
| 45 to 59 Minutes | 9 | 3.9% |
| 60 to 89 Minutes | 4 | 1.7% |
| 90 or more Minutes | 4 | 1.7% |
Commute Time by Sex in Strong City
The most common commute times in Strong City are less than 5 minutes (59 commuters, 38.8%) for males and 5 to 9 minutes (37 commuters, 46.3%) for females.
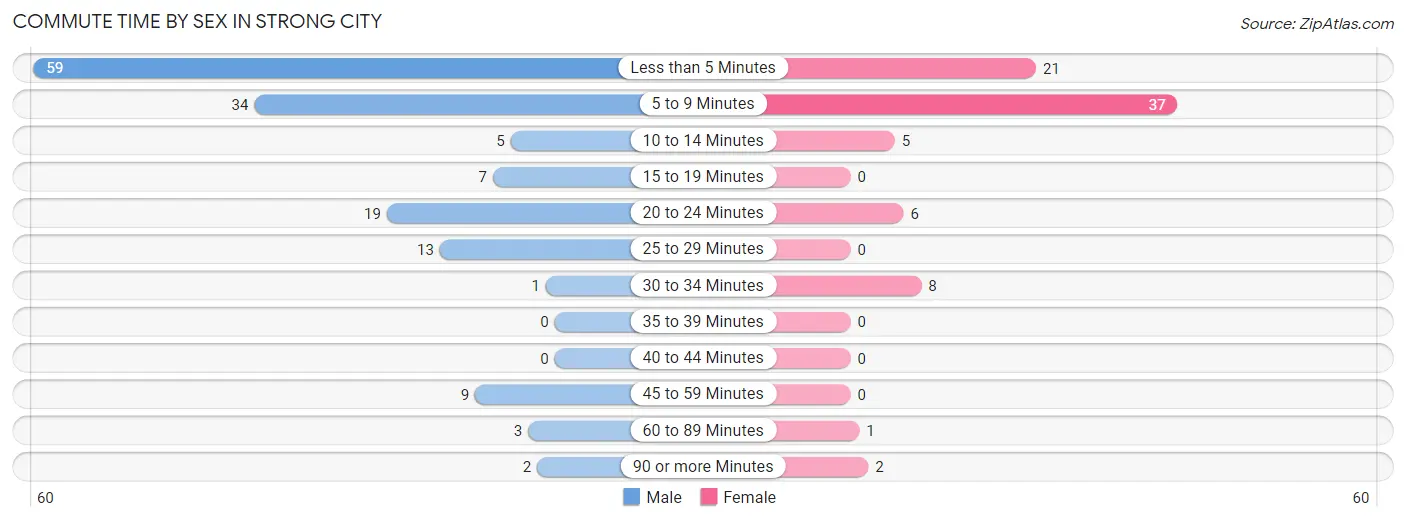
| Commute Time | Male | Female |
| Less than 5 Minutes | 59 (38.8%) | 21 (26.3%) |
| 5 to 9 Minutes | 34 (22.4%) | 37 (46.3%) |
| 10 to 14 Minutes | 5 (3.3%) | 5 (6.2%) |
| 15 to 19 Minutes | 7 (4.6%) | 0 (0.0%) |
| 20 to 24 Minutes | 19 (12.5%) | 6 (7.5%) |
| 25 to 29 Minutes | 13 (8.6%) | 0 (0.0%) |
| 30 to 34 Minutes | 1 (0.7%) | 8 (10.0%) |
| 35 to 39 Minutes | 0 (0.0%) | 0 (0.0%) |
| 40 to 44 Minutes | 0 (0.0%) | 0 (0.0%) |
| 45 to 59 Minutes | 9 (5.9%) | 0 (0.0%) |
| 60 to 89 Minutes | 3 (2.0%) | 1 (1.3%) |
| 90 or more Minutes | 2 (1.3%) | 2 (2.5%) |
Time of Departure to Work by Sex in Strong City
The most frequent times of departure to work in Strong City are 5:00 AM to 5:29 AM (25, 16.5%) for males and 7:30 AM to 7:59 AM (32, 40.0%) for females.
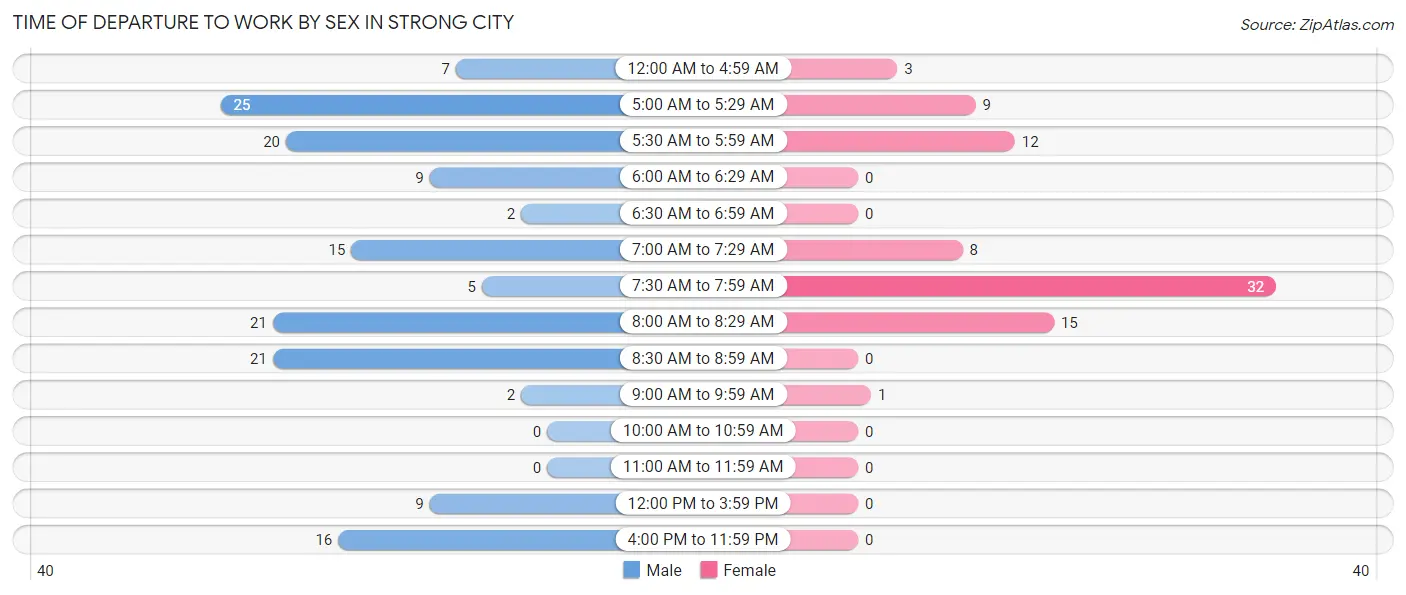
| Time of Departure | Male | Female |
| 12:00 AM to 4:59 AM | 7 (4.6%) | 3 (3.7%) |
| 5:00 AM to 5:29 AM | 25 (16.5%) | 9 (11.3%) |
| 5:30 AM to 5:59 AM | 20 (13.2%) | 12 (15.0%) |
| 6:00 AM to 6:29 AM | 9 (5.9%) | 0 (0.0%) |
| 6:30 AM to 6:59 AM | 2 (1.3%) | 0 (0.0%) |
| 7:00 AM to 7:29 AM | 15 (9.9%) | 8 (10.0%) |
| 7:30 AM to 7:59 AM | 5 (3.3%) | 32 (40.0%) |
| 8:00 AM to 8:29 AM | 21 (13.8%) | 15 (18.8%) |
| 8:30 AM to 8:59 AM | 21 (13.8%) | 0 (0.0%) |
| 9:00 AM to 9:59 AM | 2 (1.3%) | 1 (1.3%) |
| 10:00 AM to 10:59 AM | 0 (0.0%) | 0 (0.0%) |
| 11:00 AM to 11:59 AM | 0 (0.0%) | 0 (0.0%) |
| 12:00 PM to 3:59 PM | 9 (5.9%) | 0 (0.0%) |
| 4:00 PM to 11:59 PM | 16 (10.5%) | 0 (0.0%) |
| Total | 152 (100.0%) | 80 (100.0%) |
Housing Occupancy in Strong City
Occupancy by Ownership in Strong City
Of the total 217 dwellings in Strong City, owner-occupied units account for 123 (56.7%), while renter-occupied units make up 94 (43.3%).
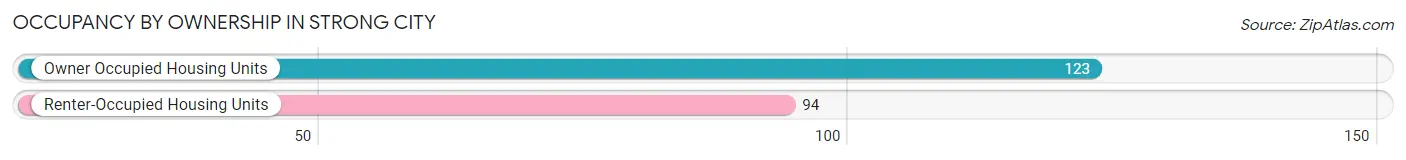
| Occupancy | # Housing Units | % Housing Units |
| Owner Occupied Housing Units | 123 | 56.7% |
| Renter-Occupied Housing Units | 94 | 43.3% |
| Total Occupied Housing Units | 217 | 100.0% |
Occupancy by Household Size in Strong City
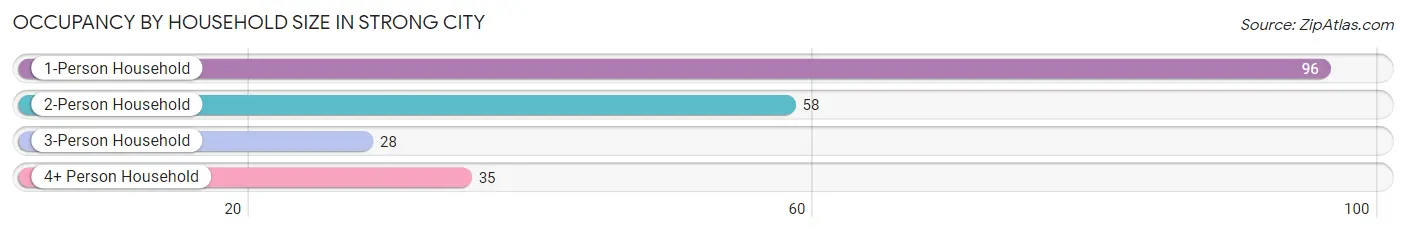
| Household Size | # Housing Units | % Housing Units |
| 1-Person Household | 96 | 44.2% |
| 2-Person Household | 58 | 26.7% |
| 3-Person Household | 28 | 12.9% |
| 4+ Person Household | 35 | 16.1% |
| Total Housing Units | 217 | 100.0% |
Occupancy by Ownership by Household Size in Strong City
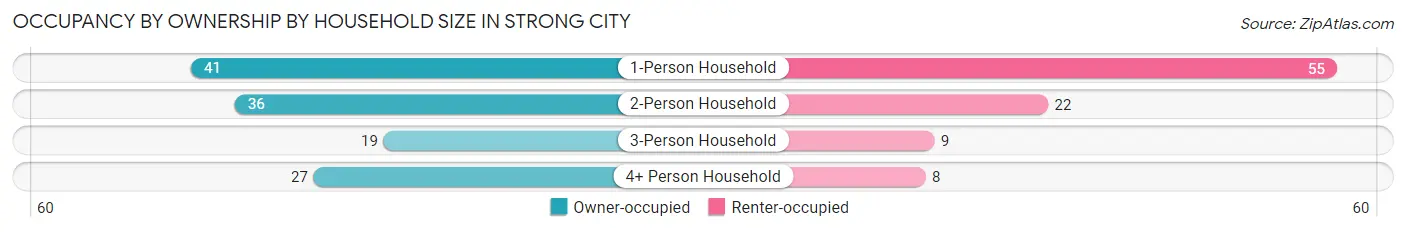
| Household Size | Owner-occupied | Renter-occupied |
| 1-Person Household | 41 (42.7%) | 55 (57.3%) |
| 2-Person Household | 36 (62.1%) | 22 (37.9%) |
| 3-Person Household | 19 (67.9%) | 9 (32.1%) |
| 4+ Person Household | 27 (77.1%) | 8 (22.9%) |
| Total Housing Units | 123 (56.7%) | 94 (43.3%) |
Occupancy by Educational Attainment in Strong City
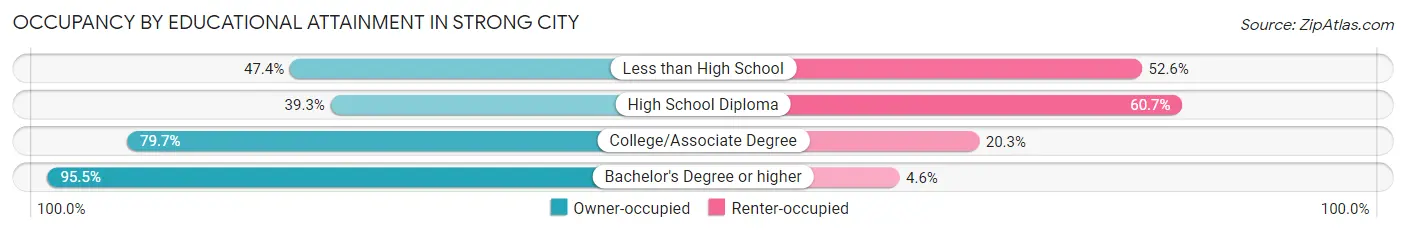
| Household Size | Owner-occupied | Renter-occupied |
| Less than High School | 9 (47.4%) | 10 (52.6%) |
| High School Diploma | 46 (39.3%) | 71 (60.7%) |
| College/Associate Degree | 47 (79.7%) | 12 (20.3%) |
| Bachelor's Degree or higher | 21 (95.5%) | 1 (4.5%) |
Occupancy by Age of Householder in Strong City
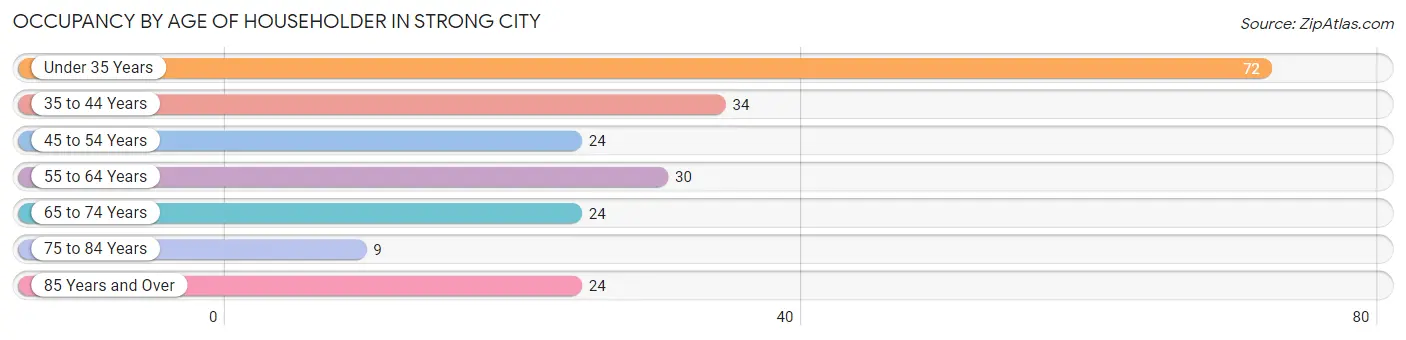
| Age Bracket | # Households | % Households |
| Under 35 Years | 72 | 33.2% |
| 35 to 44 Years | 34 | 15.7% |
| 45 to 54 Years | 24 | 11.1% |
| 55 to 64 Years | 30 | 13.8% |
| 65 to 74 Years | 24 | 11.1% |
| 75 to 84 Years | 9 | 4.2% |
| 85 Years and Over | 24 | 11.1% |
| Total | 217 | 100.0% |
Housing Finances in Strong City
Median Income by Occupancy in Strong City
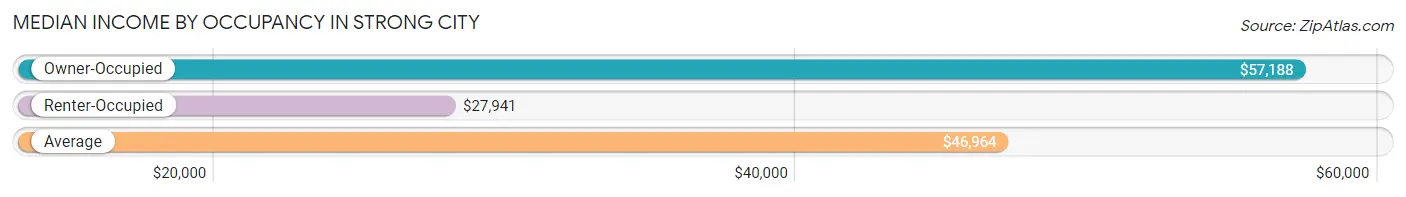
| Occupancy Type | # Households | Median Income |
| Owner-Occupied | 123 (56.7%) | $57,188 |
| Renter-Occupied | 94 (43.3%) | $27,941 |
| Average | 217 (100.0%) | $46,964 |
Occupancy by Householder Income Bracket in Strong City
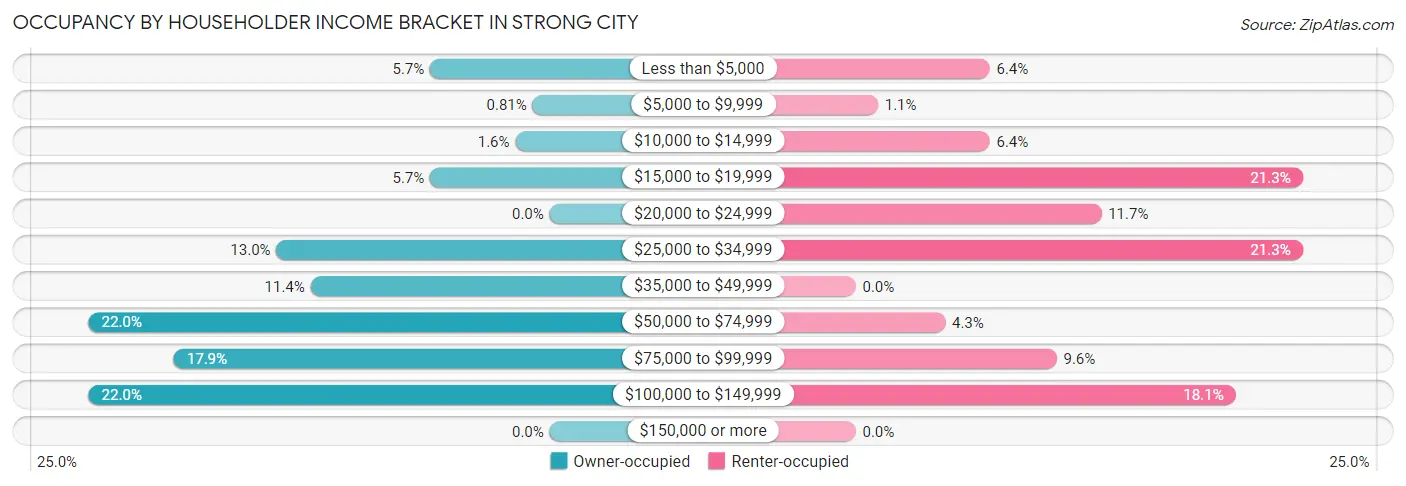
| Income Bracket | Owner-occupied | Renter-occupied |
| Less than $5,000 | 7 (5.7%) | 6 (6.4%) |
| $5,000 to $9,999 | 1 (0.8%) | 1 (1.1%) |
| $10,000 to $14,999 | 2 (1.6%) | 6 (6.4%) |
| $15,000 to $19,999 | 7 (5.7%) | 20 (21.3%) |
| $20,000 to $24,999 | 0 (0.0%) | 11 (11.7%) |
| $25,000 to $34,999 | 16 (13.0%) | 20 (21.3%) |
| $35,000 to $49,999 | 14 (11.4%) | 0 (0.0%) |
| $50,000 to $74,999 | 27 (22.0%) | 4 (4.3%) |
| $75,000 to $99,999 | 22 (17.9%) | 9 (9.6%) |
| $100,000 to $149,999 | 27 (22.0%) | 17 (18.1%) |
| $150,000 or more | 0 (0.0%) | 0 (0.0%) |
| Total | 123 (100.0%) | 94 (100.0%) |
Monthly Housing Cost Tiers in Strong City
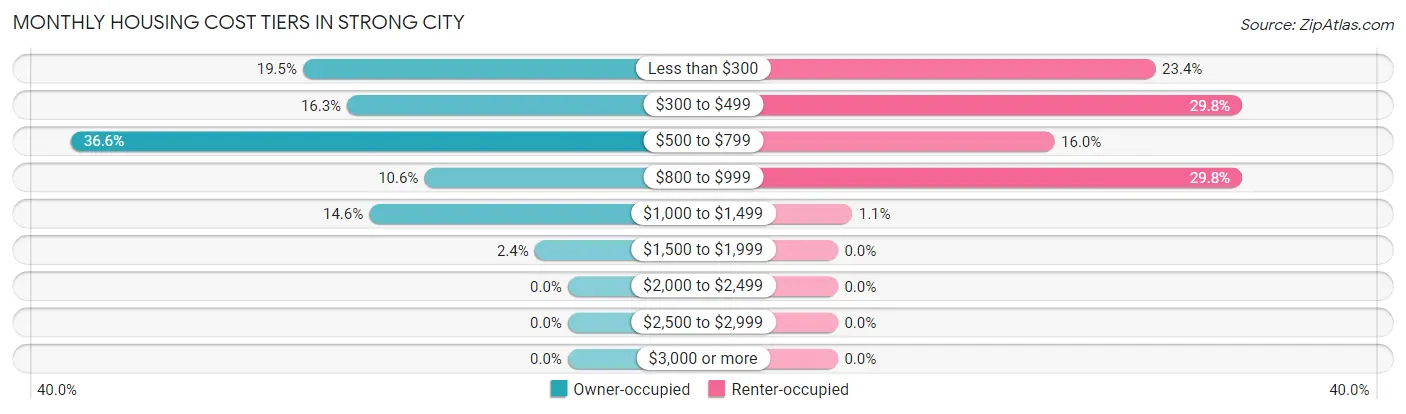
| Monthly Cost | Owner-occupied | Renter-occupied |
| Less than $300 | 24 (19.5%) | 22 (23.4%) |
| $300 to $499 | 20 (16.3%) | 28 (29.8%) |
| $500 to $799 | 45 (36.6%) | 15 (16.0%) |
| $800 to $999 | 13 (10.6%) | 28 (29.8%) |
| $1,000 to $1,499 | 18 (14.6%) | 1 (1.1%) |
| $1,500 to $1,999 | 3 (2.4%) | 0 (0.0%) |
| $2,000 to $2,499 | 0 (0.0%) | 0 (0.0%) |
| $2,500 to $2,999 | 0 (0.0%) | 0 (0.0%) |
| $3,000 or more | 0 (0.0%) | 0 (0.0%) |
| Total | 123 (100.0%) | 94 (100.0%) |
Physical Housing Characteristics in Strong City
Housing Structures in Strong City
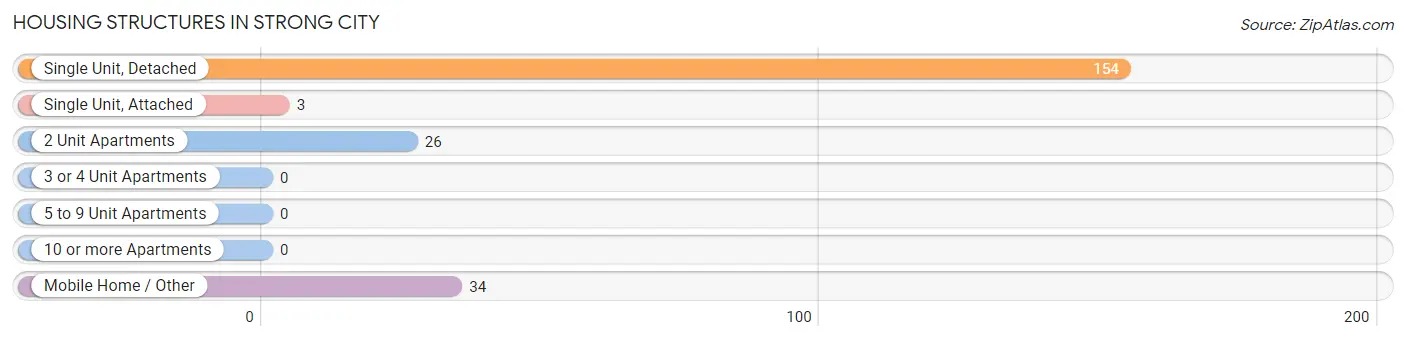
| Structure Type | # Housing Units | % Housing Units |
| Single Unit, Detached | 154 | 71.0% |
| Single Unit, Attached | 3 | 1.4% |
| 2 Unit Apartments | 26 | 12.0% |
| 3 or 4 Unit Apartments | 0 | 0.0% |
| 5 to 9 Unit Apartments | 0 | 0.0% |
| 10 or more Apartments | 0 | 0.0% |
| Mobile Home / Other | 34 | 15.7% |
| Total | 217 | 100.0% |
Housing Structures by Occupancy in Strong City
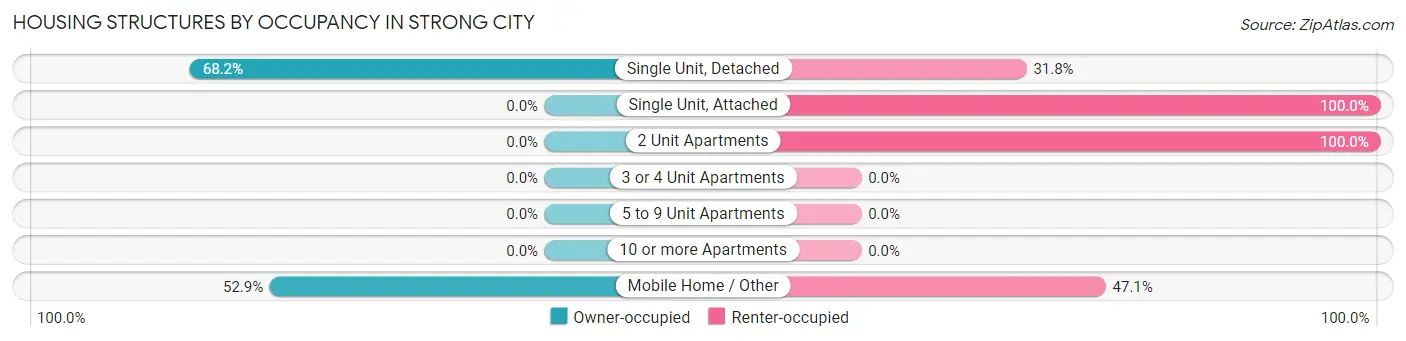
| Structure Type | Owner-occupied | Renter-occupied |
| Single Unit, Detached | 105 (68.2%) | 49 (31.8%) |
| Single Unit, Attached | 0 (0.0%) | 3 (100.0%) |
| 2 Unit Apartments | 0 (0.0%) | 26 (100.0%) |
| 3 or 4 Unit Apartments | 0 (0.0%) | 0 (0.0%) |
| 5 to 9 Unit Apartments | 0 (0.0%) | 0 (0.0%) |
| 10 or more Apartments | 0 (0.0%) | 0 (0.0%) |
| Mobile Home / Other | 18 (52.9%) | 16 (47.1%) |
| Total | 123 (56.7%) | 94 (43.3%) |
Housing Structures by Number of Rooms in Strong City
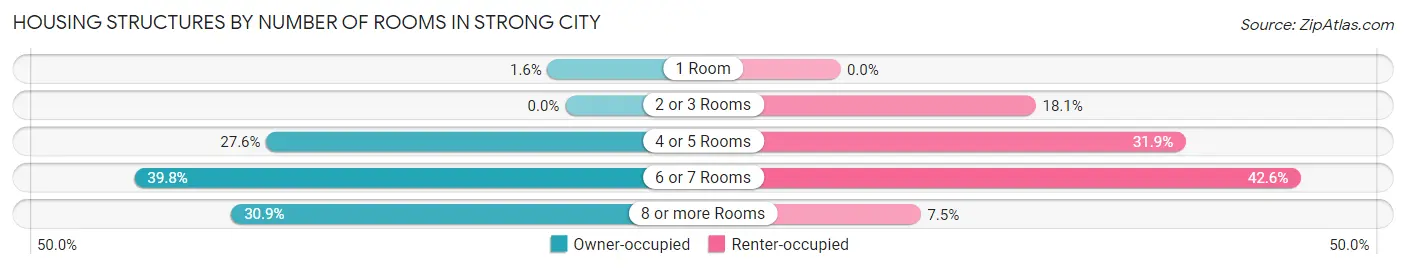
| Number of Rooms | Owner-occupied | Renter-occupied |
| 1 Room | 2 (1.6%) | 0 (0.0%) |
| 2 or 3 Rooms | 0 (0.0%) | 17 (18.1%) |
| 4 or 5 Rooms | 34 (27.6%) | 30 (31.9%) |
| 6 or 7 Rooms | 49 (39.8%) | 40 (42.5%) |
| 8 or more Rooms | 38 (30.9%) | 7 (7.4%) |
| Total | 123 (100.0%) | 94 (100.0%) |
Housing Structure by Heating Type in Strong City
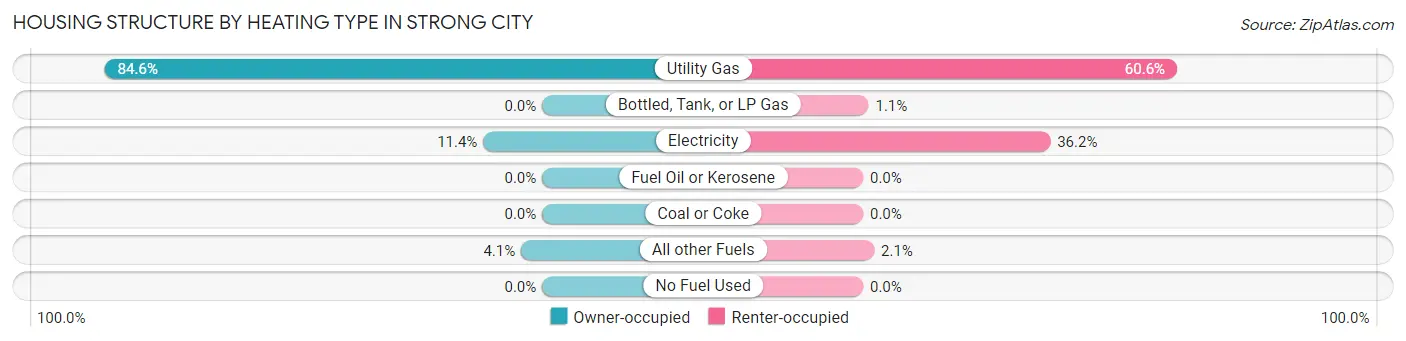
| Heating Type | Owner-occupied | Renter-occupied |
| Utility Gas | 104 (84.6%) | 57 (60.6%) |
| Bottled, Tank, or LP Gas | 0 (0.0%) | 1 (1.1%) |
| Electricity | 14 (11.4%) | 34 (36.2%) |
| Fuel Oil or Kerosene | 0 (0.0%) | 0 (0.0%) |
| Coal or Coke | 0 (0.0%) | 0 (0.0%) |
| All other Fuels | 5 (4.1%) | 2 (2.1%) |
| No Fuel Used | 0 (0.0%) | 0 (0.0%) |
| Total | 123 (100.0%) | 94 (100.0%) |
Household Vehicle Usage in Strong City
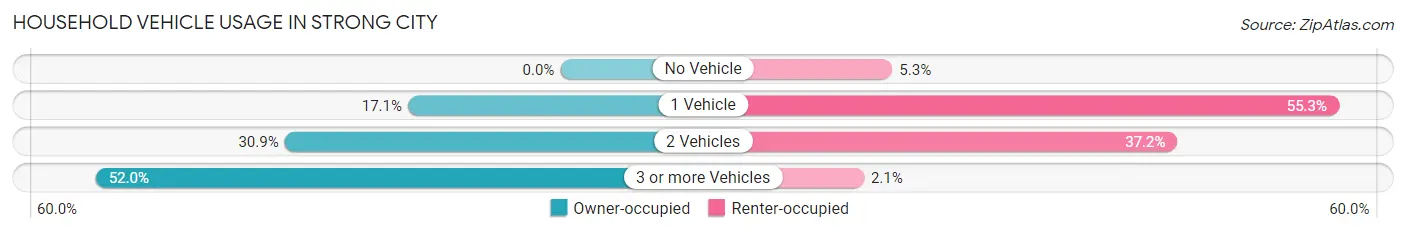
| Vehicles per Household | Owner-occupied | Renter-occupied |
| No Vehicle | 0 (0.0%) | 5 (5.3%) |
| 1 Vehicle | 21 (17.1%) | 52 (55.3%) |
| 2 Vehicles | 38 (30.9%) | 35 (37.2%) |
| 3 or more Vehicles | 64 (52.0%) | 2 (2.1%) |
| Total | 123 (100.0%) | 94 (100.0%) |
Real Estate & Mortgages in Strong City
Real Estate and Mortgage Overview in Strong City
| Characteristic | Without Mortgage | With Mortgage |
| Housing Units | 86 | 37 |
| Median Property Value | $72,900 | $115,200 |
| Median Household Income | $53,125 | $0 |
| Monthly Housing Costs | $480 | $0 |
| Real Estate Taxes | $1,211 | $0 |
Property Value by Mortgage Status in Strong City
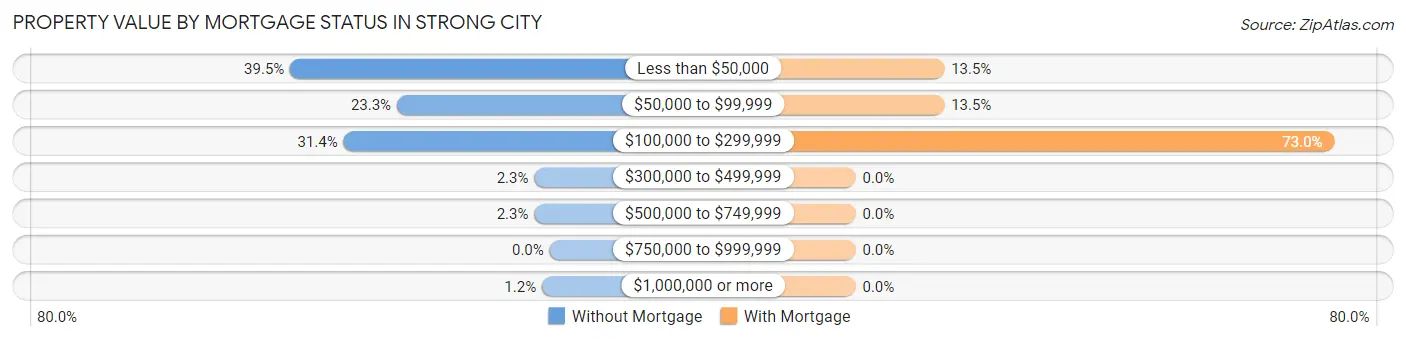
| Property Value | Without Mortgage | With Mortgage |
| Less than $50,000 | 34 (39.5%) | 5 (13.5%) |
| $50,000 to $99,999 | 20 (23.3%) | 5 (13.5%) |
| $100,000 to $299,999 | 27 (31.4%) | 27 (73.0%) |
| $300,000 to $499,999 | 2 (2.3%) | 0 (0.0%) |
| $500,000 to $749,999 | 2 (2.3%) | 0 (0.0%) |
| $750,000 to $999,999 | 0 (0.0%) | 0 (0.0%) |
| $1,000,000 or more | 1 (1.2%) | 0 (0.0%) |
| Total | 86 (100.0%) | 37 (100.0%) |
Household Income by Mortgage Status in Strong City
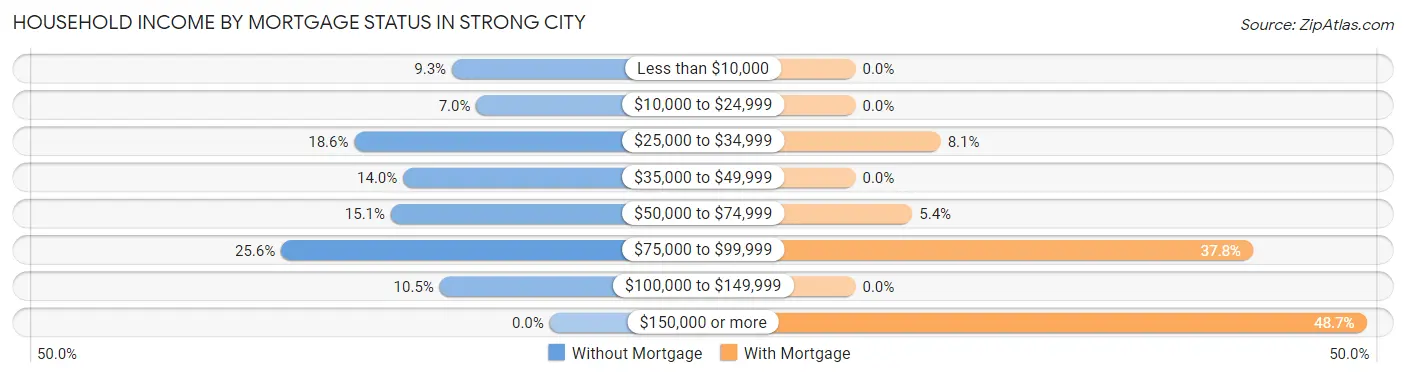
| Household Income | Without Mortgage | With Mortgage |
| Less than $10,000 | 8 (9.3%) | 0 (0.0%) |
| $10,000 to $24,999 | 6 (7.0%) | 0 (0.0%) |
| $25,000 to $34,999 | 16 (18.6%) | 3 (8.1%) |
| $35,000 to $49,999 | 12 (14.0%) | 0 (0.0%) |
| $50,000 to $74,999 | 13 (15.1%) | 2 (5.4%) |
| $75,000 to $99,999 | 22 (25.6%) | 14 (37.8%) |
| $100,000 to $149,999 | 9 (10.5%) | 0 (0.0%) |
| $150,000 or more | 0 (0.0%) | 18 (48.6%) |
| Total | 86 (100.0%) | 37 (100.0%) |
Property Value to Household Income Ratio in Strong City
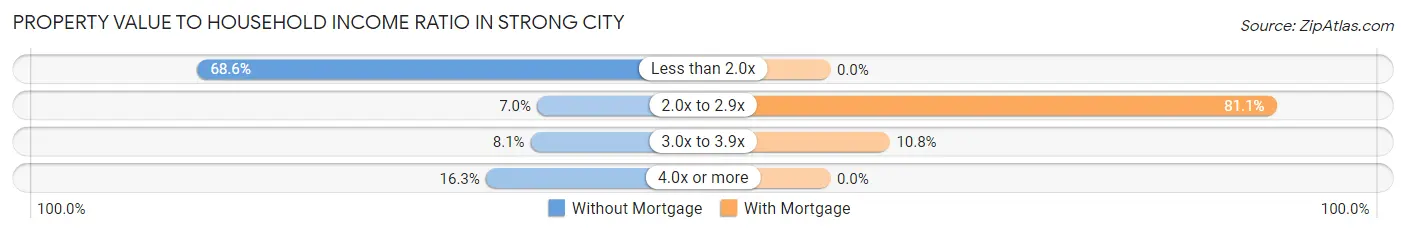
| Value-to-Income Ratio | Without Mortgage | With Mortgage |
| Less than 2.0x | 59 (68.6%) | 0 (0.0%) |
| 2.0x to 2.9x | 6 (7.0%) | 30 (81.1%) |
| 3.0x to 3.9x | 7 (8.1%) | 4 (10.8%) |
| 4.0x or more | 14 (16.3%) | 0 (0.0%) |
| Total | 86 (100.0%) | 37 (100.0%) |
Real Estate Taxes by Mortgage Status in Strong City
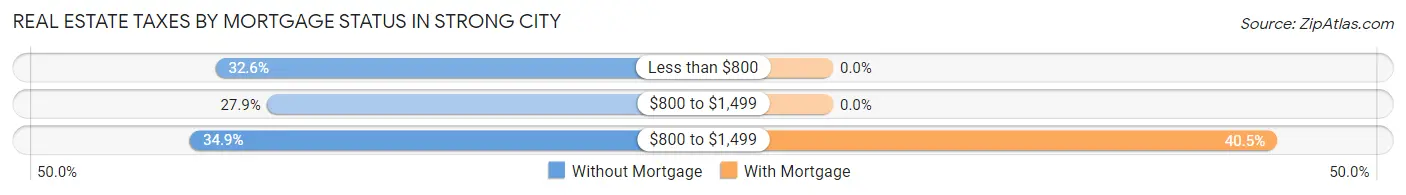
| Property Taxes | Without Mortgage | With Mortgage |
| Less than $800 | 28 (32.6%) | 0 (0.0%) |
| $800 to $1,499 | 24 (27.9%) | 0 (0.0%) |
| $800 to $1,499 | 30 (34.9%) | 15 (40.5%) |
| Total | 86 (100.0%) | 37 (100.0%) |
Health & Disability in Strong City
Health Insurance Coverage by Age in Strong City
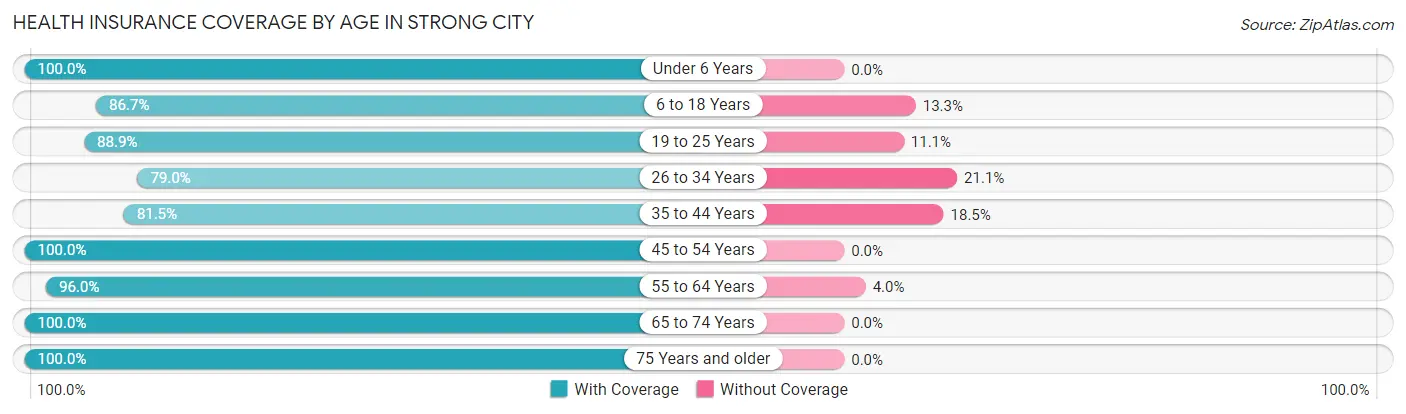
| Age Bracket | With Coverage | Without Coverage |
| Under 6 Years | 33 (100.0%) | 0 (0.0%) |
| 6 to 18 Years | 52 (86.7%) | 8 (13.3%) |
| 19 to 25 Years | 40 (88.9%) | 5 (11.1%) |
| 26 to 34 Years | 60 (78.9%) | 16 (21.0%) |
| 35 to 44 Years | 66 (81.5%) | 15 (18.5%) |
| 45 to 54 Years | 44 (100.0%) | 0 (0.0%) |
| 55 to 64 Years | 48 (96.0%) | 2 (4.0%) |
| 65 to 74 Years | 43 (100.0%) | 0 (0.0%) |
| 75 Years and older | 33 (100.0%) | 0 (0.0%) |
| Total | 419 (90.1%) | 46 (9.9%) |
Health Insurance Coverage by Citizenship Status in Strong City
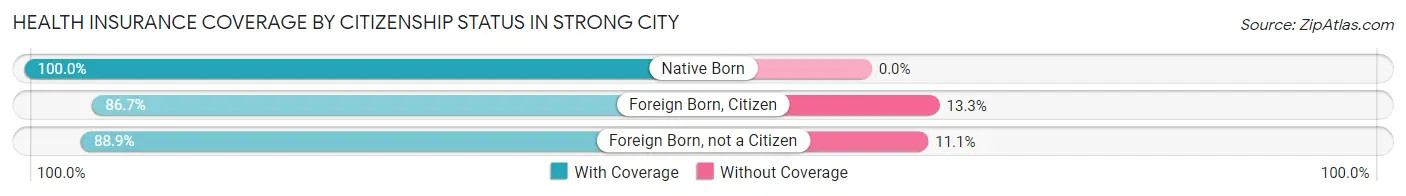
| Citizenship Status | With Coverage | Without Coverage |
| Native Born | 33 (100.0%) | 0 (0.0%) |
| Foreign Born, Citizen | 52 (86.7%) | 8 (13.3%) |
| Foreign Born, not a Citizen | 40 (88.9%) | 5 (11.1%) |
Health Insurance Coverage by Household Income in Strong City
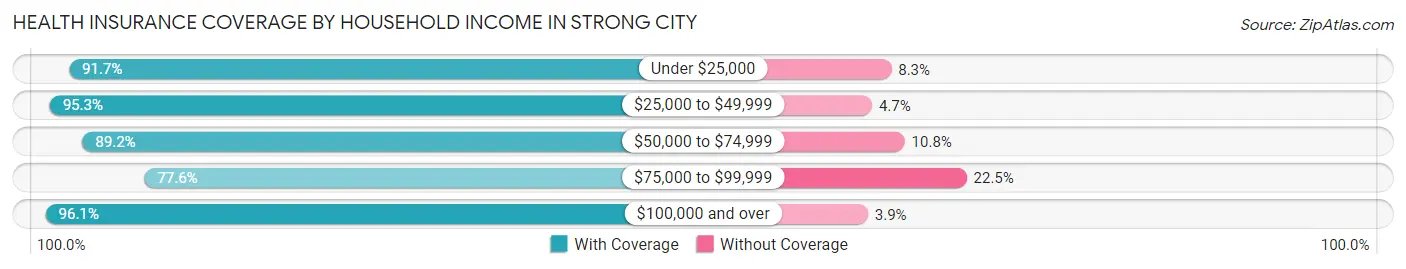
| Household Income | With Coverage | Without Coverage |
| Under $25,000 | 66 (91.7%) | 6 (8.3%) |
| $25,000 to $49,999 | 81 (95.3%) | 4 (4.7%) |
| $50,000 to $74,999 | 74 (89.2%) | 9 (10.8%) |
| $75,000 to $99,999 | 76 (77.5%) | 22 (22.5%) |
| $100,000 and over | 122 (96.1%) | 5 (3.9%) |
Public vs Private Health Insurance Coverage by Age in Strong City
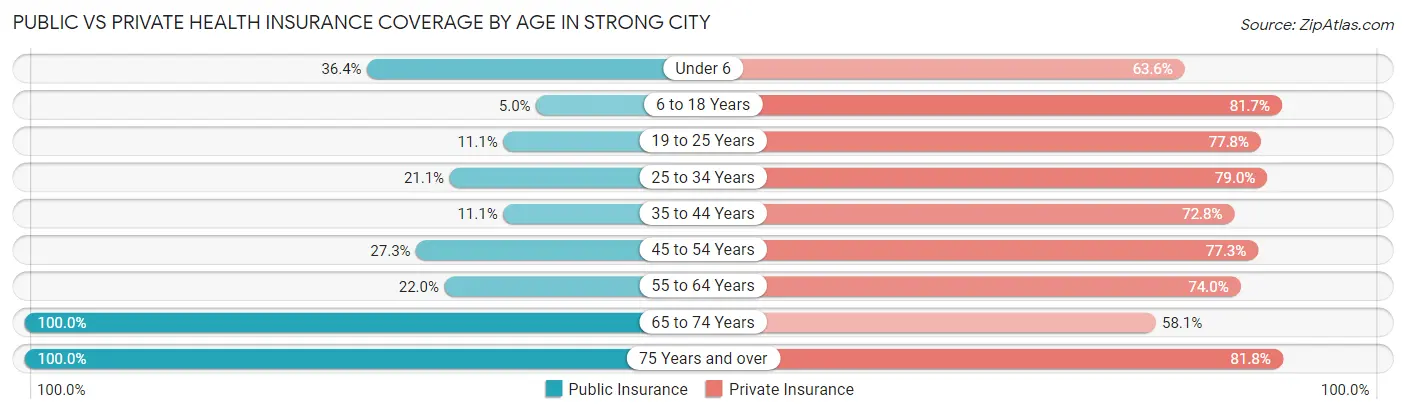
| Age Bracket | Public Insurance | Private Insurance |
| Under 6 | 12 (36.4%) | 21 (63.6%) |
| 6 to 18 Years | 3 (5.0%) | 49 (81.7%) |
| 19 to 25 Years | 5 (11.1%) | 35 (77.8%) |
| 25 to 34 Years | 16 (21.0%) | 60 (78.9%) |
| 35 to 44 Years | 9 (11.1%) | 59 (72.8%) |
| 45 to 54 Years | 12 (27.3%) | 34 (77.3%) |
| 55 to 64 Years | 11 (22.0%) | 37 (74.0%) |
| 65 to 74 Years | 43 (100.0%) | 25 (58.1%) |
| 75 Years and over | 33 (100.0%) | 27 (81.8%) |
| Total | 144 (31.0%) | 347 (74.6%) |
Disability Status by Sex by Age in Strong City
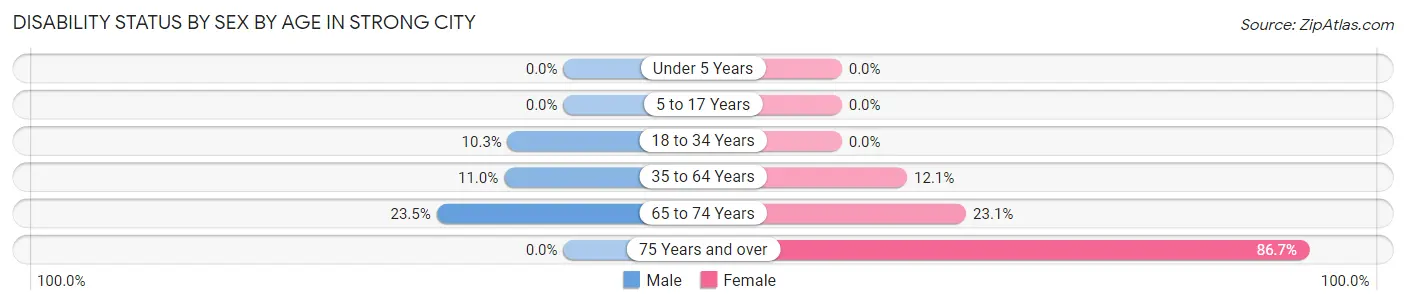
| Age Bracket | Male | Female |
| Under 5 Years | 0 (0.0%) | 0 (0.0%) |
| 5 to 17 Years | 0 (0.0%) | 0 (0.0%) |
| 18 to 34 Years | 9 (10.3%) | 0 (0.0%) |
| 35 to 64 Years | 12 (11.0%) | 8 (12.1%) |
| 65 to 74 Years | 4 (23.5%) | 6 (23.1%) |
| 75 Years and over | 0 (0.0%) | 26 (86.7%) |
Disability Class by Sex by Age in Strong City
Disability Class: Hearing Difficulty
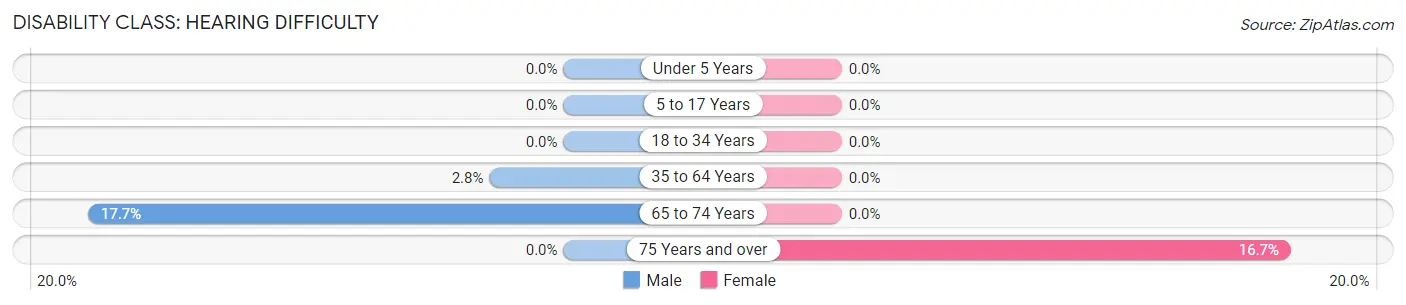
| Age Bracket | Male | Female |
| Under 5 Years | 0 (0.0%) | 0 (0.0%) |
| 5 to 17 Years | 0 (0.0%) | 0 (0.0%) |
| 18 to 34 Years | 0 (0.0%) | 0 (0.0%) |
| 35 to 64 Years | 3 (2.8%) | 0 (0.0%) |
| 65 to 74 Years | 3 (17.6%) | 0 (0.0%) |
| 75 Years and over | 0 (0.0%) | 5 (16.7%) |
Disability Class: Vision Difficulty
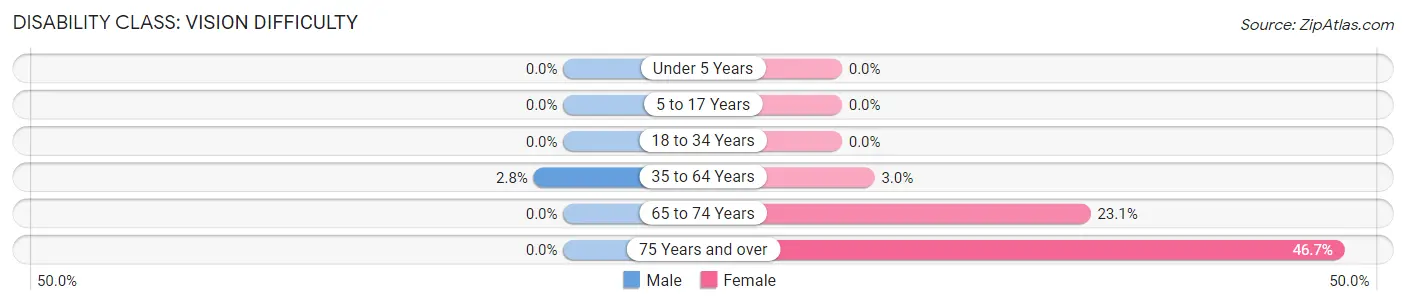
| Age Bracket | Male | Female |
| Under 5 Years | 0 (0.0%) | 0 (0.0%) |
| 5 to 17 Years | 0 (0.0%) | 0 (0.0%) |
| 18 to 34 Years | 0 (0.0%) | 0 (0.0%) |
| 35 to 64 Years | 3 (2.8%) | 2 (3.0%) |
| 65 to 74 Years | 0 (0.0%) | 6 (23.1%) |
| 75 Years and over | 0 (0.0%) | 14 (46.7%) |
Disability Class: Cognitive Difficulty
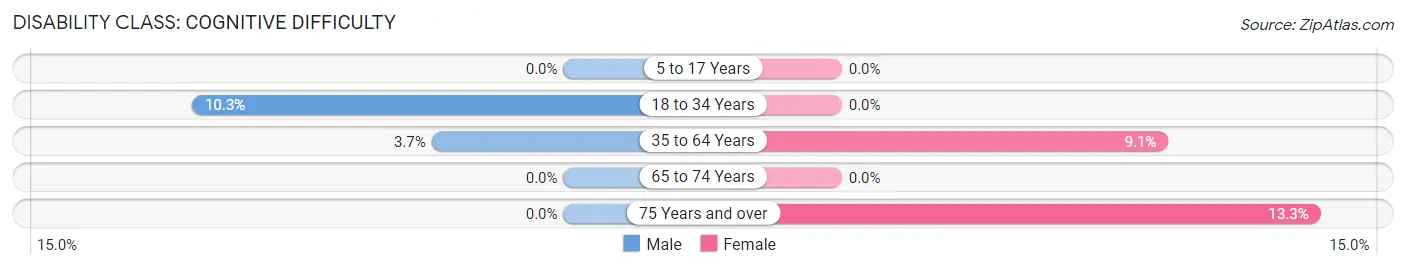
| Age Bracket | Male | Female |
| 5 to 17 Years | 0 (0.0%) | 0 (0.0%) |
| 18 to 34 Years | 9 (10.3%) | 0 (0.0%) |
| 35 to 64 Years | 4 (3.7%) | 6 (9.1%) |
| 65 to 74 Years | 0 (0.0%) | 0 (0.0%) |
| 75 Years and over | 0 (0.0%) | 4 (13.3%) |
Disability Class: Ambulatory Difficulty
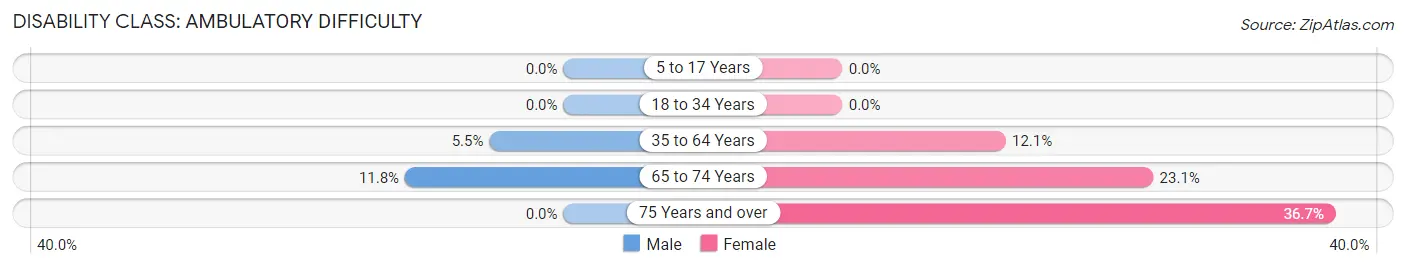
| Age Bracket | Male | Female |
| 5 to 17 Years | 0 (0.0%) | 0 (0.0%) |
| 18 to 34 Years | 0 (0.0%) | 0 (0.0%) |
| 35 to 64 Years | 6 (5.5%) | 8 (12.1%) |
| 65 to 74 Years | 2 (11.8%) | 6 (23.1%) |
| 75 Years and over | 0 (0.0%) | 11 (36.7%) |
Disability Class: Self-Care Difficulty
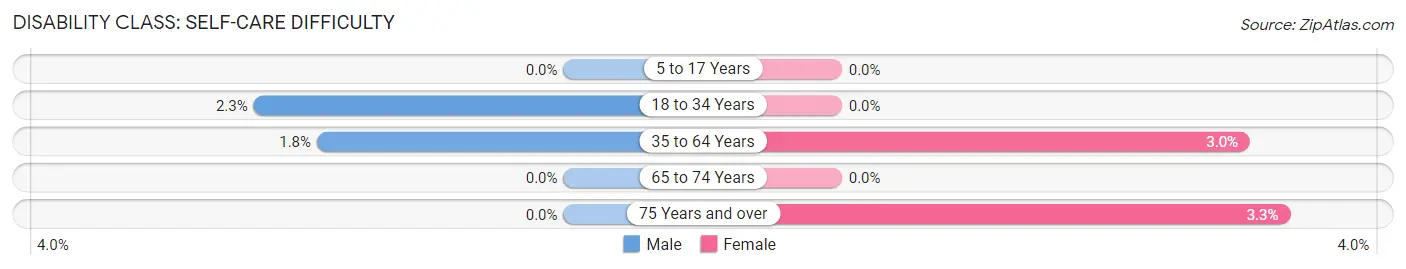
| Age Bracket | Male | Female |
| 5 to 17 Years | 0 (0.0%) | 0 (0.0%) |
| 18 to 34 Years | 2 (2.3%) | 0 (0.0%) |
| 35 to 64 Years | 2 (1.8%) | 2 (3.0%) |
| 65 to 74 Years | 0 (0.0%) | 0 (0.0%) |
| 75 Years and over | 0 (0.0%) | 1 (3.3%) |
Technology Access in Strong City
Computing Device Access in Strong City
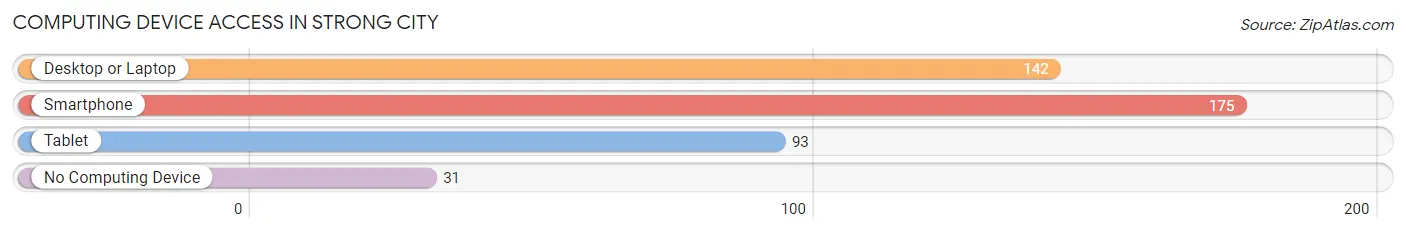
| Device Type | # Households | % Households |
| Desktop or Laptop | 142 | 65.4% |
| Smartphone | 175 | 80.6% |
| Tablet | 93 | 42.9% |
| No Computing Device | 31 | 14.3% |
| Total | 217 | 100.0% |
Internet Access in Strong City
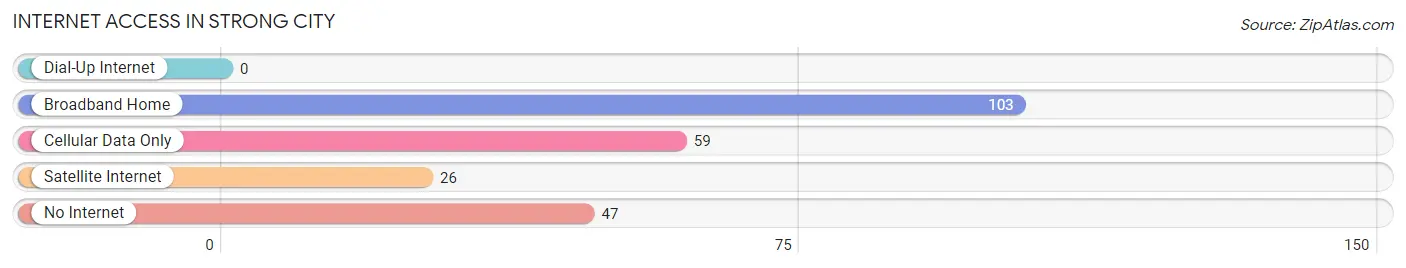
| Internet Type | # Households | % Households |
| Dial-Up Internet | 0 | 0.0% |
| Broadband Home | 103 | 47.5% |
| Cellular Data Only | 59 | 27.2% |
| Satellite Internet | 26 | 12.0% |
| No Internet | 47 | 21.7% |
| Total | 217 | 100.0% |
Strong City Summary
City of Strong City Kansas
Strong City, Kansas is a small city located in the Flint Hills region of the state. It is the county seat of Chase County and is located in the center of the county. The city is situated on the banks of the Cottonwood River and is surrounded by rolling hills and prairies. The city has a population of approximately 1,000 people and is the only incorporated city in the county.
History
The area that is now Strong City was first settled in the late 1860s by settlers from the east. The first settlers were mostly farmers and ranchers who were attracted to the area by the fertile soil and abundant water. The town was originally called Cottonwood City, but was later changed to Strong City in 1872. The name was chosen to honor the strength of the settlers who had come to the area.
The town was officially incorporated in 1873 and quickly grew to become the largest town in the county. The town was a major stop on the Santa Fe Trail and was a popular destination for travelers. The town also became a major center for the cattle industry in the area.
In the early 1900s, the town began to decline as the cattle industry moved away from the area. The town was also hit hard by the Great Depression and many of the businesses in the town closed. The town was able to survive, however, and in the 1950s the town began to experience a resurgence. The town was able to attract new businesses and industries and the population began to grow again.
Geography
Strong City is located in the Flint Hills region of Kansas. The city is situated on the banks of the Cottonwood River and is surrounded by rolling hills and prairies. The city is located in the center of Chase County and is the only incorporated city in the county. The city is located approximately 50 miles south of Topeka and approximately 100 miles west of Kansas City.
The climate in Strong City is typical of the Midwest. Summers are hot and humid with temperatures reaching into the 90s. Winters are cold and snowy with temperatures often dropping below freezing. The average annual precipitation is approximately 30 inches.
Economy
The economy of Strong City is largely based on agriculture. The area is known for its cattle and sheep production and is also home to several large grain farms. The city is also home to several small businesses, including a few restaurants, a grocery store, and a few retail stores.
The city is also home to a few manufacturing companies, including a furniture factory and a plastics factory. The city is also home to a few small technology companies.
Demographics
As of the 2010 census, the population of Strong City was 1,000 people. The racial makeup of the city was 95.2% White, 0.7% African American, 0.3% Native American, 0.2% Asian, 0.1% Pacific Islander, and 3.5% from other races. The median household income was $37,500 and the median family income was $45,000. The per capita income was $19,000.
Conclusion
Strong City, Kansas is a small city located in the Flint Hills region of the state. It is the county seat of Chase County and is the only incorporated city in the county. The city has a population of approximately 1,000 people and is largely based on agriculture. The city is also home to several small businesses and manufacturing companies. The city has a diverse population and a median household income of $37,500.
Common Questions
What is Per Capita Income in Strong City?
Per Capita income in Strong City is $29,165.
What is the Median Family Income in Strong City?
Median Family Income in Strong City is $77,375.
What is the Median Household income in Strong City?
Median Household Income in Strong City is $46,964.
What is Income or Wage Gap in Strong City?
Income or Wage Gap in Strong City is 18.0%.
Women in Strong City earn 82.0 cents for every dollar earned by a man.
What is Inequality or Gini Index in Strong City?
Inequality or Gini Index in Strong City is 0.40.
What is the Total Population of Strong City?
Total Population of Strong City is 465.
What is the Total Male Population of Strong City?
Total Male Population of Strong City is 254.
What is the Total Female Population of Strong City?
Total Female Population of Strong City is 211.
What is the Ratio of Males per 100 Females in Strong City?
There are 120.38 Males per 100 Females in Strong City.
What is the Ratio of Females per 100 Males in Strong City?
There are 83.07 Females per 100 Males in Strong City.
What is the Median Population Age in Strong City?
Median Population Age in Strong City is 39.1 Years.
What is the Average Family Size in Strong City
Average Family Size in Strong City is 3.1 People.
What is the Average Household Size in Strong City
Average Household Size in Strong City is 2.1 People.
How Large is the Labor Force in Strong City?
There are 255 People in the Labor Forcein in Strong City.
What is the Percentage of People in the Labor Force in Strong City?
68.2% of People are in the Labor Force in Strong City.
What is the Unemployment Rate in Strong City?
Unemployment Rate in Strong City is 1.2%.