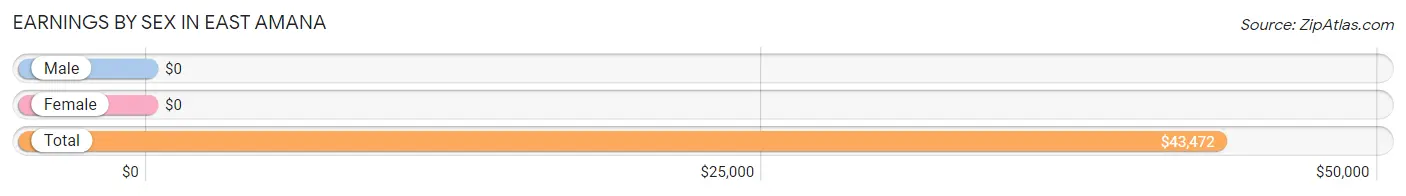
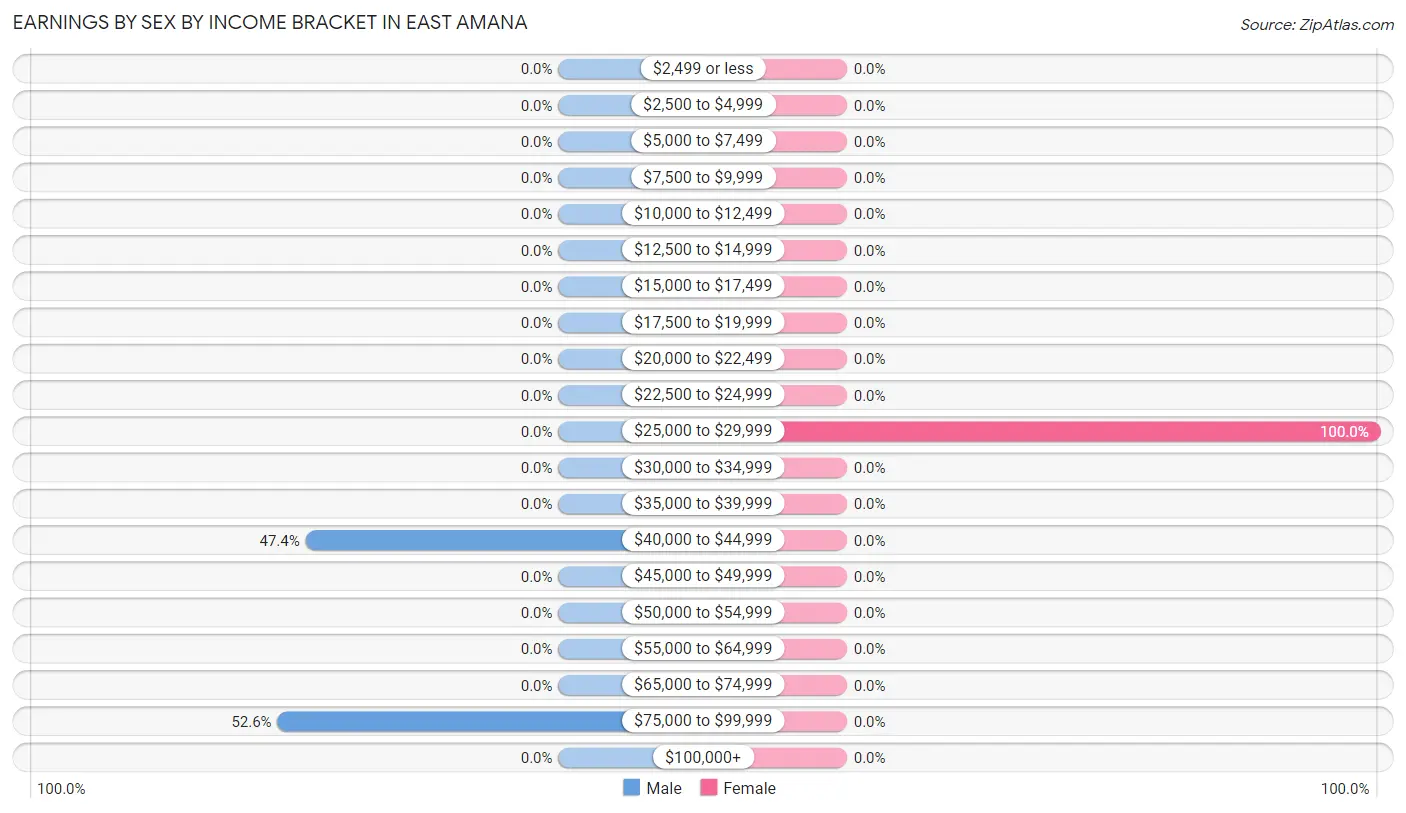
The most common earnings brackets in East Amana are $75,000 to $99,999 for men (10 | 52.6%) and $25,000 to $29,999 for women (12 | 100.0%).
Income
Male
Female
$2,499 or less
0 (0.0%)
0 (0.0%)
$2,500 to $4,999
0 (0.0%)
0 (0.0%)
$5,000 to $7,499
0 (0.0%)
0 (0.0%)
$7,500 to $9,999
0 (0.0%)
0 (0.0%)
$10,000 to $12,499
0 (0.0%)
0 (0.0%)
$12,500 to $14,999
0 (0.0%)
0 (0.0%)
$15,000 to $17,499
0 (0.0%)
0 (0.0%)
$17,500 to $19,999
0 (0.0%)
0 (0.0%)
$20,000 to $22,499
0 (0.0%)
0 (0.0%)
$22,500 to $24,999
0 (0.0%)
0 (0.0%)
$25,000 to $29,999
0 (0.0%)
12 (100.0%)
$30,000 to $34,999
0 (0.0%)
0 (0.0%)
$35,000 to $39,999
0 (0.0%)
0 (0.0%)
$40,000 to $44,999
9 (47.4%)
0 (0.0%)
$45,000 to $49,999
0 (0.0%)
0 (0.0%)
$50,000 to $54,999
0 (0.0%)
0 (0.0%)
$55,000 to $64,999
0 (0.0%)
0 (0.0%)
$65,000 to $74,999
0 (0.0%)
0 (0.0%)
$75,000 to $99,999
10 (52.6%)
0 (0.0%)
$100,000+
0 (0.0%)
0 (0.0%)
Total
19 (100.0%)
12 (100.0%)
Earnings by Sex by Educational Attainment in East Amana
Educational Attainment
Male Income
Female Income
Less than High School
-
-
High School Diploma
-
-
College or Associate's Degree
-
-
Bachelor's Degree
-
-
Graduate Degree
-
-
Total
-
-
Family Income in East Amana
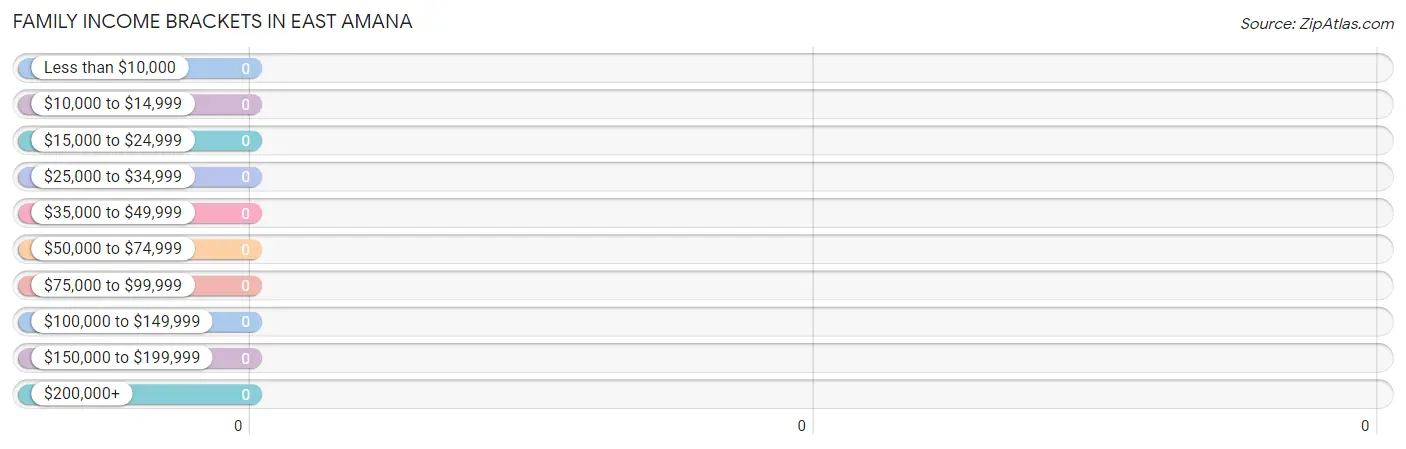
Family Income Brackets in East Amana
Income Bracket
# Families
% Families
Less than $10,000
0
0.0%
$10,000 to $14,999
0
0.0%
$15,000 to $24,999
0
0.0%
$25,000 to $34,999
0
0.0%
$35,000 to $49,999
0
0.0%
$50,000 to $74,999
0
0.0%
$75,000 to $99,999
0
0.0%
$100,000 to $149,999
0
0.0%
$150,000 to $199,999
0
0.0%
$200,000+
0
0.0%
Family Income by Famaliy Size in East Amana
Income Bracket
# Families
Median Income
2-Person Families
0 (0.0%)
$0
3-Person Families
0 (0.0%)
$0
4-Person Families
0 (0.0%)
$0
5-Person Families
0 (0.0%)
$0
6-Person Families
0 (0.0%)
$0
7+ Person Families
0 (0.0%)
$0
Total
0 (0.0%)
$0
Family Income by Number of Earners in East Amana
Number of Earners
# Families
Median Income
No Earners
0 (0.0%)
$0
1 Earner
0 (0.0%)
$0
2 Earners
0 (0.0%)
$0
3+ Earners
0 (0.0%)
$0
Total
0 (0.0%)
$0
Household Income in East Amana
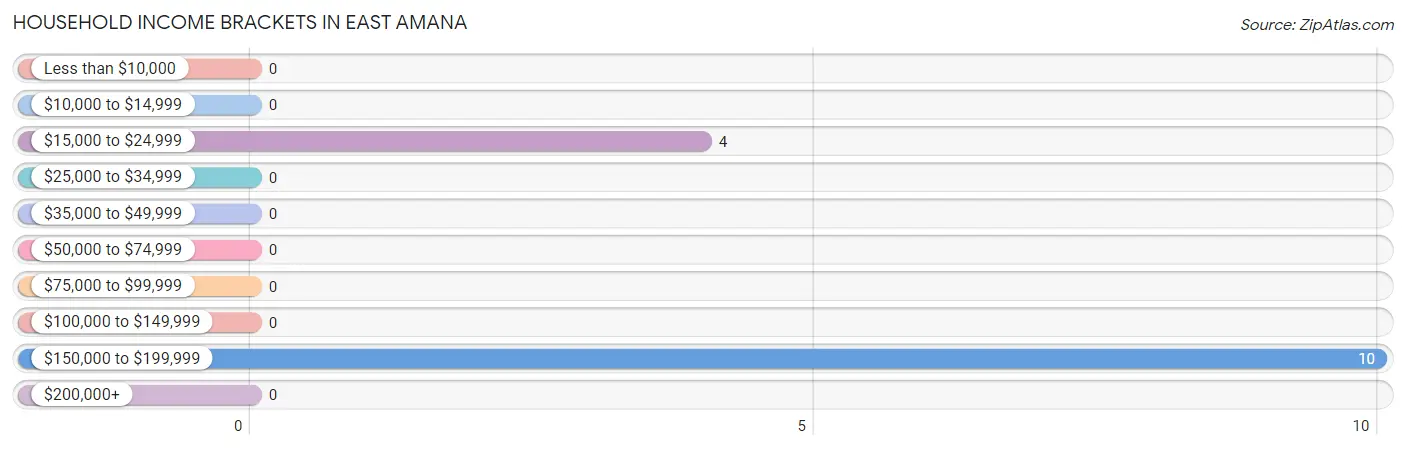
Household Income Brackets in East Amana
With 10 households falling in the category, the $150,000 to $199,999 income range is the most frequent in East Amana, accounting for 71.4% of all households.
Income Bracket
# Households
% Households
Less than $10,000
0
0.0%
$10,000 to $14,999
0
0.0%
$15,000 to $24,999
4
28.6%
$25,000 to $34,999
0
0.0%
$35,000 to $49,999
0
0.0%
$50,000 to $74,999
0
0.0%
$75,000 to $99,999
0
0.0%
$100,000 to $149,999
0
0.0%
$150,000 to $199,999
10
71.4%
$200,000+
0
0.0%
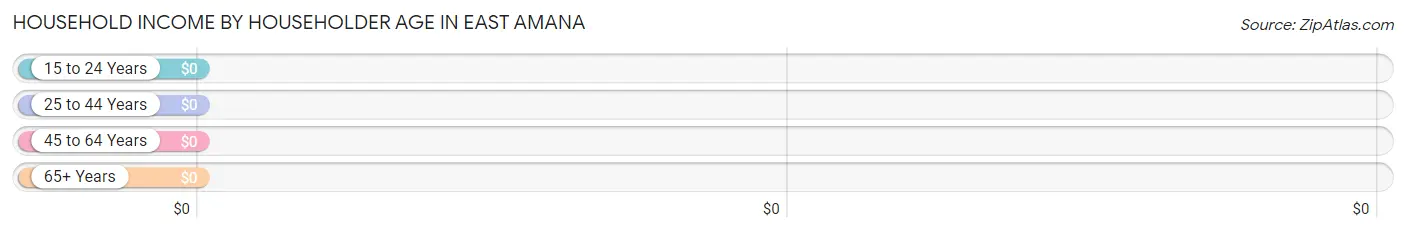
Household Income by Householder Age in East Amana
Income Bracket
# Households
Median Income
15 to 24 Years
0 (0.0%)
$0
25 to 44 Years
10 (71.4%)
$0
45 to 64 Years
0 (0.0%)
$0
65+ Years
4 (28.6%)
$0
Total
14 (100.0%)
$0
Poverty in East Amana
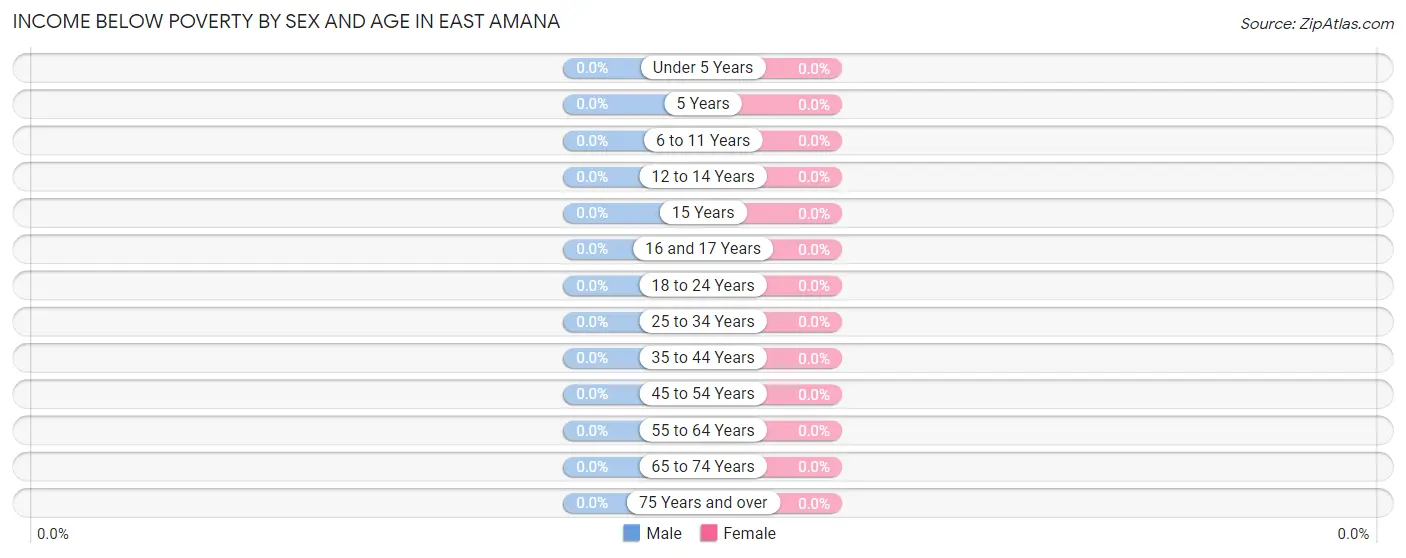
Income Below Poverty by Sex and Age in East Amana
Age Bracket
Male
Female
Under 5 Years
0 (0.0%)
0 (0.0%)
5 Years
0 (0.0%)
0 (0.0%)
6 to 11 Years
0 (0.0%)
0 (0.0%)
12 to 14 Years
0 (0.0%)
0 (0.0%)
15 Years
0 (0.0%)
0 (0.0%)
16 and 17 Years
0 (0.0%)
0 (0.0%)
18 to 24 Years
0 (0.0%)
0 (0.0%)
25 to 34 Years
0 (0.0%)
0 (0.0%)
35 to 44 Years
0 (0.0%)
0 (0.0%)
45 to 54 Years
0 (0.0%)
0 (0.0%)
55 to 64 Years
0 (0.0%)
0 (0.0%)
65 to 74 Years
0 (0.0%)
0 (0.0%)
75 Years and over
0 (0.0%)
0 (0.0%)
Total
0 (0.0%)
0 (0.0%)
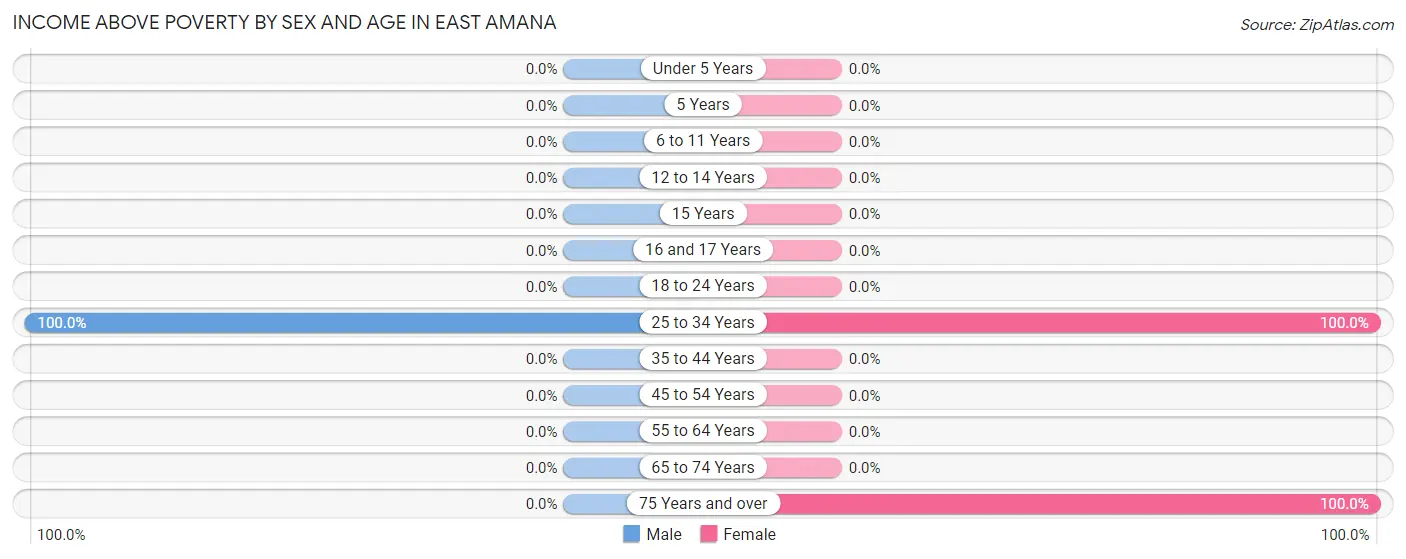
Income Above Poverty by Sex and Age in East Amana
According to the poverty statistics in East Amana, males aged 25 to 34 years and females aged 25 to 34 years are the age groups that are most secure financially, with 100.0% of males and 100.0% of females in these age groups living above the poverty line.
Age Bracket
Male
Female
Under 5 Years
0 (0.0%)
0 (0.0%)
5 Years
0 (0.0%)
0 (0.0%)
6 to 11 Years
0 (0.0%)
0 (0.0%)
12 to 14 Years
0 (0.0%)
0 (0.0%)
15 Years
0 (0.0%)
0 (0.0%)
16 and 17 Years
0 (0.0%)
0 (0.0%)
18 to 24 Years
0 (0.0%)
0 (0.0%)
25 to 34 Years
19 (100.0%)
12 (100.0%)
35 to 44 Years
0 (0.0%)
0 (0.0%)
45 to 54 Years
0 (0.0%)
0 (0.0%)
55 to 64 Years
0 (0.0%)
0 (0.0%)
65 to 74 Years
0 (0.0%)
0 (0.0%)
75 Years and over
0 (0.0%)
4 (100.0%)
Total
19 (100.0%)
16 (100.0%)
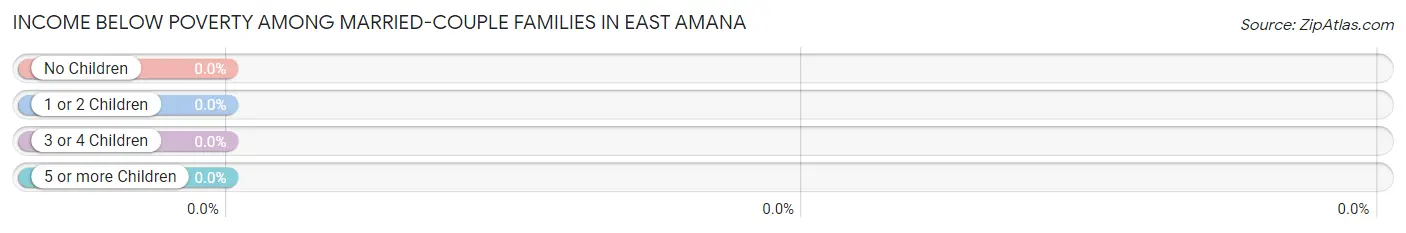
Income Below Poverty Among Married-Couple Families in East Amana
Children
Above Poverty
Below Poverty
No Children
0 (0.0%)
0 (0.0%)
1 or 2 Children
0 (0.0%)
0 (0.0%)
3 or 4 Children
0 (0.0%)
0 (0.0%)
5 or more Children
0 (0.0%)
0 (0.0%)
Total
0 (0.0%)
0 (0.0%)
Income Below Poverty Among Single-Parent Households in East Amana
Children
Single Father
Single Mother
No Children
0 (0.0%)
0 (0.0%)
1 or 2 Children
0 (0.0%)
0 (0.0%)
3 or 4 Children
0 (0.0%)
0 (0.0%)
5 or more Children
0 (0.0%)
0 (0.0%)
Total
0 (0.0%)
0 (0.0%)
Income Below Poverty Among Married-Couple vs Single-Parent Households in East Amana
Children
Married-Couple Families
Single-Parent Households
No Children
0 (0.0%)
0 (0.0%)
1 or 2 Children
0 (0.0%)
0 (0.0%)
3 or 4 Children
0 (0.0%)
0 (0.0%)
5 or more Children
0 (0.0%)
0 (0.0%)
Total
0 (0.0%)
0 (0.0%)
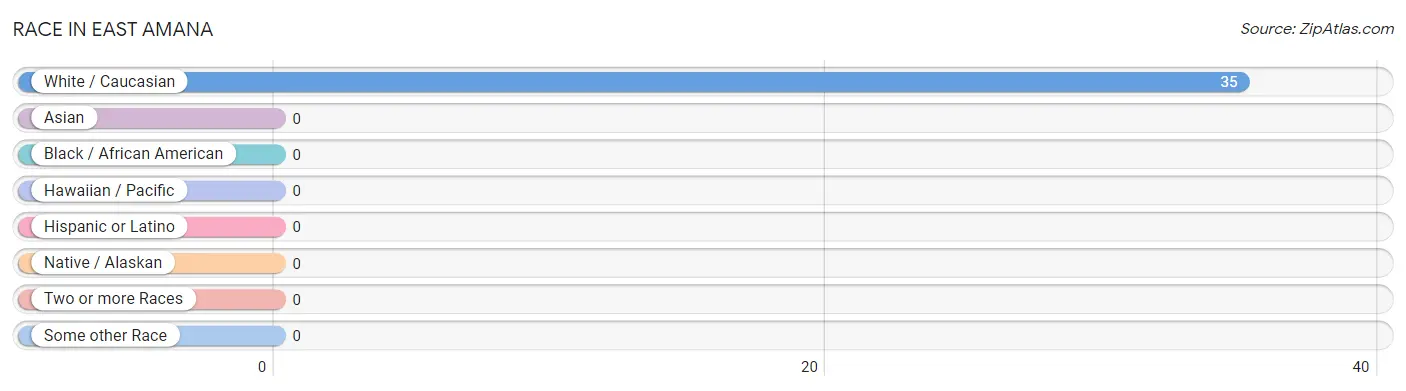
Race in East Amana
The most populous races in East Amana are , and White / Caucasian (35 | 100.0%).
Race
# Population
% Population
Asian
0
0.0%
Black / African American
0
0.0%
Hawaiian / Pacific
0
0.0%
Hispanic or Latino
0
0.0%
Native / Alaskan
0
0.0%
White / Caucasian
35
100.0%
Two or more Races
0
0.0%
Some other Race
0
0.0%
Total
35
100.0%
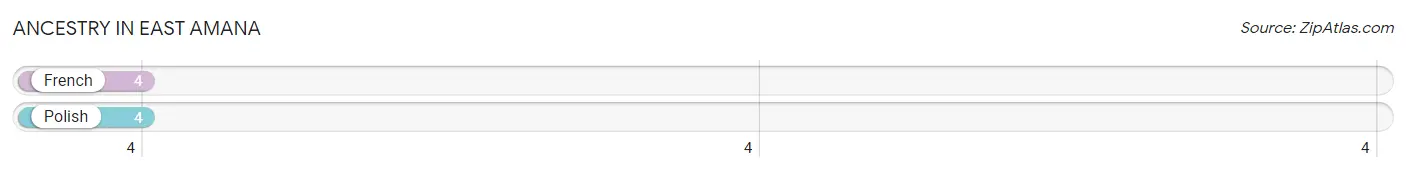
Ancestry in East Amana
The most populous ancestries reported in East Amana are French (4 | 11.4%), and Polish (4 | 11.4%), together accounting for 22.9% of all East Amana residents.
Ancestry
# Population
% Population
French
4
11.4%
Polish
4
11.4%
View All 2 Rows
Immigrants in East Amana
Immigration Origin
# Population
% Population
View All 0 Rows
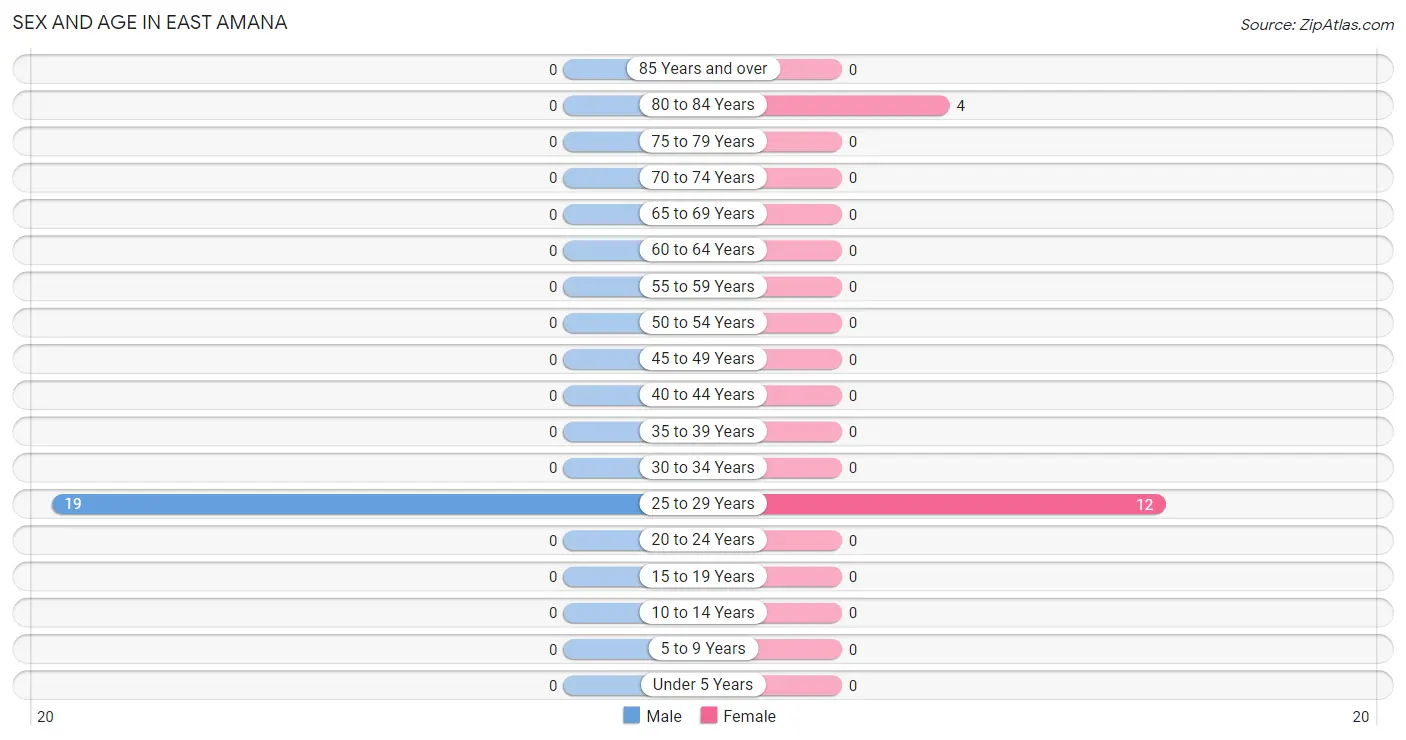
Sex and Age in East Amana
Sex and Age in East Amana
The most populous age groups in East Amana are 25 to 29 Years (19 | 100.0%) for men and 25 to 29 Years (12 | 75.0%) for women.
Age Bracket
Male
Female
Under 5 Years
0 (0.0%)
0 (0.0%)
5 to 9 Years
0 (0.0%)
0 (0.0%)
10 to 14 Years
0 (0.0%)
0 (0.0%)
15 to 19 Years
0 (0.0%)
0 (0.0%)
20 to 24 Years
0 (0.0%)
0 (0.0%)
25 to 29 Years
19 (100.0%)
12 (75.0%)
30 to 34 Years
0 (0.0%)
0 (0.0%)
35 to 39 Years
0 (0.0%)
0 (0.0%)
40 to 44 Years
0 (0.0%)
0 (0.0%)
45 to 49 Years
0 (0.0%)
0 (0.0%)
50 to 54 Years
0 (0.0%)
0 (0.0%)
55 to 59 Years
0 (0.0%)
0 (0.0%)
60 to 64 Years
0 (0.0%)
0 (0.0%)
65 to 69 Years
0 (0.0%)
0 (0.0%)
70 to 74 Years
0 (0.0%)
0 (0.0%)
75 to 79 Years
0 (0.0%)
0 (0.0%)
80 to 84 Years
0 (0.0%)
4 (25.0%)
85 Years and over
0 (0.0%)
0 (0.0%)
Total
19 (100.0%)
16 (100.0%)
Families and Households in East Amana
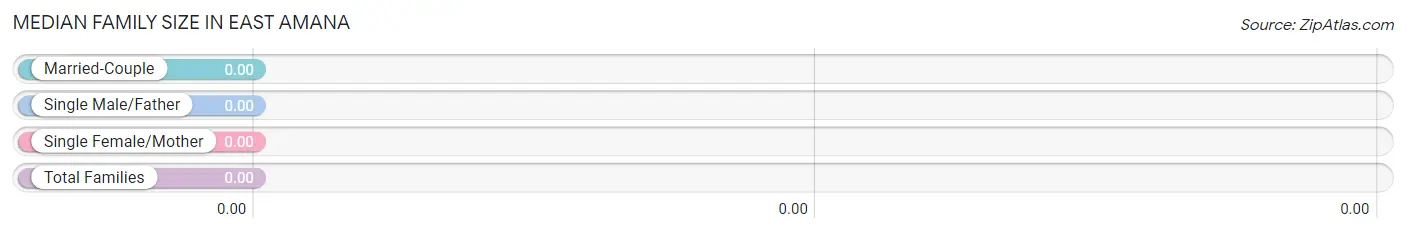
Median Family Size in East Amana
Family Type
# Families
Family Size
Married-Couple
0 (0.0%)
-
Single Male/Father
0 (0.0%)
-
Single Female/Mother
0 (0.0%)
-
Total Families
0 (0.0%)
-
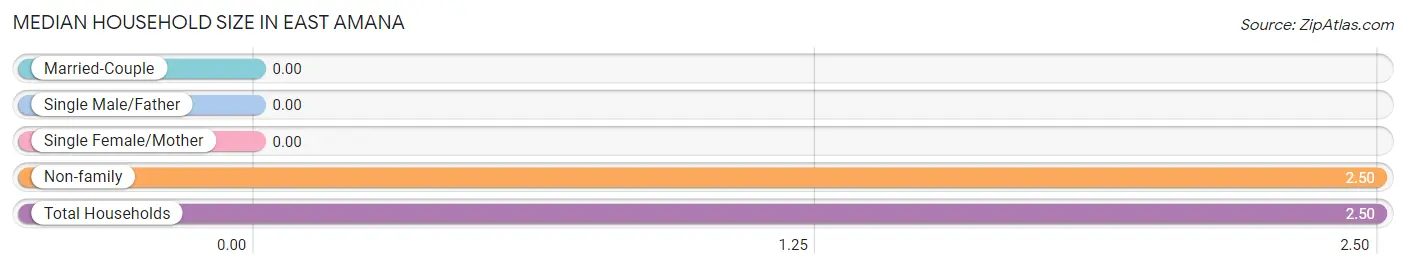
Median Household Size in East Amana
Household Type
# Households
Household Size
Married-Couple
0 (0.0%)
-
Single Male/Father
0 (0.0%)
-
Single Female/Mother
0 (0.0%)
-
Non-family
14 (100.0%)
2.50
Total Households
14 (100.0%)
2.50
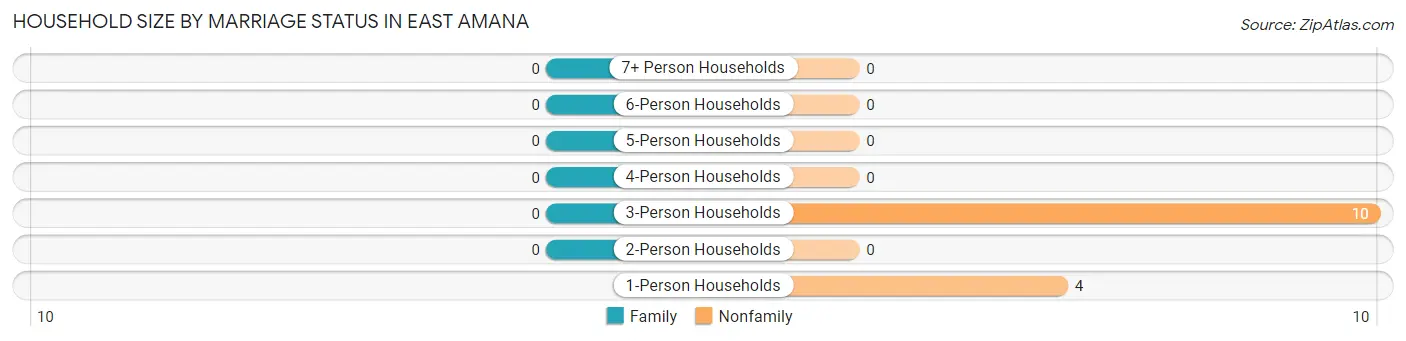
Household Size by Marriage Status in East Amana
Household Size
Family Households
Nonfamily Households
1-Person Households
-
4 (28.6%)
2-Person Households
0 (0.0%)
0 (0.0%)
3-Person Households
0 (0.0%)
10 (71.4%)
4-Person Households
0 (0.0%)
0 (0.0%)
5-Person Households
0 (0.0%)
0 (0.0%)
6-Person Households
0 (0.0%)
0 (0.0%)
7+ Person Households
0 (0.0%)
0 (0.0%)
Total
0 (0.0%)
14 (100.0%)
Female Fertility in East Amana
Fertility by Age in East Amana
Age Bracket
Women with Births
Births / 1,000 Women
15 to 19 years
0 (0.0%)
0.0
20 to 34 years
0 (0.0%)
0.0
35 to 50 years
0 (0.0%)
0.0
Total
0 (0.0%)
0.0
Fertility by Age by Marriage Status in East Amana
Age Bracket
Married
Unmarried
15 to 19 years
0 (0.0%)
0 (0.0%)
20 to 34 years
0 (0.0%)
0 (0.0%)
35 to 50 years
0 (0.0%)
0 (0.0%)
Total
0 (0.0%)
0 (0.0%)
Fertility by Education in East Amana
Educational Attainment
Women with Births
Births / 1,000 Women
Less than High School
0 (0.0%)
0.0
High School Diploma
0 (0.0%)
0.0
College or Associate's Degree
0 (0.0%)
0.0
Bachelor's Degree
0 (0.0%)
0.0
Graduate Degree
0 (0.0%)
0.0
Total
0 (0.0%)
0.0
Fertility by Education by Marriage Status in East Amana
Educational Attainment
Married
Unmarried
Less than High School
0 (0.0%)
0 (0.0%)
High School Diploma
0 (0.0%)
0 (0.0%)
College or Associate's Degree
0 (0.0%)
0 (0.0%)
Bachelor's Degree
0 (0.0%)
0 (0.0%)
Graduate Degree
0 (0.0%)
0 (0.0%)
Total
0 (0.0%)
0 (0.0%)
Employment Characteristics in East Amana
Employment by Class of Employer in East Amana
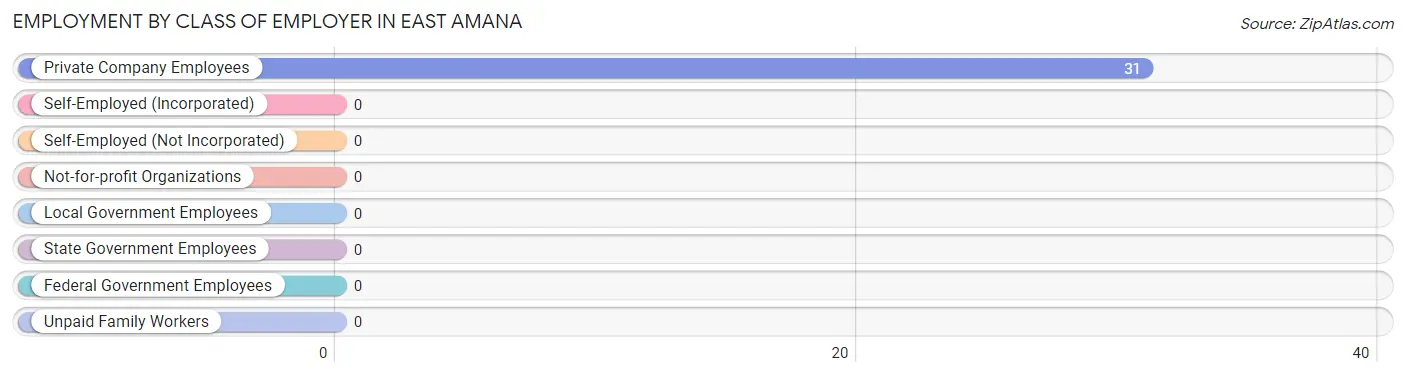
Among the 31 employed individuals in East Amana, , and private company employees (31 | 100.0%) make up the most common classes of employment.
Employer Class
# Employees
% Employees
Private Company Employees
31
100.0%
Self-Employed (Incorporated)
0
0.0%
Self-Employed (Not Incorporated)
0
0.0%
Not-for-profit Organizations
0
0.0%
Local Government Employees
0
0.0%
State Government Employees
0
0.0%
Federal Government Employees
0
0.0%
Unpaid Family Workers
0
0.0%
Total
31
100.0%
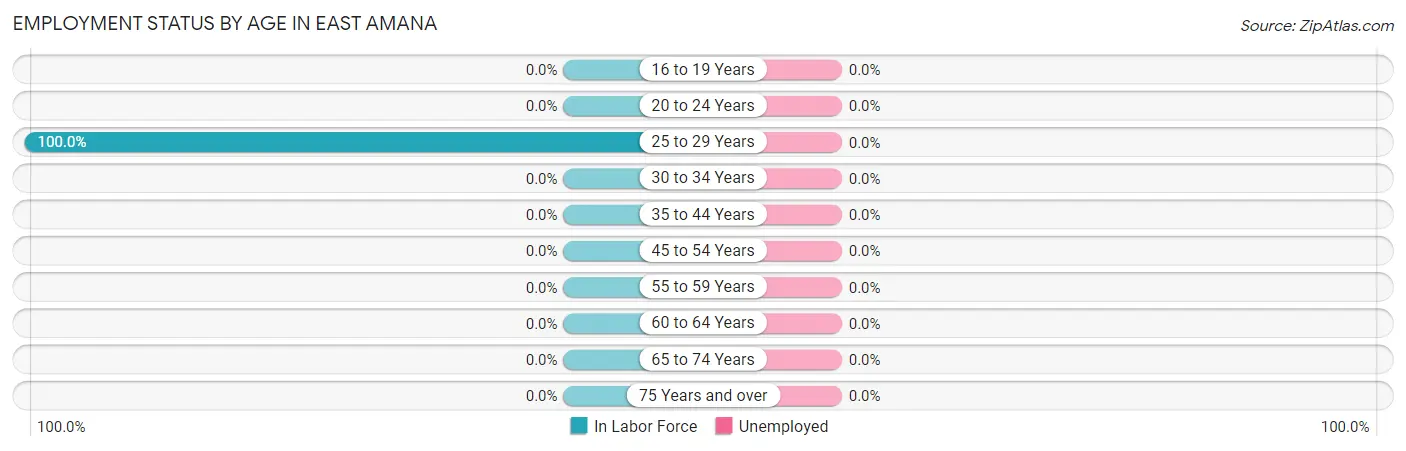
Employment Status by Age in East Amana
Age Bracket
In Labor Force
Unemployed
16 to 19 Years
0 (0.0%)
0 (0.0%)
20 to 24 Years
0 (0.0%)
0 (0.0%)
25 to 29 Years
31 (100.0%)
0 (0.0%)
30 to 34 Years
0 (0.0%)
0 (0.0%)
35 to 44 Years
0 (0.0%)
0 (0.0%)
45 to 54 Years
0 (0.0%)
0 (0.0%)
55 to 59 Years
0 (0.0%)
0 (0.0%)
60 to 64 Years
0 (0.0%)
0 (0.0%)
65 to 74 Years
0 (0.0%)
0 (0.0%)
75 Years and over
0 (0.0%)
0 (0.0%)
Total
31 (88.6%)
0 (0.0%)
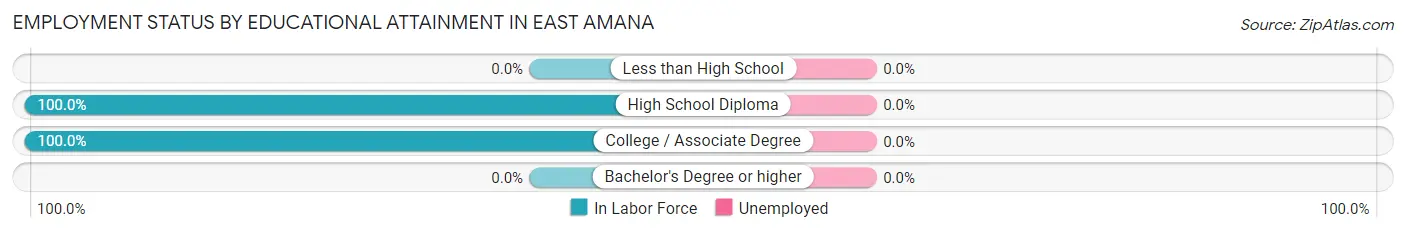
Employment Status by Educational Attainment in East Amana
Educational Attainment
In Labor Force
Unemployed
Less than High School
0 (0.0%)
0 (0.0%)
High School Diploma
19 (100.0%)
0 (0.0%)
College / Associate Degree
12 (100.0%)
0 (0.0%)
Bachelor's Degree or higher
0 (0.0%)
0 (0.0%)
Total
31 (100.0%)
0 (0.0%)
Employment Occupations by Sex in East Amana
Management, Business, Science and Arts Occupations
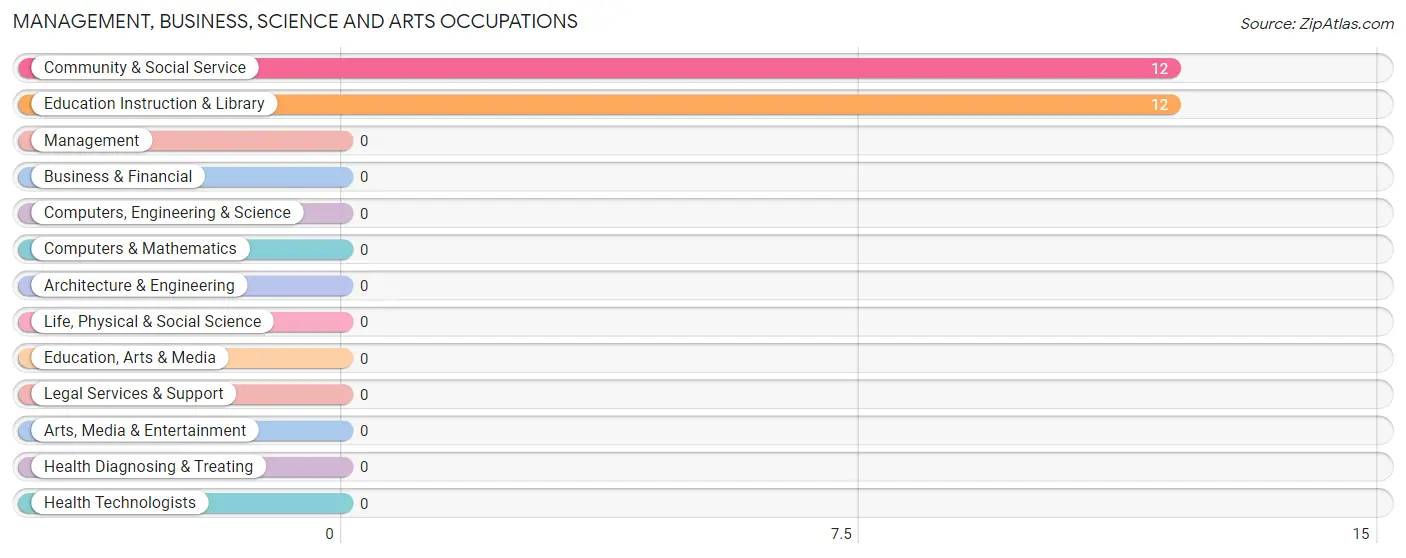
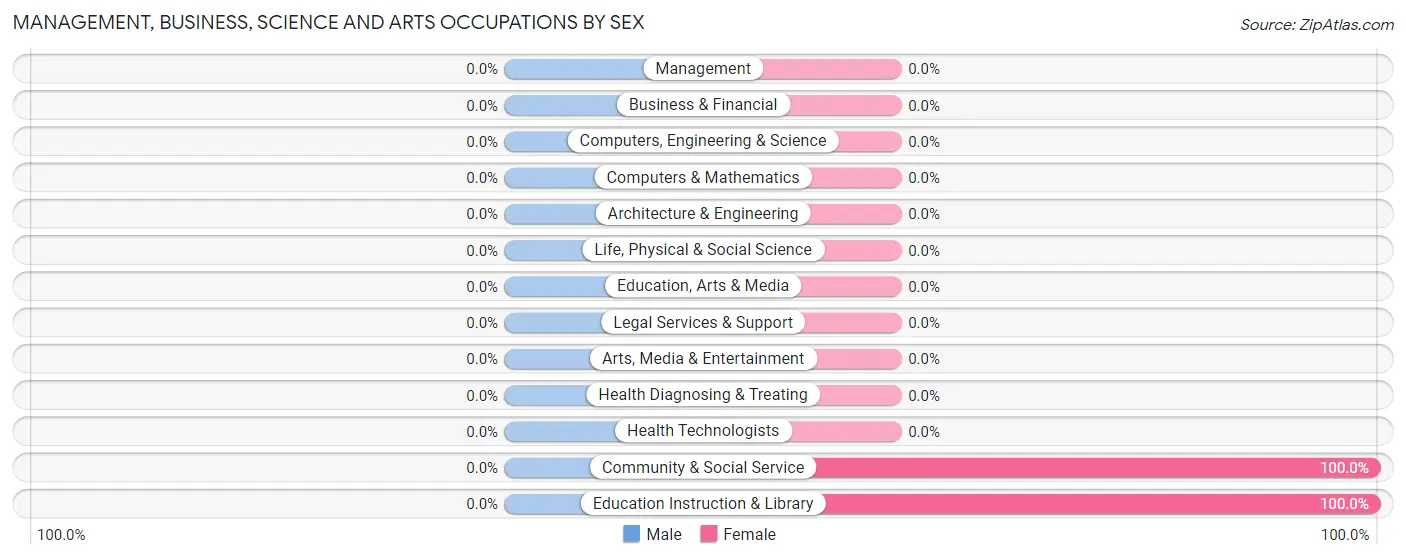
The most common Management, Business, Science and Arts occupations in East Amana are Community & Social Service (12 | 38.7%), and Education Instruction & Library (12 | 38.7%).
Management, Business, Science and Arts Occupations by Sex
Occupation
Male
Female
Management
0 (0.0%)
0 (0.0%)
Business & Financial
0 (0.0%)
0 (0.0%)
Computers, Engineering & Science
0 (0.0%)
0 (0.0%)
Computers & Mathematics
0 (0.0%)
0 (0.0%)
Architecture & Engineering
0 (0.0%)
0 (0.0%)
Life, Physical & Social Science
0 (0.0%)
0 (0.0%)
Community & Social Service
0 (0.0%)
12 (100.0%)
Education, Arts & Media
0 (0.0%)
0 (0.0%)
Legal Services & Support
0 (0.0%)
0 (0.0%)
Education Instruction & Library
0 (0.0%)
12 (100.0%)
Arts, Media & Entertainment
0 (0.0%)
0 (0.0%)
Health Diagnosing & Treating
0 (0.0%)
0 (0.0%)
Health Technologists
0 (0.0%)
0 (0.0%)
Total (Category)
0 (0.0%)
12 (100.0%)
Total (Overall)
19 (61.3%)
12 (38.7%)
Services Occupations
Services Occupations by Sex
Occupation
Male
Female
Healthcare Support
0 (0.0%)
0 (0.0%)
Security & Protection
0 (0.0%)
0 (0.0%)
Firefighting & Prevention
0 (0.0%)
0 (0.0%)
Law Enforcement
0 (0.0%)
0 (0.0%)
Food Preparation & Serving
0 (0.0%)
0 (0.0%)
Cleaning & Maintenance
0 (0.0%)
0 (0.0%)
Personal Care & Service
0 (0.0%)
0 (0.0%)
Total (Category)
0 (0.0%)
0 (0.0%)
Total (Overall)
19 (61.3%)
12 (38.7%)
Sales and Office Occupations
Sales and Office Occupations by Sex
Occupation
Male
Female
Sales & Related
0 (0.0%)
0 (0.0%)
Office & Administration
0 (0.0%)
0 (0.0%)
Total (Category)
0 (0.0%)
0 (0.0%)
Total (Overall)
19 (61.3%)
12 (38.7%)
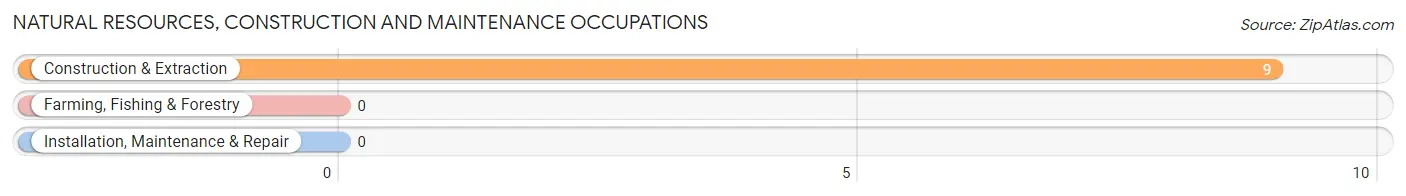
Natural Resources, Construction and Maintenance Occupations
The most common Natural Resources, Construction and Maintenance occupations in East Amana are , and Construction & Extraction (9 | 29.0%).
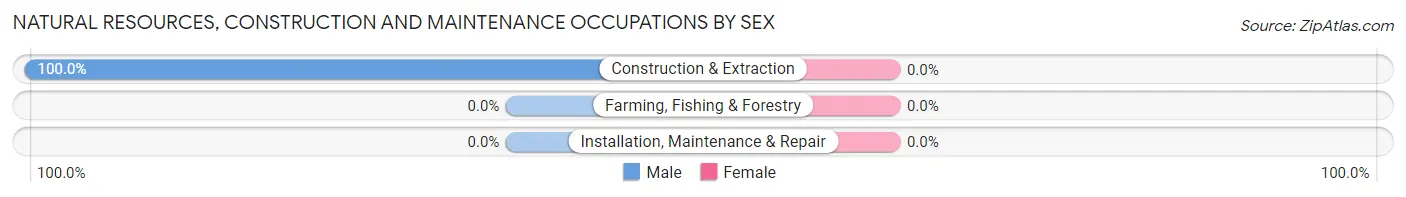
Natural Resources, Construction and Maintenance Occupations by Sex
Occupation
Male
Female
Farming, Fishing & Forestry
0 (0.0%)
0 (0.0%)
Construction & Extraction
9 (100.0%)
0 (0.0%)
Installation, Maintenance & Repair
0 (0.0%)
0 (0.0%)
Total (Category)
9 (100.0%)
0 (0.0%)
Total (Overall)
19 (61.3%)
12 (38.7%)
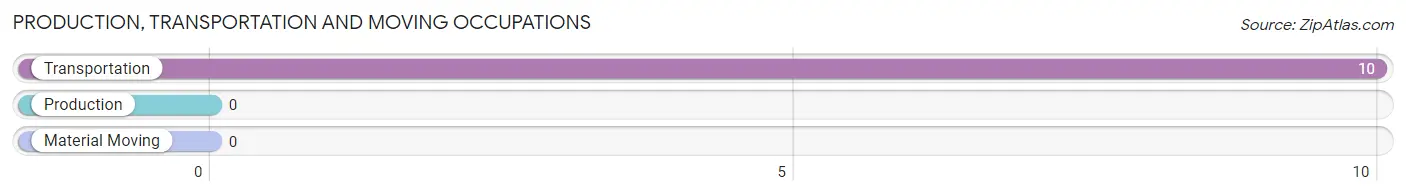
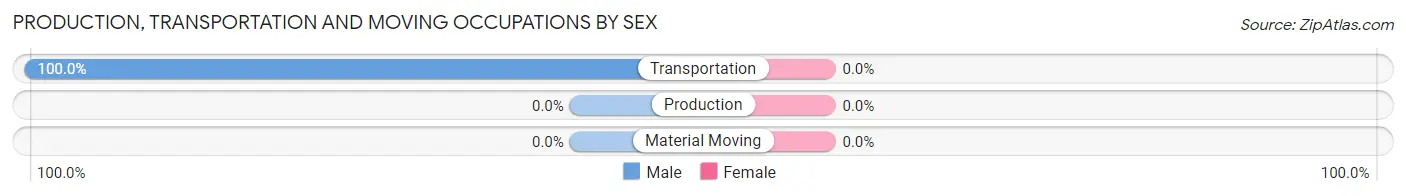
Production, Transportation and Moving Occupations
The most common Production, Transportation and Moving occupations in East Amana are , and Transportation (10 | 32.3%).
Production, Transportation and Moving Occupations by Sex
Occupation
Male
Female
Production
0 (0.0%)
0 (0.0%)
Transportation
10 (100.0%)
0 (0.0%)
Material Moving
0 (0.0%)
0 (0.0%)
Total (Category)
10 (100.0%)
0 (0.0%)
Total (Overall)
19 (61.3%)
12 (38.7%)
Employment Industries by Sex in East Amana
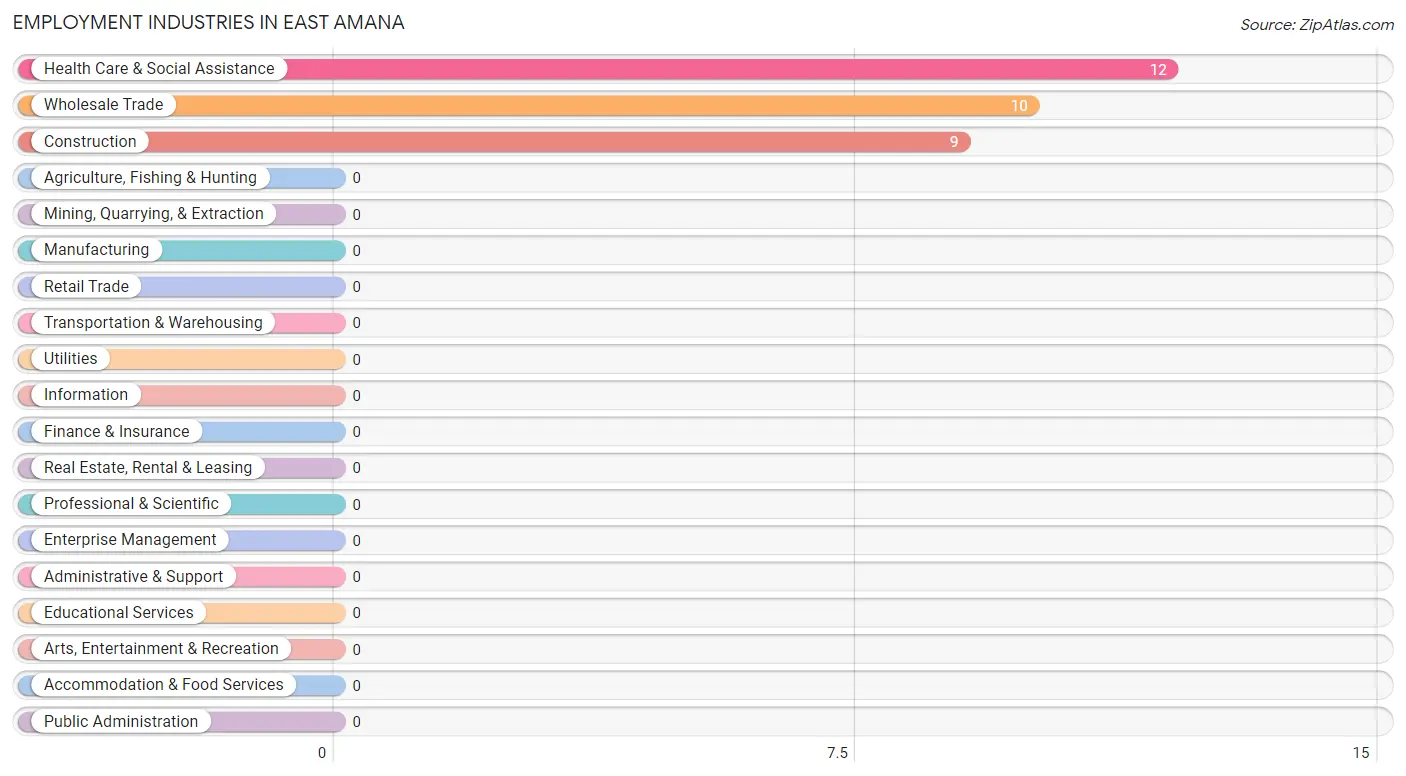
Employment Industries in East Amana
The major employment industries in East Amana include Health Care & Social Assistance (12 | 38.7%), Wholesale Trade (10 | 32.3%), and Construction (9 | 29.0%).
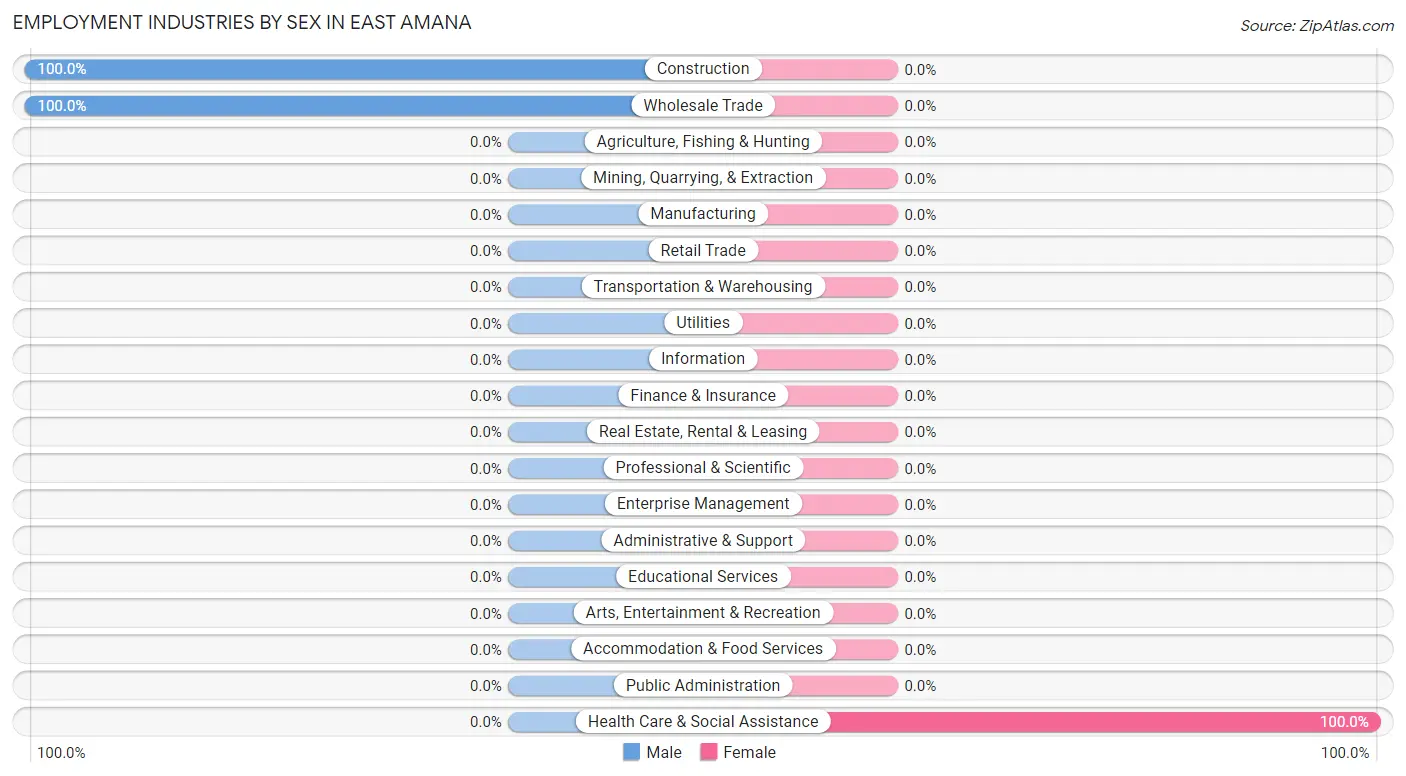
Employment Industries by Sex in East Amana
Industry
Male
Female
Agriculture, Fishing & Hunting
0 (0.0%)
0 (0.0%)
Mining, Quarrying, & Extraction
0 (0.0%)
0 (0.0%)
Construction
9 (100.0%)
0 (0.0%)
Manufacturing
0 (0.0%)
0 (0.0%)
Wholesale Trade
10 (100.0%)
0 (0.0%)
Retail Trade
0 (0.0%)
0 (0.0%)
Transportation & Warehousing
0 (0.0%)
0 (0.0%)
Utilities
0 (0.0%)
0 (0.0%)
Information
0 (0.0%)
0 (0.0%)
Finance & Insurance
0 (0.0%)
0 (0.0%)
Real Estate, Rental & Leasing
0 (0.0%)
0 (0.0%)
Professional & Scientific
0 (0.0%)
0 (0.0%)
Enterprise Management
0 (0.0%)
0 (0.0%)
Administrative & Support
0 (0.0%)
0 (0.0%)
Educational Services
0 (0.0%)
0 (0.0%)
Health Care & Social Assistance
0 (0.0%)
12 (100.0%)
Arts, Entertainment & Recreation
0 (0.0%)
0 (0.0%)
Accommodation & Food Services
0 (0.0%)
0 (0.0%)
Public Administration
0 (0.0%)
0 (0.0%)
Total
19 (61.3%)
12 (38.7%)
Education in East Amana
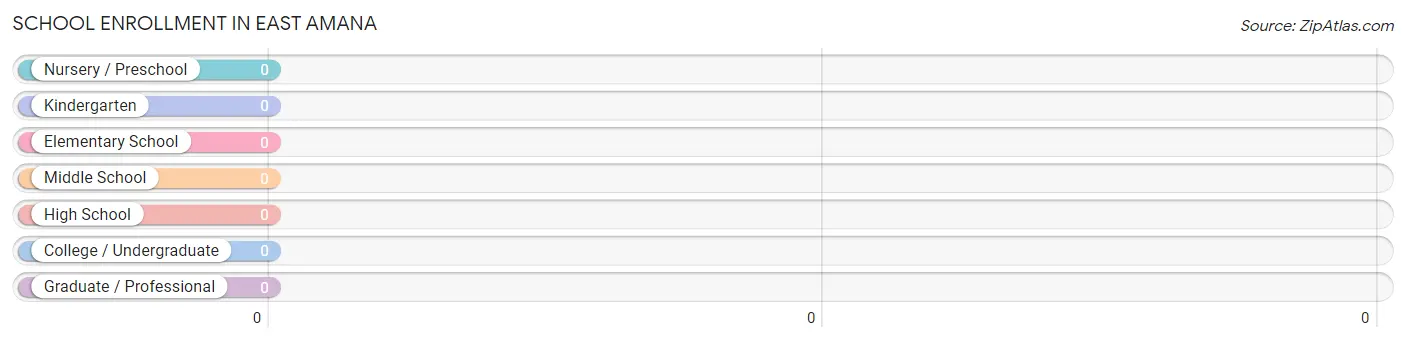
School Enrollment in East Amana
School Level
# Students
% Students
Nursery / Preschool
0
0.0%
Kindergarten
0
0.0%
Elementary School
0
0.0%
Middle School
0
0.0%
High School
0
0.0%
College / Undergraduate
0
0.0%
Graduate / Professional
0
0.0%
Total
0
0.0%
School Enrollment by Age by Funding Source in East Amana
Age Bracket
Public School
Private School
3 to 4 Year Olds
0 (0.0%)
0 (0.0%)
5 to 9 Year Old
0 (0.0%)
0 (0.0%)
10 to 14 Year Olds
0 (0.0%)
0 (0.0%)
15 to 17 Year Olds
0 (0.0%)
0 (0.0%)
18 to 19 Year Olds
0 (0.0%)
0 (0.0%)
20 to 24 Year Olds
0 (0.0%)
0 (0.0%)
25 to 34 Year Olds
0 (0.0%)
0 (0.0%)
35 Years and over
0 (0.0%)
0 (0.0%)
Total
0 (0.0%)
0 (0.0%)
Educational Attainment by Field of Study in East Amana
Field of Study
# Graduates
% Graduates
Computers & Mathematics
0
0.0%
Bio, Nature & Agricultural
0
0.0%
Physical & Health Sciences
0
0.0%
Psychology
0
0.0%
Social Sciences
0
0.0%
Engineering
0
0.0%
Multidisciplinary Studies
0
0.0%
Science & Technology
0
0.0%
Business
0
0.0%
Education
0
0.0%
Literature & Languages
0
0.0%
Liberal Arts & History
0
0.0%
Visual & Performing Arts
0
0.0%
Communications
0
0.0%
Arts & Humanities
0
0.0%
Total
0
0.0%
Transportation & Commute in East Amana
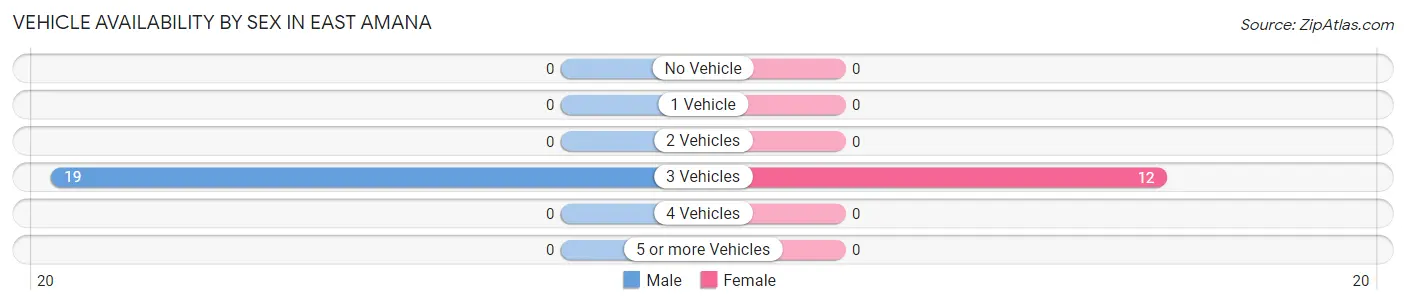
Vehicle Availability by Sex in East Amana
The most prevalent vehicle ownership categories in East Amana are males with 3 vehicles (19, accounting for 100.0%) and females with 3 vehicles (12, making up 158.3%).
Vehicles Available
Male
Female
No Vehicle
0 (0.0%)
0 (0.0%)
1 Vehicle
0 (0.0%)
0 (0.0%)
2 Vehicles
0 (0.0%)
0 (0.0%)
3 Vehicles
19 (100.0%)
12 (100.0%)
4 Vehicles
0 (0.0%)
0 (0.0%)
5 or more Vehicles
0 (0.0%)
0 (0.0%)
Total
19 (100.0%)
12 (100.0%)
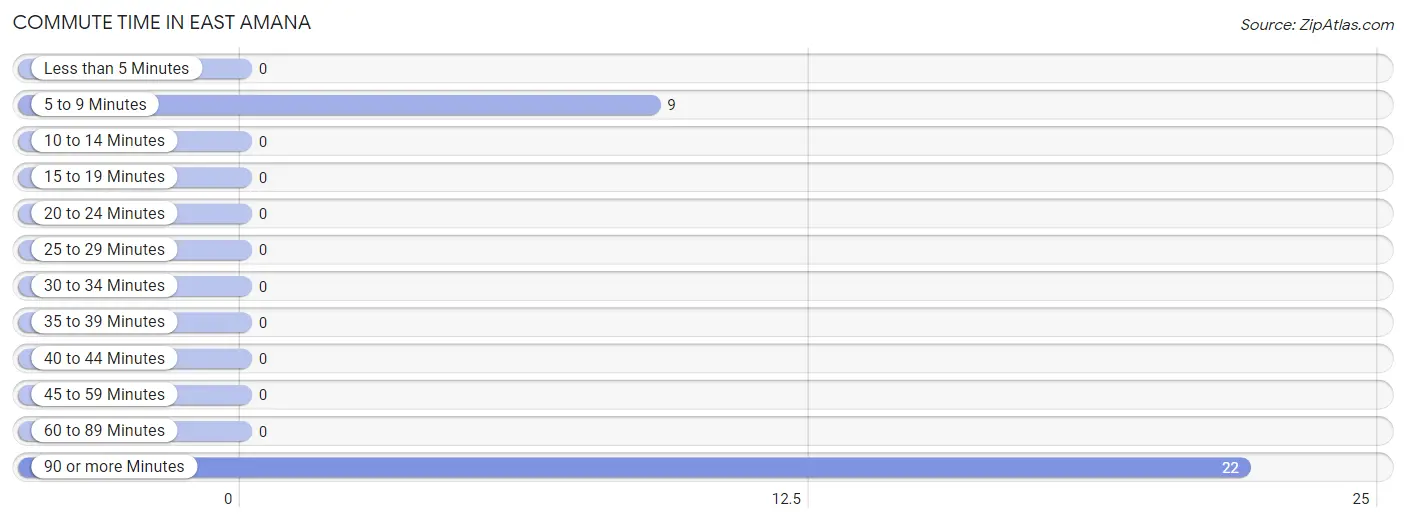
Commute Time in East Amana
The most frequently occuring commute durations in East Amana are 90 or more minutes (22 commuters, 71.0%), 5 to 9 minutes (9 commuters, 29.0%), and less than 5 minutes (0 commuters, 0.0%).
Commute Time
# Commuters
% Commuters
Less than 5 Minutes
0
0.0%
5 to 9 Minutes
9
29.0%
10 to 14 Minutes
0
0.0%
15 to 19 Minutes
0
0.0%
20 to 24 Minutes
0
0.0%
25 to 29 Minutes
0
0.0%
30 to 34 Minutes
0
0.0%
35 to 39 Minutes
0
0.0%
40 to 44 Minutes
0
0.0%
45 to 59 Minutes
0
0.0%
60 to 89 Minutes
0
0.0%
90 or more Minutes
22
71.0%
Commute Time by Sex in East Amana
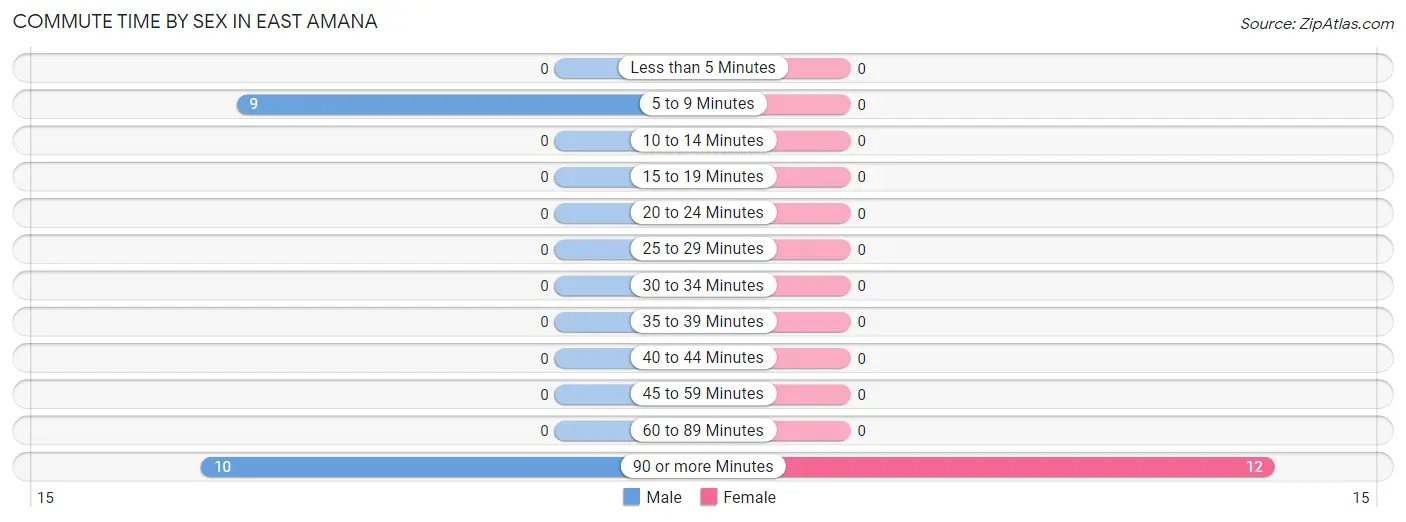
The most common commute times in East Amana are 90 or more minutes (10 commuters, 52.6%) for males and 90 or more minutes (12 commuters, 100.0%) for females.
Commute Time
Male
Female
Less than 5 Minutes
0 (0.0%)
0 (0.0%)
5 to 9 Minutes
9 (47.4%)
0 (0.0%)
10 to 14 Minutes
0 (0.0%)
0 (0.0%)
15 to 19 Minutes
0 (0.0%)
0 (0.0%)
20 to 24 Minutes
0 (0.0%)
0 (0.0%)
25 to 29 Minutes
0 (0.0%)
0 (0.0%)
30 to 34 Minutes
0 (0.0%)
0 (0.0%)
35 to 39 Minutes
0 (0.0%)
0 (0.0%)
40 to 44 Minutes
0 (0.0%)
0 (0.0%)
45 to 59 Minutes
0 (0.0%)
0 (0.0%)
60 to 89 Minutes
0 (0.0%)
0 (0.0%)
90 or more Minutes
10 (52.6%)
12 (100.0%)
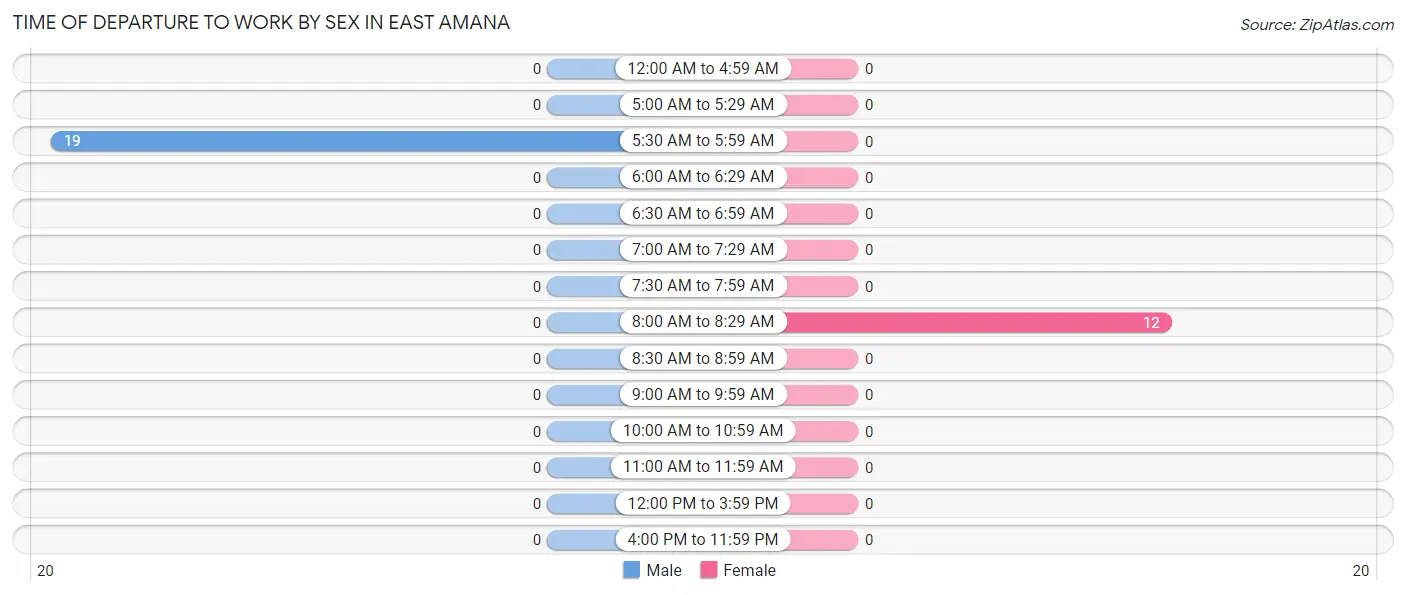
Time of Departure to Work by Sex in East Amana
The most frequent times of departure to work in East Amana are 5:30 AM to 5:59 AM (19, 100.0%) for males and 8:00 AM to 8:29 AM (12, 100.0%) for females.
Time of Departure
Male
Female
12:00 AM to 4:59 AM
0 (0.0%)
0 (0.0%)
5:00 AM to 5:29 AM
0 (0.0%)
0 (0.0%)
5:30 AM to 5:59 AM
19 (100.0%)
0 (0.0%)
6:00 AM to 6:29 AM
0 (0.0%)
0 (0.0%)
6:30 AM to 6:59 AM
0 (0.0%)
0 (0.0%)
7:00 AM to 7:29 AM
0 (0.0%)
0 (0.0%)
7:30 AM to 7:59 AM
0 (0.0%)
0 (0.0%)
8:00 AM to 8:29 AM
0 (0.0%)
12 (100.0%)
8:30 AM to 8:59 AM
0 (0.0%)
0 (0.0%)
9:00 AM to 9:59 AM
0 (0.0%)
0 (0.0%)
10:00 AM to 10:59 AM
0 (0.0%)
0 (0.0%)
11:00 AM to 11:59 AM
0 (0.0%)
0 (0.0%)
12:00 PM to 3:59 PM
0 (0.0%)
0 (0.0%)
4:00 PM to 11:59 PM
0 (0.0%)
0 (0.0%)
Total
19 (100.0%)
12 (100.0%)
Housing Occupancy in East Amana
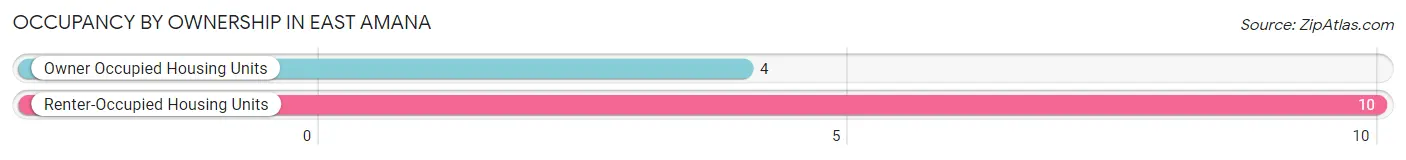
Occupancy by Ownership in East Amana
Of the total 14 dwellings in East Amana, owner-occupied units account for 4 (28.6%), while renter-occupied units make up 10 (71.4%).
Occupancy
# Housing Units
% Housing Units
Owner Occupied Housing Units
4
28.6%
Renter-Occupied Housing Units
10
71.4%
Total Occupied Housing Units
14
100.0%
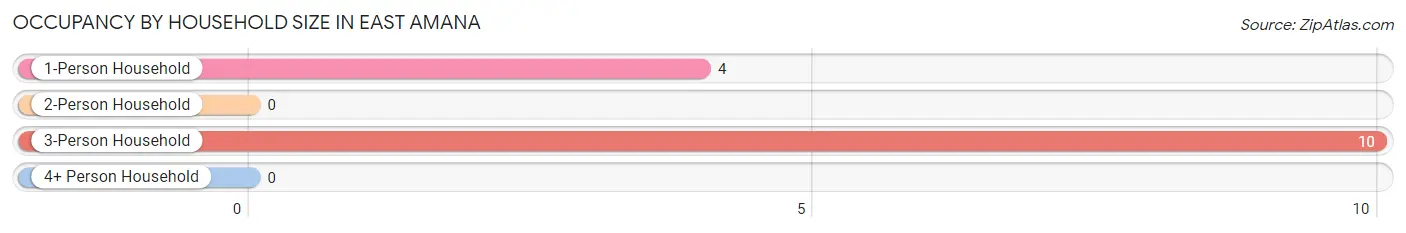
Occupancy by Household Size in East Amana
Household Size
# Housing Units
% Housing Units
1-Person Household
4
28.6%
2-Person Household
0
0.0%
3-Person Household
10
71.4%
4+ Person Household
0
0.0%
Total Housing Units
14
100.0%
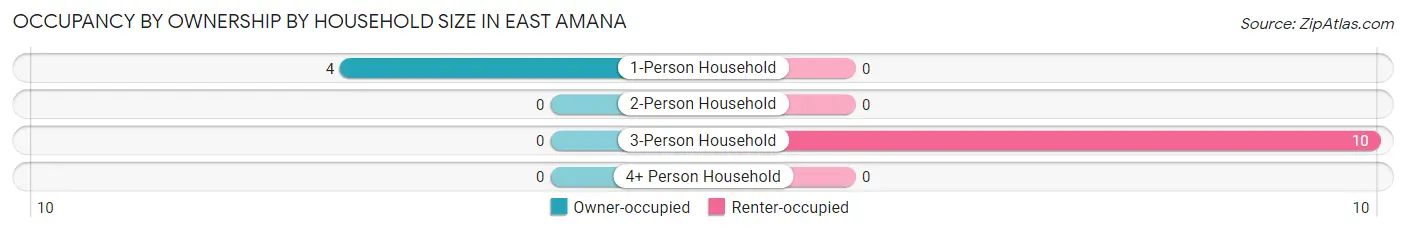
Occupancy by Ownership by Household Size in East Amana
Household Size
Owner-occupied
Renter-occupied
1-Person Household
4 (100.0%)
0 (0.0%)
2-Person Household
0 (0.0%)
0 (0.0%)
3-Person Household
0 (0.0%)
10 (100.0%)
4+ Person Household
0 (0.0%)
0 (0.0%)
Total Housing Units
4 (28.6%)
10 (71.4%)
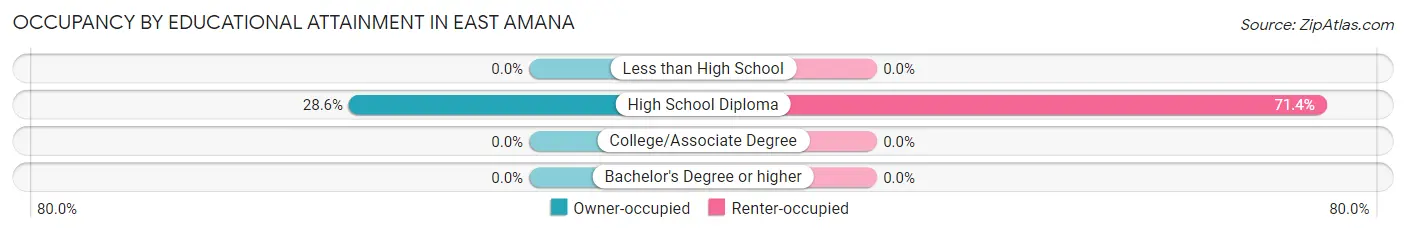
Occupancy by Educational Attainment in East Amana
Household Size
Owner-occupied
Renter-occupied
Less than High School
0 (0.0%)
0 (0.0%)
High School Diploma
4 (28.6%)
10 (71.4%)
College/Associate Degree
0 (0.0%)
0 (0.0%)
Bachelor's Degree or higher
0 (0.0%)
0 (0.0%)
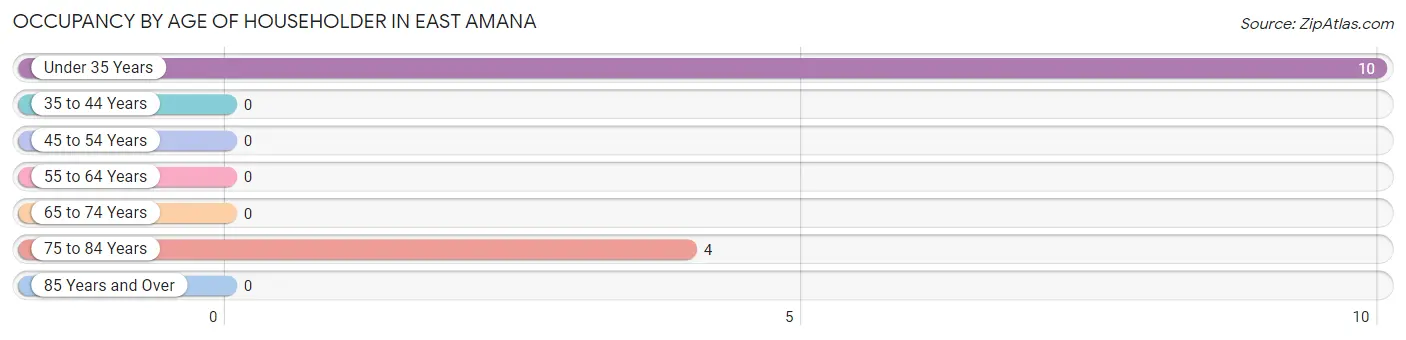
Occupancy by Age of Householder in East Amana
Age Bracket
# Households
% Households
Under 35 Years
10
71.4%
35 to 44 Years
0
0.0%
45 to 54 Years
0
0.0%
55 to 64 Years
0
0.0%
65 to 74 Years
0
0.0%
75 to 84 Years
4
28.6%
85 Years and Over
0
0.0%
Total
14
100.0%
Housing Finances in East Amana
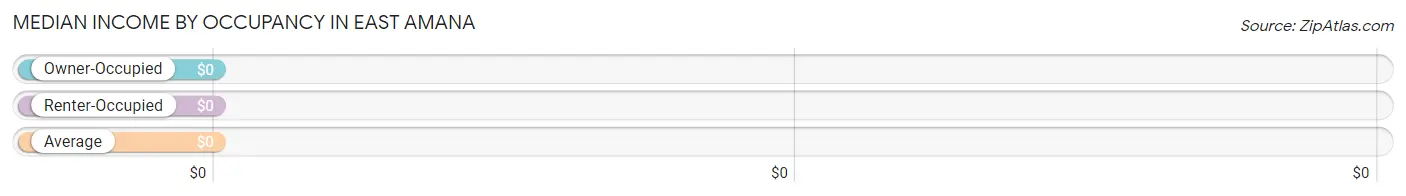
Median Income by Occupancy in East Amana
Occupancy Type
# Households
Median Income
Owner-Occupied
4 (28.6%)
$0
Renter-Occupied
10 (71.4%)
$0
Average
14 (100.0%)
$0
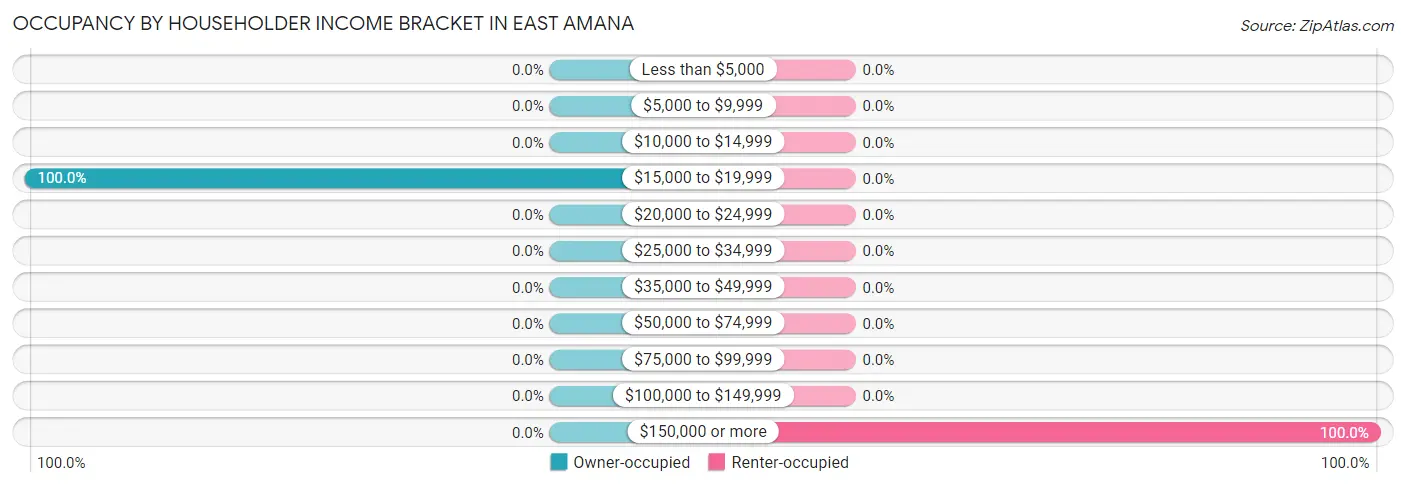
Occupancy by Householder Income Bracket in East Amana
Income Bracket
Owner-occupied
Renter-occupied
Less than $5,000
0 (0.0%)
0 (0.0%)
$5,000 to $9,999
0 (0.0%)
0 (0.0%)
$10,000 to $14,999
0 (0.0%)
0 (0.0%)
$15,000 to $19,999
4 (100.0%)
0 (0.0%)
$20,000 to $24,999
0 (0.0%)
0 (0.0%)
$25,000 to $34,999
0 (0.0%)
0 (0.0%)
$35,000 to $49,999
0 (0.0%)
0 (0.0%)
$50,000 to $74,999
0 (0.0%)
0 (0.0%)
$75,000 to $99,999
0 (0.0%)
0 (0.0%)
$100,000 to $149,999
0 (0.0%)
0 (0.0%)
$150,000 or more
0 (0.0%)
10 (100.0%)
Total
4 (100.0%)
10 (100.0%)
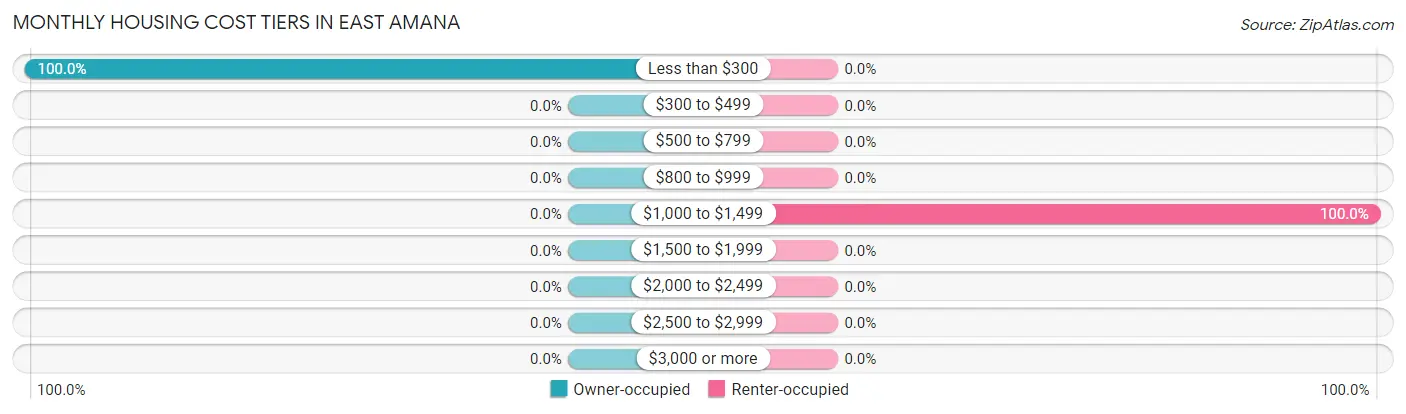
Monthly Housing Cost Tiers in East Amana
Monthly Cost
Owner-occupied
Renter-occupied
Less than $300
4 (100.0%)
0 (0.0%)
$300 to $499
0 (0.0%)
0 (0.0%)
$500 to $799
0 (0.0%)
0 (0.0%)
$800 to $999
0 (0.0%)
0 (0.0%)
$1,000 to $1,499
0 (0.0%)
10 (100.0%)
$1,500 to $1,999
0 (0.0%)
0 (0.0%)
$2,000 to $2,499
0 (0.0%)
0 (0.0%)
$2,500 to $2,999
0 (0.0%)
0 (0.0%)
$3,000 or more
0 (0.0%)
0 (0.0%)
Total
4 (100.0%)
10 (100.0%)
Physical Housing Characteristics in East Amana
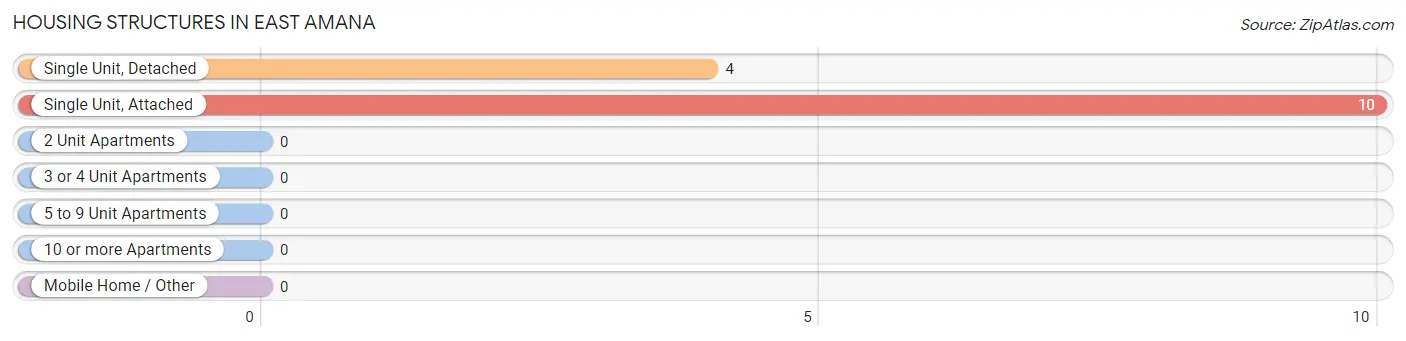
Housing Structures in East Amana
Structure Type
# Housing Units
% Housing Units
Single Unit, Detached
4
28.6%
Single Unit, Attached
10
71.4%
2 Unit Apartments
0
0.0%
3 or 4 Unit Apartments
0
0.0%
5 to 9 Unit Apartments
0
0.0%
10 or more Apartments
0
0.0%
Mobile Home / Other
0
0.0%
Total
14
100.0%
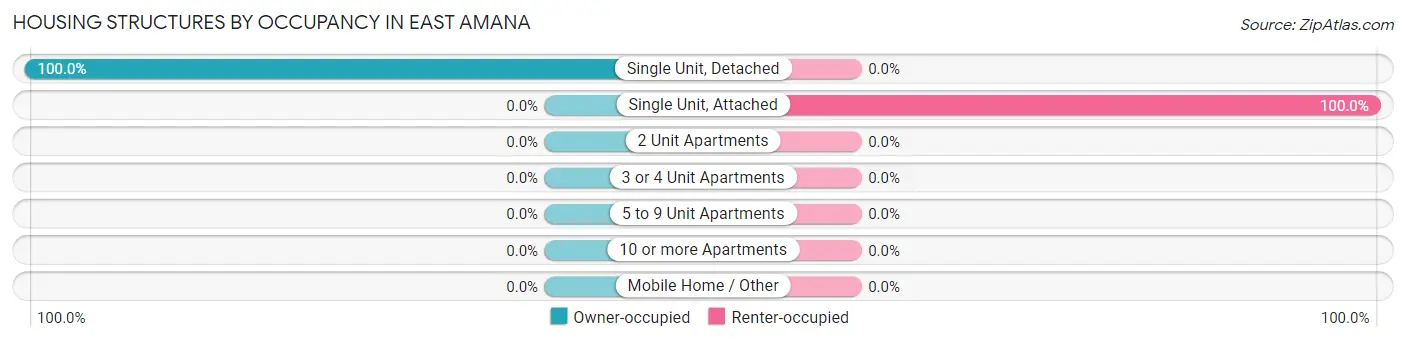
Housing Structures by Occupancy in East Amana
Structure Type
Owner-occupied
Renter-occupied
Single Unit, Detached
4 (100.0%)
0 (0.0%)
Single Unit, Attached
0 (0.0%)
10 (100.0%)
2 Unit Apartments
0 (0.0%)
0 (0.0%)
3 or 4 Unit Apartments
0 (0.0%)
0 (0.0%)
5 to 9 Unit Apartments
0 (0.0%)
0 (0.0%)
10 or more Apartments
0 (0.0%)
0 (0.0%)
Mobile Home / Other
0 (0.0%)
0 (0.0%)
Total
4 (28.6%)
10 (71.4%)
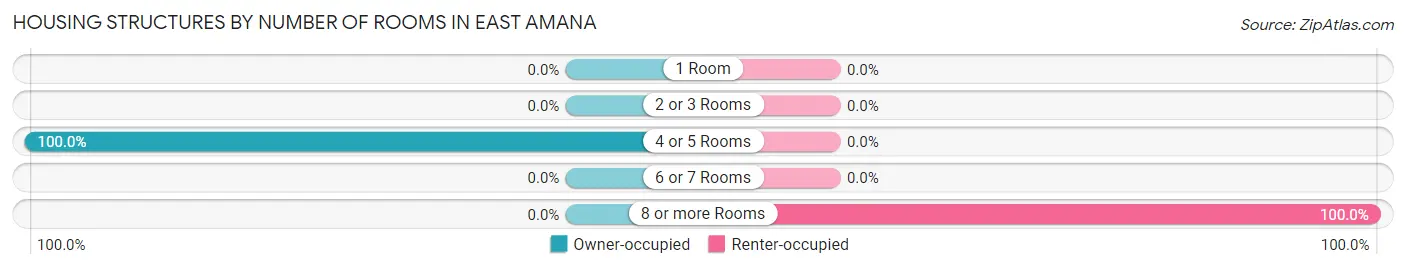
Housing Structures by Number of Rooms in East Amana
Number of Rooms
Owner-occupied
Renter-occupied
1 Room
0 (0.0%)
0 (0.0%)
2 or 3 Rooms
0 (0.0%)
0 (0.0%)
4 or 5 Rooms
4 (100.0%)
0 (0.0%)
6 or 7 Rooms
0 (0.0%)
0 (0.0%)
8 or more Rooms
0 (0.0%)
10 (100.0%)
Total
4 (100.0%)
10 (100.0%)
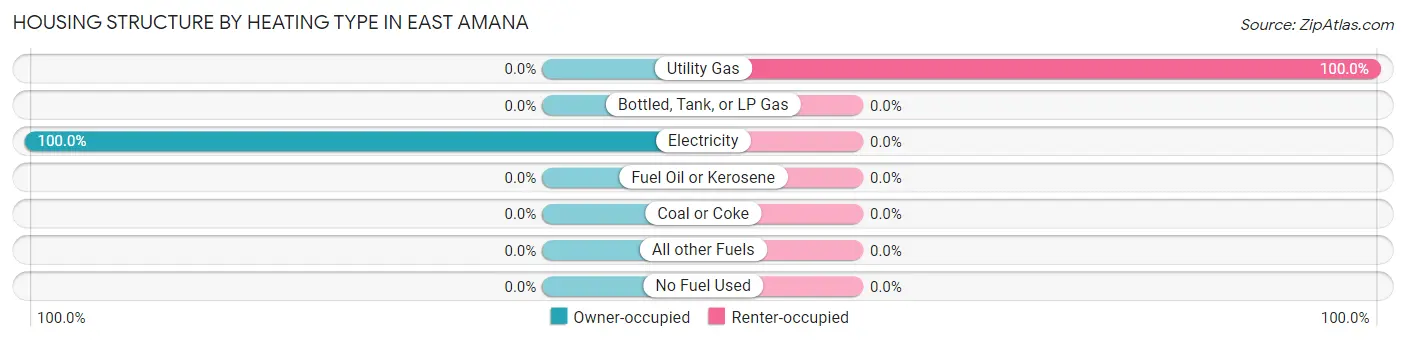
Housing Structure by Heating Type in East Amana
Heating Type
Owner-occupied
Renter-occupied
Utility Gas
0 (0.0%)
10 (100.0%)
Bottled, Tank, or LP Gas
0 (0.0%)
0 (0.0%)
Electricity
4 (100.0%)
0 (0.0%)
Fuel Oil or Kerosene
0 (0.0%)
0 (0.0%)
Coal or Coke
0 (0.0%)
0 (0.0%)
All other Fuels
0 (0.0%)
0 (0.0%)
No Fuel Used
0 (0.0%)
0 (0.0%)
Total
4 (100.0%)
10 (100.0%)
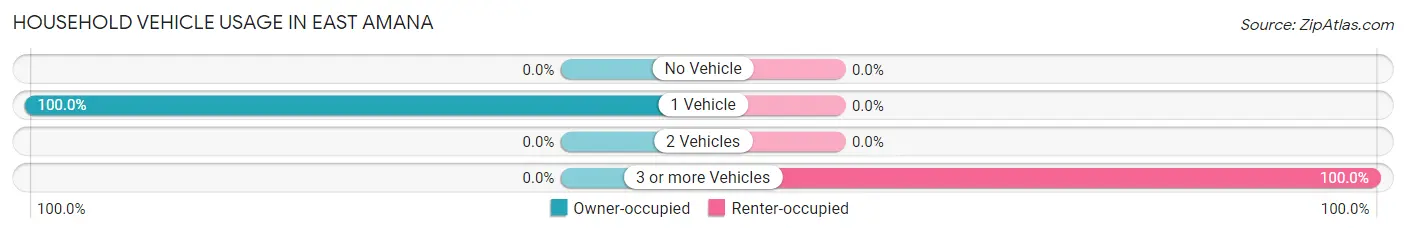
Household Vehicle Usage in East Amana
Vehicles per Household
Owner-occupied
Renter-occupied
No Vehicle
0 (0.0%)
0 (0.0%)
1 Vehicle
4 (100.0%)
0 (0.0%)
2 Vehicles
0 (0.0%)
0 (0.0%)
3 or more Vehicles
0 (0.0%)
10 (100.0%)
Total
4 (100.0%)
10 (100.0%)
Real Estate & Mortgages in East Amana
Real Estate and Mortgage Overview in East Amana
Characteristic
Without Mortgage
With Mortgage
Housing Units
4
0
Median Property Value
-
-
Median Household Income
-
-
Monthly Housing Costs
-
-
Real Estate Taxes
-
-
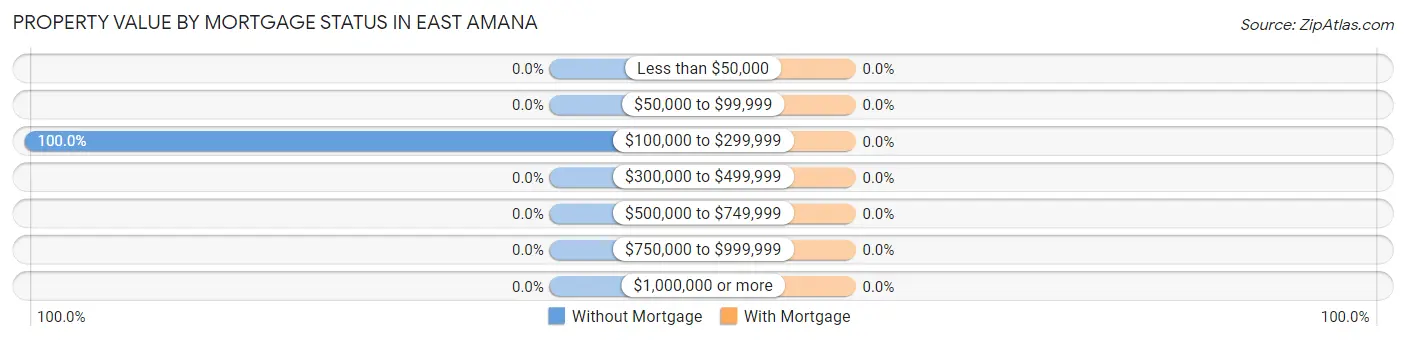
Property Value by Mortgage Status in East Amana
Property Value
Without Mortgage
With Mortgage
Less than $50,000
0 (0.0%)
0 (0.0%)
$50,000 to $99,999
0 (0.0%)
0 (0.0%)
$100,000 to $299,999
4 (100.0%)
0 (0.0%)
$300,000 to $499,999
0 (0.0%)
0 (0.0%)
$500,000 to $749,999
0 (0.0%)
0 (0.0%)
$750,000 to $999,999
0 (0.0%)
0 (0.0%)
$1,000,000 or more
0 (0.0%)
0 (0.0%)
Total
4 (100.0%)
0 (0.0%)
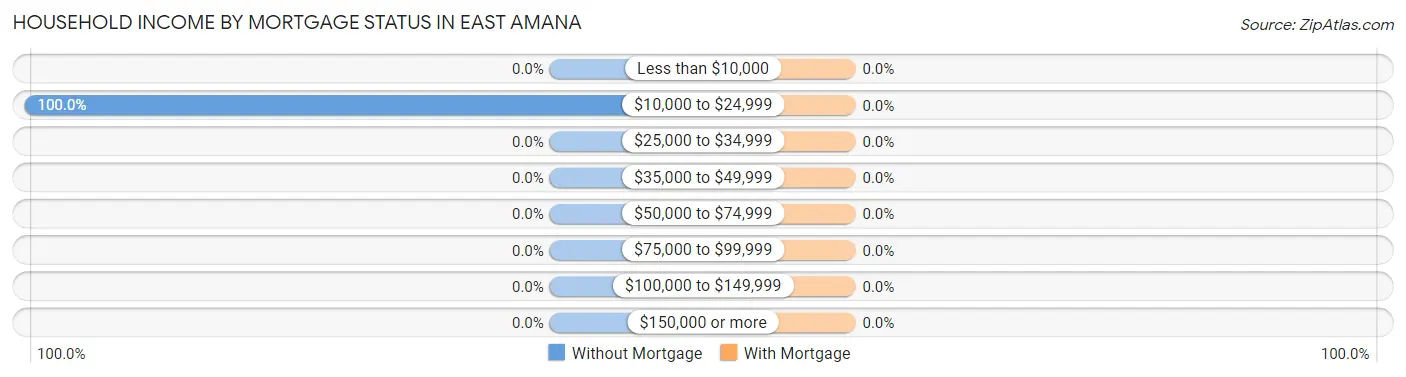
Household Income by Mortgage Status in East Amana
Household Income
Without Mortgage
With Mortgage
Less than $10,000
0 (0.0%)
0 (0.0%)
$10,000 to $24,999
4 (100.0%)
0 (0.0%)
$25,000 to $34,999
0 (0.0%)
0 (0.0%)
$35,000 to $49,999
0 (0.0%)
0 (0.0%)
$50,000 to $74,999
0 (0.0%)
0 (0.0%)
$75,000 to $99,999
0 (0.0%)
0 (0.0%)
$100,000 to $149,999
0 (0.0%)
0 (0.0%)
$150,000 or more
0 (0.0%)
0 (0.0%)
Total
4 (100.0%)
0 (0.0%)
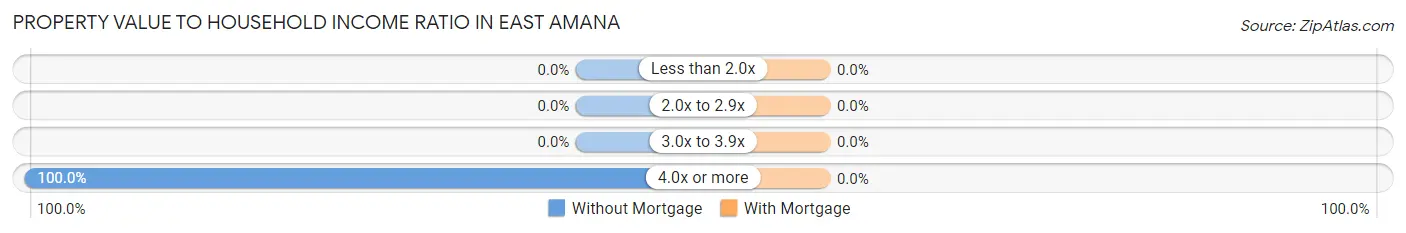
Property Value to Household Income Ratio in East Amana
Value-to-Income Ratio
Without Mortgage
With Mortgage
Less than 2.0x
0 (0.0%)
0 (0.0%)
2.0x to 2.9x
0 (0.0%)
0 (0.0%)
3.0x to 3.9x
0 (0.0%)
0 (0.0%)
4.0x or more
4 (100.0%)
0 (0.0%)
Total
4 (100.0%)
0 (0.0%)
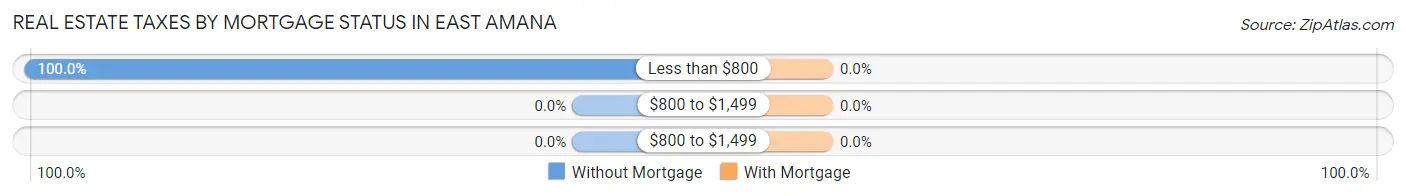
Real Estate Taxes by Mortgage Status in East Amana
Property Taxes
Without Mortgage
With Mortgage
Less than $800
4 (100.0%)
0 (0.0%)
$800 to $1,499
0 (0.0%)
0 (0.0%)
$800 to $1,499
0 (0.0%)
0 (0.0%)
Total
4 (100.0%)
0 (0.0%)
Health & Disability in East Amana
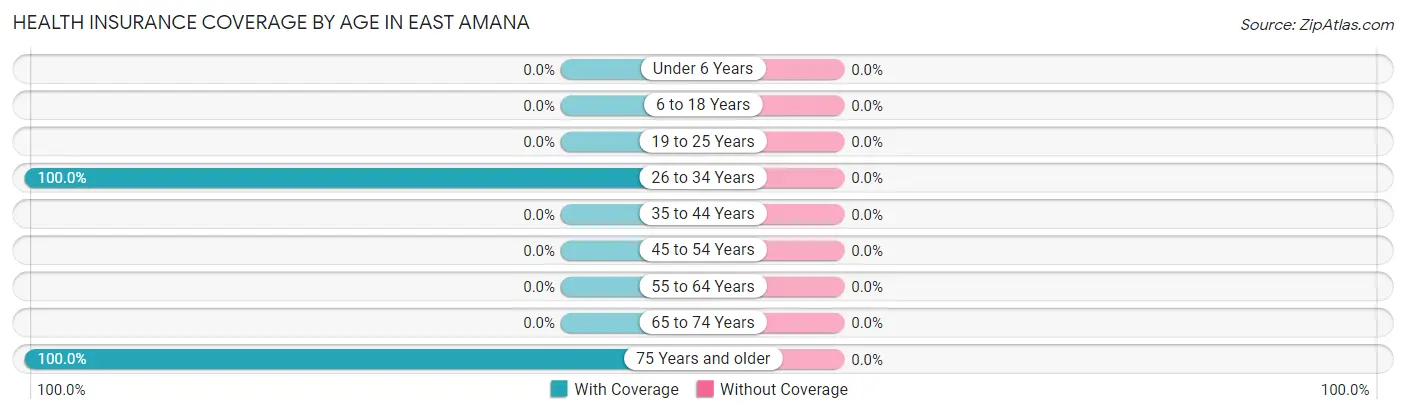
Health Insurance Coverage by Age in East Amana
Age Bracket
With Coverage
Without Coverage
Under 6 Years
0 (0.0%)
0 (0.0%)
6 to 18 Years
0 (0.0%)
0 (0.0%)
19 to 25 Years
0 (0.0%)
0 (0.0%)
26 to 34 Years
31 (100.0%)
0 (0.0%)
35 to 44 Years
0 (0.0%)
0 (0.0%)
45 to 54 Years
0 (0.0%)
0 (0.0%)
55 to 64 Years
0 (0.0%)
0 (0.0%)
65 to 74 Years
0 (0.0%)
0 (0.0%)
75 Years and older
4 (100.0%)
0 (0.0%)
Total
35 (100.0%)
0 (0.0%)
Health Insurance Coverage by Citizenship Status in East Amana
Citizenship Status
With Coverage
Without Coverage
Native Born
0 (0.0%)
0 (0.0%)
Foreign Born, Citizen
0 (0.0%)
0 (0.0%)
Foreign Born, not a Citizen
0 (0.0%)
0 (0.0%)
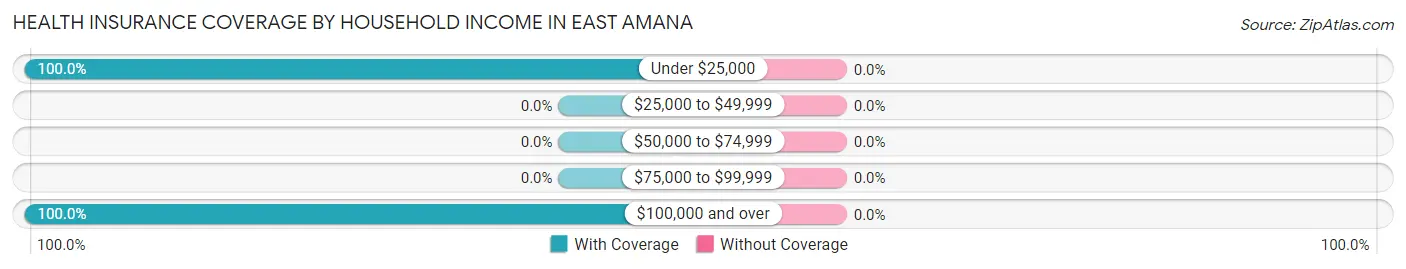
Health Insurance Coverage by Household Income in East Amana
Household Income
With Coverage
Without Coverage
Under $25,000
4 (100.0%)
0 (0.0%)
$25,000 to $49,999
0 (0.0%)
0 (0.0%)
$50,000 to $74,999
0 (0.0%)
0 (0.0%)
$75,000 to $99,999
0 (0.0%)
0 (0.0%)
$100,000 and over
31 (100.0%)
0 (0.0%)
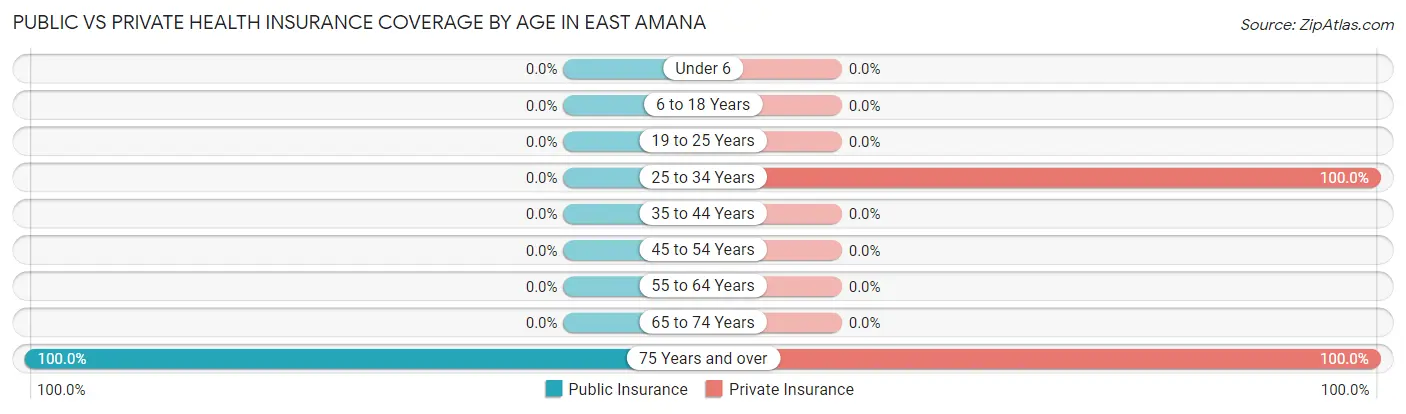
Public vs Private Health Insurance Coverage by Age in East Amana
Age Bracket
Public Insurance
Private Insurance
Under 6
0 (0.0%)
0 (0.0%)
6 to 18 Years
0 (0.0%)
0 (0.0%)
19 to 25 Years
0 (0.0%)
0 (0.0%)
25 to 34 Years
0 (0.0%)
31 (100.0%)
35 to 44 Years
0 (0.0%)
0 (0.0%)
45 to 54 Years
0 (0.0%)
0 (0.0%)
55 to 64 Years
0 (0.0%)
0 (0.0%)
65 to 74 Years
0 (0.0%)
0 (0.0%)
75 Years and over
4 (100.0%)
4 (100.0%)
Total
4 (11.4%)
35 (100.0%)
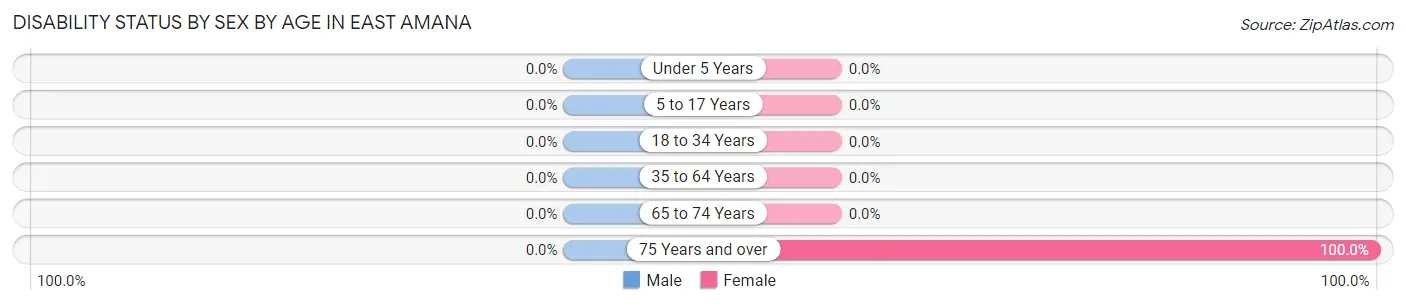
Disability Status by Sex by Age in East Amana
Age Bracket
Male
Female
Under 5 Years
0 (0.0%)
0 (0.0%)
5 to 17 Years
0 (0.0%)
0 (0.0%)
18 to 34 Years
0 (0.0%)
0 (0.0%)
35 to 64 Years
0 (0.0%)
0 (0.0%)
65 to 74 Years
0 (0.0%)
0 (0.0%)
75 Years and over
0 (0.0%)
4 (100.0%)
Disability Class by Sex by Age in East Amana
Disability Class: Hearing Difficulty
Age Bracket
Male
Female
Under 5 Years
0 (0.0%)
0 (0.0%)
5 to 17 Years
0 (0.0%)
0 (0.0%)
18 to 34 Years
0 (0.0%)
0 (0.0%)
35 to 64 Years
0 (0.0%)
0 (0.0%)
65 to 74 Years
0 (0.0%)
0 (0.0%)
75 Years and over
0 (0.0%)
0 (0.0%)
Disability Class: Vision Difficulty
Age Bracket
Male
Female
Under 5 Years
0 (0.0%)
0 (0.0%)
5 to 17 Years
0 (0.0%)
0 (0.0%)
18 to 34 Years
0 (0.0%)
0 (0.0%)
35 to 64 Years
0 (0.0%)
0 (0.0%)
65 to 74 Years
0 (0.0%)
0 (0.0%)
75 Years and over
0 (0.0%)
0 (0.0%)
Disability Class: Cognitive Difficulty
Age Bracket
Male
Female
5 to 17 Years
0 (0.0%)
0 (0.0%)
18 to 34 Years
0 (0.0%)
0 (0.0%)
35 to 64 Years
0 (0.0%)
0 (0.0%)
65 to 74 Years
0 (0.0%)
0 (0.0%)
75 Years and over
0 (0.0%)
0 (0.0%)
Disability Class: Ambulatory Difficulty
Age Bracket
Male
Female
5 to 17 Years
0 (0.0%)
0 (0.0%)
18 to 34 Years
0 (0.0%)
0 (0.0%)
35 to 64 Years
0 (0.0%)
0 (0.0%)
65 to 74 Years
0 (0.0%)
0 (0.0%)
75 Years and over
0 (0.0%)
0 (0.0%)
Disability Class: Self-Care Difficulty
Age Bracket
Male
Female
5 to 17 Years
0 (0.0%)
0 (0.0%)
18 to 34 Years
0 (0.0%)
0 (0.0%)
35 to 64 Years
0 (0.0%)
0 (0.0%)
65 to 74 Years
0 (0.0%)
0 (0.0%)
75 Years and over
0 (0.0%)
0 (0.0%)
Technology Access in East Amana
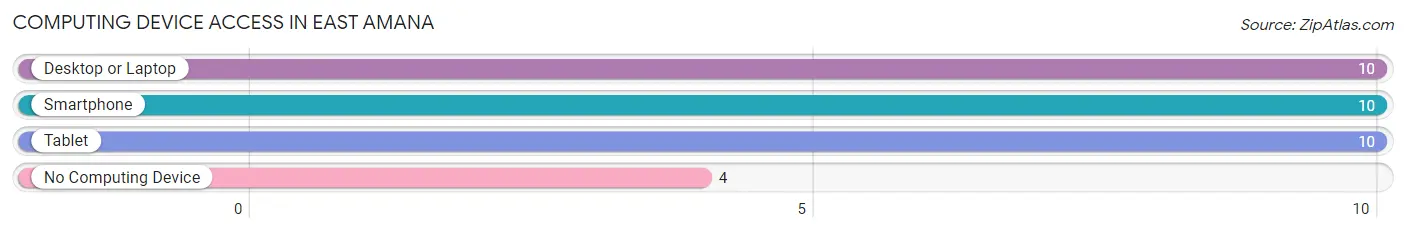
Computing Device Access in East Amana
Device Type
# Households
% Households
Desktop or Laptop
10
71.4%
Smartphone
10
71.4%
Tablet
10
71.4%
No Computing Device
4
28.6%
Total
14
100.0%
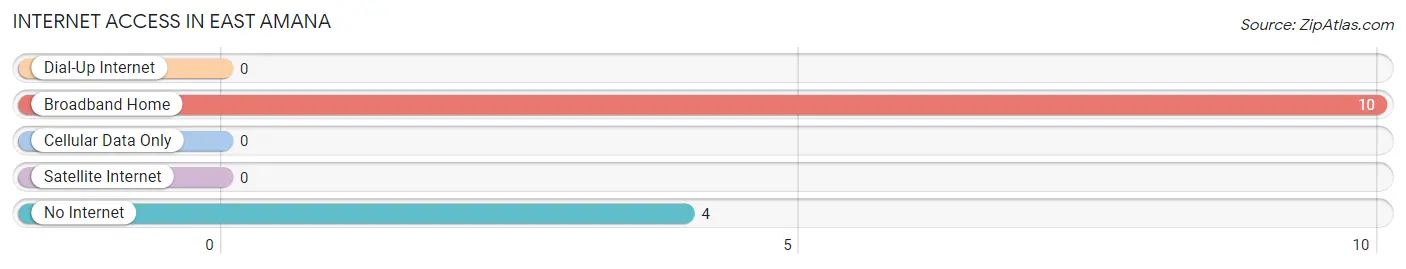
Internet Access in East Amana
Internet Type
# Households
% Households
Dial-Up Internet
0
0.0%
Broadband Home
10
71.4%
Cellular Data Only
0
0.0%
Satellite Internet
0
0.0%
No Internet
4
28.6%
Total
14
100.0%
East Amana Summary
Amana, Iowa is a small town located in the eastern part of the state, about 20 miles south of Cedar Rapids. It is part of the Amana Colonies, a group of seven villages that were founded by German immigrants in the mid-1800s. The Amana Colonies are a National Historic Landmark and are known for their unique culture and architecture.
History
The Amana Colonies were founded in 1855 by a group of German immigrants who were seeking religious freedom. The group was part of a religious movement known as the Community of True Inspiration, which was founded in 1714 in Germany. The group was led by a man named Christian Metz, who was known as the “Inspirer”. The group believed in communal living and shared all of their possessions.
The Amana Colonies were established in Iowa in 1855 and were made up of seven villages: Amana, East Amana, High Amana, Middle Amana, South Amana, West Amana, and Homestead. The villages were built around a central meeting house, which was used for religious services and community gatherings. The villages were self-sufficient and had their own schools, churches, stores, and workshops.
The Amana Colonies were a successful and prosperous community for many years. However, in 1932, the group decided to dissolve the communal system and adopt a more modern way of life. The villages were divided into individual family farms and businesses. The Amana Colonies are still a thriving community today and are known for their unique culture and architecture.
Geography
East Amana is located in eastern Iowa, about 20 miles south of Cedar Rapids. It is part of the Amana Colonies, which are located in Iowa County. The village is situated on the banks of the Iowa River and is surrounded by rolling hills and farmland. The climate in East Amana is humid continental, with hot summers and cold winters.
Economy
The economy of East Amana is largely based on agriculture and tourism. The village is home to several small businesses, including a winery, a brewery, a cheese shop, and a bakery. The Amana Colonies are a popular tourist destination, and the village is home to several bed and breakfasts, restaurants, and shops.
Demographics
As of the 2010 census, the population of East Amana was 545. The racial makeup of the village was 97.3% White, 0.2% African American, 0.4% Native American, 0.4% Asian, 0.2% from other races, and 1.5% from two or more races. The median household income was $45,000, and the median family income was $50,000. The per capita income was $20,000.
Common Questions
What is Per Capita Income in East Amana?
Per Capita income in East Amana is $47,640.
What is Inequality or Gini Index in East Amana?
Inequality or Gini Index in East Amana is 0.25.
What is the Total Population of East Amana?
Total Population of East Amana is 35.
What is the Total Male Population of East Amana?
Total Male Population of East Amana is 19.
What is the Total Female Population of East Amana?
Total Female Population of East Amana is 16.
What is the Ratio of Males per 100 Females in East Amana?
There are 118.75 Males per 100 Females in East Amana.
What is the Ratio of Females per 100 Males in East Amana?
There are 84.21 Females per 100 Males in East Amana.
What is the Median Population Age in East Amana?
Median Population Age in East Amana is 26.8 Years.
What is the Average Household Size in East Amana
Average Household Size in East Amana is 2.5 People.
How Large is the Labor Force in East Amana?
There are 31 People in the Labor Forcein in East Amana.
What is the Percentage of People in the Labor Force in East Amana?
88.6% of People are in the Labor Force in East Amana.
Report Title
Report Link
HTML Copy & Paste Link
Social Media
Copy and paste the folowing code into any webpage where you would like this interactive chart to display