Geneva, GA Map & Demographics
Geneva Map
Geneva Overview
$29,713
PER CAPITA INCOME
$75,417
AVG FAMILY INCOME
$76,111
AVG HOUSEHOLD INCOME
23.9%
WAGE / INCOME GAP [ % ]
76.1¢/ $1
WAGE / INCOME GAP [ $ ]
0.33
INEQUALITY / GINI INDEX
140
TOTAL POPULATION
76
MALE POPULATION
64
FEMALE POPULATION
118.75
MALES / 100 FEMALES
84.21
FEMALES / 100 MALES
56.9
MEDIAN AGE
2.4
AVG FAMILY SIZE
2.3
AVG HOUSEHOLD SIZE
48
LABOR FORCE [ PEOPLE ]
40.0%
PERCENT IN LABOR FORCE
Geneva Zip Codes
Geneva Area Codes
Income in Geneva
Income Overview in Geneva
Per Capita Income in Geneva is $29,713, while median incomes of families and households are $75,417 and $76,111 respectively.
| Characteristic | Number | Measure |
| Per Capita Income | 140 | $29,713 |
| Median Family Income | 51 | $75,417 |
| Mean Family Income | 51 | $74,408 |
| Median Household Income | 62 | $76,111 |
| Mean Household Income | 62 | $68,671 |
| Income Deficit | 51 | $0 |
| Wage / Income Gap (%) | 140 | 23.94% |
| Wage / Income Gap ($) | 140 | 76.06¢ per $1 |
| Gini / Inequality Index | 140 | 0.33 |
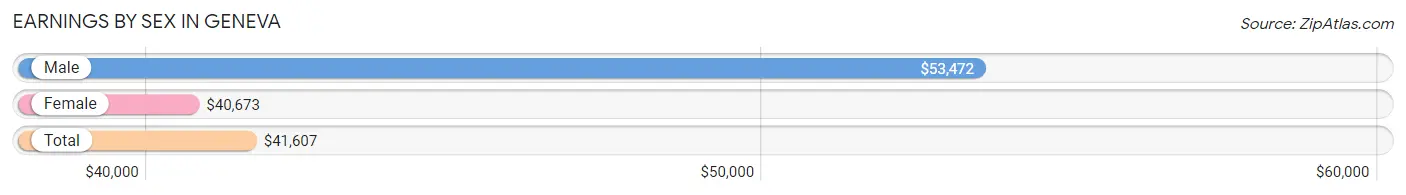
Earnings by Sex in Geneva
Average Earnings in Geneva are $41,607, $53,472 for men and $40,673 for women, a difference of 23.9%.
| Sex | Number | Average Earnings |
| Male | 25 (52.1%) | $53,472 |
| Female | 23 (47.9%) | $40,673 |
| Total | 48 (100.0%) | $41,607 |
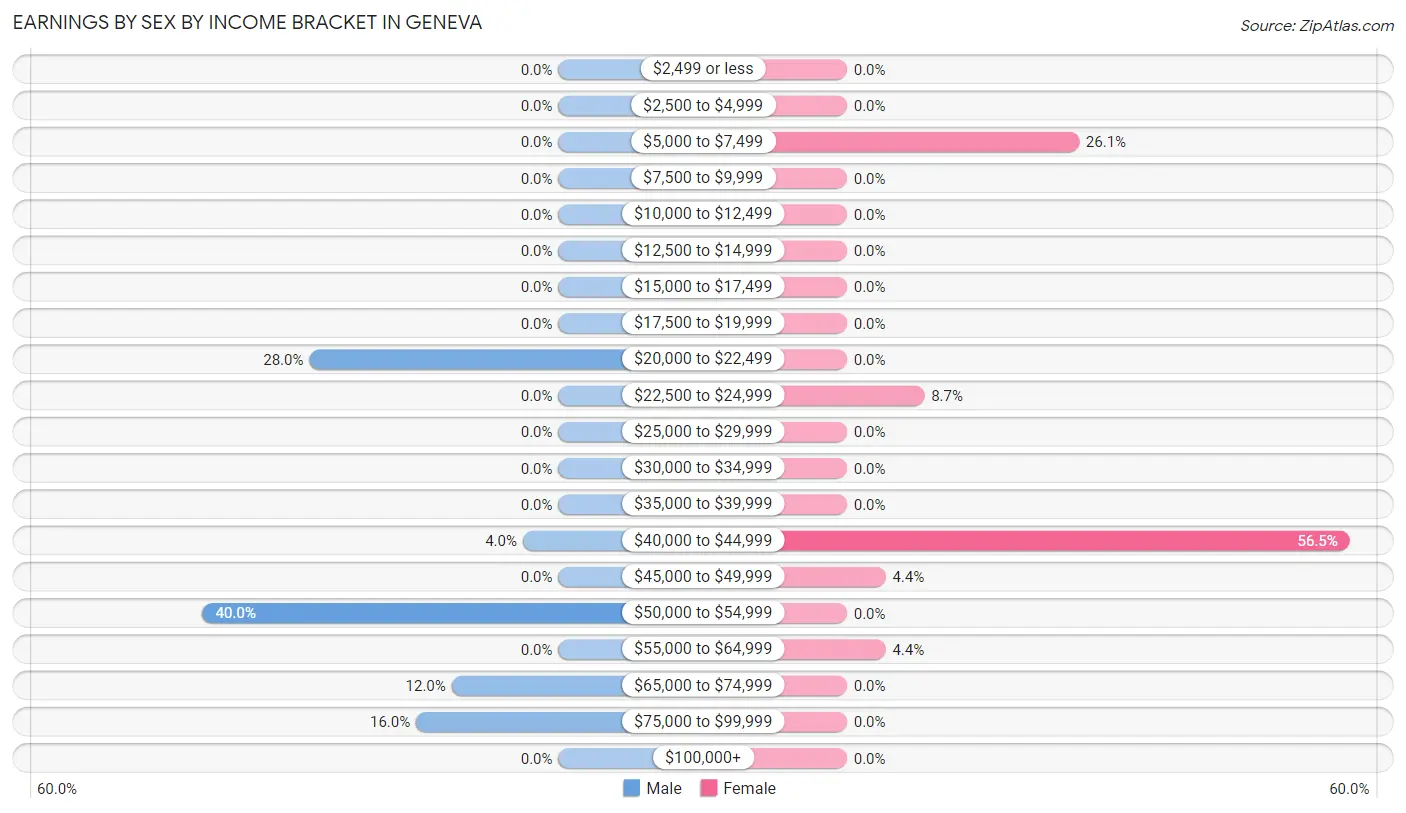
Earnings by Sex by Income Bracket in Geneva
The most common earnings brackets in Geneva are $50,000 to $54,999 for men (10 | 40.0%) and $40,000 to $44,999 for women (13 | 56.5%).
| Income | Male | Female |
| $2,499 or less | 0 (0.0%) | 0 (0.0%) |
| $2,500 to $4,999 | 0 (0.0%) | 0 (0.0%) |
| $5,000 to $7,499 | 0 (0.0%) | 6 (26.1%) |
| $7,500 to $9,999 | 0 (0.0%) | 0 (0.0%) |
| $10,000 to $12,499 | 0 (0.0%) | 0 (0.0%) |
| $12,500 to $14,999 | 0 (0.0%) | 0 (0.0%) |
| $15,000 to $17,499 | 0 (0.0%) | 0 (0.0%) |
| $17,500 to $19,999 | 0 (0.0%) | 0 (0.0%) |
| $20,000 to $22,499 | 7 (28.0%) | 0 (0.0%) |
| $22,500 to $24,999 | 0 (0.0%) | 2 (8.7%) |
| $25,000 to $29,999 | 0 (0.0%) | 0 (0.0%) |
| $30,000 to $34,999 | 0 (0.0%) | 0 (0.0%) |
| $35,000 to $39,999 | 0 (0.0%) | 0 (0.0%) |
| $40,000 to $44,999 | 1 (4.0%) | 13 (56.5%) |
| $45,000 to $49,999 | 0 (0.0%) | 1 (4.3%) |
| $50,000 to $54,999 | 10 (40.0%) | 0 (0.0%) |
| $55,000 to $64,999 | 0 (0.0%) | 1 (4.3%) |
| $65,000 to $74,999 | 3 (12.0%) | 0 (0.0%) |
| $75,000 to $99,999 | 4 (16.0%) | 0 (0.0%) |
| $100,000+ | 0 (0.0%) | 0 (0.0%) |
| Total | 25 (100.0%) | 23 (100.0%) |
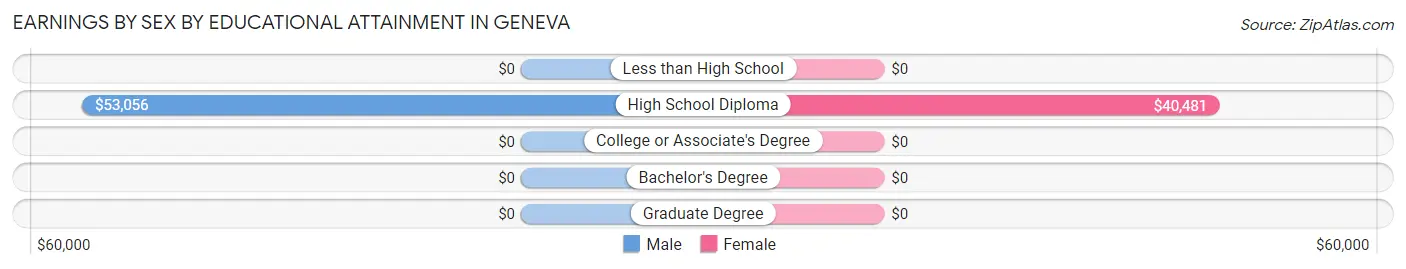
Earnings by Sex by Educational Attainment in Geneva
Average earnings in Geneva are $53,472 for men and $40,673 for women, a difference of 23.9%. Men with an educational attainment of high school diploma enjoy the highest average annual earnings of $53,056, while those with high school diploma education earn the least with $53,056. Women with an educational attainment of high school diploma earn the most with the average annual earnings of $40,481, while those with high school diploma education have the smallest earnings of $40,481.
| Educational Attainment | Male Income | Female Income |
| Less than High School | - | - |
| High School Diploma | $53,056 | $40,481 |
| College or Associate's Degree | - | - |
| Bachelor's Degree | - | - |
| Graduate Degree | - | - |
| Total | $53,472 | $40,673 |
Family Income in Geneva
Family Income Brackets in Geneva
According to the Geneva family income data, there are 15 families falling into the $100,000 to $149,999 income range, which is the most common income bracket and makes up 29.4% of all families.
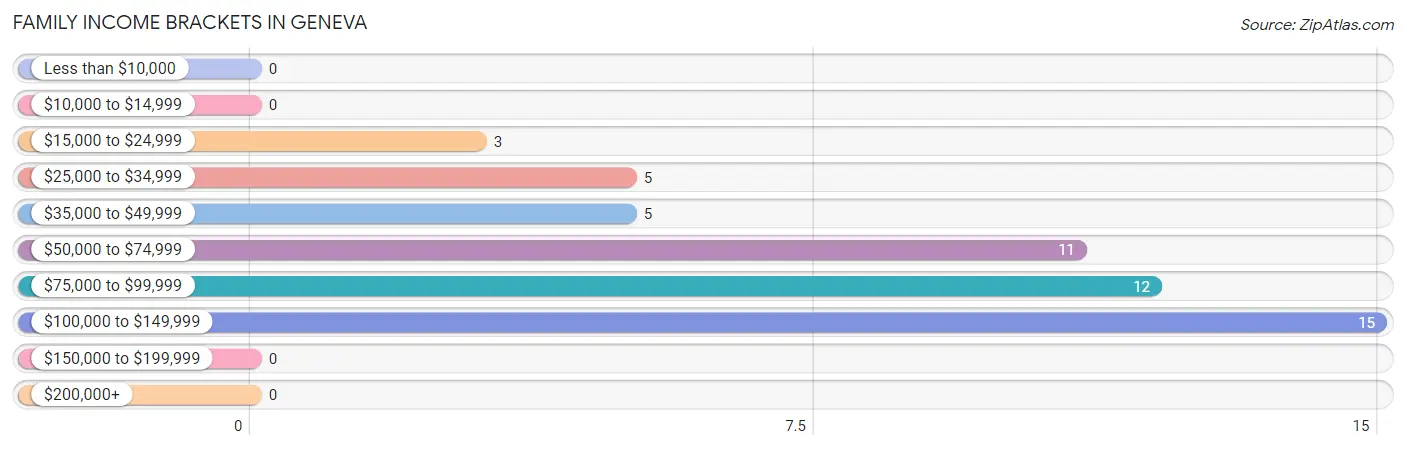
| Income Bracket | # Families | % Families |
| Less than $10,000 | 0 | 0.0% |
| $10,000 to $14,999 | 0 | 0.0% |
| $15,000 to $24,999 | 3 | 5.9% |
| $25,000 to $34,999 | 5 | 9.8% |
| $35,000 to $49,999 | 5 | 9.8% |
| $50,000 to $74,999 | 11 | 21.6% |
| $75,000 to $99,999 | 12 | 23.5% |
| $100,000 to $149,999 | 15 | 29.4% |
| $150,000 to $199,999 | 0 | 0.0% |
| $200,000+ | 0 | 0.0% |
Family Income by Famaliy Size in Geneva
2-person families (30 | 58.8%) account for the highest median family income in Geneva with $64,688 per family, while 2-person families (30 | 58.8%) have the highest median income of $32,344 per family member.
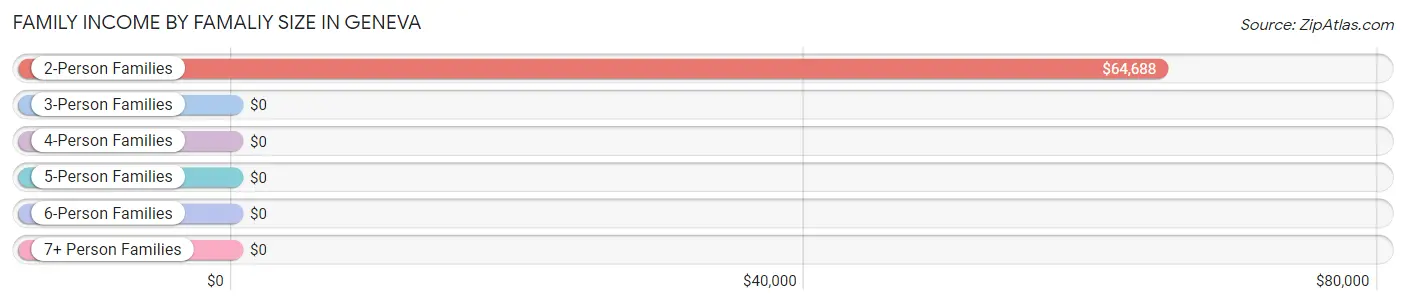
| Income Bracket | # Families | Median Income |
| 2-Person Families | 30 (58.8%) | $64,688 |
| 3-Person Families | 11 (21.6%) | $0 |
| 4-Person Families | 10 (19.6%) | $0 |
| 5-Person Families | 0 (0.0%) | $0 |
| 6-Person Families | 0 (0.0%) | $0 |
| 7+ Person Families | 0 (0.0%) | $0 |
| Total | 51 (100.0%) | $75,417 |
Family Income by Number of Earners in Geneva
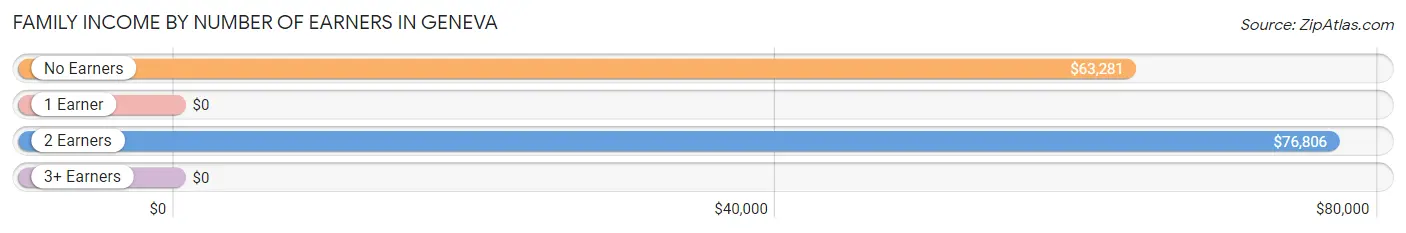
| Number of Earners | # Families | Median Income |
| No Earners | 31 (60.8%) | $63,281 |
| 1 Earner | 1 (2.0%) | $0 |
| 2 Earners | 19 (37.2%) | $76,806 |
| 3+ Earners | 0 (0.0%) | $0 |
| Total | 51 (100.0%) | $75,417 |
Household Income in Geneva
Household Income Brackets in Geneva
With 23 households falling in the category, the $100,000 to $149,999 income range is the most frequent in Geneva, accounting for 37.1% of all households.
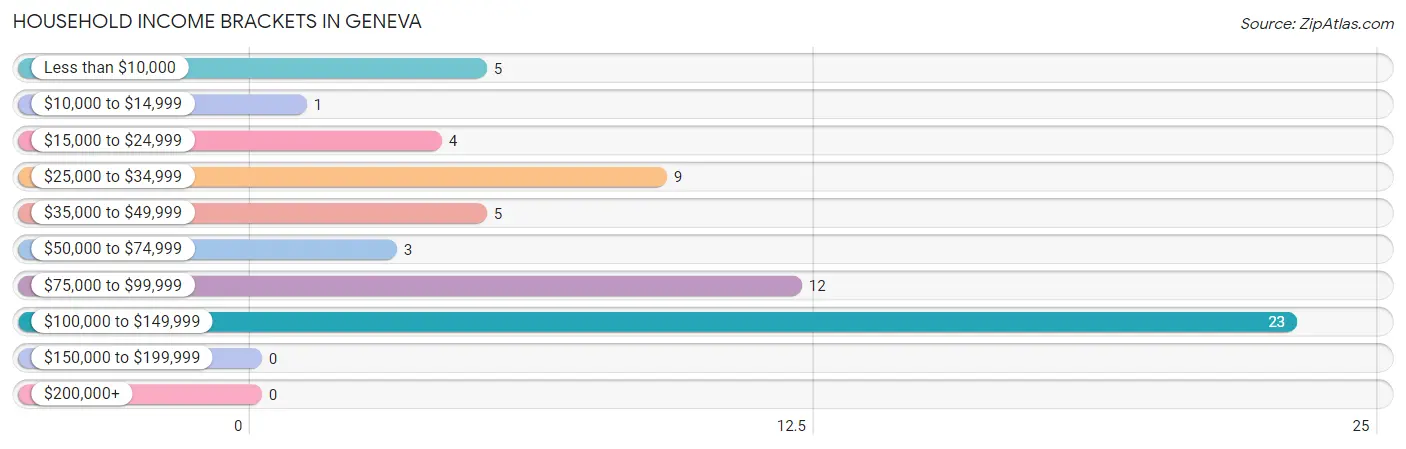
| Income Bracket | # Households | % Households |
| Less than $10,000 | 5 | 8.1% |
| $10,000 to $14,999 | 1 | 1.6% |
| $15,000 to $24,999 | 4 | 6.5% |
| $25,000 to $34,999 | 9 | 14.5% |
| $35,000 to $49,999 | 5 | 8.1% |
| $50,000 to $74,999 | 3 | 4.8% |
| $75,000 to $99,999 | 12 | 19.4% |
| $100,000 to $149,999 | 23 | 37.1% |
| $150,000 to $199,999 | 0 | 0.0% |
| $200,000+ | 0 | 0.0% |
Household Income by Householder Age in Geneva
The median household income in Geneva is $76,111, with the highest median household income of $106,406 found in the 25 to 44 years age bracket for the primary householder. A total of 15 households (24.2%) fall into this category. Meanwhile, the 15 to 24 years age bracket for the primary householder has the lowest median household income of $0, with 1 households (1.6%) in this group.
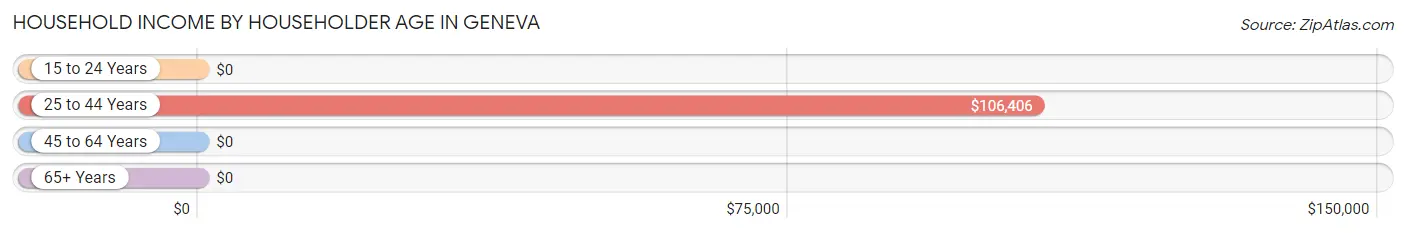
| Income Bracket | # Households | Median Income |
| 15 to 24 Years | 1 (1.6%) | $0 |
| 25 to 44 Years | 15 (24.2%) | $106,406 |
| 45 to 64 Years | 18 (29.0%) | $0 |
| 65+ Years | 28 (45.2%) | $0 |
| Total | 62 (100.0%) | $76,111 |
Poverty in Geneva
Income Below Poverty by Sex and Age in Geneva
With 15.8% poverty level for males and 23.4% for females among the residents of Geneva, 6 to 11 year old males and 45 to 54 year old females are the most vulnerable to poverty, with 3 males (100.0%) and 3 females (100.0%) in their respective age groups living below the poverty level.
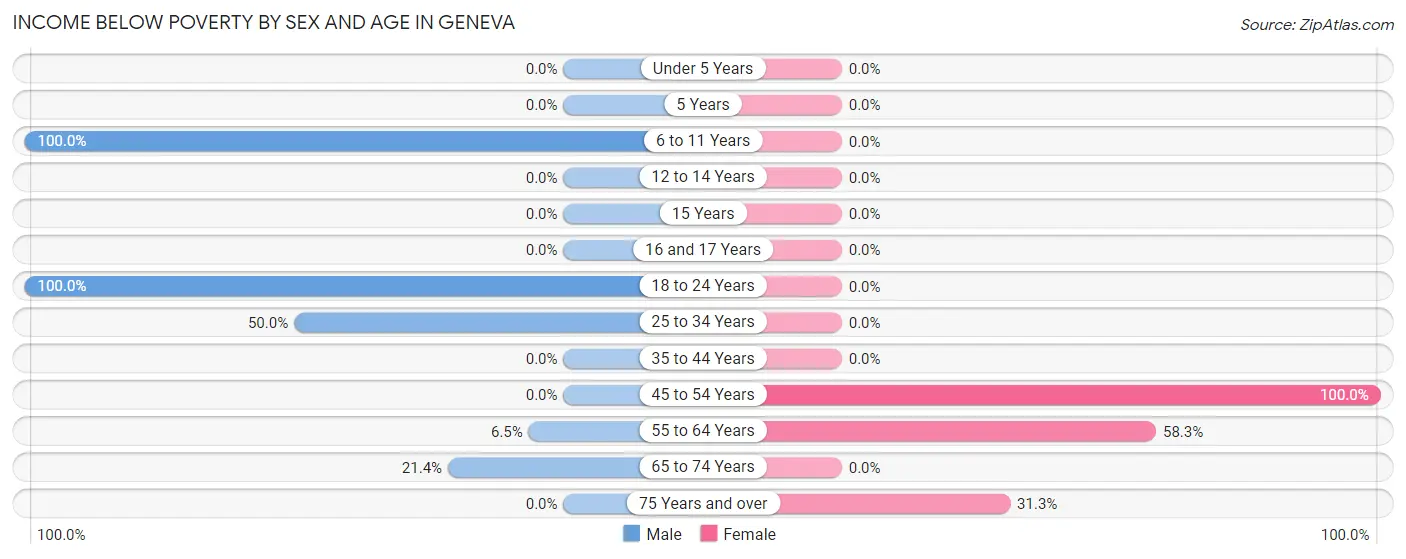
| Age Bracket | Male | Female |
| Under 5 Years | 0 (0.0%) | 0 (0.0%) |
| 5 Years | 0 (0.0%) | 0 (0.0%) |
| 6 to 11 Years | 3 (100.0%) | 0 (0.0%) |
| 12 to 14 Years | 0 (0.0%) | 0 (0.0%) |
| 15 Years | 0 (0.0%) | 0 (0.0%) |
| 16 and 17 Years | 0 (0.0%) | 0 (0.0%) |
| 18 to 24 Years | 1 (100.0%) | 0 (0.0%) |
| 25 to 34 Years | 3 (50.0%) | 0 (0.0%) |
| 35 to 44 Years | 0 (0.0%) | 0 (0.0%) |
| 45 to 54 Years | 0 (0.0%) | 3 (100.0%) |
| 55 to 64 Years | 2 (6.5%) | 7 (58.3%) |
| 65 to 74 Years | 3 (21.4%) | 0 (0.0%) |
| 75 Years and over | 0 (0.0%) | 5 (31.2%) |
| Total | 12 (15.8%) | 15 (23.4%) |
Income Above Poverty by Sex and Age in Geneva
According to the poverty statistics in Geneva, males aged under 5 years and females aged 6 to 11 years are the age groups that are most secure financially, with 100.0% of males and 100.0% of females in these age groups living above the poverty line.
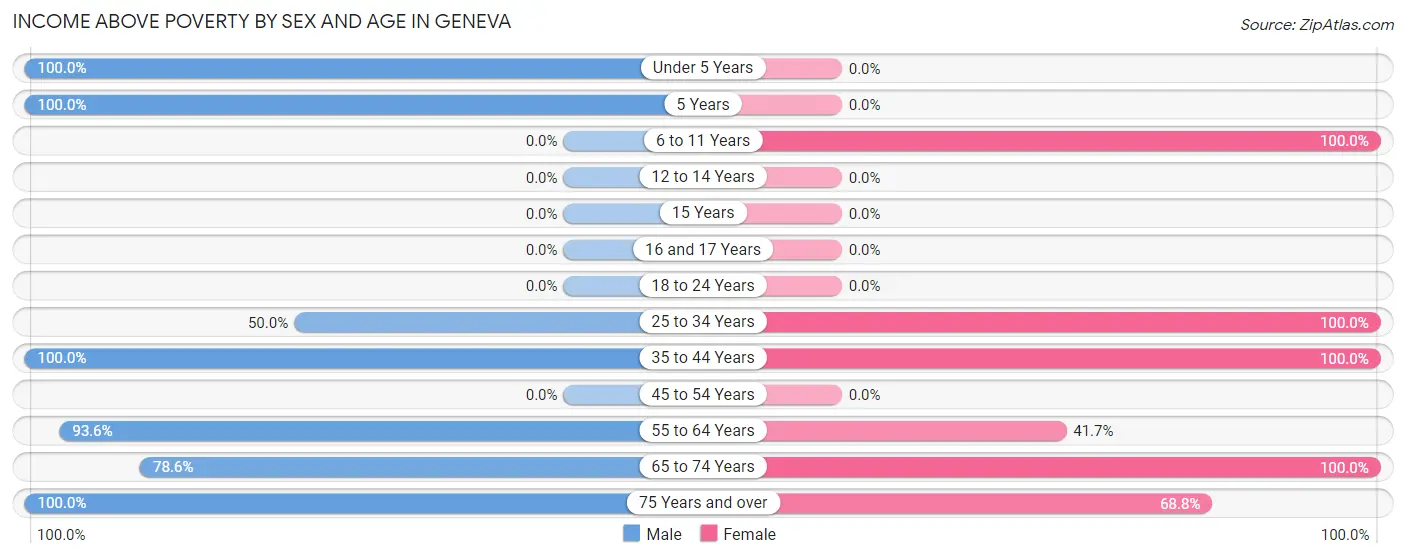
| Age Bracket | Male | Female |
| Under 5 Years | 4 (100.0%) | 0 (0.0%) |
| 5 Years | 2 (100.0%) | 0 (0.0%) |
| 6 to 11 Years | 0 (0.0%) | 11 (100.0%) |
| 12 to 14 Years | 0 (0.0%) | 0 (0.0%) |
| 15 Years | 0 (0.0%) | 0 (0.0%) |
| 16 and 17 Years | 0 (0.0%) | 0 (0.0%) |
| 18 to 24 Years | 0 (0.0%) | 0 (0.0%) |
| 25 to 34 Years | 3 (50.0%) | 16 (100.0%) |
| 35 to 44 Years | 14 (100.0%) | 4 (100.0%) |
| 45 to 54 Years | 0 (0.0%) | 0 (0.0%) |
| 55 to 64 Years | 29 (93.5%) | 5 (41.7%) |
| 65 to 74 Years | 11 (78.6%) | 2 (100.0%) |
| 75 Years and over | 1 (100.0%) | 11 (68.8%) |
| Total | 64 (84.2%) | 49 (76.6%) |
Income Below Poverty Among Married-Couple Families in Geneva
The poverty statistics for married-couple families in Geneva show that 18.8% or 3 of the total 16 families live below the poverty line. Families with no children have the highest poverty rate of 25.0%, comprising of 3 families. On the other hand, families with 1 or 2 children have the lowest poverty rate of 0.0%, which includes 0 families.
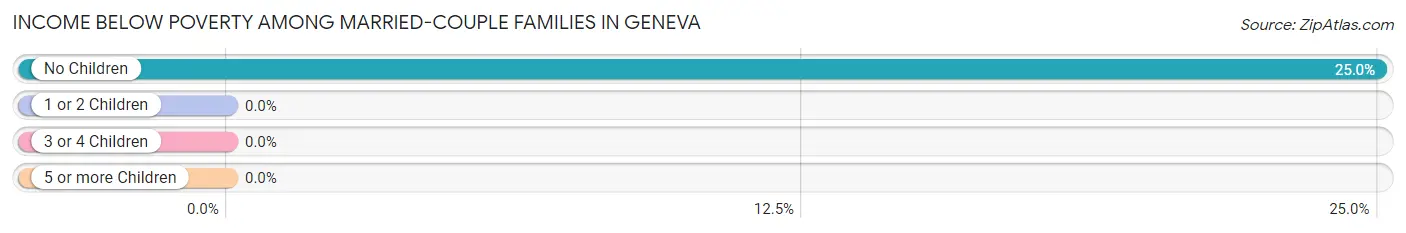
| Children | Above Poverty | Below Poverty |
| No Children | 9 (75.0%) | 3 (25.0%) |
| 1 or 2 Children | 4 (100.0%) | 0 (0.0%) |
| 3 or 4 Children | 0 (0.0%) | 0 (0.0%) |
| 5 or more Children | 0 (0.0%) | 0 (0.0%) |
| Total | 13 (81.2%) | 3 (18.8%) |
Income Below Poverty Among Single-Parent Households in Geneva
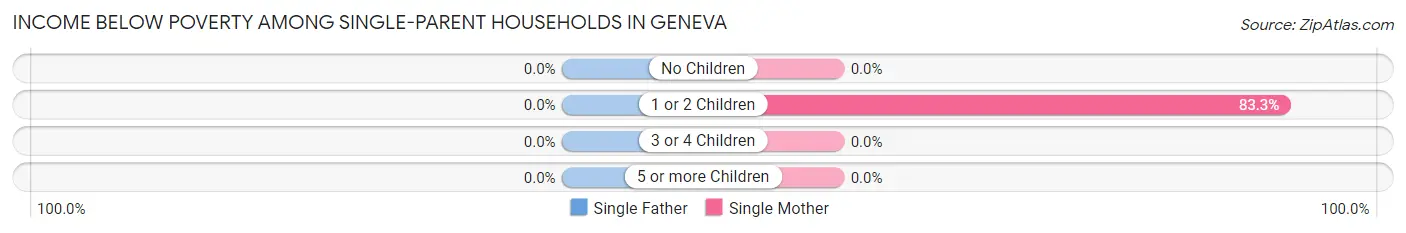
| Children | Single Father | Single Mother |
| No Children | 0 (0.0%) | 0 (0.0%) |
| 1 or 2 Children | 0 (0.0%) | 5 (83.3%) |
| 3 or 4 Children | 0 (0.0%) | 0 (0.0%) |
| 5 or more Children | 0 (0.0%) | 0 (0.0%) |
| Total | 0 (0.0%) | 5 (27.8%) |
Income Below Poverty Among Married-Couple vs Single-Parent Households in Geneva
The poverty data for Geneva shows that 3 of the married-couple family households (18.8%) and 5 of the single-parent households (14.3%) are living below the poverty level. Within the married-couple family households, those with no children have the highest poverty rate, with 3 households (25.0%) falling below the poverty line. Among the single-parent households, those with 1 or 2 children have the highest poverty rate, with 5 household (35.7%) living below poverty.
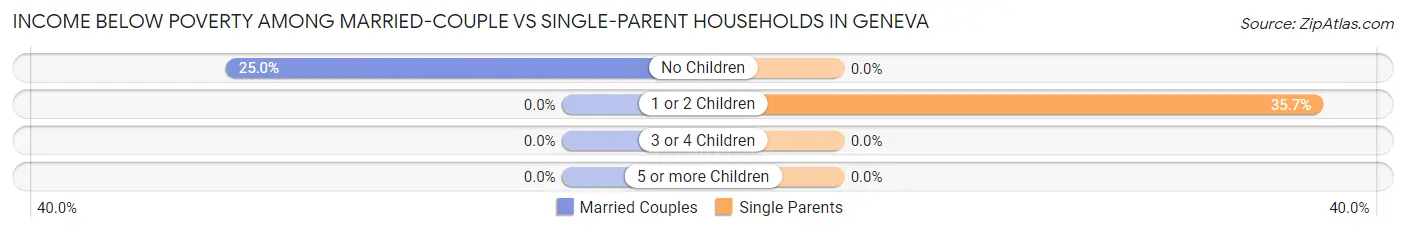
| Children | Married-Couple Families | Single-Parent Households |
| No Children | 3 (25.0%) | 0 (0.0%) |
| 1 or 2 Children | 0 (0.0%) | 5 (35.7%) |
| 3 or 4 Children | 0 (0.0%) | 0 (0.0%) |
| 5 or more Children | 0 (0.0%) | 0 (0.0%) |
| Total | 3 (18.8%) | 5 (14.3%) |
Race in Geneva
The most populous races in Geneva are Black / African American (72 | 51.4%), and White / Caucasian (68 | 48.6%).
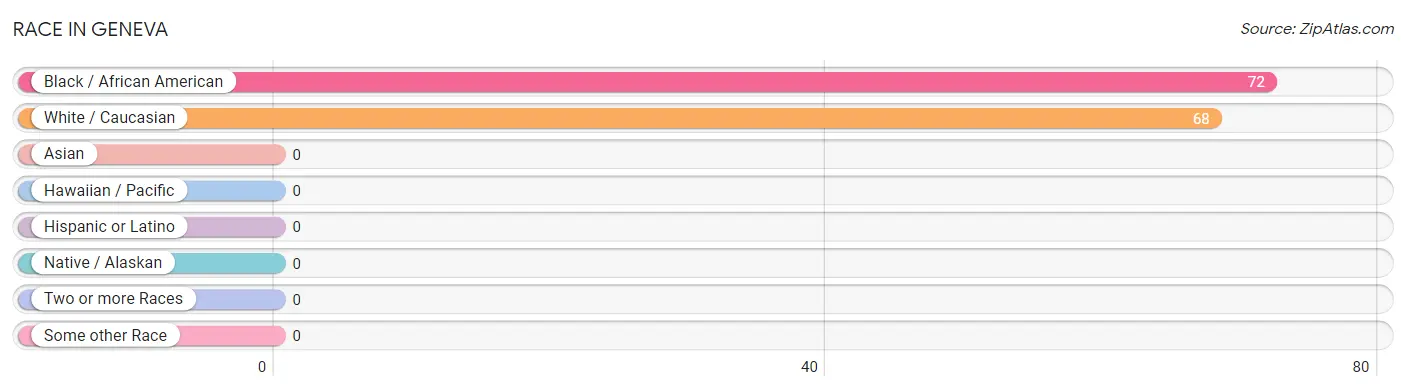
| Race | # Population | % Population |
| Asian | 0 | 0.0% |
| Black / African American | 72 | 51.4% |
| Hawaiian / Pacific | 0 | 0.0% |
| Hispanic or Latino | 0 | 0.0% |
| Native / Alaskan | 0 | 0.0% |
| White / Caucasian | 68 | 48.6% |
| Two or more Races | 0 | 0.0% |
| Some other Race | 0 | 0.0% |
| Total | 140 | 100.0% |
Ancestry in Geneva
The most populous ancestries reported in Geneva are American (26 | 18.6%), European (6 | 4.3%), German (5 | 3.6%), Irish (5 | 3.6%), and English (4 | 2.9%), together accounting for 32.9% of all Geneva residents.
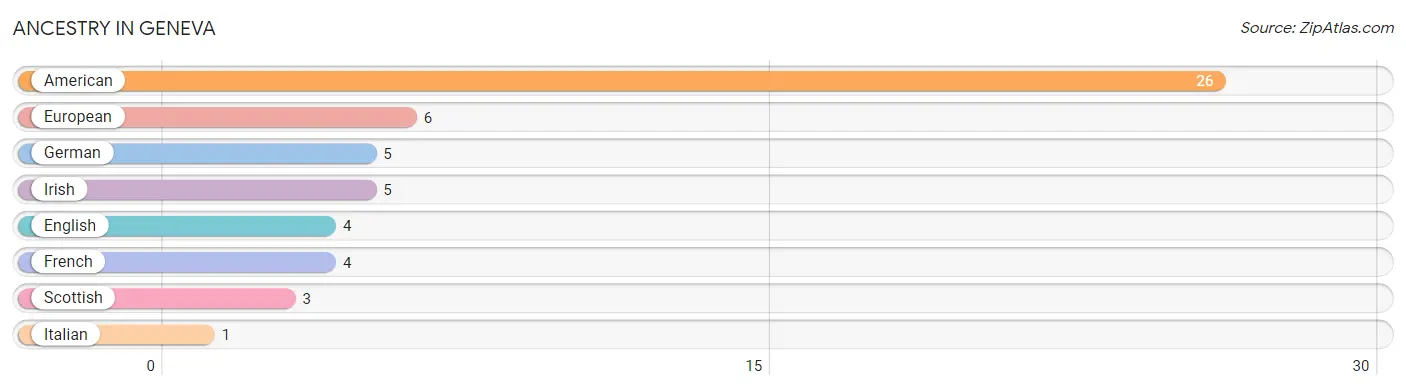
| Ancestry | # Population | % Population |
| American | 26 | 18.6% |
| English | 4 | 2.9% |
| European | 6 | 4.3% |
| French | 4 | 2.9% |
| German | 5 | 3.6% |
| Irish | 5 | 3.6% |
| Italian | 1 | 0.7% |
| Scottish | 3 | 2.1% | View All 8 Rows |
Immigrants in Geneva

| Immigration Origin | # Population | % Population | View All 0 Rows |
Sex and Age in Geneva
Sex and Age in Geneva
The most populous age groups in Geneva are 60 to 64 Years (17 | 22.4%) for men and 5 to 9 Years (11 | 17.2%) for women.
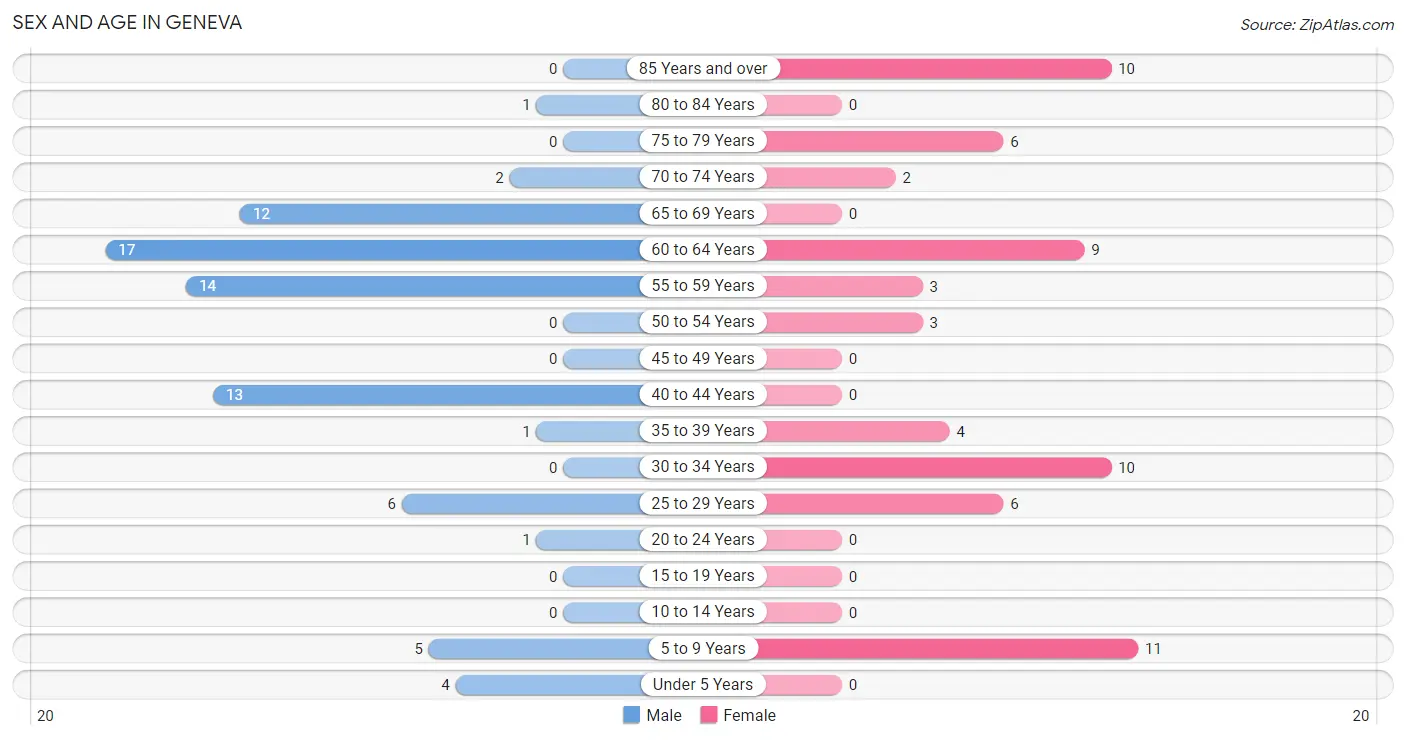
| Age Bracket | Male | Female |
| Under 5 Years | 4 (5.3%) | 0 (0.0%) |
| 5 to 9 Years | 5 (6.6%) | 11 (17.2%) |
| 10 to 14 Years | 0 (0.0%) | 0 (0.0%) |
| 15 to 19 Years | 0 (0.0%) | 0 (0.0%) |
| 20 to 24 Years | 1 (1.3%) | 0 (0.0%) |
| 25 to 29 Years | 6 (7.9%) | 6 (9.4%) |
| 30 to 34 Years | 0 (0.0%) | 10 (15.6%) |
| 35 to 39 Years | 1 (1.3%) | 4 (6.2%) |
| 40 to 44 Years | 13 (17.1%) | 0 (0.0%) |
| 45 to 49 Years | 0 (0.0%) | 0 (0.0%) |
| 50 to 54 Years | 0 (0.0%) | 3 (4.7%) |
| 55 to 59 Years | 14 (18.4%) | 3 (4.7%) |
| 60 to 64 Years | 17 (22.4%) | 9 (14.1%) |
| 65 to 69 Years | 12 (15.8%) | 0 (0.0%) |
| 70 to 74 Years | 2 (2.6%) | 2 (3.1%) |
| 75 to 79 Years | 0 (0.0%) | 6 (9.4%) |
| 80 to 84 Years | 1 (1.3%) | 0 (0.0%) |
| 85 Years and over | 0 (0.0%) | 10 (15.6%) |
| Total | 76 (100.0%) | 64 (100.0%) |
Families and Households in Geneva
Median Family Size in Geneva
The median family size in Geneva is 2.35 persons per family, with married-couple families (16 | 31.4%) accounting for the largest median family size of 2.75 persons per family. On the other hand, single female/mother families (18 | 35.3%) represent the smallest median family size with 2.11 persons per family.
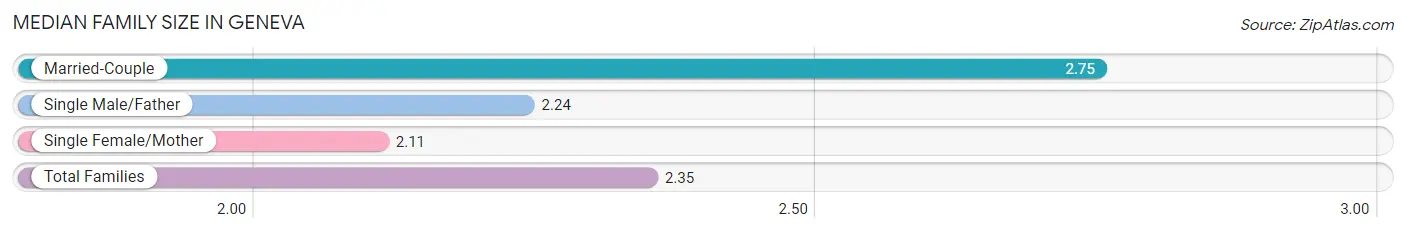
| Family Type | # Families | Family Size |
| Married-Couple | 16 (31.4%) | 2.75 |
| Single Male/Father | 17 (33.3%) | 2.24 |
| Single Female/Mother | 18 (35.3%) | 2.11 |
| Total Families | 51 (100.0%) | 2.35 |
Median Household Size in Geneva
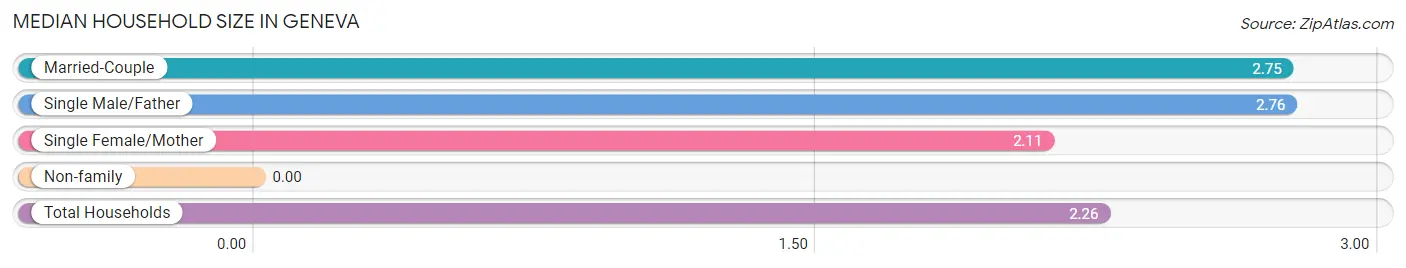
| Household Type | # Households | Household Size |
| Married-Couple | 16 (25.8%) | 2.75 |
| Single Male/Father | 17 (27.4%) | 2.76 |
| Single Female/Mother | 18 (29.0%) | 2.11 |
| Non-family | 11 (17.7%) | - |
| Total Households | 62 (100.0%) | 2.26 |
Household Size by Marriage Status in Geneva
Out of a total of 62 households in Geneva, 51 (82.3%) are family households, while 11 (17.7%) are nonfamily households. The most numerous type of family households are 2-person households, comprising 22, and the most common type of nonfamily households are 1-person households, comprising 11.
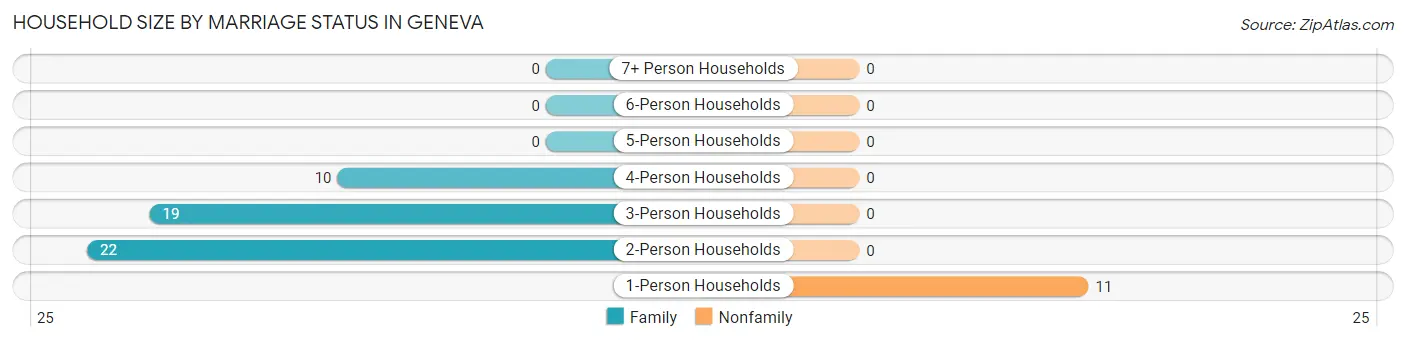
| Household Size | Family Households | Nonfamily Households |
| 1-Person Households | - | 11 (17.7%) |
| 2-Person Households | 22 (35.5%) | 0 (0.0%) |
| 3-Person Households | 19 (30.6%) | 0 (0.0%) |
| 4-Person Households | 10 (16.1%) | 0 (0.0%) |
| 5-Person Households | 0 (0.0%) | 0 (0.0%) |
| 6-Person Households | 0 (0.0%) | 0 (0.0%) |
| 7+ Person Households | 0 (0.0%) | 0 (0.0%) |
| Total | 51 (82.3%) | 11 (17.7%) |
Female Fertility in Geneva
Fertility by Age in Geneva
| Age Bracket | Women with Births | Births / 1,000 Women |
| 15 to 19 years | 0 (0.0%) | 0.0 |
| 20 to 34 years | 0 (0.0%) | 0.0 |
| 35 to 50 years | 0 (0.0%) | 0.0 |
| Total | 0 (0.0%) | 0.0 |
Fertility by Age by Marriage Status in Geneva
| Age Bracket | Married | Unmarried |
| 15 to 19 years | 0 (0.0%) | 0 (0.0%) |
| 20 to 34 years | 0 (0.0%) | 0 (0.0%) |
| 35 to 50 years | 0 (0.0%) | 0 (0.0%) |
| Total | 0 (0.0%) | 0 (0.0%) |
Fertility by Education in Geneva
| Educational Attainment | Women with Births | Births / 1,000 Women |
| Less than High School | 0 (0.0%) | 0.0 |
| High School Diploma | 0 (0.0%) | 0.0 |
| College or Associate's Degree | 0 (0.0%) | 0.0 |
| Bachelor's Degree | 0 (0.0%) | 0.0 |
| Graduate Degree | 0 (0.0%) | 0.0 |
| Total | 0 (0.0%) | 0.0 |
Fertility by Education by Marriage Status in Geneva
| Educational Attainment | Married | Unmarried |
| Less than High School | 0 (0.0%) | 0 (0.0%) |
| High School Diploma | 0 (0.0%) | 0 (0.0%) |
| College or Associate's Degree | 0 (0.0%) | 0 (0.0%) |
| Bachelor's Degree | 0 (0.0%) | 0 (0.0%) |
| Graduate Degree | 0 (0.0%) | 0 (0.0%) |
| Total | 0 (0.0%) | 0 (0.0%) |
Employment Characteristics in Geneva
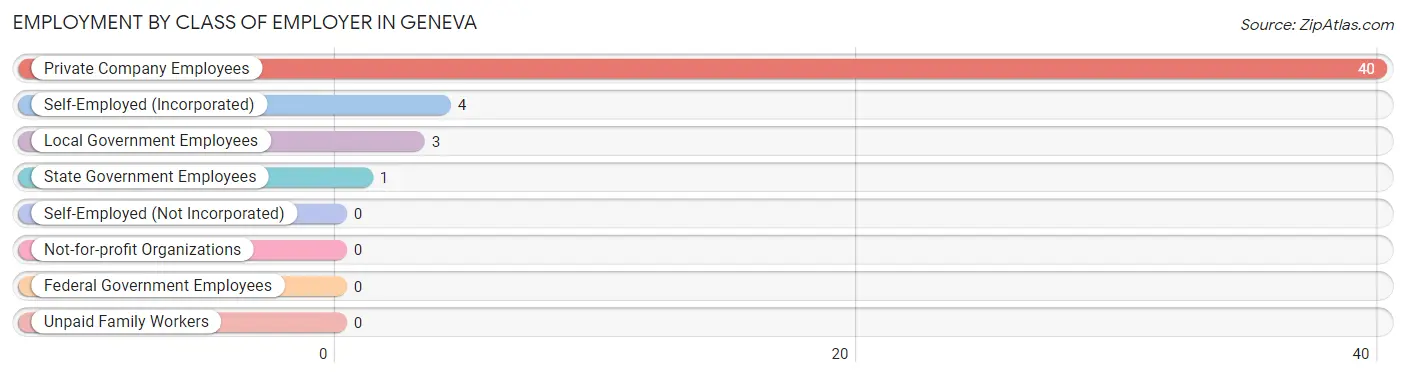
Employment by Class of Employer in Geneva
Among the 48 employed individuals in Geneva, private company employees (40 | 83.3%), self-employed (incorporated) (4 | 8.3%), and local government employees (3 | 6.2%) make up the most common classes of employment.
| Employer Class | # Employees | % Employees |
| Private Company Employees | 40 | 83.3% |
| Self-Employed (Incorporated) | 4 | 8.3% |
| Self-Employed (Not Incorporated) | 0 | 0.0% |
| Not-for-profit Organizations | 0 | 0.0% |
| Local Government Employees | 3 | 6.2% |
| State Government Employees | 1 | 2.1% |
| Federal Government Employees | 0 | 0.0% |
| Unpaid Family Workers | 0 | 0.0% |
| Total | 48 | 100.0% |
Employment Status by Age in Geneva
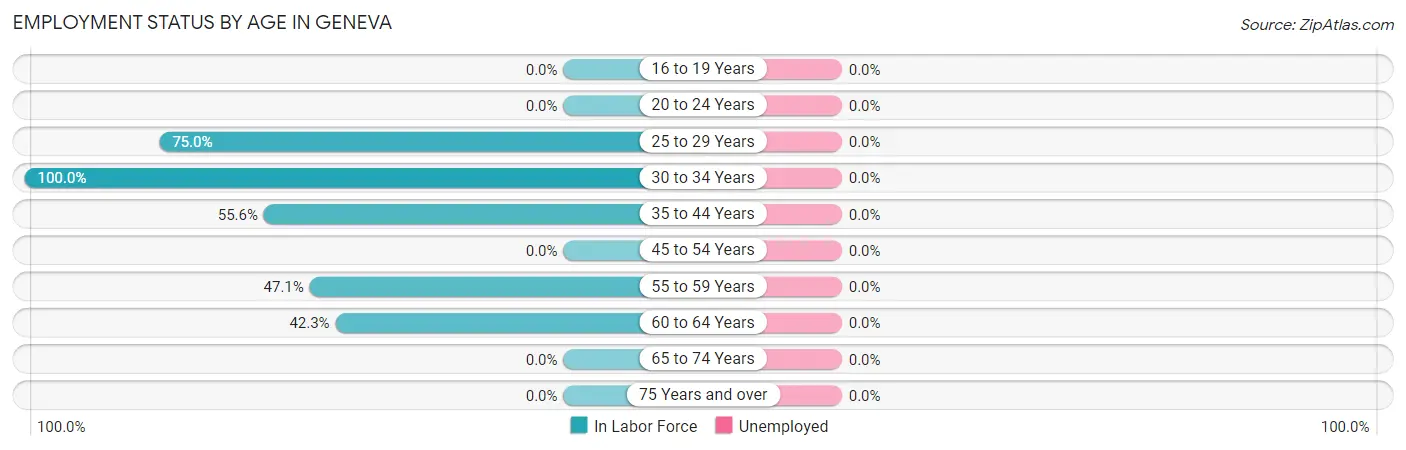
| Age Bracket | In Labor Force | Unemployed |
| 16 to 19 Years | 0 (0.0%) | 0 (0.0%) |
| 20 to 24 Years | 0 (0.0%) | 0 (0.0%) |
| 25 to 29 Years | 9 (75.0%) | 0 (0.0%) |
| 30 to 34 Years | 10 (100.0%) | 0 (0.0%) |
| 35 to 44 Years | 10 (55.6%) | 0 (0.0%) |
| 45 to 54 Years | 0 (0.0%) | 0 (0.0%) |
| 55 to 59 Years | 8 (47.1%) | 0 (0.0%) |
| 60 to 64 Years | 11 (42.3%) | 0 (0.0%) |
| 65 to 74 Years | 0 (0.0%) | 0 (0.0%) |
| 75 Years and over | 0 (0.0%) | 0 (0.0%) |
| Total | 48 (40.0%) | 0 (0.0%) |
Employment Status by Educational Attainment in Geneva
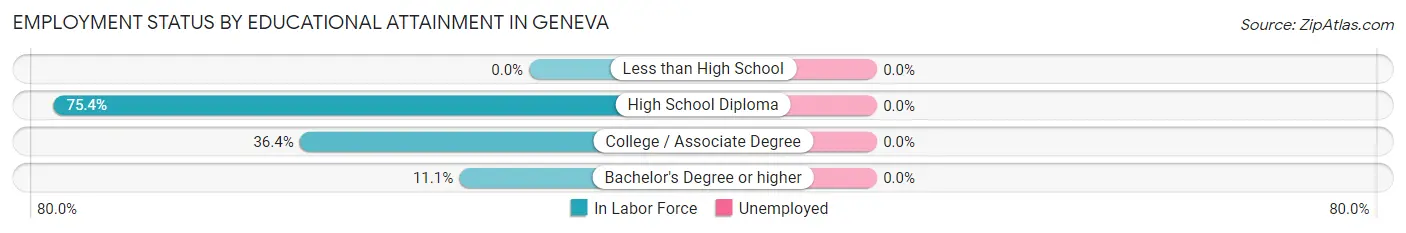
| Educational Attainment | In Labor Force | Unemployed |
| Less than High School | 0 (0.0%) | 0 (0.0%) |
| High School Diploma | 43 (75.4%) | 0 (0.0%) |
| College / Associate Degree | 4 (36.4%) | 0 (0.0%) |
| Bachelor's Degree or higher | 1 (11.1%) | 0 (0.0%) |
| Total | 48 (55.8%) | 0 (0.0%) |
Employment Occupations by Sex in Geneva
Management, Business, Science and Arts Occupations
The most common Management, Business, Science and Arts occupations in Geneva are , and Management (9 | 18.8%).
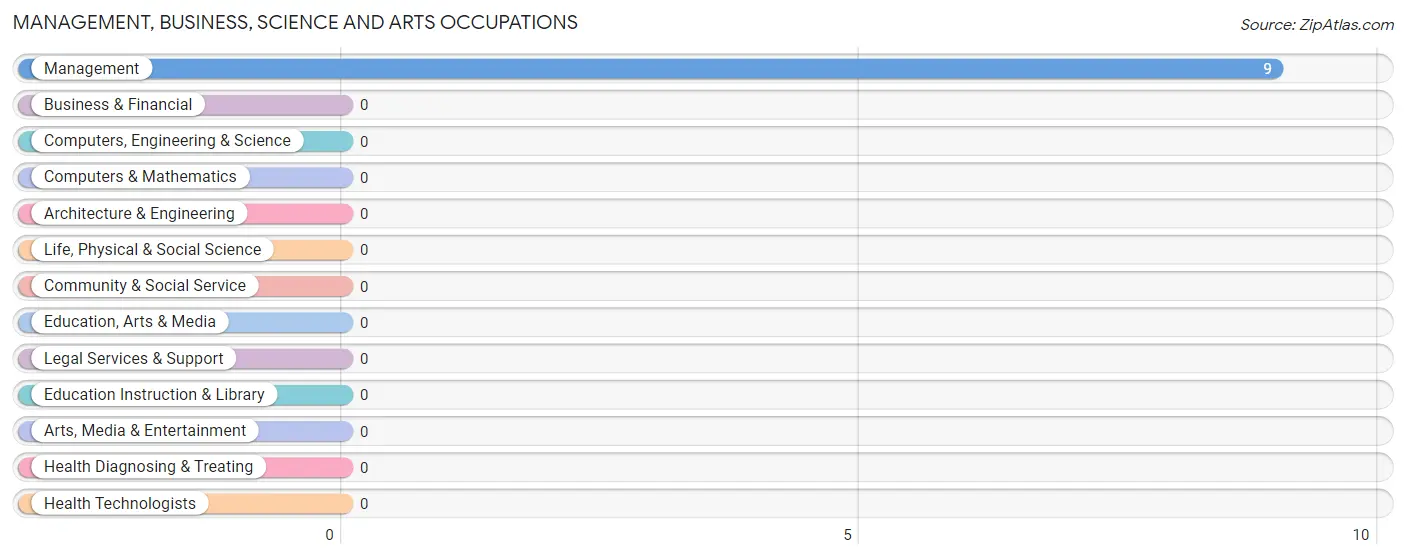
Management, Business, Science and Arts Occupations by Sex
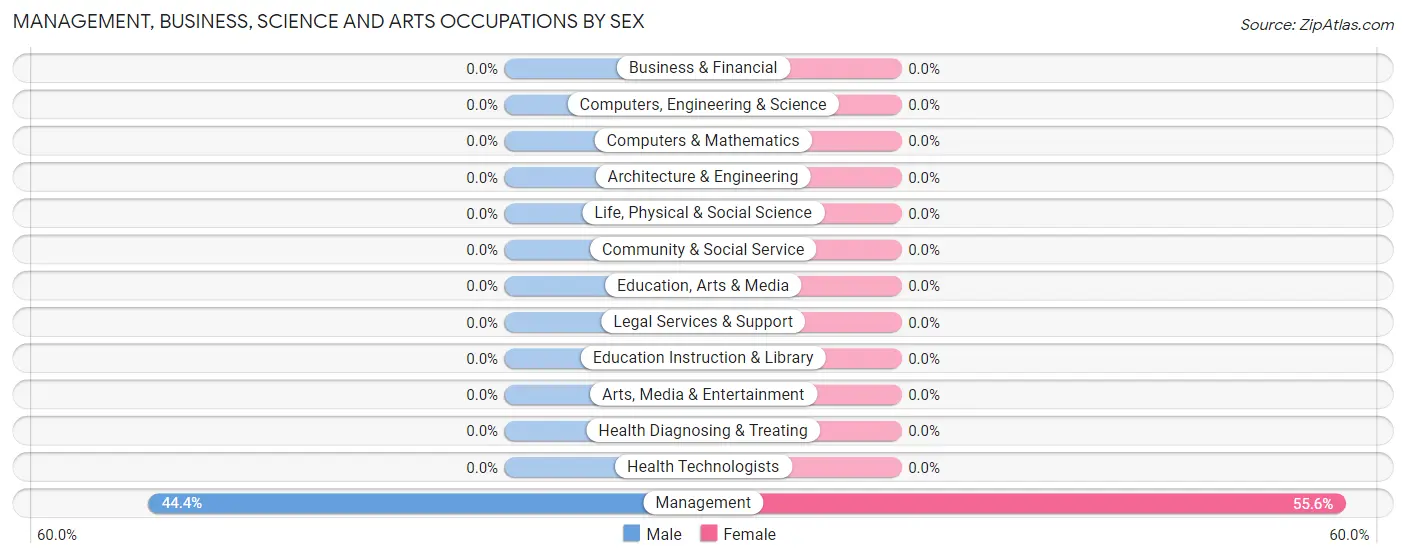
| Occupation | Male | Female |
| Management | 4 (44.4%) | 5 (55.6%) |
| Business & Financial | 0 (0.0%) | 0 (0.0%) |
| Computers, Engineering & Science | 0 (0.0%) | 0 (0.0%) |
| Computers & Mathematics | 0 (0.0%) | 0 (0.0%) |
| Architecture & Engineering | 0 (0.0%) | 0 (0.0%) |
| Life, Physical & Social Science | 0 (0.0%) | 0 (0.0%) |
| Community & Social Service | 0 (0.0%) | 0 (0.0%) |
| Education, Arts & Media | 0 (0.0%) | 0 (0.0%) |
| Legal Services & Support | 0 (0.0%) | 0 (0.0%) |
| Education Instruction & Library | 0 (0.0%) | 0 (0.0%) |
| Arts, Media & Entertainment | 0 (0.0%) | 0 (0.0%) |
| Health Diagnosing & Treating | 0 (0.0%) | 0 (0.0%) |
| Health Technologists | 0 (0.0%) | 0 (0.0%) |
| Total (Category) | 4 (44.4%) | 5 (55.6%) |
| Total (Overall) | 25 (52.1%) | 23 (47.9%) |
Services Occupations
The most common Services occupations in Geneva are Healthcare Support (9 | 18.8%), and Food Preparation & Serving (6 | 12.5%).
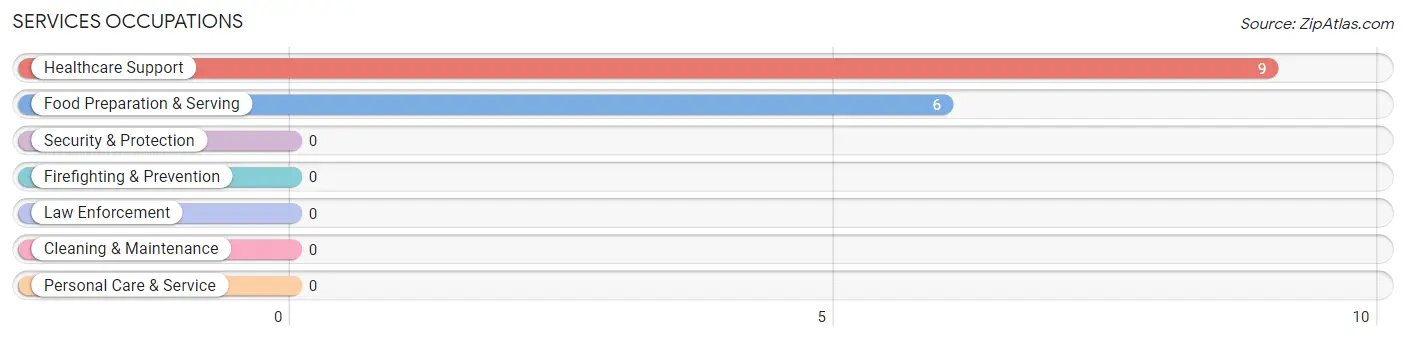
Services Occupations by Sex
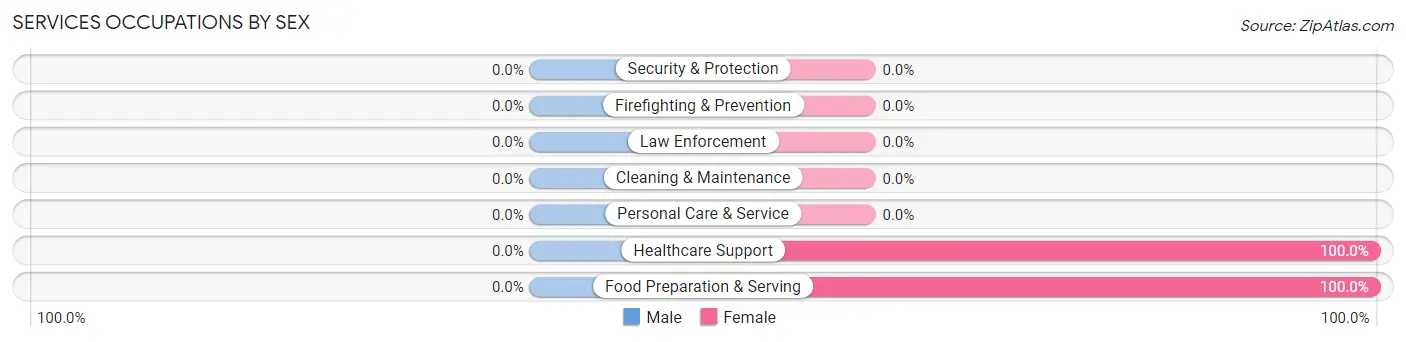
| Occupation | Male | Female |
| Healthcare Support | 0 (0.0%) | 9 (100.0%) |
| Security & Protection | 0 (0.0%) | 0 (0.0%) |
| Firefighting & Prevention | 0 (0.0%) | 0 (0.0%) |
| Law Enforcement | 0 (0.0%) | 0 (0.0%) |
| Food Preparation & Serving | 0 (0.0%) | 6 (100.0%) |
| Cleaning & Maintenance | 0 (0.0%) | 0 (0.0%) |
| Personal Care & Service | 0 (0.0%) | 0 (0.0%) |
| Total (Category) | 0 (0.0%) | 15 (100.0%) |
| Total (Overall) | 25 (52.1%) | 23 (47.9%) |
Sales and Office Occupations
The most common Sales and Office occupations in Geneva are , and Office & Administration (12 | 25.0%).

Sales and Office Occupations by Sex
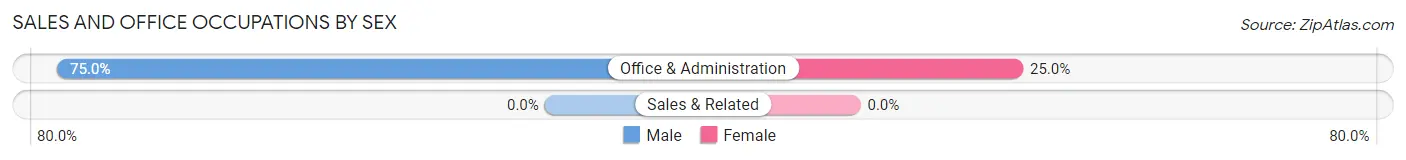
| Occupation | Male | Female |
| Sales & Related | 0 (0.0%) | 0 (0.0%) |
| Office & Administration | 9 (75.0%) | 3 (25.0%) |
| Total (Category) | 9 (75.0%) | 3 (25.0%) |
| Total (Overall) | 25 (52.1%) | 23 (47.9%) |
Natural Resources, Construction and Maintenance Occupations
The most common Natural Resources, Construction and Maintenance occupations in Geneva are , and Construction & Extraction (3 | 6.2%).
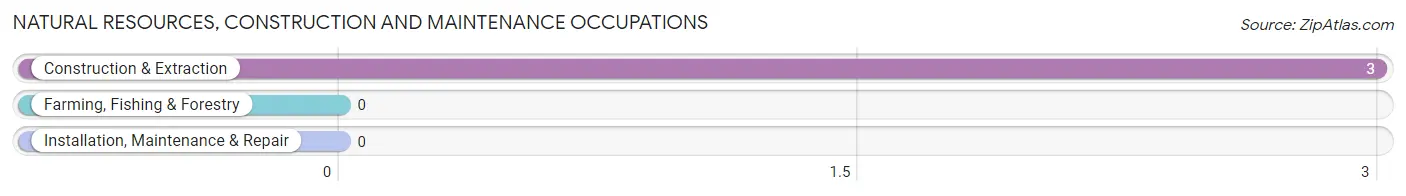
Natural Resources, Construction and Maintenance Occupations by Sex
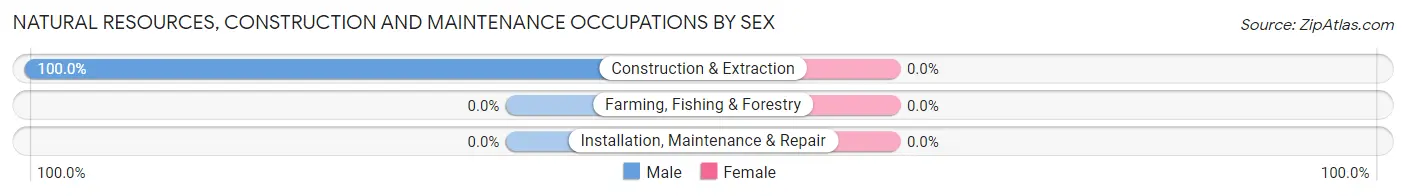
| Occupation | Male | Female |
| Farming, Fishing & Forestry | 0 (0.0%) | 0 (0.0%) |
| Construction & Extraction | 3 (100.0%) | 0 (0.0%) |
| Installation, Maintenance & Repair | 0 (0.0%) | 0 (0.0%) |
| Total (Category) | 3 (100.0%) | 0 (0.0%) |
| Total (Overall) | 25 (52.1%) | 23 (47.9%) |
Production, Transportation and Moving Occupations
The most common Production, Transportation and Moving occupations in Geneva are Transportation (8 | 16.7%), and Production (1 | 2.1%).
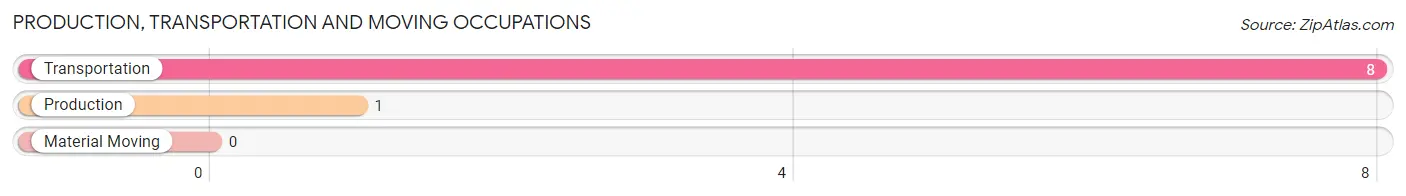
Production, Transportation and Moving Occupations by Sex
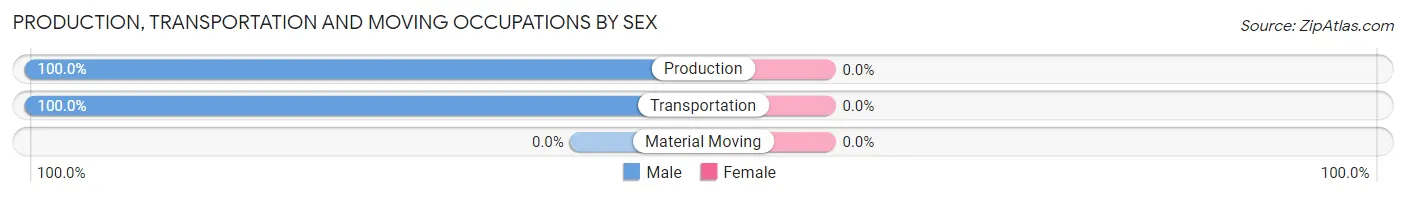
| Occupation | Male | Female |
| Production | 1 (100.0%) | 0 (0.0%) |
| Transportation | 8 (100.0%) | 0 (0.0%) |
| Material Moving | 0 (0.0%) | 0 (0.0%) |
| Total (Category) | 9 (100.0%) | 0 (0.0%) |
| Total (Overall) | 25 (52.1%) | 23 (47.9%) |
Employment Industries by Sex in Geneva
Employment Industries in Geneva
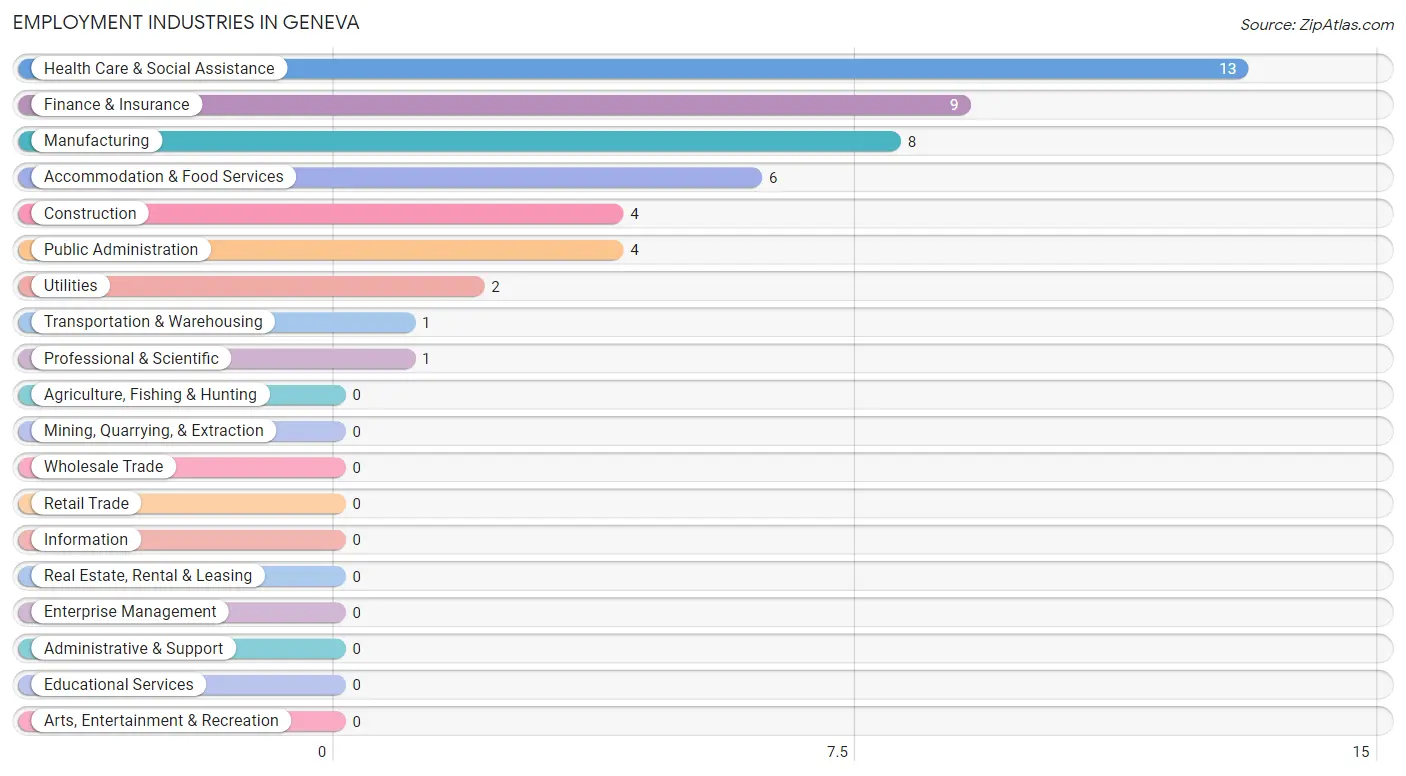
The major employment industries in Geneva include Health Care & Social Assistance (13 | 27.1%), Finance & Insurance (9 | 18.8%), Manufacturing (8 | 16.7%), Accommodation & Food Services (6 | 12.5%), and Construction (4 | 8.3%).
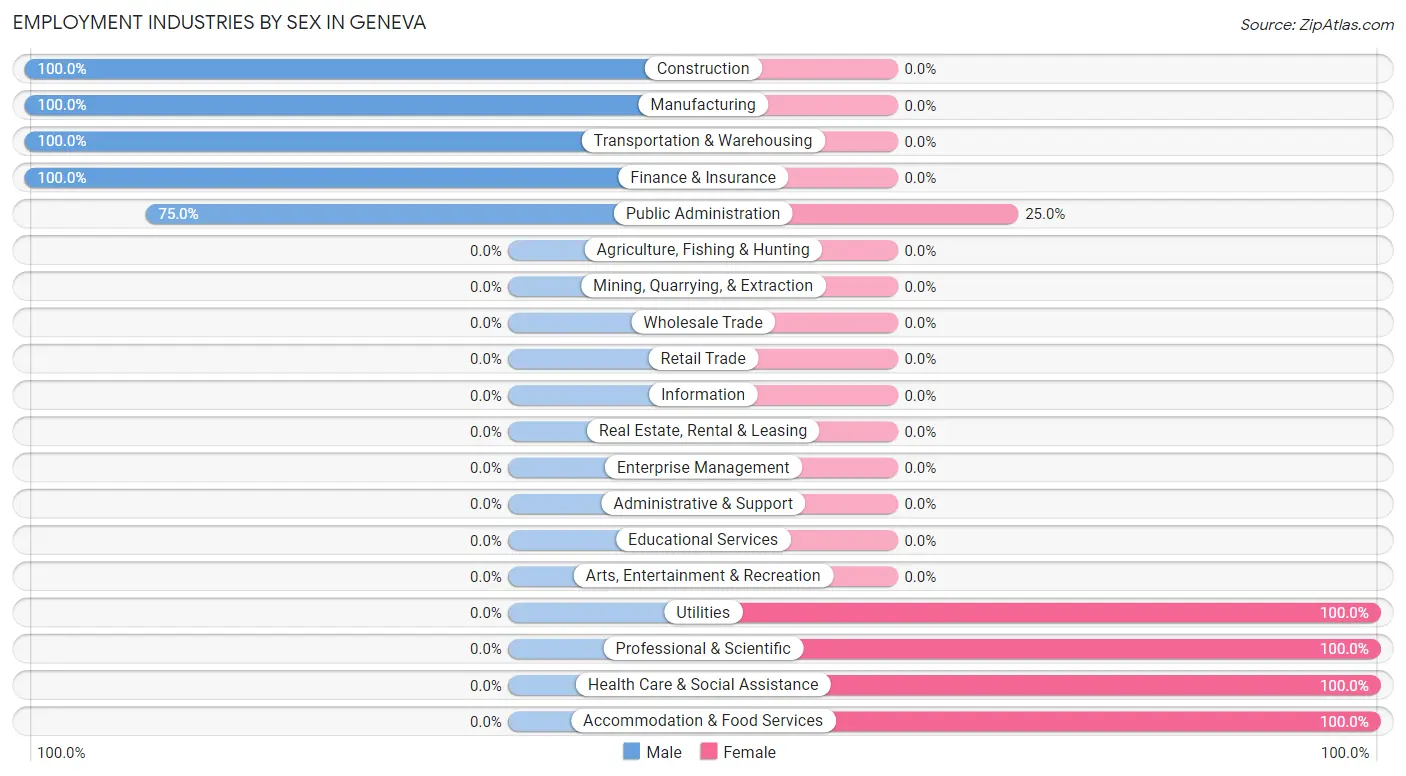
Employment Industries by Sex in Geneva
The Geneva industries that see more men than women are Construction (100.0%), Manufacturing (100.0%), and Transportation & Warehousing (100.0%), whereas the industries that tend to have a higher number of women are Utilities (100.0%), Professional & Scientific (100.0%), and Health Care & Social Assistance (100.0%).
| Industry | Male | Female |
| Agriculture, Fishing & Hunting | 0 (0.0%) | 0 (0.0%) |
| Mining, Quarrying, & Extraction | 0 (0.0%) | 0 (0.0%) |
| Construction | 4 (100.0%) | 0 (0.0%) |
| Manufacturing | 8 (100.0%) | 0 (0.0%) |
| Wholesale Trade | 0 (0.0%) | 0 (0.0%) |
| Retail Trade | 0 (0.0%) | 0 (0.0%) |
| Transportation & Warehousing | 1 (100.0%) | 0 (0.0%) |
| Utilities | 0 (0.0%) | 2 (100.0%) |
| Information | 0 (0.0%) | 0 (0.0%) |
| Finance & Insurance | 9 (100.0%) | 0 (0.0%) |
| Real Estate, Rental & Leasing | 0 (0.0%) | 0 (0.0%) |
| Professional & Scientific | 0 (0.0%) | 1 (100.0%) |
| Enterprise Management | 0 (0.0%) | 0 (0.0%) |
| Administrative & Support | 0 (0.0%) | 0 (0.0%) |
| Educational Services | 0 (0.0%) | 0 (0.0%) |
| Health Care & Social Assistance | 0 (0.0%) | 13 (100.0%) |
| Arts, Entertainment & Recreation | 0 (0.0%) | 0 (0.0%) |
| Accommodation & Food Services | 0 (0.0%) | 6 (100.0%) |
| Public Administration | 3 (75.0%) | 1 (25.0%) |
| Total | 25 (52.1%) | 23 (47.9%) |
Education in Geneva
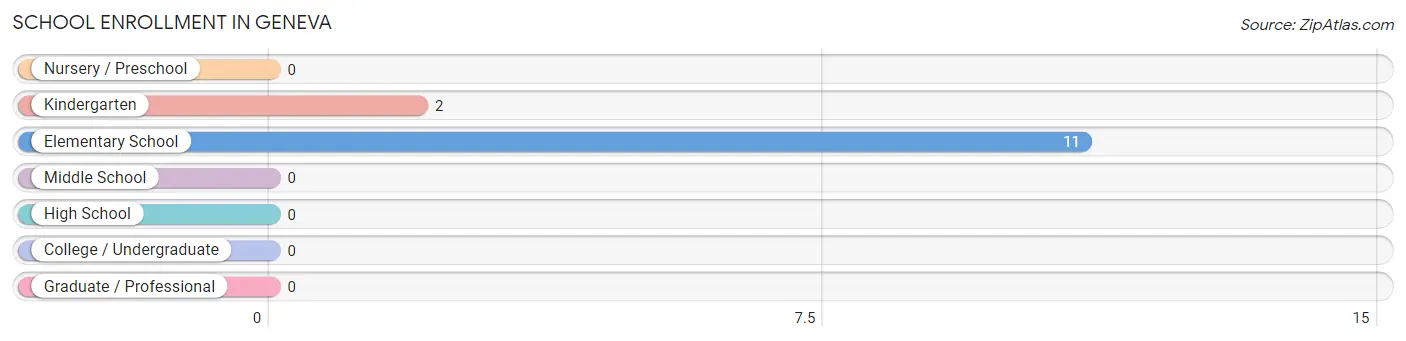
School Enrollment in Geneva
The most common levels of schooling among the 13 students in Geneva are elementary school (11 | 84.6%), and kindergarten (2 | 15.4%).
| School Level | # Students | % Students |
| Nursery / Preschool | 0 | 0.0% |
| Kindergarten | 2 | 15.4% |
| Elementary School | 11 | 84.6% |
| Middle School | 0 | 0.0% |
| High School | 0 | 0.0% |
| College / Undergraduate | 0 | 0.0% |
| Graduate / Professional | 0 | 0.0% |
| Total | 13 | 100.0% |
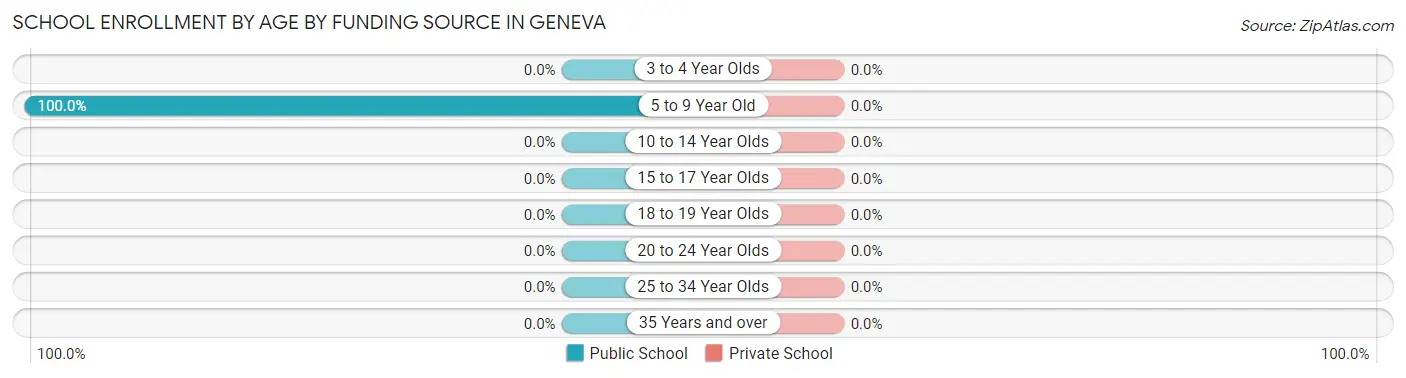
School Enrollment by Age by Funding Source in Geneva
| Age Bracket | Public School | Private School |
| 3 to 4 Year Olds | 0 (0.0%) | 0 (0.0%) |
| 5 to 9 Year Old | 13 (100.0%) | 0 (0.0%) |
| 10 to 14 Year Olds | 0 (0.0%) | 0 (0.0%) |
| 15 to 17 Year Olds | 0 (0.0%) | 0 (0.0%) |
| 18 to 19 Year Olds | 0 (0.0%) | 0 (0.0%) |
| 20 to 24 Year Olds | 0 (0.0%) | 0 (0.0%) |
| 25 to 34 Year Olds | 0 (0.0%) | 0 (0.0%) |
| 35 Years and over | 0 (0.0%) | 0 (0.0%) |
| Total | 13 (100.0%) | 0 (0.0%) |
Educational Attainment by Field of Study in Geneva
Arts & humanities (8 | 88.9%), and business (1 | 11.1%) are the most common fields of study among 9 individuals in Geneva who have obtained a bachelor's degree or higher.
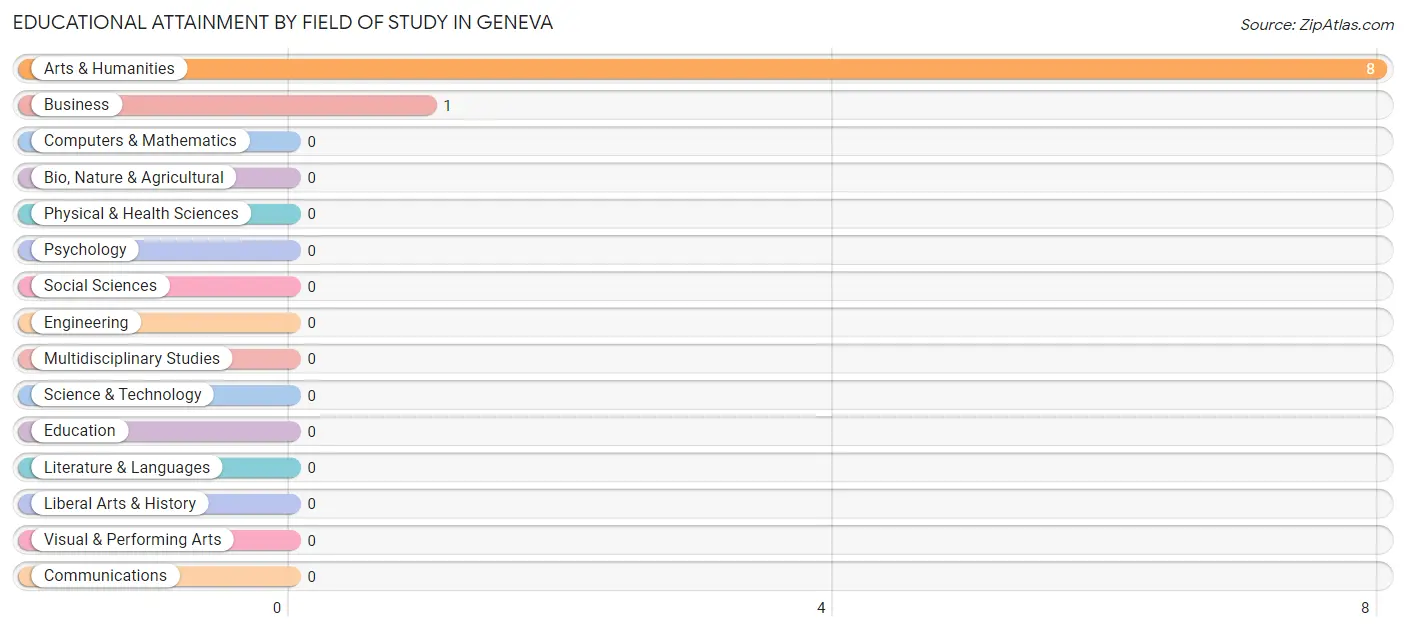
| Field of Study | # Graduates | % Graduates |
| Computers & Mathematics | 0 | 0.0% |
| Bio, Nature & Agricultural | 0 | 0.0% |
| Physical & Health Sciences | 0 | 0.0% |
| Psychology | 0 | 0.0% |
| Social Sciences | 0 | 0.0% |
| Engineering | 0 | 0.0% |
| Multidisciplinary Studies | 0 | 0.0% |
| Science & Technology | 0 | 0.0% |
| Business | 1 | 11.1% |
| Education | 0 | 0.0% |
| Literature & Languages | 0 | 0.0% |
| Liberal Arts & History | 0 | 0.0% |
| Visual & Performing Arts | 0 | 0.0% |
| Communications | 0 | 0.0% |
| Arts & Humanities | 8 | 88.9% |
| Total | 9 | 100.0% |
Transportation & Commute in Geneva
Vehicle Availability by Sex in Geneva
The most prevalent vehicle ownership categories in Geneva are males with 3 vehicles (16, accounting for 64.0%) and females with 3 vehicles (1, making up 69.6%).
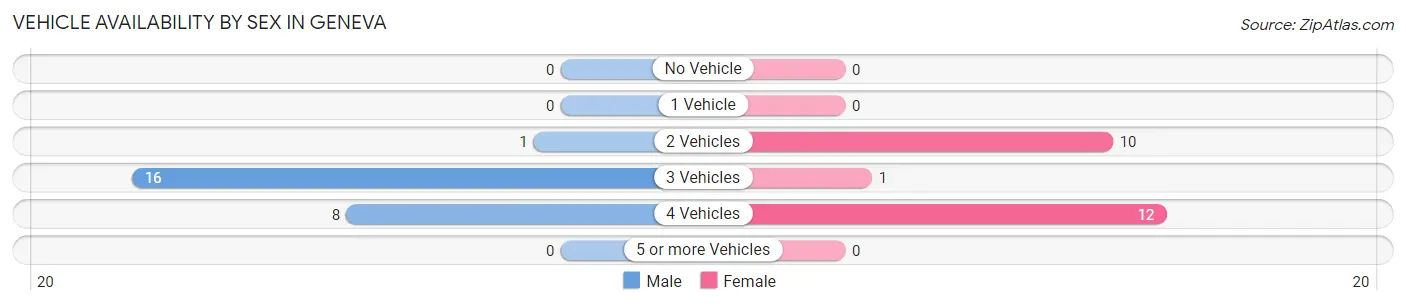
| Vehicles Available | Male | Female |
| No Vehicle | 0 (0.0%) | 0 (0.0%) |
| 1 Vehicle | 0 (0.0%) | 0 (0.0%) |
| 2 Vehicles | 1 (4.0%) | 10 (43.5%) |
| 3 Vehicles | 16 (64.0%) | 1 (4.3%) |
| 4 Vehicles | 8 (32.0%) | 12 (52.2%) |
| 5 or more Vehicles | 0 (0.0%) | 0 (0.0%) |
| Total | 25 (100.0%) | 23 (100.0%) |
Commute Time in Geneva
The most frequently occuring commute durations in Geneva are 25 to 29 minutes (25 commuters, 62.5%), 30 to 34 minutes (9 commuters, 22.5%), and 40 to 44 minutes (3 commuters, 7.5%).
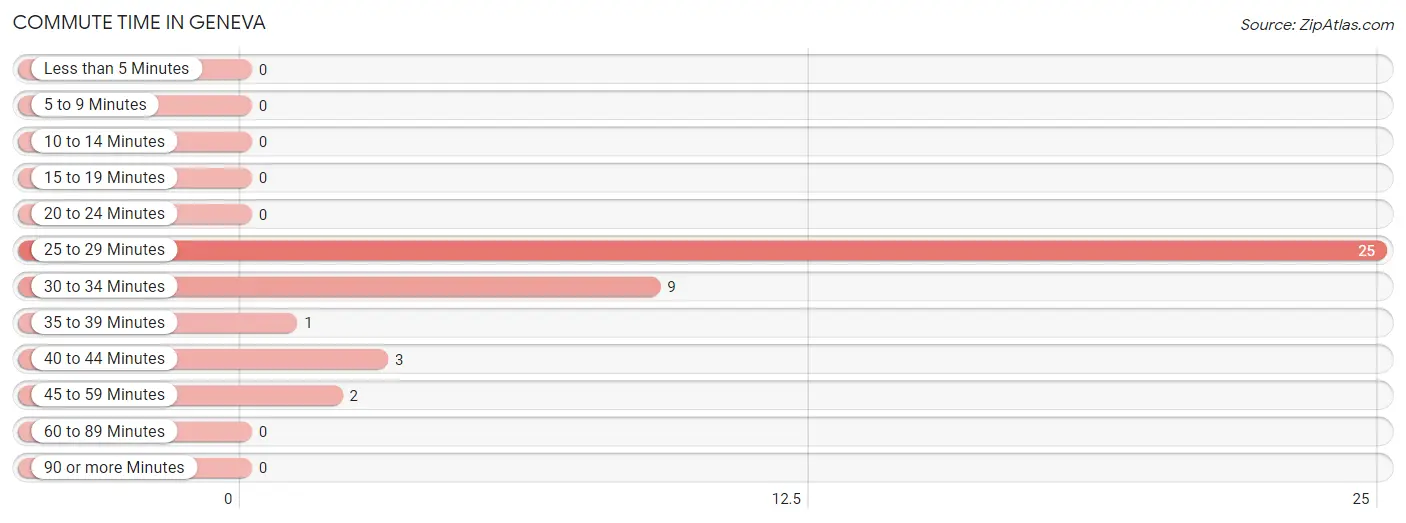
| Commute Time | # Commuters | % Commuters |
| Less than 5 Minutes | 0 | 0.0% |
| 5 to 9 Minutes | 0 | 0.0% |
| 10 to 14 Minutes | 0 | 0.0% |
| 15 to 19 Minutes | 0 | 0.0% |
| 20 to 24 Minutes | 0 | 0.0% |
| 25 to 29 Minutes | 25 | 62.5% |
| 30 to 34 Minutes | 9 | 22.5% |
| 35 to 39 Minutes | 1 | 2.5% |
| 40 to 44 Minutes | 3 | 7.5% |
| 45 to 59 Minutes | 2 | 5.0% |
| 60 to 89 Minutes | 0 | 0.0% |
| 90 or more Minutes | 0 | 0.0% |
Commute Time by Sex in Geneva
The most common commute times in Geneva are 25 to 29 minutes (16 commuters, 76.2%) for males and 25 to 29 minutes (9 commuters, 47.4%) for females.
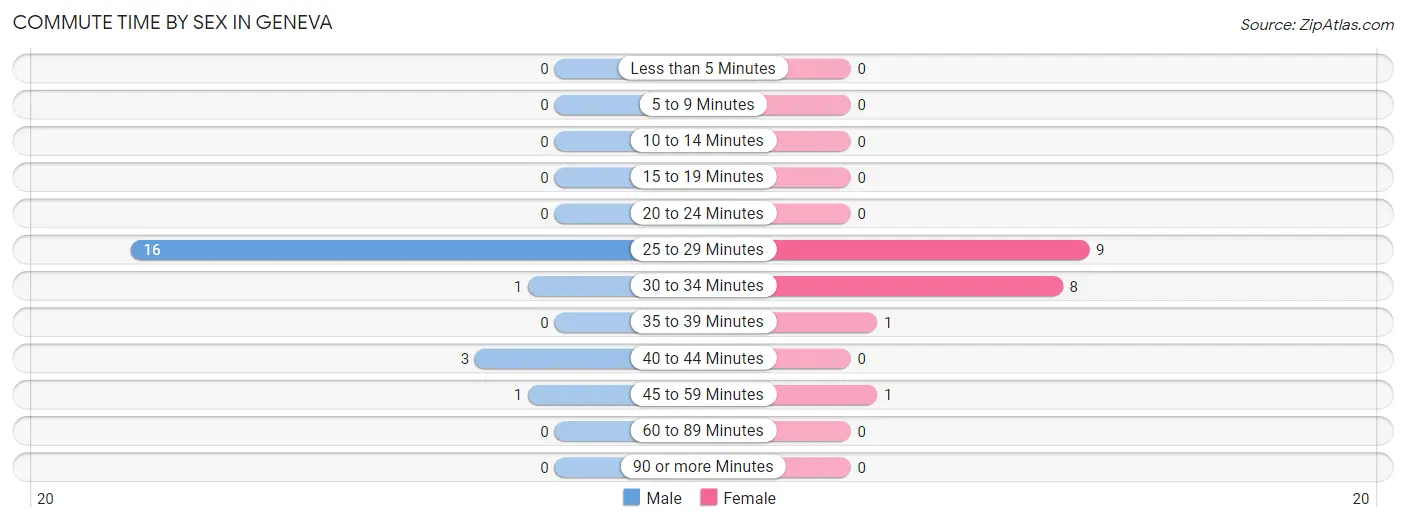
| Commute Time | Male | Female |
| Less than 5 Minutes | 0 (0.0%) | 0 (0.0%) |
| 5 to 9 Minutes | 0 (0.0%) | 0 (0.0%) |
| 10 to 14 Minutes | 0 (0.0%) | 0 (0.0%) |
| 15 to 19 Minutes | 0 (0.0%) | 0 (0.0%) |
| 20 to 24 Minutes | 0 (0.0%) | 0 (0.0%) |
| 25 to 29 Minutes | 16 (76.2%) | 9 (47.4%) |
| 30 to 34 Minutes | 1 (4.8%) | 8 (42.1%) |
| 35 to 39 Minutes | 0 (0.0%) | 1 (5.3%) |
| 40 to 44 Minutes | 3 (14.3%) | 0 (0.0%) |
| 45 to 59 Minutes | 1 (4.8%) | 1 (5.3%) |
| 60 to 89 Minutes | 0 (0.0%) | 0 (0.0%) |
| 90 or more Minutes | 0 (0.0%) | 0 (0.0%) |
Time of Departure to Work by Sex in Geneva
The most frequent times of departure to work in Geneva are 5:00 AM to 5:29 AM (16, 76.2%) for males and 7:00 AM to 7:29 AM (10, 52.6%) for females.
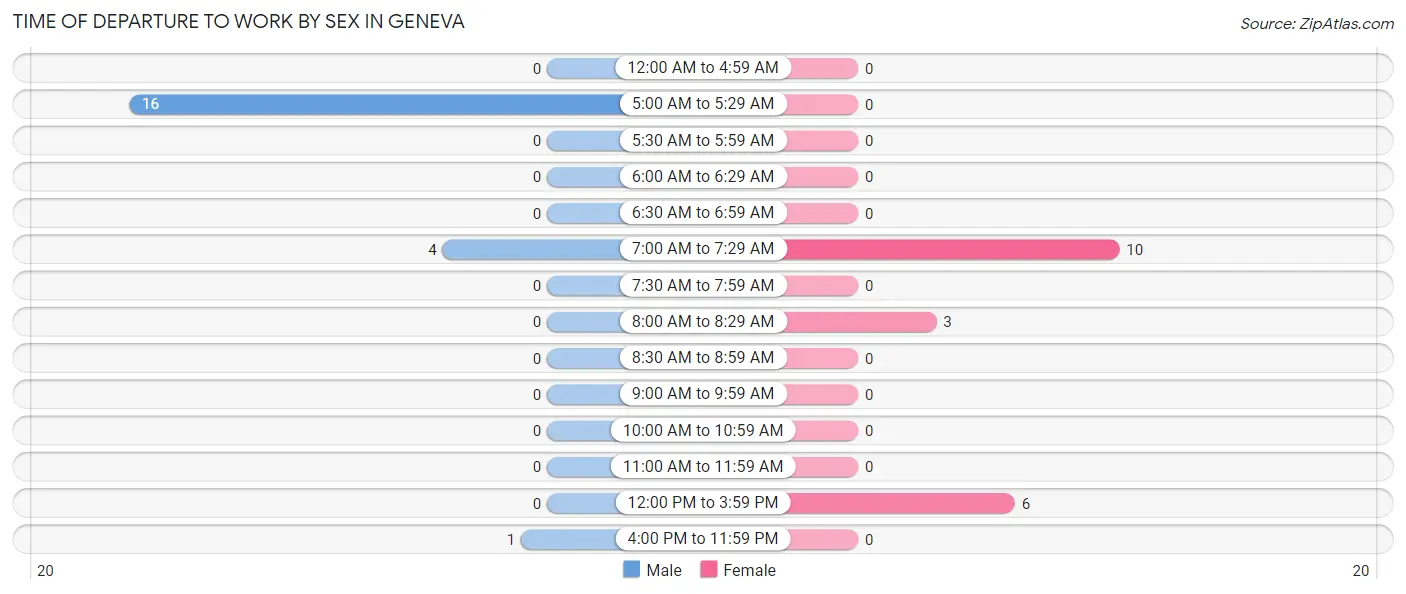
| Time of Departure | Male | Female |
| 12:00 AM to 4:59 AM | 0 (0.0%) | 0 (0.0%) |
| 5:00 AM to 5:29 AM | 16 (76.2%) | 0 (0.0%) |
| 5:30 AM to 5:59 AM | 0 (0.0%) | 0 (0.0%) |
| 6:00 AM to 6:29 AM | 0 (0.0%) | 0 (0.0%) |
| 6:30 AM to 6:59 AM | 0 (0.0%) | 0 (0.0%) |
| 7:00 AM to 7:29 AM | 4 (19.1%) | 10 (52.6%) |
| 7:30 AM to 7:59 AM | 0 (0.0%) | 0 (0.0%) |
| 8:00 AM to 8:29 AM | 0 (0.0%) | 3 (15.8%) |
| 8:30 AM to 8:59 AM | 0 (0.0%) | 0 (0.0%) |
| 9:00 AM to 9:59 AM | 0 (0.0%) | 0 (0.0%) |
| 10:00 AM to 10:59 AM | 0 (0.0%) | 0 (0.0%) |
| 11:00 AM to 11:59 AM | 0 (0.0%) | 0 (0.0%) |
| 12:00 PM to 3:59 PM | 0 (0.0%) | 6 (31.6%) |
| 4:00 PM to 11:59 PM | 1 (4.8%) | 0 (0.0%) |
| Total | 21 (100.0%) | 19 (100.0%) |
Housing Occupancy in Geneva
Occupancy by Ownership in Geneva
Of the total 62 dwellings in Geneva, owner-occupied units account for 55 (88.7%), while renter-occupied units make up 7 (11.3%).
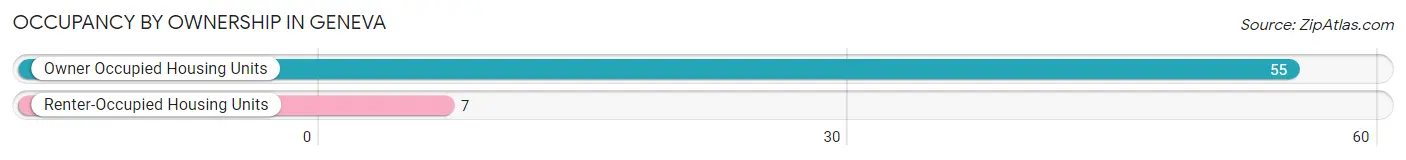
| Occupancy | # Housing Units | % Housing Units |
| Owner Occupied Housing Units | 55 | 88.7% |
| Renter-Occupied Housing Units | 7 | 11.3% |
| Total Occupied Housing Units | 62 | 100.0% |
Occupancy by Household Size in Geneva
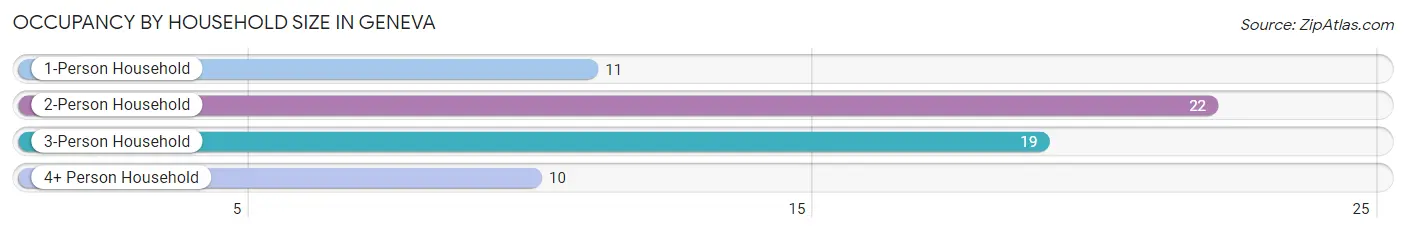
| Household Size | # Housing Units | % Housing Units |
| 1-Person Household | 11 | 17.7% |
| 2-Person Household | 22 | 35.5% |
| 3-Person Household | 19 | 30.6% |
| 4+ Person Household | 10 | 16.1% |
| Total Housing Units | 62 | 100.0% |
Occupancy by Ownership by Household Size in Geneva
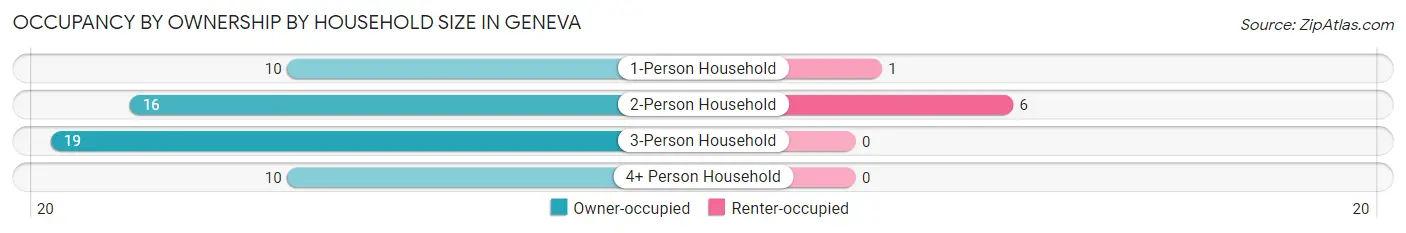
| Household Size | Owner-occupied | Renter-occupied |
| 1-Person Household | 10 (90.9%) | 1 (9.1%) |
| 2-Person Household | 16 (72.7%) | 6 (27.3%) |
| 3-Person Household | 19 (100.0%) | 0 (0.0%) |
| 4+ Person Household | 10 (100.0%) | 0 (0.0%) |
| Total Housing Units | 55 (88.7%) | 7 (11.3%) |
Occupancy by Educational Attainment in Geneva
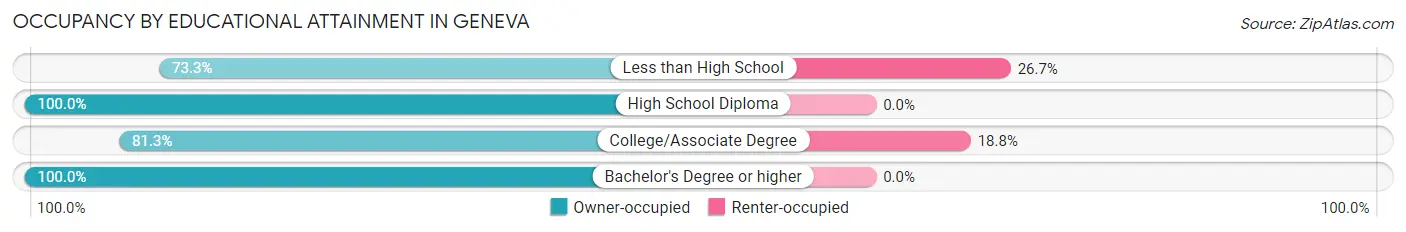
| Household Size | Owner-occupied | Renter-occupied |
| Less than High School | 11 (73.3%) | 4 (26.7%) |
| High School Diploma | 22 (100.0%) | 0 (0.0%) |
| College/Associate Degree | 13 (81.2%) | 3 (18.8%) |
| Bachelor's Degree or higher | 9 (100.0%) | 0 (0.0%) |
Occupancy by Age of Householder in Geneva
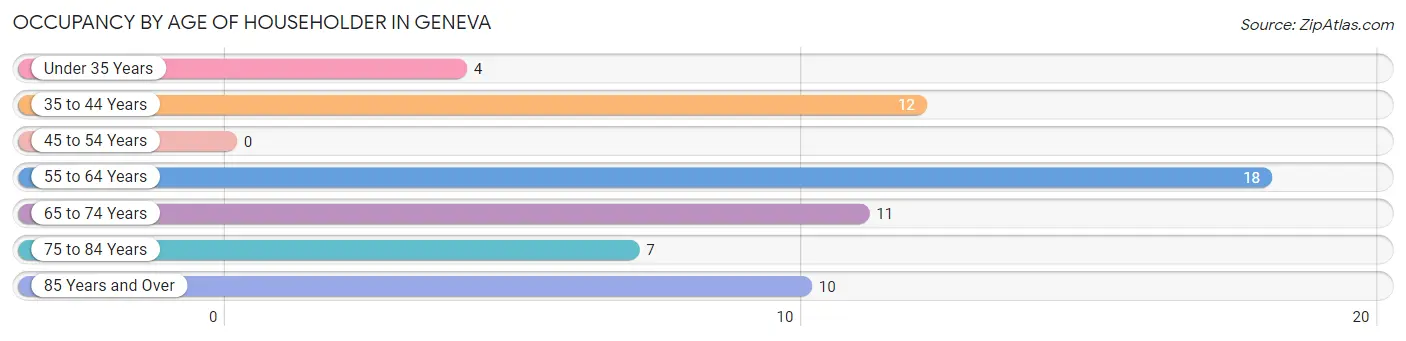
| Age Bracket | # Households | % Households |
| Under 35 Years | 4 | 6.5% |
| 35 to 44 Years | 12 | 19.4% |
| 45 to 54 Years | 0 | 0.0% |
| 55 to 64 Years | 18 | 29.0% |
| 65 to 74 Years | 11 | 17.7% |
| 75 to 84 Years | 7 | 11.3% |
| 85 Years and Over | 10 | 16.1% |
| Total | 62 | 100.0% |
Housing Finances in Geneva
Median Income by Occupancy in Geneva
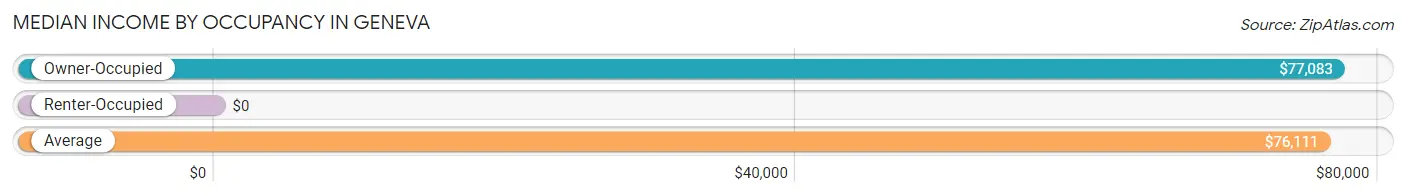
| Occupancy Type | # Households | Median Income |
| Owner-Occupied | 55 (88.7%) | $77,083 |
| Renter-Occupied | 7 (11.3%) | $0 |
| Average | 62 (100.0%) | $76,111 |
Occupancy by Householder Income Bracket in Geneva
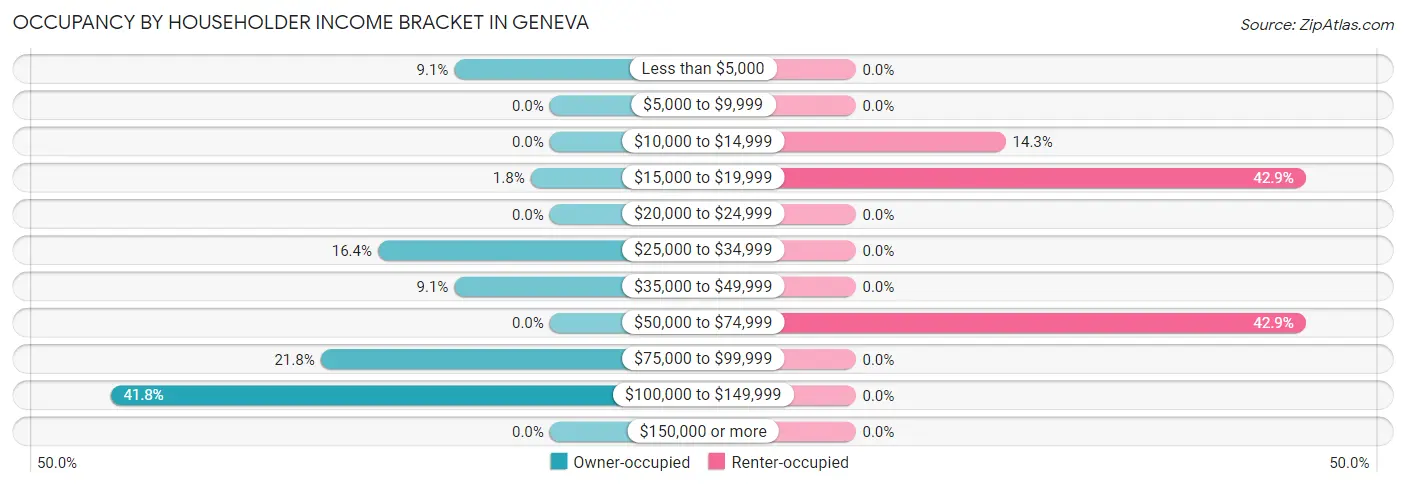
| Income Bracket | Owner-occupied | Renter-occupied |
| Less than $5,000 | 5 (9.1%) | 0 (0.0%) |
| $5,000 to $9,999 | 0 (0.0%) | 0 (0.0%) |
| $10,000 to $14,999 | 0 (0.0%) | 1 (14.3%) |
| $15,000 to $19,999 | 1 (1.8%) | 3 (42.9%) |
| $20,000 to $24,999 | 0 (0.0%) | 0 (0.0%) |
| $25,000 to $34,999 | 9 (16.4%) | 0 (0.0%) |
| $35,000 to $49,999 | 5 (9.1%) | 0 (0.0%) |
| $50,000 to $74,999 | 0 (0.0%) | 3 (42.9%) |
| $75,000 to $99,999 | 12 (21.8%) | 0 (0.0%) |
| $100,000 to $149,999 | 23 (41.8%) | 0 (0.0%) |
| $150,000 or more | 0 (0.0%) | 0 (0.0%) |
| Total | 55 (100.0%) | 7 (100.0%) |
Monthly Housing Cost Tiers in Geneva
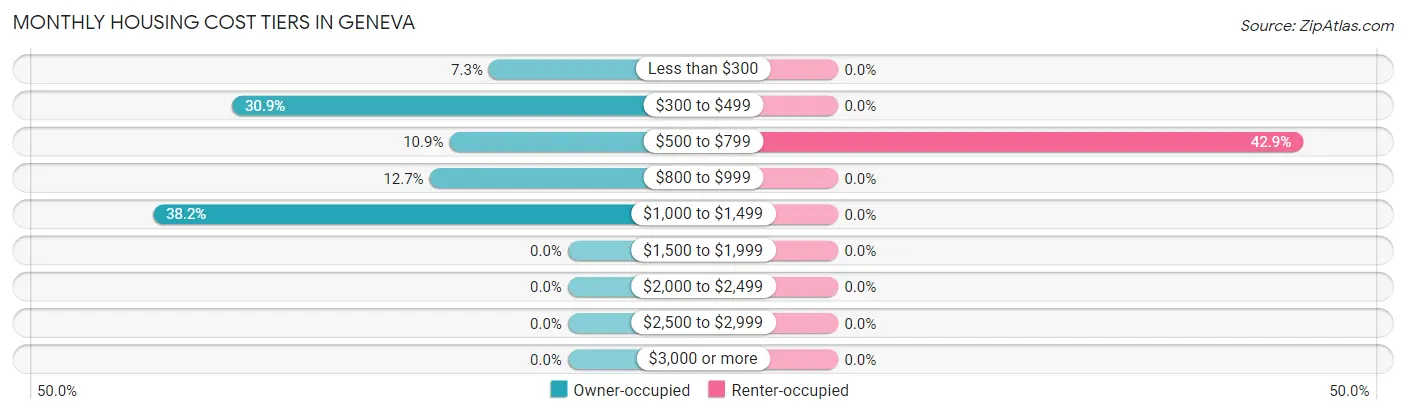
| Monthly Cost | Owner-occupied | Renter-occupied |
| Less than $300 | 4 (7.3%) | 0 (0.0%) |
| $300 to $499 | 17 (30.9%) | 0 (0.0%) |
| $500 to $799 | 6 (10.9%) | 3 (42.9%) |
| $800 to $999 | 7 (12.7%) | 0 (0.0%) |
| $1,000 to $1,499 | 21 (38.2%) | 0 (0.0%) |
| $1,500 to $1,999 | 0 (0.0%) | 0 (0.0%) |
| $2,000 to $2,499 | 0 (0.0%) | 0 (0.0%) |
| $2,500 to $2,999 | 0 (0.0%) | 0 (0.0%) |
| $3,000 or more | 0 (0.0%) | 0 (0.0%) |
| Total | 55 (100.0%) | 7 (100.0%) |
Physical Housing Characteristics in Geneva
Housing Structures in Geneva
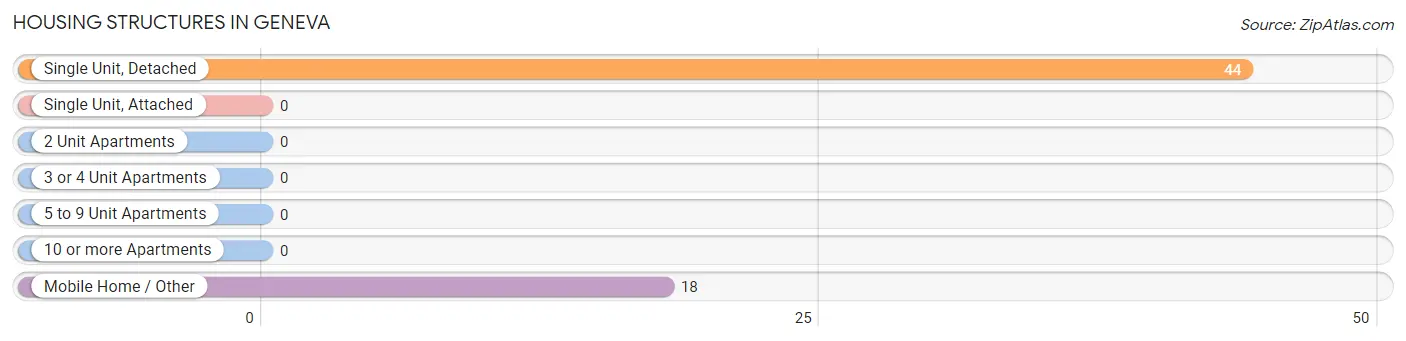
| Structure Type | # Housing Units | % Housing Units |
| Single Unit, Detached | 44 | 71.0% |
| Single Unit, Attached | 0 | 0.0% |
| 2 Unit Apartments | 0 | 0.0% |
| 3 or 4 Unit Apartments | 0 | 0.0% |
| 5 to 9 Unit Apartments | 0 | 0.0% |
| 10 or more Apartments | 0 | 0.0% |
| Mobile Home / Other | 18 | 29.0% |
| Total | 62 | 100.0% |
Housing Structures by Occupancy in Geneva
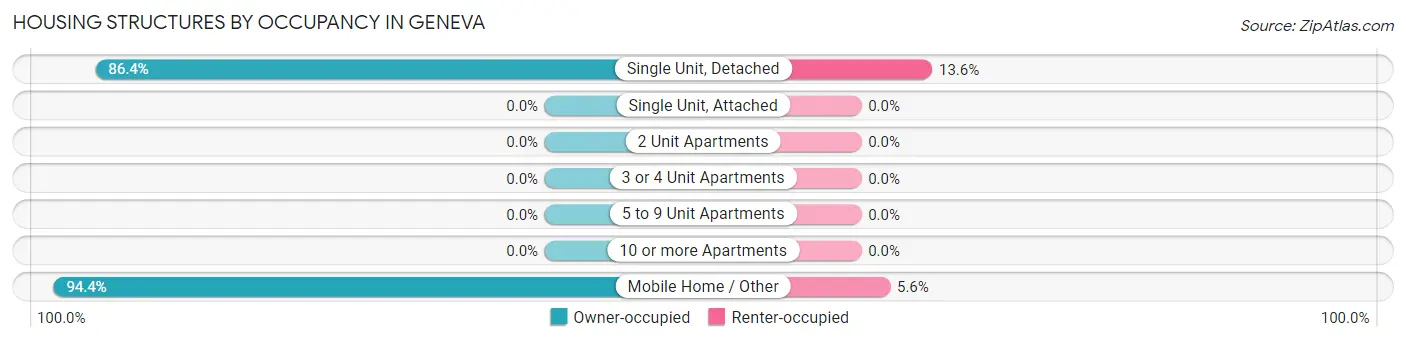
| Structure Type | Owner-occupied | Renter-occupied |
| Single Unit, Detached | 38 (86.4%) | 6 (13.6%) |
| Single Unit, Attached | 0 (0.0%) | 0 (0.0%) |
| 2 Unit Apartments | 0 (0.0%) | 0 (0.0%) |
| 3 or 4 Unit Apartments | 0 (0.0%) | 0 (0.0%) |
| 5 to 9 Unit Apartments | 0 (0.0%) | 0 (0.0%) |
| 10 or more Apartments | 0 (0.0%) | 0 (0.0%) |
| Mobile Home / Other | 17 (94.4%) | 1 (5.6%) |
| Total | 55 (88.7%) | 7 (11.3%) |
Housing Structures by Number of Rooms in Geneva
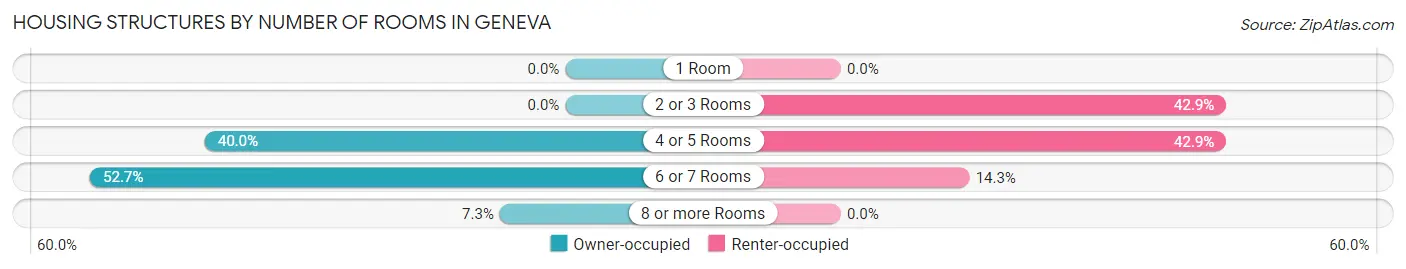
| Number of Rooms | Owner-occupied | Renter-occupied |
| 1 Room | 0 (0.0%) | 0 (0.0%) |
| 2 or 3 Rooms | 0 (0.0%) | 3 (42.9%) |
| 4 or 5 Rooms | 22 (40.0%) | 3 (42.9%) |
| 6 or 7 Rooms | 29 (52.7%) | 1 (14.3%) |
| 8 or more Rooms | 4 (7.3%) | 0 (0.0%) |
| Total | 55 (100.0%) | 7 (100.0%) |
Housing Structure by Heating Type in Geneva
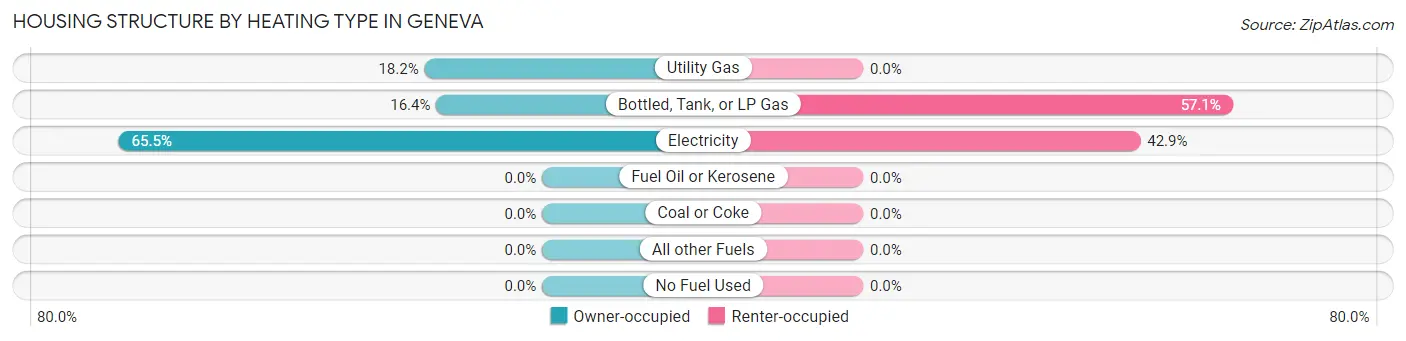
| Heating Type | Owner-occupied | Renter-occupied |
| Utility Gas | 10 (18.2%) | 0 (0.0%) |
| Bottled, Tank, or LP Gas | 9 (16.4%) | 4 (57.1%) |
| Electricity | 36 (65.4%) | 3 (42.9%) |
| Fuel Oil or Kerosene | 0 (0.0%) | 0 (0.0%) |
| Coal or Coke | 0 (0.0%) | 0 (0.0%) |
| All other Fuels | 0 (0.0%) | 0 (0.0%) |
| No Fuel Used | 0 (0.0%) | 0 (0.0%) |
| Total | 55 (100.0%) | 7 (100.0%) |
Household Vehicle Usage in Geneva
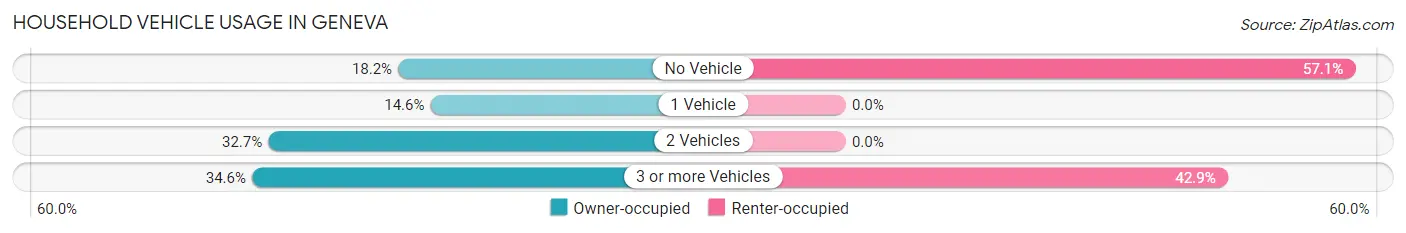
| Vehicles per Household | Owner-occupied | Renter-occupied |
| No Vehicle | 10 (18.2%) | 4 (57.1%) |
| 1 Vehicle | 8 (14.5%) | 0 (0.0%) |
| 2 Vehicles | 18 (32.7%) | 0 (0.0%) |
| 3 or more Vehicles | 19 (34.5%) | 3 (42.9%) |
| Total | 55 (100.0%) | 7 (100.0%) |
Real Estate & Mortgages in Geneva
Real Estate and Mortgage Overview in Geneva
| Characteristic | Without Mortgage | With Mortgage |
| Housing Units | 27 | 28 |
| Median Property Value | - | - |
| Median Household Income | - | - |
| Monthly Housing Costs | $417 | $0 |
| Real Estate Taxes | - | - |
Property Value by Mortgage Status in Geneva
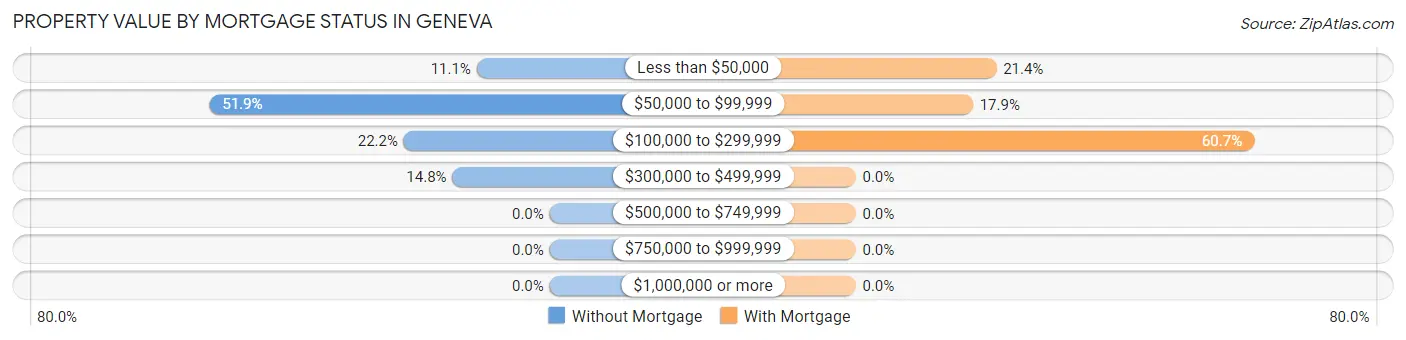
| Property Value | Without Mortgage | With Mortgage |
| Less than $50,000 | 3 (11.1%) | 6 (21.4%) |
| $50,000 to $99,999 | 14 (51.8%) | 5 (17.9%) |
| $100,000 to $299,999 | 6 (22.2%) | 17 (60.7%) |
| $300,000 to $499,999 | 4 (14.8%) | 0 (0.0%) |
| $500,000 to $749,999 | 0 (0.0%) | 0 (0.0%) |
| $750,000 to $999,999 | 0 (0.0%) | 0 (0.0%) |
| $1,000,000 or more | 0 (0.0%) | 0 (0.0%) |
| Total | 27 (100.0%) | 28 (100.0%) |
Household Income by Mortgage Status in Geneva
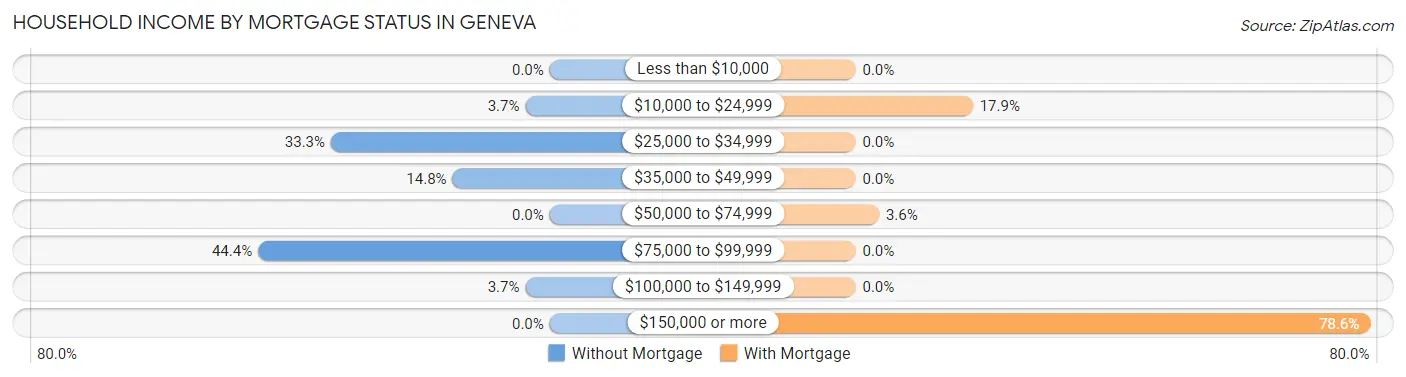
| Household Income | Without Mortgage | With Mortgage |
| Less than $10,000 | 0 (0.0%) | 0 (0.0%) |
| $10,000 to $24,999 | 1 (3.7%) | 5 (17.9%) |
| $25,000 to $34,999 | 9 (33.3%) | 0 (0.0%) |
| $35,000 to $49,999 | 4 (14.8%) | 0 (0.0%) |
| $50,000 to $74,999 | 0 (0.0%) | 1 (3.6%) |
| $75,000 to $99,999 | 12 (44.4%) | 0 (0.0%) |
| $100,000 to $149,999 | 1 (3.7%) | 0 (0.0%) |
| $150,000 or more | 0 (0.0%) | 22 (78.6%) |
| Total | 27 (100.0%) | 28 (100.0%) |
Property Value to Household Income Ratio in Geneva
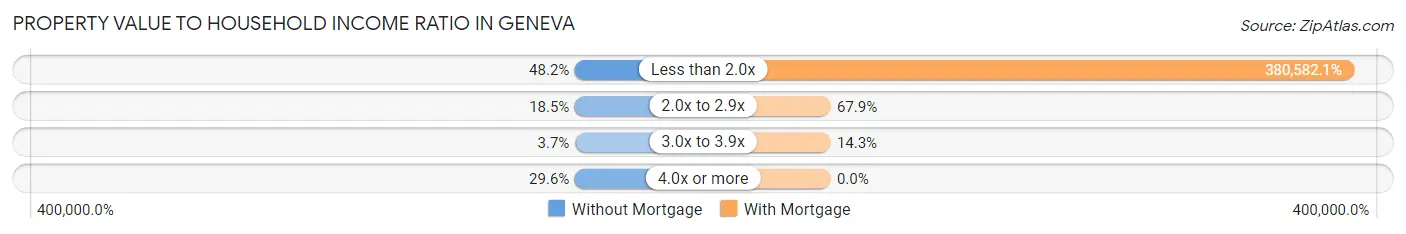
| Value-to-Income Ratio | Without Mortgage | With Mortgage |
| Less than 2.0x | 13 (48.1%) | 106,563 (380,582.1%) |
| 2.0x to 2.9x | 5 (18.5%) | 19 (67.9%) |
| 3.0x to 3.9x | 1 (3.7%) | 4 (14.3%) |
| 4.0x or more | 8 (29.6%) | 0 (0.0%) |
| Total | 27 (100.0%) | 28 (100.0%) |
Real Estate Taxes by Mortgage Status in Geneva
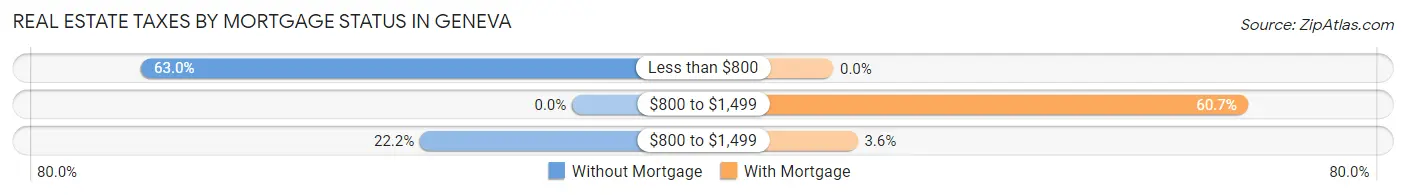
| Property Taxes | Without Mortgage | With Mortgage |
| Less than $800 | 17 (63.0%) | 0 (0.0%) |
| $800 to $1,499 | 0 (0.0%) | 17 (60.7%) |
| $800 to $1,499 | 6 (22.2%) | 1 (3.6%) |
| Total | 27 (100.0%) | 28 (100.0%) |
Health & Disability in Geneva
Health Insurance Coverage by Age in Geneva
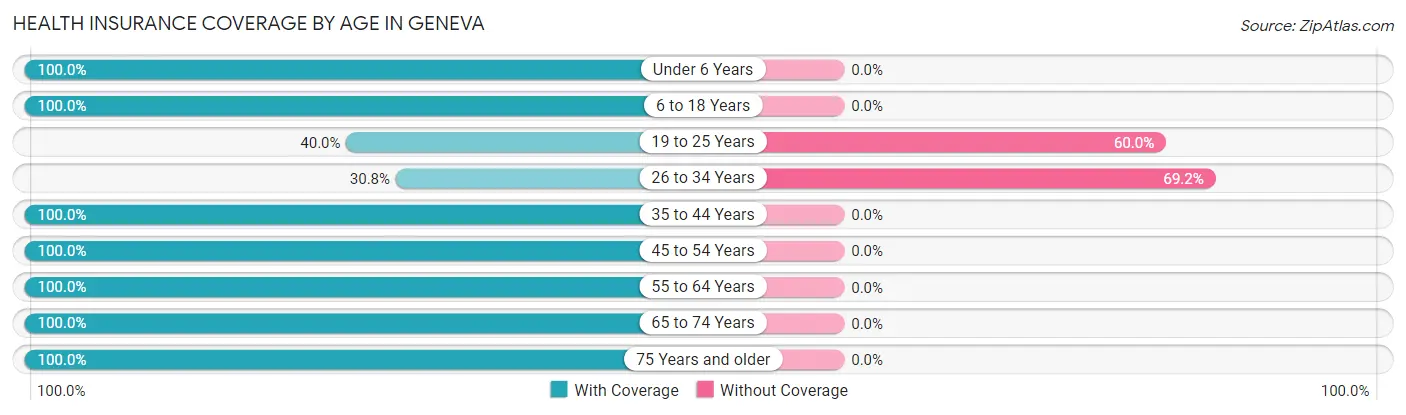
| Age Bracket | With Coverage | Without Coverage |
| Under 6 Years | 6 (100.0%) | 0 (0.0%) |
| 6 to 18 Years | 14 (100.0%) | 0 (0.0%) |
| 19 to 25 Years | 4 (40.0%) | 6 (60.0%) |
| 26 to 34 Years | 4 (30.8%) | 9 (69.2%) |
| 35 to 44 Years | 18 (100.0%) | 0 (0.0%) |
| 45 to 54 Years | 3 (100.0%) | 0 (0.0%) |
| 55 to 64 Years | 43 (100.0%) | 0 (0.0%) |
| 65 to 74 Years | 16 (100.0%) | 0 (0.0%) |
| 75 Years and older | 17 (100.0%) | 0 (0.0%) |
| Total | 125 (89.3%) | 15 (10.7%) |
Health Insurance Coverage by Citizenship Status in Geneva
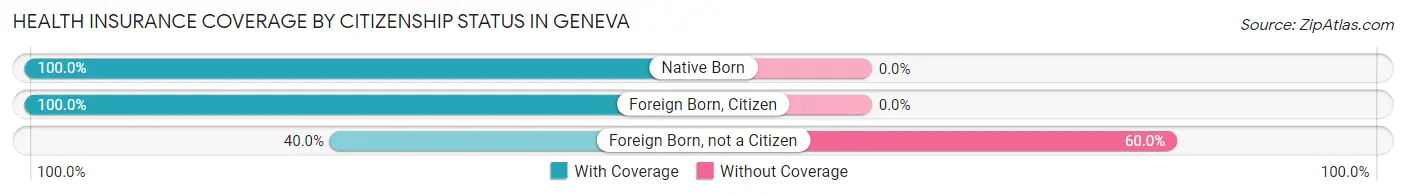
| Citizenship Status | With Coverage | Without Coverage |
| Native Born | 6 (100.0%) | 0 (0.0%) |
| Foreign Born, Citizen | 14 (100.0%) | 0 (0.0%) |
| Foreign Born, not a Citizen | 4 (40.0%) | 6 (60.0%) |
Health Insurance Coverage by Household Income in Geneva
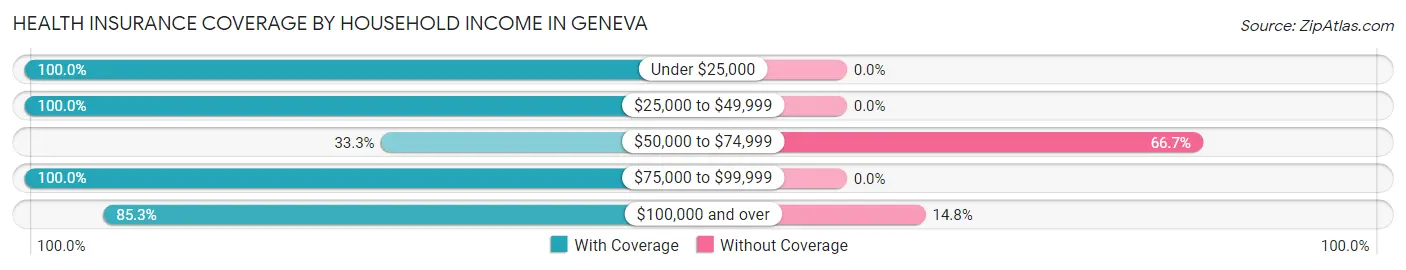
| Household Income | With Coverage | Without Coverage |
| Under $25,000 | 14 (100.0%) | 0 (0.0%) |
| $25,000 to $49,999 | 26 (100.0%) | 0 (0.0%) |
| $50,000 to $74,999 | 3 (33.3%) | 6 (66.7%) |
| $75,000 to $99,999 | 30 (100.0%) | 0 (0.0%) |
| $100,000 and over | 52 (85.3%) | 9 (14.7%) |
Public vs Private Health Insurance Coverage by Age in Geneva
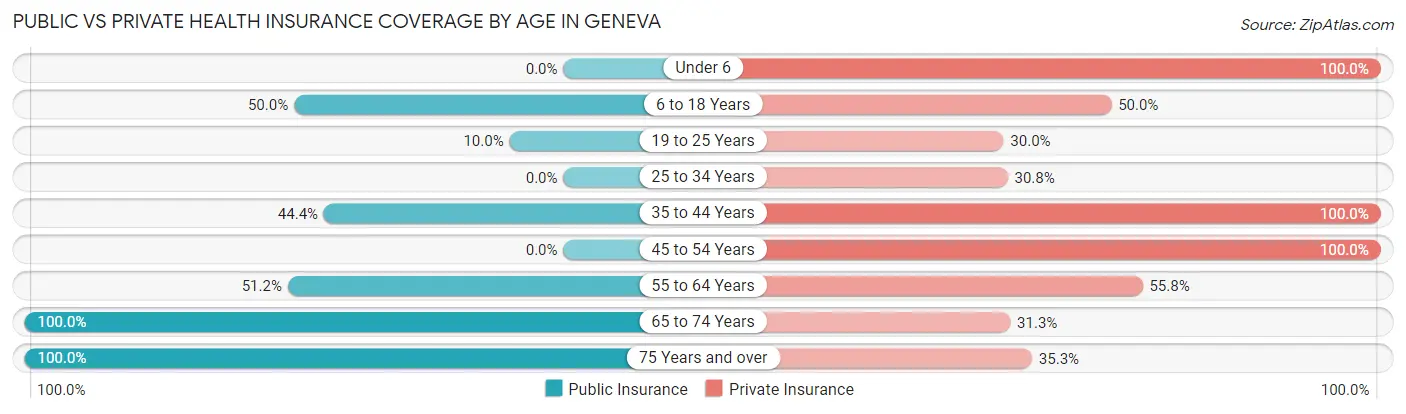
| Age Bracket | Public Insurance | Private Insurance |
| Under 6 | 0 (0.0%) | 6 (100.0%) |
| 6 to 18 Years | 7 (50.0%) | 7 (50.0%) |
| 19 to 25 Years | 1 (10.0%) | 3 (30.0%) |
| 25 to 34 Years | 0 (0.0%) | 4 (30.8%) |
| 35 to 44 Years | 8 (44.4%) | 18 (100.0%) |
| 45 to 54 Years | 0 (0.0%) | 3 (100.0%) |
| 55 to 64 Years | 22 (51.2%) | 24 (55.8%) |
| 65 to 74 Years | 16 (100.0%) | 5 (31.2%) |
| 75 Years and over | 17 (100.0%) | 6 (35.3%) |
| Total | 71 (50.7%) | 76 (54.3%) |
Disability Status by Sex by Age in Geneva
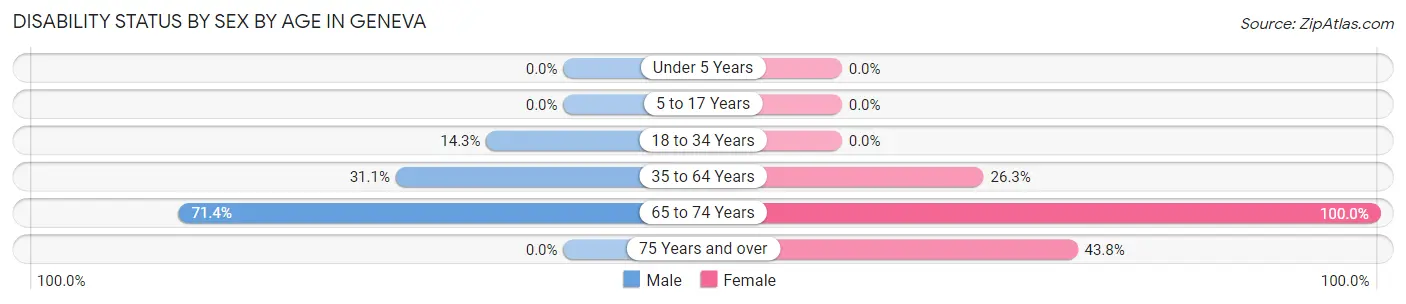
| Age Bracket | Male | Female |
| Under 5 Years | 0 (0.0%) | 0 (0.0%) |
| 5 to 17 Years | 0 (0.0%) | 0 (0.0%) |
| 18 to 34 Years | 1 (14.3%) | 0 (0.0%) |
| 35 to 64 Years | 14 (31.1%) | 5 (26.3%) |
| 65 to 74 Years | 10 (71.4%) | 2 (100.0%) |
| 75 Years and over | 0 (0.0%) | 7 (43.8%) |
Disability Class by Sex by Age in Geneva
Disability Class: Hearing Difficulty
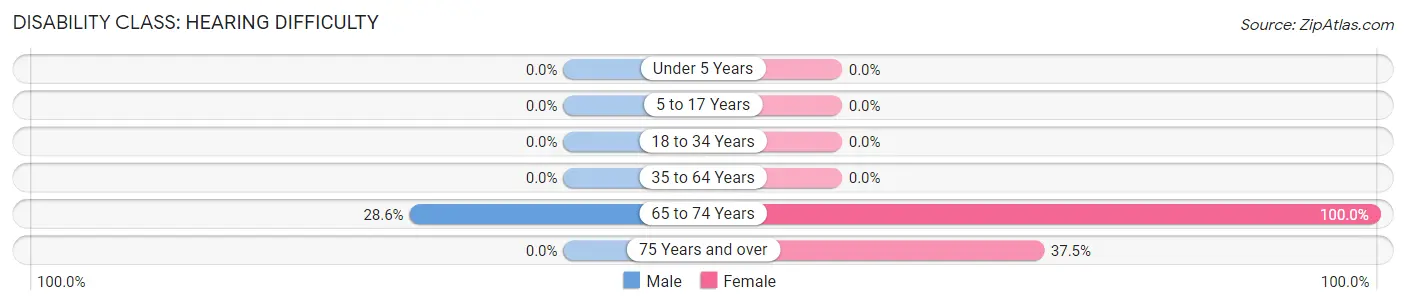
| Age Bracket | Male | Female |
| Under 5 Years | 0 (0.0%) | 0 (0.0%) |
| 5 to 17 Years | 0 (0.0%) | 0 (0.0%) |
| 18 to 34 Years | 0 (0.0%) | 0 (0.0%) |
| 35 to 64 Years | 0 (0.0%) | 0 (0.0%) |
| 65 to 74 Years | 4 (28.6%) | 2 (100.0%) |
| 75 Years and over | 0 (0.0%) | 6 (37.5%) |
Disability Class: Vision Difficulty
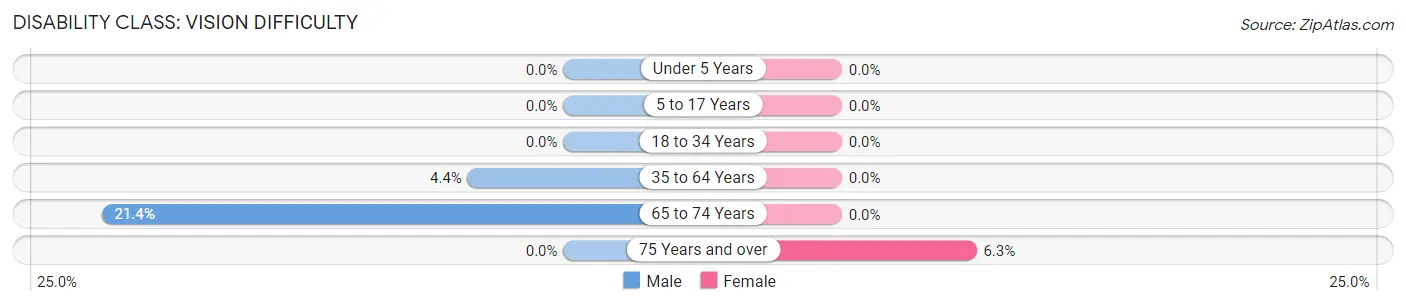
| Age Bracket | Male | Female |
| Under 5 Years | 0 (0.0%) | 0 (0.0%) |
| 5 to 17 Years | 0 (0.0%) | 0 (0.0%) |
| 18 to 34 Years | 0 (0.0%) | 0 (0.0%) |
| 35 to 64 Years | 2 (4.4%) | 0 (0.0%) |
| 65 to 74 Years | 3 (21.4%) | 0 (0.0%) |
| 75 Years and over | 0 (0.0%) | 1 (6.2%) |
Disability Class: Cognitive Difficulty
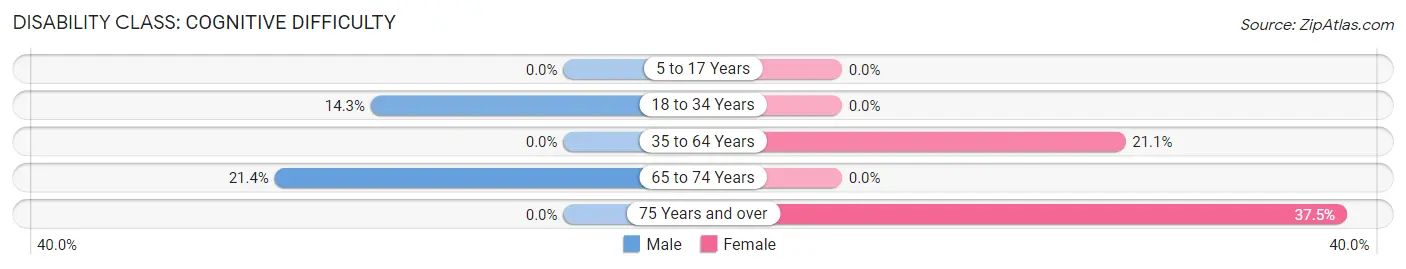
| Age Bracket | Male | Female |
| 5 to 17 Years | 0 (0.0%) | 0 (0.0%) |
| 18 to 34 Years | 1 (14.3%) | 0 (0.0%) |
| 35 to 64 Years | 0 (0.0%) | 4 (21.0%) |
| 65 to 74 Years | 3 (21.4%) | 0 (0.0%) |
| 75 Years and over | 0 (0.0%) | 6 (37.5%) |
Disability Class: Ambulatory Difficulty
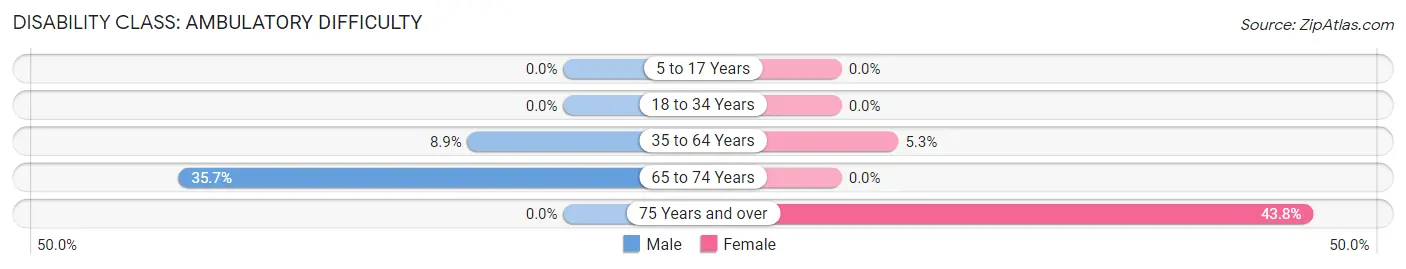
| Age Bracket | Male | Female |
| 5 to 17 Years | 0 (0.0%) | 0 (0.0%) |
| 18 to 34 Years | 0 (0.0%) | 0 (0.0%) |
| 35 to 64 Years | 4 (8.9%) | 1 (5.3%) |
| 65 to 74 Years | 5 (35.7%) | 0 (0.0%) |
| 75 Years and over | 0 (0.0%) | 7 (43.8%) |
Disability Class: Self-Care Difficulty
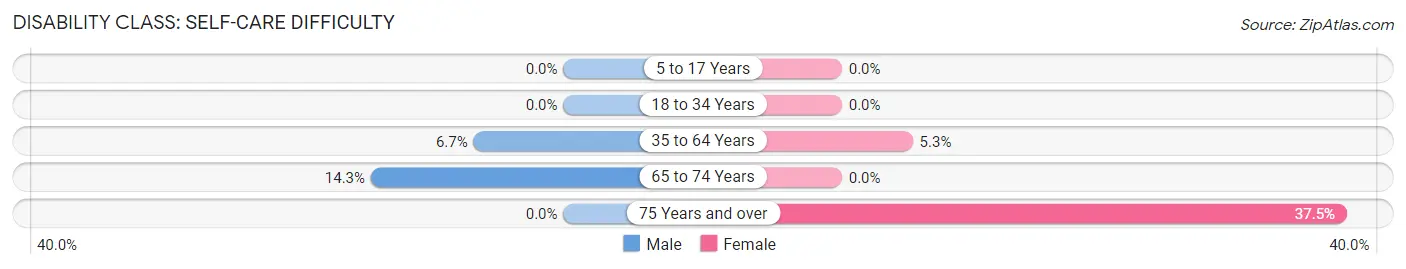
| Age Bracket | Male | Female |
| 5 to 17 Years | 0 (0.0%) | 0 (0.0%) |
| 18 to 34 Years | 0 (0.0%) | 0 (0.0%) |
| 35 to 64 Years | 3 (6.7%) | 1 (5.3%) |
| 65 to 74 Years | 2 (14.3%) | 0 (0.0%) |
| 75 Years and over | 0 (0.0%) | 6 (37.5%) |
Technology Access in Geneva
Computing Device Access in Geneva
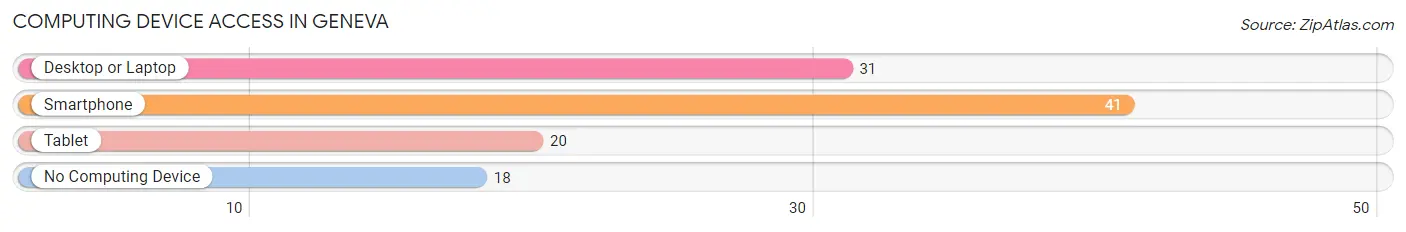
| Device Type | # Households | % Households |
| Desktop or Laptop | 31 | 50.0% |
| Smartphone | 41 | 66.1% |
| Tablet | 20 | 32.3% |
| No Computing Device | 18 | 29.0% |
| Total | 62 | 100.0% |
Internet Access in Geneva
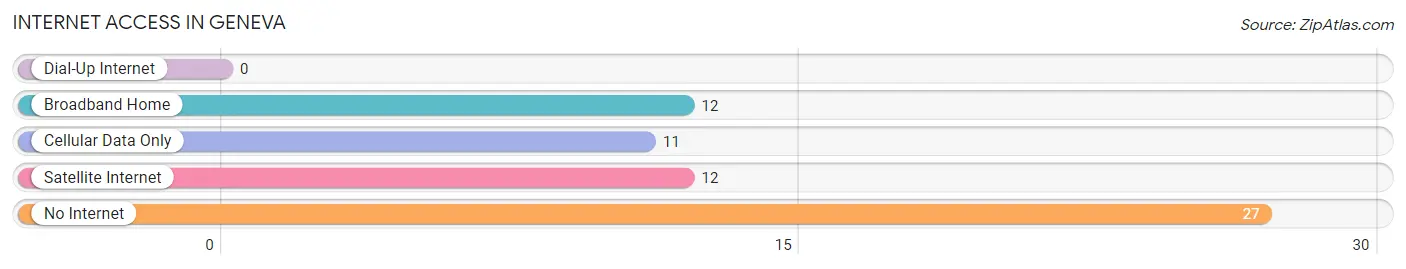
| Internet Type | # Households | % Households |
| Dial-Up Internet | 0 | 0.0% |
| Broadband Home | 12 | 19.4% |
| Cellular Data Only | 11 | 17.7% |
| Satellite Internet | 12 | 19.4% |
| No Internet | 27 | 43.5% |
| Total | 62 | 100.0% |
Geneva Summary
Geneva is a small city located in the state of Georgia, United States. It is situated in the southeastern corner of the state, near the border with Florida. The city is part of the Valdosta Metropolitan Statistical Area and is the county seat of Seminole County. As of the 2010 census, the population of Geneva was 1,845.
Geography
Geneva is located at 30°51'25" North, 83°37'17" West (30.856944, -83.621389). The city has a total area of 2.2 square miles, all of which is land. The city is situated on the banks of the Withlacoochee River, which forms the border between Georgia and Florida.
Climate
Geneva has a humid subtropical climate, with hot, humid summers and mild winters. The average annual temperature is around 70°F (21°C). The average annual precipitation is around 50 inches (127 cm).
Demographics
As of the 2010 census, there were 1,845 people, 717 households, and 486 families residing in the city. The population density was 837.5 people per square mile (323.7/km2). The racial makeup of the city was 68.2% White, 28.2% African American, 0.2% Native American, 0.7% Asian, 0.1% Pacific Islander, 0.9% from other races, and 1.7% from two or more races. Hispanic or Latino of any race were 2.3% of the population.
Economy
Geneva is a small city with a limited economy. The city is home to a few small businesses, including a grocery store, a hardware store, and a few restaurants. The city is also home to a few manufacturing companies, including a paper mill and a wood products plant. The city is also home to a few farms, which produce a variety of crops, including cotton, peanuts, and corn.
History
Geneva was founded in 1837 and was originally known as "Geneva Station". The city was named after Geneva, Switzerland, by a Swiss immigrant who settled in the area. The city was incorporated in 1891 and was named the county seat of Seminole County in 1895.
In the early 1900s, Geneva was a thriving agricultural center, with cotton, peanuts, and corn being the main crops. The city was also home to a few manufacturing companies, including a paper mill and a wood products plant.
In the late 20th century, the city began to decline economically, as many of the manufacturing companies closed down. The city has since been trying to revitalize its economy, with the help of the local government and businesses.
Common Questions
What is Per Capita Income in Geneva?
Per Capita income in Geneva is $29,713.
What is the Median Family Income in Geneva?
Median Family Income in Geneva is $75,417.
What is the Median Household income in Geneva?
Median Household Income in Geneva is $76,111.
What is Income or Wage Gap in Geneva?
Income or Wage Gap in Geneva is 23.9%.
Women in Geneva earn 76.1 cents for every dollar earned by a man.
What is Inequality or Gini Index in Geneva?
Inequality or Gini Index in Geneva is 0.33.
What is the Total Population of Geneva?
Total Population of Geneva is 140.
What is the Total Male Population of Geneva?
Total Male Population of Geneva is 76.
What is the Total Female Population of Geneva?
Total Female Population of Geneva is 64.
What is the Ratio of Males per 100 Females in Geneva?
There are 118.75 Males per 100 Females in Geneva.
What is the Ratio of Females per 100 Males in Geneva?
There are 84.21 Females per 100 Males in Geneva.
What is the Median Population Age in Geneva?
Median Population Age in Geneva is 56.9 Years.
What is the Average Family Size in Geneva
Average Family Size in Geneva is 2.4 People.
What is the Average Household Size in Geneva
Average Household Size in Geneva is 2.3 People.
How Large is the Labor Force in Geneva?
There are 48 People in the Labor Forcein in Geneva.
What is the Percentage of People in the Labor Force in Geneva?
40.0% of People are in the Labor Force in Geneva.