Florida City, FL Map & Demographics
Florida City Map
Florida City Overview
$16,019
PER CAPITA INCOME
$50,149
AVG FAMILY INCOME
$44,774
AVG HOUSEHOLD INCOME
0.9%
WAGE / INCOME GAP [ % ]
99.1¢/ $1
WAGE / INCOME GAP [ $ ]
0.46
INEQUALITY / GINI INDEX
12,841
TOTAL POPULATION
6,043
MALE POPULATION
6,798
FEMALE POPULATION
88.89
MALES / 100 FEMALES
112.49
FEMALES / 100 MALES
28.5
MEDIAN AGE
4.4
AVG FAMILY SIZE
3.6
AVG HOUSEHOLD SIZE
4,907
LABOR FORCE [ PEOPLE ]
54.4%
PERCENT IN LABOR FORCE
8.8%
UNEMPLOYMENT RATE
Income in Florida City
Income Overview in Florida City
Per Capita Income in Florida City is $16,019, while median incomes of families and households are $50,149 and $44,774 respectively.
| Characteristic | Number | Measure |
| Per Capita Income | 12,841 | $16,019 |
| Median Family Income | 2,491 | $50,149 |
| Mean Family Income | 2,491 | $62,842 |
| Median Household Income | 3,543 | $44,774 |
| Mean Household Income | 3,543 | $55,404 |
| Income Deficit | 2,491 | $0 |
| Wage / Income Gap (%) | 12,841 | 0.92% |
| Wage / Income Gap ($) | 12,841 | 99.08¢ per $1 |
| Gini / Inequality Index | 12,841 | 0.46 |
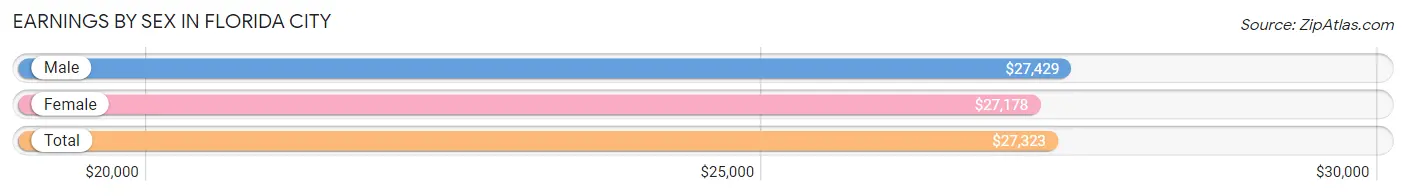
Earnings by Sex in Florida City
Average Earnings in Florida City are $27,323, $27,429 for men and $27,178 for women, a difference of 0.9%.
| Sex | Number | Average Earnings |
| Male | 2,346 (47.9%) | $27,429 |
| Female | 2,549 (52.1%) | $27,178 |
| Total | 4,895 (100.0%) | $27,323 |
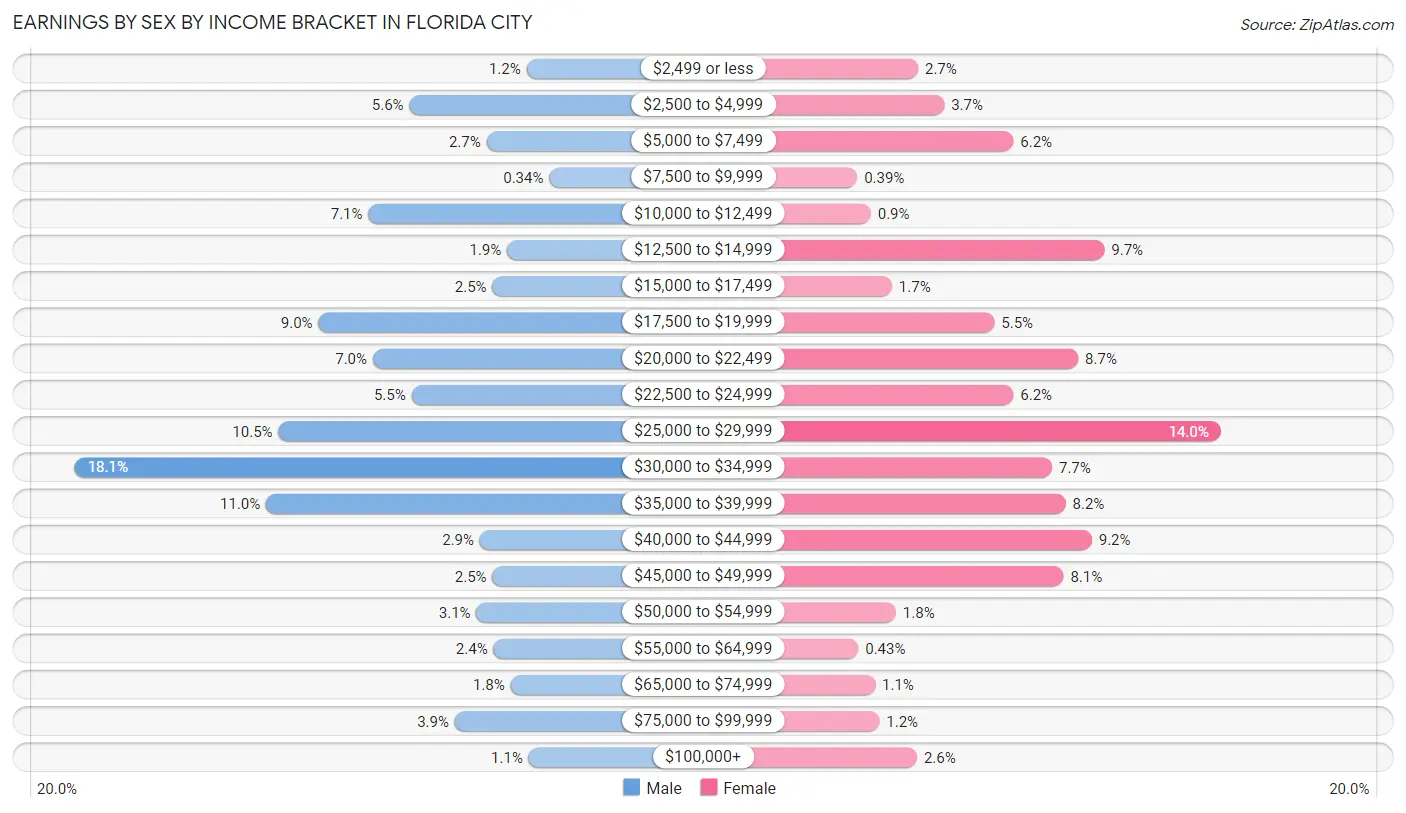
Earnings by Sex by Income Bracket in Florida City
The most common earnings brackets in Florida City are $30,000 to $34,999 for men (425 | 18.1%) and $25,000 to $29,999 for women (357 | 14.0%).
| Income | Male | Female |
| $2,499 or less | 28 (1.2%) | 68 (2.7%) |
| $2,500 to $4,999 | 131 (5.6%) | 93 (3.6%) |
| $5,000 to $7,499 | 63 (2.7%) | 159 (6.2%) |
| $7,500 to $9,999 | 8 (0.3%) | 10 (0.4%) |
| $10,000 to $12,499 | 167 (7.1%) | 23 (0.9%) |
| $12,500 to $14,999 | 45 (1.9%) | 246 (9.7%) |
| $15,000 to $17,499 | 58 (2.5%) | 43 (1.7%) |
| $17,500 to $19,999 | 211 (9.0%) | 141 (5.5%) |
| $20,000 to $22,499 | 163 (7.0%) | 221 (8.7%) |
| $22,500 to $24,999 | 129 (5.5%) | 159 (6.2%) |
| $25,000 to $29,999 | 246 (10.5%) | 357 (14.0%) |
| $30,000 to $34,999 | 425 (18.1%) | 196 (7.7%) |
| $35,000 to $39,999 | 257 (11.0%) | 209 (8.2%) |
| $40,000 to $44,999 | 69 (2.9%) | 234 (9.2%) |
| $45,000 to $49,999 | 58 (2.5%) | 207 (8.1%) |
| $50,000 to $54,999 | 72 (3.1%) | 47 (1.8%) |
| $55,000 to $64,999 | 57 (2.4%) | 11 (0.4%) |
| $65,000 to $74,999 | 42 (1.8%) | 27 (1.1%) |
| $75,000 to $99,999 | 91 (3.9%) | 31 (1.2%) |
| $100,000+ | 26 (1.1%) | 67 (2.6%) |
| Total | 2,346 (100.0%) | 2,549 (100.0%) |
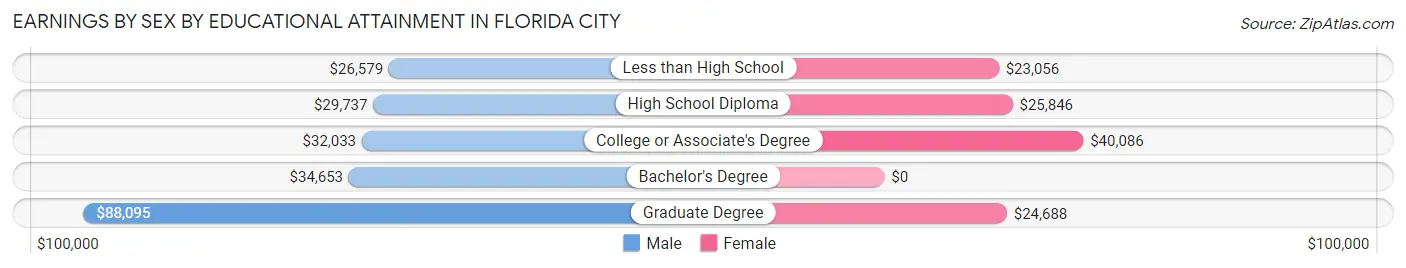
Earnings by Sex by Educational Attainment in Florida City
Average earnings in Florida City are $31,365 for men and $28,788 for women, a difference of 8.2%. Men with an educational attainment of graduate degree enjoy the highest average annual earnings of $88,095, while those with less than high school education earn the least with $26,579. Women with an educational attainment of college or associate's degree earn the most with the average annual earnings of $40,086, while those with less than high school education have the smallest earnings of $23,056.
| Educational Attainment | Male Income | Female Income |
| Less than High School | $26,579 | $23,056 |
| High School Diploma | $29,737 | $25,846 |
| College or Associate's Degree | $32,033 | $40,086 |
| Bachelor's Degree | $34,653 | $0 |
| Graduate Degree | $88,095 | $24,688 |
| Total | $31,365 | $28,788 |
Family Income in Florida City
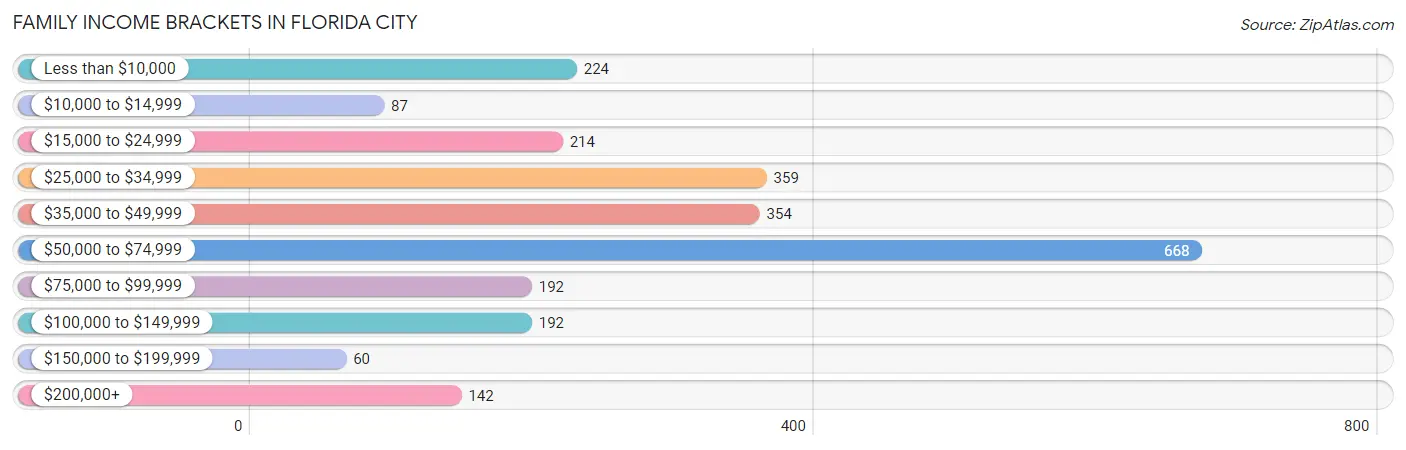
Family Income Brackets in Florida City
According to the Florida City family income data, there are 668 families falling into the $50,000 to $74,999 income range, which is the most common income bracket and makes up 26.8% of all families. Conversely, the $150,000 to $199,999 income bracket is the least frequent group with only 60 families (2.4%) belonging to this category.
| Income Bracket | # Families | % Families |
| Less than $10,000 | 224 | 9.0% |
| $10,000 to $14,999 | 87 | 3.5% |
| $15,000 to $24,999 | 214 | 8.6% |
| $25,000 to $34,999 | 359 | 14.4% |
| $35,000 to $49,999 | 354 | 14.2% |
| $50,000 to $74,999 | 668 | 26.8% |
| $75,000 to $99,999 | 192 | 7.7% |
| $100,000 to $149,999 | 192 | 7.7% |
| $150,000 to $199,999 | 60 | 2.4% |
| $200,000+ | 142 | 5.7% |
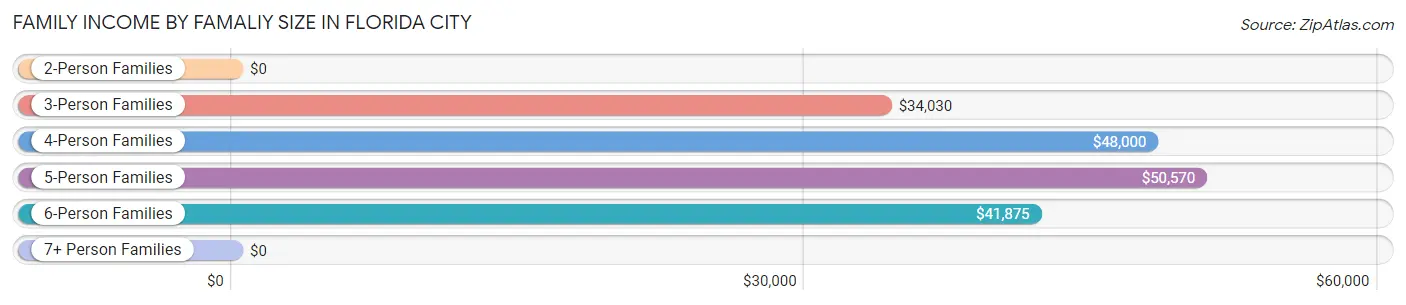
Family Income by Famaliy Size in Florida City
5-person families (536 | 21.5%) account for the highest median family income in Florida City with $50,570 per family, while 4-person families (690 | 27.7%) have the highest median income of $12,000 per family member.
| Income Bracket | # Families | Median Income |
| 2-Person Families | 417 (16.7%) | $0 |
| 3-Person Families | 521 (20.9%) | $34,030 |
| 4-Person Families | 690 (27.7%) | $48,000 |
| 5-Person Families | 536 (21.5%) | $50,570 |
| 6-Person Families | 146 (5.9%) | $41,875 |
| 7+ Person Families | 181 (7.3%) | $0 |
| Total | 2,491 (100.0%) | $50,149 |
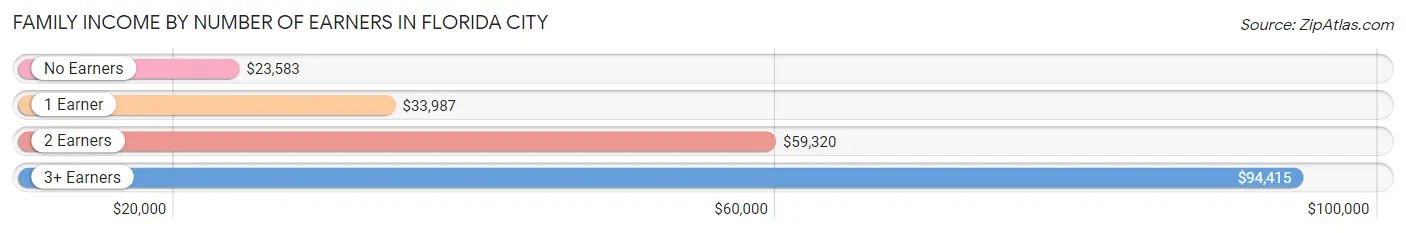
Family Income by Number of Earners in Florida City
The median family income in Florida City is $50,149, with families comprising 3+ earners (258) having the highest median family income of $94,415, while families with no earners (315) have the lowest median family income of $23,583, accounting for 10.4% and 12.7% of families, respectively.
| Number of Earners | # Families | Median Income |
| No Earners | 315 (12.7%) | $23,583 |
| 1 Earner | 1,069 (42.9%) | $33,987 |
| 2 Earners | 849 (34.1%) | $59,320 |
| 3+ Earners | 258 (10.4%) | $94,415 |
| Total | 2,491 (100.0%) | $50,149 |
Household Income in Florida City
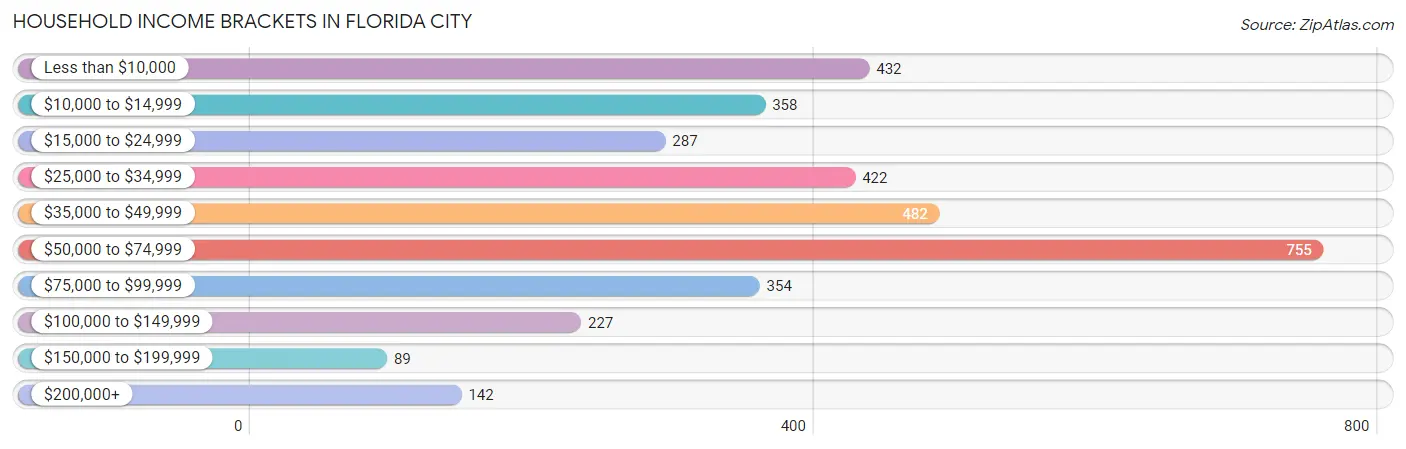
Household Income Brackets in Florida City
With 755 households falling in the category, the $50,000 to $74,999 income range is the most frequent in Florida City, accounting for 21.3% of all households. In contrast, only 89 households (2.5%) fall into the $150,000 to $199,999 income bracket, making it the least populous group.
| Income Bracket | # Households | % Households |
| Less than $10,000 | 432 | 12.2% |
| $10,000 to $14,999 | 358 | 10.1% |
| $15,000 to $24,999 | 287 | 8.1% |
| $25,000 to $34,999 | 422 | 11.9% |
| $35,000 to $49,999 | 482 | 13.6% |
| $50,000 to $74,999 | 755 | 21.3% |
| $75,000 to $99,999 | 354 | 10.0% |
| $100,000 to $149,999 | 227 | 6.4% |
| $150,000 to $199,999 | 89 | 2.5% |
| $200,000+ | 142 | 4.0% |
Household Income by Householder Age in Florida City
The median household income in Florida City is $44,774, with the highest median household income of $50,013 found in the 45 to 64 years age bracket for the primary householder. A total of 1,313 households (37.1%) fall into this category. Meanwhile, the 15 to 24 years age bracket for the primary householder has the lowest median household income of $0, with 153 households (4.3%) in this group.
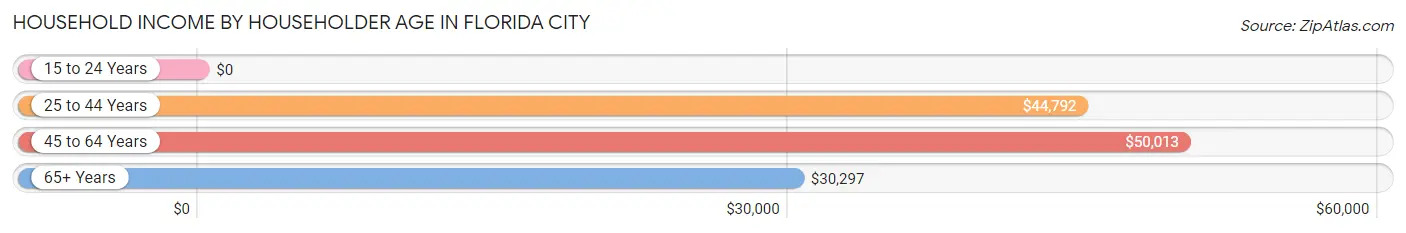
| Income Bracket | # Households | Median Income |
| 15 to 24 Years | 153 (4.3%) | $0 |
| 25 to 44 Years | 1,227 (34.6%) | $44,792 |
| 45 to 64 Years | 1,313 (37.1%) | $50,013 |
| 65+ Years | 850 (24.0%) | $30,297 |
| Total | 3,543 (100.0%) | $44,774 |
Poverty in Florida City
Income Below Poverty by Sex and Age in Florida City
With 30.4% poverty level for males and 34.6% for females among the residents of Florida City, 15 year old males and 15 year old females are the most vulnerable to poverty, with 23 males (63.9%) and 78 females (71.6%) in their respective age groups living below the poverty level.
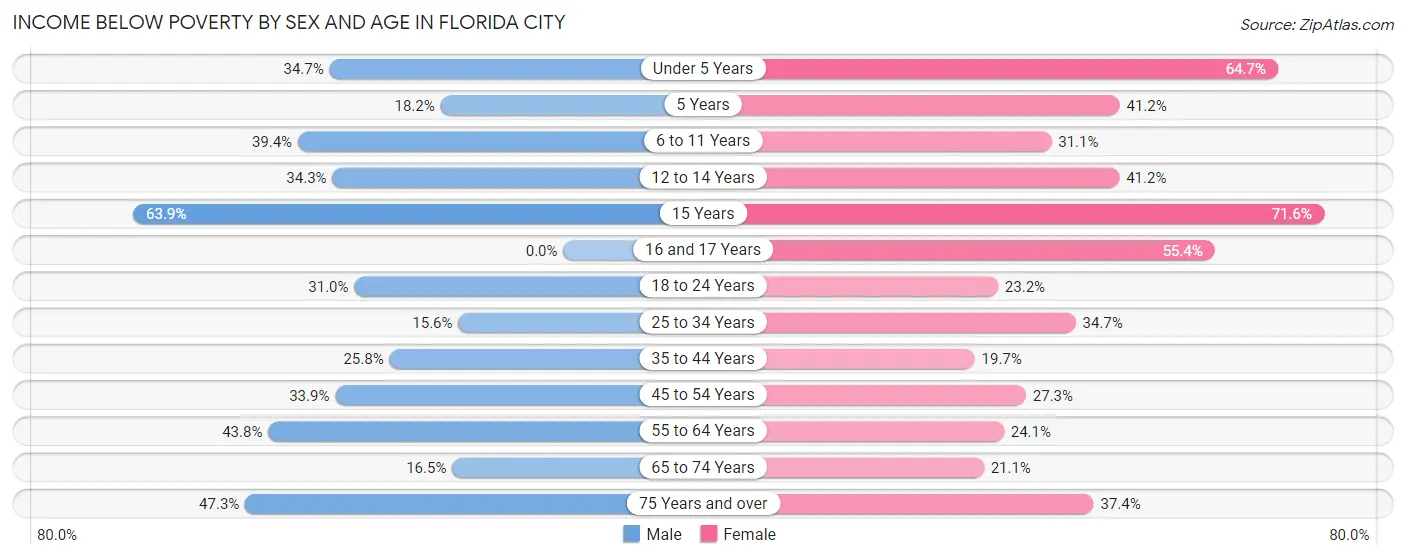
| Age Bracket | Male | Female |
| Under 5 Years | 208 (34.7%) | 448 (64.7%) |
| 5 Years | 31 (18.2%) | 120 (41.2%) |
| 6 to 11 Years | 281 (39.4%) | 177 (31.1%) |
| 12 to 14 Years | 72 (34.3%) | 178 (41.2%) |
| 15 Years | 23 (63.9%) | 78 (71.6%) |
| 16 and 17 Years | 0 (0.0%) | 196 (55.4%) |
| 18 to 24 Years | 287 (31.0%) | 105 (23.2%) |
| 25 to 34 Years | 104 (15.6%) | 403 (34.7%) |
| 35 to 44 Years | 204 (25.8%) | 186 (19.7%) |
| 45 to 54 Years | 212 (33.9%) | 126 (27.3%) |
| 55 to 64 Years | 202 (43.8%) | 139 (24.0%) |
| 65 to 74 Years | 51 (16.5%) | 114 (21.1%) |
| 75 Years and over | 163 (47.2%) | 80 (37.4%) |
| Total | 1,838 (30.4%) | 2,350 (34.6%) |
Income Above Poverty by Sex and Age in Florida City
According to the poverty statistics in Florida City, males aged 16 and 17 years and females aged 35 to 44 years are the age groups that are most secure financially, with 100.0% of males and 80.3% of females in these age groups living above the poverty line.
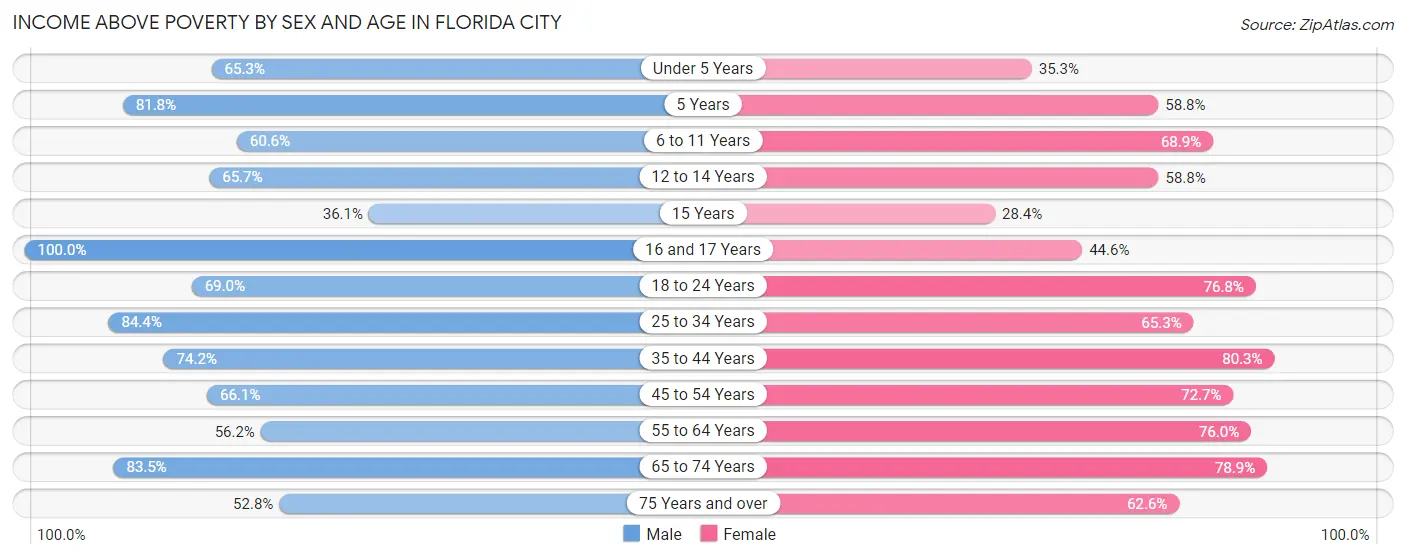
| Age Bracket | Male | Female |
| Under 5 Years | 391 (65.3%) | 244 (35.3%) |
| 5 Years | 139 (81.8%) | 171 (58.8%) |
| 6 to 11 Years | 432 (60.6%) | 392 (68.9%) |
| 12 to 14 Years | 138 (65.7%) | 254 (58.8%) |
| 15 Years | 13 (36.1%) | 31 (28.4%) |
| 16 and 17 Years | 189 (100.0%) | 158 (44.6%) |
| 18 to 24 Years | 638 (69.0%) | 348 (76.8%) |
| 25 to 34 Years | 563 (84.4%) | 758 (65.3%) |
| 35 to 44 Years | 586 (74.2%) | 757 (80.3%) |
| 45 to 54 Years | 414 (66.1%) | 335 (72.7%) |
| 55 to 64 Years | 259 (56.2%) | 439 (75.9%) |
| 65 to 74 Years | 258 (83.5%) | 427 (78.9%) |
| 75 Years and over | 182 (52.7%) | 134 (62.6%) |
| Total | 4,202 (69.6%) | 4,448 (65.4%) |
Income Below Poverty Among Married-Couple Families in Florida City
The poverty statistics for married-couple families in Florida City show that 13.1% or 152 of the total 1,157 families live below the poverty line. Families with 5 or more children have the highest poverty rate of 67.4%, comprising of 29 families. On the other hand, families with 1 or 2 children have the lowest poverty rate of 8.0%, which includes 32 families.
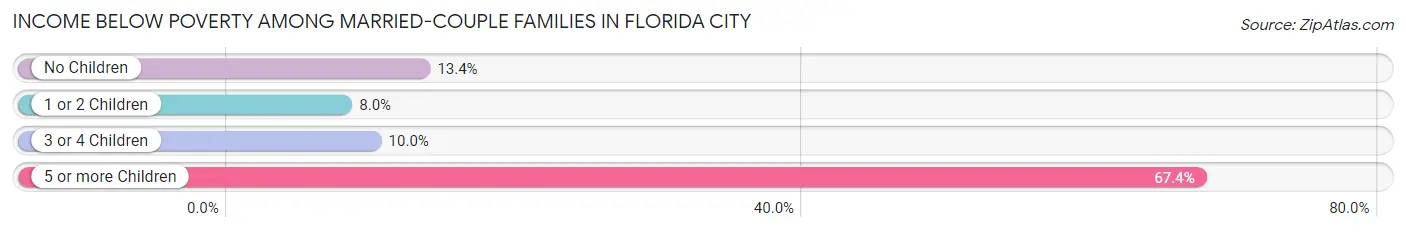
| Children | Above Poverty | Below Poverty |
| No Children | 504 (86.6%) | 78 (13.4%) |
| 1 or 2 Children | 370 (92.0%) | 32 (8.0%) |
| 3 or 4 Children | 117 (90.0%) | 13 (10.0%) |
| 5 or more Children | 14 (32.6%) | 29 (67.4%) |
| Total | 1,005 (86.9%) | 152 (13.1%) |
Income Below Poverty Among Single-Parent Households in Florida City
According to the poverty data in Florida City, 12.8% or 54 single-father households and 45.1% or 411 single-mother households are living below the poverty line. Among single-father households, those with 3 or 4 children have the highest poverty rate, with 19 households (41.3%) experiencing poverty. Likewise, among single-mother households, those with 5 or more children have the highest poverty rate, with 57 households (100.0%) falling below the poverty line.
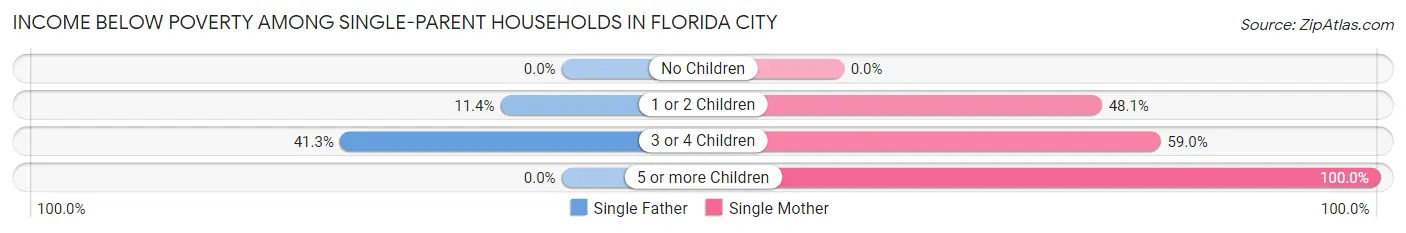
| Children | Single Father | Single Mother |
| No Children | 0 (0.0%) | 0 (0.0%) |
| 1 or 2 Children | 35 (11.4%) | 223 (48.1%) |
| 3 or 4 Children | 19 (41.3%) | 131 (59.0%) |
| 5 or more Children | 0 (0.0%) | 57 (100.0%) |
| Total | 54 (12.8%) | 411 (45.1%) |
Income Below Poverty Among Married-Couple vs Single-Parent Households in Florida City
The poverty data for Florida City shows that 152 of the married-couple family households (13.1%) and 465 of the single-parent households (34.9%) are living below the poverty level. Within the married-couple family households, those with 5 or more children have the highest poverty rate, with 29 households (67.4%) falling below the poverty line. Among the single-parent households, those with 5 or more children have the highest poverty rate, with 57 household (100.0%) living below poverty.
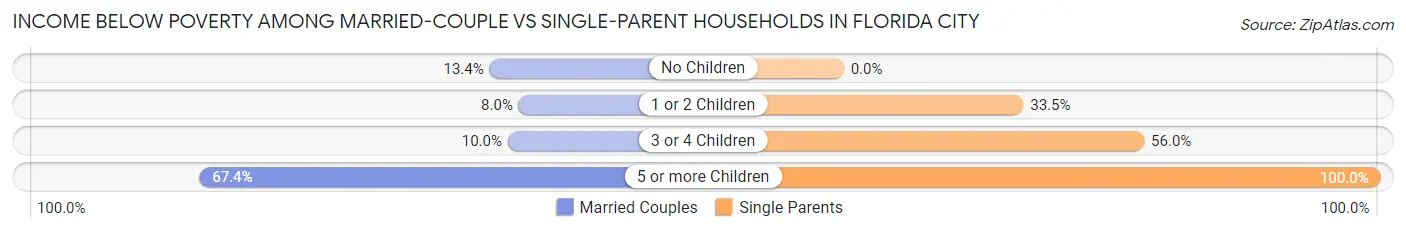
| Children | Married-Couple Families | Single-Parent Households |
| No Children | 78 (13.4%) | 0 (0.0%) |
| 1 or 2 Children | 32 (8.0%) | 258 (33.5%) |
| 3 or 4 Children | 13 (10.0%) | 150 (56.0%) |
| 5 or more Children | 29 (67.4%) | 57 (100.0%) |
| Total | 152 (13.1%) | 465 (34.9%) |
Race in Florida City
The most populous races in Florida City are Black / African American (6,478 | 50.4%), Hispanic or Latino (6,274 | 48.9%), and White / Caucasian (3,562 | 27.7%).
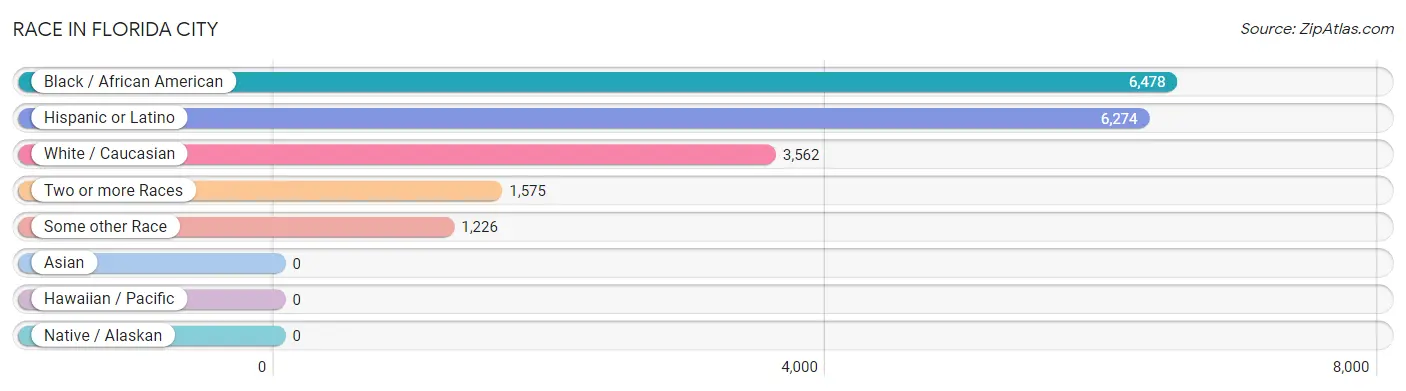
| Race | # Population | % Population |
| Asian | 0 | 0.0% |
| Black / African American | 6,478 | 50.4% |
| Hawaiian / Pacific | 0 | 0.0% |
| Hispanic or Latino | 6,274 | 48.9% |
| Native / Alaskan | 0 | 0.0% |
| White / Caucasian | 3,562 | 27.7% |
| Two or more Races | 1,575 | 12.3% |
| Some other Race | 1,226 | 9.6% |
| Total | 12,841 | 100.0% |
Ancestry in Florida City
The most populous ancestries reported in Florida City are Mexican (2,747 | 21.4%), Cuban (1,502 | 11.7%), Haitian (1,065 | 8.3%), Central American (979 | 7.6%), and Nicaraguan (479 | 3.7%), together accounting for 52.7% of all Florida City residents.
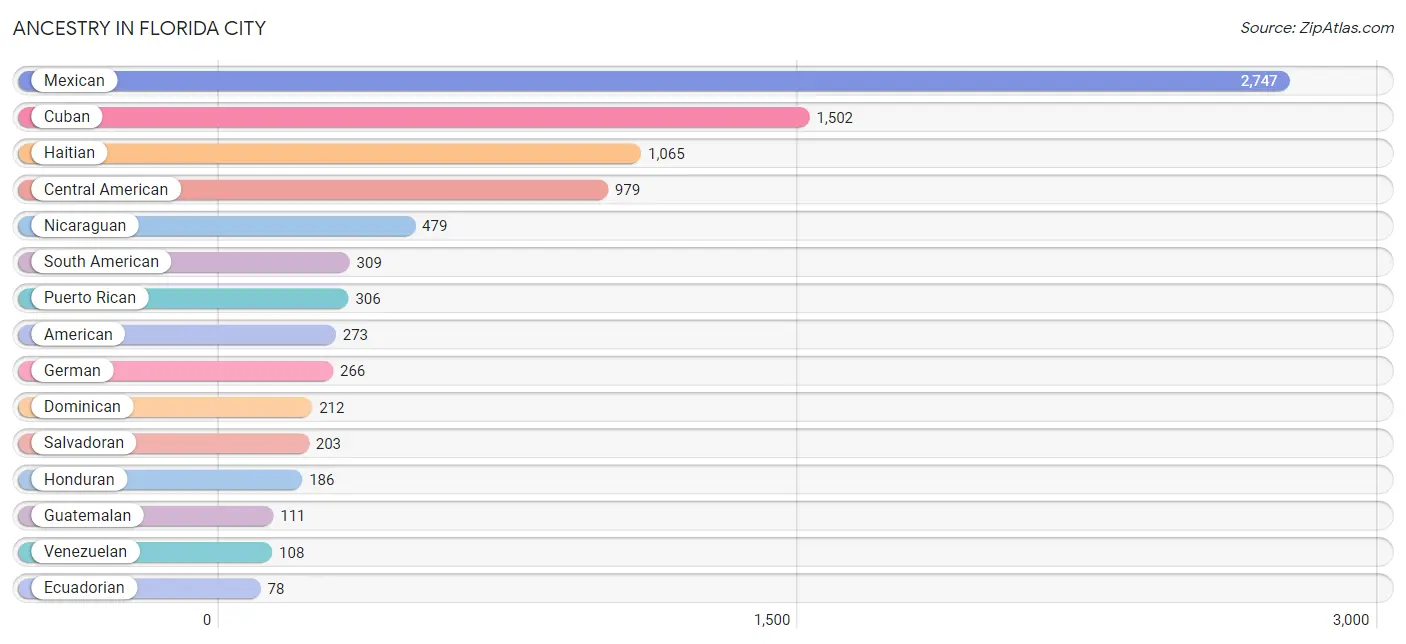
| Ancestry | # Population | % Population |
| American | 273 | 2.1% |
| Argentinean | 53 | 0.4% |
| Bahamian | 34 | 0.3% |
| British | 8 | 0.1% |
| Central American | 979 | 7.6% |
| Colombian | 70 | 0.5% |
| Cuban | 1,502 | 11.7% |
| Dominican | 212 | 1.7% |
| Ecuadorian | 78 | 0.6% |
| English | 11 | 0.1% |
| European | 10 | 0.1% |
| French | 4 | 0.0% |
| German | 266 | 2.1% |
| Guatemalan | 111 | 0.9% |
| Haitian | 1,065 | 8.3% |
| Honduran | 186 | 1.5% |
| Irish | 23 | 0.2% |
| Italian | 39 | 0.3% |
| Jamaican | 71 | 0.5% |
| Mexican | 2,747 | 21.4% |
| Nicaraguan | 479 | 3.7% |
| Polish | 21 | 0.2% |
| Puerto Rican | 306 | 2.4% |
| Salvadoran | 203 | 1.6% |
| South American | 309 | 2.4% |
| Subsaharan African | 13 | 0.1% |
| U.S. Virgin Islander | 1 | 0.0% |
| Venezuelan | 108 | 0.8% | View All 28 Rows |
Immigrants in Florida City
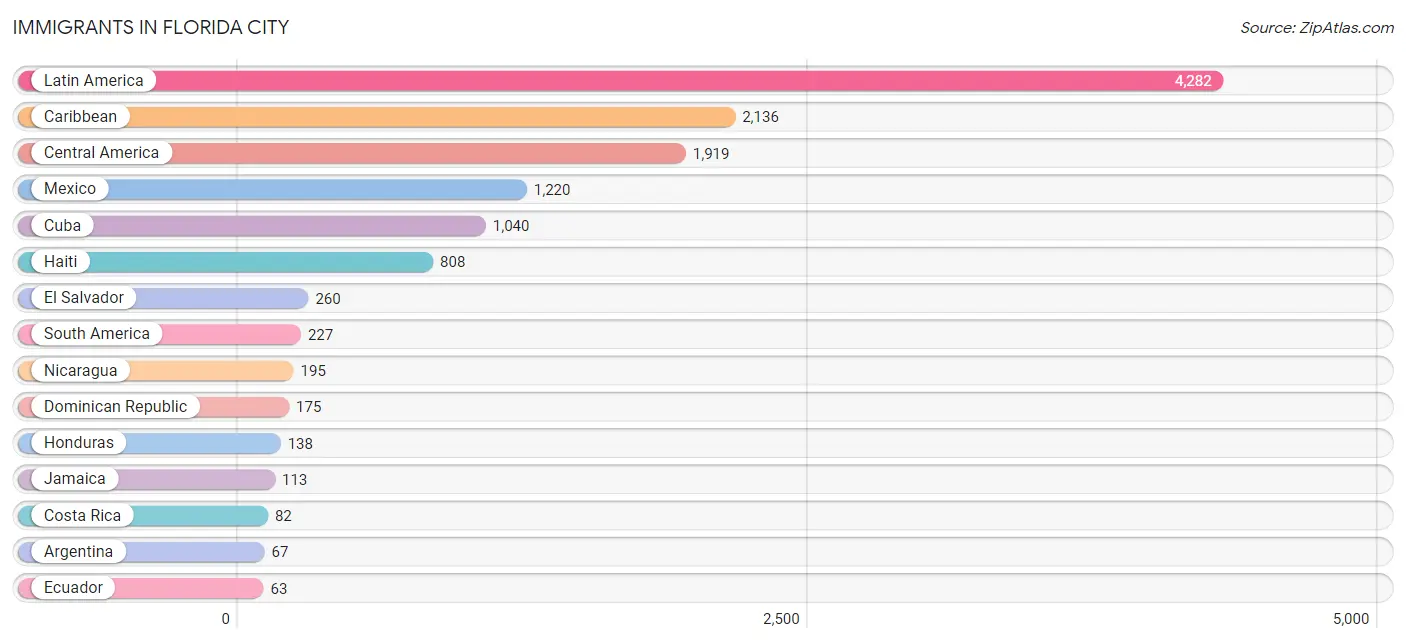
The most numerous immigrant groups reported in Florida City came from Latin America (4,282 | 33.4%), Caribbean (2,136 | 16.6%), Central America (1,919 | 14.9%), Mexico (1,220 | 9.5%), and Cuba (1,040 | 8.1%), together accounting for 82.5% of all Florida City residents.
| Immigration Origin | # Population | % Population |
| Africa | 13 | 0.1% |
| Argentina | 67 | 0.5% |
| Caribbean | 2,136 | 16.6% |
| Central America | 1,919 | 14.9% |
| Colombia | 48 | 0.4% |
| Costa Rica | 82 | 0.6% |
| Cuba | 1,040 | 8.1% |
| Dominican Republic | 175 | 1.4% |
| Ecuador | 63 | 0.5% |
| El Salvador | 260 | 2.0% |
| Guatemala | 24 | 0.2% |
| Guyana | 7 | 0.1% |
| Haiti | 808 | 6.3% |
| Honduras | 138 | 1.1% |
| Jamaica | 113 | 0.9% |
| Latin America | 4,282 | 33.4% |
| Mexico | 1,220 | 9.5% |
| Nicaragua | 195 | 1.5% |
| South America | 227 | 1.8% |
| Venezuela | 42 | 0.3% |
| Western Africa | 13 | 0.1% | View All 21 Rows |
Sex and Age in Florida City
Sex and Age in Florida City
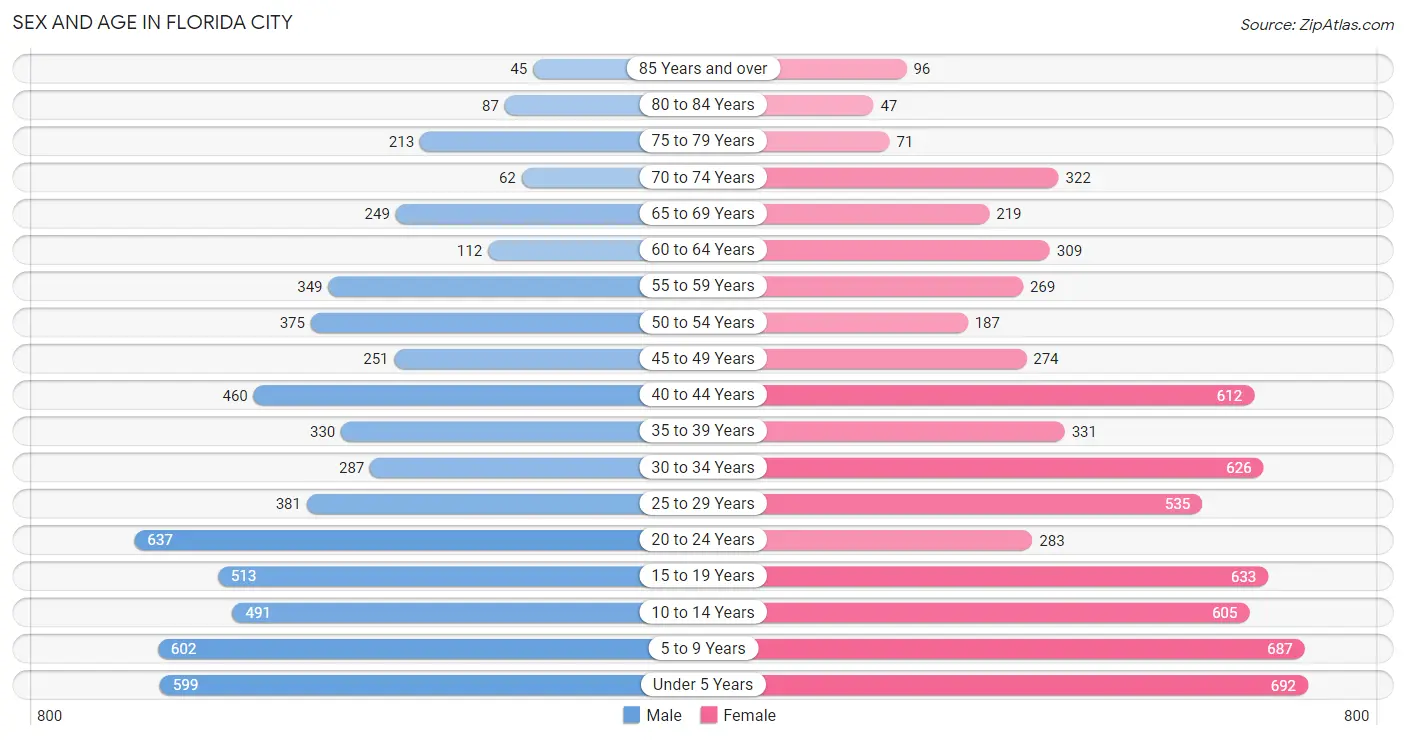
The most populous age groups in Florida City are 20 to 24 Years (637 | 10.5%) for men and Under 5 Years (692 | 10.2%) for women.
| Age Bracket | Male | Female |
| Under 5 Years | 599 (9.9%) | 692 (10.2%) |
| 5 to 9 Years | 602 (10.0%) | 687 (10.1%) |
| 10 to 14 Years | 491 (8.1%) | 605 (8.9%) |
| 15 to 19 Years | 513 (8.5%) | 633 (9.3%) |
| 20 to 24 Years | 637 (10.5%) | 283 (4.2%) |
| 25 to 29 Years | 381 (6.3%) | 535 (7.9%) |
| 30 to 34 Years | 287 (4.8%) | 626 (9.2%) |
| 35 to 39 Years | 330 (5.5%) | 331 (4.9%) |
| 40 to 44 Years | 460 (7.6%) | 612 (9.0%) |
| 45 to 49 Years | 251 (4.2%) | 274 (4.0%) |
| 50 to 54 Years | 375 (6.2%) | 187 (2.8%) |
| 55 to 59 Years | 349 (5.8%) | 269 (4.0%) |
| 60 to 64 Years | 112 (1.8%) | 309 (4.5%) |
| 65 to 69 Years | 249 (4.1%) | 219 (3.2%) |
| 70 to 74 Years | 62 (1.0%) | 322 (4.7%) |
| 75 to 79 Years | 213 (3.5%) | 71 (1.0%) |
| 80 to 84 Years | 87 (1.4%) | 47 (0.7%) |
| 85 Years and over | 45 (0.7%) | 96 (1.4%) |
| Total | 6,043 (100.0%) | 6,798 (100.0%) |
Families and Households in Florida City
Median Family Size in Florida City
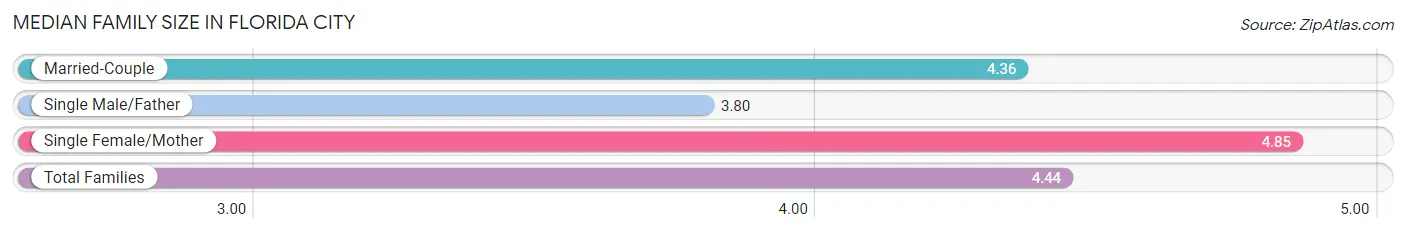
The median family size in Florida City is 4.44 persons per family, with single female/mother families (911 | 36.6%) accounting for the largest median family size of 4.85 persons per family. On the other hand, single male/father families (423 | 17.0%) represent the smallest median family size with 3.80 persons per family.
| Family Type | # Families | Family Size |
| Married-Couple | 1,157 (46.5%) | 4.36 |
| Single Male/Father | 423 (17.0%) | 3.80 |
| Single Female/Mother | 911 (36.6%) | 4.85 |
| Total Families | 2,491 (100.0%) | 4.44 |
Median Household Size in Florida City
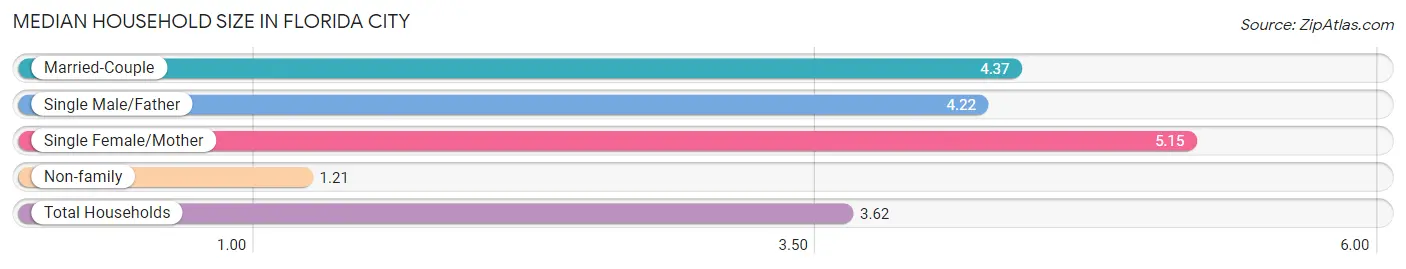
The median household size in Florida City is 3.62 persons per household, with single female/mother households (911 | 25.7%) accounting for the largest median household size of 5.15 persons per household. non-family households (1,052 | 29.7%) represent the smallest median household size with 1.21 persons per household.
| Household Type | # Households | Household Size |
| Married-Couple | 1,157 (32.7%) | 4.37 |
| Single Male/Father | 423 (11.9%) | 4.22 |
| Single Female/Mother | 911 (25.7%) | 5.15 |
| Non-family | 1,052 (29.7%) | 1.21 |
| Total Households | 3,543 (100.0%) | 3.62 |
Household Size by Marriage Status in Florida City
Out of a total of 3,543 households in Florida City, 2,491 (70.3%) are family households, while 1,052 (29.7%) are nonfamily households. The most numerous type of family households are 4-person households, comprising 690, and the most common type of nonfamily households are 1-person households, comprising 856.
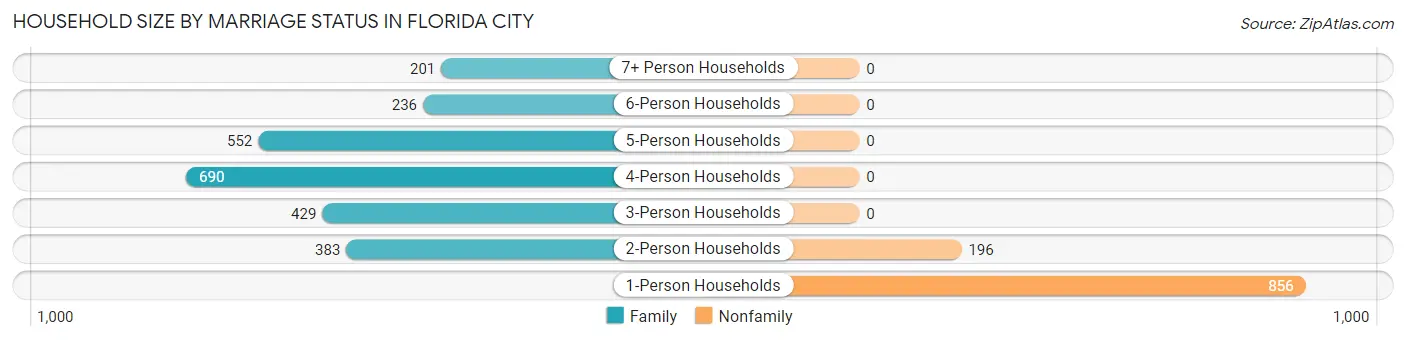
| Household Size | Family Households | Nonfamily Households |
| 1-Person Households | - | 856 (24.2%) |
| 2-Person Households | 383 (10.8%) | 196 (5.5%) |
| 3-Person Households | 429 (12.1%) | 0 (0.0%) |
| 4-Person Households | 690 (19.5%) | 0 (0.0%) |
| 5-Person Households | 552 (15.6%) | 0 (0.0%) |
| 6-Person Households | 236 (6.7%) | 0 (0.0%) |
| 7+ Person Households | 201 (5.7%) | 0 (0.0%) |
| Total | 2,491 (70.3%) | 1,052 (29.7%) |
Female Fertility in Florida City
Fertility by Age in Florida City
Average fertility rate in Florida City is 83.0 births per 1,000 women. Women in the age bracket of 20 to 34 years have the highest fertility rate with 114.0 births per 1,000 women. Women in the age bracket of 20 to 34 years acount for 60.0% of all women with births.
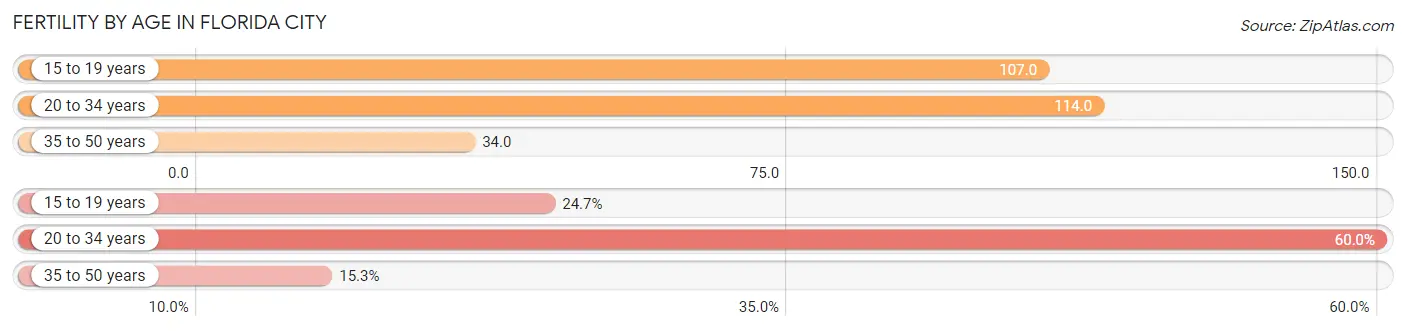
| Age Bracket | Women with Births | Births / 1,000 Women |
| 15 to 19 years | 68 (24.7%) | 107.0 |
| 20 to 34 years | 165 (60.0%) | 114.0 |
| 35 to 50 years | 42 (15.3%) | 34.0 |
| Total | 275 (100.0%) | 83.0 |
Fertility by Age by Marriage Status in Florida City
29.1% of women with births (275) in Florida City are married. The highest percentage of unmarried women with births falls into 15 to 19 years age bracket with 100.0% of them unmarried at the time of birth, while the lowest percentage of unmarried women with births belong to 35 to 50 years age bracket with 0.0% of them unmarried.
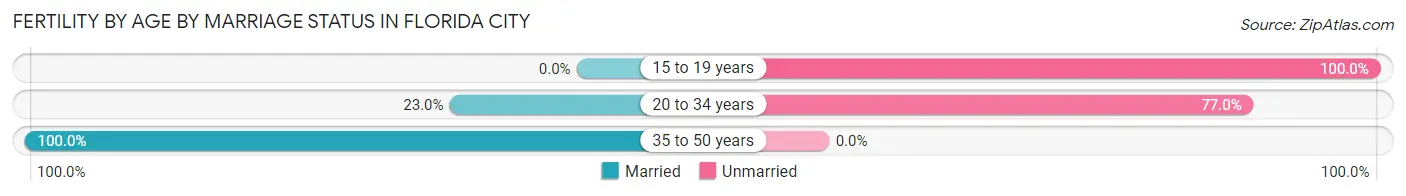
| Age Bracket | Married | Unmarried |
| 15 to 19 years | 0 (0.0%) | 68 (100.0%) |
| 20 to 34 years | 38 (23.0%) | 127 (77.0%) |
| 35 to 50 years | 42 (100.0%) | 0 (0.0%) |
| Total | 80 (29.1%) | 195 (70.9%) |
Fertility by Education in Florida City
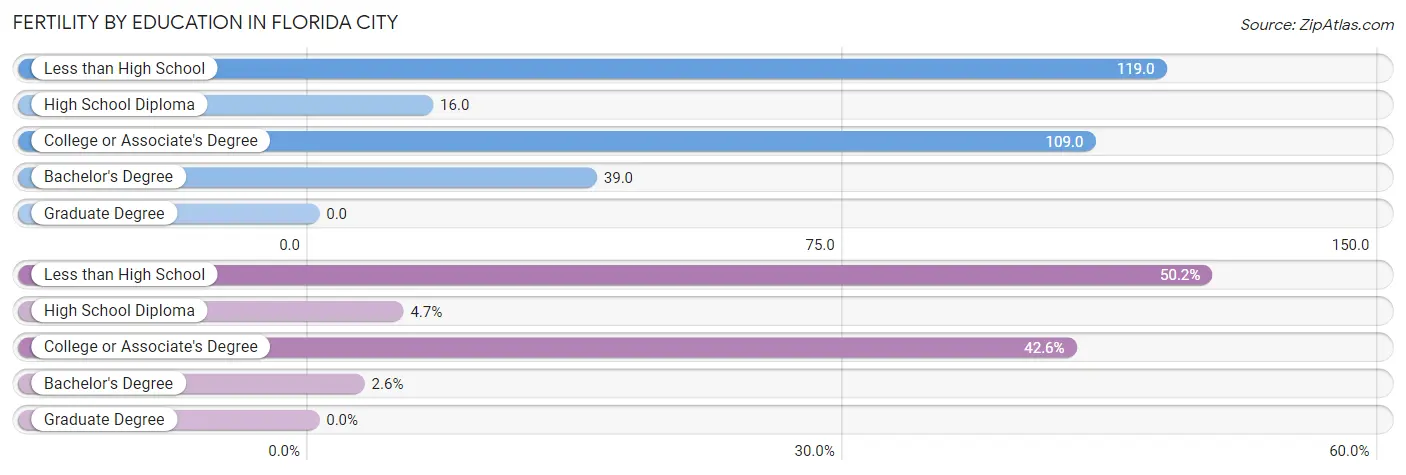
| Educational Attainment | Women with Births | Births / 1,000 Women |
| Less than High School | 138 (50.2%) | 119.0 |
| High School Diploma | 13 (4.7%) | 16.0 |
| College or Associate's Degree | 117 (42.5%) | 109.0 |
| Bachelor's Degree | 7 (2.5%) | 39.0 |
| Graduate Degree | 0 (0.0%) | 0.0 |
| Total | 275 (100.0%) | 83.0 |
Fertility by Education by Marriage Status in Florida City
70.9% of women with births in Florida City are unmarried. Women with the educational attainment of high school diploma are most likely to be married with 100.0% of them married at childbirth, while women with the educational attainment of less than high school are least likely to be married with 90.6% of them unmarried at childbirth.
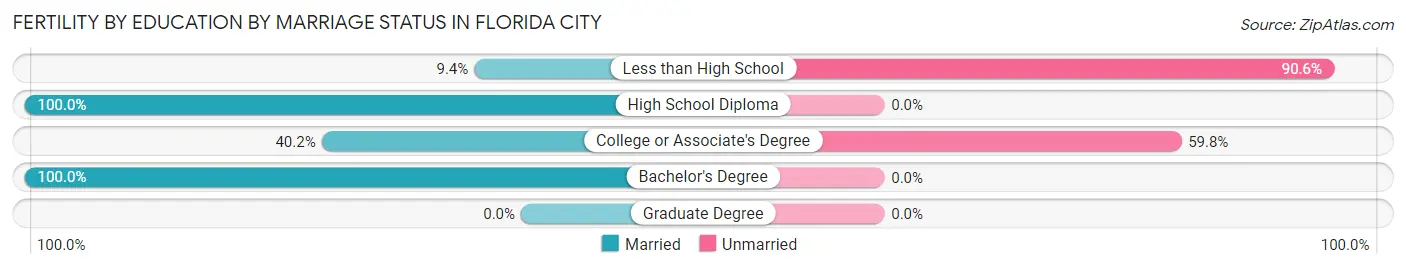
| Educational Attainment | Married | Unmarried |
| Less than High School | 13 (9.4%) | 125 (90.6%) |
| High School Diploma | 13 (100.0%) | 0 (0.0%) |
| College or Associate's Degree | 47 (40.2%) | 70 (59.8%) |
| Bachelor's Degree | 7 (100.0%) | 0 (0.0%) |
| Graduate Degree | 0 (0.0%) | 0 (0.0%) |
| Total | 80 (29.1%) | 195 (70.9%) |
Employment Characteristics in Florida City
Employment by Class of Employer in Florida City
Among the 4,373 employed individuals in Florida City, private company employees (3,318 | 75.9%), federal government employees (269 | 6.1%), and local government employees (229 | 5.2%) make up the most common classes of employment.
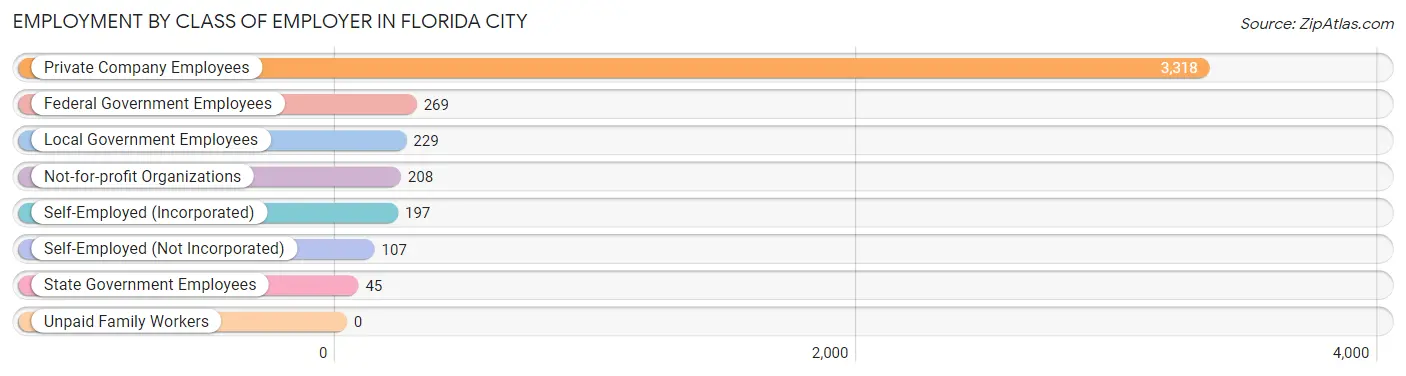
| Employer Class | # Employees | % Employees |
| Private Company Employees | 3,318 | 75.9% |
| Self-Employed (Incorporated) | 197 | 4.5% |
| Self-Employed (Not Incorporated) | 107 | 2.5% |
| Not-for-profit Organizations | 208 | 4.8% |
| Local Government Employees | 229 | 5.2% |
| State Government Employees | 45 | 1.0% |
| Federal Government Employees | 269 | 6.1% |
| Unpaid Family Workers | 0 | 0.0% |
| Total | 4,373 | 100.0% |
Employment Status by Age in Florida City
According to the labor force statistics for Florida City, out of the total population over 16 years of age (9,020), 54.4% or 4,907 individuals are in the labor force, with 8.8% or 432 of them unemployed. The age group with the highest labor force participation rate is 35 to 44 years, with 82.7% or 1,433 individuals in the labor force. Within the labor force, the 60 to 64 years age range has the highest percentage of unemployed individuals, with 29.0% or 36 of them being unemployed.
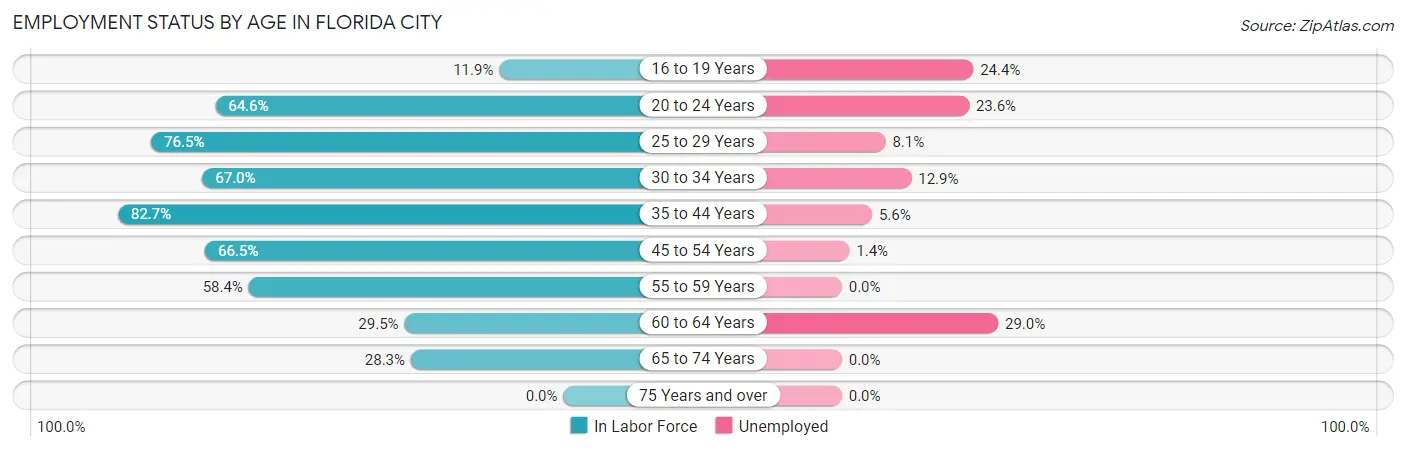
| Age Bracket | In Labor Force | Unemployed |
| 16 to 19 Years | 119 (11.9%) | 29 (24.4%) |
| 20 to 24 Years | 594 (64.6%) | 140 (23.6%) |
| 25 to 29 Years | 701 (76.5%) | 57 (8.1%) |
| 30 to 34 Years | 612 (67.0%) | 79 (12.9%) |
| 35 to 44 Years | 1,433 (82.7%) | 80 (5.6%) |
| 45 to 54 Years | 723 (66.5%) | 10 (1.4%) |
| 55 to 59 Years | 361 (58.4%) | 0 (0.0%) |
| 60 to 64 Years | 124 (29.5%) | 36 (29.0%) |
| 65 to 74 Years | 241 (28.3%) | 0 (0.0%) |
| 75 Years and over | 0 (0.0%) | 0 (0.0%) |
| Total | 4,907 (54.4%) | 432 (8.8%) |
Employment Status by Educational Attainment in Florida City
According to labor force statistics for Florida City, 69.5% of individuals (3,953) out of the total population between 25 and 64 years of age (5,688) are in the labor force, with 6.6% or 261 of them being unemployed. The group with the highest labor force participation rate are those with the educational attainment of bachelor's degree or higher, with 94.0% or 375 individuals in the labor force. Within the labor force, individuals with less than high school education have the highest percentage of unemployment, with 9.6% or 98 of them being unemployed.
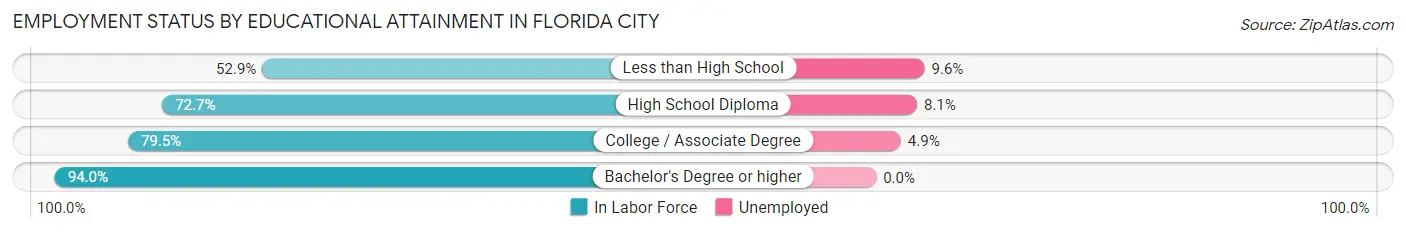
| Educational Attainment | In Labor Force | Unemployed |
| Less than High School | 1,021 (52.9%) | 185 (9.6%) |
| High School Diploma | 1,207 (72.7%) | 134 (8.1%) |
| College / Associate Degree | 1,350 (79.5%) | 83 (4.9%) |
| Bachelor's Degree or higher | 375 (94.0%) | 0 (0.0%) |
| Total | 3,953 (69.5%) | 375 (6.6%) |
Employment Occupations by Sex in Florida City
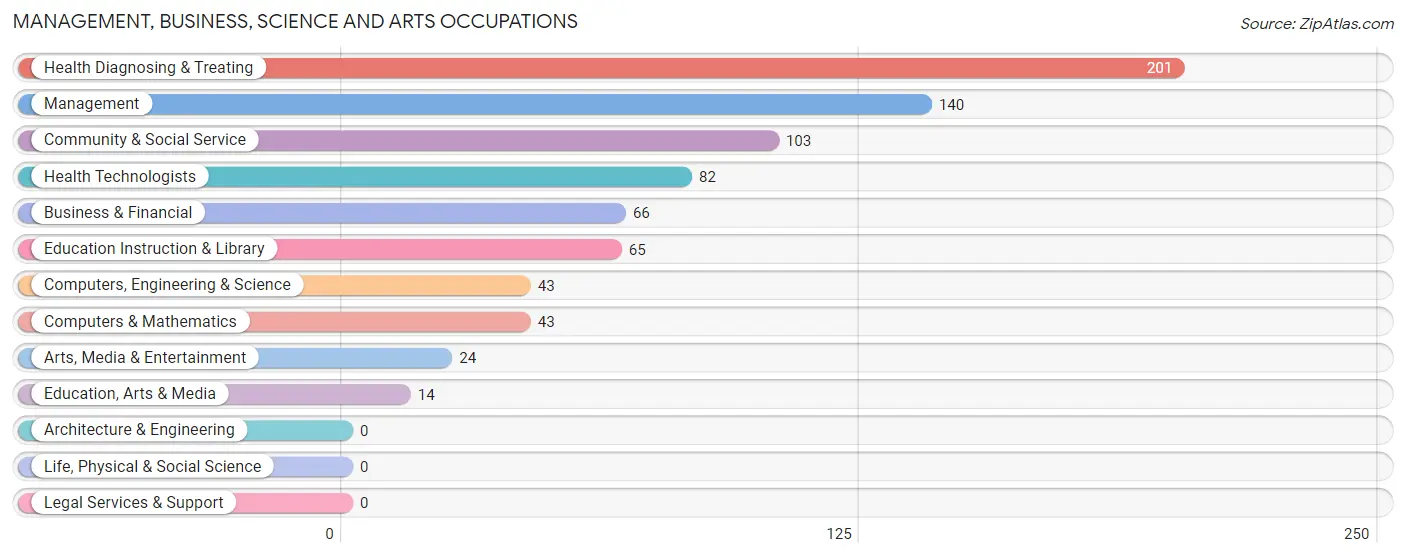
Management, Business, Science and Arts Occupations
The most common Management, Business, Science and Arts occupations in Florida City are Health Diagnosing & Treating (201 | 4.5%), Management (140 | 3.1%), Community & Social Service (103 | 2.3%), Health Technologists (82 | 1.8%), and Business & Financial (66 | 1.5%).
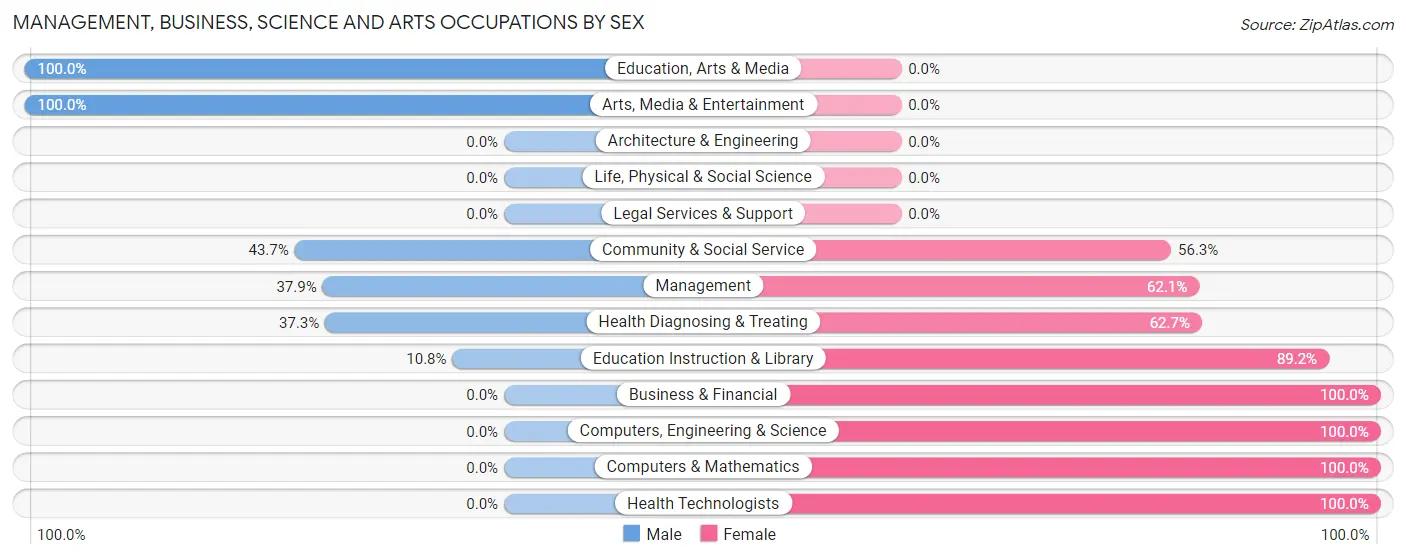
Management, Business, Science and Arts Occupations by Sex
Within the Management, Business, Science and Arts occupations in Florida City, the most male-oriented occupations are Education, Arts & Media (100.0%), Arts, Media & Entertainment (100.0%), and Community & Social Service (43.7%), while the most female-oriented occupations are Business & Financial (100.0%), Computers, Engineering & Science (100.0%), and Computers & Mathematics (100.0%).
| Occupation | Male | Female |
| Management | 53 (37.9%) | 87 (62.1%) |
| Business & Financial | 0 (0.0%) | 66 (100.0%) |
| Computers, Engineering & Science | 0 (0.0%) | 43 (100.0%) |
| Computers & Mathematics | 0 (0.0%) | 43 (100.0%) |
| Architecture & Engineering | 0 (0.0%) | 0 (0.0%) |
| Life, Physical & Social Science | 0 (0.0%) | 0 (0.0%) |
| Community & Social Service | 45 (43.7%) | 58 (56.3%) |
| Education, Arts & Media | 14 (100.0%) | 0 (0.0%) |
| Legal Services & Support | 0 (0.0%) | 0 (0.0%) |
| Education Instruction & Library | 7 (10.8%) | 58 (89.2%) |
| Arts, Media & Entertainment | 24 (100.0%) | 0 (0.0%) |
| Health Diagnosing & Treating | 75 (37.3%) | 126 (62.7%) |
| Health Technologists | 0 (0.0%) | 82 (100.0%) |
| Total (Category) | 173 (31.3%) | 380 (68.7%) |
| Total (Overall) | 2,146 (47.9%) | 2,331 (52.1%) |
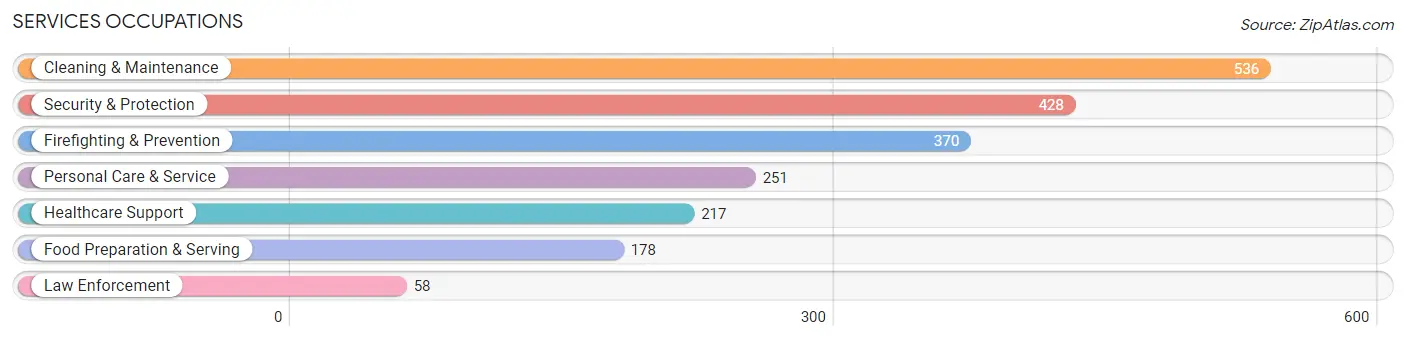
Services Occupations
The most common Services occupations in Florida City are Cleaning & Maintenance (536 | 12.0%), Security & Protection (428 | 9.6%), Firefighting & Prevention (370 | 8.3%), Personal Care & Service (251 | 5.6%), and Healthcare Support (217 | 4.9%).
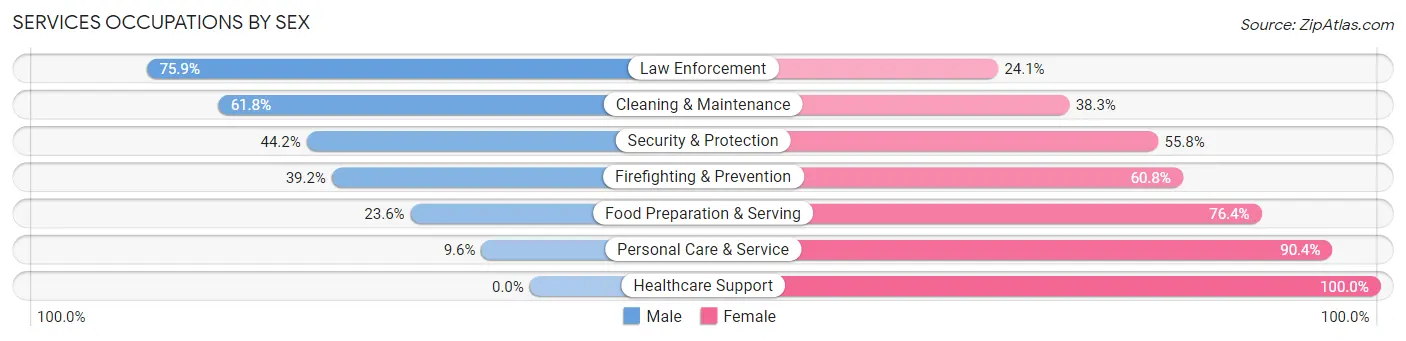
Services Occupations by Sex
Within the Services occupations in Florida City, the most male-oriented occupations are Law Enforcement (75.9%), Cleaning & Maintenance (61.8%), and Security & Protection (44.2%), while the most female-oriented occupations are Healthcare Support (100.0%), Personal Care & Service (90.4%), and Food Preparation & Serving (76.4%).
| Occupation | Male | Female |
| Healthcare Support | 0 (0.0%) | 217 (100.0%) |
| Security & Protection | 189 (44.2%) | 239 (55.8%) |
| Firefighting & Prevention | 145 (39.2%) | 225 (60.8%) |
| Law Enforcement | 44 (75.9%) | 14 (24.1%) |
| Food Preparation & Serving | 42 (23.6%) | 136 (76.4%) |
| Cleaning & Maintenance | 331 (61.8%) | 205 (38.3%) |
| Personal Care & Service | 24 (9.6%) | 227 (90.4%) |
| Total (Category) | 586 (36.4%) | 1,024 (63.6%) |
| Total (Overall) | 2,146 (47.9%) | 2,331 (52.1%) |
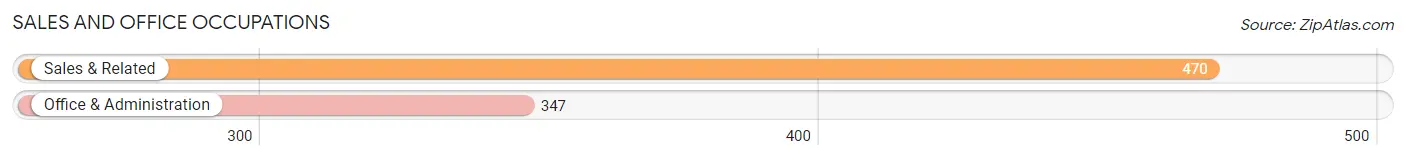
Sales and Office Occupations
The most common Sales and Office occupations in Florida City are Sales & Related (470 | 10.5%), and Office & Administration (347 | 7.7%).
Sales and Office Occupations by Sex

| Occupation | Male | Female |
| Sales & Related | 90 (19.2%) | 380 (80.8%) |
| Office & Administration | 92 (26.5%) | 255 (73.5%) |
| Total (Category) | 182 (22.3%) | 635 (77.7%) |
| Total (Overall) | 2,146 (47.9%) | 2,331 (52.1%) |
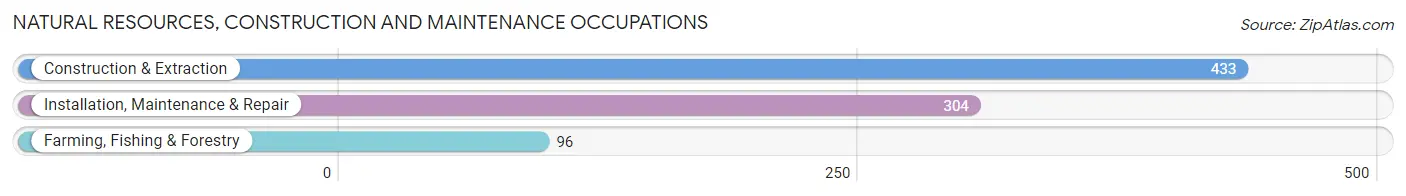
Natural Resources, Construction and Maintenance Occupations
The most common Natural Resources, Construction and Maintenance occupations in Florida City are Construction & Extraction (433 | 9.7%), Installation, Maintenance & Repair (304 | 6.8%), and Farming, Fishing & Forestry (96 | 2.1%).
Natural Resources, Construction and Maintenance Occupations by Sex

| Occupation | Male | Female |
| Farming, Fishing & Forestry | 96 (100.0%) | 0 (0.0%) |
| Construction & Extraction | 433 (100.0%) | 0 (0.0%) |
| Installation, Maintenance & Repair | 266 (87.5%) | 38 (12.5%) |
| Total (Category) | 795 (95.4%) | 38 (4.6%) |
| Total (Overall) | 2,146 (47.9%) | 2,331 (52.1%) |
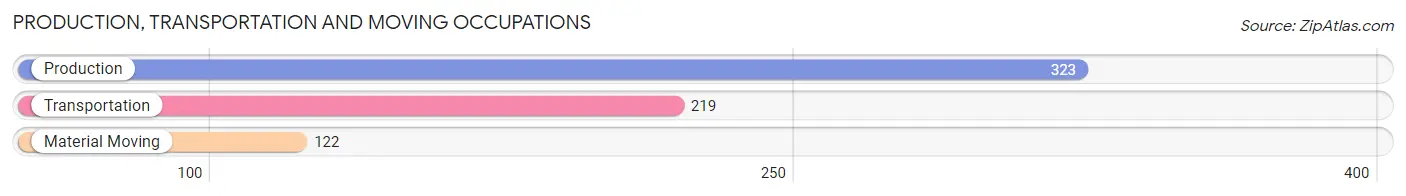
Production, Transportation and Moving Occupations
The most common Production, Transportation and Moving occupations in Florida City are Production (323 | 7.2%), Transportation (219 | 4.9%), and Material Moving (122 | 2.7%).
Production, Transportation and Moving Occupations by Sex
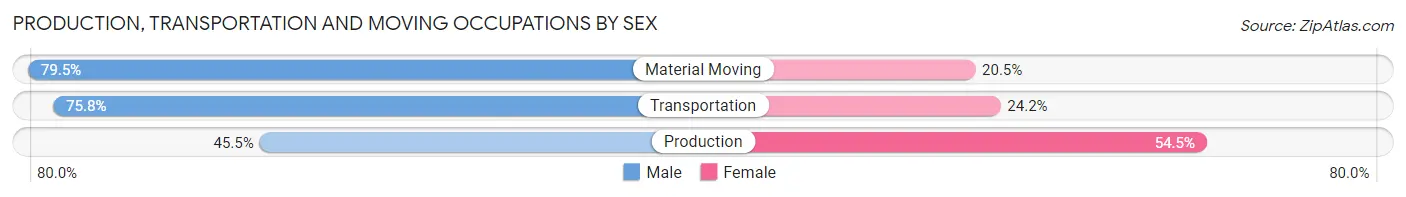
| Occupation | Male | Female |
| Production | 147 (45.5%) | 176 (54.5%) |
| Transportation | 166 (75.8%) | 53 (24.2%) |
| Material Moving | 97 (79.5%) | 25 (20.5%) |
| Total (Category) | 410 (61.8%) | 254 (38.3%) |
| Total (Overall) | 2,146 (47.9%) | 2,331 (52.1%) |
Employment Industries by Sex in Florida City
Employment Industries in Florida City
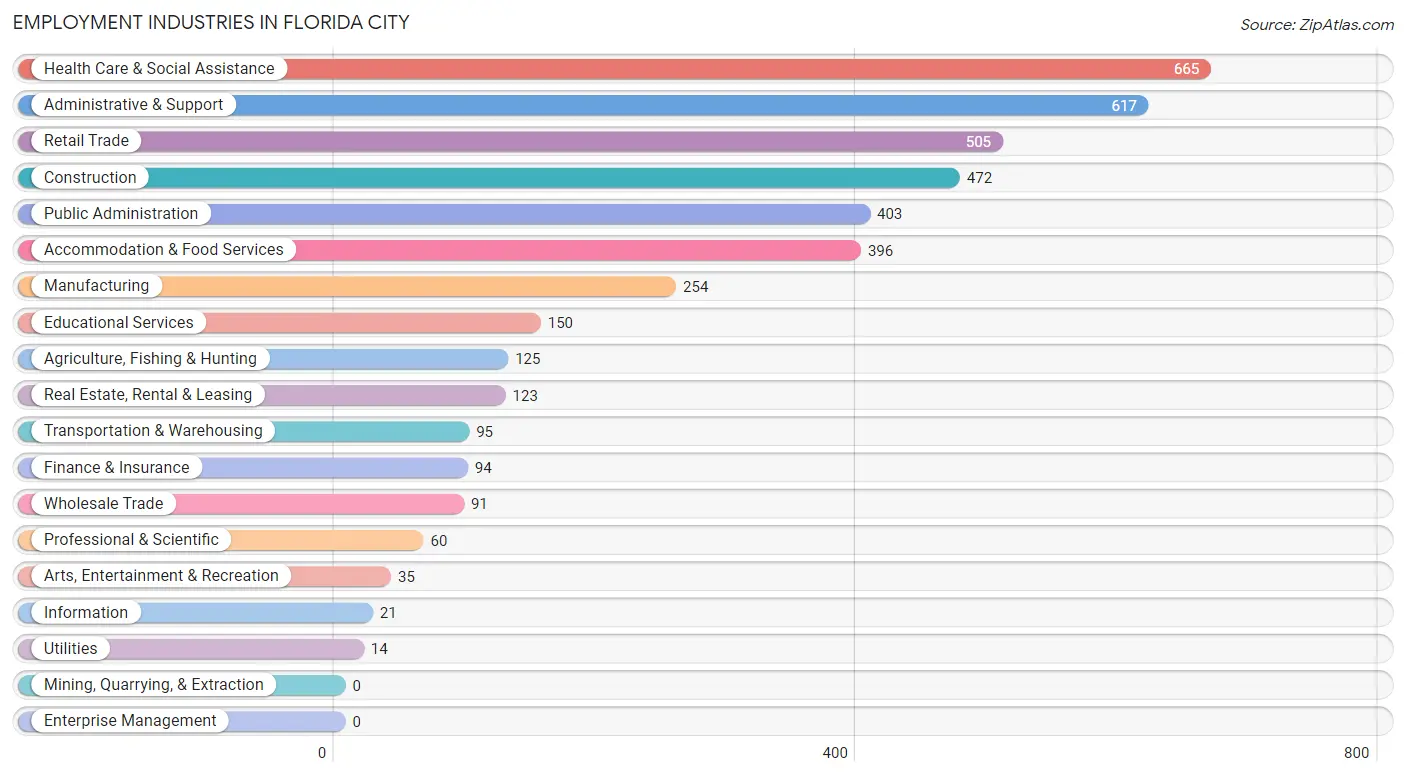
The major employment industries in Florida City include Health Care & Social Assistance (665 | 14.8%), Administrative & Support (617 | 13.8%), Retail Trade (505 | 11.3%), Construction (472 | 10.5%), and Public Administration (403 | 9.0%).
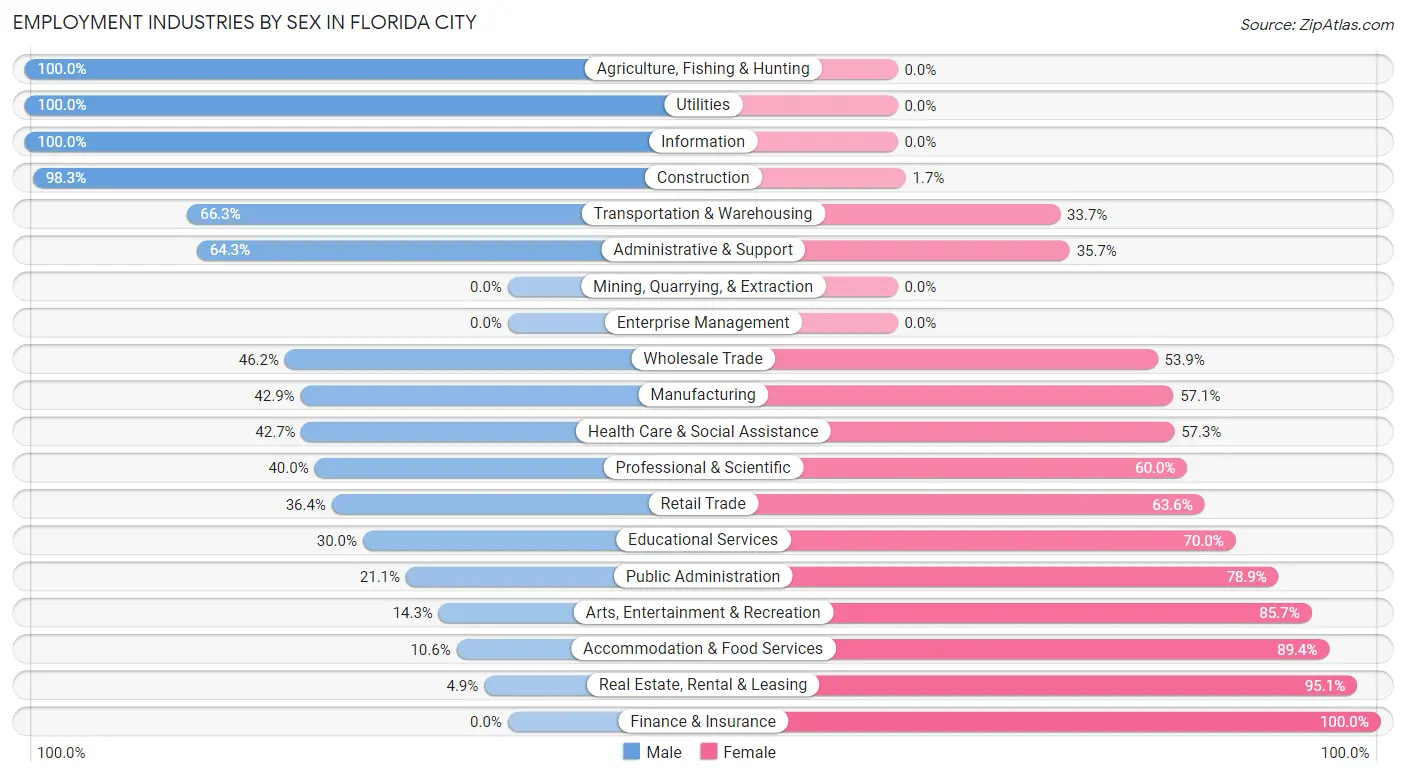
Employment Industries by Sex in Florida City
The Florida City industries that see more men than women are Agriculture, Fishing & Hunting (100.0%), Utilities (100.0%), and Information (100.0%), whereas the industries that tend to have a higher number of women are Finance & Insurance (100.0%), Real Estate, Rental & Leasing (95.1%), and Accommodation & Food Services (89.4%).
| Industry | Male | Female |
| Agriculture, Fishing & Hunting | 125 (100.0%) | 0 (0.0%) |
| Mining, Quarrying, & Extraction | 0 (0.0%) | 0 (0.0%) |
| Construction | 464 (98.3%) | 8 (1.7%) |
| Manufacturing | 109 (42.9%) | 145 (57.1%) |
| Wholesale Trade | 42 (46.2%) | 49 (53.8%) |
| Retail Trade | 184 (36.4%) | 321 (63.6%) |
| Transportation & Warehousing | 63 (66.3%) | 32 (33.7%) |
| Utilities | 14 (100.0%) | 0 (0.0%) |
| Information | 21 (100.0%) | 0 (0.0%) |
| Finance & Insurance | 0 (0.0%) | 94 (100.0%) |
| Real Estate, Rental & Leasing | 6 (4.9%) | 117 (95.1%) |
| Professional & Scientific | 24 (40.0%) | 36 (60.0%) |
| Enterprise Management | 0 (0.0%) | 0 (0.0%) |
| Administrative & Support | 397 (64.3%) | 220 (35.7%) |
| Educational Services | 45 (30.0%) | 105 (70.0%) |
| Health Care & Social Assistance | 284 (42.7%) | 381 (57.3%) |
| Arts, Entertainment & Recreation | 5 (14.3%) | 30 (85.7%) |
| Accommodation & Food Services | 42 (10.6%) | 354 (89.4%) |
| Public Administration | 85 (21.1%) | 318 (78.9%) |
| Total | 2,146 (47.9%) | 2,331 (52.1%) |
Education in Florida City
School Enrollment in Florida City
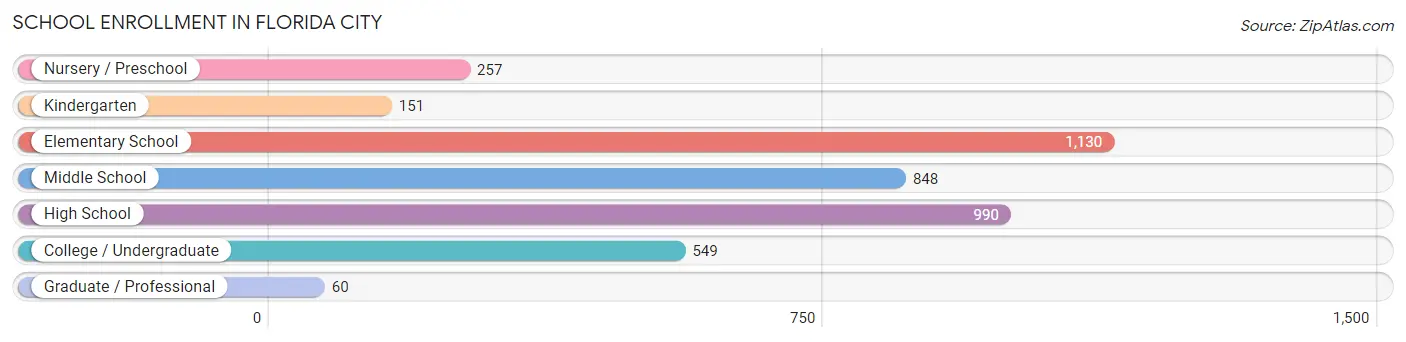
The most common levels of schooling among the 3,985 students in Florida City are elementary school (1,130 | 28.4%), high school (990 | 24.8%), and middle school (848 | 21.3%).
| School Level | # Students | % Students |
| Nursery / Preschool | 257 | 6.5% |
| Kindergarten | 151 | 3.8% |
| Elementary School | 1,130 | 28.4% |
| Middle School | 848 | 21.3% |
| High School | 990 | 24.8% |
| College / Undergraduate | 549 | 13.8% |
| Graduate / Professional | 60 | 1.5% |
| Total | 3,985 | 100.0% |
School Enrollment by Age by Funding Source in Florida City
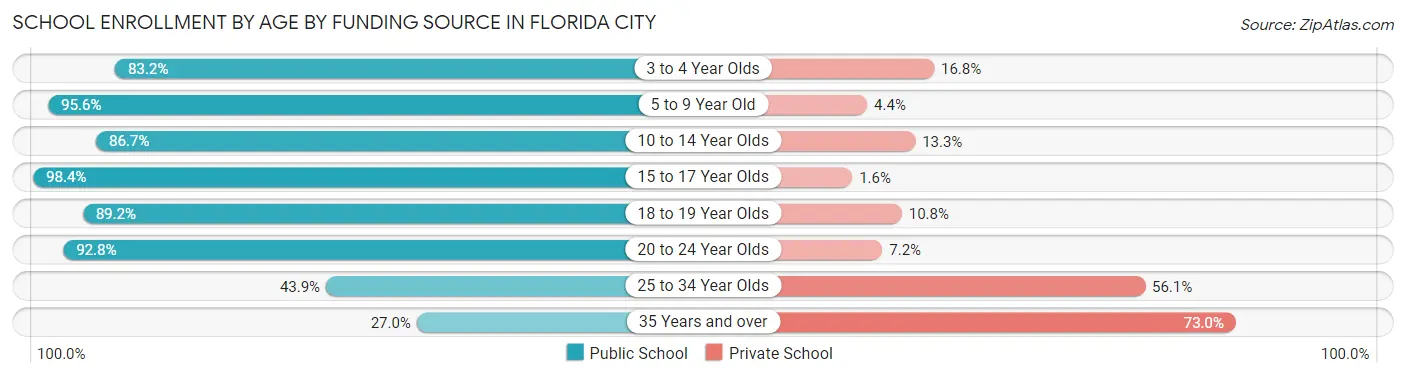
Out of a total of 3,985 students who are enrolled in schools in Florida City, 446 (11.2%) attend a private institution, while the remaining 3,539 (88.8%) are enrolled in public schools. The age group of 35 years and over has the highest likelihood of being enrolled in private schools, with 65 (73.0% in the age bracket) enrolled. Conversely, the age group of 15 to 17 year olds has the lowest likelihood of being enrolled in a private school, with 677 (98.4% in the age bracket) attending a public institution.
| Age Bracket | Public School | Private School |
| 3 to 4 Year Olds | 158 (83.2%) | 32 (16.8%) |
| 5 to 9 Year Old | 1,137 (95.6%) | 52 (4.4%) |
| 10 to 14 Year Olds | 950 (86.7%) | 146 (13.3%) |
| 15 to 17 Year Olds | 677 (98.4%) | 11 (1.6%) |
| 18 to 19 Year Olds | 280 (89.2%) | 34 (10.8%) |
| 20 to 24 Year Olds | 245 (92.8%) | 19 (7.2%) |
| 25 to 34 Year Olds | 68 (43.9%) | 87 (56.1%) |
| 35 Years and over | 24 (27.0%) | 65 (73.0%) |
| Total | 3,539 (88.8%) | 446 (11.2%) |
Educational Attainment by Field of Study in Florida City
Arts & humanities (89 | 18.3%), physical & health sciences (75 | 15.5%), psychology (72 | 14.8%), liberal arts & history (56 | 11.6%), and science & technology (47 | 9.7%) are the most common fields of study among 485 individuals in Florida City who have obtained a bachelor's degree or higher.
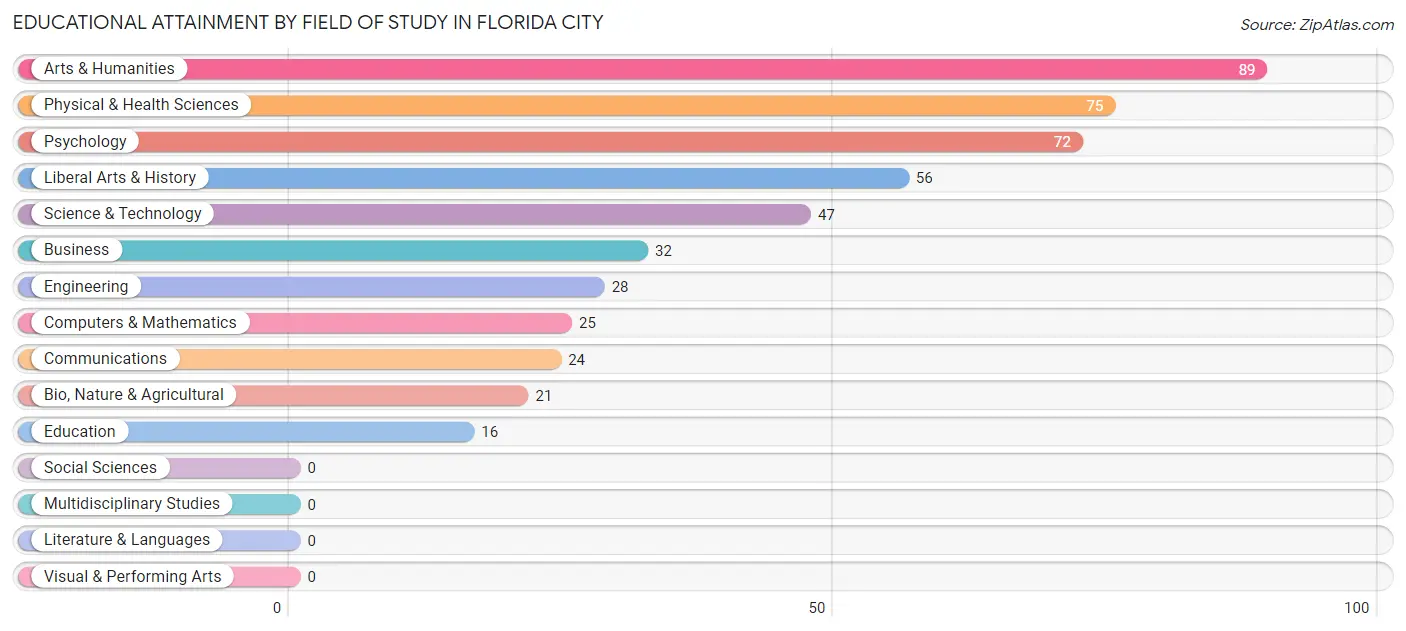
| Field of Study | # Graduates | % Graduates |
| Computers & Mathematics | 25 | 5.1% |
| Bio, Nature & Agricultural | 21 | 4.3% |
| Physical & Health Sciences | 75 | 15.5% |
| Psychology | 72 | 14.8% |
| Social Sciences | 0 | 0.0% |
| Engineering | 28 | 5.8% |
| Multidisciplinary Studies | 0 | 0.0% |
| Science & Technology | 47 | 9.7% |
| Business | 32 | 6.6% |
| Education | 16 | 3.3% |
| Literature & Languages | 0 | 0.0% |
| Liberal Arts & History | 56 | 11.6% |
| Visual & Performing Arts | 0 | 0.0% |
| Communications | 24 | 5.0% |
| Arts & Humanities | 89 | 18.3% |
| Total | 485 | 100.0% |
Transportation & Commute in Florida City
Vehicle Availability by Sex in Florida City
The most prevalent vehicle ownership categories in Florida City are males with 2 vehicles (795, accounting for 38.5%) and females with 2 vehicles (1,055, making up 34.4%).
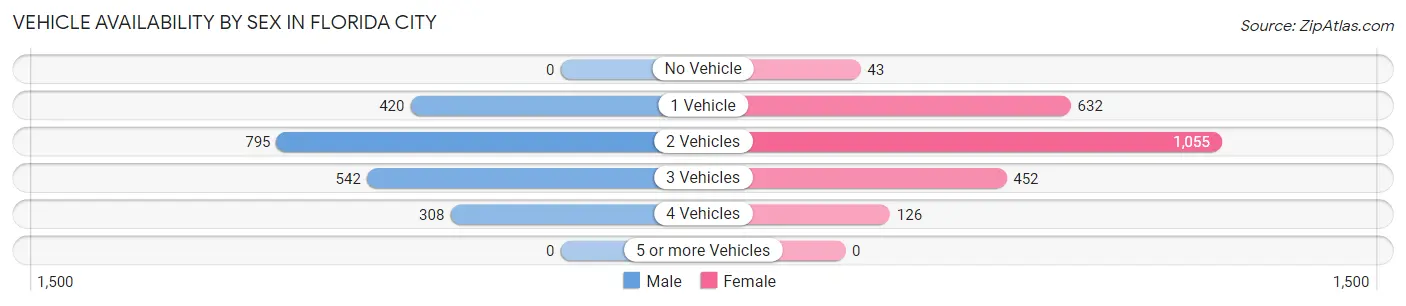
| Vehicles Available | Male | Female |
| No Vehicle | 0 (0.0%) | 43 (1.9%) |
| 1 Vehicle | 420 (20.3%) | 632 (27.4%) |
| 2 Vehicles | 795 (38.5%) | 1,055 (45.7%) |
| 3 Vehicles | 542 (26.3%) | 452 (19.6%) |
| 4 Vehicles | 308 (14.9%) | 126 (5.5%) |
| 5 or more Vehicles | 0 (0.0%) | 0 (0.0%) |
| Total | 2,065 (100.0%) | 2,308 (100.0%) |
Commute Time in Florida City
The most frequently occuring commute durations in Florida City are 60 to 89 minutes (891 commuters, 21.1%), 30 to 34 minutes (780 commuters, 18.5%), and 10 to 14 minutes (634 commuters, 15.0%).
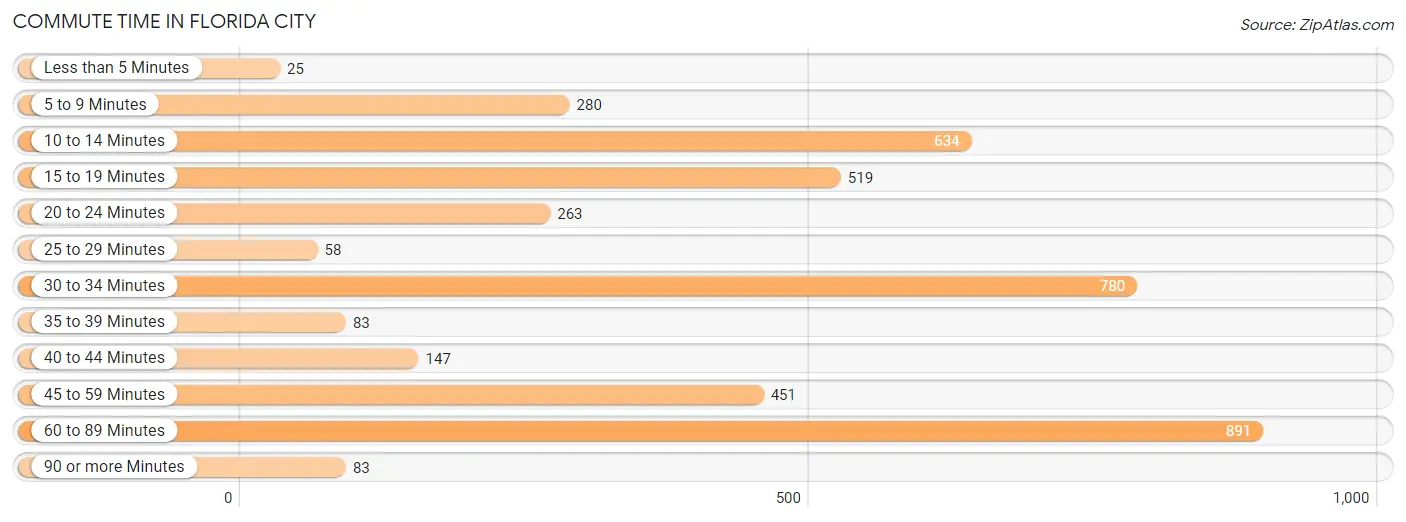
| Commute Time | # Commuters | % Commuters |
| Less than 5 Minutes | 25 | 0.6% |
| 5 to 9 Minutes | 280 | 6.6% |
| 10 to 14 Minutes | 634 | 15.0% |
| 15 to 19 Minutes | 519 | 12.3% |
| 20 to 24 Minutes | 263 | 6.2% |
| 25 to 29 Minutes | 58 | 1.4% |
| 30 to 34 Minutes | 780 | 18.5% |
| 35 to 39 Minutes | 83 | 2.0% |
| 40 to 44 Minutes | 147 | 3.5% |
| 45 to 59 Minutes | 451 | 10.7% |
| 60 to 89 Minutes | 891 | 21.1% |
| 90 or more Minutes | 83 | 2.0% |
Commute Time by Sex in Florida City
The most common commute times in Florida City are 60 to 89 minutes (581 commuters, 29.9%) for males and 10 to 14 minutes (456 commuters, 20.1%) for females.
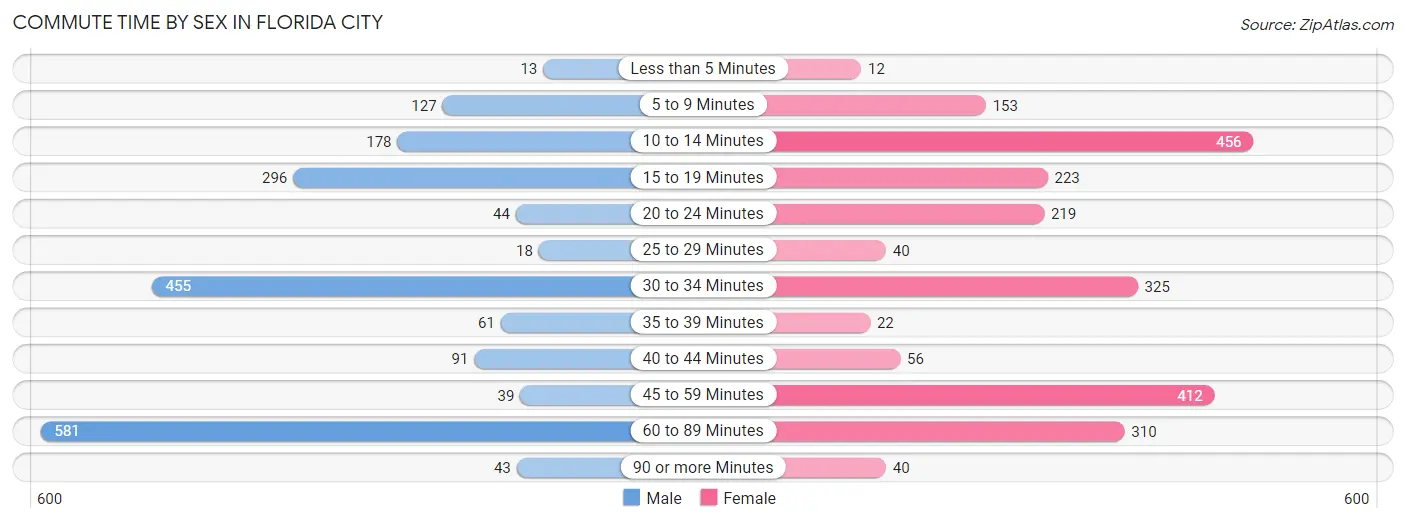
| Commute Time | Male | Female |
| Less than 5 Minutes | 13 (0.7%) | 12 (0.5%) |
| 5 to 9 Minutes | 127 (6.5%) | 153 (6.8%) |
| 10 to 14 Minutes | 178 (9.1%) | 456 (20.1%) |
| 15 to 19 Minutes | 296 (15.2%) | 223 (9.8%) |
| 20 to 24 Minutes | 44 (2.3%) | 219 (9.7%) |
| 25 to 29 Minutes | 18 (0.9%) | 40 (1.8%) |
| 30 to 34 Minutes | 455 (23.4%) | 325 (14.3%) |
| 35 to 39 Minutes | 61 (3.1%) | 22 (1.0%) |
| 40 to 44 Minutes | 91 (4.7%) | 56 (2.5%) |
| 45 to 59 Minutes | 39 (2.0%) | 412 (18.2%) |
| 60 to 89 Minutes | 581 (29.9%) | 310 (13.7%) |
| 90 or more Minutes | 43 (2.2%) | 40 (1.8%) |
Time of Departure to Work by Sex in Florida City
The most frequent times of departure to work in Florida City are 8:00 AM to 8:29 AM (316, 16.2%) for males and 8:00 AM to 8:29 AM (459, 20.2%) for females.
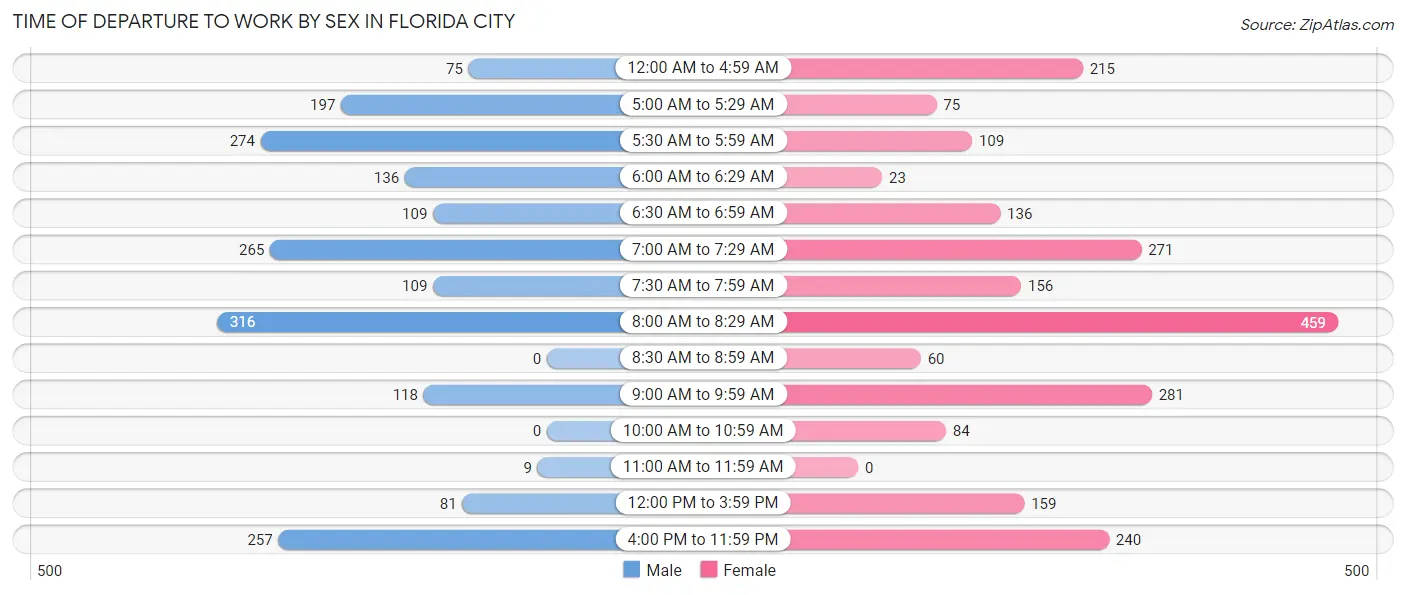
| Time of Departure | Male | Female |
| 12:00 AM to 4:59 AM | 75 (3.8%) | 215 (9.5%) |
| 5:00 AM to 5:29 AM | 197 (10.1%) | 75 (3.3%) |
| 5:30 AM to 5:59 AM | 274 (14.1%) | 109 (4.8%) |
| 6:00 AM to 6:29 AM | 136 (7.0%) | 23 (1.0%) |
| 6:30 AM to 6:59 AM | 109 (5.6%) | 136 (6.0%) |
| 7:00 AM to 7:29 AM | 265 (13.6%) | 271 (11.9%) |
| 7:30 AM to 7:59 AM | 109 (5.6%) | 156 (6.9%) |
| 8:00 AM to 8:29 AM | 316 (16.2%) | 459 (20.2%) |
| 8:30 AM to 8:59 AM | 0 (0.0%) | 60 (2.6%) |
| 9:00 AM to 9:59 AM | 118 (6.1%) | 281 (12.4%) |
| 10:00 AM to 10:59 AM | 0 (0.0%) | 84 (3.7%) |
| 11:00 AM to 11:59 AM | 9 (0.5%) | 0 (0.0%) |
| 12:00 PM to 3:59 PM | 81 (4.2%) | 159 (7.0%) |
| 4:00 PM to 11:59 PM | 257 (13.2%) | 240 (10.6%) |
| Total | 1,946 (100.0%) | 2,268 (100.0%) |
Housing Occupancy in Florida City
Occupancy by Ownership in Florida City
Of the total 3,543 dwellings in Florida City, owner-occupied units account for 881 (24.9%), while renter-occupied units make up 2,662 (75.1%).
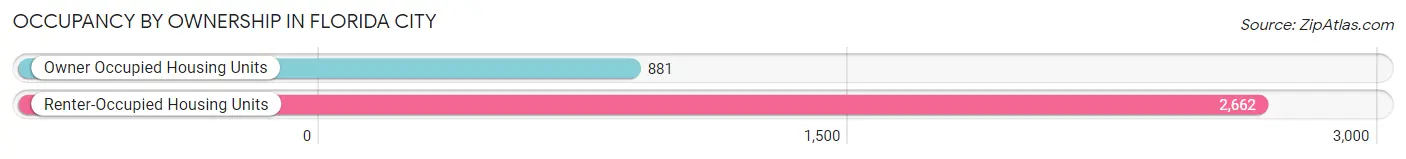
| Occupancy | # Housing Units | % Housing Units |
| Owner Occupied Housing Units | 881 | 24.9% |
| Renter-Occupied Housing Units | 2,662 | 75.1% |
| Total Occupied Housing Units | 3,543 | 100.0% |
Occupancy by Household Size in Florida City
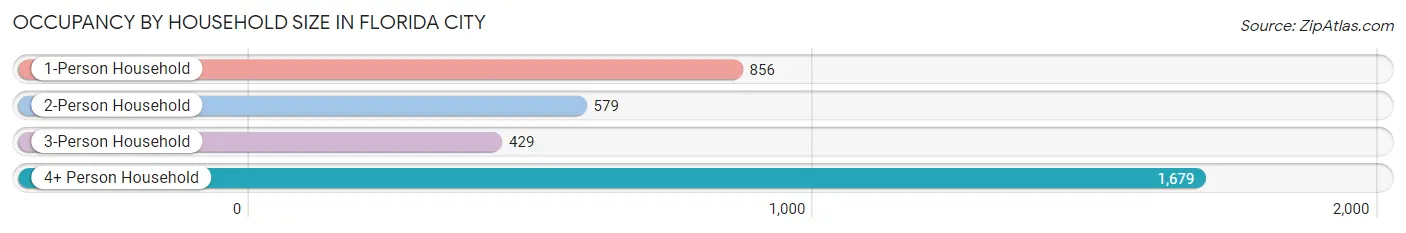
| Household Size | # Housing Units | % Housing Units |
| 1-Person Household | 856 | 24.2% |
| 2-Person Household | 579 | 16.3% |
| 3-Person Household | 429 | 12.1% |
| 4+ Person Household | 1,679 | 47.4% |
| Total Housing Units | 3,543 | 100.0% |
Occupancy by Ownership by Household Size in Florida City
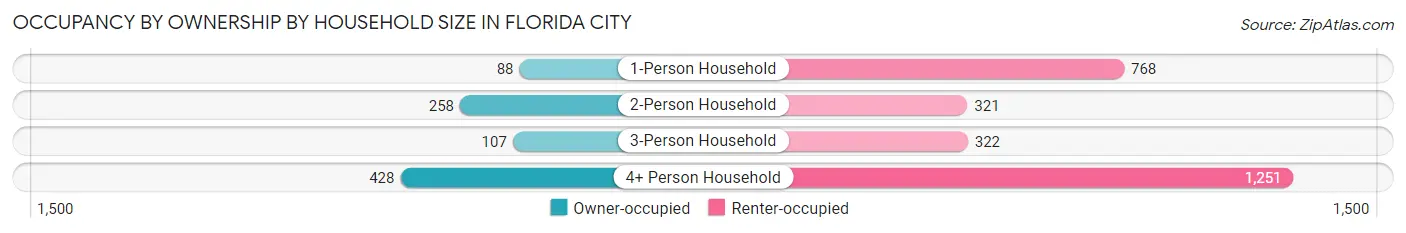
| Household Size | Owner-occupied | Renter-occupied |
| 1-Person Household | 88 (10.3%) | 768 (89.7%) |
| 2-Person Household | 258 (44.6%) | 321 (55.4%) |
| 3-Person Household | 107 (24.9%) | 322 (75.1%) |
| 4+ Person Household | 428 (25.5%) | 1,251 (74.5%) |
| Total Housing Units | 881 (24.9%) | 2,662 (75.1%) |
Occupancy by Educational Attainment in Florida City
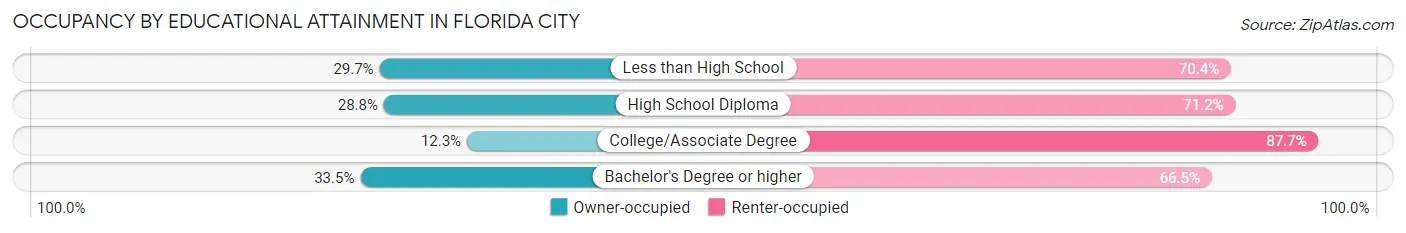
| Household Size | Owner-occupied | Renter-occupied |
| Less than High School | 370 (29.6%) | 878 (70.4%) |
| High School Diploma | 299 (28.8%) | 740 (71.2%) |
| College/Associate Degree | 121 (12.3%) | 863 (87.7%) |
| Bachelor's Degree or higher | 91 (33.5%) | 181 (66.5%) |
Occupancy by Age of Householder in Florida City
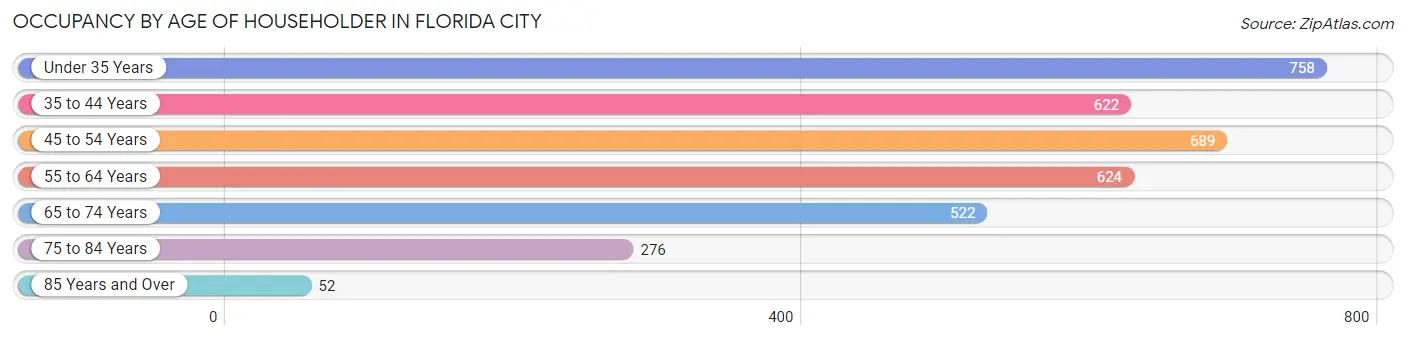
| Age Bracket | # Households | % Households |
| Under 35 Years | 758 | 21.4% |
| 35 to 44 Years | 622 | 17.6% |
| 45 to 54 Years | 689 | 19.5% |
| 55 to 64 Years | 624 | 17.6% |
| 65 to 74 Years | 522 | 14.7% |
| 75 to 84 Years | 276 | 7.8% |
| 85 Years and Over | 52 | 1.5% |
| Total | 3,543 | 100.0% |
Housing Finances in Florida City
Median Income by Occupancy in Florida City
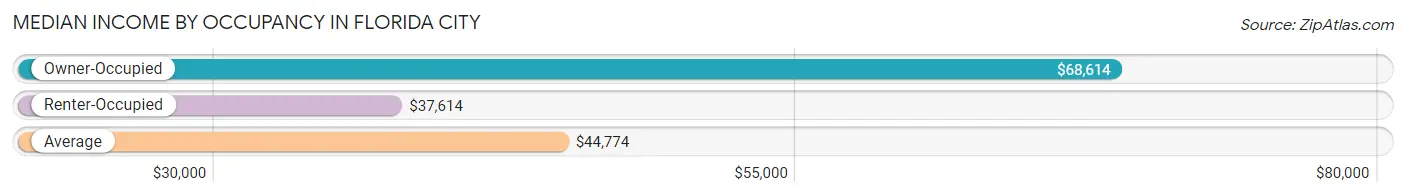
| Occupancy Type | # Households | Median Income |
| Owner-Occupied | 881 (24.9%) | $68,614 |
| Renter-Occupied | 2,662 (75.1%) | $37,614 |
| Average | 3,543 (100.0%) | $44,774 |
Occupancy by Householder Income Bracket in Florida City
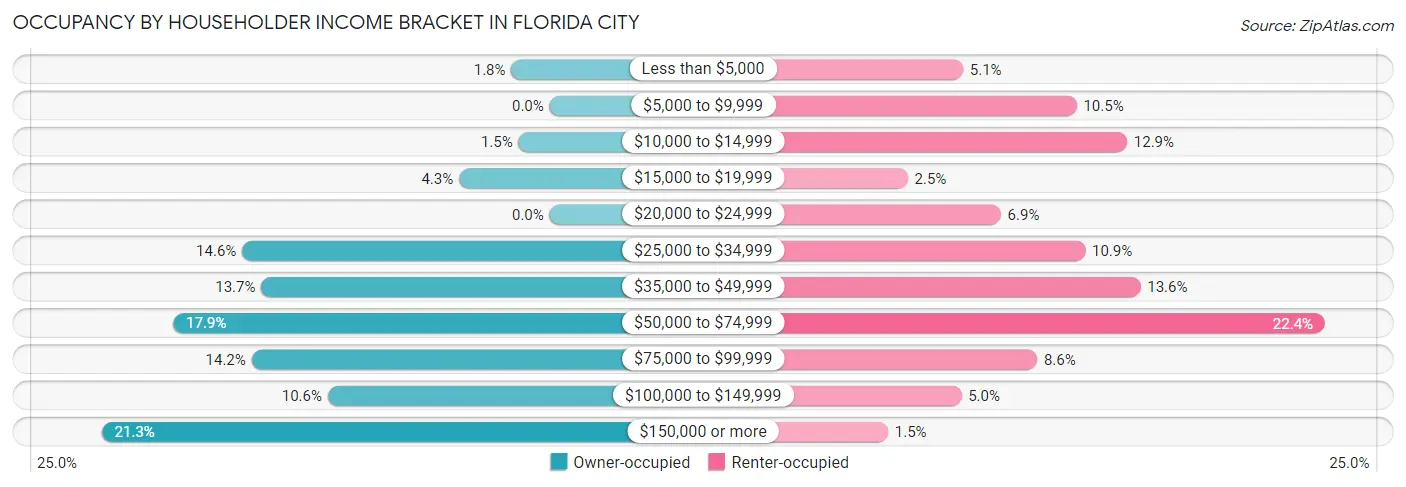
| Income Bracket | Owner-occupied | Renter-occupied |
| Less than $5,000 | 16 (1.8%) | 136 (5.1%) |
| $5,000 to $9,999 | 0 (0.0%) | 280 (10.5%) |
| $10,000 to $14,999 | 13 (1.5%) | 344 (12.9%) |
| $15,000 to $19,999 | 38 (4.3%) | 66 (2.5%) |
| $20,000 to $24,999 | 0 (0.0%) | 184 (6.9%) |
| $25,000 to $34,999 | 129 (14.6%) | 291 (10.9%) |
| $35,000 to $49,999 | 121 (13.7%) | 361 (13.6%) |
| $50,000 to $74,999 | 158 (17.9%) | 595 (22.4%) |
| $75,000 to $99,999 | 125 (14.2%) | 230 (8.6%) |
| $100,000 to $149,999 | 93 (10.6%) | 134 (5.0%) |
| $150,000 or more | 188 (21.3%) | 41 (1.5%) |
| Total | 881 (100.0%) | 2,662 (100.0%) |
Monthly Housing Cost Tiers in Florida City
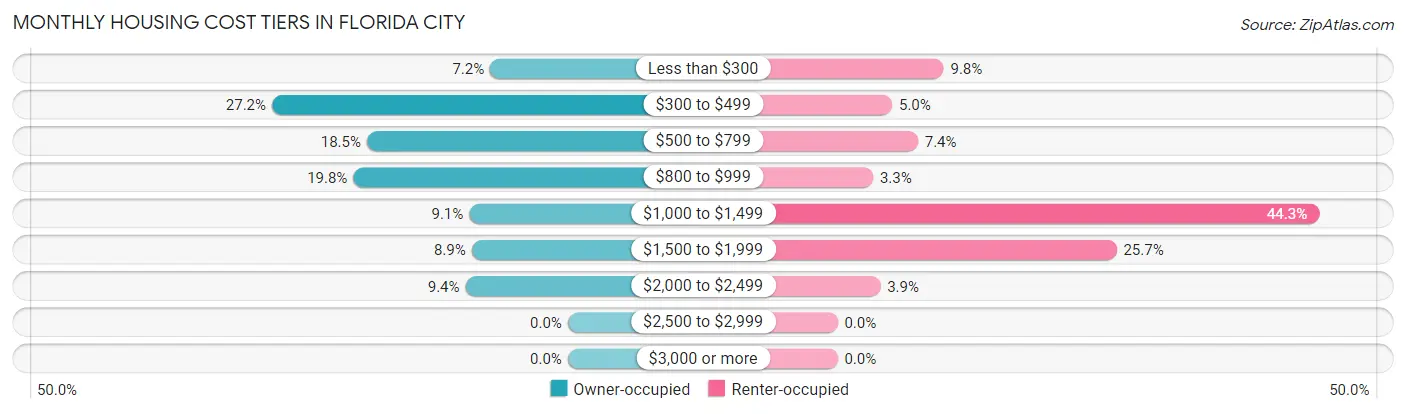
| Monthly Cost | Owner-occupied | Renter-occupied |
| Less than $300 | 63 (7.1%) | 260 (9.8%) |
| $300 to $499 | 240 (27.2%) | 134 (5.0%) |
| $500 to $799 | 163 (18.5%) | 197 (7.4%) |
| $800 to $999 | 174 (19.8%) | 87 (3.3%) |
| $1,000 to $1,499 | 80 (9.1%) | 1,180 (44.3%) |
| $1,500 to $1,999 | 78 (8.8%) | 684 (25.7%) |
| $2,000 to $2,499 | 83 (9.4%) | 105 (3.9%) |
| $2,500 to $2,999 | 0 (0.0%) | 0 (0.0%) |
| $3,000 or more | 0 (0.0%) | 0 (0.0%) |
| Total | 881 (100.0%) | 2,662 (100.0%) |
Physical Housing Characteristics in Florida City
Housing Structures in Florida City
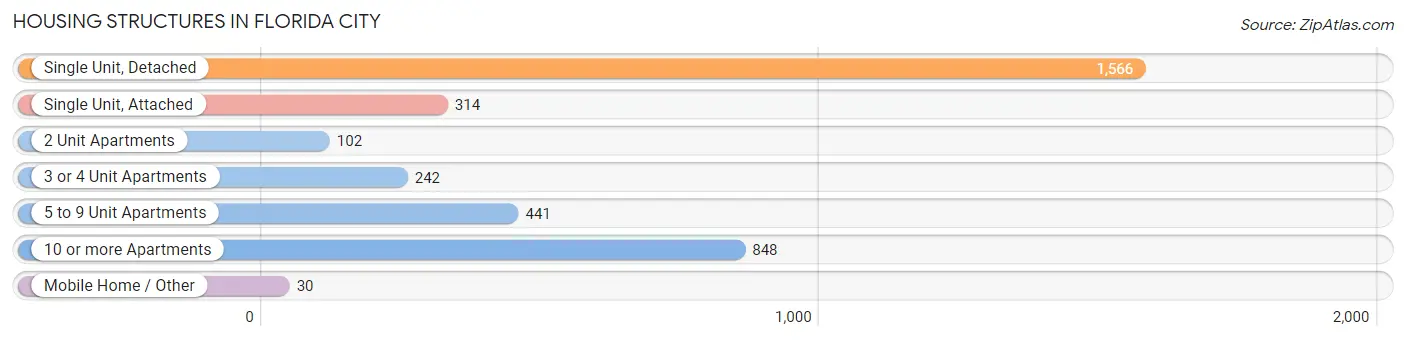
| Structure Type | # Housing Units | % Housing Units |
| Single Unit, Detached | 1,566 | 44.2% |
| Single Unit, Attached | 314 | 8.9% |
| 2 Unit Apartments | 102 | 2.9% |
| 3 or 4 Unit Apartments | 242 | 6.8% |
| 5 to 9 Unit Apartments | 441 | 12.4% |
| 10 or more Apartments | 848 | 23.9% |
| Mobile Home / Other | 30 | 0.9% |
| Total | 3,543 | 100.0% |
Housing Structures by Occupancy in Florida City
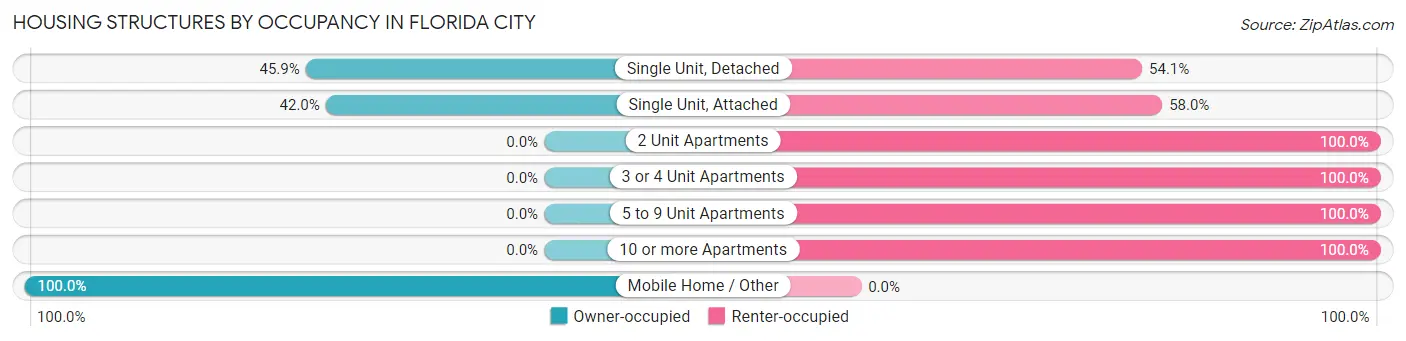
| Structure Type | Owner-occupied | Renter-occupied |
| Single Unit, Detached | 719 (45.9%) | 847 (54.1%) |
| Single Unit, Attached | 132 (42.0%) | 182 (58.0%) |
| 2 Unit Apartments | 0 (0.0%) | 102 (100.0%) |
| 3 or 4 Unit Apartments | 0 (0.0%) | 242 (100.0%) |
| 5 to 9 Unit Apartments | 0 (0.0%) | 441 (100.0%) |
| 10 or more Apartments | 0 (0.0%) | 848 (100.0%) |
| Mobile Home / Other | 30 (100.0%) | 0 (0.0%) |
| Total | 881 (24.9%) | 2,662 (75.1%) |
Housing Structures by Number of Rooms in Florida City
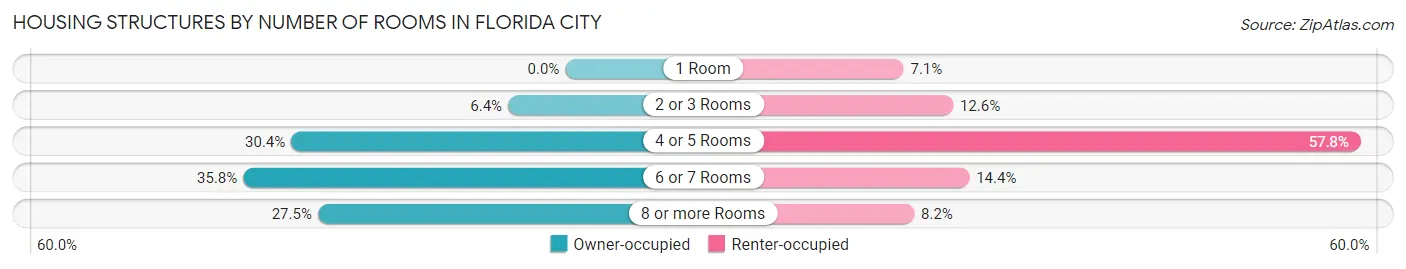
| Number of Rooms | Owner-occupied | Renter-occupied |
| 1 Room | 0 (0.0%) | 188 (7.1%) |
| 2 or 3 Rooms | 56 (6.4%) | 334 (12.6%) |
| 4 or 5 Rooms | 268 (30.4%) | 1,539 (57.8%) |
| 6 or 7 Rooms | 315 (35.7%) | 382 (14.3%) |
| 8 or more Rooms | 242 (27.5%) | 219 (8.2%) |
| Total | 881 (100.0%) | 2,662 (100.0%) |
Housing Structure by Heating Type in Florida City
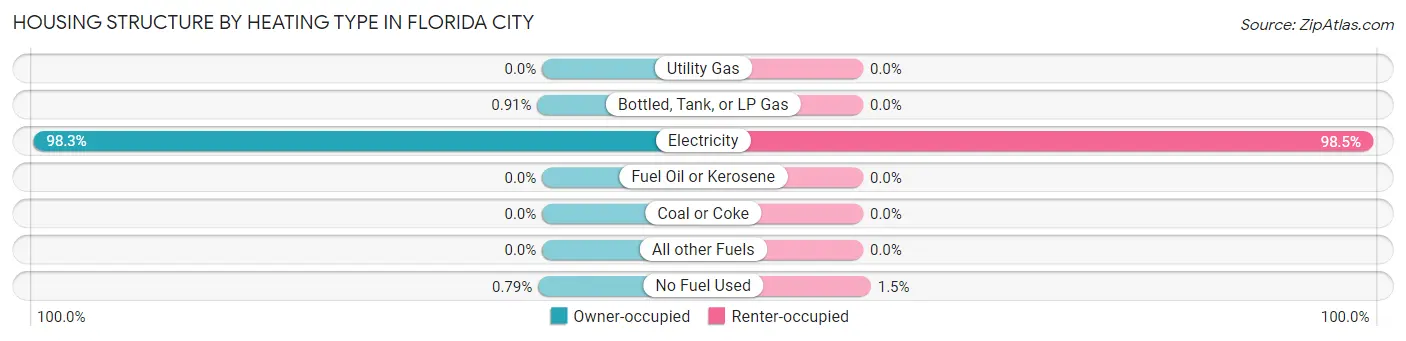
| Heating Type | Owner-occupied | Renter-occupied |
| Utility Gas | 0 (0.0%) | 0 (0.0%) |
| Bottled, Tank, or LP Gas | 8 (0.9%) | 0 (0.0%) |
| Electricity | 866 (98.3%) | 2,622 (98.5%) |
| Fuel Oil or Kerosene | 0 (0.0%) | 0 (0.0%) |
| Coal or Coke | 0 (0.0%) | 0 (0.0%) |
| All other Fuels | 0 (0.0%) | 0 (0.0%) |
| No Fuel Used | 7 (0.8%) | 40 (1.5%) |
| Total | 881 (100.0%) | 2,662 (100.0%) |
Household Vehicle Usage in Florida City
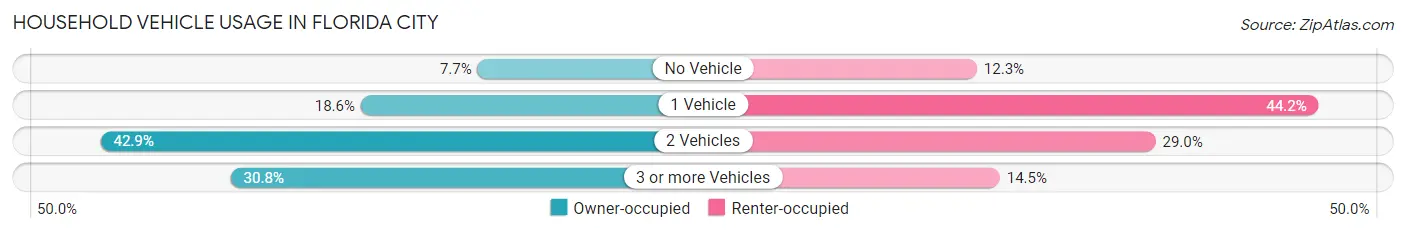
| Vehicles per Household | Owner-occupied | Renter-occupied |
| No Vehicle | 68 (7.7%) | 328 (12.3%) |
| 1 Vehicle | 164 (18.6%) | 1,177 (44.2%) |
| 2 Vehicles | 378 (42.9%) | 772 (29.0%) |
| 3 or more Vehicles | 271 (30.8%) | 385 (14.5%) |
| Total | 881 (100.0%) | 2,662 (100.0%) |
Real Estate & Mortgages in Florida City
Real Estate and Mortgage Overview in Florida City
| Characteristic | Without Mortgage | With Mortgage |
| Housing Units | 534 | 347 |
| Median Property Value | - | - |
| Median Household Income | $67,039 | $37 |
| Monthly Housing Costs | $502 | $0 |
| Real Estate Taxes | $1,510 | $56 |
Property Value by Mortgage Status in Florida City
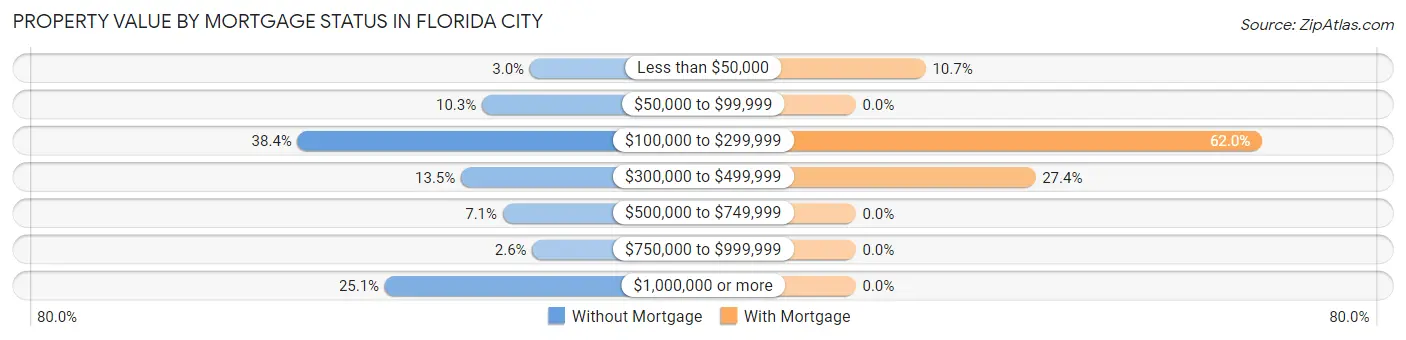
| Property Value | Without Mortgage | With Mortgage |
| Less than $50,000 | 16 (3.0%) | 37 (10.7%) |
| $50,000 to $99,999 | 55 (10.3%) | 0 (0.0%) |
| $100,000 to $299,999 | 205 (38.4%) | 215 (62.0%) |
| $300,000 to $499,999 | 72 (13.5%) | 95 (27.4%) |
| $500,000 to $749,999 | 38 (7.1%) | 0 (0.0%) |
| $750,000 to $999,999 | 14 (2.6%) | 0 (0.0%) |
| $1,000,000 or more | 134 (25.1%) | 0 (0.0%) |
| Total | 534 (100.0%) | 347 (100.0%) |
Household Income by Mortgage Status in Florida City
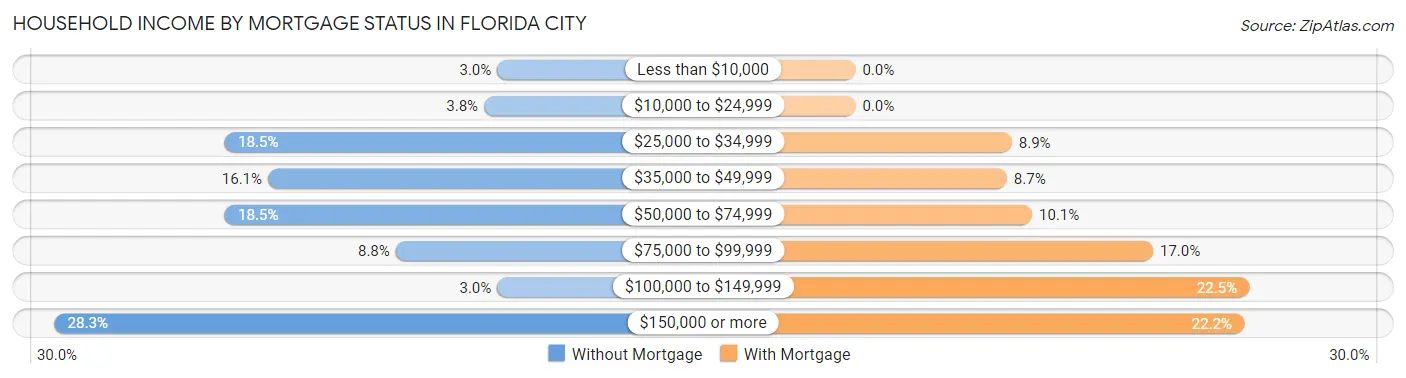
| Household Income | Without Mortgage | With Mortgage |
| Less than $10,000 | 16 (3.0%) | 0 (0.0%) |
| $10,000 to $24,999 | 20 (3.7%) | 0 (0.0%) |
| $25,000 to $34,999 | 99 (18.5%) | 31 (8.9%) |
| $35,000 to $49,999 | 86 (16.1%) | 30 (8.6%) |
| $50,000 to $74,999 | 99 (18.5%) | 35 (10.1%) |
| $75,000 to $99,999 | 47 (8.8%) | 59 (17.0%) |
| $100,000 to $149,999 | 16 (3.0%) | 78 (22.5%) |
| $150,000 or more | 151 (28.3%) | 77 (22.2%) |
| Total | 534 (100.0%) | 347 (100.0%) |
Property Value to Household Income Ratio in Florida City
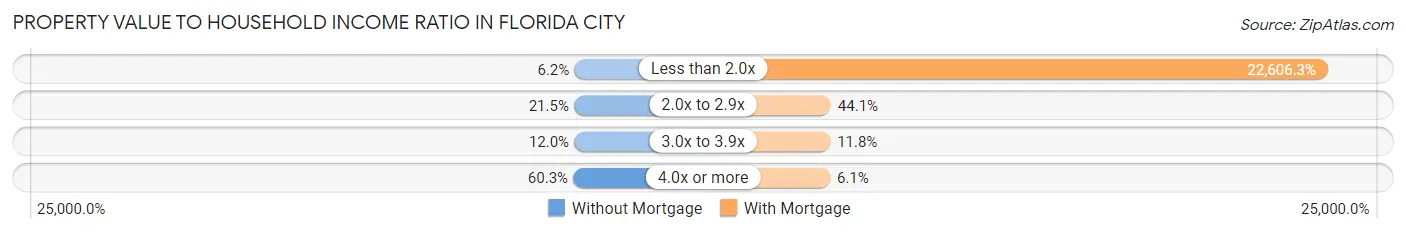
| Value-to-Income Ratio | Without Mortgage | With Mortgage |
| Less than 2.0x | 33 (6.2%) | 78,444 (22,606.3%) |
| 2.0x to 2.9x | 115 (21.5%) | 153 (44.1%) |
| 3.0x to 3.9x | 64 (12.0%) | 41 (11.8%) |
| 4.0x or more | 322 (60.3%) | 21 (6.0%) |
| Total | 534 (100.0%) | 347 (100.0%) |
Real Estate Taxes by Mortgage Status in Florida City
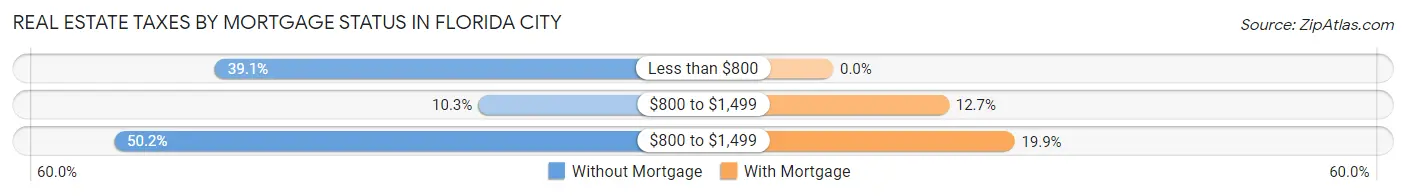
| Property Taxes | Without Mortgage | With Mortgage |
| Less than $800 | 209 (39.1%) | 0 (0.0%) |
| $800 to $1,499 | 55 (10.3%) | 44 (12.7%) |
| $800 to $1,499 | 268 (50.2%) | 69 (19.9%) |
| Total | 534 (100.0%) | 347 (100.0%) |
Health & Disability in Florida City
Health Insurance Coverage by Age in Florida City
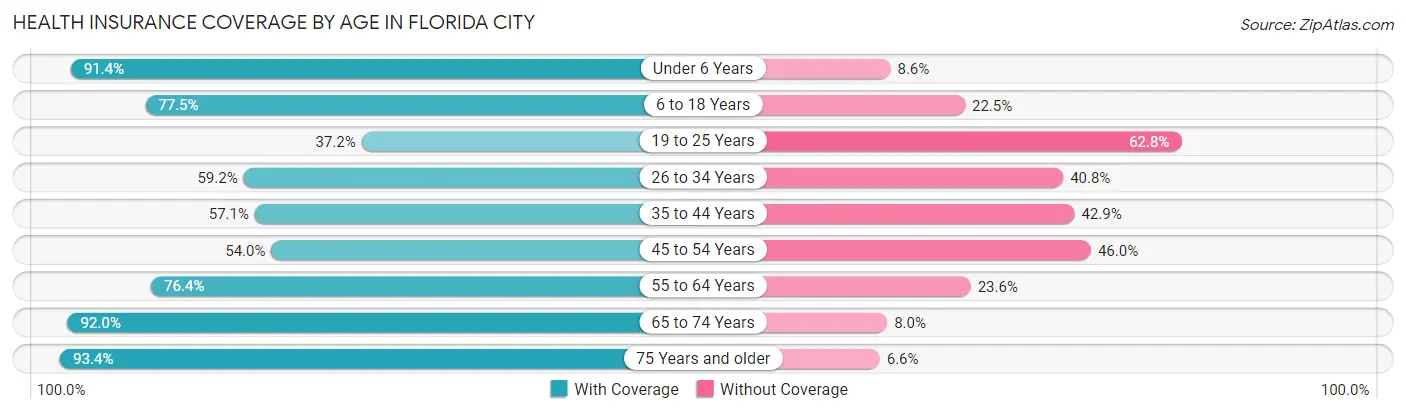
| Age Bracket | With Coverage | Without Coverage |
| Under 6 Years | 1,601 (91.4%) | 151 (8.6%) |
| 6 to 18 Years | 2,157 (77.5%) | 627 (22.5%) |
| 19 to 25 Years | 514 (37.2%) | 869 (62.8%) |
| 26 to 34 Years | 977 (59.2%) | 674 (40.8%) |
| 35 to 44 Years | 989 (57.1%) | 744 (42.9%) |
| 45 to 54 Years | 587 (54.0%) | 500 (46.0%) |
| 55 to 64 Years | 794 (76.4%) | 245 (23.6%) |
| 65 to 74 Years | 782 (92.0%) | 68 (8.0%) |
| 75 Years and older | 522 (93.4%) | 37 (6.6%) |
| Total | 8,923 (69.5%) | 3,915 (30.5%) |
Health Insurance Coverage by Citizenship Status in Florida City
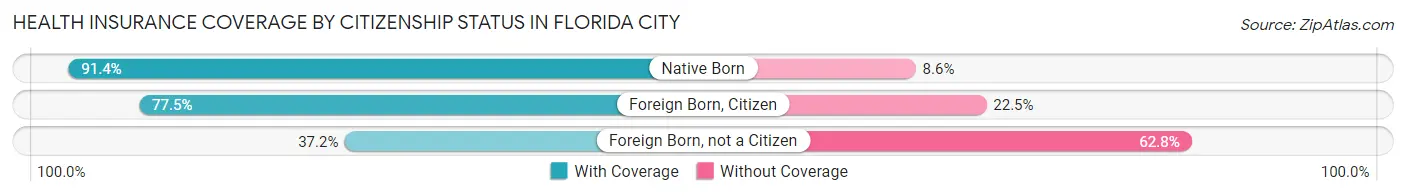
| Citizenship Status | With Coverage | Without Coverage |
| Native Born | 1,601 (91.4%) | 151 (8.6%) |
| Foreign Born, Citizen | 2,157 (77.5%) | 627 (22.5%) |
| Foreign Born, not a Citizen | 514 (37.2%) | 869 (62.8%) |
Health Insurance Coverage by Household Income in Florida City
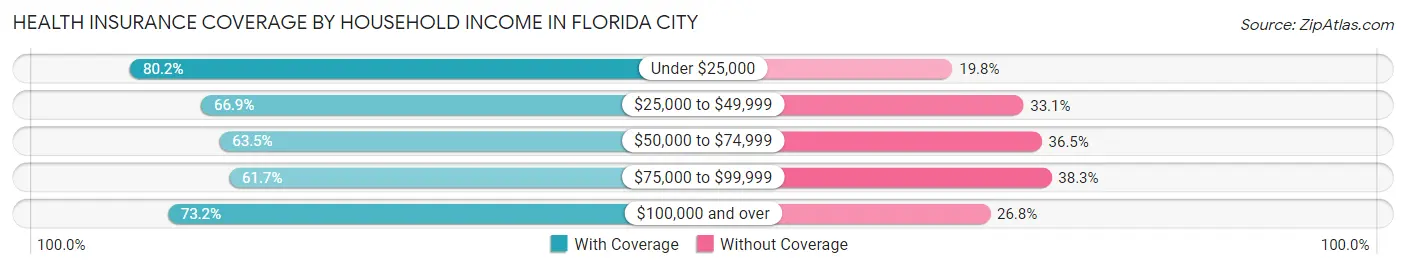
| Household Income | With Coverage | Without Coverage |
| Under $25,000 | 2,338 (80.2%) | 576 (19.8%) |
| $25,000 to $49,999 | 2,378 (66.9%) | 1,175 (33.1%) |
| $50,000 to $74,999 | 2,062 (63.5%) | 1,185 (36.5%) |
| $75,000 to $99,999 | 795 (61.7%) | 494 (38.3%) |
| $100,000 and over | 1,323 (73.2%) | 485 (26.8%) |
Public vs Private Health Insurance Coverage by Age in Florida City
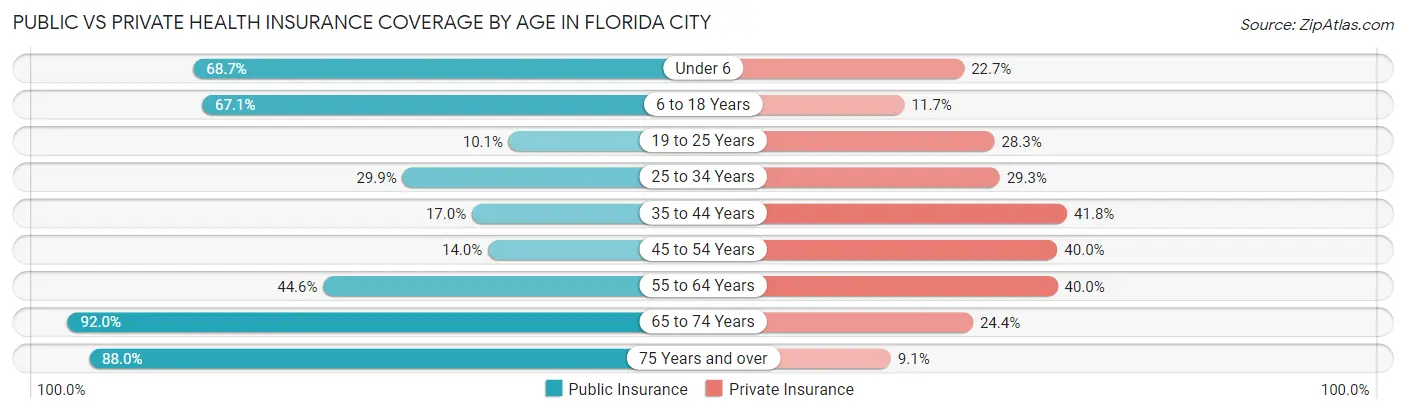
| Age Bracket | Public Insurance | Private Insurance |
| Under 6 | 1,203 (68.7%) | 398 (22.7%) |
| 6 to 18 Years | 1,867 (67.1%) | 325 (11.7%) |
| 19 to 25 Years | 140 (10.1%) | 392 (28.3%) |
| 25 to 34 Years | 493 (29.9%) | 484 (29.3%) |
| 35 to 44 Years | 294 (17.0%) | 725 (41.8%) |
| 45 to 54 Years | 152 (14.0%) | 435 (40.0%) |
| 55 to 64 Years | 463 (44.6%) | 416 (40.0%) |
| 65 to 74 Years | 782 (92.0%) | 207 (24.3%) |
| 75 Years and over | 492 (88.0%) | 51 (9.1%) |
| Total | 5,886 (45.9%) | 3,433 (26.7%) |
Disability Status by Sex by Age in Florida City
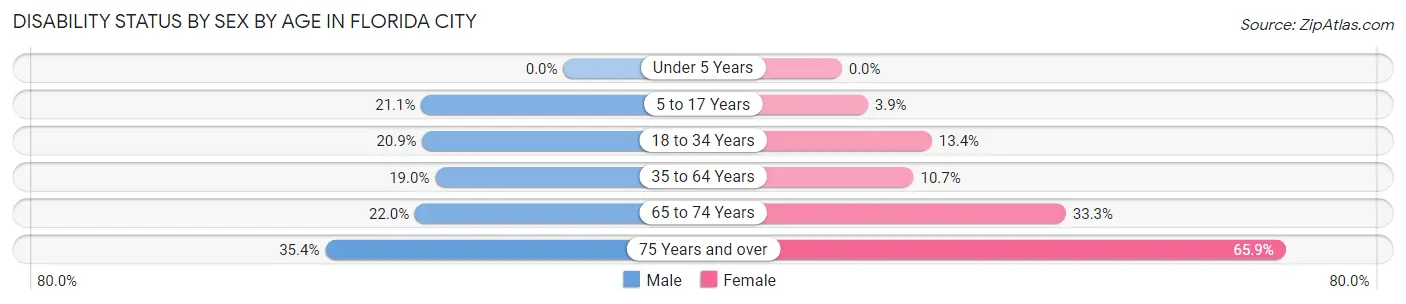
| Age Bracket | Male | Female |
| Under 5 Years | 0 (0.0%) | 0 (0.0%) |
| 5 to 17 Years | 278 (21.1%) | 68 (3.9%) |
| 18 to 34 Years | 333 (20.9%) | 216 (13.4%) |
| 35 to 64 Years | 357 (19.0%) | 211 (10.6%) |
| 65 to 74 Years | 68 (22.0%) | 180 (33.3%) |
| 75 Years and over | 122 (35.4%) | 141 (65.9%) |
Disability Class by Sex by Age in Florida City
Disability Class: Hearing Difficulty
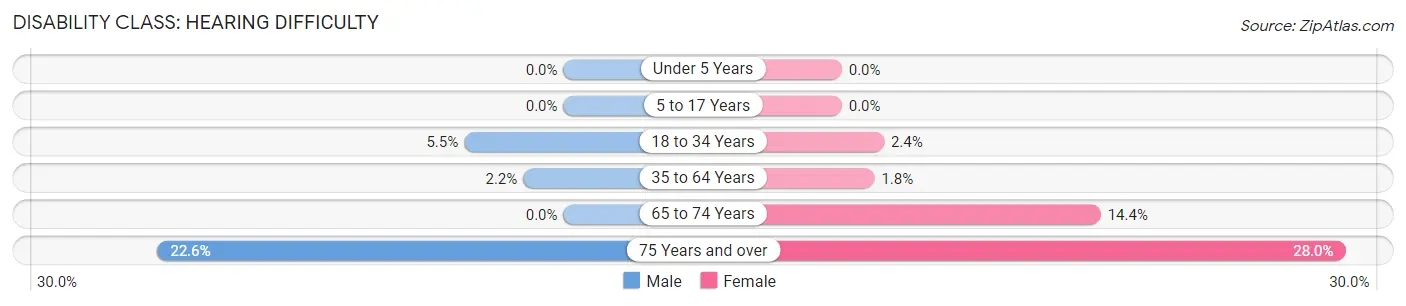
| Age Bracket | Male | Female |
| Under 5 Years | 0 (0.0%) | 0 (0.0%) |
| 5 to 17 Years | 0 (0.0%) | 0 (0.0%) |
| 18 to 34 Years | 88 (5.5%) | 38 (2.4%) |
| 35 to 64 Years | 42 (2.2%) | 36 (1.8%) |
| 65 to 74 Years | 0 (0.0%) | 78 (14.4%) |
| 75 Years and over | 78 (22.6%) | 60 (28.0%) |
Disability Class: Vision Difficulty
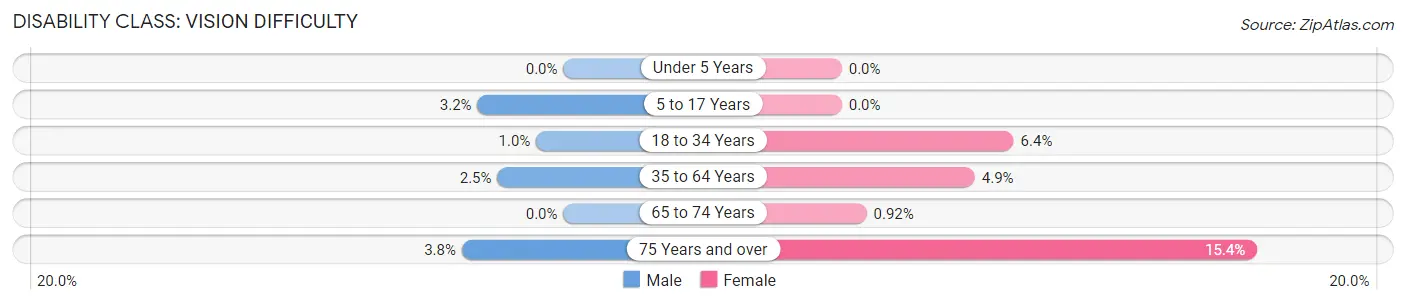
| Age Bracket | Male | Female |
| Under 5 Years | 0 (0.0%) | 0 (0.0%) |
| 5 to 17 Years | 42 (3.2%) | 0 (0.0%) |
| 18 to 34 Years | 16 (1.0%) | 103 (6.4%) |
| 35 to 64 Years | 46 (2.5%) | 98 (4.9%) |
| 65 to 74 Years | 0 (0.0%) | 5 (0.9%) |
| 75 Years and over | 13 (3.8%) | 33 (15.4%) |
Disability Class: Cognitive Difficulty
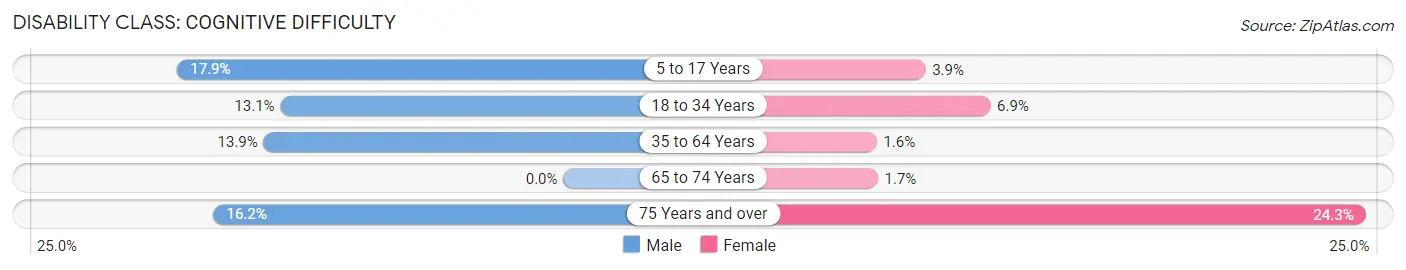
| Age Bracket | Male | Female |
| 5 to 17 Years | 236 (17.9%) | 68 (3.9%) |
| 18 to 34 Years | 209 (13.1%) | 111 (6.9%) |
| 35 to 64 Years | 261 (13.9%) | 32 (1.6%) |
| 65 to 74 Years | 0 (0.0%) | 9 (1.7%) |
| 75 Years and over | 56 (16.2%) | 52 (24.3%) |
Disability Class: Ambulatory Difficulty
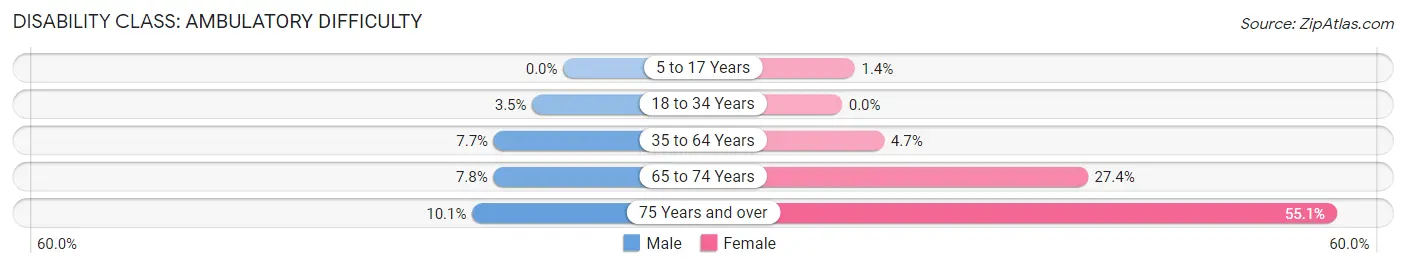
| Age Bracket | Male | Female |
| 5 to 17 Years | 0 (0.0%) | 25 (1.4%) |
| 18 to 34 Years | 55 (3.5%) | 0 (0.0%) |
| 35 to 64 Years | 145 (7.7%) | 93 (4.7%) |
| 65 to 74 Years | 24 (7.8%) | 148 (27.4%) |
| 75 Years and over | 35 (10.1%) | 118 (55.1%) |
Disability Class: Self-Care Difficulty
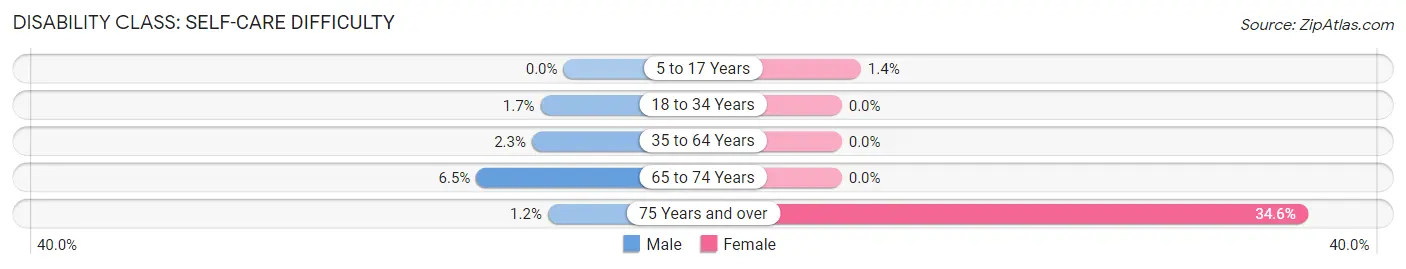
| Age Bracket | Male | Female |
| 5 to 17 Years | 0 (0.0%) | 25 (1.4%) |
| 18 to 34 Years | 27 (1.7%) | 0 (0.0%) |
| 35 to 64 Years | 44 (2.3%) | 0 (0.0%) |
| 65 to 74 Years | 20 (6.5%) | 0 (0.0%) |
| 75 Years and over | 4 (1.2%) | 74 (34.6%) |
Technology Access in Florida City
Computing Device Access in Florida City
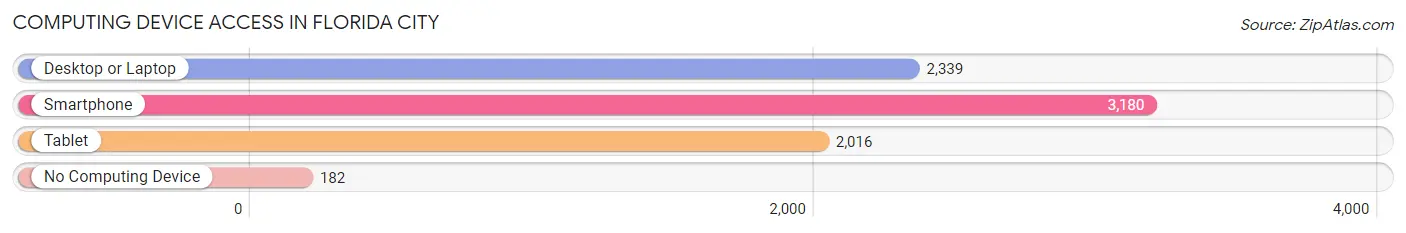
| Device Type | # Households | % Households |
| Desktop or Laptop | 2,339 | 66.0% |
| Smartphone | 3,180 | 89.7% |
| Tablet | 2,016 | 56.9% |
| No Computing Device | 182 | 5.1% |
| Total | 3,543 | 100.0% |
Internet Access in Florida City
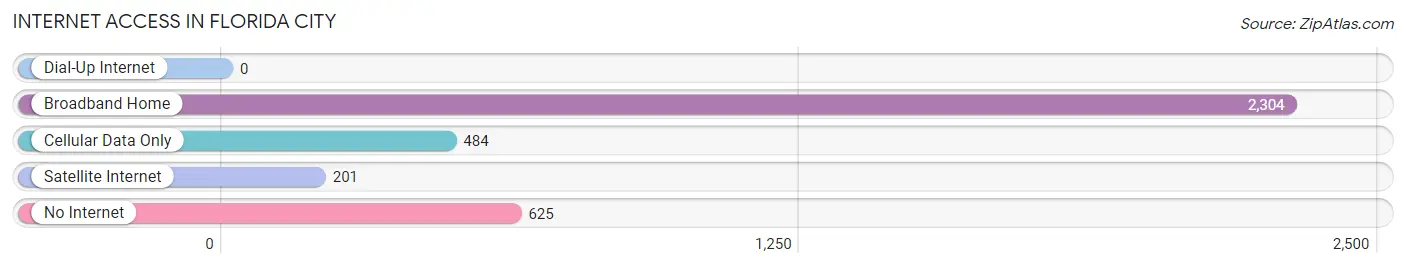
| Internet Type | # Households | % Households |
| Dial-Up Internet | 0 | 0.0% |
| Broadband Home | 2,304 | 65.0% |
| Cellular Data Only | 484 | 13.7% |
| Satellite Internet | 201 | 5.7% |
| No Internet | 625 | 17.6% |
| Total | 3,543 | 100.0% |
Florida City Summary
City of Florida City
Florida City is a city located in Miami-Dade County, Florida, United States. The city is located in the southernmost part of the Florida peninsula, about 25 miles south of Miami. As of the 2010 census, the population was 11,245. It is the southernmost city in the South Florida metropolitan area, which comprises Miami-Dade, Broward, and Palm Beach counties.
History
The area that is now Florida City was originally inhabited by the Tequesta Indians. The first European settlers arrived in the area in the late 19th century. The city was incorporated in 1914 and was named after the state of Florida.
In the early 20th century, the city was a popular tourist destination, with many hotels and resorts. The city was also home to a large agricultural industry, with many farms and packing houses.
In the 1950s, the city began to experience rapid growth due to the development of the nearby Homestead Air Force Base. The base brought many new jobs to the area and helped to spur the growth of the city.
In the 1960s, the city experienced a population boom due to the influx of Cuban immigrants. Many of these immigrants settled in the city and helped to shape its culture and economy.
In the 1970s, the city experienced a decline in population due to the closure of the Homestead Air Force Base. The city has since recovered and is now experiencing a population growth.
Geography
Florida City is located in the southernmost part of the Florida peninsula, about 25 miles south of Miami. The city is located on the Atlantic coast and is bordered by the Everglades National Park to the west and Biscayne Bay to the east.
The city has a total area of 4.2 square miles, of which 4.1 square miles is land and 0.1 square miles is water.
Economy
The economy of Florida City is largely based on tourism and agriculture. The city is home to many hotels and resorts, as well as a large agricultural industry.
The city is also home to many manufacturing and distribution companies, as well as a growing technology sector.
Demographics
As of the 2010 census, the population of Florida City was 11,245. The racial makeup of the city was 64.3% White, 22.3% African American, 0.4% Native American, 0.7% Asian, 0.1% Pacific Islander, 10.2% from other races, and 2.0% from two or more races. Hispanic or Latino of any race were 57.2% of the population.
The median income for a household in the city was $30,917, and the median income for a family was $35,917. The per capita income for the city was $14,917. About 22.3% of families and 25.2% of the population were below the poverty line, including 33.3% of those under age 18 and 16.2% of those age 65 or over.
Conclusion
Florida City is a city located in Miami-Dade County, Florida, United States. The city is located in the southernmost part of the Florida peninsula, about 25 miles south of Miami. As of the 2010 census, the population was 11,245. The city has a long history, dating back to the Tequesta Indians. The city has experienced rapid growth due to the development of the nearby Homestead Air Force Base and the influx of Cuban immigrants in the 1960s. The economy of Florida City is largely based on tourism and agriculture. The city is also home to many manufacturing and distribution companies, as well as a growing technology sector. The population of Florida City is largely Hispanic or Latino, with 57.2% of the population identifying as such. The median income for a household in the city was $30,917, and the median income for a family was $35,917. About 22.3% of families and 25.2% of the population were below the poverty line.
Common Questions
What is Per Capita Income in Florida City?
Per Capita income in Florida City is $16,019.
What is the Median Family Income in Florida City?
Median Family Income in Florida City is $50,149.
What is the Median Household income in Florida City?
Median Household Income in Florida City is $44,774.
What is Income or Wage Gap in Florida City?
Income or Wage Gap in Florida City is 0.9%.
Women in Florida City earn 99.1 cents for every dollar earned by a man.
What is Inequality or Gini Index in Florida City?
Inequality or Gini Index in Florida City is 0.46.
What is the Total Population of Florida City?
Total Population of Florida City is 12,841.
What is the Total Male Population of Florida City?
Total Male Population of Florida City is 6,043.
What is the Total Female Population of Florida City?
Total Female Population of Florida City is 6,798.
What is the Ratio of Males per 100 Females in Florida City?
There are 88.89 Males per 100 Females in Florida City.
What is the Ratio of Females per 100 Males in Florida City?
There are 112.49 Females per 100 Males in Florida City.
What is the Median Population Age in Florida City?
Median Population Age in Florida City is 28.5 Years.
What is the Average Family Size in Florida City
Average Family Size in Florida City is 4.4 People.
What is the Average Household Size in Florida City
Average Household Size in Florida City is 3.6 People.
How Large is the Labor Force in Florida City?
There are 4,907 People in the Labor Forcein in Florida City.
What is the Percentage of People in the Labor Force in Florida City?
54.4% of People are in the Labor Force in Florida City.
What is the Unemployment Rate in Florida City?
Unemployment Rate in Florida City is 8.8%.