Dunnellon, FL Map & Demographics
Dunnellon Map
Dunnellon Overview
$29,379
PER CAPITA INCOME
$59,350
AVG FAMILY INCOME
$34,930
AVG HOUSEHOLD INCOME
5.7%
WAGE / INCOME GAP [ % ]
94.3¢/ $1
WAGE / INCOME GAP [ $ ]
$10,081
FAMILY INCOME DEFICIT
0.42
INEQUALITY / GINI INDEX
2,337
TOTAL POPULATION
1,101
MALE POPULATION
1,236
FEMALE POPULATION
89.08
MALES / 100 FEMALES
112.26
FEMALES / 100 MALES
60.4
MEDIAN AGE
2.7
AVG FAMILY SIZE
1.8
AVG HOUSEHOLD SIZE
676
LABOR FORCE [ PEOPLE ]
32.4%
PERCENT IN LABOR FORCE
6.1%
UNEMPLOYMENT RATE
Dunnellon Area Codes
Income in Dunnellon
Income Overview in Dunnellon
Per Capita Income in Dunnellon is $29,379, while median incomes of families and households are $59,350 and $34,930 respectively.
| Characteristic | Number | Measure |
| Per Capita Income | 2,337 | $29,379 |
| Median Family Income | 529 | $59,350 |
| Mean Family Income | 529 | $72,523 |
| Median Household Income | 1,310 | $34,930 |
| Mean Household Income | 1,310 | $51,467 |
| Income Deficit | 529 | $10,081 |
| Wage / Income Gap (%) | 2,337 | 5.74% |
| Wage / Income Gap ($) | 2,337 | 94.26¢ per $1 |
| Gini / Inequality Index | 2,337 | 0.42 |
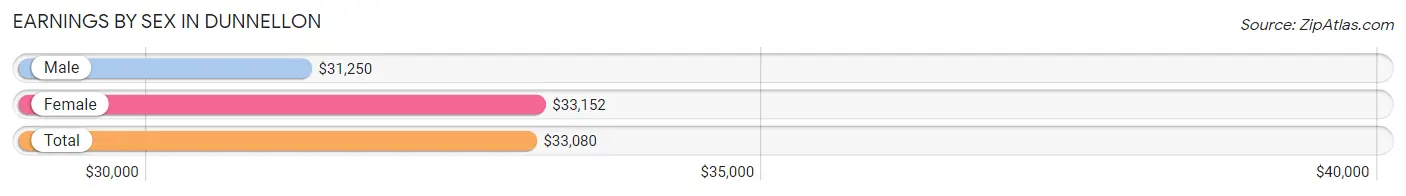
Earnings by Sex in Dunnellon
Average Earnings in Dunnellon are $33,080, $31,250 for men and $33,152 for women, a difference of 5.7%.
| Sex | Number | Average Earnings |
| Male | 278 (37.7%) | $31,250 |
| Female | 460 (62.3%) | $33,152 |
| Total | 738 (100.0%) | $33,080 |
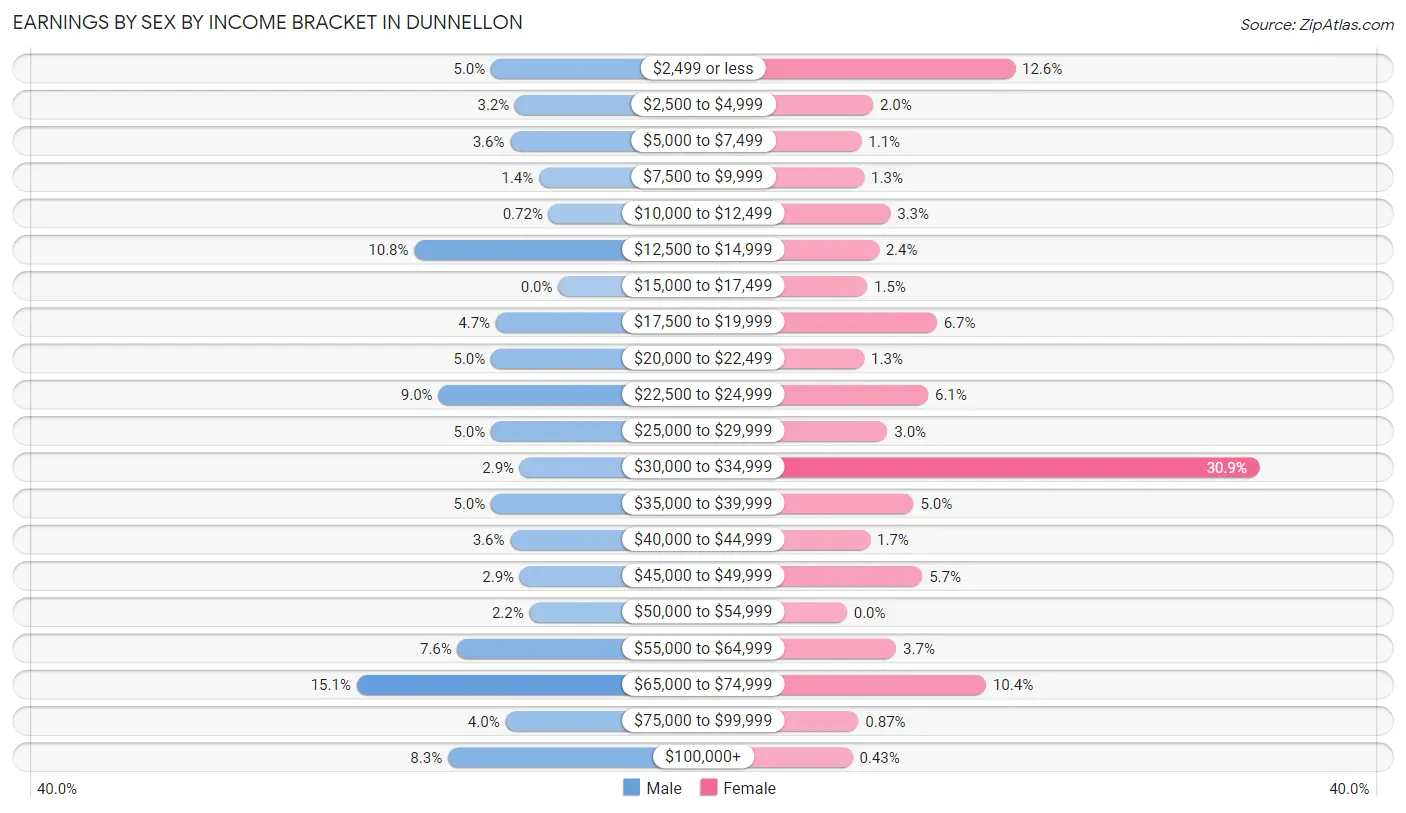
Earnings by Sex by Income Bracket in Dunnellon
The most common earnings brackets in Dunnellon are $65,000 to $74,999 for men (42 | 15.1%) and $30,000 to $34,999 for women (142 | 30.9%).
| Income | Male | Female |
| $2,499 or less | 14 (5.0%) | 58 (12.6%) |
| $2,500 to $4,999 | 9 (3.2%) | 9 (2.0%) |
| $5,000 to $7,499 | 10 (3.6%) | 5 (1.1%) |
| $7,500 to $9,999 | 4 (1.4%) | 6 (1.3%) |
| $10,000 to $12,499 | 2 (0.7%) | 15 (3.3%) |
| $12,500 to $14,999 | 30 (10.8%) | 11 (2.4%) |
| $15,000 to $17,499 | 0 (0.0%) | 7 (1.5%) |
| $17,500 to $19,999 | 13 (4.7%) | 31 (6.7%) |
| $20,000 to $22,499 | 14 (5.0%) | 6 (1.3%) |
| $22,500 to $24,999 | 25 (9.0%) | 28 (6.1%) |
| $25,000 to $29,999 | 14 (5.0%) | 14 (3.0%) |
| $30,000 to $34,999 | 8 (2.9%) | 142 (30.9%) |
| $35,000 to $39,999 | 14 (5.0%) | 23 (5.0%) |
| $40,000 to $44,999 | 10 (3.6%) | 8 (1.7%) |
| $45,000 to $49,999 | 8 (2.9%) | 26 (5.7%) |
| $50,000 to $54,999 | 6 (2.2%) | 0 (0.0%) |
| $55,000 to $64,999 | 21 (7.5%) | 17 (3.7%) |
| $65,000 to $74,999 | 42 (15.1%) | 48 (10.4%) |
| $75,000 to $99,999 | 11 (4.0%) | 4 (0.9%) |
| $100,000+ | 23 (8.3%) | 2 (0.4%) |
| Total | 278 (100.0%) | 460 (100.0%) |
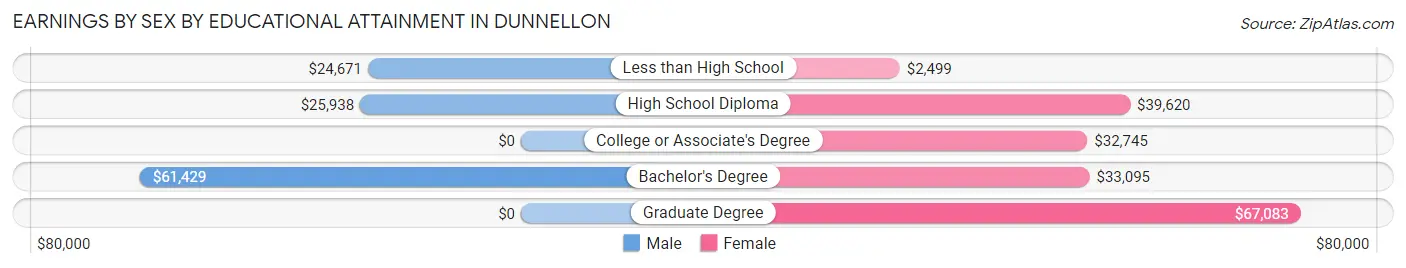
Earnings by Sex by Educational Attainment in Dunnellon
Average earnings in Dunnellon are $40,375 for men and $33,252 for women, a difference of 17.6%. Men with an educational attainment of bachelor's degree enjoy the highest average annual earnings of $61,429, while those with less than high school education earn the least with $24,671. Women with an educational attainment of graduate degree earn the most with the average annual earnings of $67,083, while those with less than high school education have the smallest earnings of $2,499.
| Educational Attainment | Male Income | Female Income |
| Less than High School | $24,671 | $2,499 |
| High School Diploma | $25,938 | $39,620 |
| College or Associate's Degree | - | - |
| Bachelor's Degree | $61,429 | $33,095 |
| Graduate Degree | - | - |
| Total | $40,375 | $33,252 |
Family Income in Dunnellon
Family Income Brackets in Dunnellon
According to the Dunnellon family income data, there are 125 families falling into the $100,000 to $149,999 income range, which is the most common income bracket and makes up 23.6% of all families. Conversely, the $200,000+ income bracket is the least frequent group with only 6 families (1.1%) belonging to this category.
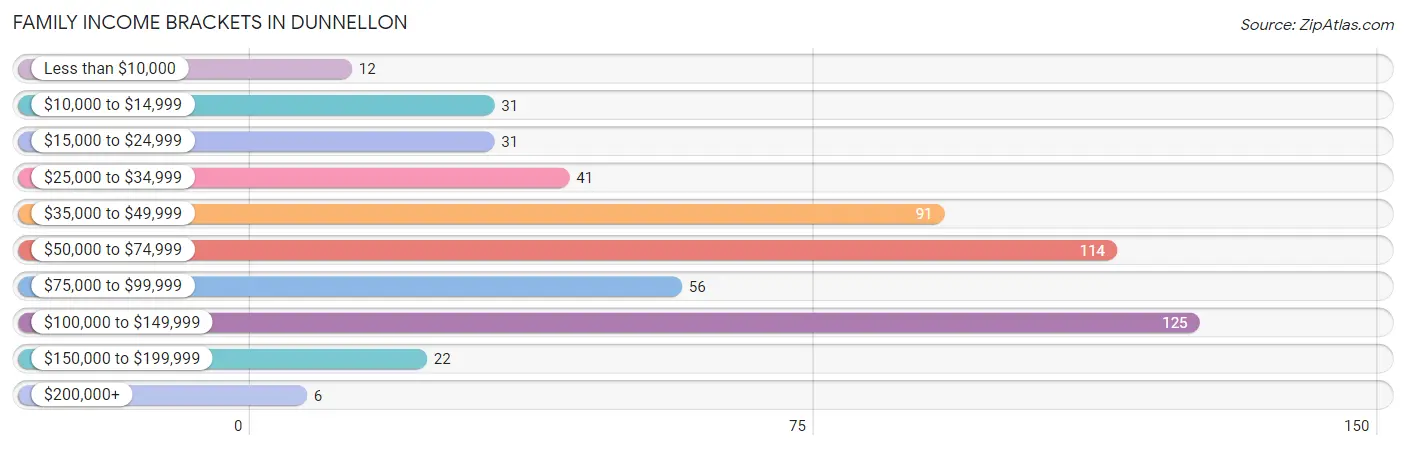
| Income Bracket | # Families | % Families |
| Less than $10,000 | 12 | 2.3% |
| $10,000 to $14,999 | 31 | 5.9% |
| $15,000 to $24,999 | 31 | 5.9% |
| $25,000 to $34,999 | 41 | 7.8% |
| $35,000 to $49,999 | 91 | 17.2% |
| $50,000 to $74,999 | 114 | 21.6% |
| $75,000 to $99,999 | 56 | 10.6% |
| $100,000 to $149,999 | 125 | 23.6% |
| $150,000 to $199,999 | 22 | 4.2% |
| $200,000+ | 6 | 1.1% |
Family Income by Famaliy Size in Dunnellon
4-person families (55 | 10.4%) account for the highest median family income in Dunnellon with $103,988 per family, while 2-person families (343 | 64.8%) have the highest median income of $31,979 per family member.
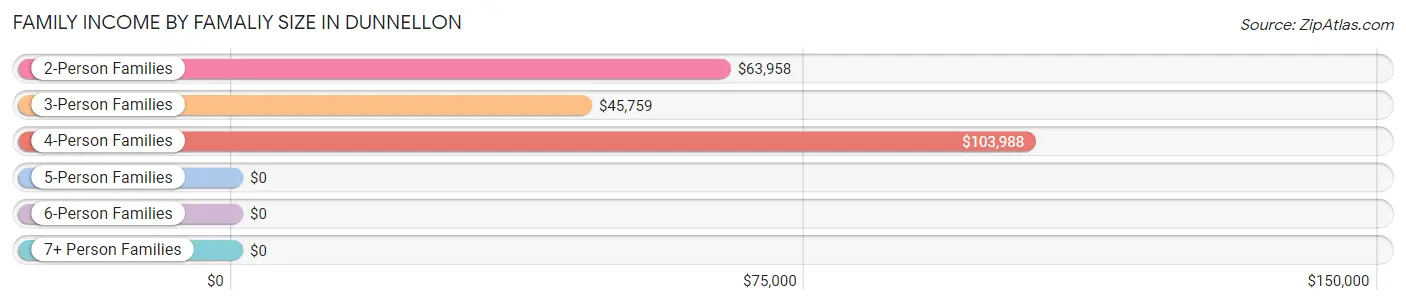
| Income Bracket | # Families | Median Income |
| 2-Person Families | 343 (64.8%) | $63,958 |
| 3-Person Families | 113 (21.4%) | $45,759 |
| 4-Person Families | 55 (10.4%) | $103,988 |
| 5-Person Families | 10 (1.9%) | $0 |
| 6-Person Families | 8 (1.5%) | $0 |
| 7+ Person Families | 0 (0.0%) | $0 |
| Total | 529 (100.0%) | $59,350 |
Family Income by Number of Earners in Dunnellon
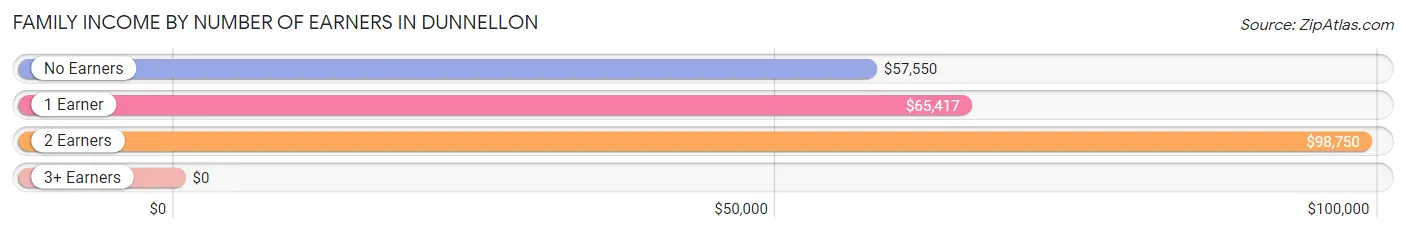
| Number of Earners | # Families | Median Income |
| No Earners | 255 (48.2%) | $57,550 |
| 1 Earner | 142 (26.8%) | $65,417 |
| 2 Earners | 126 (23.8%) | $98,750 |
| 3+ Earners | 6 (1.1%) | $0 |
| Total | 529 (100.0%) | $59,350 |
Household Income in Dunnellon
Household Income Brackets in Dunnellon
With 309 households falling in the category, the $25,000 to $34,999 income range is the most frequent in Dunnellon, accounting for 23.6% of all households. In contrast, only 8 households (0.6%) fall into the $200,000+ income bracket, making it the least populous group.
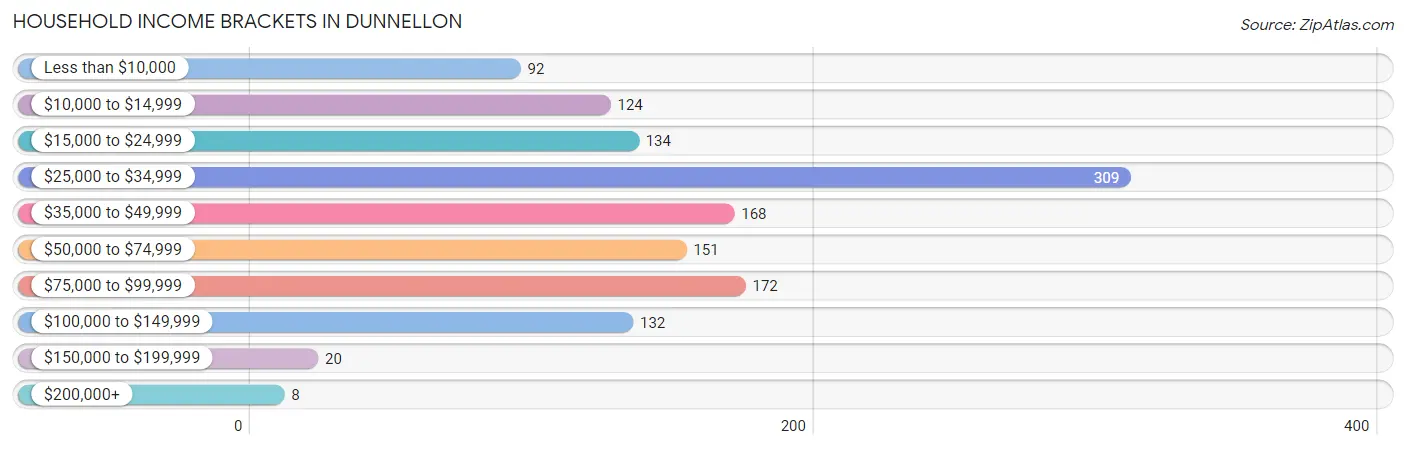
| Income Bracket | # Households | % Households |
| Less than $10,000 | 92 | 7.0% |
| $10,000 to $14,999 | 124 | 9.5% |
| $15,000 to $24,999 | 134 | 10.2% |
| $25,000 to $34,999 | 309 | 23.6% |
| $35,000 to $49,999 | 168 | 12.8% |
| $50,000 to $74,999 | 151 | 11.5% |
| $75,000 to $99,999 | 172 | 13.1% |
| $100,000 to $149,999 | 132 | 10.1% |
| $150,000 to $199,999 | 20 | 1.5% |
| $200,000+ | 8 | 0.6% |
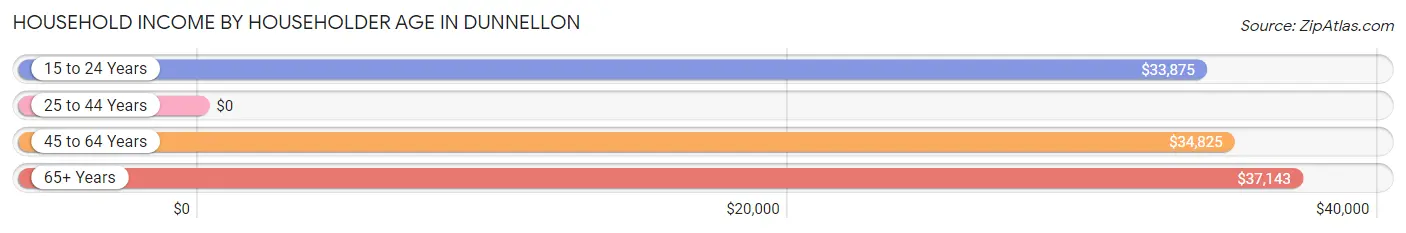
Household Income by Householder Age in Dunnellon
The median household income in Dunnellon is $34,930, with the highest median household income of $37,143 found in the 65+ years age bracket for the primary householder. A total of 574 households (43.8%) fall into this category. Meanwhile, the 25 to 44 years age bracket for the primary householder has the lowest median household income of $0, with 174 households (13.3%) in this group.
| Income Bracket | # Households | Median Income |
| 15 to 24 Years | 19 (1.5%) | $33,875 |
| 25 to 44 Years | 174 (13.3%) | $0 |
| 45 to 64 Years | 543 (41.4%) | $34,825 |
| 65+ Years | 574 (43.8%) | $37,143 |
| Total | 1,310 (100.0%) | $34,930 |
Poverty in Dunnellon
Income Below Poverty by Sex and Age in Dunnellon
With 18.6% poverty level for males and 18.4% for females among the residents of Dunnellon, 35 to 44 year old males and 25 to 34 year old females are the most vulnerable to poverty, with 26 males (38.2%) and 55 females (56.7%) in their respective age groups living below the poverty level.
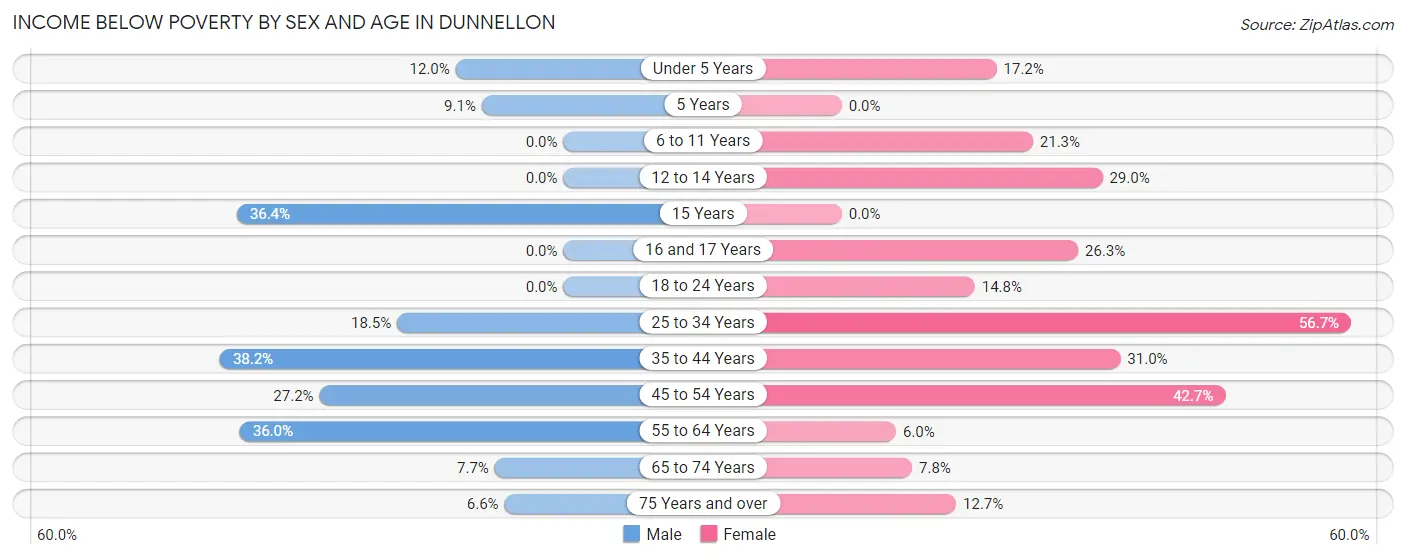
| Age Bracket | Male | Female |
| Under 5 Years | 6 (12.0%) | 5 (17.2%) |
| 5 Years | 1 (9.1%) | 0 (0.0%) |
| 6 to 11 Years | 0 (0.0%) | 10 (21.3%) |
| 12 to 14 Years | 0 (0.0%) | 9 (29.0%) |
| 15 Years | 4 (36.4%) | 0 (0.0%) |
| 16 and 17 Years | 0 (0.0%) | 5 (26.3%) |
| 18 to 24 Years | 0 (0.0%) | 4 (14.8%) |
| 25 to 34 Years | 10 (18.5%) | 55 (56.7%) |
| 35 to 44 Years | 26 (38.2%) | 36 (31.0%) |
| 45 to 54 Years | 25 (27.2%) | 38 (42.7%) |
| 55 to 64 Years | 107 (36.0%) | 20 (6.0%) |
| 65 to 74 Years | 14 (7.6%) | 18 (7.8%) |
| 75 Years and over | 12 (6.6%) | 28 (12.7%) |
| Total | 205 (18.6%) | 228 (18.4%) |
Income Above Poverty by Sex and Age in Dunnellon
According to the poverty statistics in Dunnellon, males aged 6 to 11 years and females aged 55 to 64 years are the age groups that are most secure financially, with 100.0% of males and 94.0% of females in these age groups living above the poverty line.
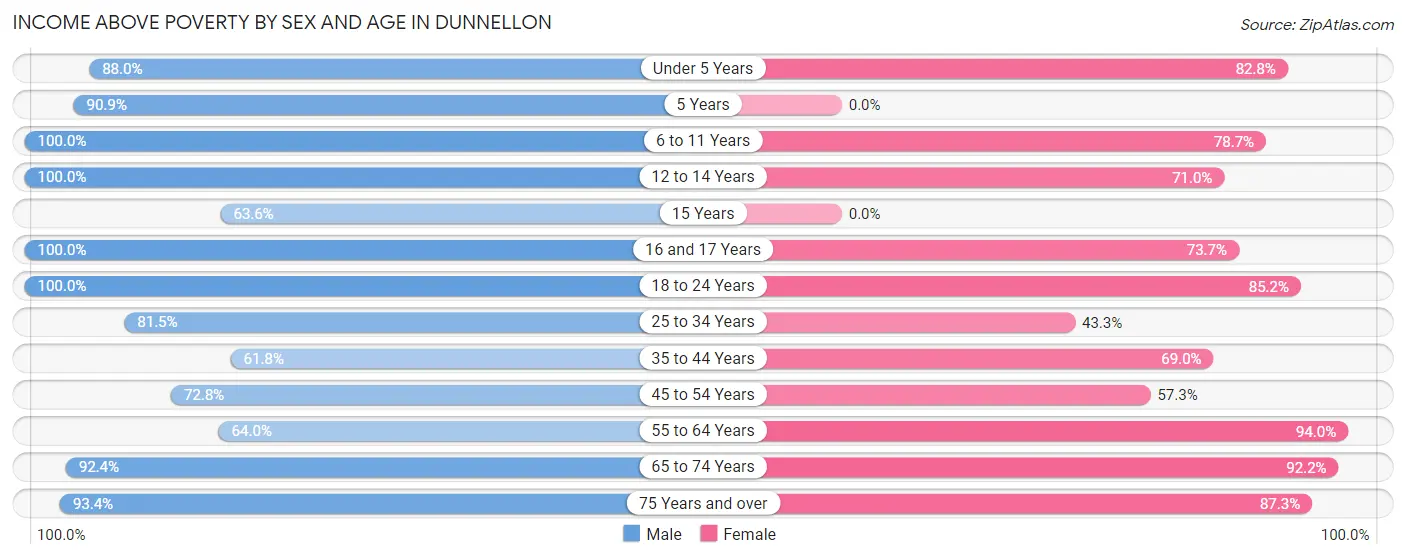
| Age Bracket | Male | Female |
| Under 5 Years | 44 (88.0%) | 24 (82.8%) |
| 5 Years | 10 (90.9%) | 0 (0.0%) |
| 6 to 11 Years | 29 (100.0%) | 37 (78.7%) |
| 12 to 14 Years | 42 (100.0%) | 22 (71.0%) |
| 15 Years | 7 (63.6%) | 0 (0.0%) |
| 16 and 17 Years | 7 (100.0%) | 14 (73.7%) |
| 18 to 24 Years | 74 (100.0%) | 23 (85.2%) |
| 25 to 34 Years | 44 (81.5%) | 42 (43.3%) |
| 35 to 44 Years | 42 (61.8%) | 80 (69.0%) |
| 45 to 54 Years | 67 (72.8%) | 51 (57.3%) |
| 55 to 64 Years | 190 (64.0%) | 311 (94.0%) |
| 65 to 74 Years | 169 (92.3%) | 212 (92.2%) |
| 75 Years and over | 171 (93.4%) | 192 (87.3%) |
| Total | 896 (81.4%) | 1,008 (81.6%) |
Income Below Poverty Among Married-Couple Families in Dunnellon
The poverty statistics for married-couple families in Dunnellon show that 5.8% or 26 of the total 445 families live below the poverty line. Families with 3 or 4 children have the highest poverty rate of 6.2%, comprising of 1 families. On the other hand, families with 1 or 2 children have the lowest poverty rate of 4.9%, which includes 4 families.
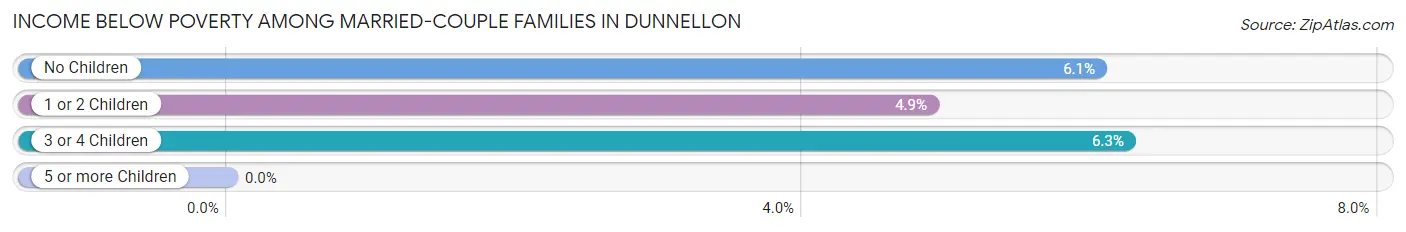
| Children | Above Poverty | Below Poverty |
| No Children | 326 (94.0%) | 21 (6.0%) |
| 1 or 2 Children | 78 (95.1%) | 4 (4.9%) |
| 3 or 4 Children | 15 (93.8%) | 1 (6.2%) |
| 5 or more Children | 0 (0.0%) | 0 (0.0%) |
| Total | 419 (94.2%) | 26 (5.8%) |
Income Below Poverty Among Single-Parent Households in Dunnellon
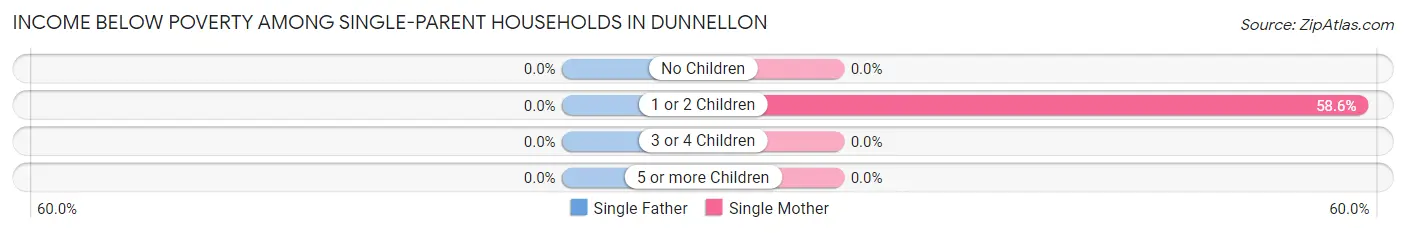
| Children | Single Father | Single Mother |
| No Children | 0 (0.0%) | 0 (0.0%) |
| 1 or 2 Children | 0 (0.0%) | 17 (58.6%) |
| 3 or 4 Children | 0 (0.0%) | 0 (0.0%) |
| 5 or more Children | 0 (0.0%) | 0 (0.0%) |
| Total | 0 (0.0%) | 17 (25.4%) |
Income Below Poverty Among Married-Couple vs Single-Parent Households in Dunnellon
The poverty data for Dunnellon shows that 26 of the married-couple family households (5.8%) and 17 of the single-parent households (20.2%) are living below the poverty level. Within the married-couple family households, those with 3 or 4 children have the highest poverty rate, with 1 households (6.2%) falling below the poverty line. Among the single-parent households, those with 1 or 2 children have the highest poverty rate, with 17 household (58.6%) living below poverty.
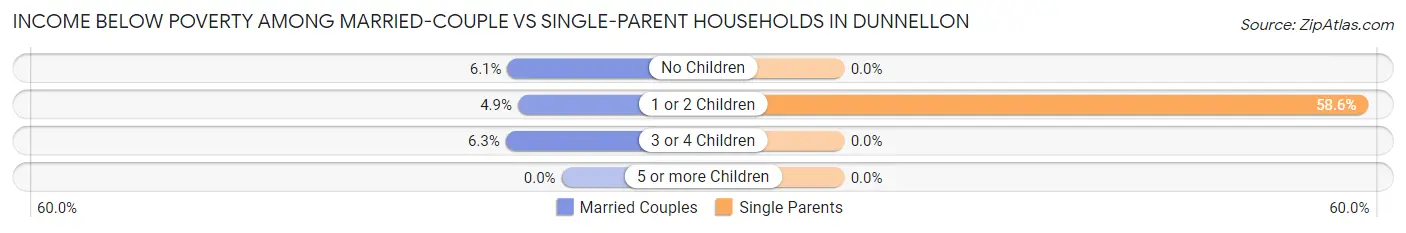
| Children | Married-Couple Families | Single-Parent Households |
| No Children | 21 (6.0%) | 0 (0.0%) |
| 1 or 2 Children | 4 (4.9%) | 17 (58.6%) |
| 3 or 4 Children | 1 (6.2%) | 0 (0.0%) |
| 5 or more Children | 0 (0.0%) | 0 (0.0%) |
| Total | 26 (5.8%) | 17 (20.2%) |
Race in Dunnellon
The most populous races in Dunnellon are White / Caucasian (1,929 | 82.5%), Black / African American (222 | 9.5%), and Two or more Races (163 | 7.0%).
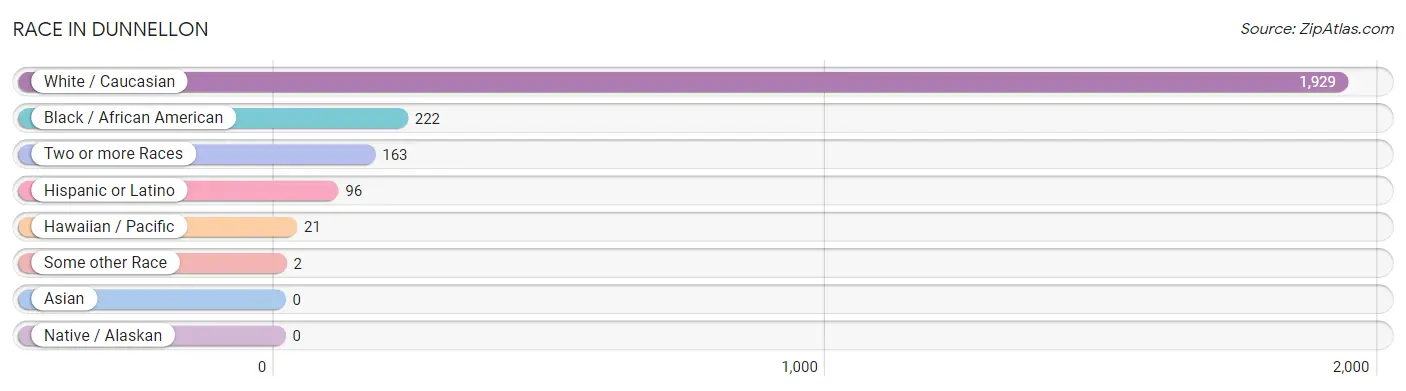
| Race | # Population | % Population |
| Asian | 0 | 0.0% |
| Black / African American | 222 | 9.5% |
| Hawaiian / Pacific | 21 | 0.9% |
| Hispanic or Latino | 96 | 4.1% |
| Native / Alaskan | 0 | 0.0% |
| White / Caucasian | 1,929 | 82.5% |
| Two or more Races | 163 | 7.0% |
| Some other Race | 2 | 0.1% |
| Total | 2,337 | 100.0% |
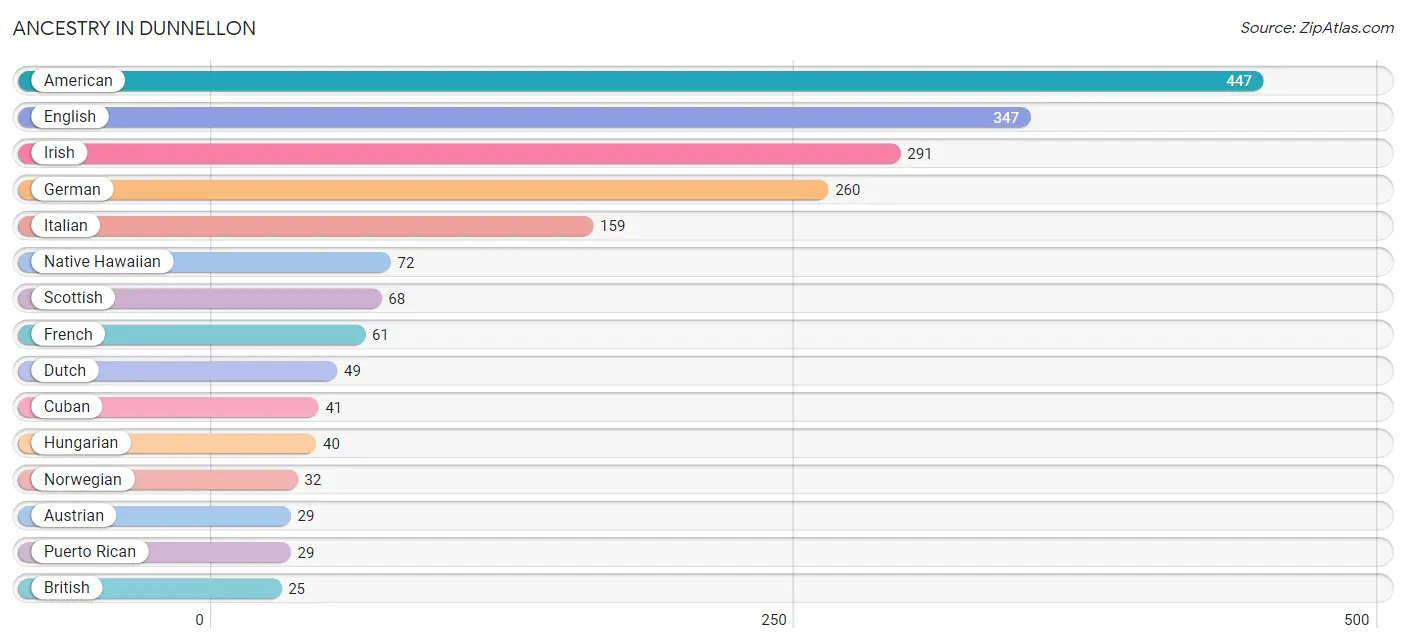
Ancestry in Dunnellon
The most populous ancestries reported in Dunnellon are American (447 | 19.1%), English (347 | 14.8%), Irish (291 | 12.4%), German (260 | 11.1%), and Italian (159 | 6.8%), together accounting for 64.4% of all Dunnellon residents.
| Ancestry | # Population | % Population |
| African | 2 | 0.1% |
| American | 447 | 19.1% |
| Austrian | 29 | 1.2% |
| British | 25 | 1.1% |
| Cajun | 7 | 0.3% |
| Central American | 20 | 0.9% |
| Costa Rican | 10 | 0.4% |
| Cuban | 41 | 1.8% |
| Czech | 4 | 0.2% |
| Czechoslovakian | 4 | 0.2% |
| Danish | 4 | 0.2% |
| Dutch | 49 | 2.1% |
| English | 347 | 14.8% |
| European | 13 | 0.6% |
| Finnish | 6 | 0.3% |
| French | 61 | 2.6% |
| French Canadian | 7 | 0.3% |
| German | 260 | 11.1% |
| Greek | 11 | 0.5% |
| Honduran | 10 | 0.4% |
| Hungarian | 40 | 1.7% |
| Irish | 291 | 12.4% |
| Iroquois | 15 | 0.6% |
| Italian | 159 | 6.8% |
| Jamaican | 4 | 0.2% |
| Mexican | 3 | 0.1% |
| Native Hawaiian | 72 | 3.1% |
| Northern European | 4 | 0.2% |
| Norwegian | 32 | 1.4% |
| Polish | 13 | 0.6% |
| Portuguese | 18 | 0.8% |
| Puerto Rican | 29 | 1.2% |
| Scandinavian | 22 | 0.9% |
| Scotch-Irish | 5 | 0.2% |
| Scottish | 68 | 2.9% |
| Slavic | 8 | 0.3% |
| Spanish | 3 | 0.1% |
| Subsaharan African | 2 | 0.1% |
| Swedish | 13 | 0.6% |
| Welsh | 11 | 0.5% | View All 40 Rows |
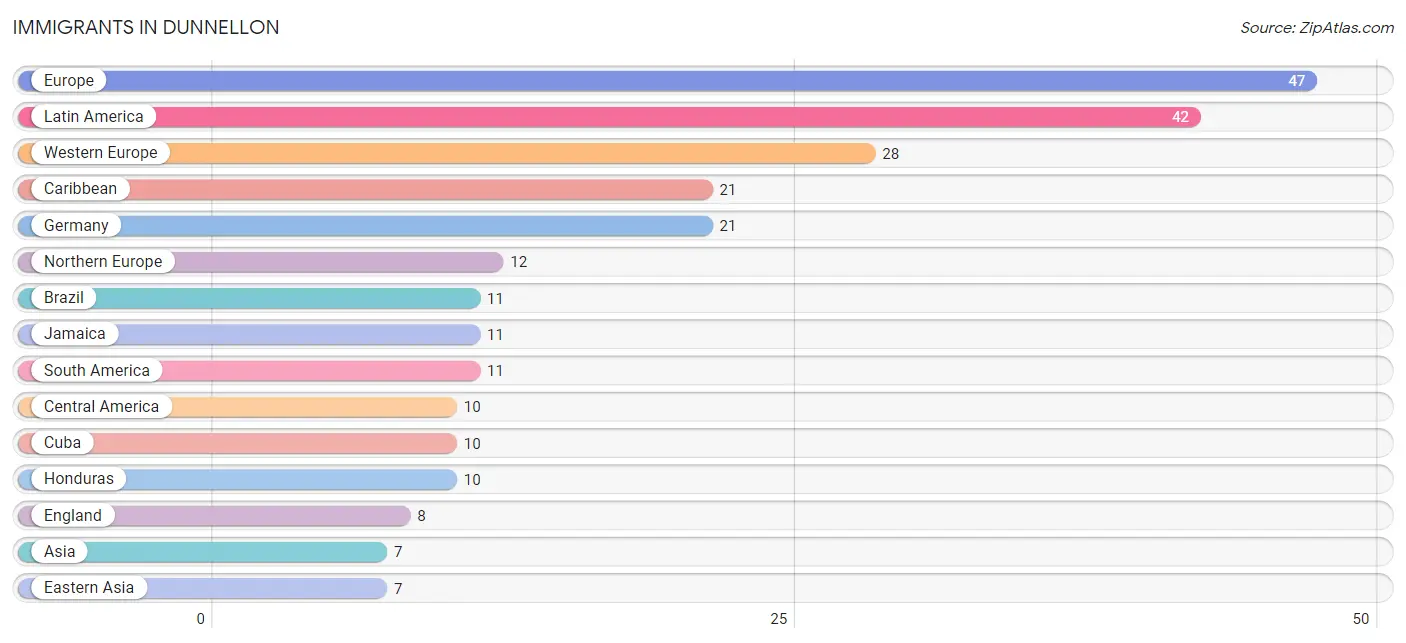
Immigrants in Dunnellon
The most numerous immigrant groups reported in Dunnellon came from Europe (47 | 2.0%), Latin America (42 | 1.8%), Western Europe (28 | 1.2%), Caribbean (21 | 0.9%), and Germany (21 | 0.9%), together accounting for 6.8% of all Dunnellon residents.
| Immigration Origin | # Population | % Population |
| Asia | 7 | 0.3% |
| Brazil | 11 | 0.5% |
| Caribbean | 21 | 0.9% |
| Central America | 10 | 0.4% |
| Cuba | 10 | 0.4% |
| Eastern Asia | 7 | 0.3% |
| Eastern Europe | 7 | 0.3% |
| England | 8 | 0.3% |
| Europe | 47 | 2.0% |
| Germany | 21 | 0.9% |
| Honduras | 10 | 0.4% |
| Jamaica | 11 | 0.5% |
| Japan | 7 | 0.3% |
| Latin America | 42 | 1.8% |
| Netherlands | 7 | 0.3% |
| Northern Europe | 12 | 0.5% |
| Poland | 7 | 0.3% |
| South America | 11 | 0.5% |
| Western Europe | 28 | 1.2% | View All 19 Rows |
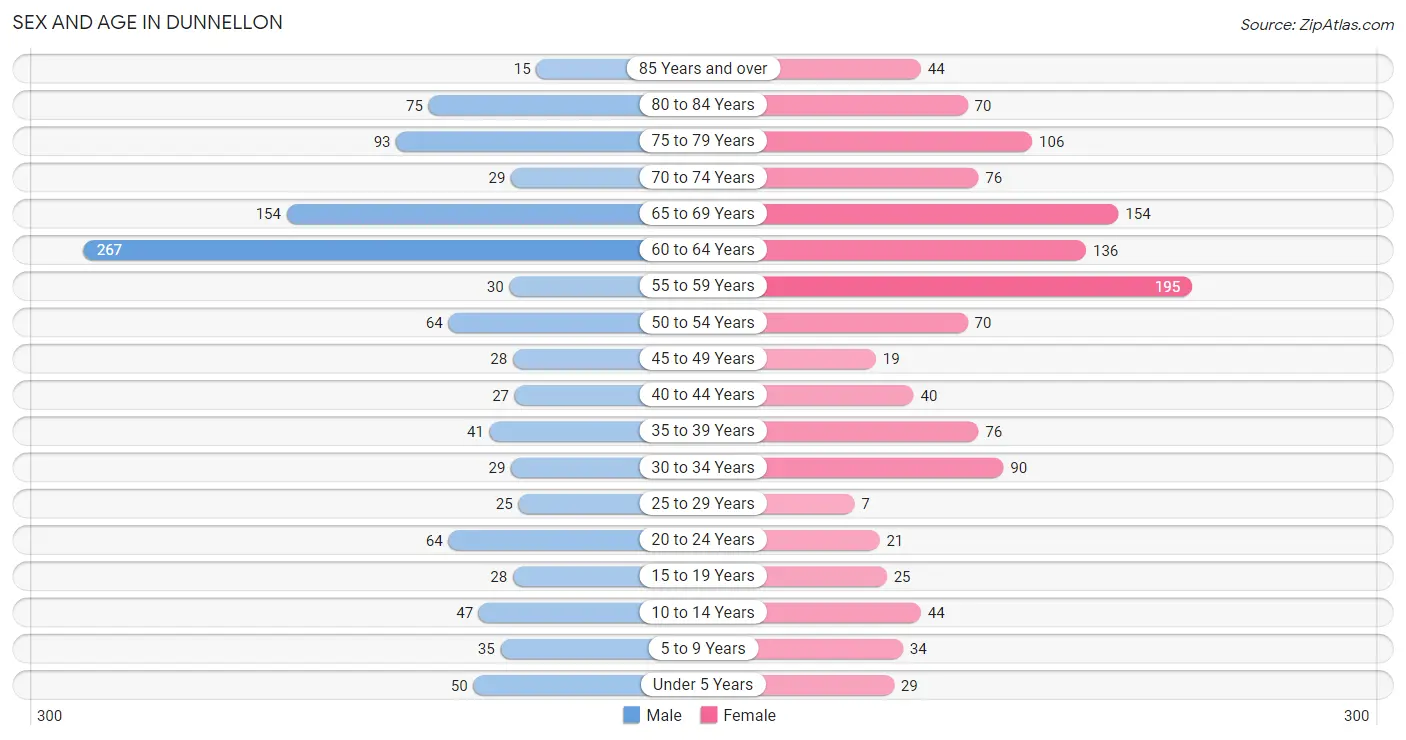
Sex and Age in Dunnellon
Sex and Age in Dunnellon
The most populous age groups in Dunnellon are 60 to 64 Years (267 | 24.2%) for men and 55 to 59 Years (195 | 15.8%) for women.
| Age Bracket | Male | Female |
| Under 5 Years | 50 (4.5%) | 29 (2.4%) |
| 5 to 9 Years | 35 (3.2%) | 34 (2.8%) |
| 10 to 14 Years | 47 (4.3%) | 44 (3.6%) |
| 15 to 19 Years | 28 (2.5%) | 25 (2.0%) |
| 20 to 24 Years | 64 (5.8%) | 21 (1.7%) |
| 25 to 29 Years | 25 (2.3%) | 7 (0.6%) |
| 30 to 34 Years | 29 (2.6%) | 90 (7.3%) |
| 35 to 39 Years | 41 (3.7%) | 76 (6.1%) |
| 40 to 44 Years | 27 (2.5%) | 40 (3.2%) |
| 45 to 49 Years | 28 (2.5%) | 19 (1.5%) |
| 50 to 54 Years | 64 (5.8%) | 70 (5.7%) |
| 55 to 59 Years | 30 (2.7%) | 195 (15.8%) |
| 60 to 64 Years | 267 (24.2%) | 136 (11.0%) |
| 65 to 69 Years | 154 (14.0%) | 154 (12.5%) |
| 70 to 74 Years | 29 (2.6%) | 76 (6.1%) |
| 75 to 79 Years | 93 (8.5%) | 106 (8.6%) |
| 80 to 84 Years | 75 (6.8%) | 70 (5.7%) |
| 85 Years and over | 15 (1.4%) | 44 (3.6%) |
| Total | 1,101 (100.0%) | 1,236 (100.0%) |
Families and Households in Dunnellon
Median Family Size in Dunnellon
The median family size in Dunnellon is 2.69 persons per family, with single female/mother families (67 | 12.7%) accounting for the largest median family size of 3.21 persons per family. On the other hand, married-couple families (445 | 84.1%) represent the smallest median family size with 2.60 persons per family.

| Family Type | # Families | Family Size |
| Married-Couple | 445 (84.1%) | 2.60 |
| Single Male/Father | 17 (3.2%) | 3.06 |
| Single Female/Mother | 67 (12.7%) | 3.21 |
| Total Families | 529 (100.0%) | 2.69 |
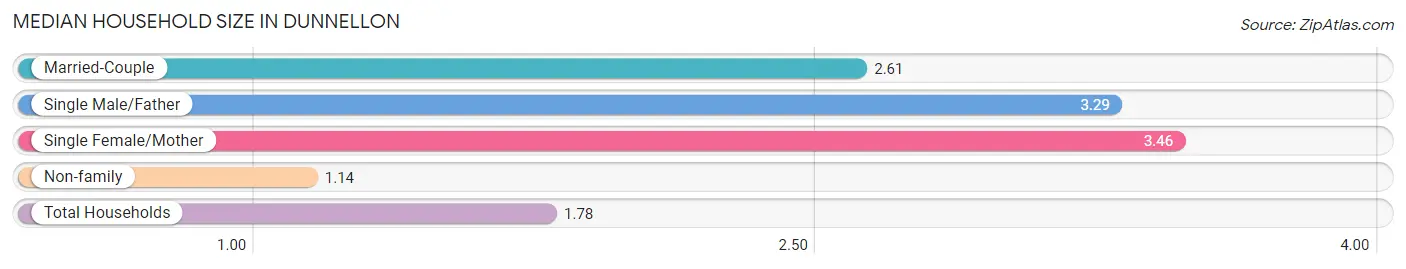
Median Household Size in Dunnellon
The median household size in Dunnellon is 1.78 persons per household, with single female/mother households (67 | 5.1%) accounting for the largest median household size of 3.46 persons per household. non-family households (781 | 59.6%) represent the smallest median household size with 1.14 persons per household.
| Household Type | # Households | Household Size |
| Married-Couple | 445 (34.0%) | 2.61 |
| Single Male/Father | 17 (1.3%) | 3.29 |
| Single Female/Mother | 67 (5.1%) | 3.46 |
| Non-family | 781 (59.6%) | 1.14 |
| Total Households | 1,310 (100.0%) | 1.78 |
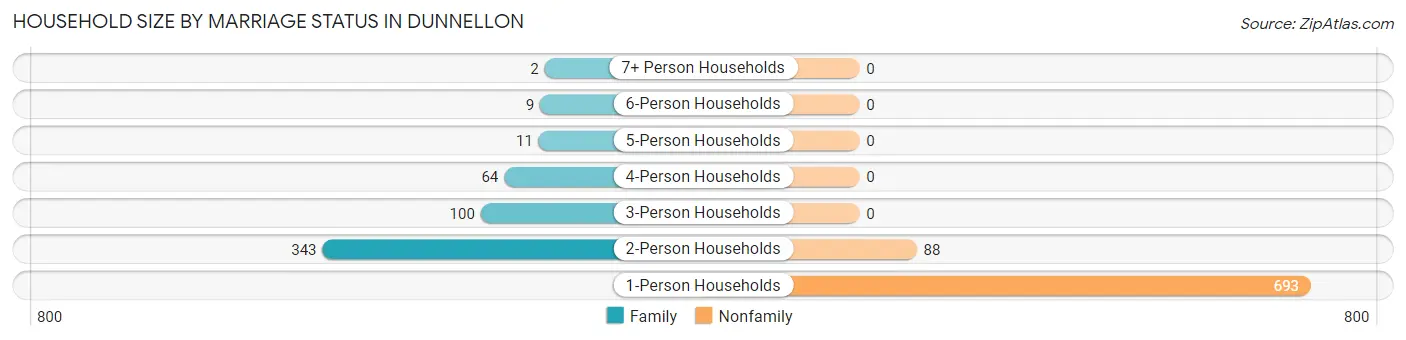
Household Size by Marriage Status in Dunnellon
Out of a total of 1,310 households in Dunnellon, 529 (40.4%) are family households, while 781 (59.6%) are nonfamily households. The most numerous type of family households are 2-person households, comprising 343, and the most common type of nonfamily households are 1-person households, comprising 693.
| Household Size | Family Households | Nonfamily Households |
| 1-Person Households | - | 693 (52.9%) |
| 2-Person Households | 343 (26.2%) | 88 (6.7%) |
| 3-Person Households | 100 (7.6%) | 0 (0.0%) |
| 4-Person Households | 64 (4.9%) | 0 (0.0%) |
| 5-Person Households | 11 (0.8%) | 0 (0.0%) |
| 6-Person Households | 9 (0.7%) | 0 (0.0%) |
| 7+ Person Households | 2 (0.2%) | 0 (0.0%) |
| Total | 529 (40.4%) | 781 (59.6%) |
Female Fertility in Dunnellon
Fertility by Age in Dunnellon
Average fertility rate in Dunnellon is 99.0 births per 1,000 women. Women in the age bracket of 20 to 34 years have the highest fertility rate with 220.0 births per 1,000 women. Women in the age bracket of 20 to 34 years acount for 86.7% of all women with births.
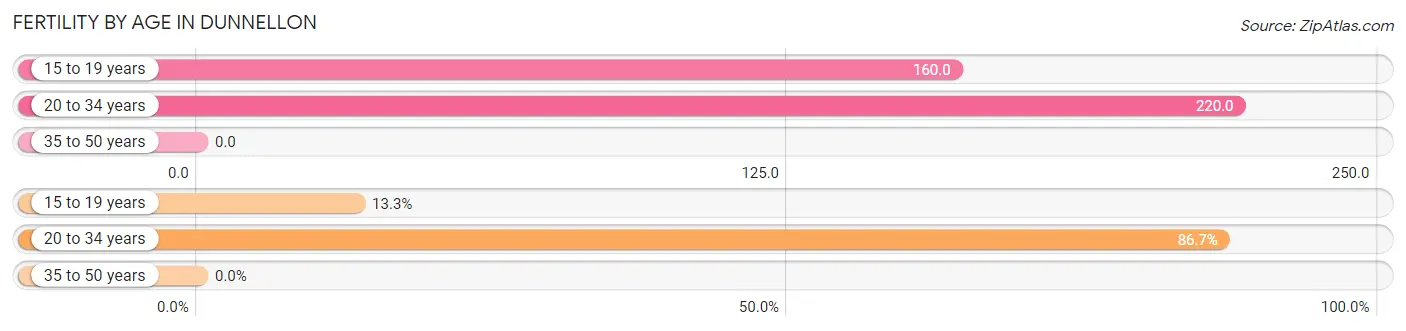
| Age Bracket | Women with Births | Births / 1,000 Women |
| 15 to 19 years | 4 (13.3%) | 160.0 |
| 20 to 34 years | 26 (86.7%) | 220.0 |
| 35 to 50 years | 0 (0.0%) | 0.0 |
| Total | 30 (100.0%) | 99.0 |
Fertility by Age by Marriage Status in Dunnellon
86.7% of women with births (30) in Dunnellon are married. The highest percentage of unmarried women with births falls into 15 to 19 years age bracket with 100.0% of them unmarried at the time of birth, while the lowest percentage of unmarried women with births belong to 20 to 34 years age bracket with 0.0% of them unmarried.
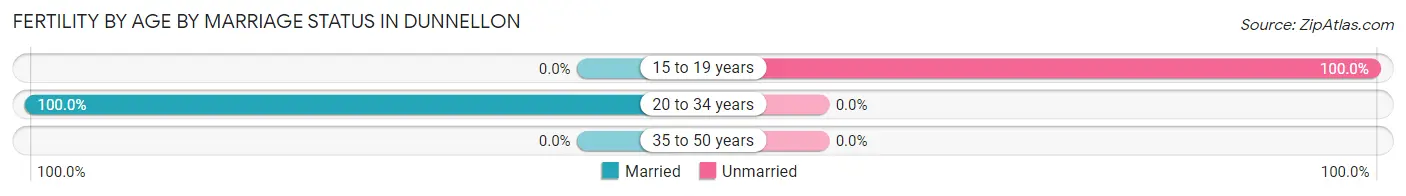
| Age Bracket | Married | Unmarried |
| 15 to 19 years | 0 (0.0%) | 4 (100.0%) |
| 20 to 34 years | 26 (100.0%) | 0 (0.0%) |
| 35 to 50 years | 0 (0.0%) | 0 (0.0%) |
| Total | 26 (86.7%) | 4 (13.3%) |
Fertility by Education in Dunnellon
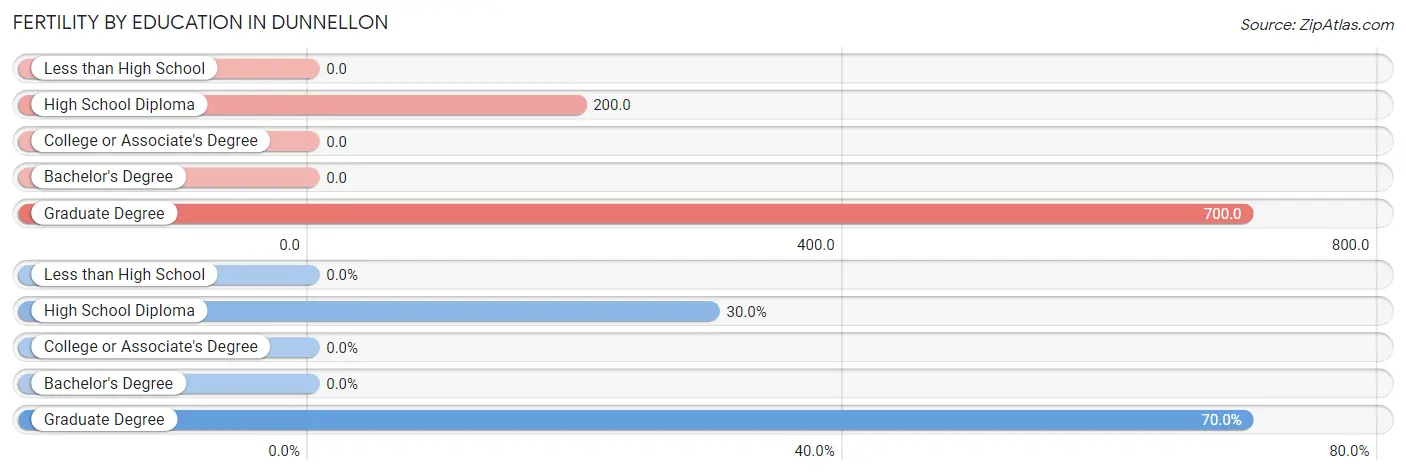
| Educational Attainment | Women with Births | Births / 1,000 Women |
| Less than High School | 0 (0.0%) | 0.0 |
| High School Diploma | 9 (30.0%) | 200.0 |
| College or Associate's Degree | 0 (0.0%) | 0.0 |
| Bachelor's Degree | 0 (0.0%) | 0.0 |
| Graduate Degree | 21 (70.0%) | 700.0 |
| Total | 30 (100.0%) | 99.0 |
Fertility by Education by Marriage Status in Dunnellon
13.3% of women with births in Dunnellon are unmarried. Women with the educational attainment of graduate degree are most likely to be married with 100.0% of them married at childbirth, while women with the educational attainment of high school diploma are least likely to be married with 44.4% of them unmarried at childbirth.
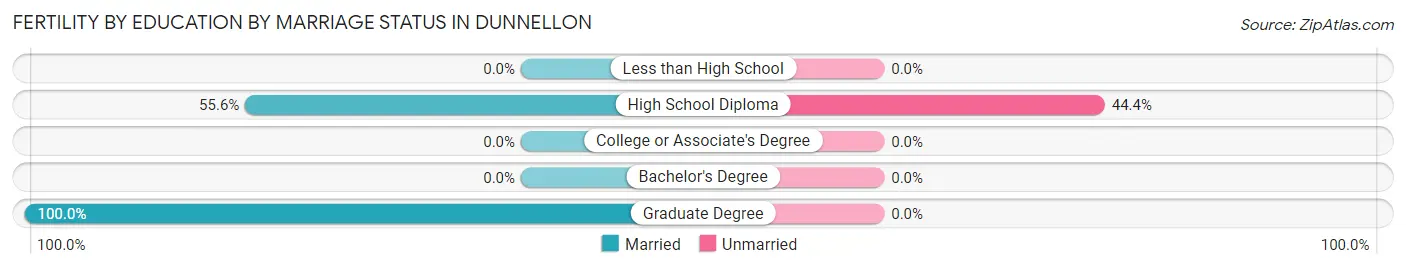
| Educational Attainment | Married | Unmarried |
| Less than High School | 0 (0.0%) | 0 (0.0%) |
| High School Diploma | 5 (55.6%) | 4 (44.4%) |
| College or Associate's Degree | 0 (0.0%) | 0 (0.0%) |
| Bachelor's Degree | 0 (0.0%) | 0 (0.0%) |
| Graduate Degree | 21 (100.0%) | 0 (0.0%) |
| Total | 26 (86.7%) | 4 (13.3%) |
Employment Characteristics in Dunnellon
Employment by Class of Employer in Dunnellon
Among the 631 employed individuals in Dunnellon, private company employees (311 | 49.3%), not-for-profit organizations (172 | 27.3%), and self-employed (incorporated) (54 | 8.6%) make up the most common classes of employment.
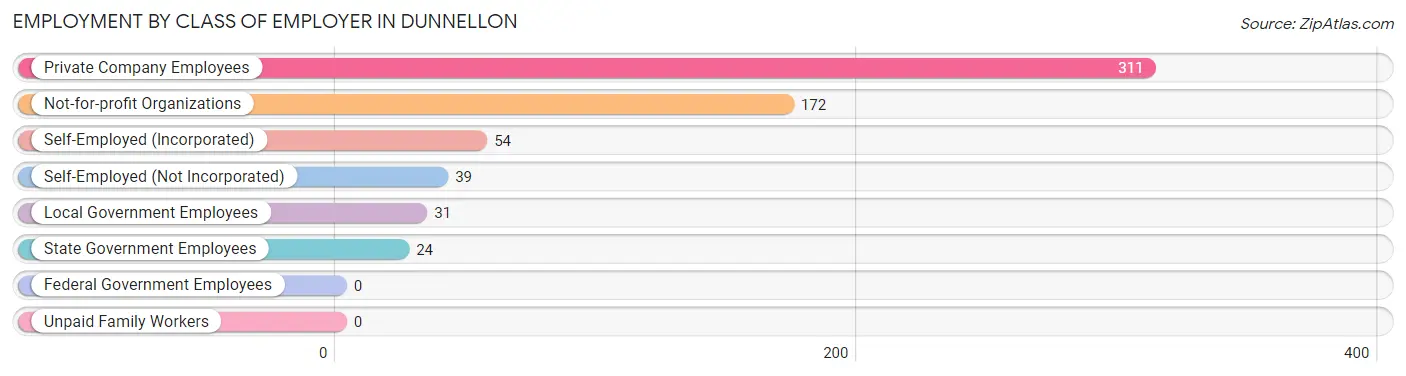
| Employer Class | # Employees | % Employees |
| Private Company Employees | 311 | 49.3% |
| Self-Employed (Incorporated) | 54 | 8.6% |
| Self-Employed (Not Incorporated) | 39 | 6.2% |
| Not-for-profit Organizations | 172 | 27.3% |
| Local Government Employees | 31 | 4.9% |
| State Government Employees | 24 | 3.8% |
| Federal Government Employees | 0 | 0.0% |
| Unpaid Family Workers | 0 | 0.0% |
| Total | 631 | 100.0% |
Employment Status by Age in Dunnellon
According to the labor force statistics for Dunnellon, out of the total population over 16 years of age (2,087), 32.4% or 676 individuals are in the labor force, with 6.1% or 41 of them unemployed. The age group with the highest labor force participation rate is 35 to 44 years, with 75.0% or 138 individuals in the labor force. Within the labor force, the 65 to 74 years age range has the highest percentage of unemployed individuals, with 33.3% or 25 of them being unemployed.
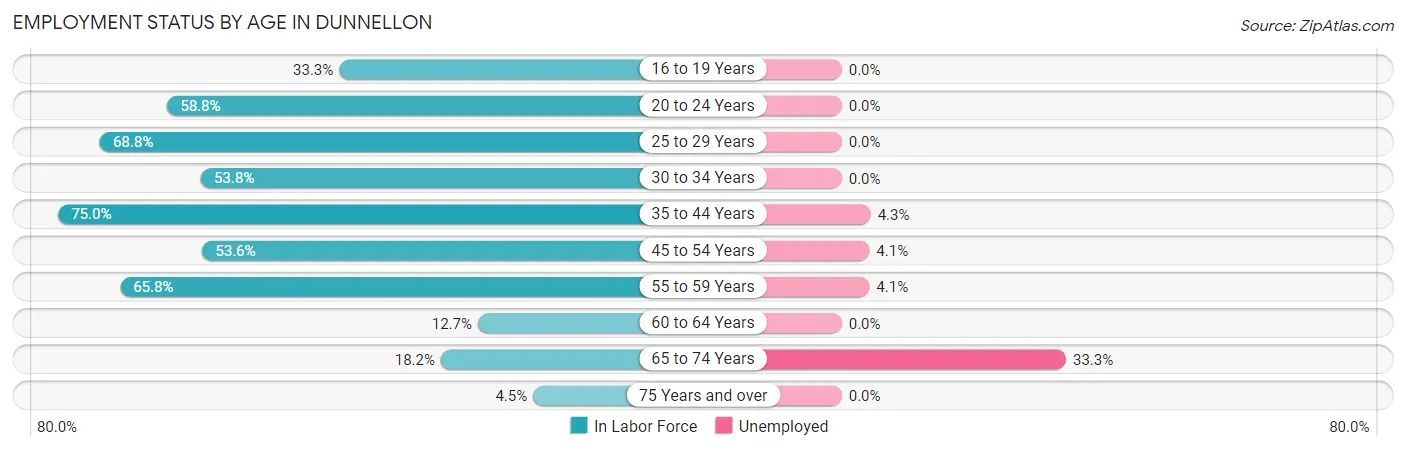
| Age Bracket | In Labor Force | Unemployed |
| 16 to 19 Years | 14 (33.3%) | 0 (0.0%) |
| 20 to 24 Years | 50 (58.8%) | 0 (0.0%) |
| 25 to 29 Years | 22 (68.8%) | 0 (0.0%) |
| 30 to 34 Years | 64 (53.8%) | 0 (0.0%) |
| 35 to 44 Years | 138 (75.0%) | 6 (4.3%) |
| 45 to 54 Years | 97 (53.6%) | 4 (4.1%) |
| 55 to 59 Years | 148 (65.8%) | 6 (4.1%) |
| 60 to 64 Years | 51 (12.7%) | 0 (0.0%) |
| 65 to 74 Years | 75 (18.2%) | 25 (33.3%) |
| 75 Years and over | 18 (4.5%) | 0 (0.0%) |
| Total | 676 (32.4%) | 41 (6.1%) |
Employment Status by Educational Attainment in Dunnellon
According to labor force statistics for Dunnellon, 45.5% of individuals (521) out of the total population between 25 and 64 years of age (1,144) are in the labor force, with 3.1% or 16 of them being unemployed. The group with the highest labor force participation rate are those with the educational attainment of bachelor's degree or higher, with 86.2% or 125 individuals in the labor force. Within the labor force, individuals with high school diploma education have the highest percentage of unemployment, with 5.1% or 4 of them being unemployed.
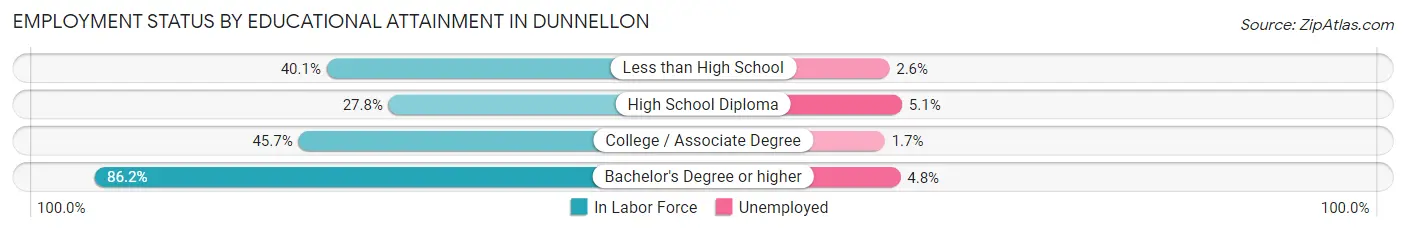
| Educational Attainment | In Labor Force | Unemployed |
| Less than High School | 77 (40.1%) | 5 (2.6%) |
| High School Diploma | 79 (27.8%) | 14 (5.1%) |
| College / Associate Degree | 239 (45.7%) | 9 (1.7%) |
| Bachelor's Degree or higher | 125 (86.2%) | 7 (4.8%) |
| Total | 521 (45.5%) | 35 (3.1%) |
Employment Occupations by Sex in Dunnellon
Management, Business, Science and Arts Occupations
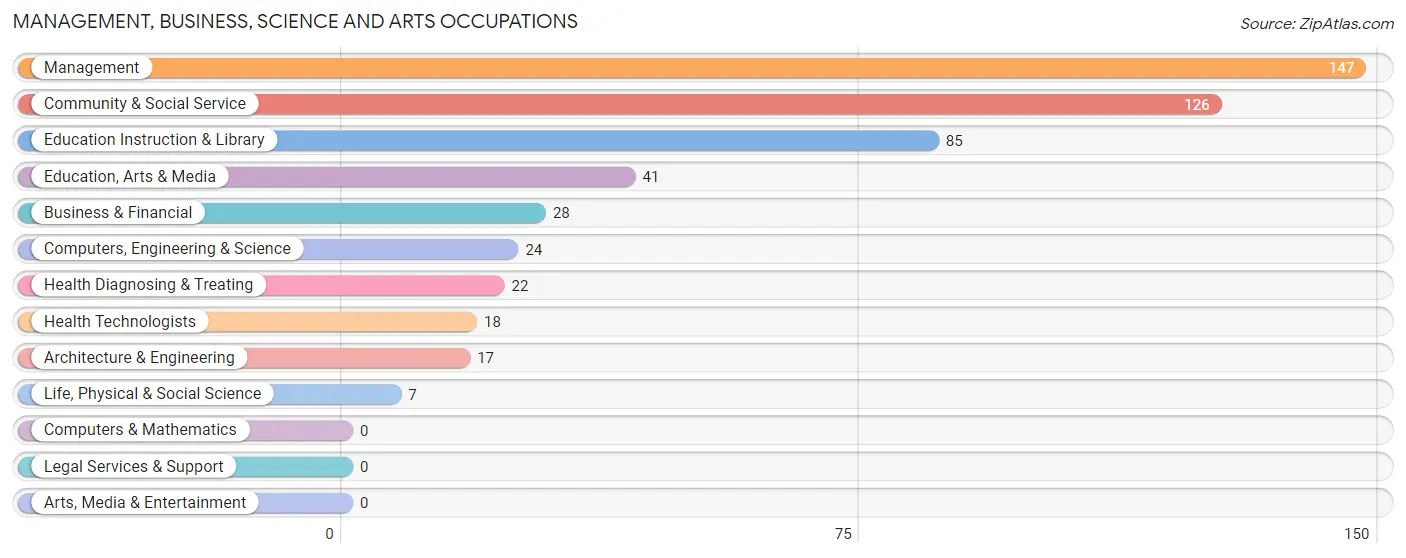
The most common Management, Business, Science and Arts occupations in Dunnellon are Management (147 | 23.1%), Community & Social Service (126 | 19.8%), Education Instruction & Library (85 | 13.4%), Education, Arts & Media (41 | 6.5%), and Business & Financial (28 | 4.4%).
Management, Business, Science and Arts Occupations by Sex
Within the Management, Business, Science and Arts occupations in Dunnellon, the most male-oriented occupations are Business & Financial (100.0%), Life, Physical & Social Science (100.0%), and Computers, Engineering & Science (70.8%), while the most female-oriented occupations are Management (97.3%), Education, Arts & Media (82.9%), and Community & Social Service (77.8%).
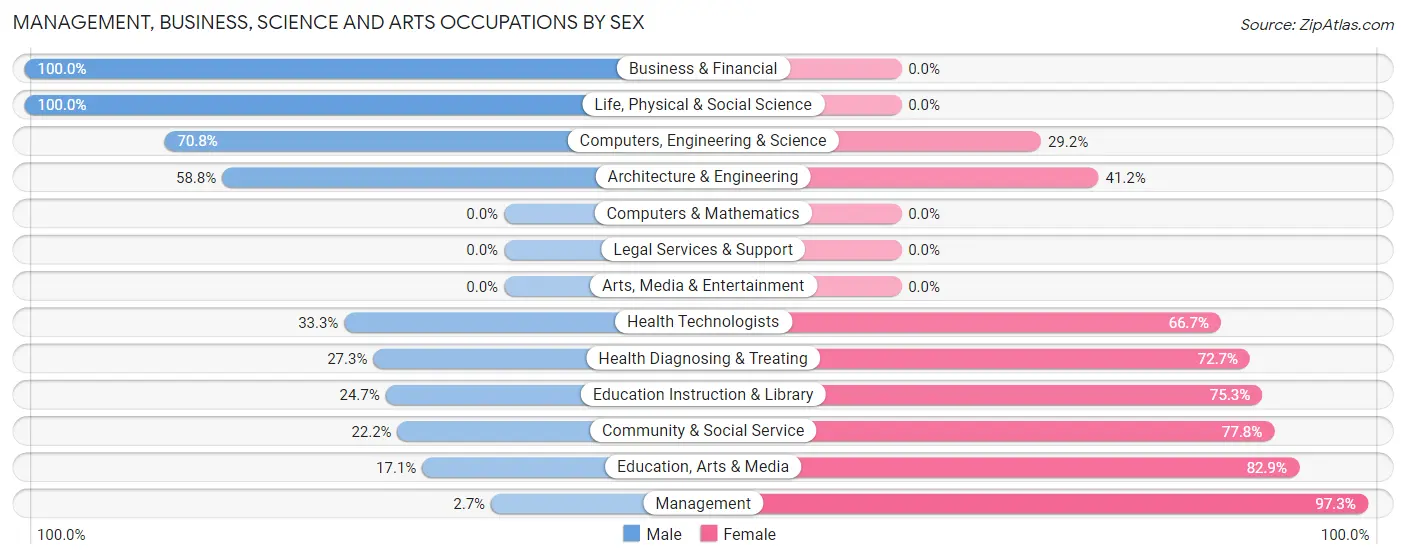
| Occupation | Male | Female |
| Management | 4 (2.7%) | 143 (97.3%) |
| Business & Financial | 28 (100.0%) | 0 (0.0%) |
| Computers, Engineering & Science | 17 (70.8%) | 7 (29.2%) |
| Computers & Mathematics | 0 (0.0%) | 0 (0.0%) |
| Architecture & Engineering | 10 (58.8%) | 7 (41.2%) |
| Life, Physical & Social Science | 7 (100.0%) | 0 (0.0%) |
| Community & Social Service | 28 (22.2%) | 98 (77.8%) |
| Education, Arts & Media | 7 (17.1%) | 34 (82.9%) |
| Legal Services & Support | 0 (0.0%) | 0 (0.0%) |
| Education Instruction & Library | 21 (24.7%) | 64 (75.3%) |
| Arts, Media & Entertainment | 0 (0.0%) | 0 (0.0%) |
| Health Diagnosing & Treating | 6 (27.3%) | 16 (72.7%) |
| Health Technologists | 6 (33.3%) | 12 (66.7%) |
| Total (Category) | 83 (23.9%) | 264 (76.1%) |
| Total (Overall) | 248 (39.0%) | 388 (61.0%) |
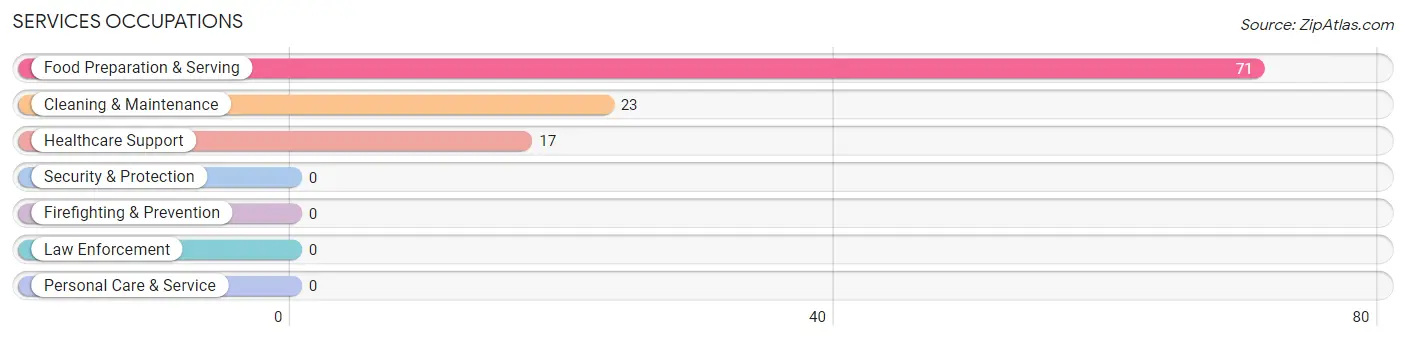
Services Occupations
The most common Services occupations in Dunnellon are Food Preparation & Serving (71 | 11.2%), Cleaning & Maintenance (23 | 3.6%), and Healthcare Support (17 | 2.7%).
Services Occupations by Sex
Within the Services occupations in Dunnellon, the most male-oriented occupations are Cleaning & Maintenance (78.3%), Food Preparation & Serving (42.2%), and Healthcare Support (41.2%), while the most female-oriented occupations are Healthcare Support (58.8%), Food Preparation & Serving (57.8%), and Cleaning & Maintenance (21.7%).
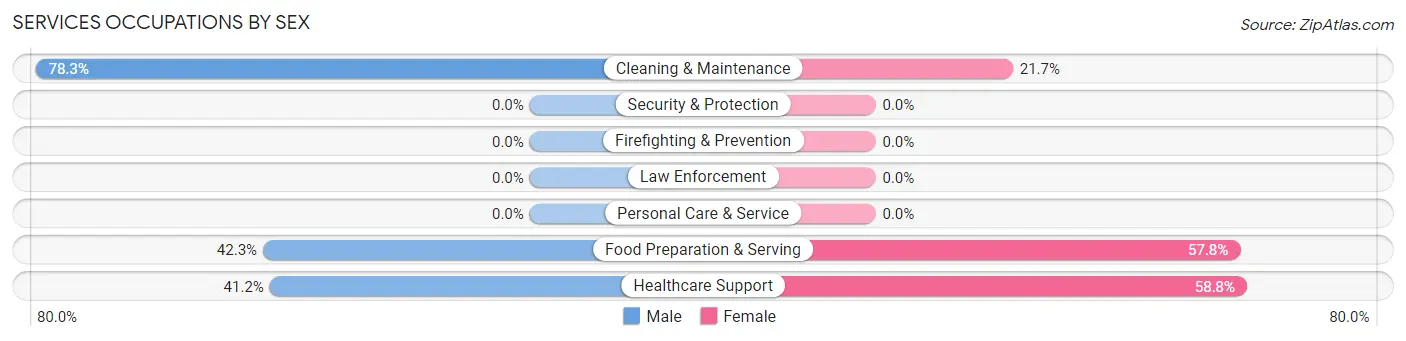
| Occupation | Male | Female |
| Healthcare Support | 7 (41.2%) | 10 (58.8%) |
| Security & Protection | 0 (0.0%) | 0 (0.0%) |
| Firefighting & Prevention | 0 (0.0%) | 0 (0.0%) |
| Law Enforcement | 0 (0.0%) | 0 (0.0%) |
| Food Preparation & Serving | 30 (42.2%) | 41 (57.8%) |
| Cleaning & Maintenance | 18 (78.3%) | 5 (21.7%) |
| Personal Care & Service | 0 (0.0%) | 0 (0.0%) |
| Total (Category) | 55 (49.5%) | 56 (50.4%) |
| Total (Overall) | 248 (39.0%) | 388 (61.0%) |
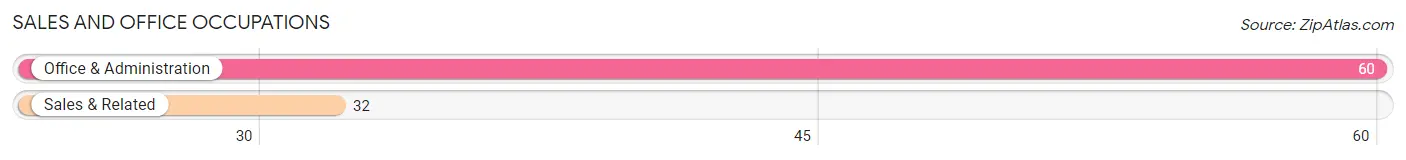
Sales and Office Occupations
The most common Sales and Office occupations in Dunnellon are Office & Administration (60 | 9.4%), and Sales & Related (32 | 5.0%).
Sales and Office Occupations by Sex
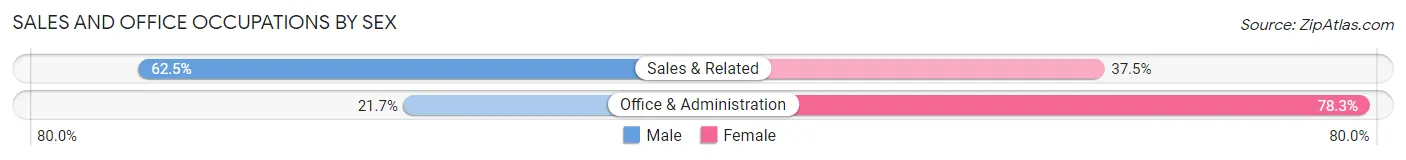
| Occupation | Male | Female |
| Sales & Related | 20 (62.5%) | 12 (37.5%) |
| Office & Administration | 13 (21.7%) | 47 (78.3%) |
| Total (Category) | 33 (35.9%) | 59 (64.1%) |
| Total (Overall) | 248 (39.0%) | 388 (61.0%) |
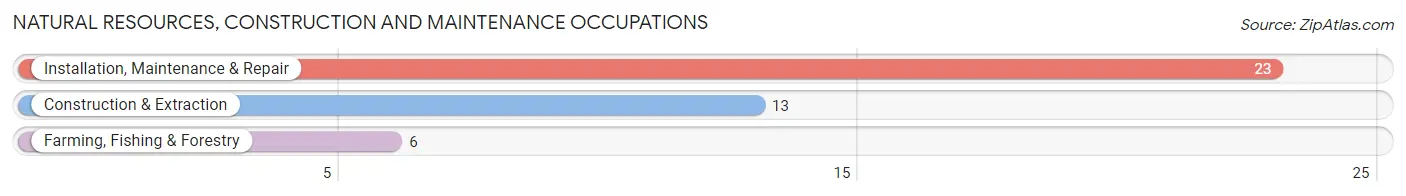
Natural Resources, Construction and Maintenance Occupations
The most common Natural Resources, Construction and Maintenance occupations in Dunnellon are Installation, Maintenance & Repair (23 | 3.6%), Construction & Extraction (13 | 2.0%), and Farming, Fishing & Forestry (6 | 0.9%).
Natural Resources, Construction and Maintenance Occupations by Sex
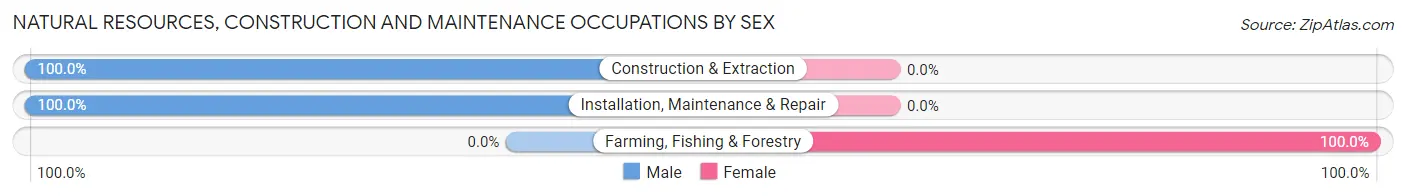
| Occupation | Male | Female |
| Farming, Fishing & Forestry | 0 (0.0%) | 6 (100.0%) |
| Construction & Extraction | 13 (100.0%) | 0 (0.0%) |
| Installation, Maintenance & Repair | 23 (100.0%) | 0 (0.0%) |
| Total (Category) | 36 (85.7%) | 6 (14.3%) |
| Total (Overall) | 248 (39.0%) | 388 (61.0%) |
Production, Transportation and Moving Occupations
The most common Production, Transportation and Moving occupations in Dunnellon are Production (29 | 4.6%), Material Moving (10 | 1.6%), and Transportation (5 | 0.8%).
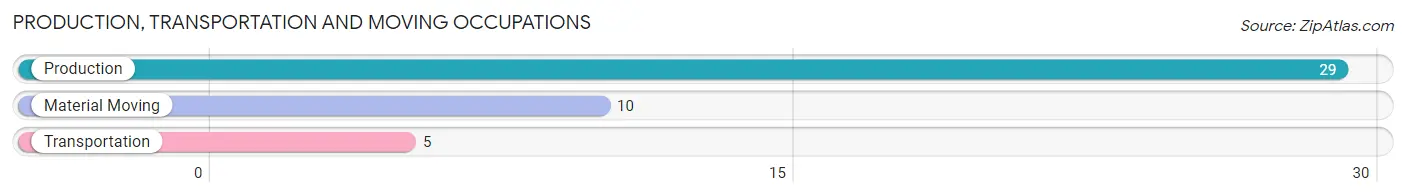
Production, Transportation and Moving Occupations by Sex
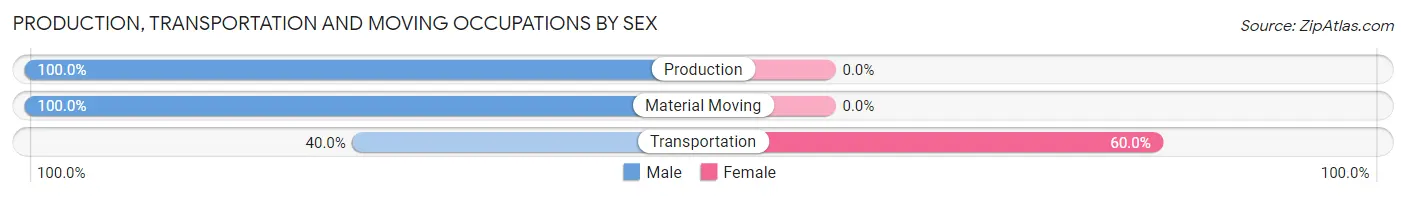
| Occupation | Male | Female |
| Production | 29 (100.0%) | 0 (0.0%) |
| Transportation | 2 (40.0%) | 3 (60.0%) |
| Material Moving | 10 (100.0%) | 0 (0.0%) |
| Total (Category) | 41 (93.2%) | 3 (6.8%) |
| Total (Overall) | 248 (39.0%) | 388 (61.0%) |
Employment Industries by Sex in Dunnellon
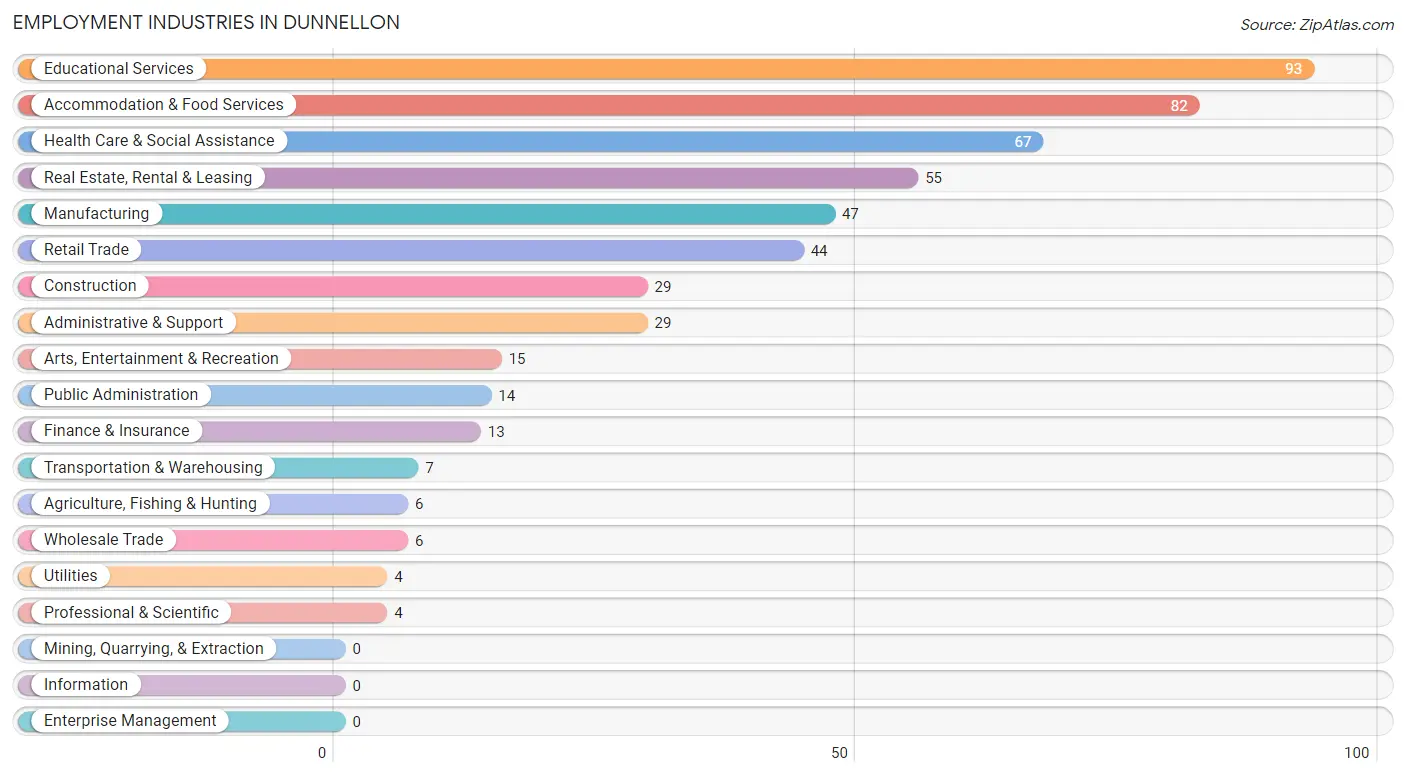
Employment Industries in Dunnellon
The major employment industries in Dunnellon include Educational Services (93 | 14.6%), Accommodation & Food Services (82 | 12.9%), Health Care & Social Assistance (67 | 10.5%), Real Estate, Rental & Leasing (55 | 8.6%), and Manufacturing (47 | 7.4%).
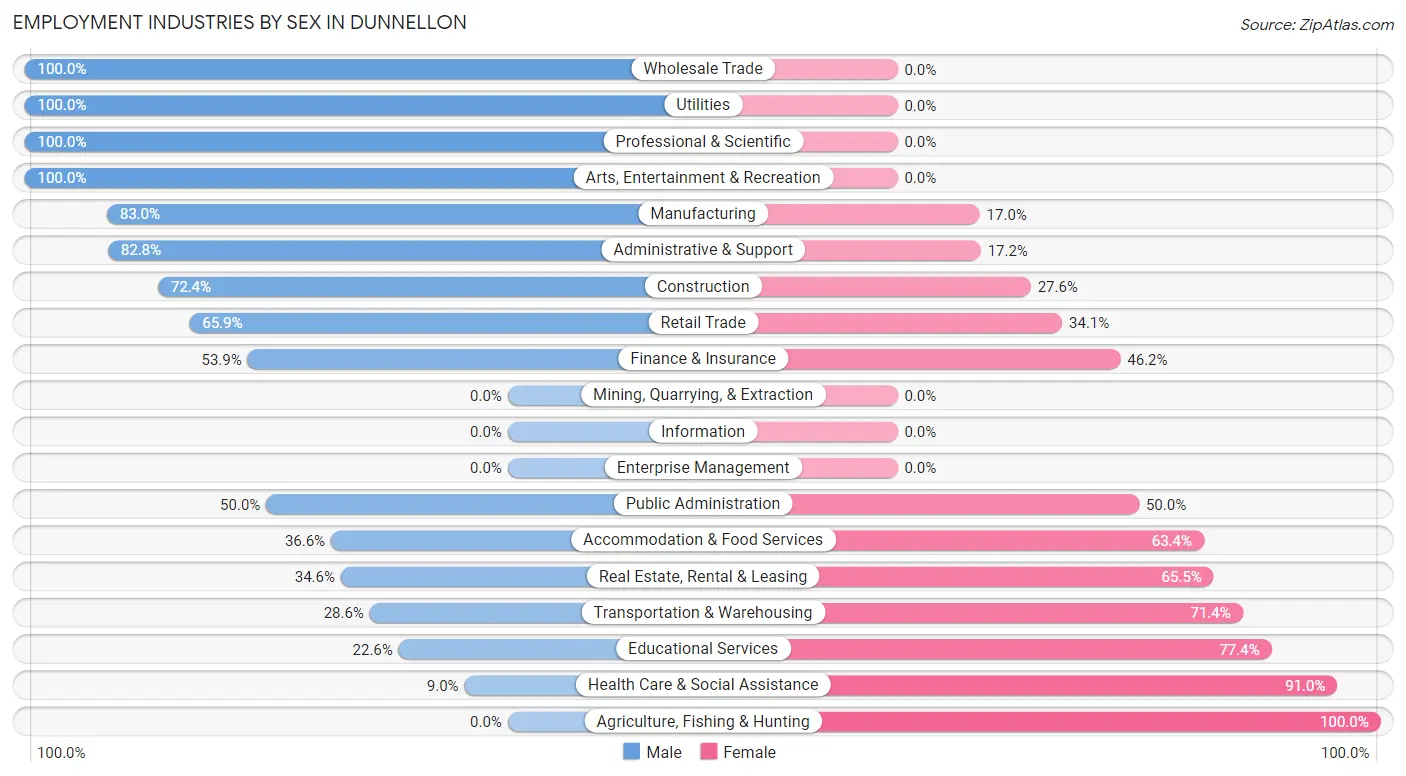
Employment Industries by Sex in Dunnellon
The Dunnellon industries that see more men than women are Wholesale Trade (100.0%), Utilities (100.0%), and Professional & Scientific (100.0%), whereas the industries that tend to have a higher number of women are Agriculture, Fishing & Hunting (100.0%), Health Care & Social Assistance (91.0%), and Educational Services (77.4%).
| Industry | Male | Female |
| Agriculture, Fishing & Hunting | 0 (0.0%) | 6 (100.0%) |
| Mining, Quarrying, & Extraction | 0 (0.0%) | 0 (0.0%) |
| Construction | 21 (72.4%) | 8 (27.6%) |
| Manufacturing | 39 (83.0%) | 8 (17.0%) |
| Wholesale Trade | 6 (100.0%) | 0 (0.0%) |
| Retail Trade | 29 (65.9%) | 15 (34.1%) |
| Transportation & Warehousing | 2 (28.6%) | 5 (71.4%) |
| Utilities | 4 (100.0%) | 0 (0.0%) |
| Information | 0 (0.0%) | 0 (0.0%) |
| Finance & Insurance | 7 (53.8%) | 6 (46.2%) |
| Real Estate, Rental & Leasing | 19 (34.5%) | 36 (65.4%) |
| Professional & Scientific | 4 (100.0%) | 0 (0.0%) |
| Enterprise Management | 0 (0.0%) | 0 (0.0%) |
| Administrative & Support | 24 (82.8%) | 5 (17.2%) |
| Educational Services | 21 (22.6%) | 72 (77.4%) |
| Health Care & Social Assistance | 6 (9.0%) | 61 (91.0%) |
| Arts, Entertainment & Recreation | 15 (100.0%) | 0 (0.0%) |
| Accommodation & Food Services | 30 (36.6%) | 52 (63.4%) |
| Public Administration | 7 (50.0%) | 7 (50.0%) |
| Total | 248 (39.0%) | 388 (61.0%) |
Education in Dunnellon
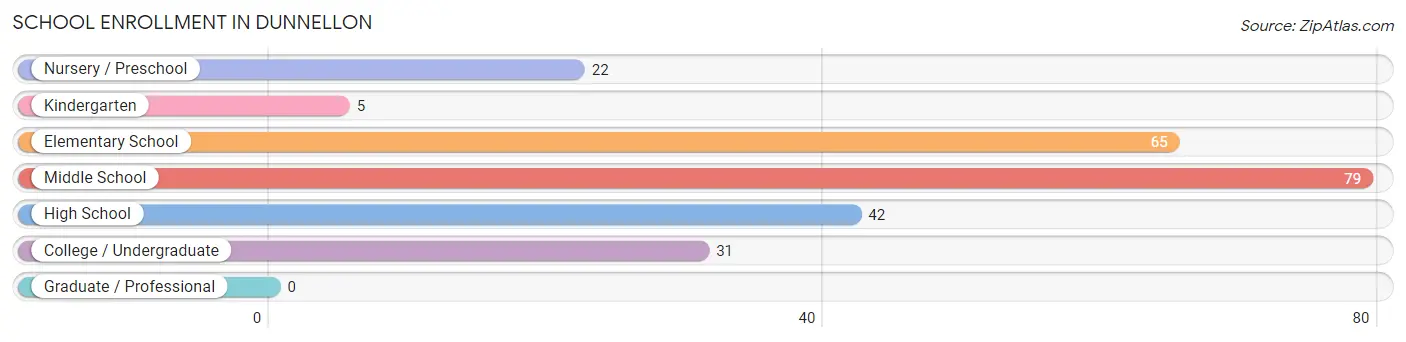
School Enrollment in Dunnellon
The most common levels of schooling among the 244 students in Dunnellon are middle school (79 | 32.4%), elementary school (65 | 26.6%), and high school (42 | 17.2%).
| School Level | # Students | % Students |
| Nursery / Preschool | 22 | 9.0% |
| Kindergarten | 5 | 2.1% |
| Elementary School | 65 | 26.6% |
| Middle School | 79 | 32.4% |
| High School | 42 | 17.2% |
| College / Undergraduate | 31 | 12.7% |
| Graduate / Professional | 0 | 0.0% |
| Total | 244 | 100.0% |
School Enrollment by Age by Funding Source in Dunnellon
Out of a total of 244 students who are enrolled in schools in Dunnellon, 93 (38.1%) attend a private institution, while the remaining 151 (61.9%) are enrolled in public schools. The age group of 5 to 9 year old has the highest likelihood of being enrolled in private schools, with 49 (71.0% in the age bracket) enrolled. Conversely, the age group of 18 to 19 year olds has the lowest likelihood of being enrolled in a private school, with 5 (100.0% in the age bracket) attending a public institution.
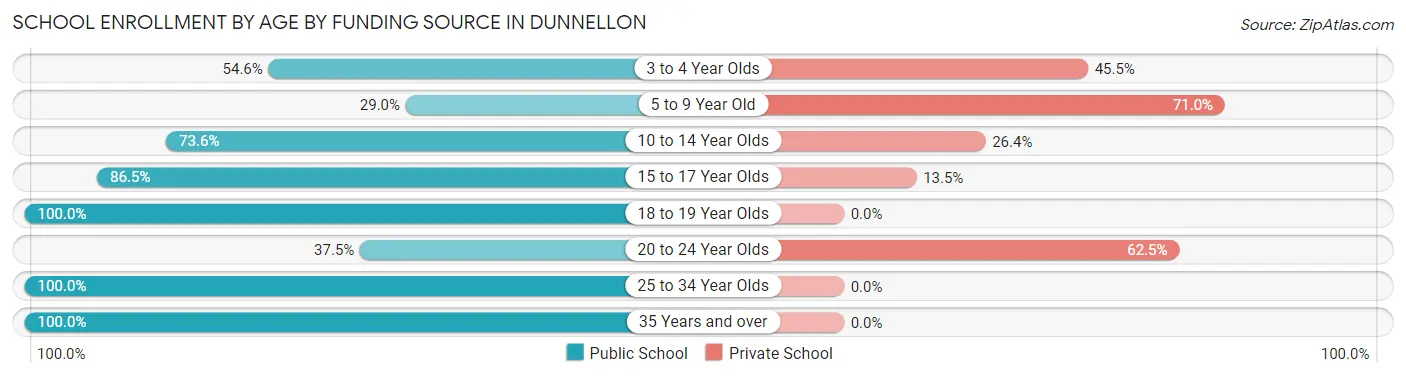
| Age Bracket | Public School | Private School |
| 3 to 4 Year Olds | 6 (54.5%) | 5 (45.5%) |
| 5 to 9 Year Old | 20 (29.0%) | 49 (71.0%) |
| 10 to 14 Year Olds | 67 (73.6%) | 24 (26.4%) |
| 15 to 17 Year Olds | 32 (86.5%) | 5 (13.5%) |
| 18 to 19 Year Olds | 5 (100.0%) | 0 (0.0%) |
| 20 to 24 Year Olds | 6 (37.5%) | 10 (62.5%) |
| 25 to 34 Year Olds | 10 (100.0%) | 0 (0.0%) |
| 35 Years and over | 5 (100.0%) | 0 (0.0%) |
| Total | 151 (61.9%) | 93 (38.1%) |
Educational Attainment by Field of Study in Dunnellon
Education (87 | 23.4%), social sciences (58 | 15.6%), psychology (47 | 12.6%), bio, nature & agricultural (35 | 9.4%), and business (31 | 8.3%) are the most common fields of study among 372 individuals in Dunnellon who have obtained a bachelor's degree or higher.
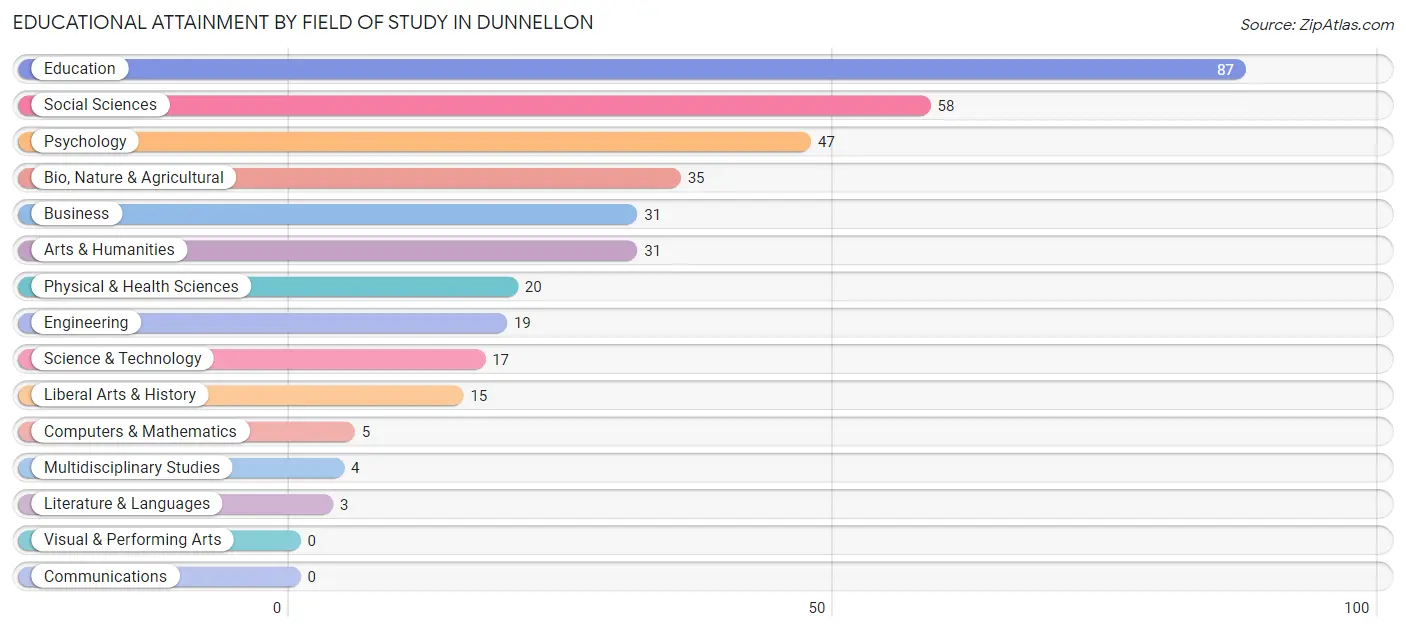
| Field of Study | # Graduates | % Graduates |
| Computers & Mathematics | 5 | 1.3% |
| Bio, Nature & Agricultural | 35 | 9.4% |
| Physical & Health Sciences | 20 | 5.4% |
| Psychology | 47 | 12.6% |
| Social Sciences | 58 | 15.6% |
| Engineering | 19 | 5.1% |
| Multidisciplinary Studies | 4 | 1.1% |
| Science & Technology | 17 | 4.6% |
| Business | 31 | 8.3% |
| Education | 87 | 23.4% |
| Literature & Languages | 3 | 0.8% |
| Liberal Arts & History | 15 | 4.0% |
| Visual & Performing Arts | 0 | 0.0% |
| Communications | 0 | 0.0% |
| Arts & Humanities | 31 | 8.3% |
| Total | 372 | 100.0% |
Transportation & Commute in Dunnellon
Vehicle Availability by Sex in Dunnellon
The most prevalent vehicle ownership categories in Dunnellon are males with 2 vehicles (157, accounting for 63.3%) and females with 2 vehicles (267, making up 41.0%).
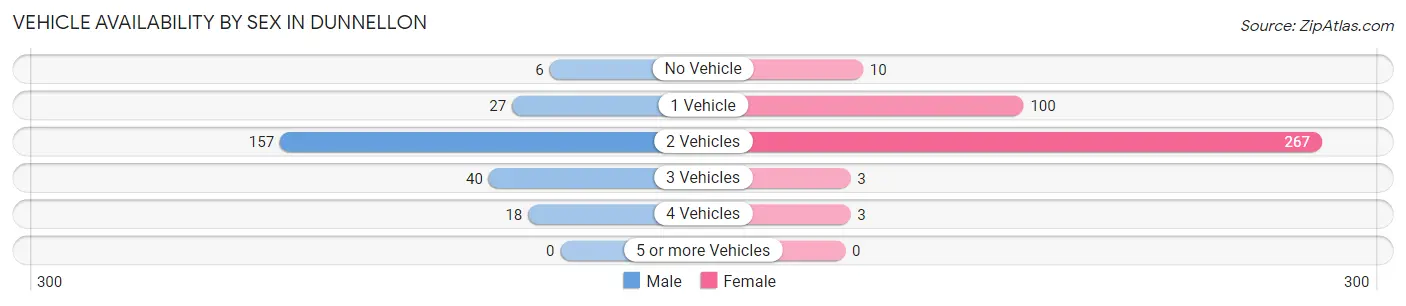
| Vehicles Available | Male | Female |
| No Vehicle | 6 (2.4%) | 10 (2.6%) |
| 1 Vehicle | 27 (10.9%) | 100 (26.1%) |
| 2 Vehicles | 157 (63.3%) | 267 (69.7%) |
| 3 Vehicles | 40 (16.1%) | 3 (0.8%) |
| 4 Vehicles | 18 (7.3%) | 3 (0.8%) |
| 5 or more Vehicles | 0 (0.0%) | 0 (0.0%) |
| Total | 248 (100.0%) | 383 (100.0%) |
Commute Time in Dunnellon
The most frequently occuring commute durations in Dunnellon are 20 to 24 minutes (142 commuters, 25.4%), 5 to 9 minutes (89 commuters, 15.9%), and 15 to 19 minutes (63 commuters, 11.3%).
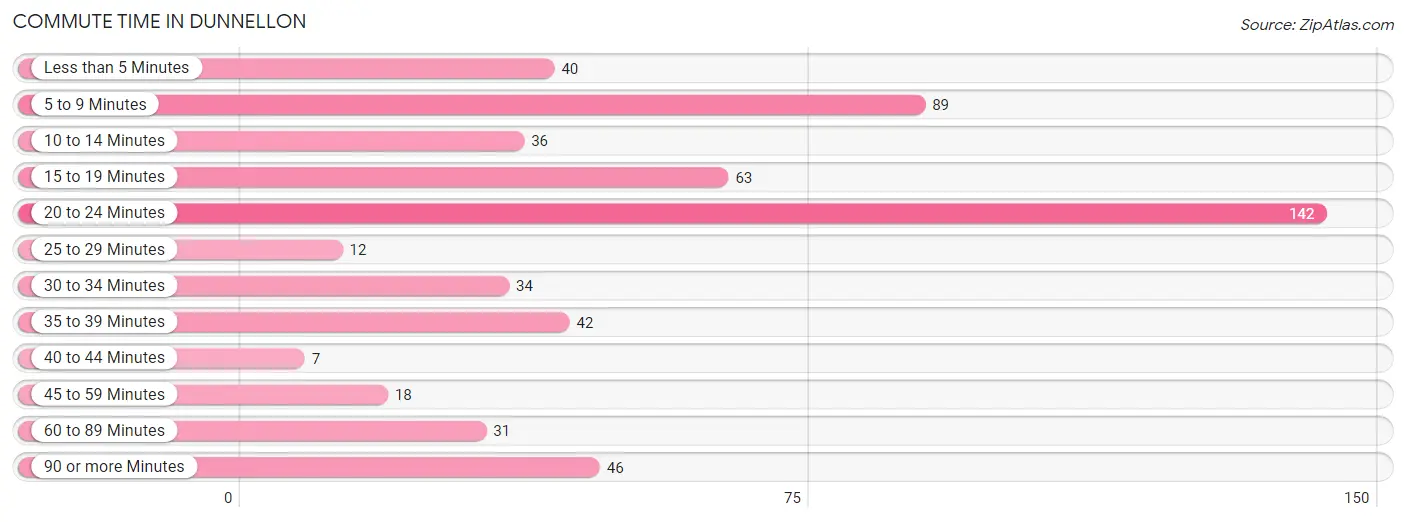
| Commute Time | # Commuters | % Commuters |
| Less than 5 Minutes | 40 | 7.1% |
| 5 to 9 Minutes | 89 | 15.9% |
| 10 to 14 Minutes | 36 | 6.4% |
| 15 to 19 Minutes | 63 | 11.3% |
| 20 to 24 Minutes | 142 | 25.4% |
| 25 to 29 Minutes | 12 | 2.1% |
| 30 to 34 Minutes | 34 | 6.1% |
| 35 to 39 Minutes | 42 | 7.5% |
| 40 to 44 Minutes | 7 | 1.3% |
| 45 to 59 Minutes | 18 | 3.2% |
| 60 to 89 Minutes | 31 | 5.5% |
| 90 or more Minutes | 46 | 8.2% |
Commute Time by Sex in Dunnellon
The most common commute times in Dunnellon are 15 to 19 minutes (42 commuters, 18.6%) for males and 20 to 24 minutes (125 commuters, 37.4%) for females.
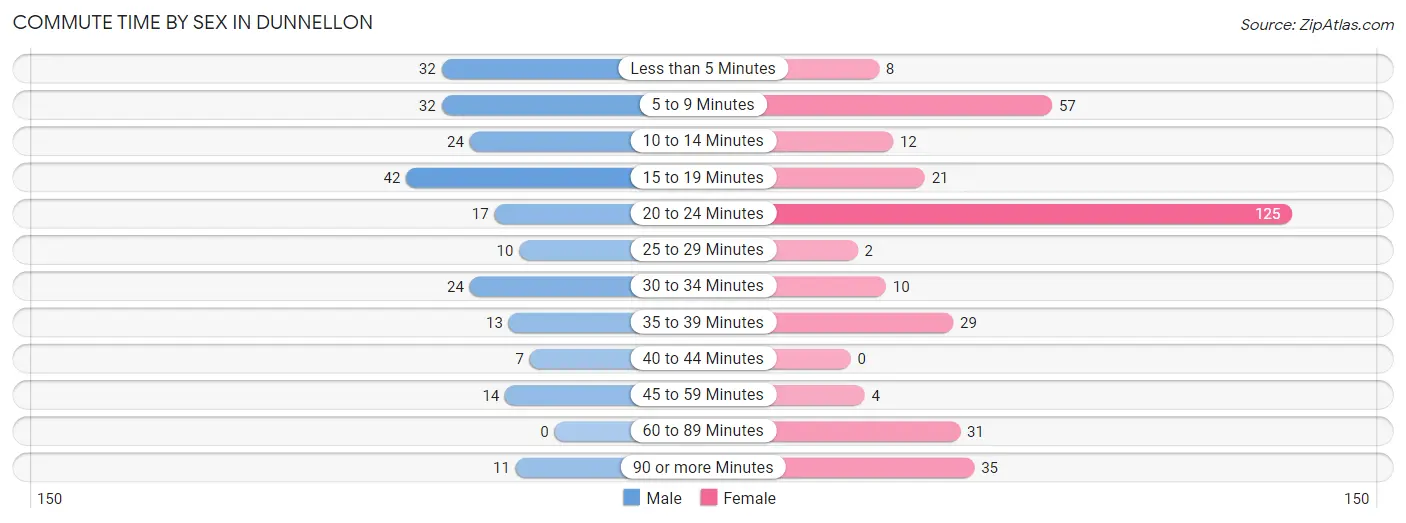
| Commute Time | Male | Female |
| Less than 5 Minutes | 32 (14.2%) | 8 (2.4%) |
| 5 to 9 Minutes | 32 (14.2%) | 57 (17.1%) |
| 10 to 14 Minutes | 24 (10.6%) | 12 (3.6%) |
| 15 to 19 Minutes | 42 (18.6%) | 21 (6.3%) |
| 20 to 24 Minutes | 17 (7.5%) | 125 (37.4%) |
| 25 to 29 Minutes | 10 (4.4%) | 2 (0.6%) |
| 30 to 34 Minutes | 24 (10.6%) | 10 (3.0%) |
| 35 to 39 Minutes | 13 (5.8%) | 29 (8.7%) |
| 40 to 44 Minutes | 7 (3.1%) | 0 (0.0%) |
| 45 to 59 Minutes | 14 (6.2%) | 4 (1.2%) |
| 60 to 89 Minutes | 0 (0.0%) | 31 (9.3%) |
| 90 or more Minutes | 11 (4.9%) | 35 (10.5%) |
Time of Departure to Work by Sex in Dunnellon
The most frequent times of departure to work in Dunnellon are 8:00 AM to 8:29 AM (52, 23.0%) for males and 7:00 AM to 7:29 AM (160, 47.9%) for females.
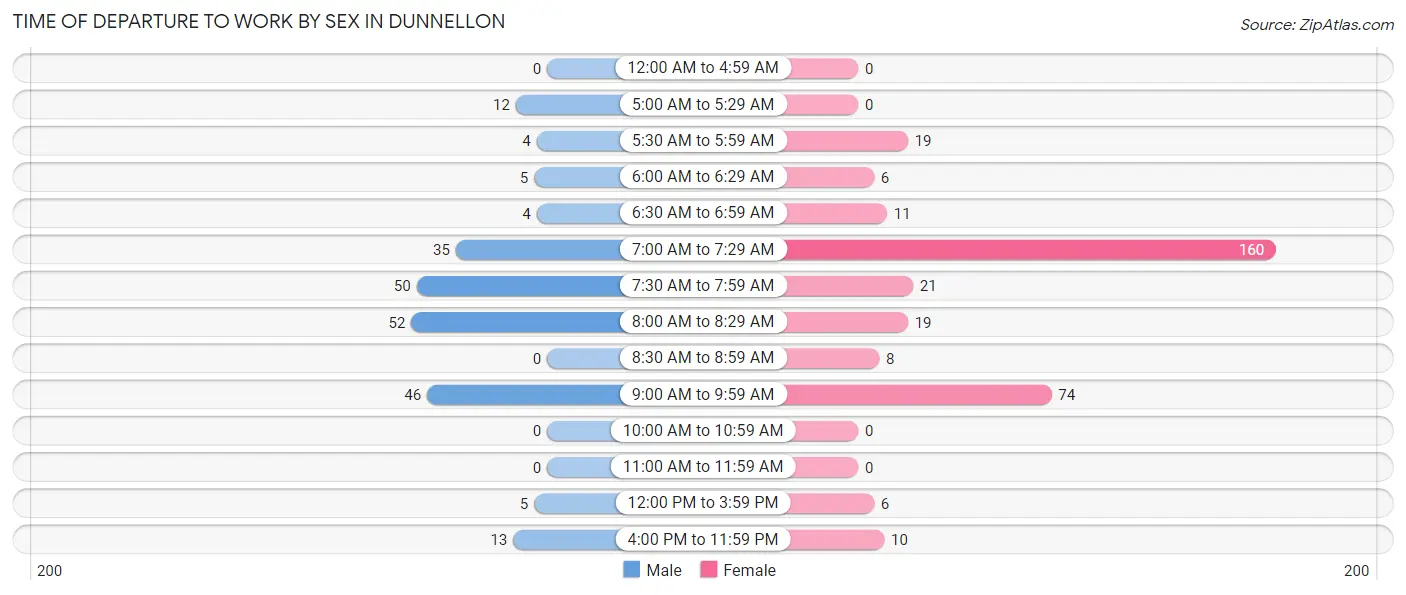
| Time of Departure | Male | Female |
| 12:00 AM to 4:59 AM | 0 (0.0%) | 0 (0.0%) |
| 5:00 AM to 5:29 AM | 12 (5.3%) | 0 (0.0%) |
| 5:30 AM to 5:59 AM | 4 (1.8%) | 19 (5.7%) |
| 6:00 AM to 6:29 AM | 5 (2.2%) | 6 (1.8%) |
| 6:30 AM to 6:59 AM | 4 (1.8%) | 11 (3.3%) |
| 7:00 AM to 7:29 AM | 35 (15.5%) | 160 (47.9%) |
| 7:30 AM to 7:59 AM | 50 (22.1%) | 21 (6.3%) |
| 8:00 AM to 8:29 AM | 52 (23.0%) | 19 (5.7%) |
| 8:30 AM to 8:59 AM | 0 (0.0%) | 8 (2.4%) |
| 9:00 AM to 9:59 AM | 46 (20.3%) | 74 (22.2%) |
| 10:00 AM to 10:59 AM | 0 (0.0%) | 0 (0.0%) |
| 11:00 AM to 11:59 AM | 0 (0.0%) | 0 (0.0%) |
| 12:00 PM to 3:59 PM | 5 (2.2%) | 6 (1.8%) |
| 4:00 PM to 11:59 PM | 13 (5.8%) | 10 (3.0%) |
| Total | 226 (100.0%) | 334 (100.0%) |
Housing Occupancy in Dunnellon
Occupancy by Ownership in Dunnellon
Of the total 1,310 dwellings in Dunnellon, owner-occupied units account for 958 (73.1%), while renter-occupied units make up 352 (26.9%).
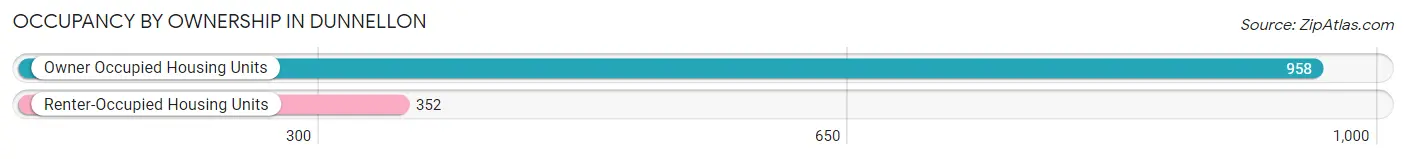
| Occupancy | # Housing Units | % Housing Units |
| Owner Occupied Housing Units | 958 | 73.1% |
| Renter-Occupied Housing Units | 352 | 26.9% |
| Total Occupied Housing Units | 1,310 | 100.0% |
Occupancy by Household Size in Dunnellon
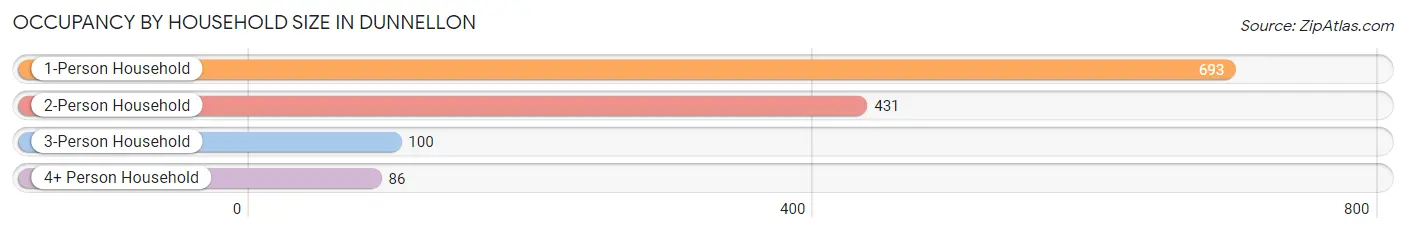
| Household Size | # Housing Units | % Housing Units |
| 1-Person Household | 693 | 52.9% |
| 2-Person Household | 431 | 32.9% |
| 3-Person Household | 100 | 7.6% |
| 4+ Person Household | 86 | 6.6% |
| Total Housing Units | 1,310 | 100.0% |
Occupancy by Ownership by Household Size in Dunnellon
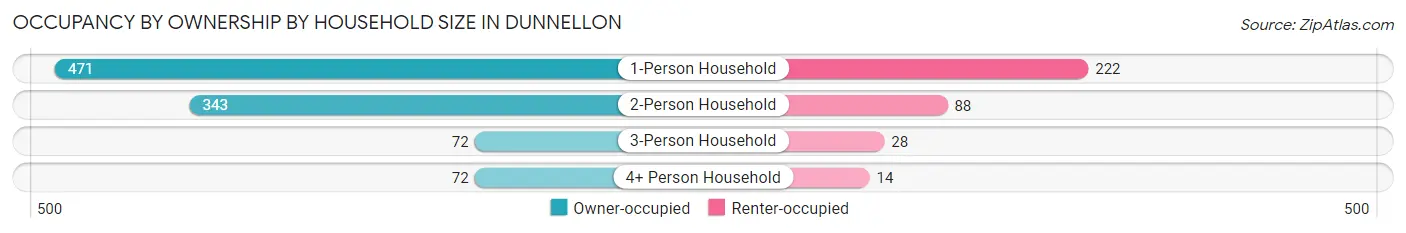
| Household Size | Owner-occupied | Renter-occupied |
| 1-Person Household | 471 (68.0%) | 222 (32.0%) |
| 2-Person Household | 343 (79.6%) | 88 (20.4%) |
| 3-Person Household | 72 (72.0%) | 28 (28.0%) |
| 4+ Person Household | 72 (83.7%) | 14 (16.3%) |
| Total Housing Units | 958 (73.1%) | 352 (26.9%) |
Occupancy by Educational Attainment in Dunnellon
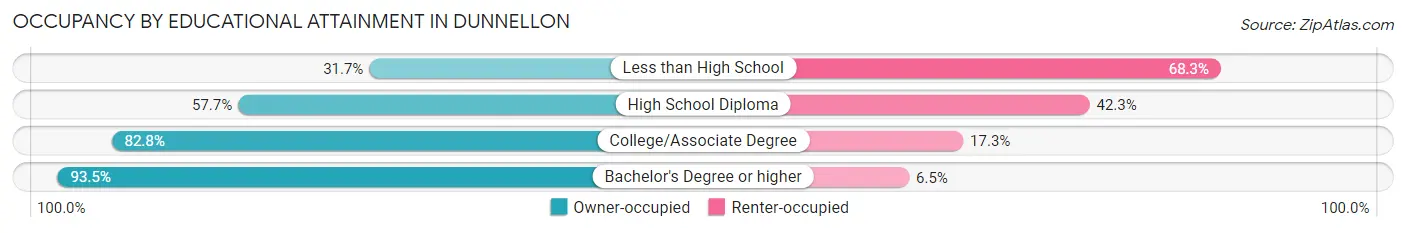
| Household Size | Owner-occupied | Renter-occupied |
| Less than High School | 51 (31.7%) | 110 (68.3%) |
| High School Diploma | 150 (57.7%) | 110 (42.3%) |
| College/Associate Degree | 571 (82.8%) | 119 (17.2%) |
| Bachelor's Degree or higher | 186 (93.5%) | 13 (6.5%) |
Occupancy by Age of Householder in Dunnellon
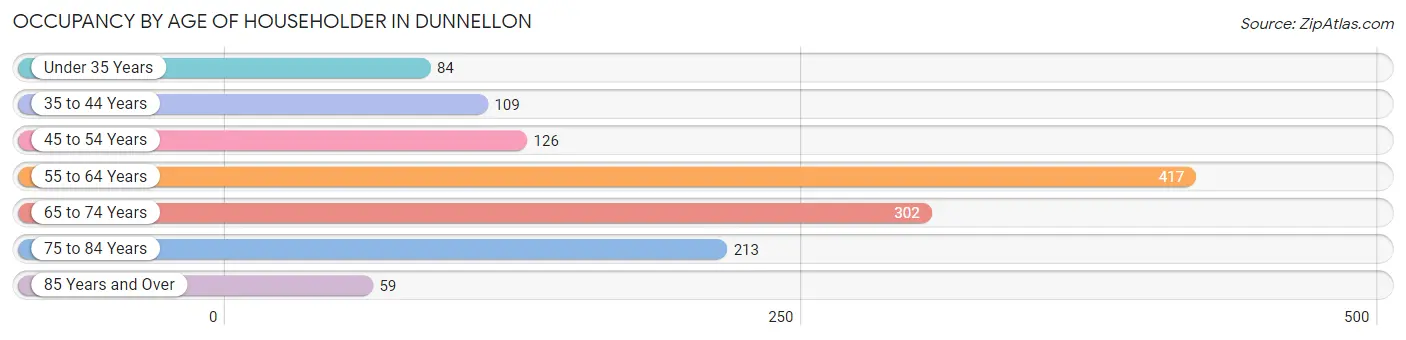
| Age Bracket | # Households | % Households |
| Under 35 Years | 84 | 6.4% |
| 35 to 44 Years | 109 | 8.3% |
| 45 to 54 Years | 126 | 9.6% |
| 55 to 64 Years | 417 | 31.8% |
| 65 to 74 Years | 302 | 23.1% |
| 75 to 84 Years | 213 | 16.3% |
| 85 Years and Over | 59 | 4.5% |
| Total | 1,310 | 100.0% |
Housing Finances in Dunnellon
Median Income by Occupancy in Dunnellon
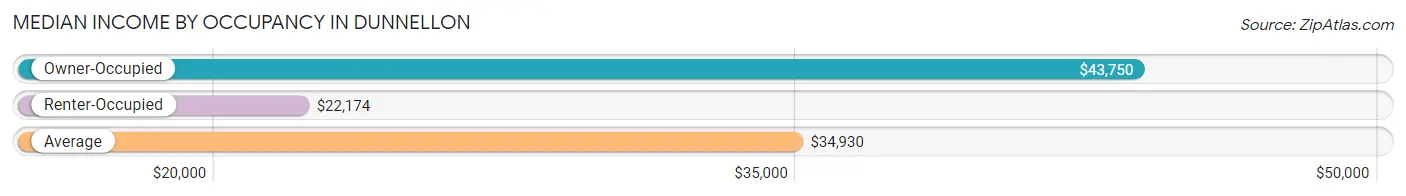
| Occupancy Type | # Households | Median Income |
| Owner-Occupied | 958 (73.1%) | $43,750 |
| Renter-Occupied | 352 (26.9%) | $22,174 |
| Average | 1,310 (100.0%) | $34,930 |
Occupancy by Householder Income Bracket in Dunnellon
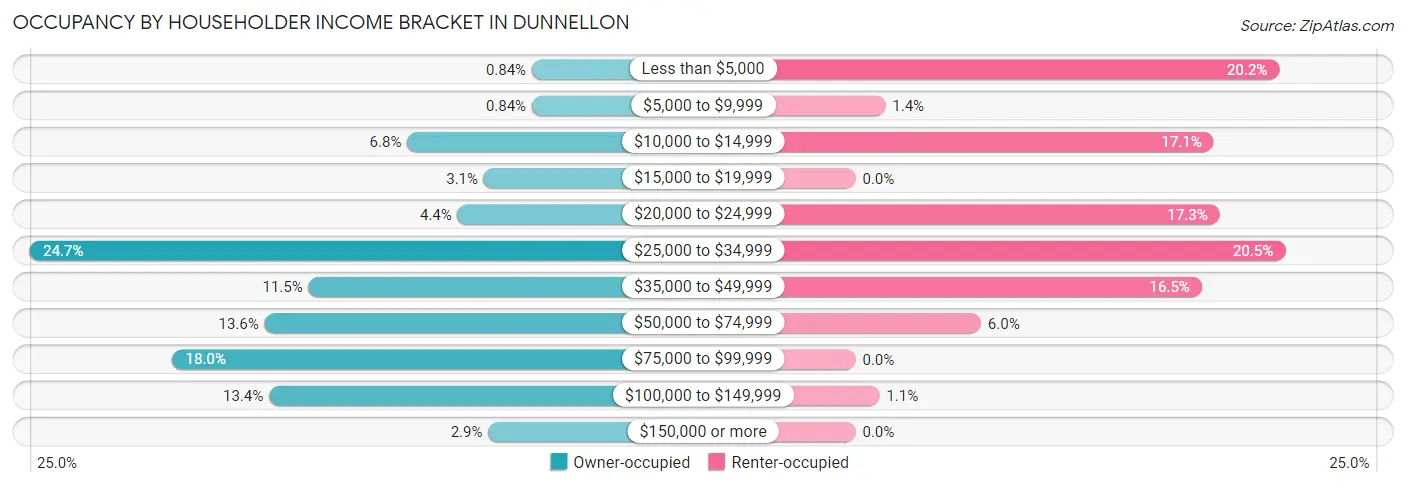
| Income Bracket | Owner-occupied | Renter-occupied |
| Less than $5,000 | 8 (0.8%) | 71 (20.2%) |
| $5,000 to $9,999 | 8 (0.8%) | 5 (1.4%) |
| $10,000 to $14,999 | 65 (6.8%) | 60 (17.1%) |
| $15,000 to $19,999 | 30 (3.1%) | 0 (0.0%) |
| $20,000 to $24,999 | 42 (4.4%) | 61 (17.3%) |
| $25,000 to $34,999 | 237 (24.7%) | 72 (20.4%) |
| $35,000 to $49,999 | 110 (11.5%) | 58 (16.5%) |
| $50,000 to $74,999 | 130 (13.6%) | 21 (6.0%) |
| $75,000 to $99,999 | 172 (17.9%) | 0 (0.0%) |
| $100,000 to $149,999 | 128 (13.4%) | 4 (1.1%) |
| $150,000 or more | 28 (2.9%) | 0 (0.0%) |
| Total | 958 (100.0%) | 352 (100.0%) |
Monthly Housing Cost Tiers in Dunnellon
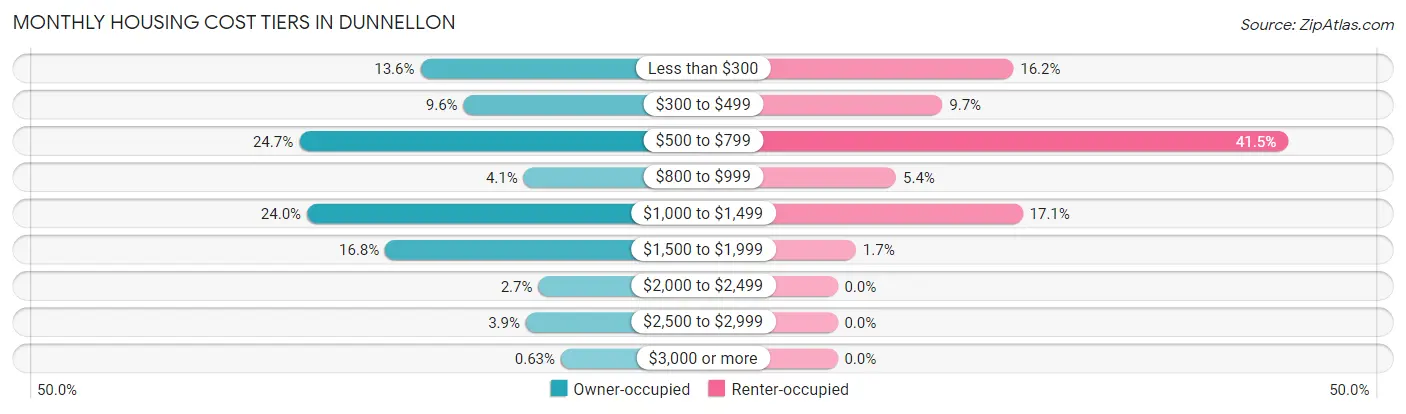
| Monthly Cost | Owner-occupied | Renter-occupied |
| Less than $300 | 130 (13.6%) | 57 (16.2%) |
| $300 to $499 | 92 (9.6%) | 34 (9.7%) |
| $500 to $799 | 237 (24.7%) | 146 (41.5%) |
| $800 to $999 | 39 (4.1%) | 19 (5.4%) |
| $1,000 to $1,499 | 230 (24.0%) | 60 (17.1%) |
| $1,500 to $1,999 | 161 (16.8%) | 6 (1.7%) |
| $2,000 to $2,499 | 26 (2.7%) | 0 (0.0%) |
| $2,500 to $2,999 | 37 (3.9%) | 0 (0.0%) |
| $3,000 or more | 6 (0.6%) | 0 (0.0%) |
| Total | 958 (100.0%) | 352 (100.0%) |
Physical Housing Characteristics in Dunnellon
Housing Structures in Dunnellon
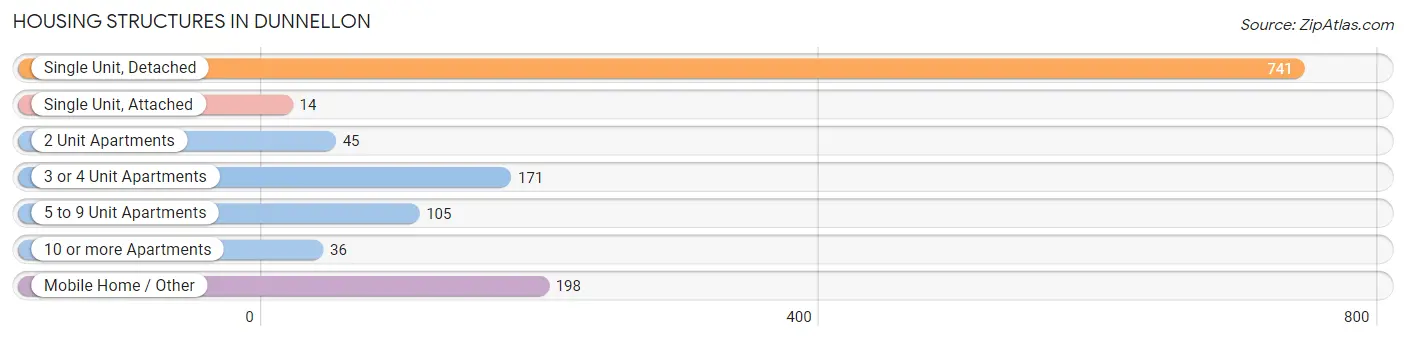
| Structure Type | # Housing Units | % Housing Units |
| Single Unit, Detached | 741 | 56.6% |
| Single Unit, Attached | 14 | 1.1% |
| 2 Unit Apartments | 45 | 3.4% |
| 3 or 4 Unit Apartments | 171 | 13.1% |
| 5 to 9 Unit Apartments | 105 | 8.0% |
| 10 or more Apartments | 36 | 2.8% |
| Mobile Home / Other | 198 | 15.1% |
| Total | 1,310 | 100.0% |
Housing Structures by Occupancy in Dunnellon
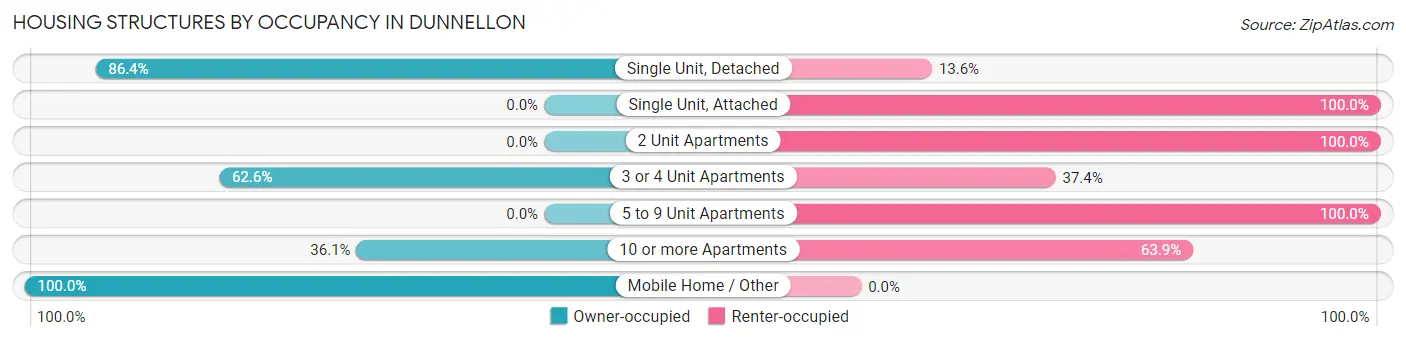
| Structure Type | Owner-occupied | Renter-occupied |
| Single Unit, Detached | 640 (86.4%) | 101 (13.6%) |
| Single Unit, Attached | 0 (0.0%) | 14 (100.0%) |
| 2 Unit Apartments | 0 (0.0%) | 45 (100.0%) |
| 3 or 4 Unit Apartments | 107 (62.6%) | 64 (37.4%) |
| 5 to 9 Unit Apartments | 0 (0.0%) | 105 (100.0%) |
| 10 or more Apartments | 13 (36.1%) | 23 (63.9%) |
| Mobile Home / Other | 198 (100.0%) | 0 (0.0%) |
| Total | 958 (73.1%) | 352 (26.9%) |
Housing Structures by Number of Rooms in Dunnellon
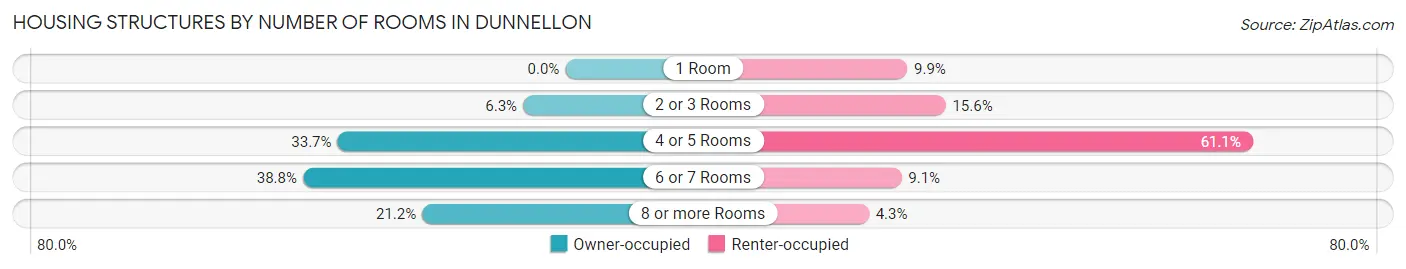
| Number of Rooms | Owner-occupied | Renter-occupied |
| 1 Room | 0 (0.0%) | 35 (9.9%) |
| 2 or 3 Rooms | 60 (6.3%) | 55 (15.6%) |
| 4 or 5 Rooms | 323 (33.7%) | 215 (61.1%) |
| 6 or 7 Rooms | 372 (38.8%) | 32 (9.1%) |
| 8 or more Rooms | 203 (21.2%) | 15 (4.3%) |
| Total | 958 (100.0%) | 352 (100.0%) |
Housing Structure by Heating Type in Dunnellon
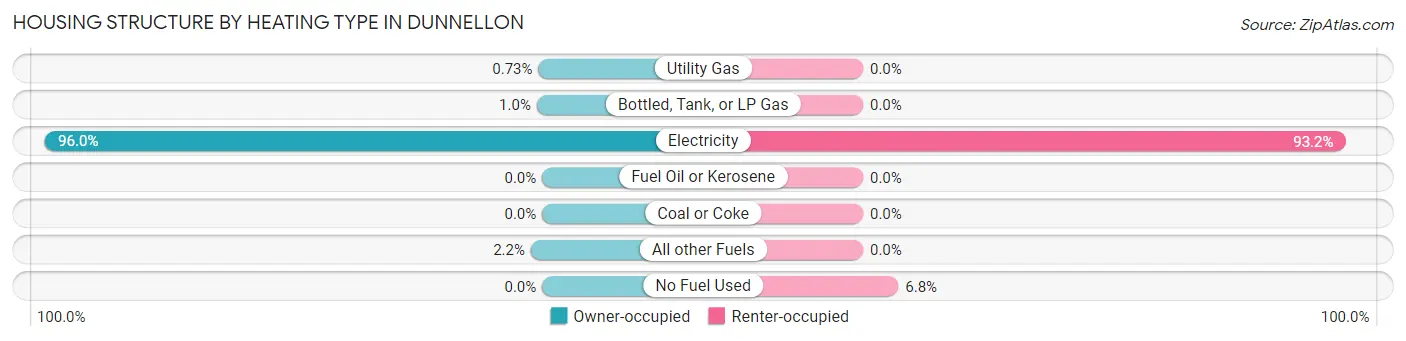
| Heating Type | Owner-occupied | Renter-occupied |
| Utility Gas | 7 (0.7%) | 0 (0.0%) |
| Bottled, Tank, or LP Gas | 10 (1.0%) | 0 (0.0%) |
| Electricity | 920 (96.0%) | 328 (93.2%) |
| Fuel Oil or Kerosene | 0 (0.0%) | 0 (0.0%) |
| Coal or Coke | 0 (0.0%) | 0 (0.0%) |
| All other Fuels | 21 (2.2%) | 0 (0.0%) |
| No Fuel Used | 0 (0.0%) | 24 (6.8%) |
| Total | 958 (100.0%) | 352 (100.0%) |
Household Vehicle Usage in Dunnellon
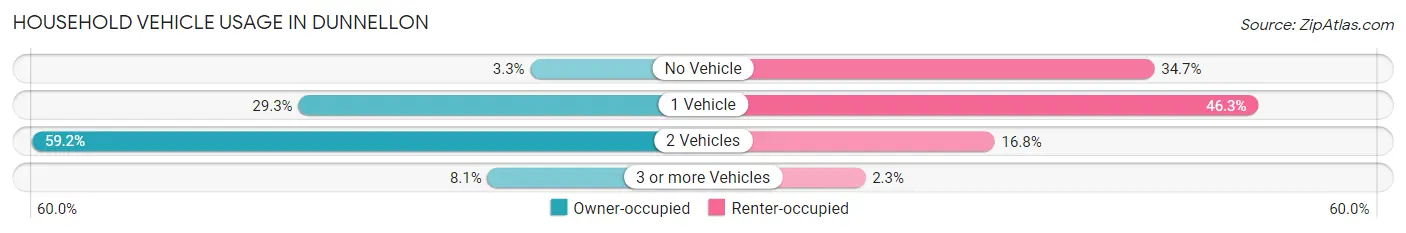
| Vehicles per Household | Owner-occupied | Renter-occupied |
| No Vehicle | 32 (3.3%) | 122 (34.7%) |
| 1 Vehicle | 281 (29.3%) | 163 (46.3%) |
| 2 Vehicles | 567 (59.2%) | 59 (16.8%) |
| 3 or more Vehicles | 78 (8.1%) | 8 (2.3%) |
| Total | 958 (100.0%) | 352 (100.0%) |
Real Estate & Mortgages in Dunnellon
Real Estate and Mortgage Overview in Dunnellon
| Characteristic | Without Mortgage | With Mortgage |
| Housing Units | 469 | 489 |
| Median Property Value | $105,800 | $206,500 |
| Median Household Income | $38,686 | $22 |
| Monthly Housing Costs | $516 | $6 |
| Real Estate Taxes | $876 | $7 |
Property Value by Mortgage Status in Dunnellon
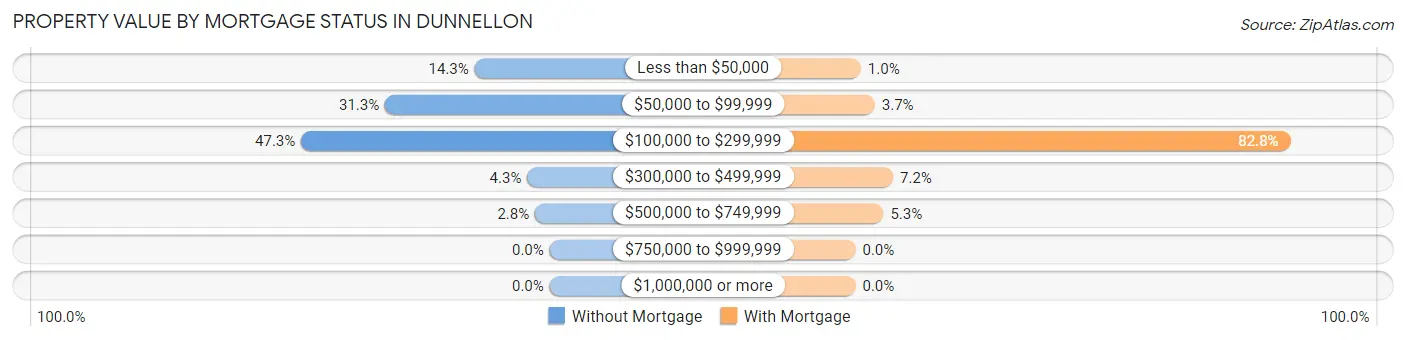
| Property Value | Without Mortgage | With Mortgage |
| Less than $50,000 | 67 (14.3%) | 5 (1.0%) |
| $50,000 to $99,999 | 147 (31.3%) | 18 (3.7%) |
| $100,000 to $299,999 | 222 (47.3%) | 405 (82.8%) |
| $300,000 to $499,999 | 20 (4.3%) | 35 (7.2%) |
| $500,000 to $749,999 | 13 (2.8%) | 26 (5.3%) |
| $750,000 to $999,999 | 0 (0.0%) | 0 (0.0%) |
| $1,000,000 or more | 0 (0.0%) | 0 (0.0%) |
| Total | 469 (100.0%) | 489 (100.0%) |
Household Income by Mortgage Status in Dunnellon
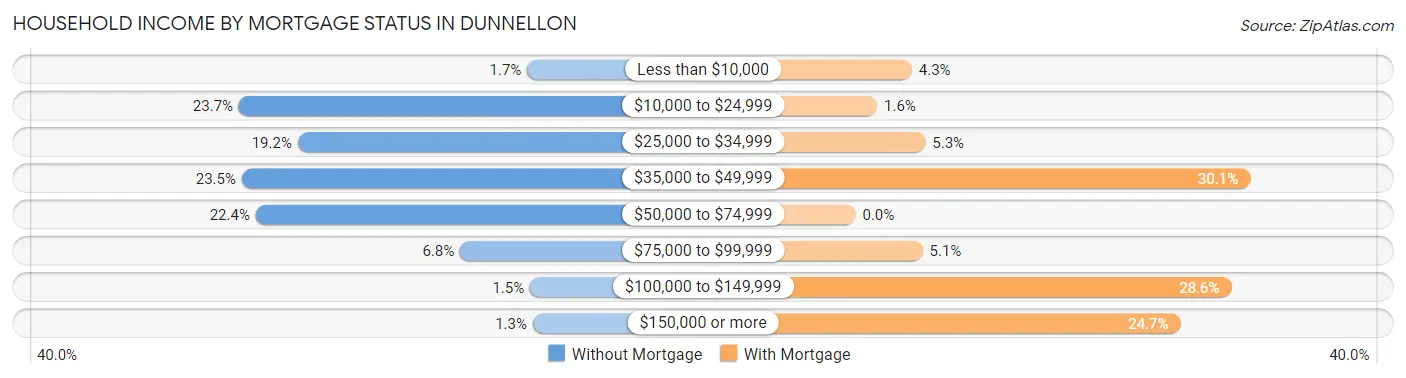
| Household Income | Without Mortgage | With Mortgage |
| Less than $10,000 | 8 (1.7%) | 21 (4.3%) |
| $10,000 to $24,999 | 111 (23.7%) | 8 (1.6%) |
| $25,000 to $34,999 | 90 (19.2%) | 26 (5.3%) |
| $35,000 to $49,999 | 110 (23.4%) | 147 (30.1%) |
| $50,000 to $74,999 | 105 (22.4%) | 0 (0.0%) |
| $75,000 to $99,999 | 32 (6.8%) | 25 (5.1%) |
| $100,000 to $149,999 | 7 (1.5%) | 140 (28.6%) |
| $150,000 or more | 6 (1.3%) | 121 (24.7%) |
| Total | 469 (100.0%) | 489 (100.0%) |
Property Value to Household Income Ratio in Dunnellon
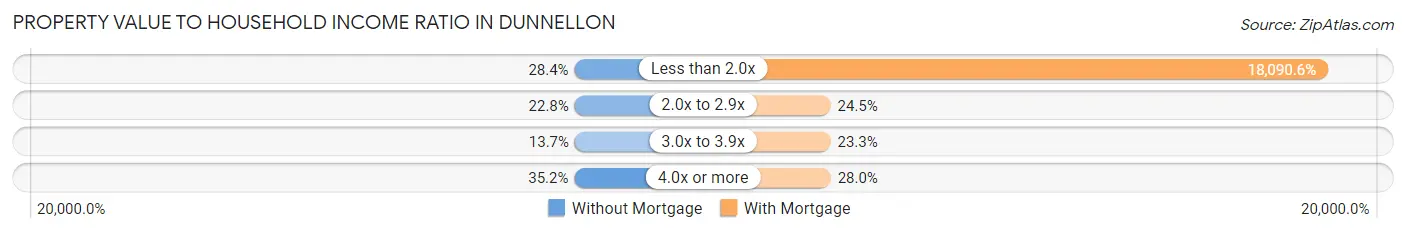
| Value-to-Income Ratio | Without Mortgage | With Mortgage |
| Less than 2.0x | 133 (28.4%) | 88,463 (18,090.6%) |
| 2.0x to 2.9x | 107 (22.8%) | 120 (24.5%) |
| 3.0x to 3.9x | 64 (13.7%) | 114 (23.3%) |
| 4.0x or more | 165 (35.2%) | 137 (28.0%) |
| Total | 469 (100.0%) | 489 (100.0%) |
Real Estate Taxes by Mortgage Status in Dunnellon
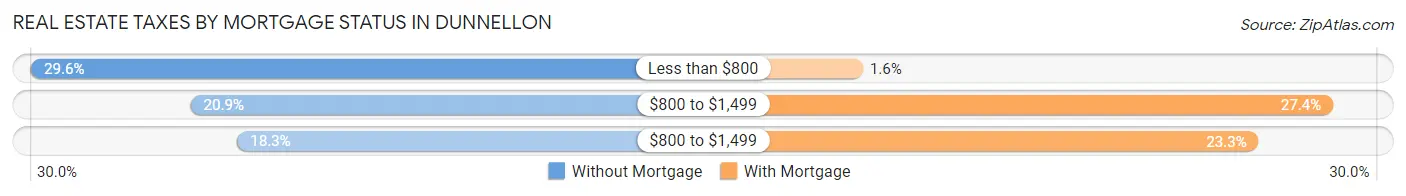
| Property Taxes | Without Mortgage | With Mortgage |
| Less than $800 | 139 (29.6%) | 8 (1.6%) |
| $800 to $1,499 | 98 (20.9%) | 134 (27.4%) |
| $800 to $1,499 | 86 (18.3%) | 114 (23.3%) |
| Total | 469 (100.0%) | 489 (100.0%) |
Health & Disability in Dunnellon
Health Insurance Coverage by Age in Dunnellon
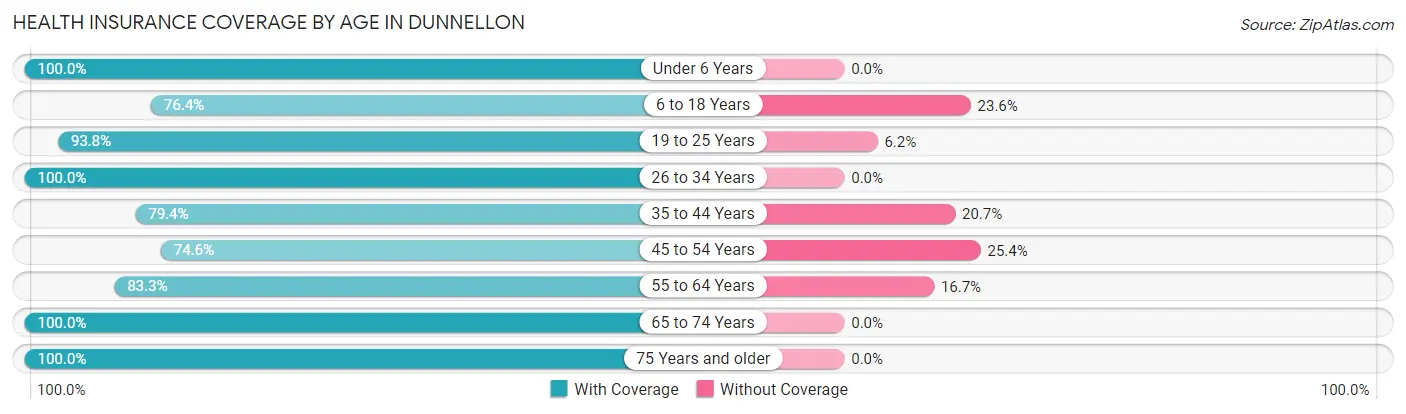
| Age Bracket | With Coverage | Without Coverage |
| Under 6 Years | 90 (100.0%) | 0 (0.0%) |
| 6 to 18 Years | 146 (76.4%) | 45 (23.6%) |
| 19 to 25 Years | 106 (93.8%) | 7 (6.2%) |
| 26 to 34 Years | 134 (100.0%) | 0 (0.0%) |
| 35 to 44 Years | 146 (79.3%) | 38 (20.6%) |
| 45 to 54 Years | 135 (74.6%) | 46 (25.4%) |
| 55 to 64 Years | 523 (83.3%) | 105 (16.7%) |
| 65 to 74 Years | 413 (100.0%) | 0 (0.0%) |
| 75 Years and older | 403 (100.0%) | 0 (0.0%) |
| Total | 2,096 (89.7%) | 241 (10.3%) |
Health Insurance Coverage by Citizenship Status in Dunnellon
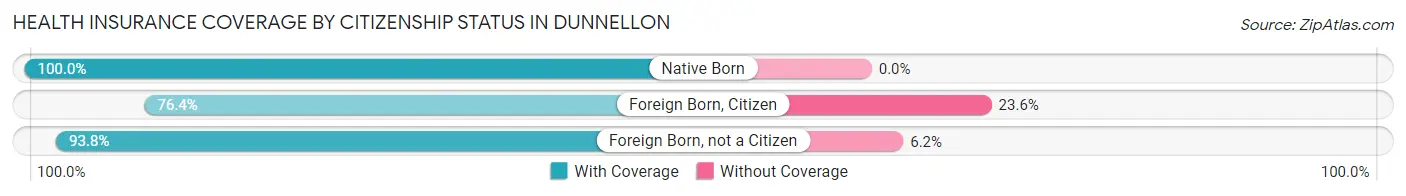
| Citizenship Status | With Coverage | Without Coverage |
| Native Born | 90 (100.0%) | 0 (0.0%) |
| Foreign Born, Citizen | 146 (76.4%) | 45 (23.6%) |
| Foreign Born, not a Citizen | 106 (93.8%) | 7 (6.2%) |
Health Insurance Coverage by Household Income in Dunnellon
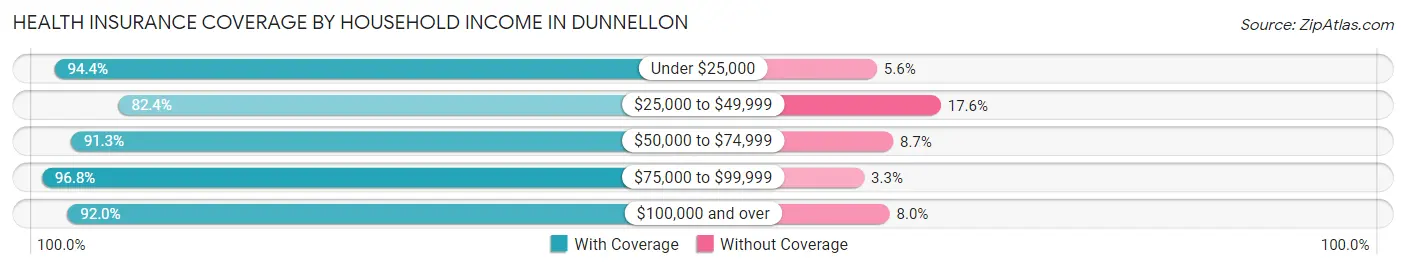
| Household Income | With Coverage | Without Coverage |
| Under $25,000 | 452 (94.4%) | 27 (5.6%) |
| $25,000 to $49,999 | 641 (82.4%) | 137 (17.6%) |
| $50,000 to $74,999 | 306 (91.3%) | 29 (8.7%) |
| $75,000 to $99,999 | 238 (96.8%) | 8 (3.3%) |
| $100,000 and over | 459 (92.0%) | 40 (8.0%) |
Public vs Private Health Insurance Coverage by Age in Dunnellon
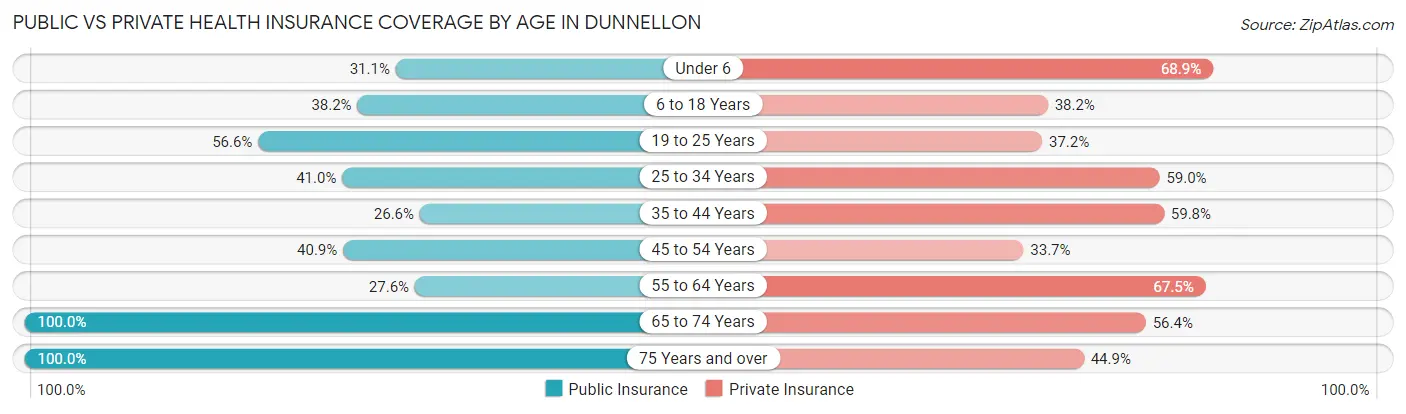
| Age Bracket | Public Insurance | Private Insurance |
| Under 6 | 28 (31.1%) | 62 (68.9%) |
| 6 to 18 Years | 73 (38.2%) | 73 (38.2%) |
| 19 to 25 Years | 64 (56.6%) | 42 (37.2%) |
| 25 to 34 Years | 55 (41.0%) | 79 (59.0%) |
| 35 to 44 Years | 49 (26.6%) | 110 (59.8%) |
| 45 to 54 Years | 74 (40.9%) | 61 (33.7%) |
| 55 to 64 Years | 173 (27.6%) | 424 (67.5%) |
| 65 to 74 Years | 413 (100.0%) | 233 (56.4%) |
| 75 Years and over | 403 (100.0%) | 181 (44.9%) |
| Total | 1,332 (57.0%) | 1,265 (54.1%) |
Disability Status by Sex by Age in Dunnellon
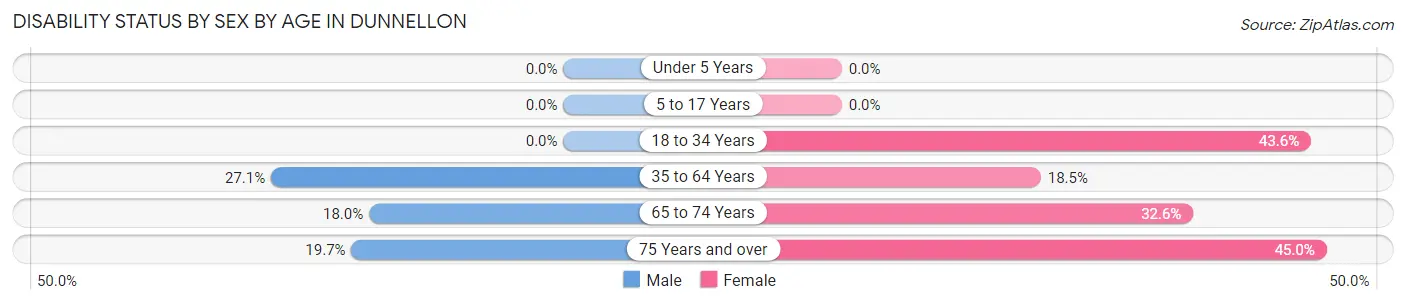
| Age Bracket | Male | Female |
| Under 5 Years | 0 (0.0%) | 0 (0.0%) |
| 5 to 17 Years | 0 (0.0%) | 0 (0.0%) |
| 18 to 34 Years | 0 (0.0%) | 54 (43.5%) |
| 35 to 64 Years | 124 (27.1%) | 99 (18.5%) |
| 65 to 74 Years | 33 (18.0%) | 75 (32.6%) |
| 75 Years and over | 36 (19.7%) | 99 (45.0%) |
Disability Class by Sex by Age in Dunnellon
Disability Class: Hearing Difficulty
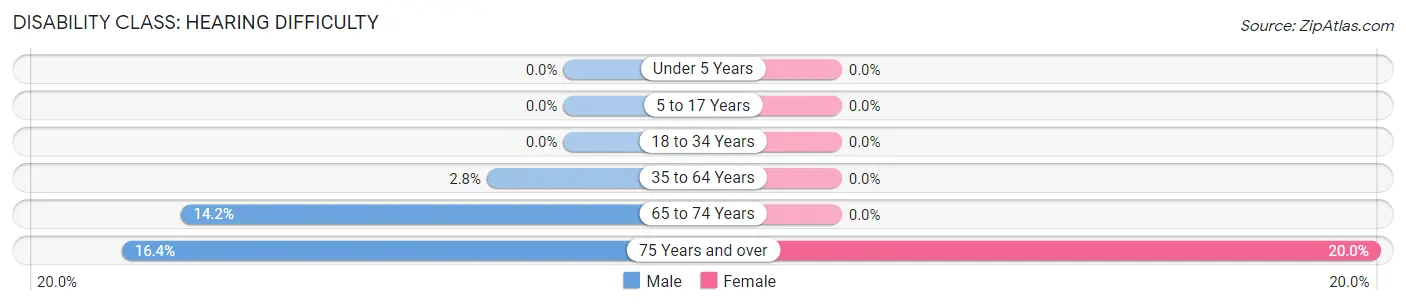
| Age Bracket | Male | Female |
| Under 5 Years | 0 (0.0%) | 0 (0.0%) |
| 5 to 17 Years | 0 (0.0%) | 0 (0.0%) |
| 18 to 34 Years | 0 (0.0%) | 0 (0.0%) |
| 35 to 64 Years | 13 (2.8%) | 0 (0.0%) |
| 65 to 74 Years | 26 (14.2%) | 0 (0.0%) |
| 75 Years and over | 30 (16.4%) | 44 (20.0%) |
Disability Class: Vision Difficulty
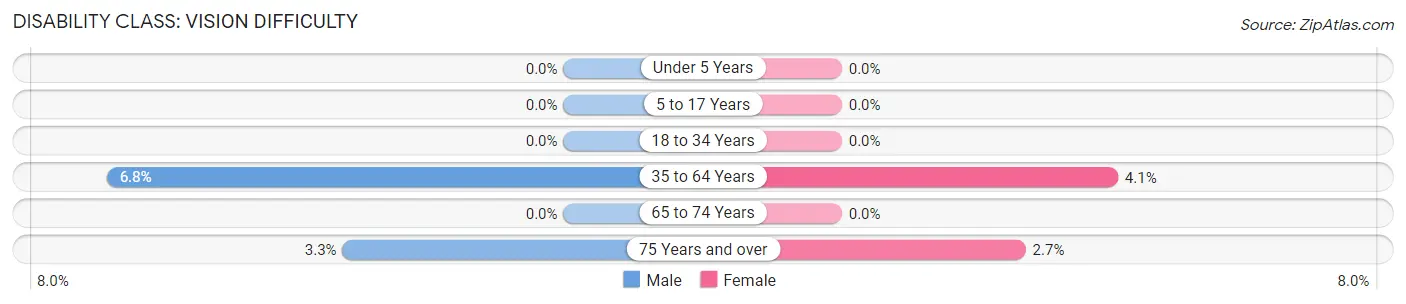
| Age Bracket | Male | Female |
| Under 5 Years | 0 (0.0%) | 0 (0.0%) |
| 5 to 17 Years | 0 (0.0%) | 0 (0.0%) |
| 18 to 34 Years | 0 (0.0%) | 0 (0.0%) |
| 35 to 64 Years | 31 (6.8%) | 22 (4.1%) |
| 65 to 74 Years | 0 (0.0%) | 0 (0.0%) |
| 75 Years and over | 6 (3.3%) | 6 (2.7%) |
Disability Class: Cognitive Difficulty
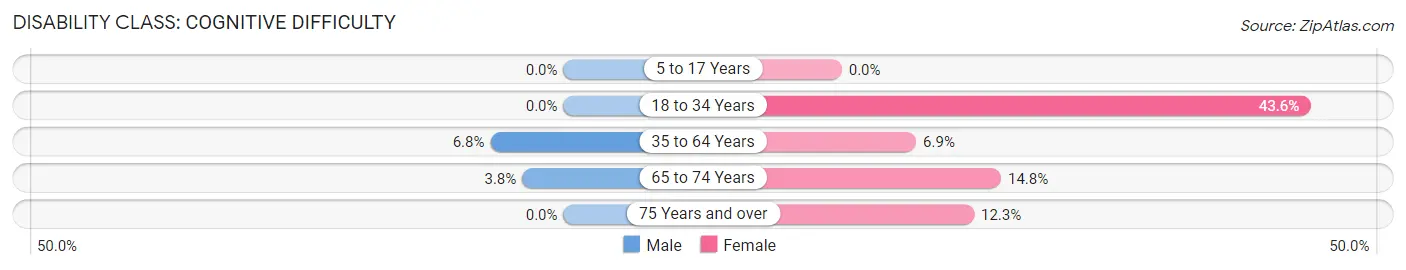
| Age Bracket | Male | Female |
| 5 to 17 Years | 0 (0.0%) | 0 (0.0%) |
| 18 to 34 Years | 0 (0.0%) | 54 (43.5%) |
| 35 to 64 Years | 31 (6.8%) | 37 (6.9%) |
| 65 to 74 Years | 7 (3.8%) | 34 (14.8%) |
| 75 Years and over | 0 (0.0%) | 27 (12.3%) |
Disability Class: Ambulatory Difficulty
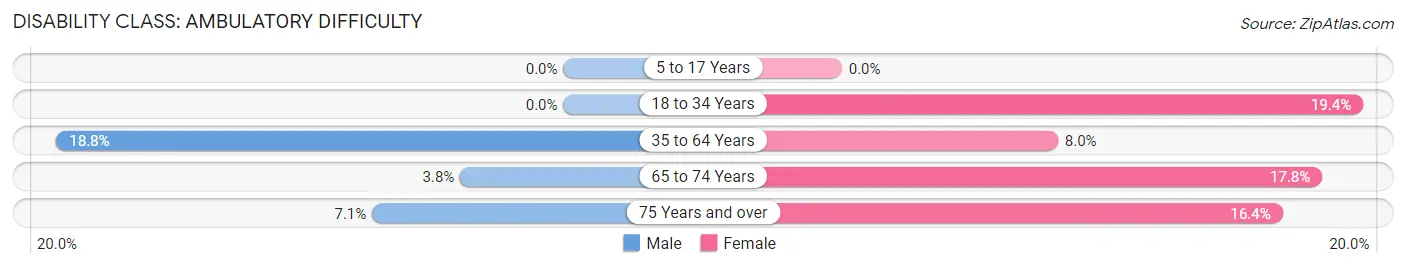
| Age Bracket | Male | Female |
| 5 to 17 Years | 0 (0.0%) | 0 (0.0%) |
| 18 to 34 Years | 0 (0.0%) | 24 (19.4%) |
| 35 to 64 Years | 86 (18.8%) | 43 (8.0%) |
| 65 to 74 Years | 7 (3.8%) | 41 (17.8%) |
| 75 Years and over | 13 (7.1%) | 36 (16.4%) |
Disability Class: Self-Care Difficulty
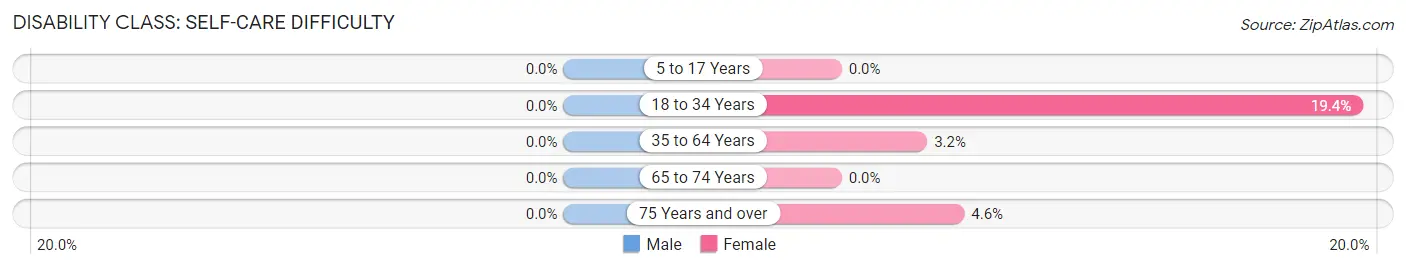
| Age Bracket | Male | Female |
| 5 to 17 Years | 0 (0.0%) | 0 (0.0%) |
| 18 to 34 Years | 0 (0.0%) | 24 (19.4%) |
| 35 to 64 Years | 0 (0.0%) | 17 (3.2%) |
| 65 to 74 Years | 0 (0.0%) | 0 (0.0%) |
| 75 Years and over | 0 (0.0%) | 10 (4.5%) |
Technology Access in Dunnellon
Computing Device Access in Dunnellon
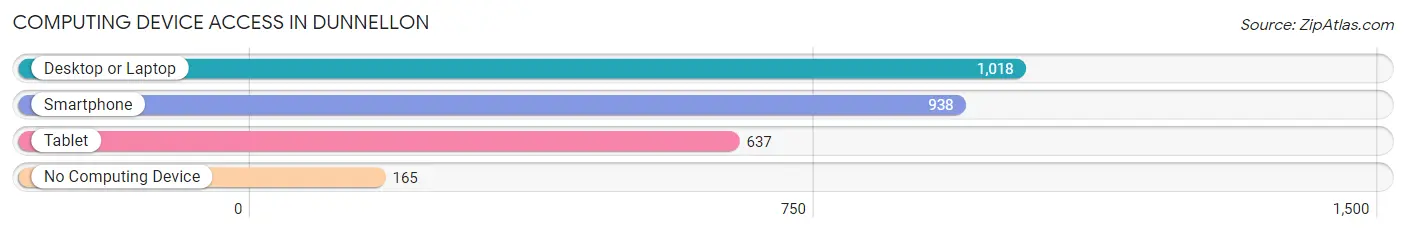
| Device Type | # Households | % Households |
| Desktop or Laptop | 1,018 | 77.7% |
| Smartphone | 938 | 71.6% |
| Tablet | 637 | 48.6% |
| No Computing Device | 165 | 12.6% |
| Total | 1,310 | 100.0% |
Internet Access in Dunnellon
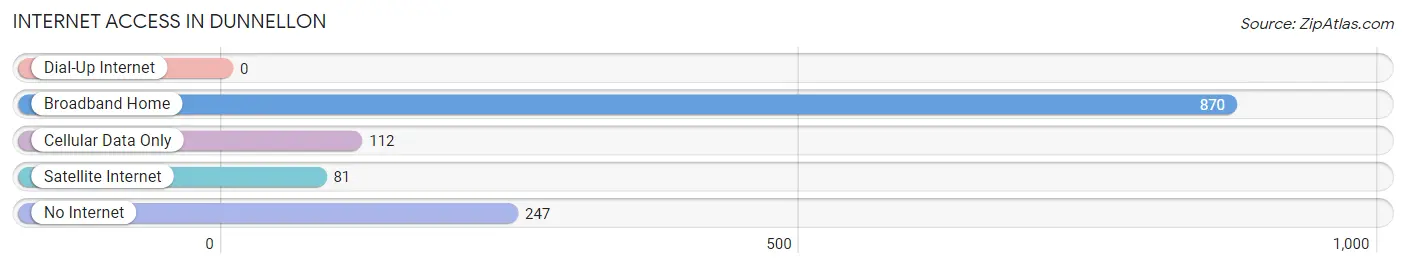
| Internet Type | # Households | % Households |
| Dial-Up Internet | 0 | 0.0% |
| Broadband Home | 870 | 66.4% |
| Cellular Data Only | 112 | 8.6% |
| Satellite Internet | 81 | 6.2% |
| No Internet | 247 | 18.9% |
| Total | 1,310 | 100.0% |
Dunnellon Summary
Dunnellon, Florida is a small city located in Marion County, Florida. It is situated on the banks of the Withlacoochee River, approximately 25 miles southwest of Ocala. The city has a population of 1,898 as of the 2010 census, making it the smallest incorporated city in Marion County.
History
The area that is now Dunnellon was originally inhabited by the Timucua Indians. The first European settlers arrived in the area in the late 1800s. The city was founded in 1887 by Captain Blitch, a former Confederate soldier. He named the city after his hometown of Dunnellon, Georgia.
The city was incorporated in 1895 and quickly became a popular tourist destination due to its proximity to the Withlacoochee River. The city was also known for its phosphate mining industry, which provided jobs for many of the city’s residents.
Geography
Dunnellon is located in Marion County, Florida. It is situated on the banks of the Withlacoochee River, approximately 25 miles southwest of Ocala. The city has a total area of 1.3 square miles, all of which is land.
The city is located in a humid subtropical climate zone, with hot, humid summers and mild winters. The average temperature in the summer is around 90 degrees Fahrenheit, while the average temperature in the winter is around 60 degrees Fahrenheit.
Economy
The economy of Dunnellon is largely based on tourism and agriculture. The city is home to several tourist attractions, including Rainbow Springs State Park, which is a popular destination for swimming, fishing, and camping. The city is also home to several farms, which produce a variety of crops, including citrus fruits, vegetables, and hay.
The city is also home to several businesses, including restaurants, retail stores, and service providers. The city is also home to several manufacturing companies, which produce a variety of products, including furniture, clothing, and electronics.
Demographics
As of the 2010 census, the population of Dunnellon was 1,898. The racial makeup of the city was 79.3% White, 15.2% African American, 0.3% Native American, 0.7% Asian, 0.1% Pacific Islander, and 4.4% from other races. Hispanic or Latino of any race were 8.2% of the population.
The median income for a household in the city was $30,938, and the median income for a family was $37,917. The per capita income for the city was $17,845. About 17.2% of families and 20.2% of the population were below the poverty line, including 28.3% of those under age 18 and 11.2% of those age 65 or over.
Conclusion
Dunnellon, Florida is a small city located in Marion County, Florida. It is situated on the banks of the Withlacoochee River, approximately 25 miles southwest of Ocala. The city has a population of 1,898 as of the 2010 census, making it the smallest incorporated city in Marion County. The economy of Dunnellon is largely based on tourism and agriculture, and the city is home to several tourist attractions, businesses, and farms. The racial makeup of the city is 79.3% White, 15.2% African American, 0.3% Native American, 0.7% Asian, 0.1% Pacific Islander, and 4.4% from other races. The median income for a household in the city was $30,938, and the median income for a family was $37,917.
Common Questions
What is Per Capita Income in Dunnellon?
Per Capita income in Dunnellon is $29,379.
What is the Median Family Income in Dunnellon?
Median Family Income in Dunnellon is $59,350.
What is the Median Household income in Dunnellon?
Median Household Income in Dunnellon is $34,930.
What is Income or Wage Gap in Dunnellon?
Income or Wage Gap in Dunnellon is 5.7%.
Women in Dunnellon earn 94.3 cents for every dollar earned by a man.
What is Family Income Deficit in Dunnellon?
Family Income Deficit in Dunnellon is $10,081.
Families that are below poverty line in Dunnellon earn $10,081 less on average than the poverty threshold level.
What is Inequality or Gini Index in Dunnellon?
Inequality or Gini Index in Dunnellon is 0.42.
What is the Total Population of Dunnellon?
Total Population of Dunnellon is 2,337.
What is the Total Male Population of Dunnellon?
Total Male Population of Dunnellon is 1,101.
What is the Total Female Population of Dunnellon?
Total Female Population of Dunnellon is 1,236.
What is the Ratio of Males per 100 Females in Dunnellon?
There are 89.08 Males per 100 Females in Dunnellon.
What is the Ratio of Females per 100 Males in Dunnellon?
There are 112.26 Females per 100 Males in Dunnellon.
What is the Median Population Age in Dunnellon?
Median Population Age in Dunnellon is 60.4 Years.
What is the Average Family Size in Dunnellon
Average Family Size in Dunnellon is 2.7 People.
What is the Average Household Size in Dunnellon
Average Household Size in Dunnellon is 1.8 People.
How Large is the Labor Force in Dunnellon?
There are 676 People in the Labor Forcein in Dunnellon.
What is the Percentage of People in the Labor Force in Dunnellon?
32.4% of People are in the Labor Force in Dunnellon.
What is the Unemployment Rate in Dunnellon?
Unemployment Rate in Dunnellon is 6.1%.