Green Cove Springs, FL Map & Demographics
Green Cove Springs Map
Green Cove Springs Overview
$29,573
PER CAPITA INCOME
$73,500
AVG FAMILY INCOME
$63,760
AVG HOUSEHOLD INCOME
23.8%
WAGE / INCOME GAP [ % ]
76.2¢/ $1
WAGE / INCOME GAP [ $ ]
$14,682
FAMILY INCOME DEFICIT
0.40
INEQUALITY / GINI INDEX
9,758
TOTAL POPULATION
5,036
MALE POPULATION
4,722
FEMALE POPULATION
106.65
MALES / 100 FEMALES
93.76
FEMALES / 100 MALES
38.5
MEDIAN AGE
3.0
AVG FAMILY SIZE
2.7
AVG HOUSEHOLD SIZE
4,139
LABOR FORCE [ PEOPLE ]
52.7%
PERCENT IN LABOR FORCE
5.4%
UNEMPLOYMENT RATE
Green Cove Springs Zip Codes
Green Cove Springs Area Codes
Income in Green Cove Springs
Income Overview in Green Cove Springs
Per Capita Income in Green Cove Springs is $29,573, while median incomes of families and households are $73,500 and $63,760 respectively.
| Characteristic | Number | Measure |
| Per Capita Income | 9,758 | $29,573 |
| Median Family Income | 2,522 | $73,500 |
| Mean Family Income | 2,522 | $84,549 |
| Median Household Income | 3,489 | $63,760 |
| Mean Household Income | 3,489 | $78,189 |
| Income Deficit | 2,522 | $14,682 |
| Wage / Income Gap (%) | 9,758 | 23.79% |
| Wage / Income Gap ($) | 9,758 | 76.21¢ per $1 |
| Gini / Inequality Index | 9,758 | 0.40 |
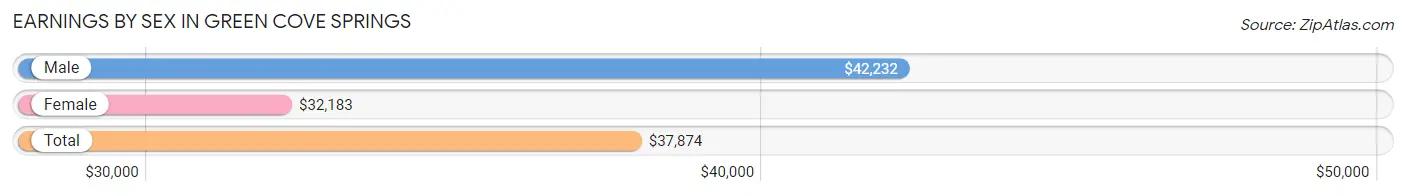
Earnings by Sex in Green Cove Springs
Average Earnings in Green Cove Springs are $37,874, $42,232 for men and $32,183 for women, a difference of 23.8%.
| Sex | Number | Average Earnings |
| Male | 2,370 (54.7%) | $42,232 |
| Female | 1,960 (45.3%) | $32,183 |
| Total | 4,330 (100.0%) | $37,874 |
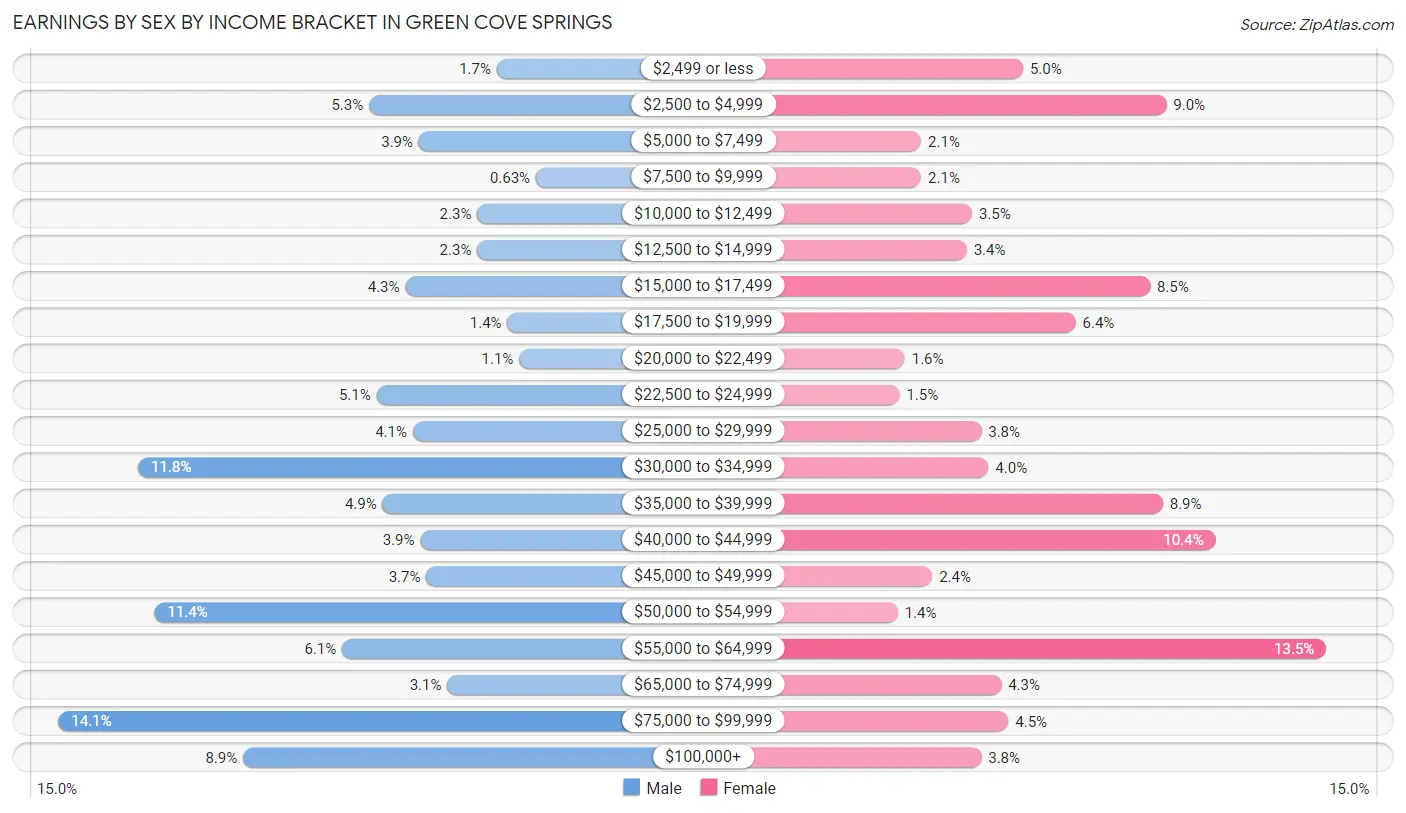
Earnings by Sex by Income Bracket in Green Cove Springs
The most common earnings brackets in Green Cove Springs are $75,000 to $99,999 for men (333 | 14.1%) and $55,000 to $64,999 for women (264 | 13.5%).
| Income | Male | Female |
| $2,499 or less | 41 (1.7%) | 97 (5.0%) |
| $2,500 to $4,999 | 126 (5.3%) | 176 (9.0%) |
| $5,000 to $7,499 | 93 (3.9%) | 41 (2.1%) |
| $7,500 to $9,999 | 15 (0.6%) | 41 (2.1%) |
| $10,000 to $12,499 | 54 (2.3%) | 69 (3.5%) |
| $12,500 to $14,999 | 54 (2.3%) | 66 (3.4%) |
| $15,000 to $17,499 | 102 (4.3%) | 167 (8.5%) |
| $17,500 to $19,999 | 34 (1.4%) | 126 (6.4%) |
| $20,000 to $22,499 | 26 (1.1%) | 32 (1.6%) |
| $22,500 to $24,999 | 121 (5.1%) | 29 (1.5%) |
| $25,000 to $29,999 | 97 (4.1%) | 74 (3.8%) |
| $30,000 to $34,999 | 280 (11.8%) | 78 (4.0%) |
| $35,000 to $39,999 | 117 (4.9%) | 174 (8.9%) |
| $40,000 to $44,999 | 92 (3.9%) | 203 (10.4%) |
| $45,000 to $49,999 | 88 (3.7%) | 47 (2.4%) |
| $50,000 to $54,999 | 269 (11.4%) | 28 (1.4%) |
| $55,000 to $64,999 | 144 (6.1%) | 264 (13.5%) |
| $65,000 to $74,999 | 74 (3.1%) | 85 (4.3%) |
| $75,000 to $99,999 | 333 (14.1%) | 89 (4.5%) |
| $100,000+ | 210 (8.9%) | 74 (3.8%) |
| Total | 2,370 (100.0%) | 1,960 (100.0%) |
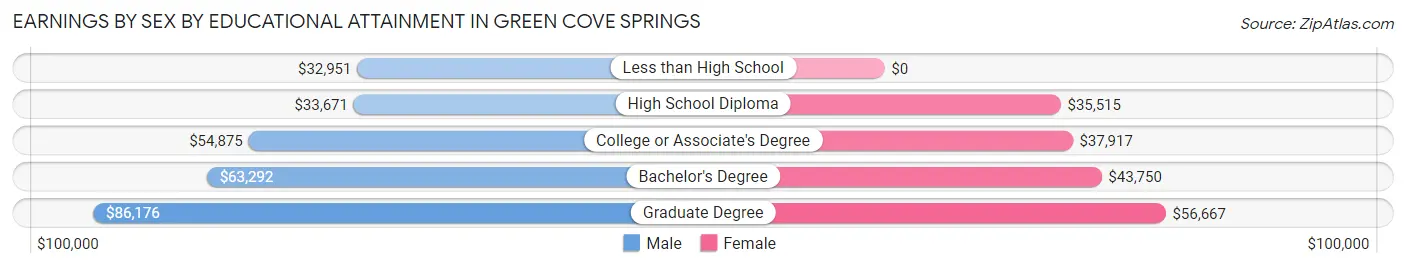
Earnings by Sex by Educational Attainment in Green Cove Springs
Average earnings in Green Cove Springs are $50,536 for men and $38,362 for women, a difference of 24.1%. Men with an educational attainment of graduate degree enjoy the highest average annual earnings of $86,176, while those with less than high school education earn the least with $32,951. Women with an educational attainment of graduate degree earn the most with the average annual earnings of $56,667, while those with high school diploma education have the smallest earnings of $35,515.
| Educational Attainment | Male Income | Female Income |
| Less than High School | $32,951 | $0 |
| High School Diploma | $33,671 | $35,515 |
| College or Associate's Degree | $54,875 | $37,917 |
| Bachelor's Degree | $63,292 | $43,750 |
| Graduate Degree | $86,176 | $56,667 |
| Total | $50,536 | $38,362 |
Family Income in Green Cove Springs
Family Income Brackets in Green Cove Springs
According to the Green Cove Springs family income data, there are 600 families falling into the $100,000 to $149,999 income range, which is the most common income bracket and makes up 23.8% of all families. Conversely, the $10,000 to $14,999 income bracket is the least frequent group with only 53 families (2.1%) belonging to this category.
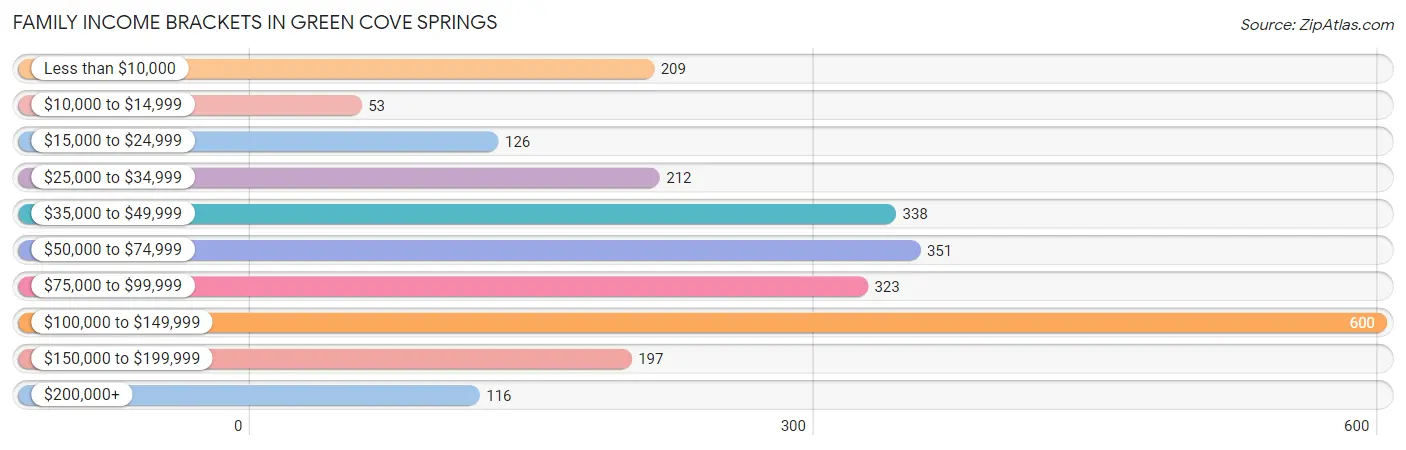
| Income Bracket | # Families | % Families |
| Less than $10,000 | 209 | 8.3% |
| $10,000 to $14,999 | 53 | 2.1% |
| $15,000 to $24,999 | 126 | 5.0% |
| $25,000 to $34,999 | 212 | 8.4% |
| $35,000 to $49,999 | 338 | 13.4% |
| $50,000 to $74,999 | 351 | 13.9% |
| $75,000 to $99,999 | 323 | 12.8% |
| $100,000 to $149,999 | 600 | 23.8% |
| $150,000 to $199,999 | 197 | 7.8% |
| $200,000+ | 116 | 4.6% |
Family Income by Famaliy Size in Green Cove Springs
6-person families (71 | 2.8%) account for the highest median family income in Green Cove Springs with $119,240 per family, while 2-person families (1,261 | 50.0%) have the highest median income of $32,656 per family member.
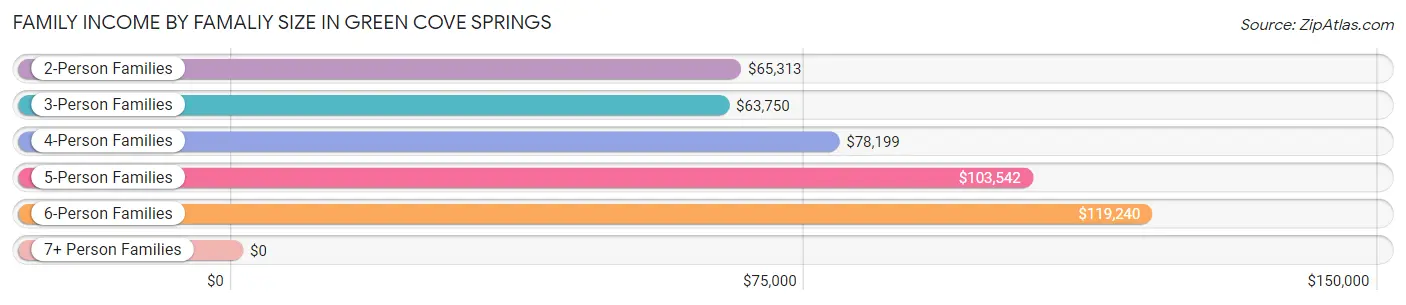
| Income Bracket | # Families | Median Income |
| 2-Person Families | 1,261 (50.0%) | $65,313 |
| 3-Person Families | 690 (27.4%) | $63,750 |
| 4-Person Families | 253 (10.0%) | $78,199 |
| 5-Person Families | 176 (7.0%) | $103,542 |
| 6-Person Families | 71 (2.8%) | $119,240 |
| 7+ Person Families | 71 (2.8%) | $0 |
| Total | 2,522 (100.0%) | $73,500 |
Family Income by Number of Earners in Green Cove Springs
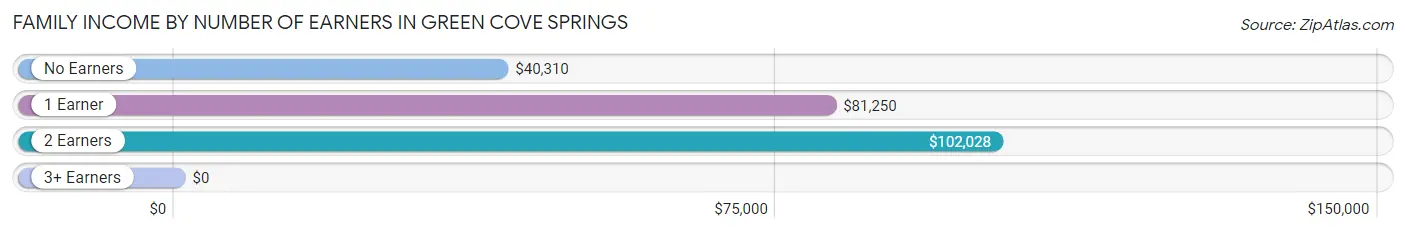
| Number of Earners | # Families | Median Income |
| No Earners | 808 (32.0%) | $40,310 |
| 1 Earner | 762 (30.2%) | $81,250 |
| 2 Earners | 779 (30.9%) | $102,028 |
| 3+ Earners | 173 (6.9%) | $0 |
| Total | 2,522 (100.0%) | $73,500 |
Household Income in Green Cove Springs
Household Income Brackets in Green Cove Springs
With 652 households falling in the category, the $100,000 to $149,999 income range is the most frequent in Green Cove Springs, accounting for 18.7% of all households. In contrast, only 115 households (3.3%) fall into the $200,000+ income bracket, making it the least populous group.
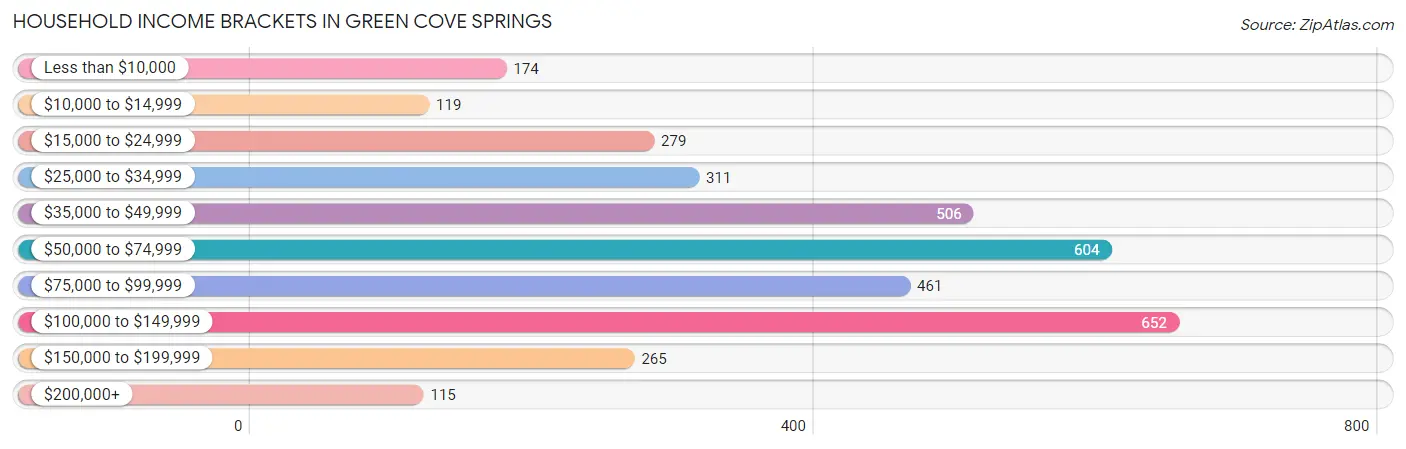
| Income Bracket | # Households | % Households |
| Less than $10,000 | 174 | 5.0% |
| $10,000 to $14,999 | 119 | 3.4% |
| $15,000 to $24,999 | 279 | 8.0% |
| $25,000 to $34,999 | 311 | 8.9% |
| $35,000 to $49,999 | 506 | 14.5% |
| $50,000 to $74,999 | 604 | 17.3% |
| $75,000 to $99,999 | 461 | 13.2% |
| $100,000 to $149,999 | 652 | 18.7% |
| $150,000 to $199,999 | 265 | 7.6% |
| $200,000+ | 115 | 3.3% |
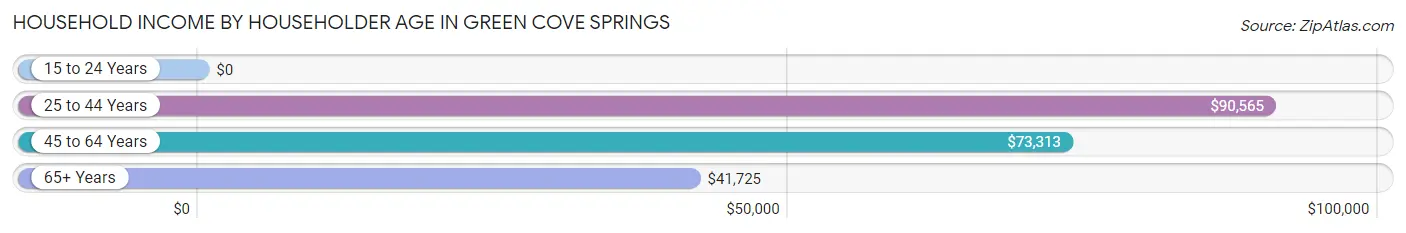
Household Income by Householder Age in Green Cove Springs
The median household income in Green Cove Springs is $63,760, with the highest median household income of $90,565 found in the 25 to 44 years age bracket for the primary householder. A total of 1,117 households (32.0%) fall into this category. Meanwhile, the 15 to 24 years age bracket for the primary householder has the lowest median household income of $0, with 47 households (1.3%) in this group.
| Income Bracket | # Households | Median Income |
| 15 to 24 Years | 47 (1.3%) | $0 |
| 25 to 44 Years | 1,117 (32.0%) | $90,565 |
| 45 to 64 Years | 1,195 (34.3%) | $73,313 |
| 65+ Years | 1,130 (32.4%) | $41,725 |
| Total | 3,489 (100.0%) | $63,760 |
Poverty in Green Cove Springs
Income Below Poverty by Sex and Age in Green Cove Springs
With 15.7% poverty level for males and 19.0% for females among the residents of Green Cove Springs, 6 to 11 year old males and 16 and 17 year old females are the most vulnerable to poverty, with 185 males (56.4%) and 51 females (54.8%) in their respective age groups living below the poverty level.
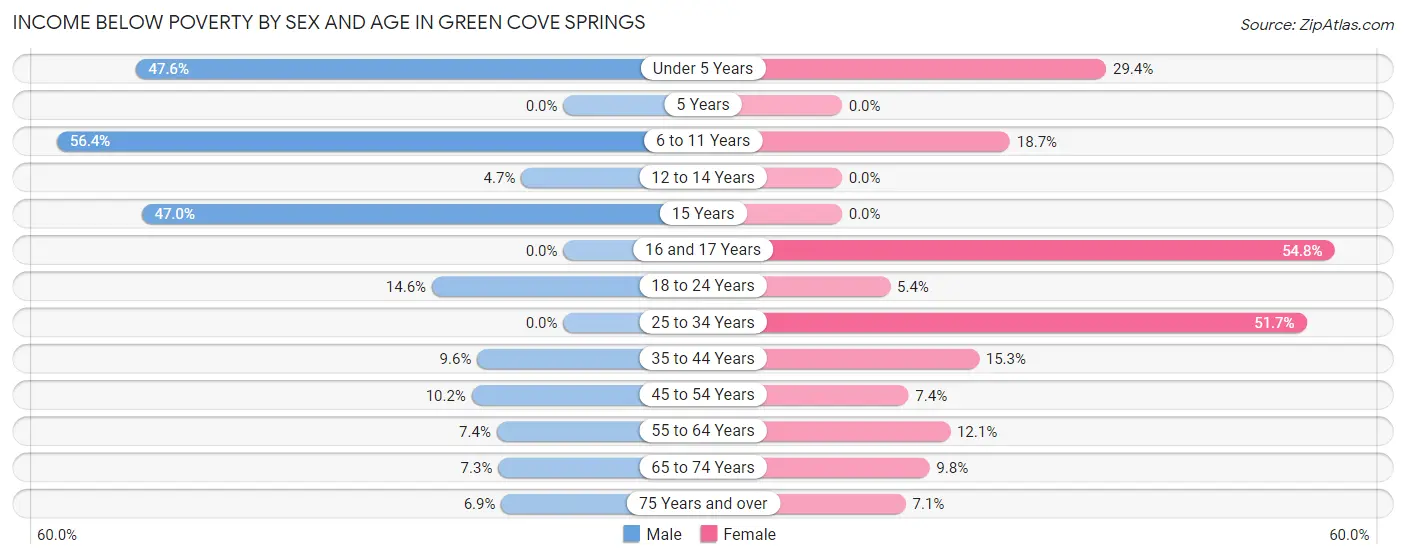
| Age Bracket | Male | Female |
| Under 5 Years | 201 (47.6%) | 78 (29.4%) |
| 5 Years | 0 (0.0%) | 0 (0.0%) |
| 6 to 11 Years | 185 (56.4%) | 73 (18.7%) |
| 12 to 14 Years | 9 (4.7%) | 0 (0.0%) |
| 15 Years | 62 (47.0%) | 0 (0.0%) |
| 16 and 17 Years | 0 (0.0%) | 51 (54.8%) |
| 18 to 24 Years | 83 (14.6%) | 17 (5.4%) |
| 25 to 34 Years | 0 (0.0%) | 358 (51.7%) |
| 35 to 44 Years | 54 (9.6%) | 85 (15.3%) |
| 45 to 54 Years | 44 (10.2%) | 35 (7.4%) |
| 55 to 64 Years | 34 (7.4%) | 77 (12.0%) |
| 65 to 74 Years | 33 (7.2%) | 54 (9.8%) |
| 75 Years and over | 27 (6.9%) | 35 (7.1%) |
| Total | 732 (15.7%) | 863 (19.0%) |
Income Above Poverty by Sex and Age in Green Cove Springs
According to the poverty statistics in Green Cove Springs, males aged 5 years and females aged 5 years are the age groups that are most secure financially, with 100.0% of males and 100.0% of females in these age groups living above the poverty line.
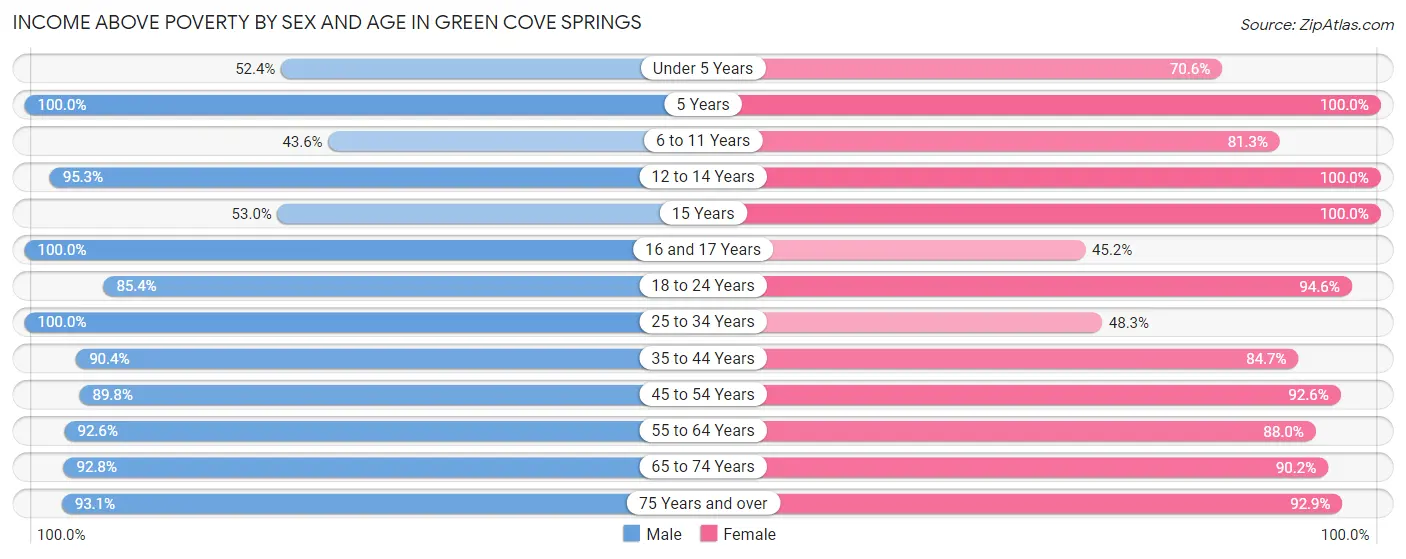
| Age Bracket | Male | Female |
| Under 5 Years | 221 (52.4%) | 187 (70.6%) |
| 5 Years | 21 (100.0%) | 42 (100.0%) |
| 6 to 11 Years | 143 (43.6%) | 317 (81.3%) |
| 12 to 14 Years | 183 (95.3%) | 8 (100.0%) |
| 15 Years | 70 (53.0%) | 17 (100.0%) |
| 16 and 17 Years | 13 (100.0%) | 42 (45.2%) |
| 18 to 24 Years | 484 (85.4%) | 299 (94.6%) |
| 25 to 34 Years | 686 (100.0%) | 334 (48.3%) |
| 35 to 44 Years | 509 (90.4%) | 472 (84.7%) |
| 45 to 54 Years | 387 (89.8%) | 437 (92.6%) |
| 55 to 64 Years | 424 (92.6%) | 562 (87.9%) |
| 65 to 74 Years | 422 (92.7%) | 499 (90.2%) |
| 75 Years and over | 364 (93.1%) | 457 (92.9%) |
| Total | 3,927 (84.3%) | 3,673 (81.0%) |
Income Below Poverty Among Married-Couple Families in Green Cove Springs
The poverty statistics for married-couple families in Green Cove Springs show that 5.0% or 85 of the total 1,717 families live below the poverty line. Families with no children have the highest poverty rate of 5.8%, comprising of 68 families. On the other hand, families with 3 or 4 children have the lowest poverty rate of 0.0%, which includes 0 families.
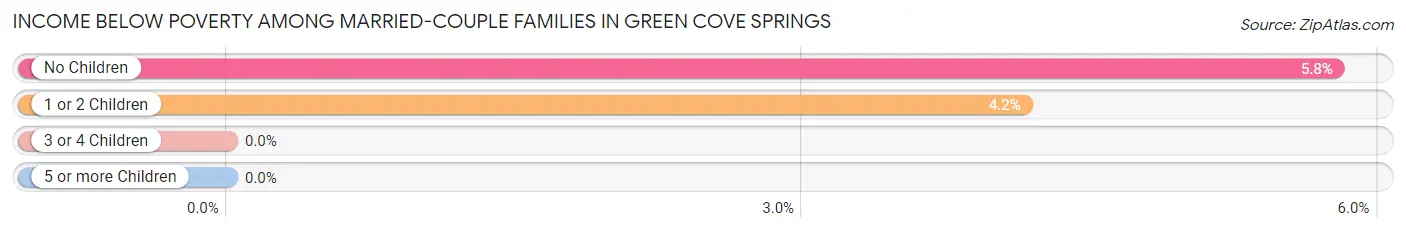
| Children | Above Poverty | Below Poverty |
| No Children | 1,108 (94.2%) | 68 (5.8%) |
| 1 or 2 Children | 393 (95.9%) | 17 (4.2%) |
| 3 or 4 Children | 60 (100.0%) | 0 (0.0%) |
| 5 or more Children | 71 (100.0%) | 0 (0.0%) |
| Total | 1,632 (95.1%) | 85 (5.0%) |
Income Below Poverty Among Single-Parent Households in Green Cove Springs
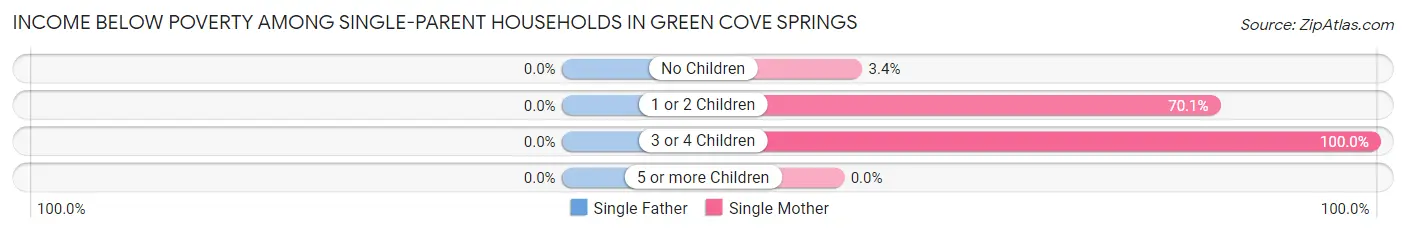
| Children | Single Father | Single Mother |
| No Children | 0 (0.0%) | 8 (3.4%) |
| 1 or 2 Children | 0 (0.0%) | 256 (70.1%) |
| 3 or 4 Children | 0 (0.0%) | 43 (100.0%) |
| 5 or more Children | 0 (0.0%) | 0 (0.0%) |
| Total | 0 (0.0%) | 307 (47.4%) |
Income Below Poverty Among Married-Couple vs Single-Parent Households in Green Cove Springs
The poverty data for Green Cove Springs shows that 85 of the married-couple family households (5.0%) and 307 of the single-parent households (38.1%) are living below the poverty level. Within the married-couple family households, those with no children have the highest poverty rate, with 68 households (5.8%) falling below the poverty line. Among the single-parent households, those with 1 or 2 children have the highest poverty rate, with 256 household (55.2%) living below poverty.
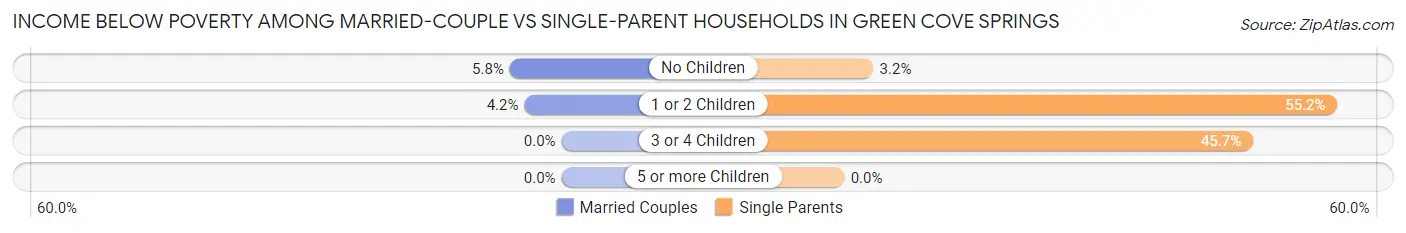
| Children | Married-Couple Families | Single-Parent Households |
| No Children | 68 (5.8%) | 8 (3.2%) |
| 1 or 2 Children | 17 (4.2%) | 256 (55.2%) |
| 3 or 4 Children | 0 (0.0%) | 43 (45.7%) |
| 5 or more Children | 0 (0.0%) | 0 (0.0%) |
| Total | 85 (5.0%) | 307 (38.1%) |
Race in Green Cove Springs
The most populous races in Green Cove Springs are White / Caucasian (7,028 | 72.0%), Hispanic or Latino (1,407 | 14.4%), and Black / African American (1,323 | 13.6%).
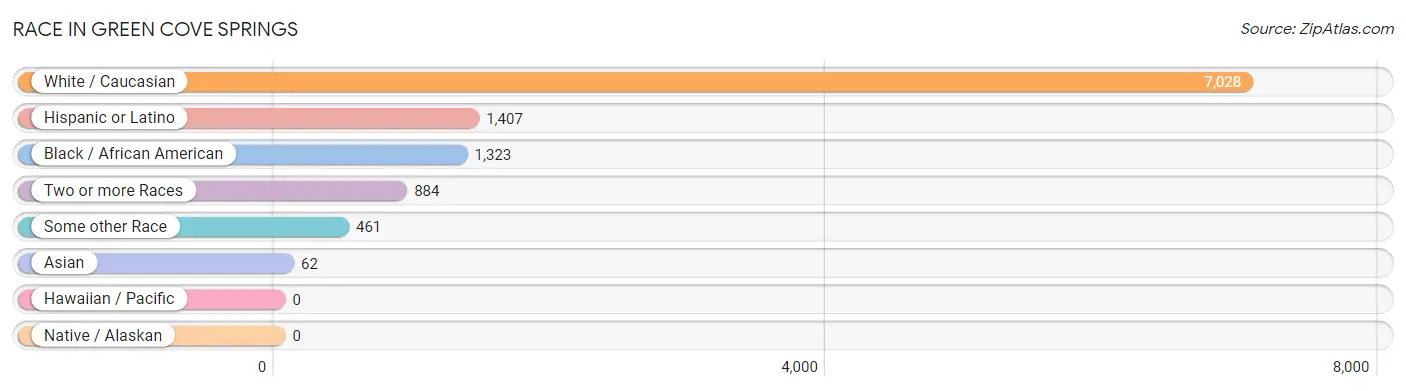
| Race | # Population | % Population |
| Asian | 62 | 0.6% |
| Black / African American | 1,323 | 13.6% |
| Hawaiian / Pacific | 0 | 0.0% |
| Hispanic or Latino | 1,407 | 14.4% |
| Native / Alaskan | 0 | 0.0% |
| White / Caucasian | 7,028 | 72.0% |
| Two or more Races | 884 | 9.1% |
| Some other Race | 461 | 4.7% |
| Total | 9,758 | 100.0% |
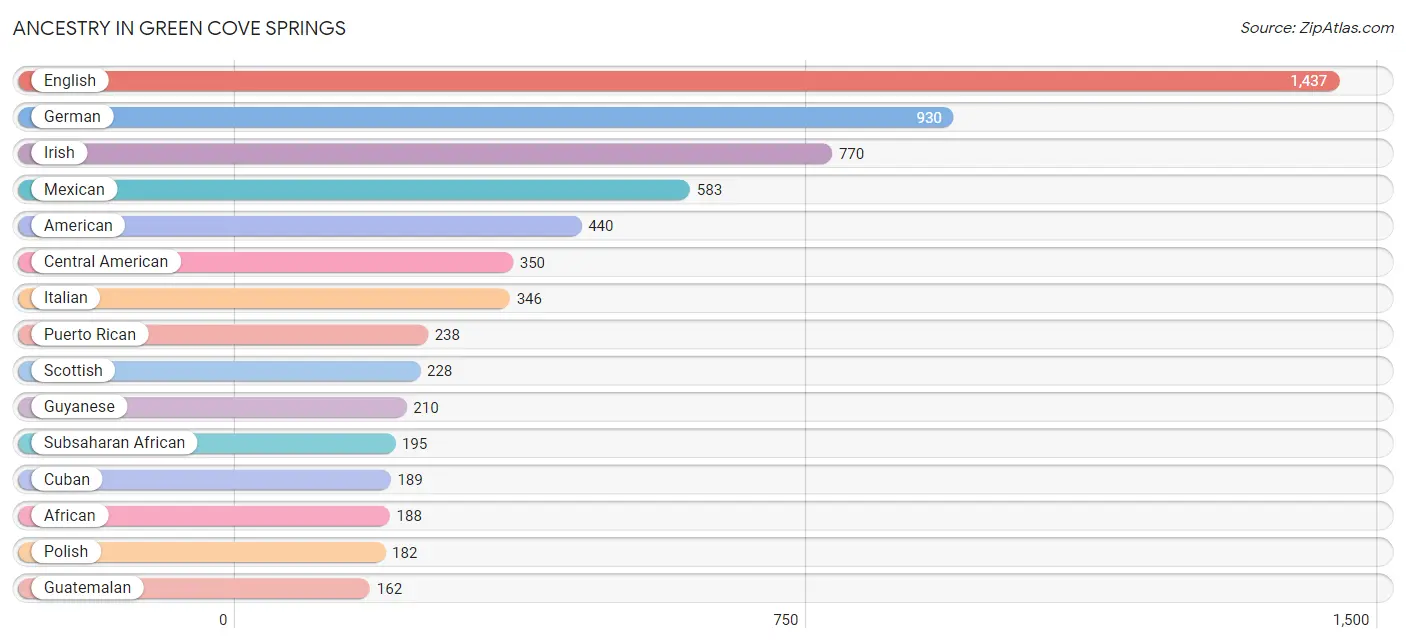
Ancestry in Green Cove Springs
The most populous ancestries reported in Green Cove Springs are English (1,437 | 14.7%), German (930 | 9.5%), Irish (770 | 7.9%), Mexican (583 | 6.0%), and American (440 | 4.5%), together accounting for 42.6% of all Green Cove Springs residents.
| Ancestry | # Population | % Population |
| African | 188 | 1.9% |
| American | 440 | 4.5% |
| Arab | 55 | 0.6% |
| Armenian | 9 | 0.1% |
| Austrian | 17 | 0.2% |
| British | 92 | 0.9% |
| Burmese | 9 | 0.1% |
| Cajun | 24 | 0.3% |
| Cambodian | 38 | 0.4% |
| Canadian | 29 | 0.3% |
| Central American | 350 | 3.6% |
| Cherokee | 89 | 0.9% |
| Choctaw | 29 | 0.3% |
| Creek | 6 | 0.1% |
| Croatian | 29 | 0.3% |
| Cuban | 189 | 1.9% |
| Czechoslovakian | 7 | 0.1% |
| Dutch | 117 | 1.2% |
| Ecuadorian | 13 | 0.1% |
| English | 1,437 | 14.7% |
| European | 69 | 0.7% |
| French | 125 | 1.3% |
| German | 930 | 9.5% |
| Guatemalan | 162 | 1.7% |
| Guyanese | 210 | 2.1% |
| Haitian | 4 | 0.0% |
| Honduran | 31 | 0.3% |
| Hungarian | 82 | 0.8% |
| Irish | 770 | 7.9% |
| Italian | 346 | 3.5% |
| Jordanian | 15 | 0.2% |
| Korean | 10 | 0.1% |
| Latvian | 45 | 0.5% |
| Lebanese | 40 | 0.4% |
| Mexican | 583 | 6.0% |
| Nigerian | 7 | 0.1% |
| Norwegian | 61 | 0.6% |
| Peruvian | 20 | 0.2% |
| Polish | 182 | 1.9% |
| Portuguese | 23 | 0.2% |
| Puerto Rican | 238 | 2.4% |
| Russian | 74 | 0.8% |
| Salvadoran | 157 | 1.6% |
| Scandinavian | 160 | 1.6% |
| Scotch-Irish | 87 | 0.9% |
| Scottish | 228 | 2.3% |
| Slavic | 9 | 0.1% |
| Slovak | 17 | 0.2% |
| South American | 33 | 0.3% |
| Spaniard | 14 | 0.1% |
| Sri Lankan | 8 | 0.1% |
| Subsaharan African | 195 | 2.0% |
| Swedish | 113 | 1.2% |
| Thai | 35 | 0.4% |
| Trinidadian and Tobagonian | 24 | 0.3% |
| Turkish | 14 | 0.1% |
| Ukrainian | 7 | 0.1% |
| Welsh | 39 | 0.4% | View All 58 Rows |
Immigrants in Green Cove Springs
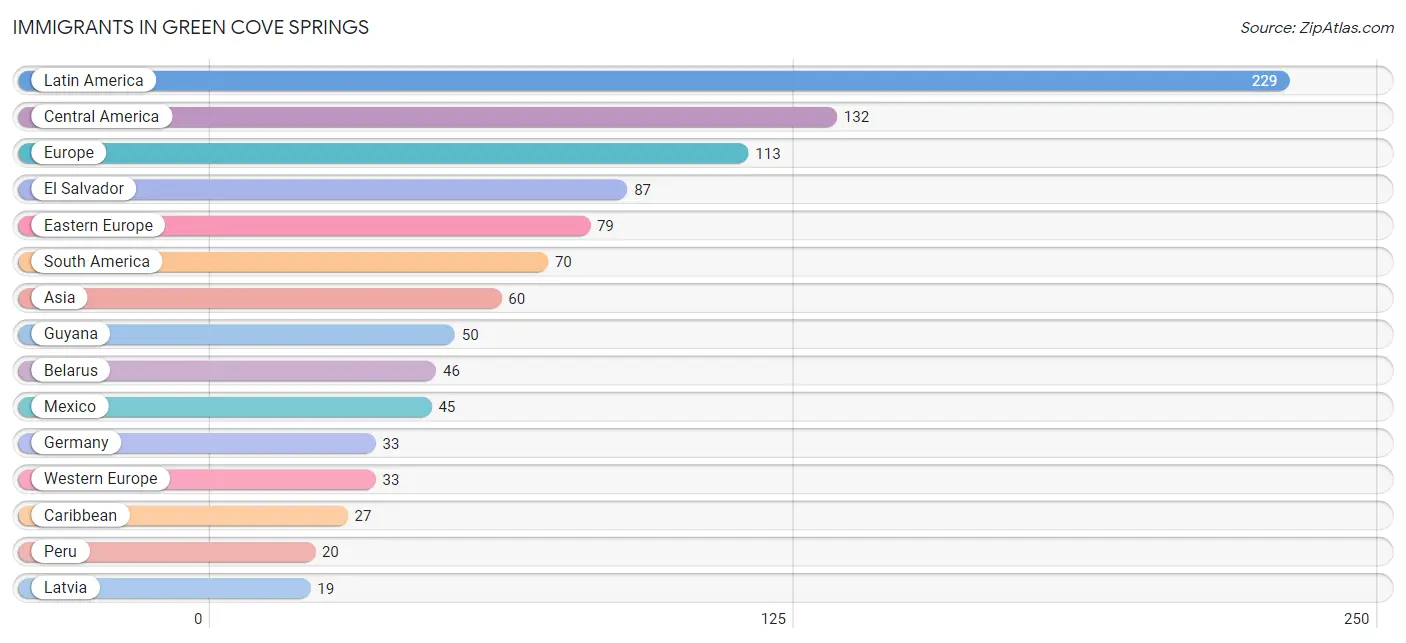
The most numerous immigrant groups reported in Green Cove Springs came from Latin America (229 | 2.4%), Central America (132 | 1.3%), Europe (113 | 1.2%), El Salvador (87 | 0.9%), and Eastern Europe (79 | 0.8%), together accounting for 6.6% of all Green Cove Springs residents.
| Immigration Origin | # Population | % Population |
| Africa | 7 | 0.1% |
| Asia | 60 | 0.6% |
| Belarus | 46 | 0.5% |
| Caribbean | 27 | 0.3% |
| Central America | 132 | 1.3% |
| Cuba | 11 | 0.1% |
| Eastern Asia | 9 | 0.1% |
| Eastern Europe | 79 | 0.8% |
| El Salvador | 87 | 0.9% |
| Europe | 113 | 1.2% |
| Germany | 33 | 0.3% |
| Guyana | 50 | 0.5% |
| Haiti | 4 | 0.0% |
| India | 18 | 0.2% |
| Italy | 1 | 0.0% |
| Jordan | 15 | 0.2% |
| Korea | 9 | 0.1% |
| Latin America | 229 | 2.4% |
| Latvia | 19 | 0.2% |
| Mexico | 45 | 0.5% |
| Nigeria | 7 | 0.1% |
| Peru | 20 | 0.2% |
| Philippines | 10 | 0.1% |
| Poland | 14 | 0.1% |
| South America | 70 | 0.7% |
| South Central Asia | 18 | 0.2% |
| South Eastern Asia | 18 | 0.2% |
| Southern Europe | 1 | 0.0% |
| Trinidad and Tobago | 12 | 0.1% |
| Vietnam | 8 | 0.1% |
| Western Africa | 7 | 0.1% |
| Western Asia | 15 | 0.2% |
| Western Europe | 33 | 0.3% | View All 33 Rows |
Sex and Age in Green Cove Springs
Sex and Age in Green Cove Springs
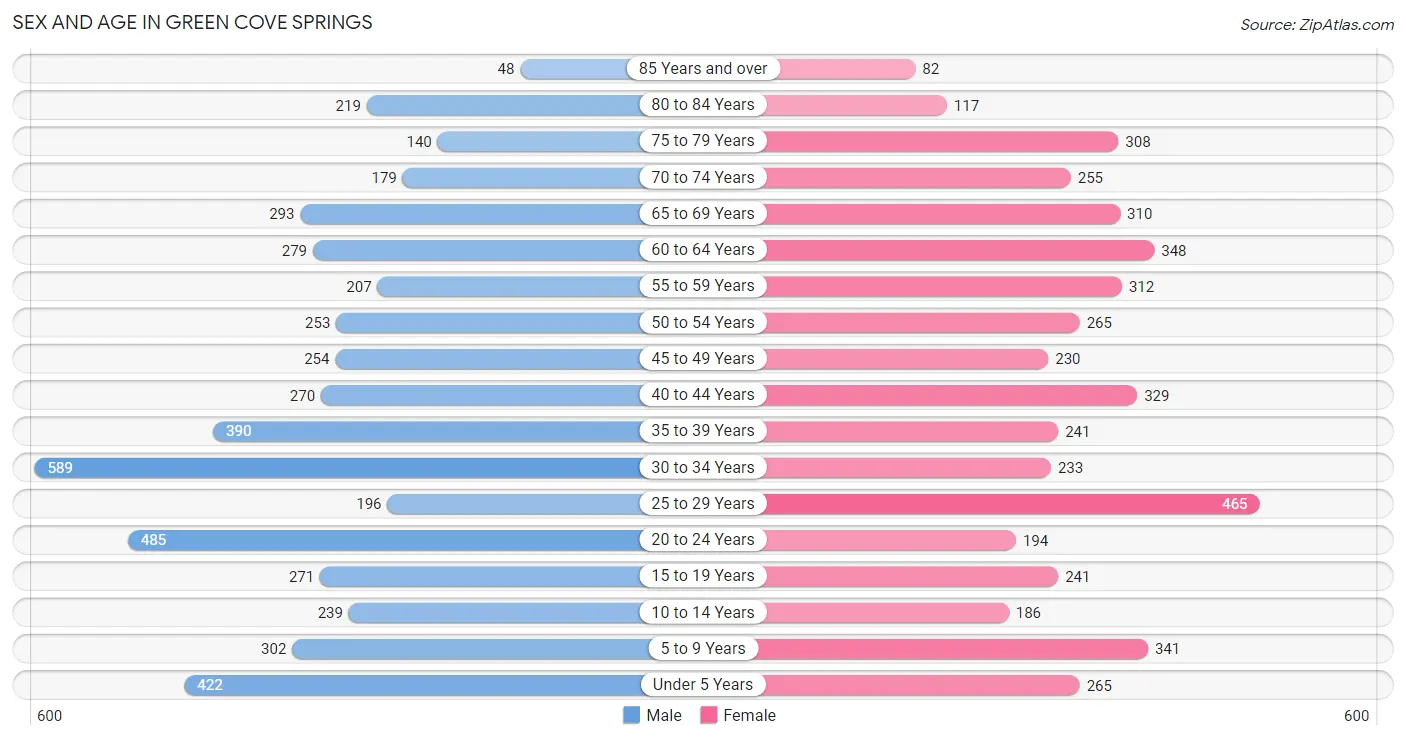
The most populous age groups in Green Cove Springs are 30 to 34 Years (589 | 11.7%) for men and 25 to 29 Years (465 | 9.9%) for women.
| Age Bracket | Male | Female |
| Under 5 Years | 422 (8.4%) | 265 (5.6%) |
| 5 to 9 Years | 302 (6.0%) | 341 (7.2%) |
| 10 to 14 Years | 239 (4.8%) | 186 (3.9%) |
| 15 to 19 Years | 271 (5.4%) | 241 (5.1%) |
| 20 to 24 Years | 485 (9.6%) | 194 (4.1%) |
| 25 to 29 Years | 196 (3.9%) | 465 (9.9%) |
| 30 to 34 Years | 589 (11.7%) | 233 (4.9%) |
| 35 to 39 Years | 390 (7.7%) | 241 (5.1%) |
| 40 to 44 Years | 270 (5.4%) | 329 (7.0%) |
| 45 to 49 Years | 254 (5.0%) | 230 (4.9%) |
| 50 to 54 Years | 253 (5.0%) | 265 (5.6%) |
| 55 to 59 Years | 207 (4.1%) | 312 (6.6%) |
| 60 to 64 Years | 279 (5.5%) | 348 (7.4%) |
| 65 to 69 Years | 293 (5.8%) | 310 (6.6%) |
| 70 to 74 Years | 179 (3.5%) | 255 (5.4%) |
| 75 to 79 Years | 140 (2.8%) | 308 (6.5%) |
| 80 to 84 Years | 219 (4.3%) | 117 (2.5%) |
| 85 Years and over | 48 (0.9%) | 82 (1.7%) |
| Total | 5,036 (100.0%) | 4,722 (100.0%) |
Families and Households in Green Cove Springs
Median Family Size in Green Cove Springs
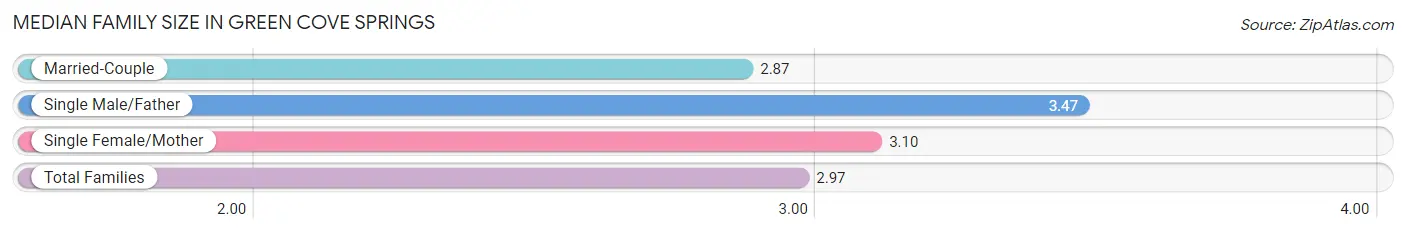
The median family size in Green Cove Springs is 2.97 persons per family, with single male/father families (158 | 6.3%) accounting for the largest median family size of 3.47 persons per family. On the other hand, married-couple families (1,717 | 68.1%) represent the smallest median family size with 2.87 persons per family.
| Family Type | # Families | Family Size |
| Married-Couple | 1,717 (68.1%) | 2.87 |
| Single Male/Father | 158 (6.3%) | 3.47 |
| Single Female/Mother | 647 (25.7%) | 3.10 |
| Total Families | 2,522 (100.0%) | 2.97 |
Median Household Size in Green Cove Springs
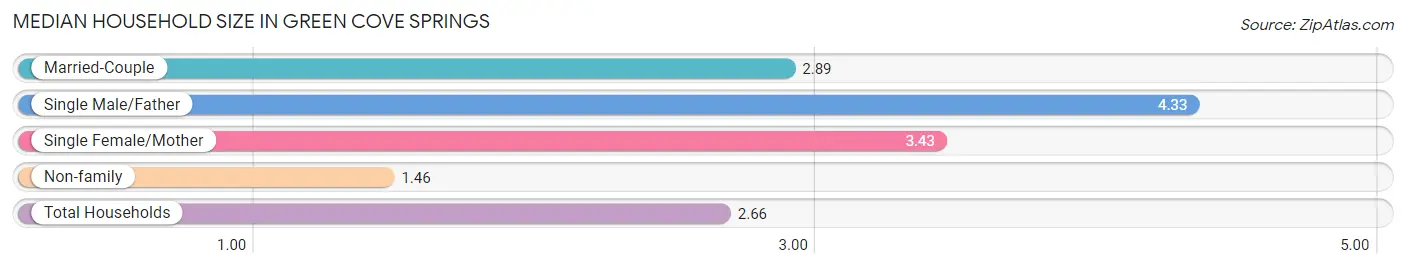
The median household size in Green Cove Springs is 2.66 persons per household, with single male/father households (158 | 4.5%) accounting for the largest median household size of 4.33 persons per household. non-family households (967 | 27.7%) represent the smallest median household size with 1.46 persons per household.
| Household Type | # Households | Household Size |
| Married-Couple | 1,717 (49.2%) | 2.89 |
| Single Male/Father | 158 (4.5%) | 4.33 |
| Single Female/Mother | 647 (18.5%) | 3.43 |
| Non-family | 967 (27.7%) | 1.46 |
| Total Households | 3,489 (100.0%) | 2.66 |
Household Size by Marriage Status in Green Cove Springs
Out of a total of 3,489 households in Green Cove Springs, 2,522 (72.3%) are family households, while 967 (27.7%) are nonfamily households. The most numerous type of family households are 2-person households, comprising 1,178, and the most common type of nonfamily households are 1-person households, comprising 690.
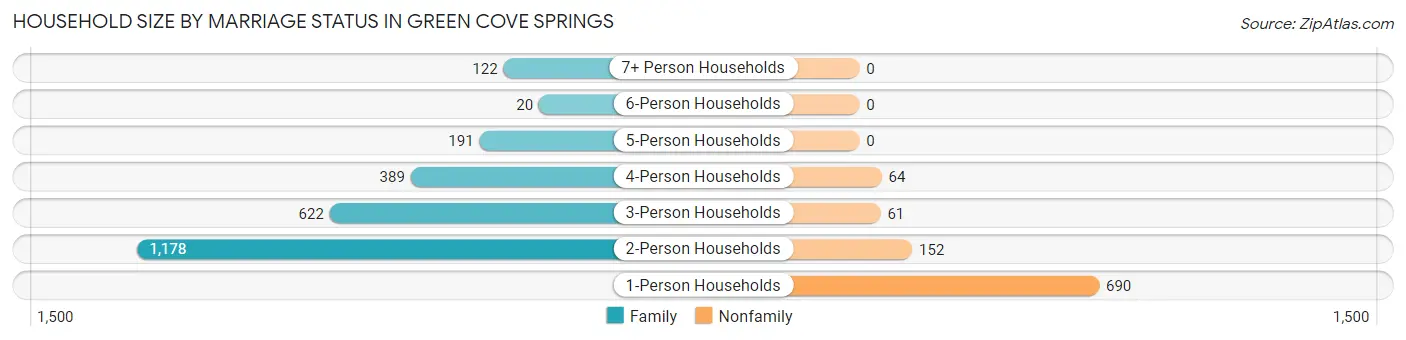
| Household Size | Family Households | Nonfamily Households |
| 1-Person Households | - | 690 (19.8%) |
| 2-Person Households | 1,178 (33.8%) | 152 (4.4%) |
| 3-Person Households | 622 (17.8%) | 61 (1.8%) |
| 4-Person Households | 389 (11.2%) | 64 (1.8%) |
| 5-Person Households | 191 (5.5%) | 0 (0.0%) |
| 6-Person Households | 20 (0.6%) | 0 (0.0%) |
| 7+ Person Households | 122 (3.5%) | 0 (0.0%) |
| Total | 2,522 (72.3%) | 967 (27.7%) |
Female Fertility in Green Cove Springs
Fertility by Age in Green Cove Springs
Average fertility rate in Green Cove Springs is 70.0 births per 1,000 women. Women in the age bracket of 20 to 34 years have the highest fertility rate with 128.0 births per 1,000 women. Women in the age bracket of 20 to 34 years acount for 82.0% of all women with births.
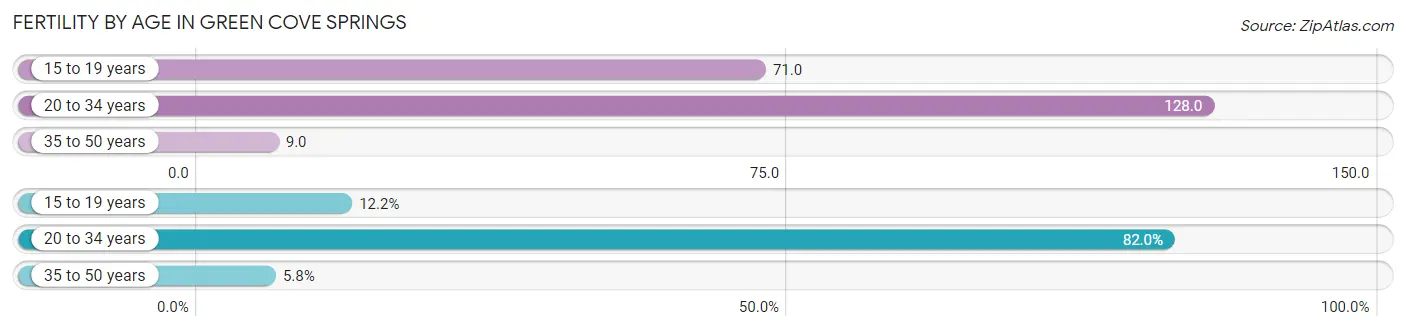
| Age Bracket | Women with Births | Births / 1,000 Women |
| 15 to 19 years | 17 (12.2%) | 71.0 |
| 20 to 34 years | 114 (82.0%) | 128.0 |
| 35 to 50 years | 8 (5.8%) | 9.0 |
| Total | 139 (100.0%) | 70.0 |
Fertility by Age by Marriage Status in Green Cove Springs
40.3% of women with births (139) in Green Cove Springs are married. The highest percentage of unmarried women with births falls into 15 to 19 years age bracket with 100.0% of them unmarried at the time of birth, while the lowest percentage of unmarried women with births belong to 35 to 50 years age bracket with 0.0% of them unmarried.
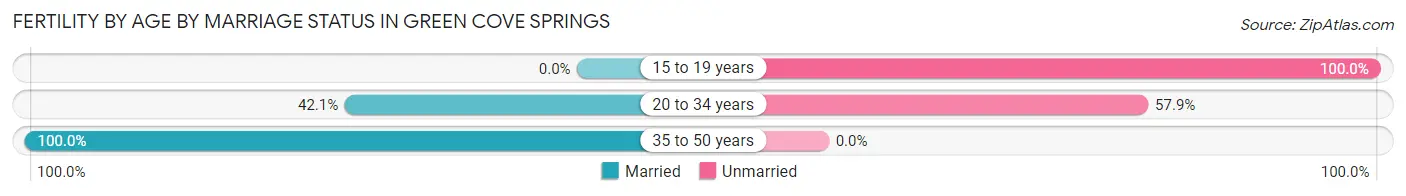
| Age Bracket | Married | Unmarried |
| 15 to 19 years | 0 (0.0%) | 17 (100.0%) |
| 20 to 34 years | 48 (42.1%) | 66 (57.9%) |
| 35 to 50 years | 8 (100.0%) | 0 (0.0%) |
| Total | 56 (40.3%) | 83 (59.7%) |
Fertility by Education in Green Cove Springs
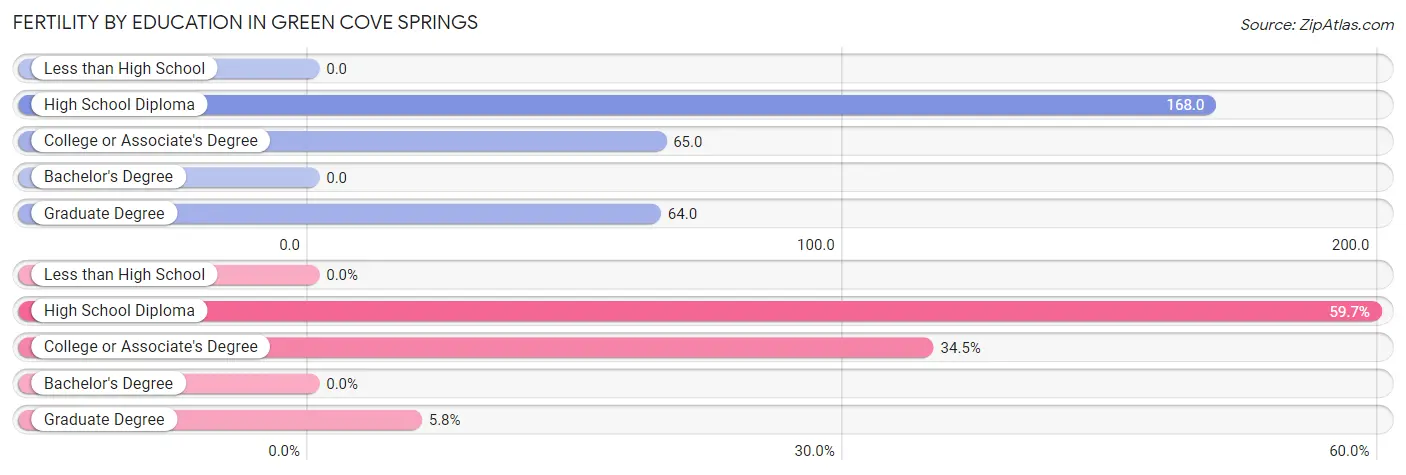
| Educational Attainment | Women with Births | Births / 1,000 Women |
| Less than High School | 0 (0.0%) | 0.0 |
| High School Diploma | 83 (59.7%) | 168.0 |
| College or Associate's Degree | 48 (34.5%) | 65.0 |
| Bachelor's Degree | 0 (0.0%) | 0.0 |
| Graduate Degree | 8 (5.8%) | 64.0 |
| Total | 139 (100.0%) | 70.0 |
Fertility by Education by Marriage Status in Green Cove Springs
59.7% of women with births in Green Cove Springs are unmarried. Women with the educational attainment of college or associate's degree are most likely to be married with 100.0% of them married at childbirth, while women with the educational attainment of high school diploma are least likely to be married with 100.0% of them unmarried at childbirth.
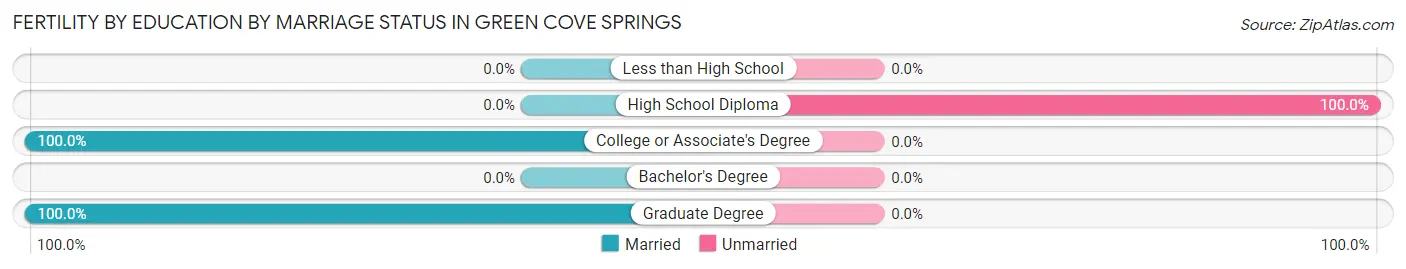
| Educational Attainment | Married | Unmarried |
| Less than High School | 0 (0.0%) | 0 (0.0%) |
| High School Diploma | 0 (0.0%) | 83 (100.0%) |
| College or Associate's Degree | 48 (100.0%) | 0 (0.0%) |
| Bachelor's Degree | 0 (0.0%) | 0 (0.0%) |
| Graduate Degree | 8 (100.0%) | 0 (0.0%) |
| Total | 56 (40.3%) | 83 (59.7%) |
Employment Characteristics in Green Cove Springs
Employment by Class of Employer in Green Cove Springs
Among the 3,890 employed individuals in Green Cove Springs, private company employees (2,610 | 67.1%), local government employees (389 | 10.0%), and self-employed (not incorporated) (277 | 7.1%) make up the most common classes of employment.
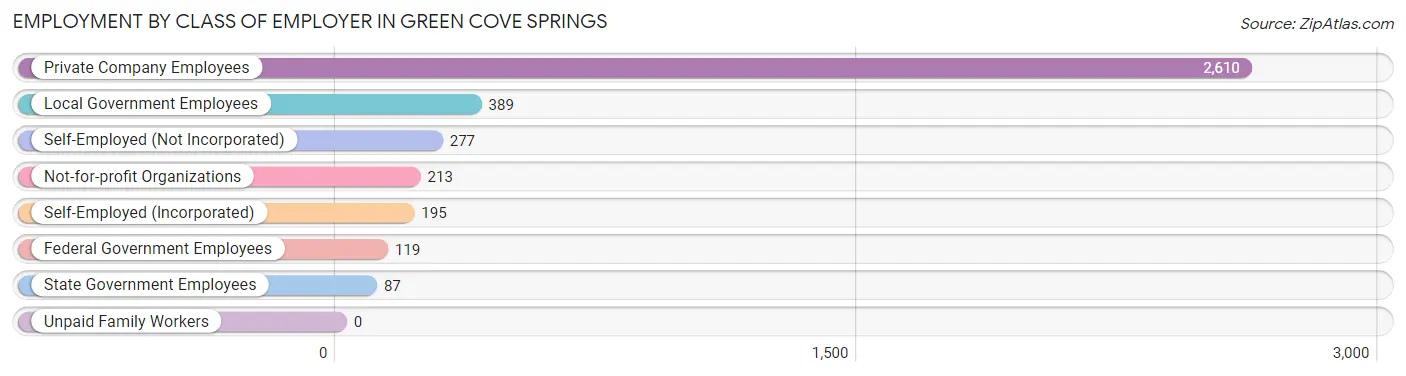
| Employer Class | # Employees | % Employees |
| Private Company Employees | 2,610 | 67.1% |
| Self-Employed (Incorporated) | 195 | 5.0% |
| Self-Employed (Not Incorporated) | 277 | 7.1% |
| Not-for-profit Organizations | 213 | 5.5% |
| Local Government Employees | 389 | 10.0% |
| State Government Employees | 87 | 2.2% |
| Federal Government Employees | 119 | 3.1% |
| Unpaid Family Workers | 0 | 0.0% |
| Total | 3,890 | 100.0% |
Employment Status by Age in Green Cove Springs
According to the labor force statistics for Green Cove Springs, out of the total population over 16 years of age (7,854), 52.7% or 4,139 individuals are in the labor force, with 5.4% or 224 of them unemployed. The age group with the highest labor force participation rate is 30 to 34 years, with 83.2% or 684 individuals in the labor force. Within the labor force, the 25 to 29 years age range has the highest percentage of unemployed individuals, with 13.3% or 66 of them being unemployed.
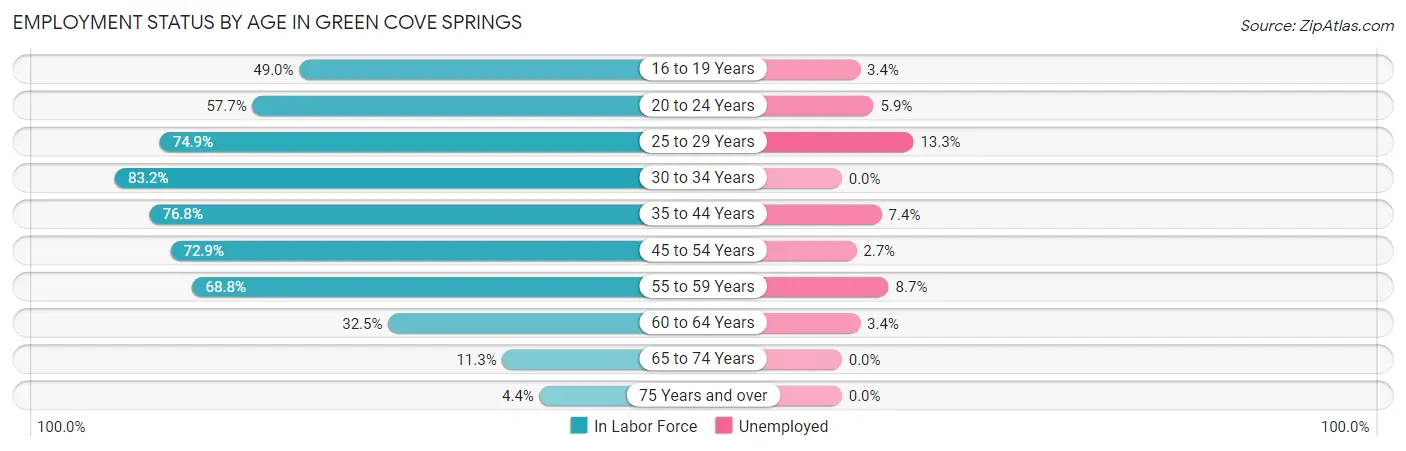
| Age Bracket | In Labor Force | Unemployed |
| 16 to 19 Years | 178 (49.0%) | 6 (3.4%) |
| 20 to 24 Years | 392 (57.7%) | 23 (5.9%) |
| 25 to 29 Years | 495 (74.9%) | 66 (13.3%) |
| 30 to 34 Years | 684 (83.2%) | 0 (0.0%) |
| 35 to 44 Years | 945 (76.8%) | 70 (7.4%) |
| 45 to 54 Years | 730 (72.9%) | 20 (2.7%) |
| 55 to 59 Years | 357 (68.8%) | 31 (8.7%) |
| 60 to 64 Years | 204 (32.5%) | 7 (3.4%) |
| 65 to 74 Years | 117 (11.3%) | 0 (0.0%) |
| 75 Years and over | 40 (4.4%) | 0 (0.0%) |
| Total | 4,139 (52.7%) | 224 (5.4%) |
Employment Status by Educational Attainment in Green Cove Springs
According to labor force statistics for Green Cove Springs, 70.3% of individuals (3,417) out of the total population between 25 and 64 years of age (4,861) are in the labor force, with 5.7% or 195 of them being unemployed. The group with the highest labor force participation rate are those with the educational attainment of bachelor's degree or higher, with 81.1% or 927 individuals in the labor force. Within the labor force, individuals with high school diploma education have the highest percentage of unemployment, with 13.6% or 118 of them being unemployed.
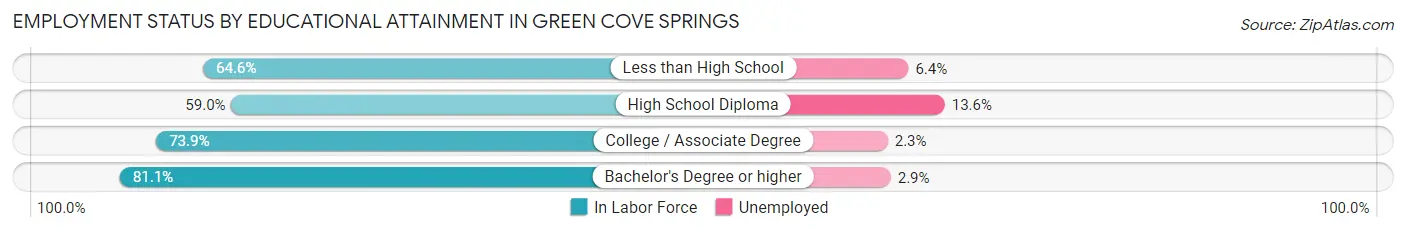
| Educational Attainment | In Labor Force | Unemployed |
| Less than High School | 281 (64.6%) | 28 (6.4%) |
| High School Diploma | 870 (59.0%) | 200 (13.6%) |
| College / Associate Degree | 1,337 (73.9%) | 42 (2.3%) |
| Bachelor's Degree or higher | 927 (81.1%) | 33 (2.9%) |
| Total | 3,417 (70.3%) | 277 (5.7%) |
Employment Occupations by Sex in Green Cove Springs
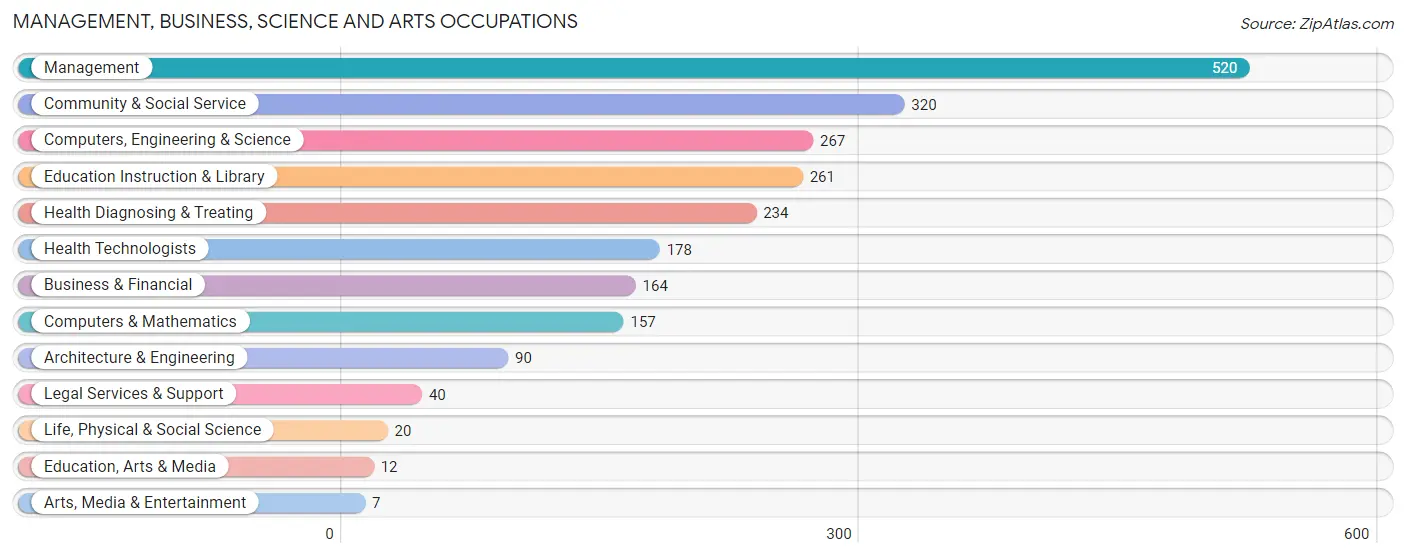
Management, Business, Science and Arts Occupations
The most common Management, Business, Science and Arts occupations in Green Cove Springs are Management (520 | 13.3%), Community & Social Service (320 | 8.2%), Computers, Engineering & Science (267 | 6.8%), Education Instruction & Library (261 | 6.7%), and Health Diagnosing & Treating (234 | 6.0%).
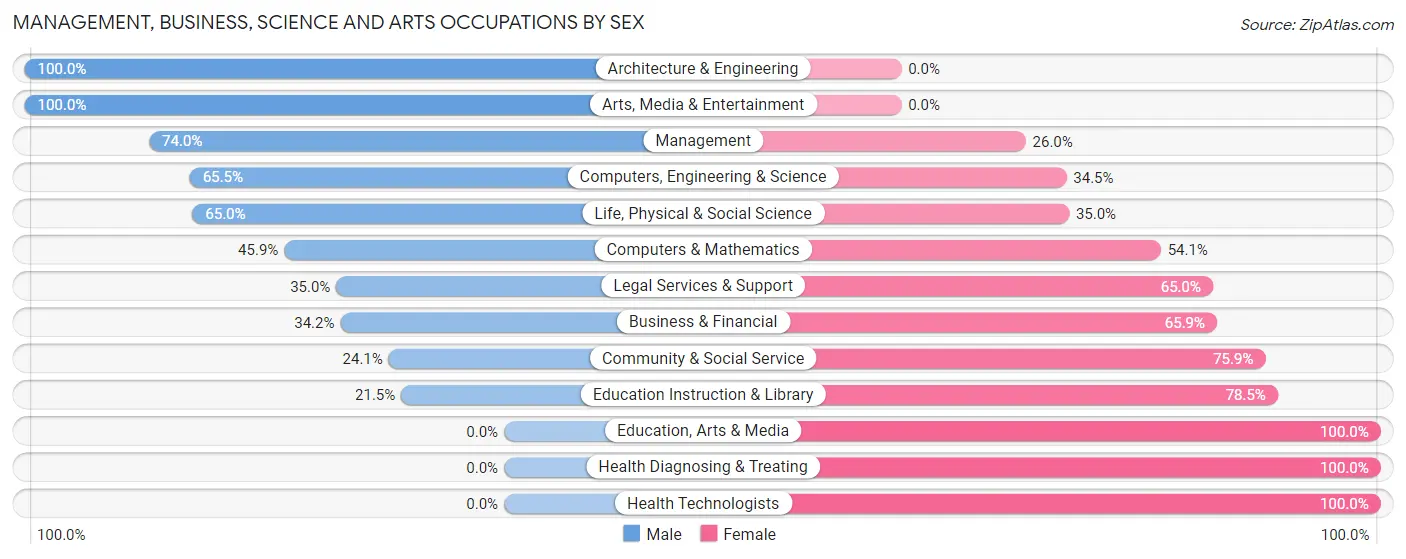
Management, Business, Science and Arts Occupations by Sex
Within the Management, Business, Science and Arts occupations in Green Cove Springs, the most male-oriented occupations are Architecture & Engineering (100.0%), Arts, Media & Entertainment (100.0%), and Management (74.0%), while the most female-oriented occupations are Education, Arts & Media (100.0%), Health Diagnosing & Treating (100.0%), and Health Technologists (100.0%).
| Occupation | Male | Female |
| Management | 385 (74.0%) | 135 (26.0%) |
| Business & Financial | 56 (34.2%) | 108 (65.8%) |
| Computers, Engineering & Science | 175 (65.5%) | 92 (34.5%) |
| Computers & Mathematics | 72 (45.9%) | 85 (54.1%) |
| Architecture & Engineering | 90 (100.0%) | 0 (0.0%) |
| Life, Physical & Social Science | 13 (65.0%) | 7 (35.0%) |
| Community & Social Service | 77 (24.1%) | 243 (75.9%) |
| Education, Arts & Media | 0 (0.0%) | 12 (100.0%) |
| Legal Services & Support | 14 (35.0%) | 26 (65.0%) |
| Education Instruction & Library | 56 (21.5%) | 205 (78.5%) |
| Arts, Media & Entertainment | 7 (100.0%) | 0 (0.0%) |
| Health Diagnosing & Treating | 0 (0.0%) | 234 (100.0%) |
| Health Technologists | 0 (0.0%) | 178 (100.0%) |
| Total (Category) | 693 (46.1%) | 812 (53.9%) |
| Total (Overall) | 2,163 (55.2%) | 1,756 (44.8%) |
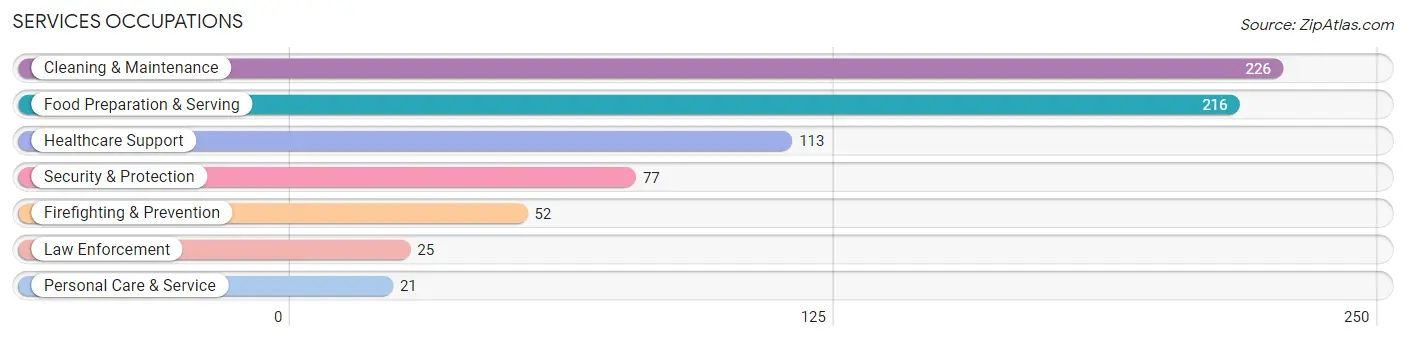
Services Occupations
The most common Services occupations in Green Cove Springs are Cleaning & Maintenance (226 | 5.8%), Food Preparation & Serving (216 | 5.5%), Healthcare Support (113 | 2.9%), Security & Protection (77 | 2.0%), and Firefighting & Prevention (52 | 1.3%).
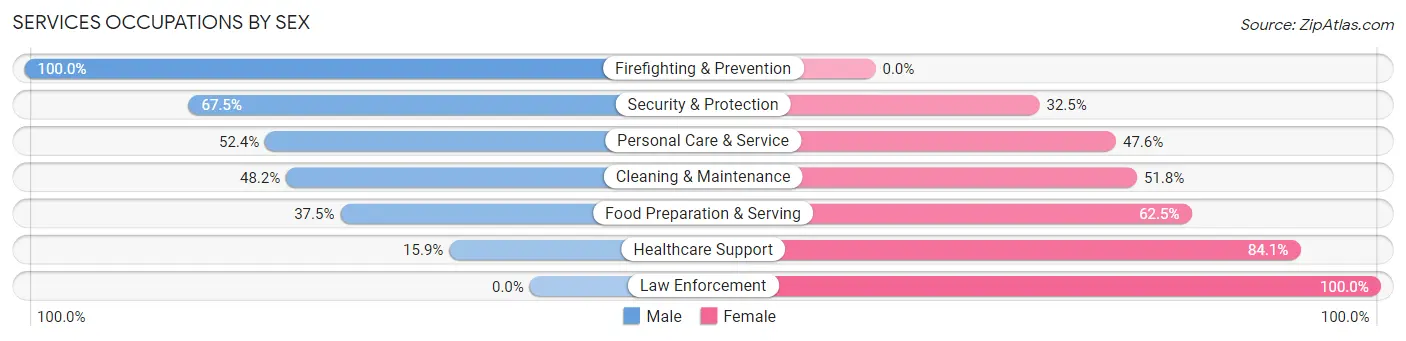
Services Occupations by Sex
Within the Services occupations in Green Cove Springs, the most male-oriented occupations are Firefighting & Prevention (100.0%), Security & Protection (67.5%), and Personal Care & Service (52.4%), while the most female-oriented occupations are Law Enforcement (100.0%), Healthcare Support (84.1%), and Food Preparation & Serving (62.5%).
| Occupation | Male | Female |
| Healthcare Support | 18 (15.9%) | 95 (84.1%) |
| Security & Protection | 52 (67.5%) | 25 (32.5%) |
| Firefighting & Prevention | 52 (100.0%) | 0 (0.0%) |
| Law Enforcement | 0 (0.0%) | 25 (100.0%) |
| Food Preparation & Serving | 81 (37.5%) | 135 (62.5%) |
| Cleaning & Maintenance | 109 (48.2%) | 117 (51.8%) |
| Personal Care & Service | 11 (52.4%) | 10 (47.6%) |
| Total (Category) | 271 (41.5%) | 382 (58.5%) |
| Total (Overall) | 2,163 (55.2%) | 1,756 (44.8%) |
Sales and Office Occupations
The most common Sales and Office occupations in Green Cove Springs are Office & Administration (337 | 8.6%), and Sales & Related (298 | 7.6%).
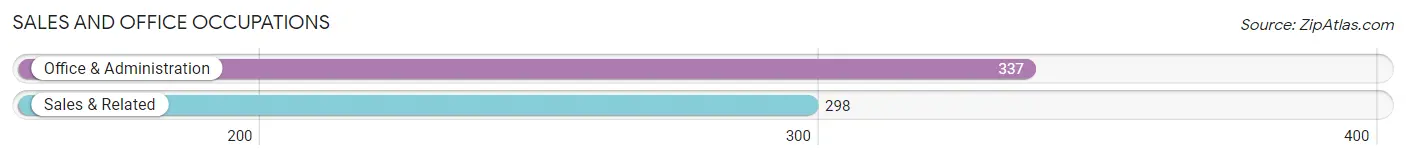
Sales and Office Occupations by Sex
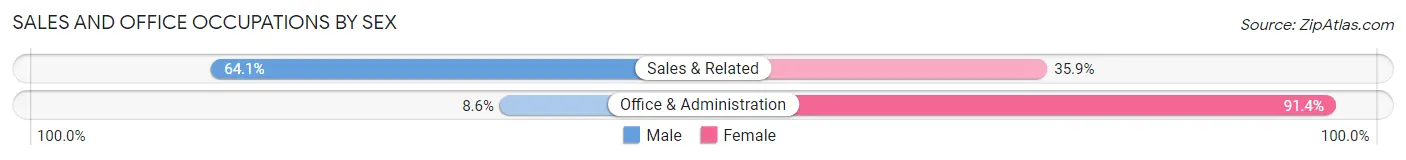
| Occupation | Male | Female |
| Sales & Related | 191 (64.1%) | 107 (35.9%) |
| Office & Administration | 29 (8.6%) | 308 (91.4%) |
| Total (Category) | 220 (34.6%) | 415 (65.3%) |
| Total (Overall) | 2,163 (55.2%) | 1,756 (44.8%) |
Natural Resources, Construction and Maintenance Occupations
The most common Natural Resources, Construction and Maintenance occupations in Green Cove Springs are Construction & Extraction (237 | 6.0%), Installation, Maintenance & Repair (200 | 5.1%), and Farming, Fishing & Forestry (12 | 0.3%).
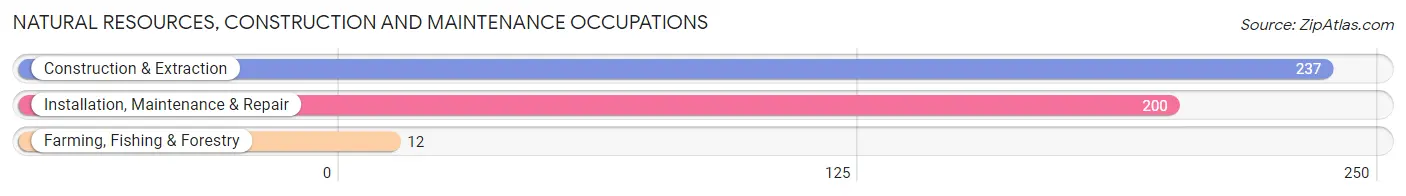
Natural Resources, Construction and Maintenance Occupations by Sex
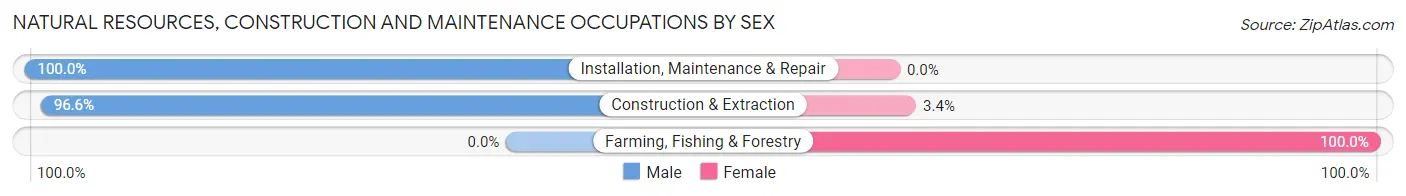
| Occupation | Male | Female |
| Farming, Fishing & Forestry | 0 (0.0%) | 12 (100.0%) |
| Construction & Extraction | 229 (96.6%) | 8 (3.4%) |
| Installation, Maintenance & Repair | 200 (100.0%) | 0 (0.0%) |
| Total (Category) | 429 (95.6%) | 20 (4.4%) |
| Total (Overall) | 2,163 (55.2%) | 1,756 (44.8%) |
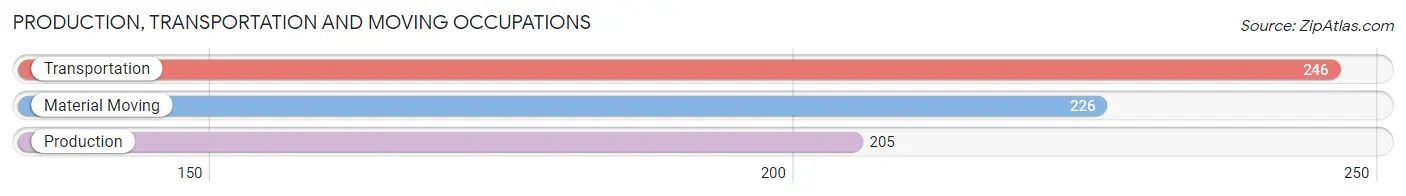
Production, Transportation and Moving Occupations
The most common Production, Transportation and Moving occupations in Green Cove Springs are Transportation (246 | 6.3%), Material Moving (226 | 5.8%), and Production (205 | 5.2%).
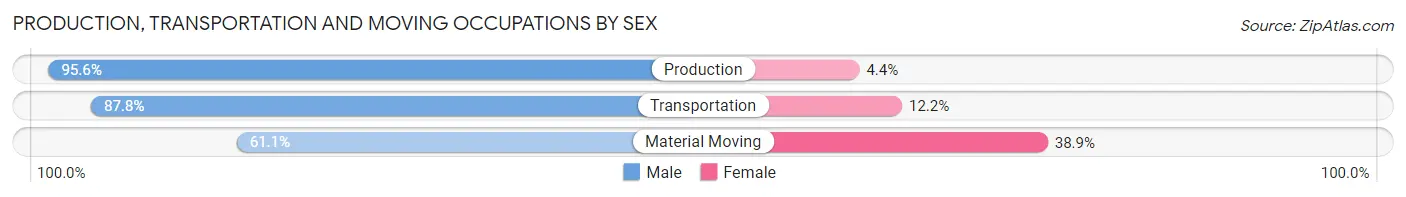
Production, Transportation and Moving Occupations by Sex
| Occupation | Male | Female |
| Production | 196 (95.6%) | 9 (4.4%) |
| Transportation | 216 (87.8%) | 30 (12.2%) |
| Material Moving | 138 (61.1%) | 88 (38.9%) |
| Total (Category) | 550 (81.2%) | 127 (18.8%) |
| Total (Overall) | 2,163 (55.2%) | 1,756 (44.8%) |
Employment Industries by Sex in Green Cove Springs
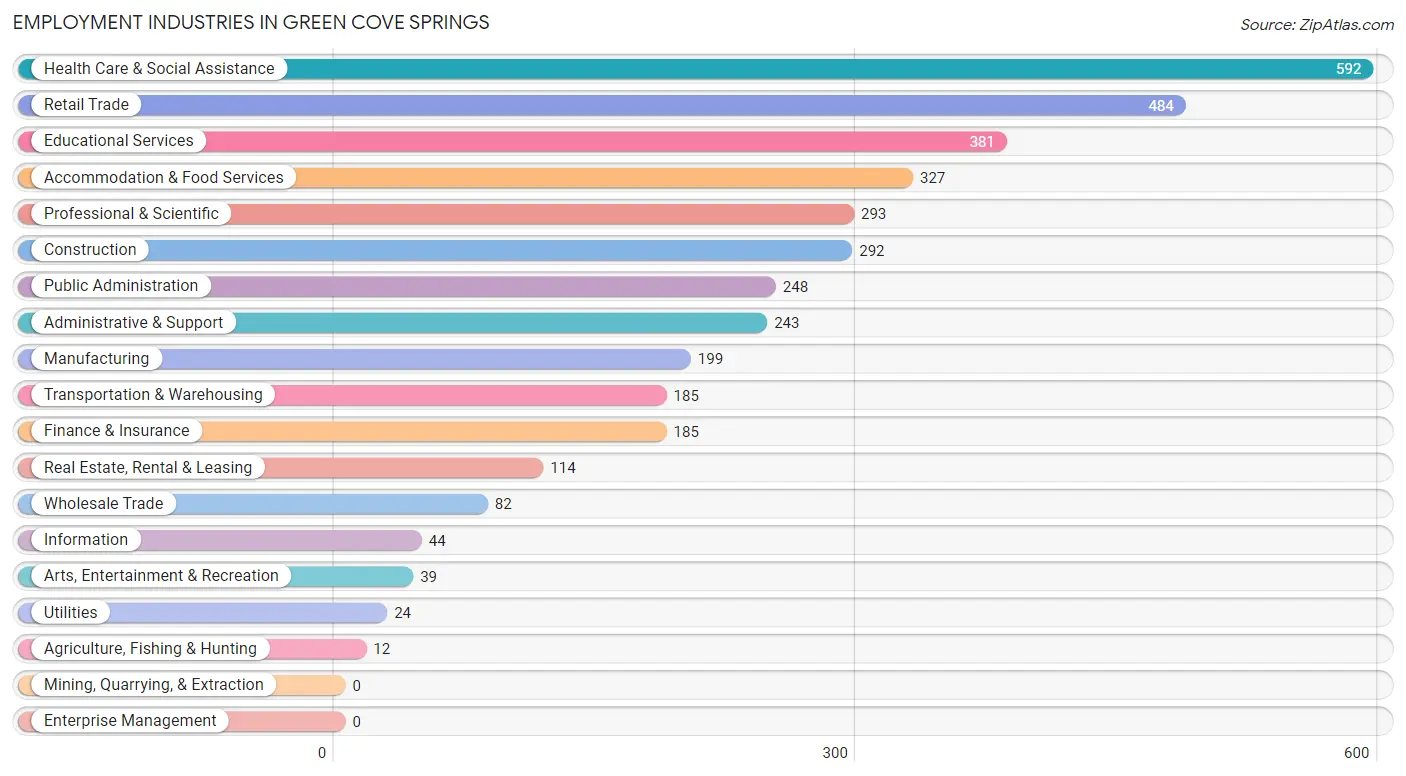
Employment Industries in Green Cove Springs
The major employment industries in Green Cove Springs include Health Care & Social Assistance (592 | 15.1%), Retail Trade (484 | 12.3%), Educational Services (381 | 9.7%), Accommodation & Food Services (327 | 8.3%), and Professional & Scientific (293 | 7.5%).
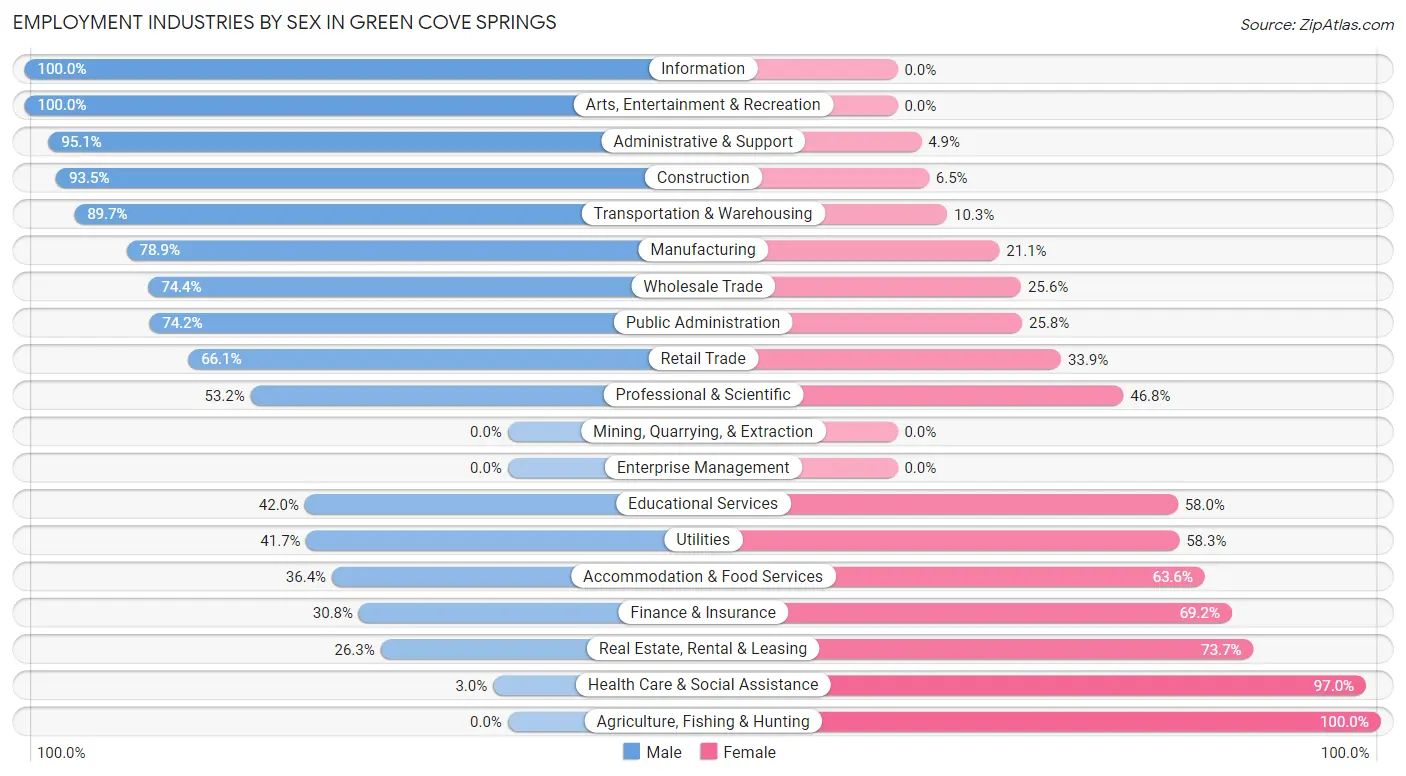
Employment Industries by Sex in Green Cove Springs
The Green Cove Springs industries that see more men than women are Information (100.0%), Arts, Entertainment & Recreation (100.0%), and Administrative & Support (95.1%), whereas the industries that tend to have a higher number of women are Agriculture, Fishing & Hunting (100.0%), Health Care & Social Assistance (97.0%), and Real Estate, Rental & Leasing (73.7%).
| Industry | Male | Female |
| Agriculture, Fishing & Hunting | 0 (0.0%) | 12 (100.0%) |
| Mining, Quarrying, & Extraction | 0 (0.0%) | 0 (0.0%) |
| Construction | 273 (93.5%) | 19 (6.5%) |
| Manufacturing | 157 (78.9%) | 42 (21.1%) |
| Wholesale Trade | 61 (74.4%) | 21 (25.6%) |
| Retail Trade | 320 (66.1%) | 164 (33.9%) |
| Transportation & Warehousing | 166 (89.7%) | 19 (10.3%) |
| Utilities | 10 (41.7%) | 14 (58.3%) |
| Information | 44 (100.0%) | 0 (0.0%) |
| Finance & Insurance | 57 (30.8%) | 128 (69.2%) |
| Real Estate, Rental & Leasing | 30 (26.3%) | 84 (73.7%) |
| Professional & Scientific | 156 (53.2%) | 137 (46.8%) |
| Enterprise Management | 0 (0.0%) | 0 (0.0%) |
| Administrative & Support | 231 (95.1%) | 12 (4.9%) |
| Educational Services | 160 (42.0%) | 221 (58.0%) |
| Health Care & Social Assistance | 18 (3.0%) | 574 (97.0%) |
| Arts, Entertainment & Recreation | 39 (100.0%) | 0 (0.0%) |
| Accommodation & Food Services | 119 (36.4%) | 208 (63.6%) |
| Public Administration | 184 (74.2%) | 64 (25.8%) |
| Total | 2,163 (55.2%) | 1,756 (44.8%) |
Education in Green Cove Springs
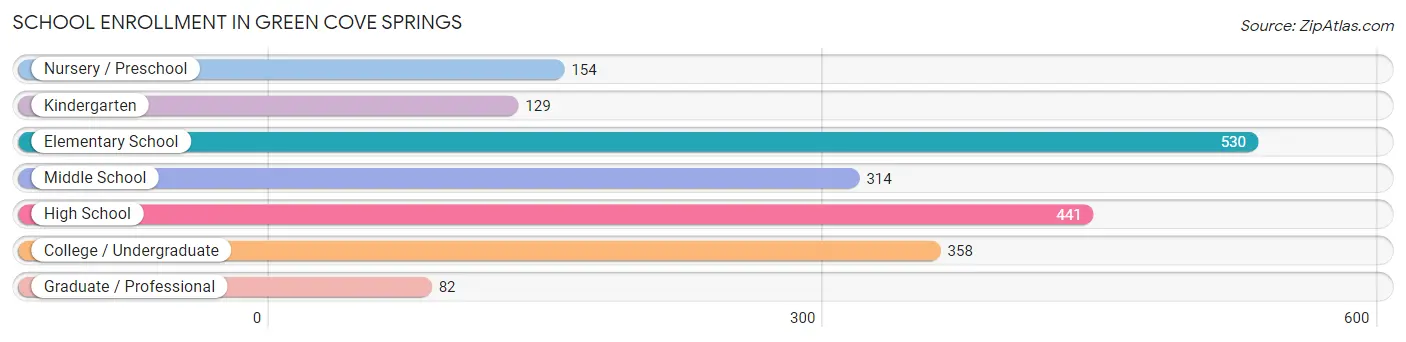
School Enrollment in Green Cove Springs
The most common levels of schooling among the 2,008 students in Green Cove Springs are elementary school (530 | 26.4%), high school (441 | 22.0%), and college / undergraduate (358 | 17.8%).
| School Level | # Students | % Students |
| Nursery / Preschool | 154 | 7.7% |
| Kindergarten | 129 | 6.4% |
| Elementary School | 530 | 26.4% |
| Middle School | 314 | 15.6% |
| High School | 441 | 22.0% |
| College / Undergraduate | 358 | 17.8% |
| Graduate / Professional | 82 | 4.1% |
| Total | 2,008 | 100.0% |
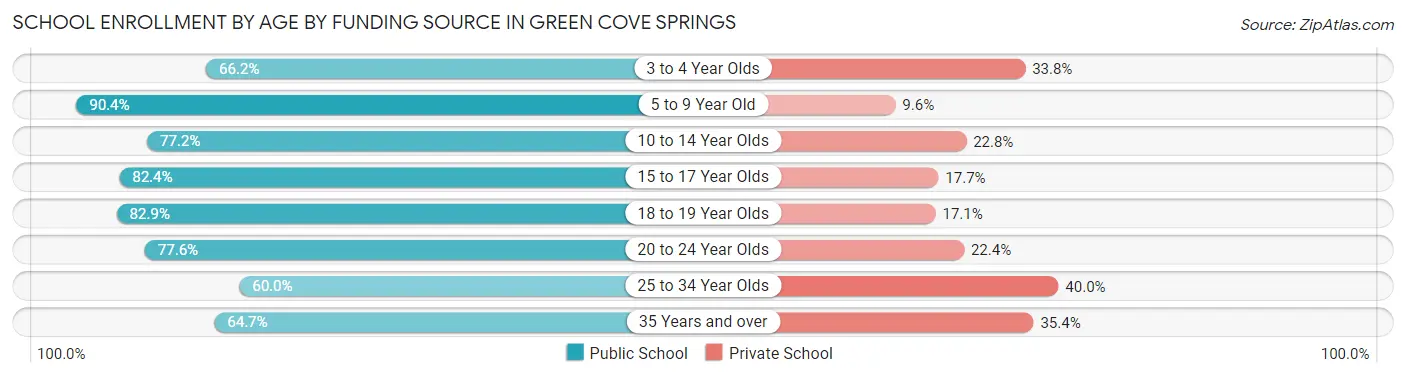
School Enrollment by Age by Funding Source in Green Cove Springs
Out of a total of 2,008 students who are enrolled in schools in Green Cove Springs, 420 (20.9%) attend a private institution, while the remaining 1,588 (79.1%) are enrolled in public schools. The age group of 25 to 34 year olds has the highest likelihood of being enrolled in private schools, with 88 (40.0% in the age bracket) enrolled. Conversely, the age group of 5 to 9 year old has the lowest likelihood of being enrolled in a private school, with 581 (90.4% in the age bracket) attending a public institution.
| Age Bracket | Public School | Private School |
| 3 to 4 Year Olds | 92 (66.2%) | 47 (33.8%) |
| 5 to 9 Year Old | 581 (90.4%) | 62 (9.6%) |
| 10 to 14 Year Olds | 328 (77.2%) | 97 (22.8%) |
| 15 to 17 Year Olds | 210 (82.4%) | 45 (17.6%) |
| 18 to 19 Year Olds | 92 (82.9%) | 19 (17.1%) |
| 20 to 24 Year Olds | 90 (77.6%) | 26 (22.4%) |
| 25 to 34 Year Olds | 132 (60.0%) | 88 (40.0%) |
| 35 Years and over | 64 (64.6%) | 35 (35.3%) |
| Total | 1,588 (79.1%) | 420 (20.9%) |
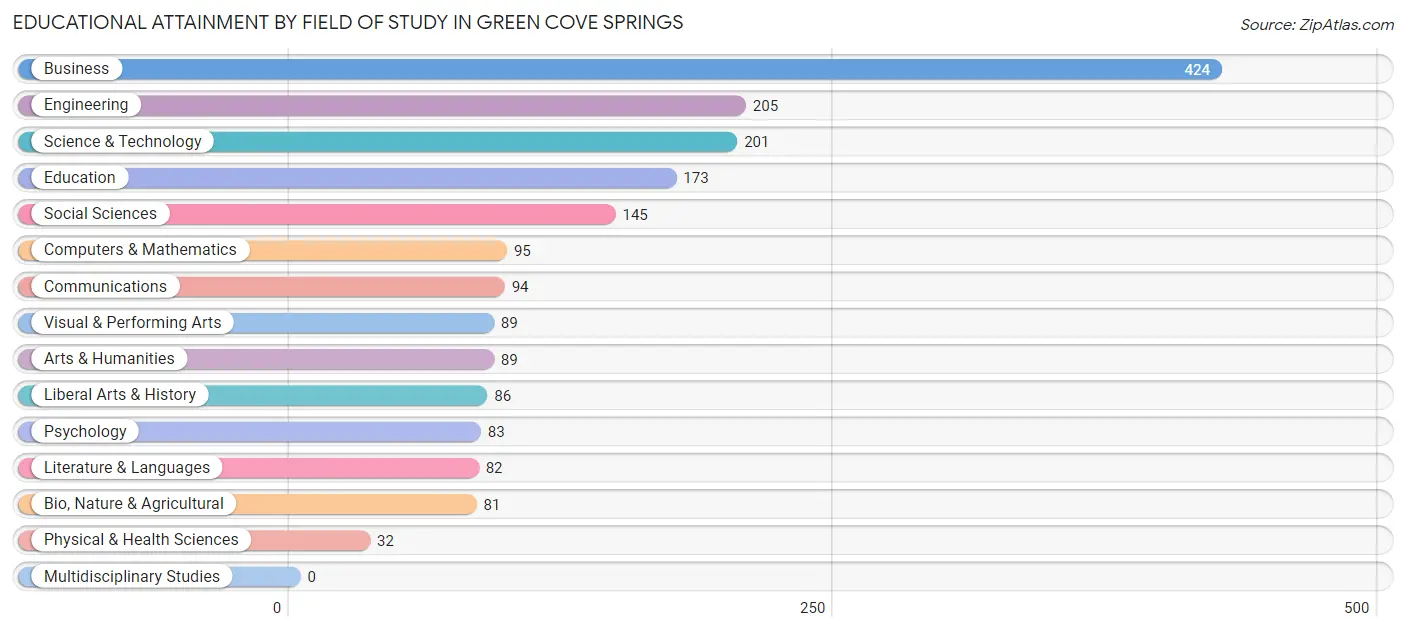
Educational Attainment by Field of Study in Green Cove Springs
Business (424 | 22.6%), engineering (205 | 10.9%), science & technology (201 | 10.7%), education (173 | 9.2%), and social sciences (145 | 7.7%) are the most common fields of study among 1,879 individuals in Green Cove Springs who have obtained a bachelor's degree or higher.
| Field of Study | # Graduates | % Graduates |
| Computers & Mathematics | 95 | 5.1% |
| Bio, Nature & Agricultural | 81 | 4.3% |
| Physical & Health Sciences | 32 | 1.7% |
| Psychology | 83 | 4.4% |
| Social Sciences | 145 | 7.7% |
| Engineering | 205 | 10.9% |
| Multidisciplinary Studies | 0 | 0.0% |
| Science & Technology | 201 | 10.7% |
| Business | 424 | 22.6% |
| Education | 173 | 9.2% |
| Literature & Languages | 82 | 4.4% |
| Liberal Arts & History | 86 | 4.6% |
| Visual & Performing Arts | 89 | 4.7% |
| Communications | 94 | 5.0% |
| Arts & Humanities | 89 | 4.7% |
| Total | 1,879 | 100.0% |
Transportation & Commute in Green Cove Springs
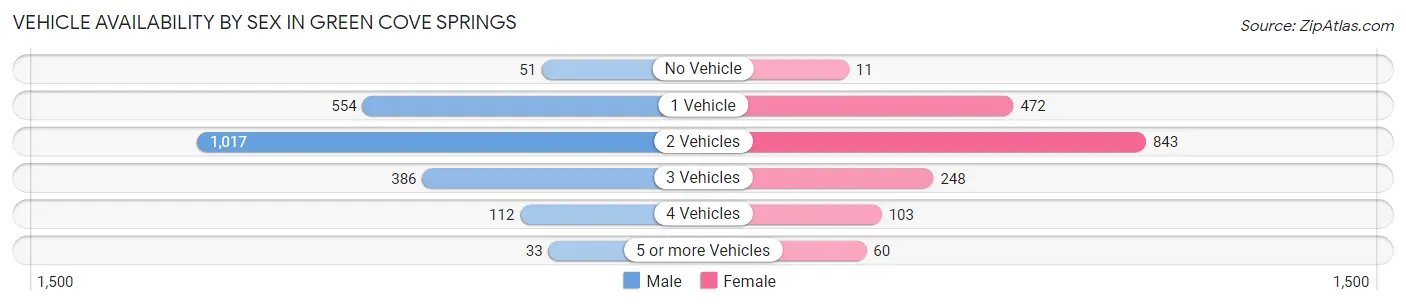
Vehicle Availability by Sex in Green Cove Springs
The most prevalent vehicle ownership categories in Green Cove Springs are males with 2 vehicles (1,017, accounting for 47.2%) and females with 2 vehicles (843, making up 58.6%).
| Vehicles Available | Male | Female |
| No Vehicle | 51 (2.4%) | 11 (0.6%) |
| 1 Vehicle | 554 (25.7%) | 472 (27.2%) |
| 2 Vehicles | 1,017 (47.2%) | 843 (48.5%) |
| 3 Vehicles | 386 (17.9%) | 248 (14.3%) |
| 4 Vehicles | 112 (5.2%) | 103 (5.9%) |
| 5 or more Vehicles | 33 (1.5%) | 60 (3.5%) |
| Total | 2,153 (100.0%) | 1,737 (100.0%) |
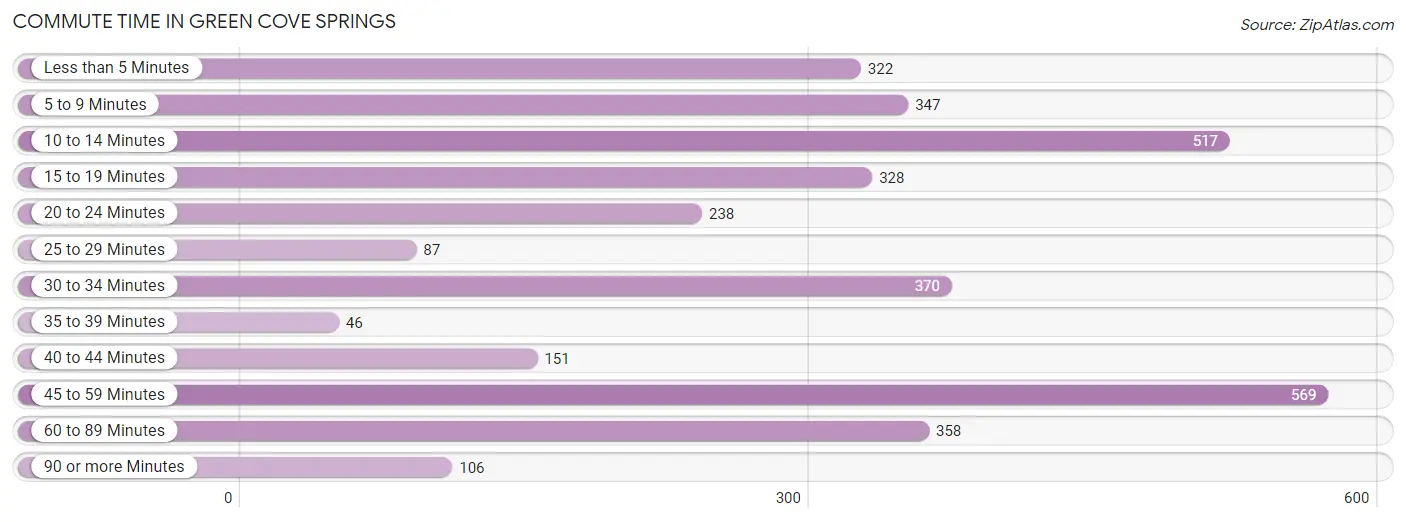
Commute Time in Green Cove Springs
The most frequently occuring commute durations in Green Cove Springs are 45 to 59 minutes (569 commuters, 16.6%), 10 to 14 minutes (517 commuters, 15.0%), and 30 to 34 minutes (370 commuters, 10.8%).
| Commute Time | # Commuters | % Commuters |
| Less than 5 Minutes | 322 | 9.4% |
| 5 to 9 Minutes | 347 | 10.1% |
| 10 to 14 Minutes | 517 | 15.0% |
| 15 to 19 Minutes | 328 | 9.5% |
| 20 to 24 Minutes | 238 | 6.9% |
| 25 to 29 Minutes | 87 | 2.5% |
| 30 to 34 Minutes | 370 | 10.8% |
| 35 to 39 Minutes | 46 | 1.3% |
| 40 to 44 Minutes | 151 | 4.4% |
| 45 to 59 Minutes | 569 | 16.6% |
| 60 to 89 Minutes | 358 | 10.4% |
| 90 or more Minutes | 106 | 3.1% |
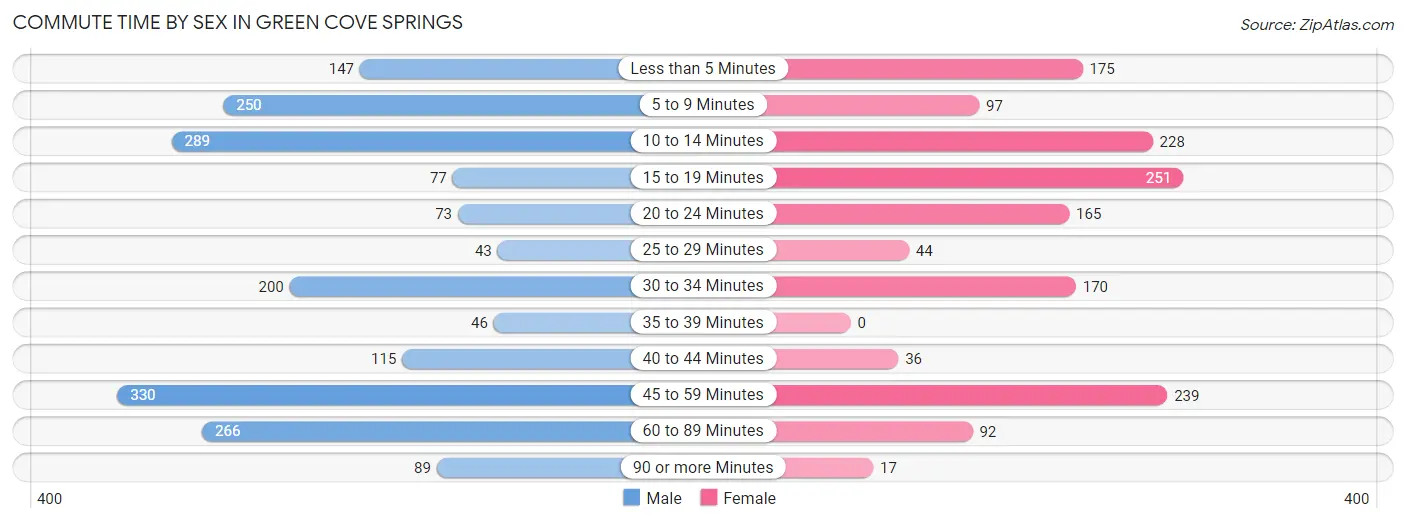
Commute Time by Sex in Green Cove Springs
The most common commute times in Green Cove Springs are 45 to 59 minutes (330 commuters, 17.1%) for males and 15 to 19 minutes (251 commuters, 16.6%) for females.
| Commute Time | Male | Female |
| Less than 5 Minutes | 147 (7.6%) | 175 (11.6%) |
| 5 to 9 Minutes | 250 (13.0%) | 97 (6.4%) |
| 10 to 14 Minutes | 289 (15.0%) | 228 (15.1%) |
| 15 to 19 Minutes | 77 (4.0%) | 251 (16.6%) |
| 20 to 24 Minutes | 73 (3.8%) | 165 (10.9%) |
| 25 to 29 Minutes | 43 (2.2%) | 44 (2.9%) |
| 30 to 34 Minutes | 200 (10.4%) | 170 (11.2%) |
| 35 to 39 Minutes | 46 (2.4%) | 0 (0.0%) |
| 40 to 44 Minutes | 115 (6.0%) | 36 (2.4%) |
| 45 to 59 Minutes | 330 (17.1%) | 239 (15.8%) |
| 60 to 89 Minutes | 266 (13.8%) | 92 (6.1%) |
| 90 or more Minutes | 89 (4.6%) | 17 (1.1%) |
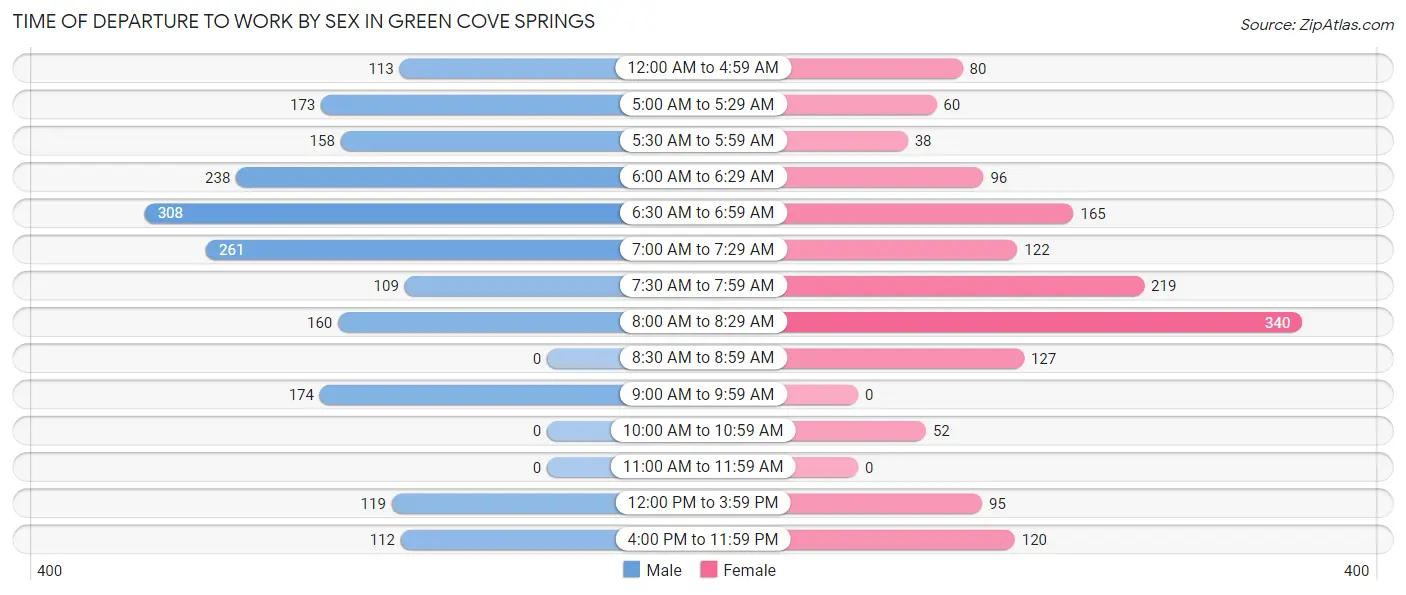
Time of Departure to Work by Sex in Green Cove Springs
The most frequent times of departure to work in Green Cove Springs are 6:30 AM to 6:59 AM (308, 16.0%) for males and 8:00 AM to 8:29 AM (340, 22.5%) for females.
| Time of Departure | Male | Female |
| 12:00 AM to 4:59 AM | 113 (5.9%) | 80 (5.3%) |
| 5:00 AM to 5:29 AM | 173 (9.0%) | 60 (4.0%) |
| 5:30 AM to 5:59 AM | 158 (8.2%) | 38 (2.5%) |
| 6:00 AM to 6:29 AM | 238 (12.4%) | 96 (6.3%) |
| 6:30 AM to 6:59 AM | 308 (16.0%) | 165 (10.9%) |
| 7:00 AM to 7:29 AM | 261 (13.6%) | 122 (8.1%) |
| 7:30 AM to 7:59 AM | 109 (5.7%) | 219 (14.5%) |
| 8:00 AM to 8:29 AM | 160 (8.3%) | 340 (22.5%) |
| 8:30 AM to 8:59 AM | 0 (0.0%) | 127 (8.4%) |
| 9:00 AM to 9:59 AM | 174 (9.0%) | 0 (0.0%) |
| 10:00 AM to 10:59 AM | 0 (0.0%) | 52 (3.4%) |
| 11:00 AM to 11:59 AM | 0 (0.0%) | 0 (0.0%) |
| 12:00 PM to 3:59 PM | 119 (6.2%) | 95 (6.3%) |
| 4:00 PM to 11:59 PM | 112 (5.8%) | 120 (7.9%) |
| Total | 1,925 (100.0%) | 1,514 (100.0%) |
Housing Occupancy in Green Cove Springs
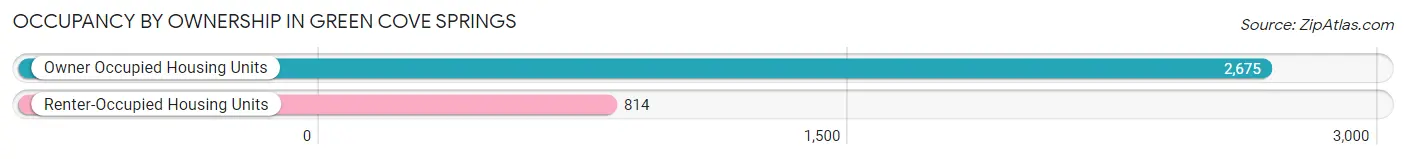
Occupancy by Ownership in Green Cove Springs
Of the total 3,489 dwellings in Green Cove Springs, owner-occupied units account for 2,675 (76.7%), while renter-occupied units make up 814 (23.3%).
| Occupancy | # Housing Units | % Housing Units |
| Owner Occupied Housing Units | 2,675 | 76.7% |
| Renter-Occupied Housing Units | 814 | 23.3% |
| Total Occupied Housing Units | 3,489 | 100.0% |
Occupancy by Household Size in Green Cove Springs
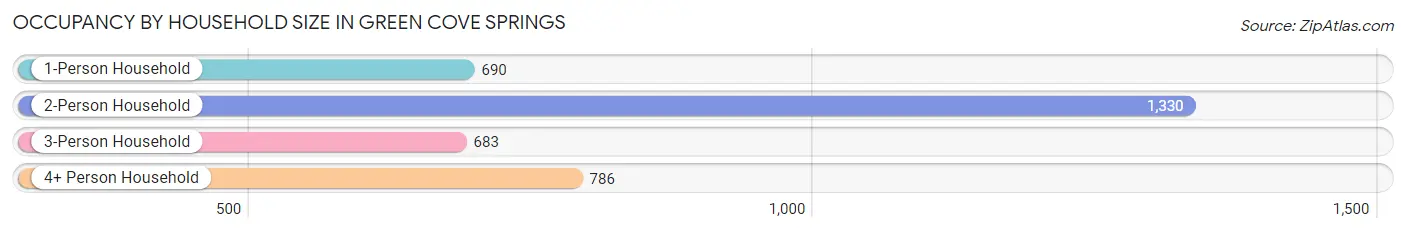
| Household Size | # Housing Units | % Housing Units |
| 1-Person Household | 690 | 19.8% |
| 2-Person Household | 1,330 | 38.1% |
| 3-Person Household | 683 | 19.6% |
| 4+ Person Household | 786 | 22.5% |
| Total Housing Units | 3,489 | 100.0% |
Occupancy by Ownership by Household Size in Green Cove Springs
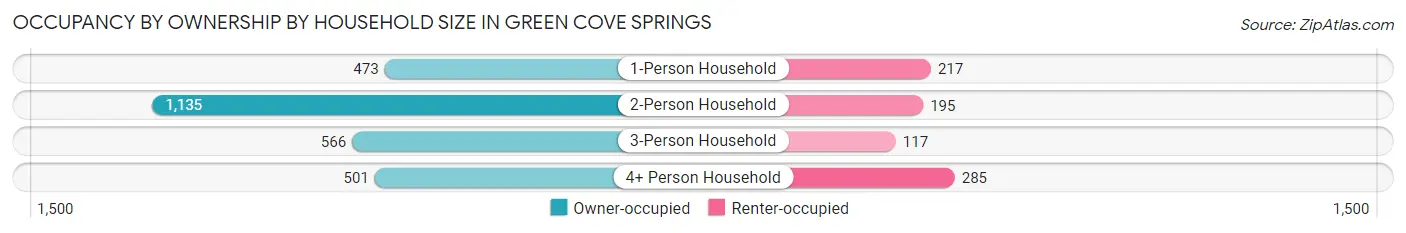
| Household Size | Owner-occupied | Renter-occupied |
| 1-Person Household | 473 (68.5%) | 217 (31.5%) |
| 2-Person Household | 1,135 (85.3%) | 195 (14.7%) |
| 3-Person Household | 566 (82.9%) | 117 (17.1%) |
| 4+ Person Household | 501 (63.7%) | 285 (36.3%) |
| Total Housing Units | 2,675 (76.7%) | 814 (23.3%) |
Occupancy by Educational Attainment in Green Cove Springs
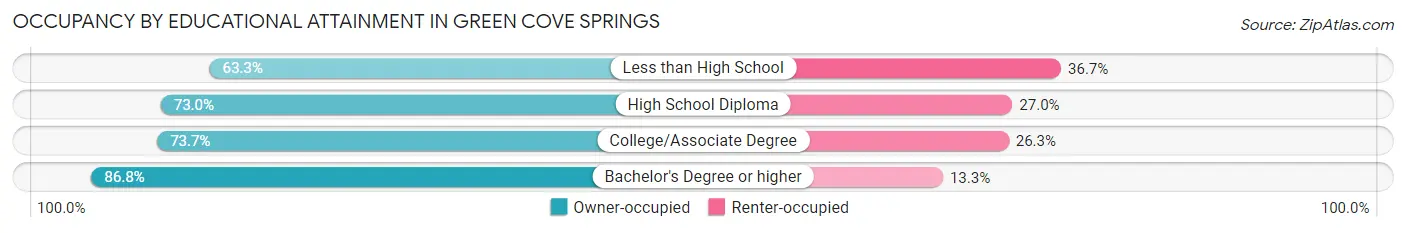
| Household Size | Owner-occupied | Renter-occupied |
| Less than High School | 133 (63.3%) | 77 (36.7%) |
| High School Diploma | 662 (73.0%) | 245 (27.0%) |
| College/Associate Degree | 1,003 (73.7%) | 358 (26.3%) |
| Bachelor's Degree or higher | 877 (86.8%) | 134 (13.3%) |
Occupancy by Age of Householder in Green Cove Springs
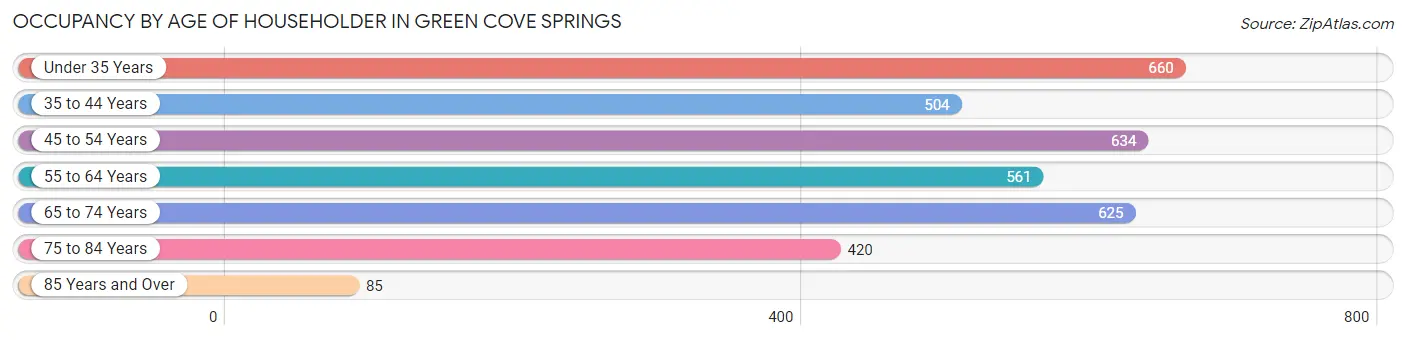
| Age Bracket | # Households | % Households |
| Under 35 Years | 660 | 18.9% |
| 35 to 44 Years | 504 | 14.4% |
| 45 to 54 Years | 634 | 18.2% |
| 55 to 64 Years | 561 | 16.1% |
| 65 to 74 Years | 625 | 17.9% |
| 75 to 84 Years | 420 | 12.0% |
| 85 Years and Over | 85 | 2.4% |
| Total | 3,489 | 100.0% |
Housing Finances in Green Cove Springs
Median Income by Occupancy in Green Cove Springs
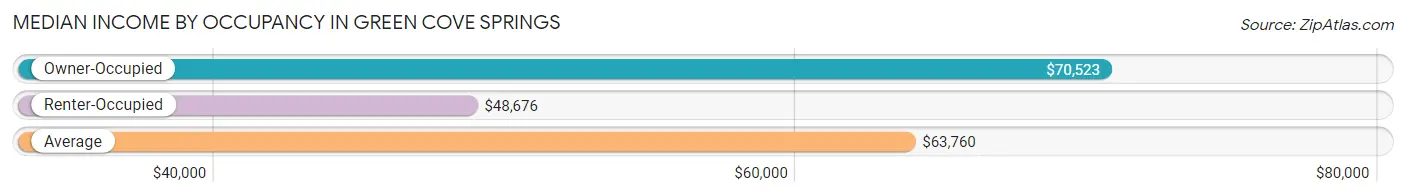
| Occupancy Type | # Households | Median Income |
| Owner-Occupied | 2,675 (76.7%) | $70,523 |
| Renter-Occupied | 814 (23.3%) | $48,676 |
| Average | 3,489 (100.0%) | $63,760 |
Occupancy by Householder Income Bracket in Green Cove Springs
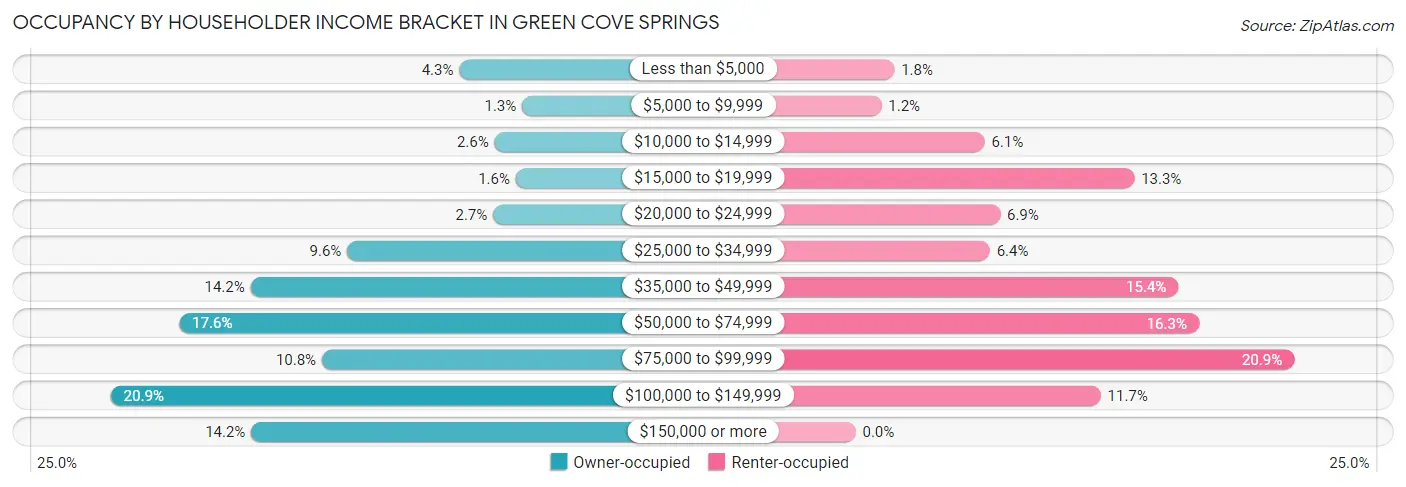
| Income Bracket | Owner-occupied | Renter-occupied |
| Less than $5,000 | 115 (4.3%) | 15 (1.8%) |
| $5,000 to $9,999 | 35 (1.3%) | 10 (1.2%) |
| $10,000 to $14,999 | 70 (2.6%) | 50 (6.1%) |
| $15,000 to $19,999 | 43 (1.6%) | 108 (13.3%) |
| $20,000 to $24,999 | 72 (2.7%) | 56 (6.9%) |
| $25,000 to $34,999 | 258 (9.6%) | 52 (6.4%) |
| $35,000 to $49,999 | 381 (14.2%) | 125 (15.4%) |
| $50,000 to $74,999 | 472 (17.6%) | 133 (16.3%) |
| $75,000 to $99,999 | 290 (10.8%) | 170 (20.9%) |
| $100,000 to $149,999 | 559 (20.9%) | 95 (11.7%) |
| $150,000 or more | 380 (14.2%) | 0 (0.0%) |
| Total | 2,675 (100.0%) | 814 (100.0%) |
Monthly Housing Cost Tiers in Green Cove Springs
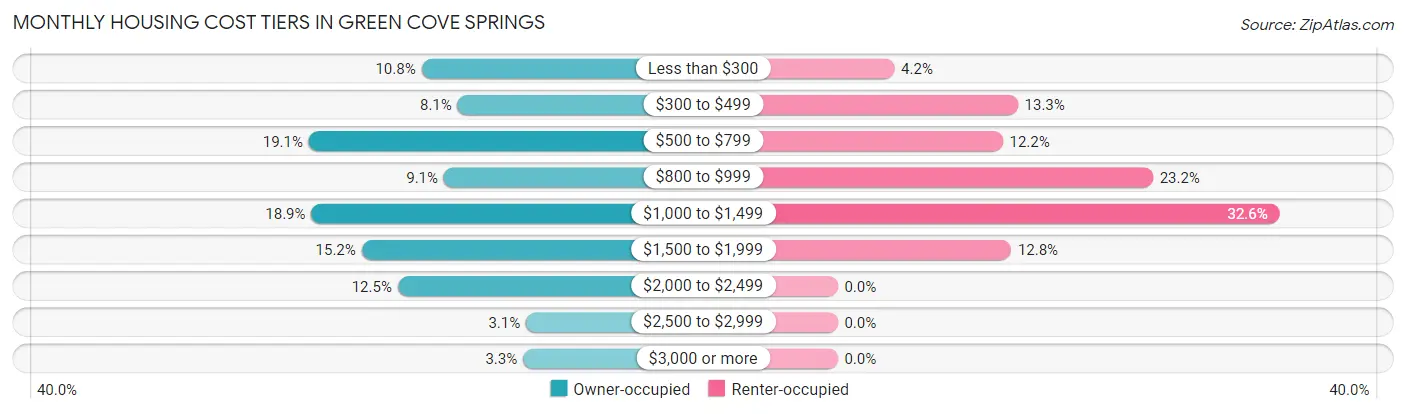
| Monthly Cost | Owner-occupied | Renter-occupied |
| Less than $300 | 288 (10.8%) | 34 (4.2%) |
| $300 to $499 | 217 (8.1%) | 108 (13.3%) |
| $500 to $799 | 510 (19.1%) | 99 (12.2%) |
| $800 to $999 | 244 (9.1%) | 189 (23.2%) |
| $1,000 to $1,499 | 505 (18.9%) | 265 (32.6%) |
| $1,500 to $1,999 | 406 (15.2%) | 104 (12.8%) |
| $2,000 to $2,499 | 335 (12.5%) | 0 (0.0%) |
| $2,500 to $2,999 | 82 (3.1%) | 0 (0.0%) |
| $3,000 or more | 88 (3.3%) | 0 (0.0%) |
| Total | 2,675 (100.0%) | 814 (100.0%) |
Physical Housing Characteristics in Green Cove Springs
Housing Structures in Green Cove Springs
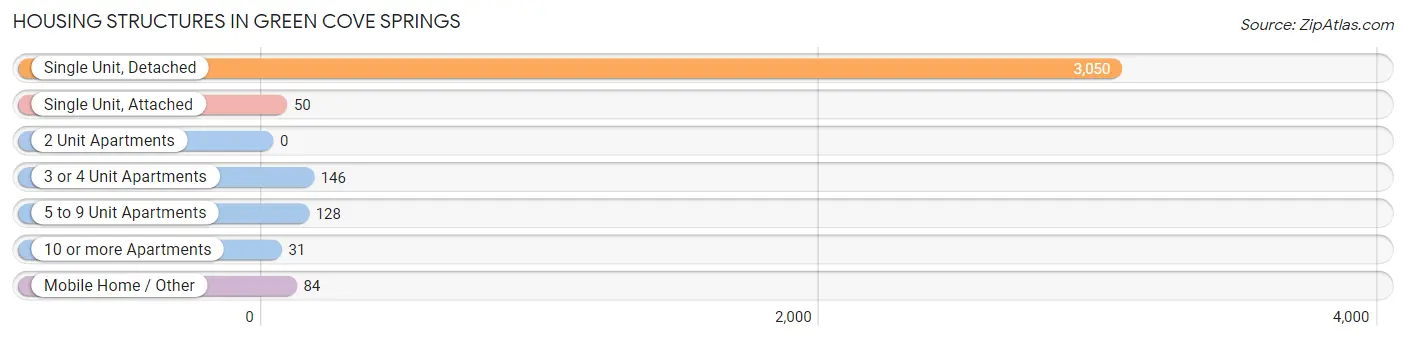
| Structure Type | # Housing Units | % Housing Units |
| Single Unit, Detached | 3,050 | 87.4% |
| Single Unit, Attached | 50 | 1.4% |
| 2 Unit Apartments | 0 | 0.0% |
| 3 or 4 Unit Apartments | 146 | 4.2% |
| 5 to 9 Unit Apartments | 128 | 3.7% |
| 10 or more Apartments | 31 | 0.9% |
| Mobile Home / Other | 84 | 2.4% |
| Total | 3,489 | 100.0% |
Housing Structures by Occupancy in Green Cove Springs
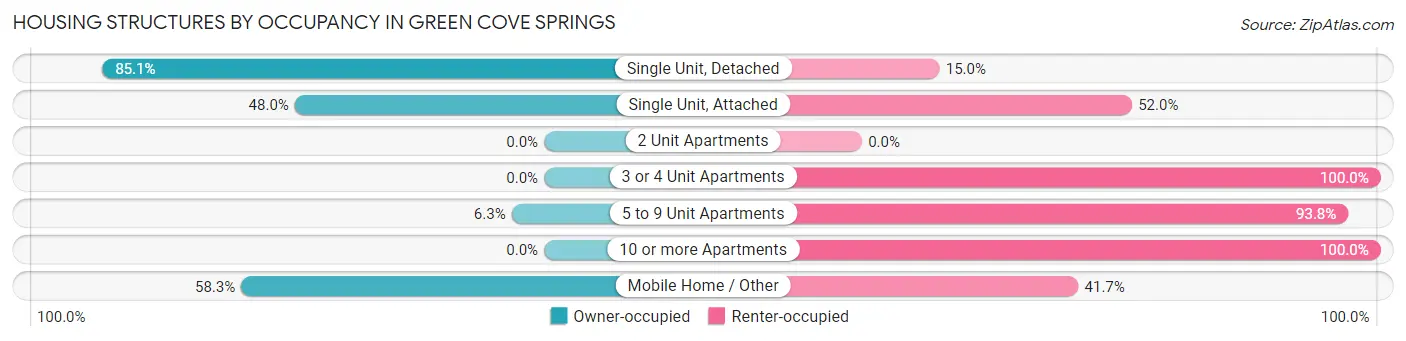
| Structure Type | Owner-occupied | Renter-occupied |
| Single Unit, Detached | 2,594 (85.1%) | 456 (14.9%) |
| Single Unit, Attached | 24 (48.0%) | 26 (52.0%) |
| 2 Unit Apartments | 0 (0.0%) | 0 (0.0%) |
| 3 or 4 Unit Apartments | 0 (0.0%) | 146 (100.0%) |
| 5 to 9 Unit Apartments | 8 (6.2%) | 120 (93.8%) |
| 10 or more Apartments | 0 (0.0%) | 31 (100.0%) |
| Mobile Home / Other | 49 (58.3%) | 35 (41.7%) |
| Total | 2,675 (76.7%) | 814 (23.3%) |
Housing Structures by Number of Rooms in Green Cove Springs
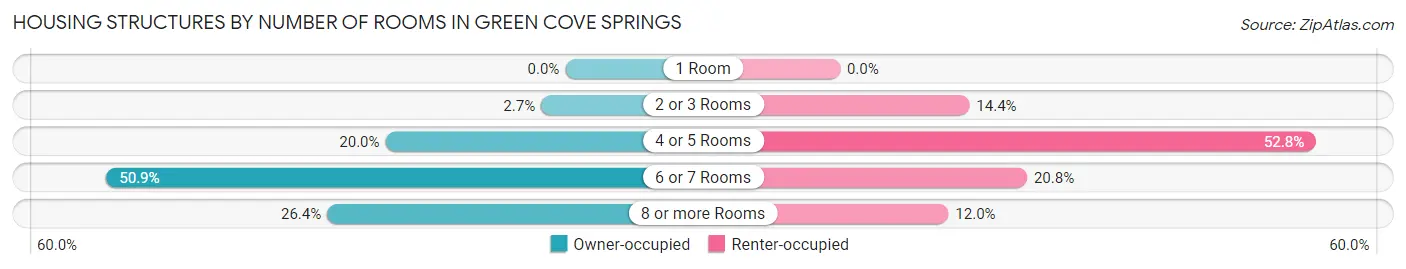
| Number of Rooms | Owner-occupied | Renter-occupied |
| 1 Room | 0 (0.0%) | 0 (0.0%) |
| 2 or 3 Rooms | 72 (2.7%) | 117 (14.4%) |
| 4 or 5 Rooms | 534 (20.0%) | 430 (52.8%) |
| 6 or 7 Rooms | 1,362 (50.9%) | 169 (20.8%) |
| 8 or more Rooms | 707 (26.4%) | 98 (12.0%) |
| Total | 2,675 (100.0%) | 814 (100.0%) |
Housing Structure by Heating Type in Green Cove Springs
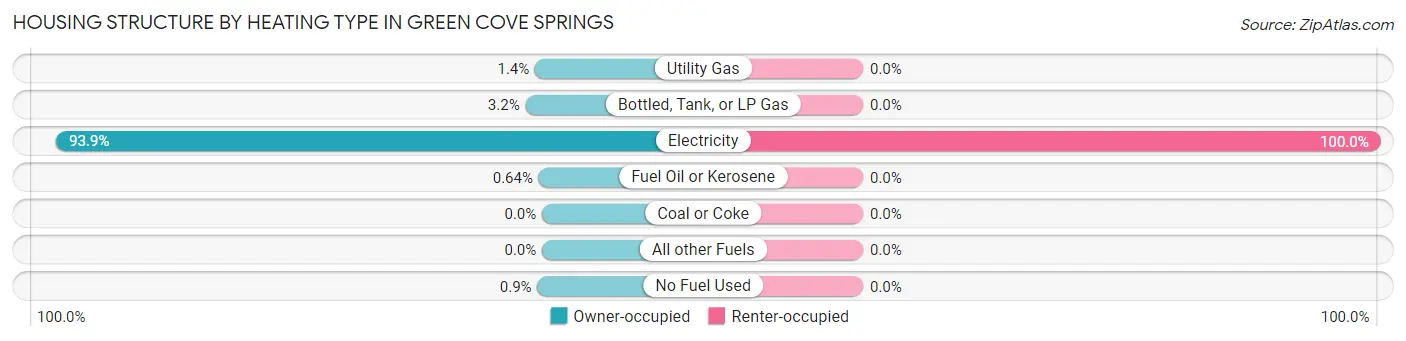
| Heating Type | Owner-occupied | Renter-occupied |
| Utility Gas | 36 (1.3%) | 0 (0.0%) |
| Bottled, Tank, or LP Gas | 86 (3.2%) | 0 (0.0%) |
| Electricity | 2,512 (93.9%) | 814 (100.0%) |
| Fuel Oil or Kerosene | 17 (0.6%) | 0 (0.0%) |
| Coal or Coke | 0 (0.0%) | 0 (0.0%) |
| All other Fuels | 0 (0.0%) | 0 (0.0%) |
| No Fuel Used | 24 (0.9%) | 0 (0.0%) |
| Total | 2,675 (100.0%) | 814 (100.0%) |
Household Vehicle Usage in Green Cove Springs
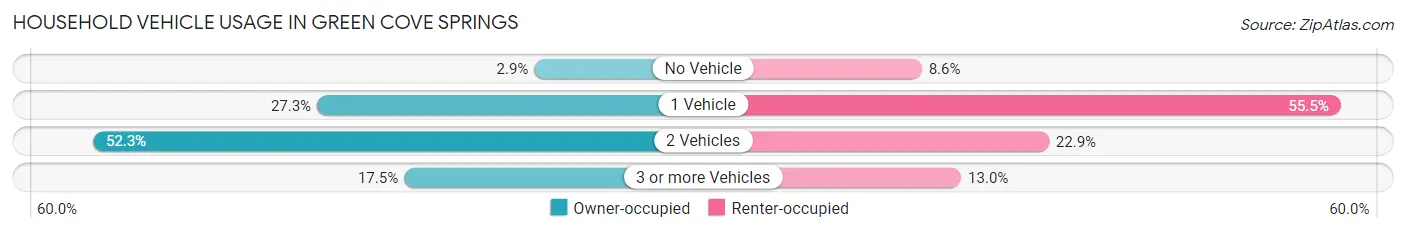
| Vehicles per Household | Owner-occupied | Renter-occupied |
| No Vehicle | 78 (2.9%) | 70 (8.6%) |
| 1 Vehicle | 729 (27.3%) | 452 (55.5%) |
| 2 Vehicles | 1,400 (52.3%) | 186 (22.9%) |
| 3 or more Vehicles | 468 (17.5%) | 106 (13.0%) |
| Total | 2,675 (100.0%) | 814 (100.0%) |
Real Estate & Mortgages in Green Cove Springs
Real Estate and Mortgage Overview in Green Cove Springs
| Characteristic | Without Mortgage | With Mortgage |
| Housing Units | 943 | 1,732 |
| Median Property Value | $220,200 | $235,500 |
| Median Household Income | $43,491 | $289 |
| Monthly Housing Costs | $484 | $88 |
| Real Estate Taxes | $1,598 | $132 |
Property Value by Mortgage Status in Green Cove Springs
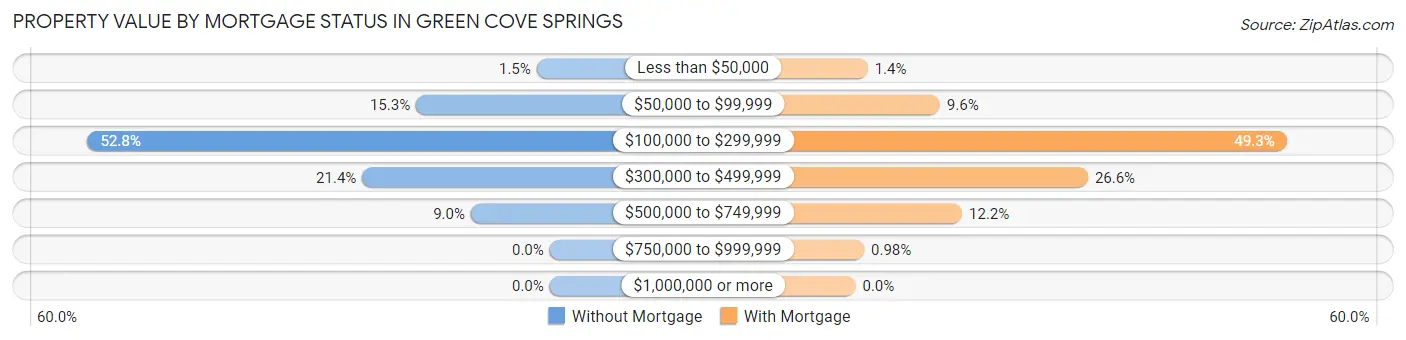
| Property Value | Without Mortgage | With Mortgage |
| Less than $50,000 | 14 (1.5%) | 24 (1.4%) |
| $50,000 to $99,999 | 144 (15.3%) | 167 (9.6%) |
| $100,000 to $299,999 | 498 (52.8%) | 853 (49.2%) |
| $300,000 to $499,999 | 202 (21.4%) | 460 (26.6%) |
| $500,000 to $749,999 | 85 (9.0%) | 211 (12.2%) |
| $750,000 to $999,999 | 0 (0.0%) | 17 (1.0%) |
| $1,000,000 or more | 0 (0.0%) | 0 (0.0%) |
| Total | 943 (100.0%) | 1,732 (100.0%) |
Household Income by Mortgage Status in Green Cove Springs
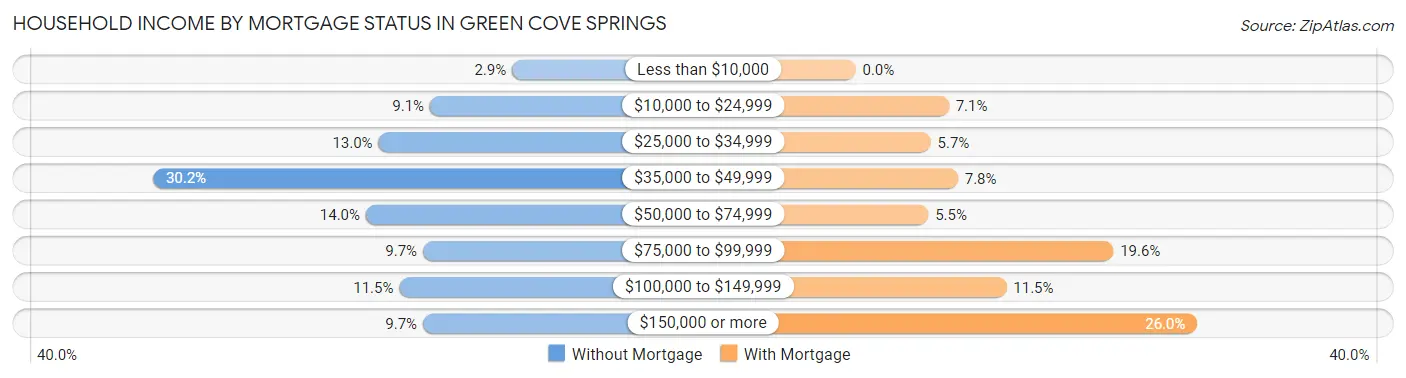
| Household Income | Without Mortgage | With Mortgage |
| Less than $10,000 | 27 (2.9%) | 0 (0.0%) |
| $10,000 to $24,999 | 86 (9.1%) | 123 (7.1%) |
| $25,000 to $34,999 | 123 (13.0%) | 99 (5.7%) |
| $35,000 to $49,999 | 285 (30.2%) | 135 (7.8%) |
| $50,000 to $74,999 | 132 (14.0%) | 96 (5.5%) |
| $75,000 to $99,999 | 91 (9.7%) | 340 (19.6%) |
| $100,000 to $149,999 | 108 (11.5%) | 199 (11.5%) |
| $150,000 or more | 91 (9.7%) | 451 (26.0%) |
| Total | 943 (100.0%) | 1,732 (100.0%) |
Property Value to Household Income Ratio in Green Cove Springs
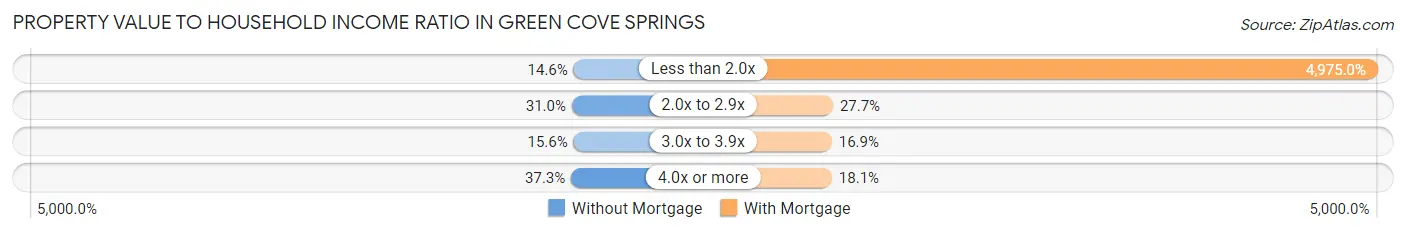
| Value-to-Income Ratio | Without Mortgage | With Mortgage |
| Less than 2.0x | 138 (14.6%) | 86,167 (4,975.0%) |
| 2.0x to 2.9x | 292 (31.0%) | 479 (27.7%) |
| 3.0x to 3.9x | 147 (15.6%) | 293 (16.9%) |
| 4.0x or more | 352 (37.3%) | 314 (18.1%) |
| Total | 943 (100.0%) | 1,732 (100.0%) |
Real Estate Taxes by Mortgage Status in Green Cove Springs
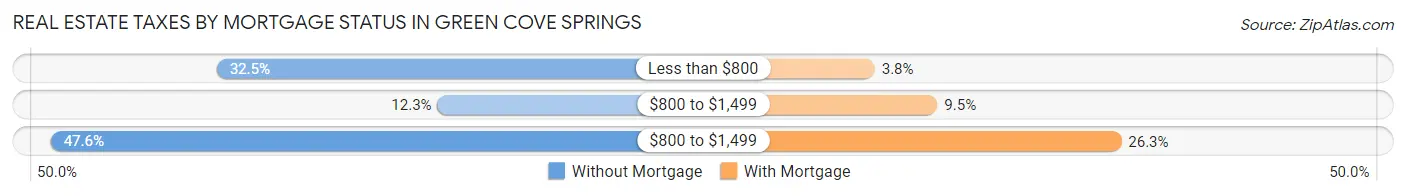
| Property Taxes | Without Mortgage | With Mortgage |
| Less than $800 | 306 (32.5%) | 66 (3.8%) |
| $800 to $1,499 | 116 (12.3%) | 165 (9.5%) |
| $800 to $1,499 | 449 (47.6%) | 456 (26.3%) |
| Total | 943 (100.0%) | 1,732 (100.0%) |
Health & Disability in Green Cove Springs
Health Insurance Coverage by Age in Green Cove Springs
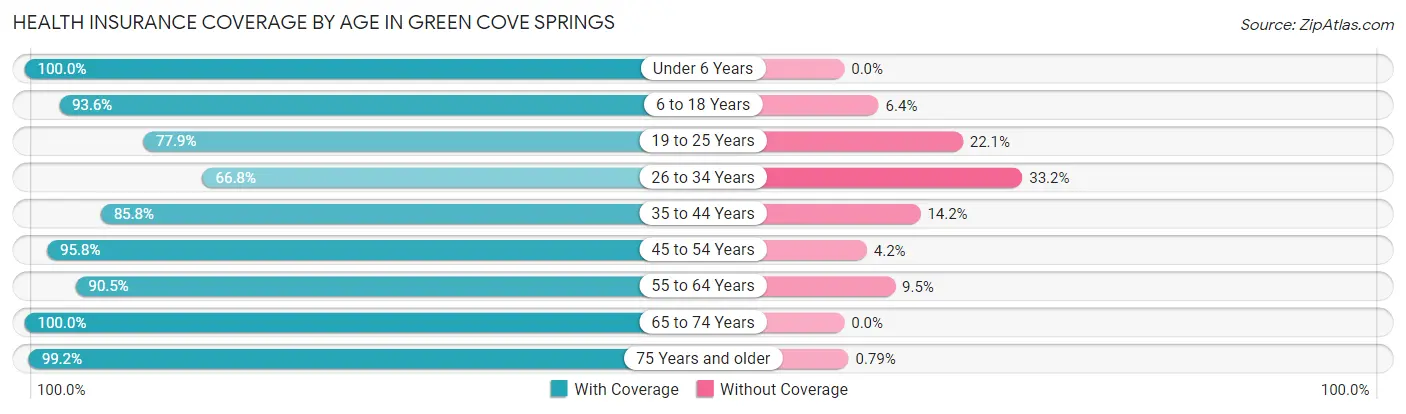
| Age Bracket | With Coverage | Without Coverage |
| Under 6 Years | 750 (100.0%) | 0 (0.0%) |
| 6 to 18 Years | 1,329 (93.6%) | 91 (6.4%) |
| 19 to 25 Years | 649 (77.9%) | 184 (22.1%) |
| 26 to 34 Years | 847 (66.8%) | 421 (33.2%) |
| 35 to 44 Years | 961 (85.8%) | 159 (14.2%) |
| 45 to 54 Years | 865 (95.8%) | 38 (4.2%) |
| 55 to 64 Years | 993 (90.5%) | 104 (9.5%) |
| 65 to 74 Years | 1,008 (100.0%) | 0 (0.0%) |
| 75 Years and older | 876 (99.2%) | 7 (0.8%) |
| Total | 8,278 (89.2%) | 1,004 (10.8%) |
Health Insurance Coverage by Citizenship Status in Green Cove Springs
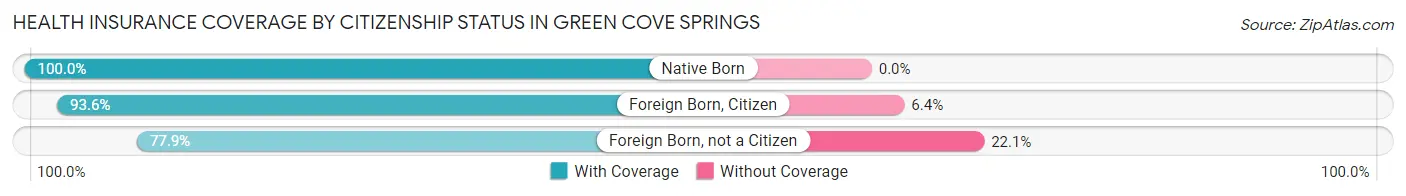
| Citizenship Status | With Coverage | Without Coverage |
| Native Born | 750 (100.0%) | 0 (0.0%) |
| Foreign Born, Citizen | 1,329 (93.6%) | 91 (6.4%) |
| Foreign Born, not a Citizen | 649 (77.9%) | 184 (22.1%) |
Health Insurance Coverage by Household Income in Green Cove Springs
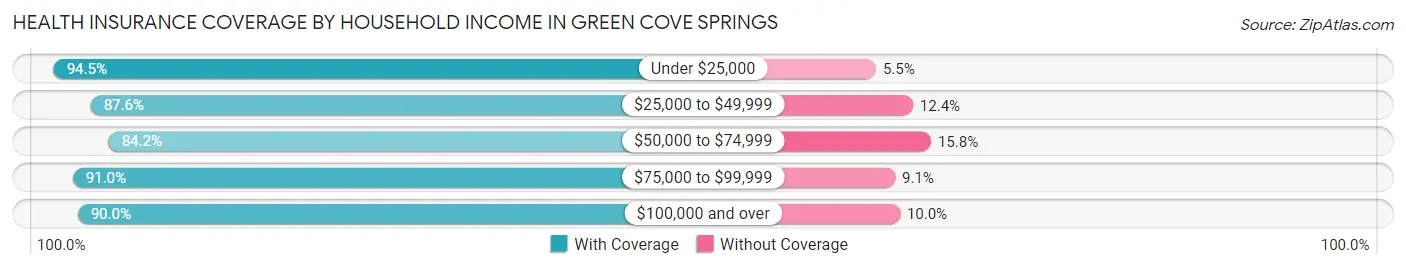
| Household Income | With Coverage | Without Coverage |
| Under $25,000 | 1,036 (94.5%) | 60 (5.5%) |
| $25,000 to $49,999 | 1,435 (87.6%) | 203 (12.4%) |
| $50,000 to $74,999 | 1,447 (84.2%) | 271 (15.8%) |
| $75,000 to $99,999 | 1,116 (90.9%) | 111 (9.0%) |
| $100,000 and over | 3,244 (90.0%) | 359 (10.0%) |
Public vs Private Health Insurance Coverage by Age in Green Cove Springs
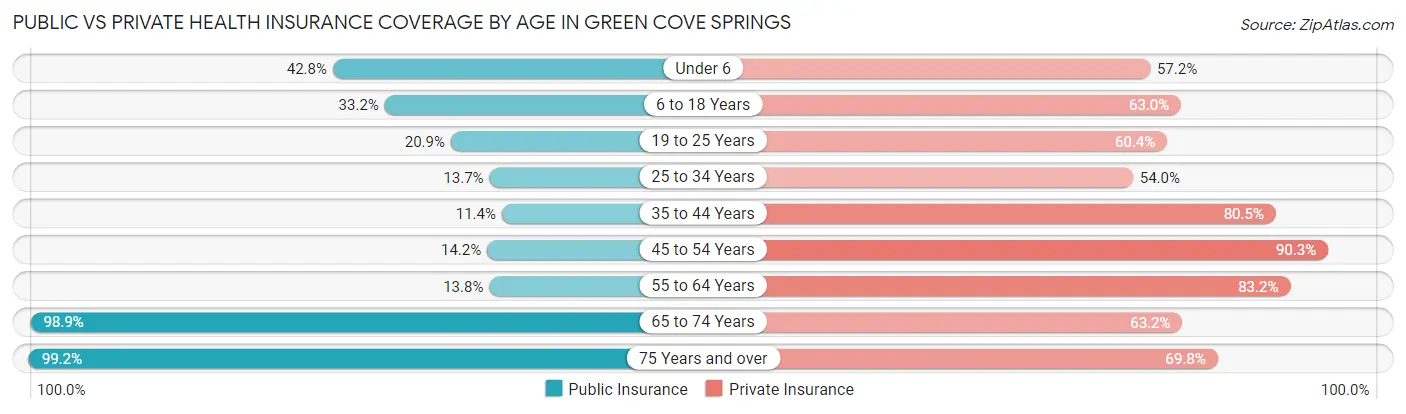
| Age Bracket | Public Insurance | Private Insurance |
| Under 6 | 321 (42.8%) | 429 (57.2%) |
| 6 to 18 Years | 471 (33.2%) | 894 (63.0%) |
| 19 to 25 Years | 174 (20.9%) | 503 (60.4%) |
| 25 to 34 Years | 174 (13.7%) | 685 (54.0%) |
| 35 to 44 Years | 128 (11.4%) | 902 (80.5%) |
| 45 to 54 Years | 128 (14.2%) | 815 (90.2%) |
| 55 to 64 Years | 151 (13.8%) | 913 (83.2%) |
| 65 to 74 Years | 997 (98.9%) | 637 (63.2%) |
| 75 Years and over | 876 (99.2%) | 616 (69.8%) |
| Total | 3,420 (36.8%) | 6,394 (68.9%) |
Disability Status by Sex by Age in Green Cove Springs
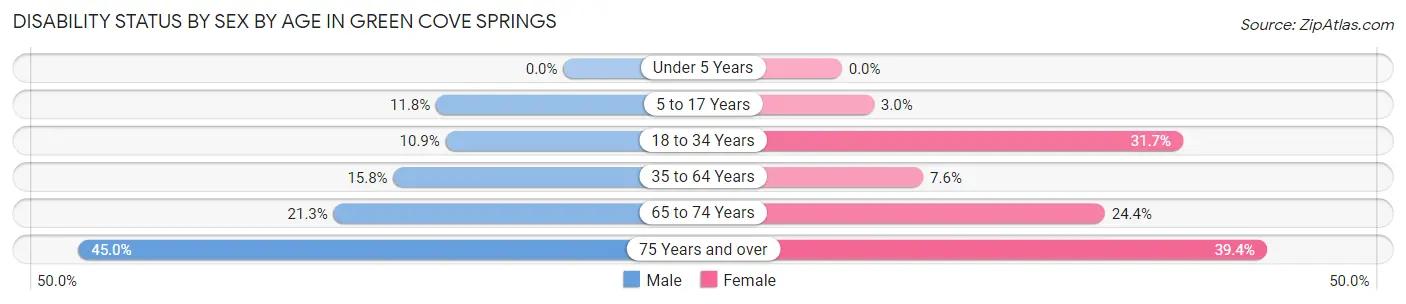
| Age Bracket | Male | Female |
| Under 5 Years | 0 (0.0%) | 0 (0.0%) |
| 5 to 17 Years | 81 (11.8%) | 19 (3.0%) |
| 18 to 34 Years | 137 (10.9%) | 319 (31.7%) |
| 35 to 64 Years | 229 (15.8%) | 126 (7.5%) |
| 65 to 74 Years | 97 (21.3%) | 135 (24.4%) |
| 75 Years and over | 176 (45.0%) | 194 (39.4%) |
Disability Class by Sex by Age in Green Cove Springs
Disability Class: Hearing Difficulty
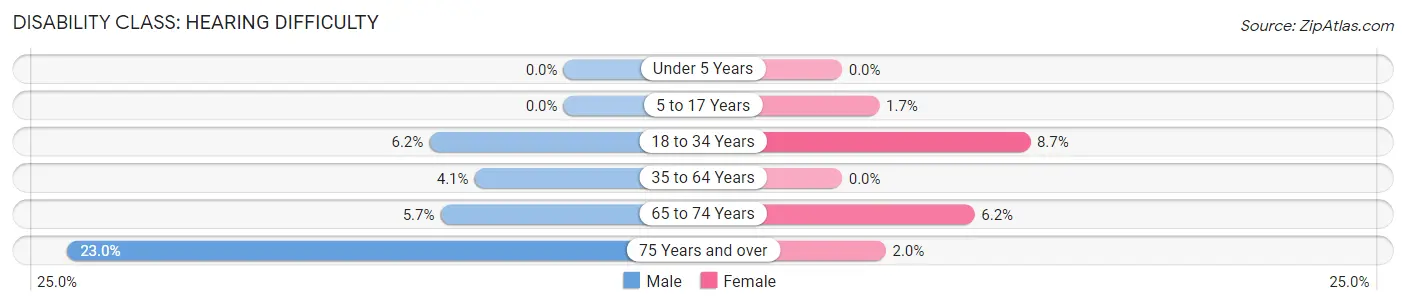
| Age Bracket | Male | Female |
| Under 5 Years | 0 (0.0%) | 0 (0.0%) |
| 5 to 17 Years | 0 (0.0%) | 11 (1.7%) |
| 18 to 34 Years | 78 (6.2%) | 88 (8.7%) |
| 35 to 64 Years | 60 (4.1%) | 0 (0.0%) |
| 65 to 74 Years | 26 (5.7%) | 34 (6.1%) |
| 75 Years and over | 90 (23.0%) | 10 (2.0%) |
Disability Class: Vision Difficulty
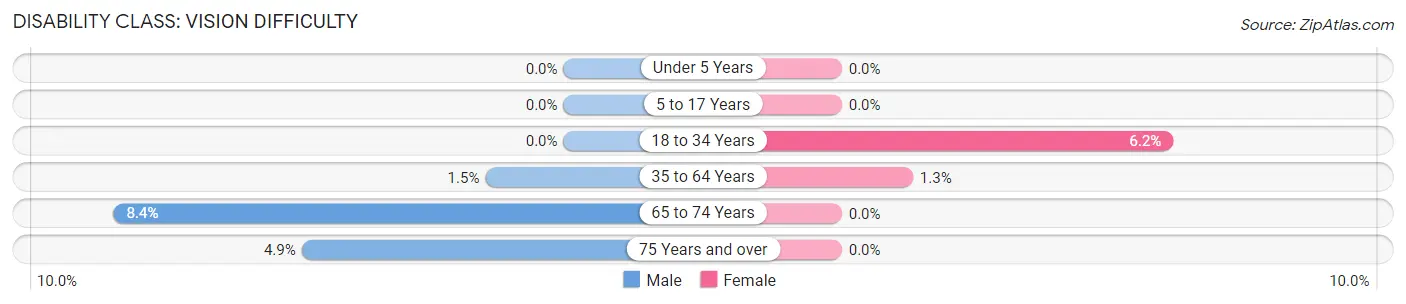
| Age Bracket | Male | Female |
| Under 5 Years | 0 (0.0%) | 0 (0.0%) |
| 5 to 17 Years | 0 (0.0%) | 0 (0.0%) |
| 18 to 34 Years | 0 (0.0%) | 62 (6.1%) |
| 35 to 64 Years | 21 (1.5%) | 22 (1.3%) |
| 65 to 74 Years | 38 (8.4%) | 0 (0.0%) |
| 75 Years and over | 19 (4.9%) | 0 (0.0%) |
Disability Class: Cognitive Difficulty
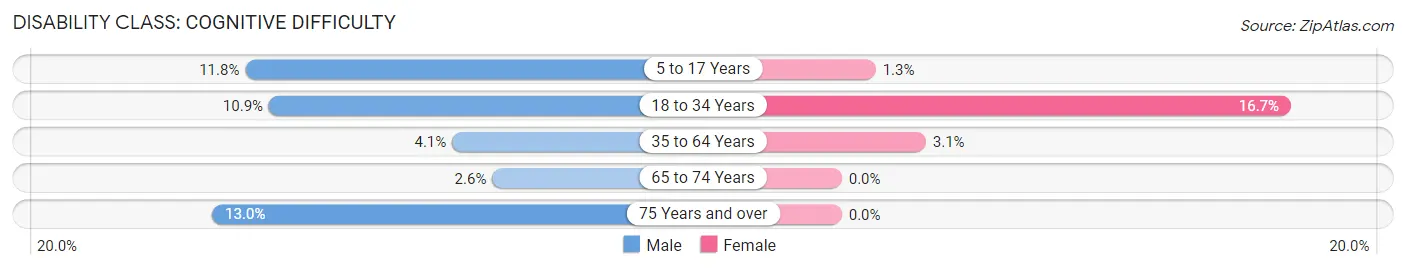
| Age Bracket | Male | Female |
| 5 to 17 Years | 81 (11.8%) | 8 (1.3%) |
| 18 to 34 Years | 137 (10.9%) | 168 (16.7%) |
| 35 to 64 Years | 60 (4.1%) | 52 (3.1%) |
| 65 to 74 Years | 12 (2.6%) | 0 (0.0%) |
| 75 Years and over | 51 (13.0%) | 0 (0.0%) |
Disability Class: Ambulatory Difficulty
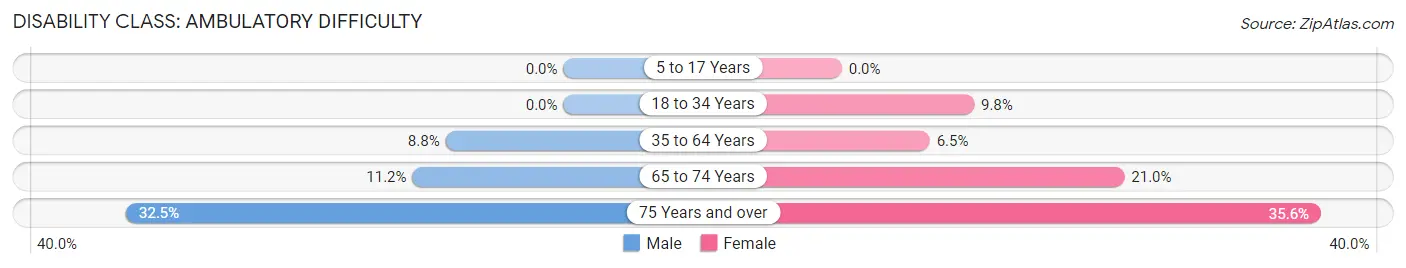
| Age Bracket | Male | Female |
| 5 to 17 Years | 0 (0.0%) | 0 (0.0%) |
| 18 to 34 Years | 0 (0.0%) | 99 (9.8%) |
| 35 to 64 Years | 127 (8.7%) | 109 (6.5%) |
| 65 to 74 Years | 51 (11.2%) | 116 (21.0%) |
| 75 Years and over | 127 (32.5%) | 175 (35.6%) |
Disability Class: Self-Care Difficulty
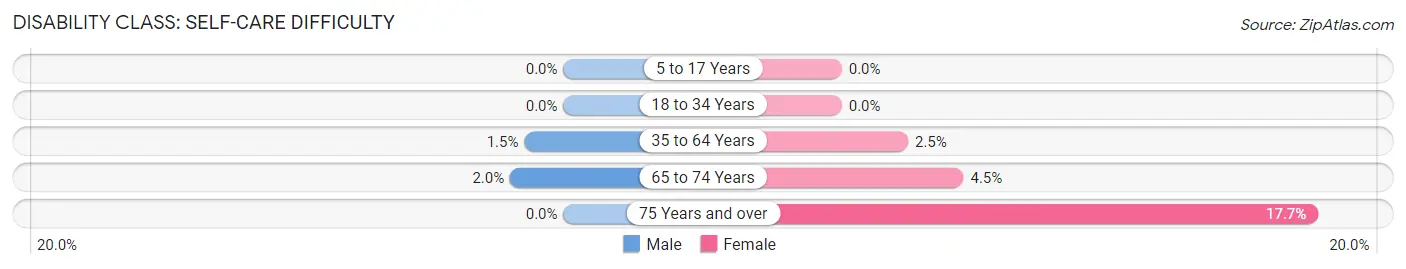
| Age Bracket | Male | Female |
| 5 to 17 Years | 0 (0.0%) | 0 (0.0%) |
| 18 to 34 Years | 0 (0.0%) | 0 (0.0%) |
| 35 to 64 Years | 21 (1.5%) | 41 (2.5%) |
| 65 to 74 Years | 9 (2.0%) | 25 (4.5%) |
| 75 Years and over | 0 (0.0%) | 87 (17.7%) |
Technology Access in Green Cove Springs
Computing Device Access in Green Cove Springs
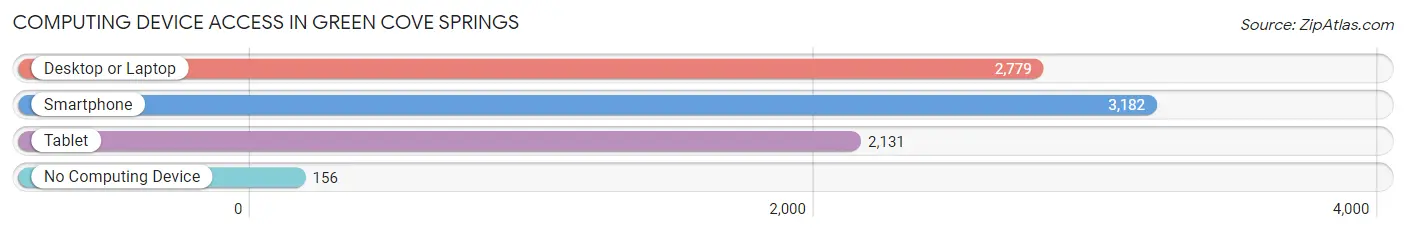
| Device Type | # Households | % Households |
| Desktop or Laptop | 2,779 | 79.6% |
| Smartphone | 3,182 | 91.2% |
| Tablet | 2,131 | 61.1% |
| No Computing Device | 156 | 4.5% |
| Total | 3,489 | 100.0% |
Internet Access in Green Cove Springs
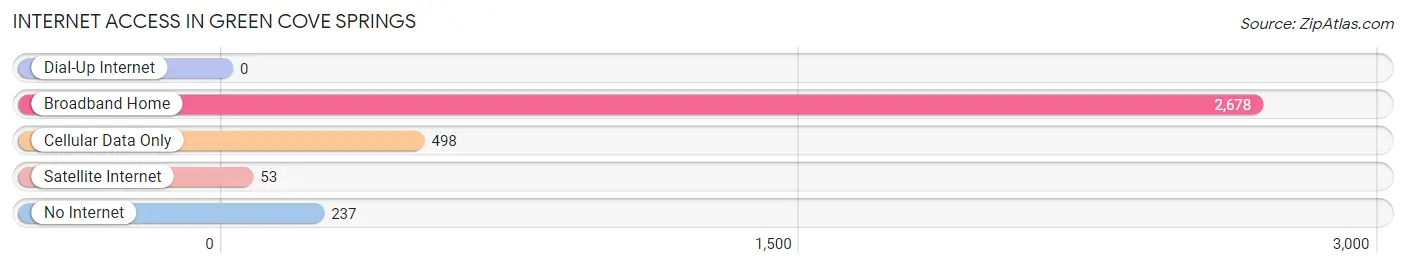
| Internet Type | # Households | % Households |
| Dial-Up Internet | 0 | 0.0% |
| Broadband Home | 2,678 | 76.8% |
| Cellular Data Only | 498 | 14.3% |
| Satellite Internet | 53 | 1.5% |
| No Internet | 237 | 6.8% |
| Total | 3,489 | 100.0% |
Green Cove Springs Summary
History
The city of Green Cove Springs, Florida is located in Clay County, approximately 25 miles southwest of Jacksonville. The city was founded in 1816 by Dr. George J. F. Clarke, who named it after the green waters of the nearby springs. The springs were a popular destination for visitors seeking to enjoy the healing properties of the mineral-rich waters.
The city was incorporated in 1854 and quickly became a popular destination for tourists. The city was known for its natural beauty and its many springs, which were believed to have healing properties. The city was also home to a number of businesses, including a sawmill, a grist mill, and a cotton gin.
In the late 19th century, the city became a popular winter resort destination for wealthy northerners. The city was home to several large hotels, including the Hotel Green Cove Springs, which was built in 1887. The city also had a number of other attractions, including a casino, a racetrack, and a golf course.
In the early 20th century, the city experienced a period of growth and development. The city was home to a number of industries, including a naval air station, a paper mill, and a phosphate plant. The city also had a number of educational institutions, including a high school and a junior college.
In the late 20th century, the city experienced a period of decline. The naval air station closed in the 1970s, and the paper mill and phosphate plant closed in the 1980s. The city also experienced a period of population decline, as many residents moved away in search of better economic opportunities.
Geography
Green Cove Springs is located in Clay County, Florida, approximately 25 miles southwest of Jacksonville. The city is situated on the St. Johns River, which is the longest river in Florida. The city is surrounded by a number of natural features, including the Green Cove Springs State Park, which is home to a number of springs and other natural features.
The city has a total area of 8.3 square miles, of which 8.2 square miles is land and 0.1 square miles is water. The city has a humid subtropical climate, with hot, humid summers and mild winters.
Economy
Green Cove Springs has a diverse economy, with a number of industries providing employment opportunities. The city is home to a number of manufacturing and industrial businesses, including a paper mill, a phosphate plant, and a naval air station. The city is also home to a number of retail businesses, including a number of restaurants, bars, and shops.
The city is also home to a number of educational institutions, including a high school and a junior college. The city is also home to a number of healthcare facilities, including a hospital and a number of medical clinics.
Demographics
As of the 2010 census, the city had a population of 6,908. The racial makeup of the city was 79.2% White, 15.3% African American, 0.4% Native American, 0.7% Asian, 0.1% Pacific Islander, 2.2% from other races, and 2.3% from two or more races. Hispanic or Latino of any race were 5.3% of the population.
The median income for a household in the city was $37,917, and the median income for a family was $45,938. The per capita income for the city was $20,945. About 14.2% of families and 17.3% of the population were below the poverty line, including 25.2% of those under age 18 and 11.2% of those age 65 or over.
Common Questions
What is Per Capita Income in Green Cove Springs?
Per Capita income in Green Cove Springs is $29,573.
What is the Median Family Income in Green Cove Springs?
Median Family Income in Green Cove Springs is $73,500.
What is the Median Household income in Green Cove Springs?
Median Household Income in Green Cove Springs is $63,760.
What is Income or Wage Gap in Green Cove Springs?
Income or Wage Gap in Green Cove Springs is 23.8%.
Women in Green Cove Springs earn 76.2 cents for every dollar earned by a man.
What is Family Income Deficit in Green Cove Springs?
Family Income Deficit in Green Cove Springs is $14,682.
Families that are below poverty line in Green Cove Springs earn $14,682 less on average than the poverty threshold level.
What is Inequality or Gini Index in Green Cove Springs?
Inequality or Gini Index in Green Cove Springs is 0.40.
What is the Total Population of Green Cove Springs?
Total Population of Green Cove Springs is 9,758.
What is the Total Male Population of Green Cove Springs?
Total Male Population of Green Cove Springs is 5,036.
What is the Total Female Population of Green Cove Springs?
Total Female Population of Green Cove Springs is 4,722.
What is the Ratio of Males per 100 Females in Green Cove Springs?
There are 106.65 Males per 100 Females in Green Cove Springs.
What is the Ratio of Females per 100 Males in Green Cove Springs?
There are 93.76 Females per 100 Males in Green Cove Springs.
What is the Median Population Age in Green Cove Springs?
Median Population Age in Green Cove Springs is 38.5 Years.
What is the Average Family Size in Green Cove Springs
Average Family Size in Green Cove Springs is 3.0 People.
What is the Average Household Size in Green Cove Springs
Average Household Size in Green Cove Springs is 2.7 People.
How Large is the Labor Force in Green Cove Springs?
There are 4,139 People in the Labor Forcein in Green Cove Springs.
What is the Percentage of People in the Labor Force in Green Cove Springs?
52.7% of People are in the Labor Force in Green Cove Springs.
What is the Unemployment Rate in Green Cove Springs?
Unemployment Rate in Green Cove Springs is 5.4%.