Sarasota, FL Map & Demographics
Sarasota Map
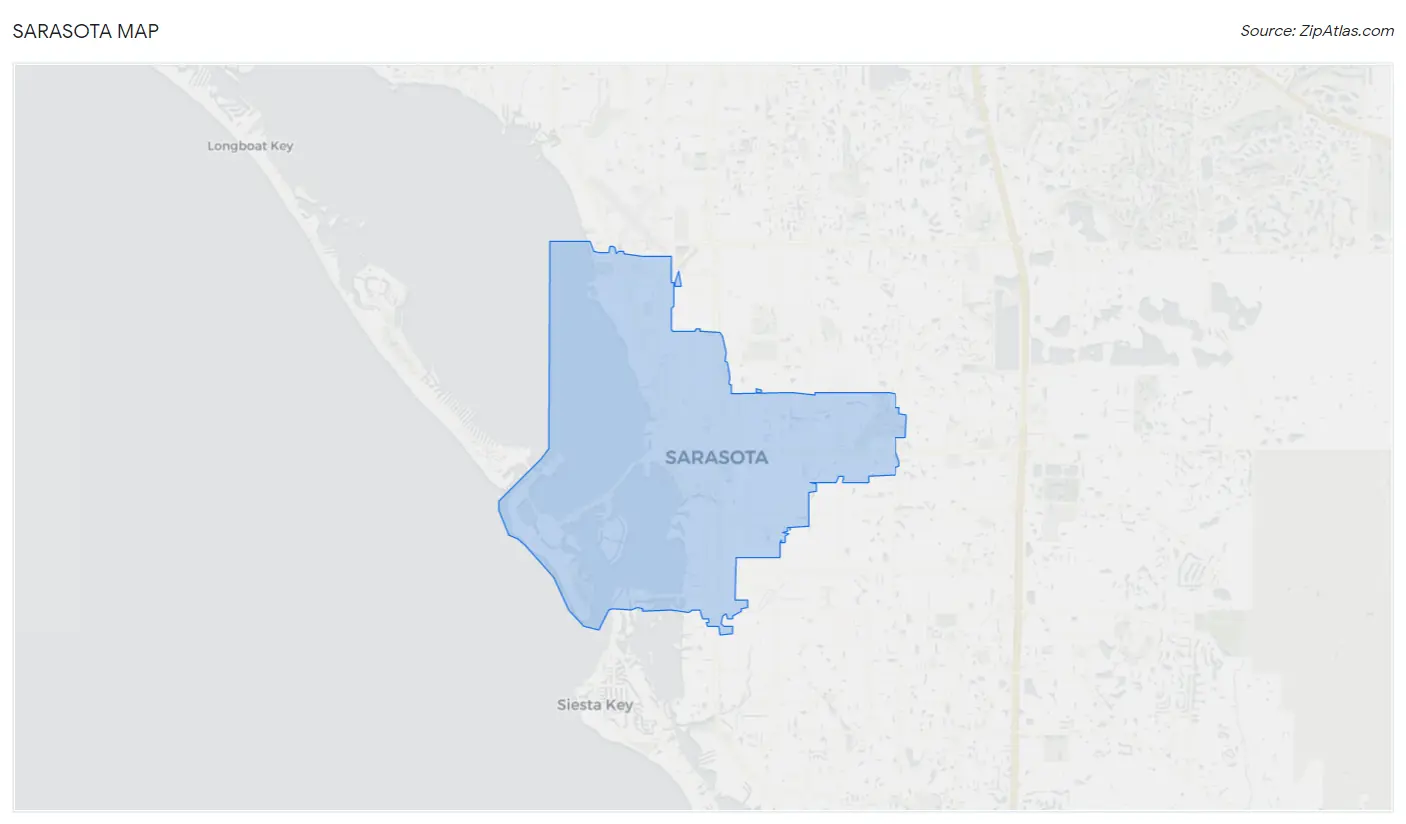
Sarasota Overview
$56,404
PER CAPITA INCOME
$85,853
AVG FAMILY INCOME
$68,870
AVG HOUSEHOLD INCOME
18.3%
WAGE / INCOME GAP [ % ]
81.7¢/ $1
WAGE / INCOME GAP [ $ ]
$11,929
FAMILY INCOME DEFICIT
0.57
INEQUALITY / GINI INDEX
55,508
TOTAL POPULATION
25,950
MALE POPULATION
29,558
FEMALE POPULATION
87.79
MALES / 100 FEMALES
113.90
FEMALES / 100 MALES
49.8
MEDIAN AGE
2.8
AVG FAMILY SIZE
2.1
AVG HOUSEHOLD SIZE
25,795
LABOR FORCE [ PEOPLE ]
53.1%
PERCENT IN LABOR FORCE
2.9%
UNEMPLOYMENT RATE
Sarasota Zip Codes
Sarasota Area Codes
Income in Sarasota
Income Overview in Sarasota
Per Capita Income in Sarasota is $56,404, while median incomes of families and households are $85,853 and $68,870 respectively.
| Characteristic | Number | Measure |
| Per Capita Income | 55,508 | $56,404 |
| Median Family Income | 12,695 | $85,853 |
| Mean Family Income | 12,695 | $159,179 |
| Median Household Income | 24,882 | $68,870 |
| Mean Household Income | 24,882 | $122,639 |
| Income Deficit | 12,695 | $11,929 |
| Wage / Income Gap (%) | 55,508 | 18.27% |
| Wage / Income Gap ($) | 55,508 | 81.73¢ per $1 |
| Gini / Inequality Index | 55,508 | 0.57 |
Earnings by Sex in Sarasota
Average Earnings in Sarasota are $35,527, $39,792 for men and $32,522 for women, a difference of 18.3%.
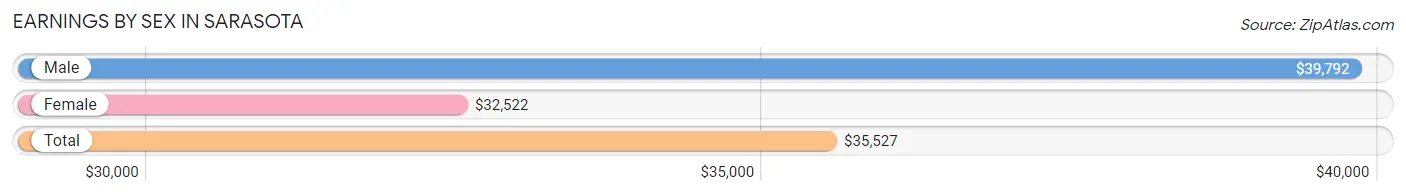
| Sex | Number | Average Earnings |
| Male | 14,423 (52.3%) | $39,792 |
| Female | 13,158 (47.7%) | $32,522 |
| Total | 27,581 (100.0%) | $35,527 |
Earnings by Sex by Income Bracket in Sarasota
The most common earnings brackets in Sarasota are $100,000+ for men (2,208 | 15.3%) and $25,000 to $29,999 for women (1,156 | 8.8%).
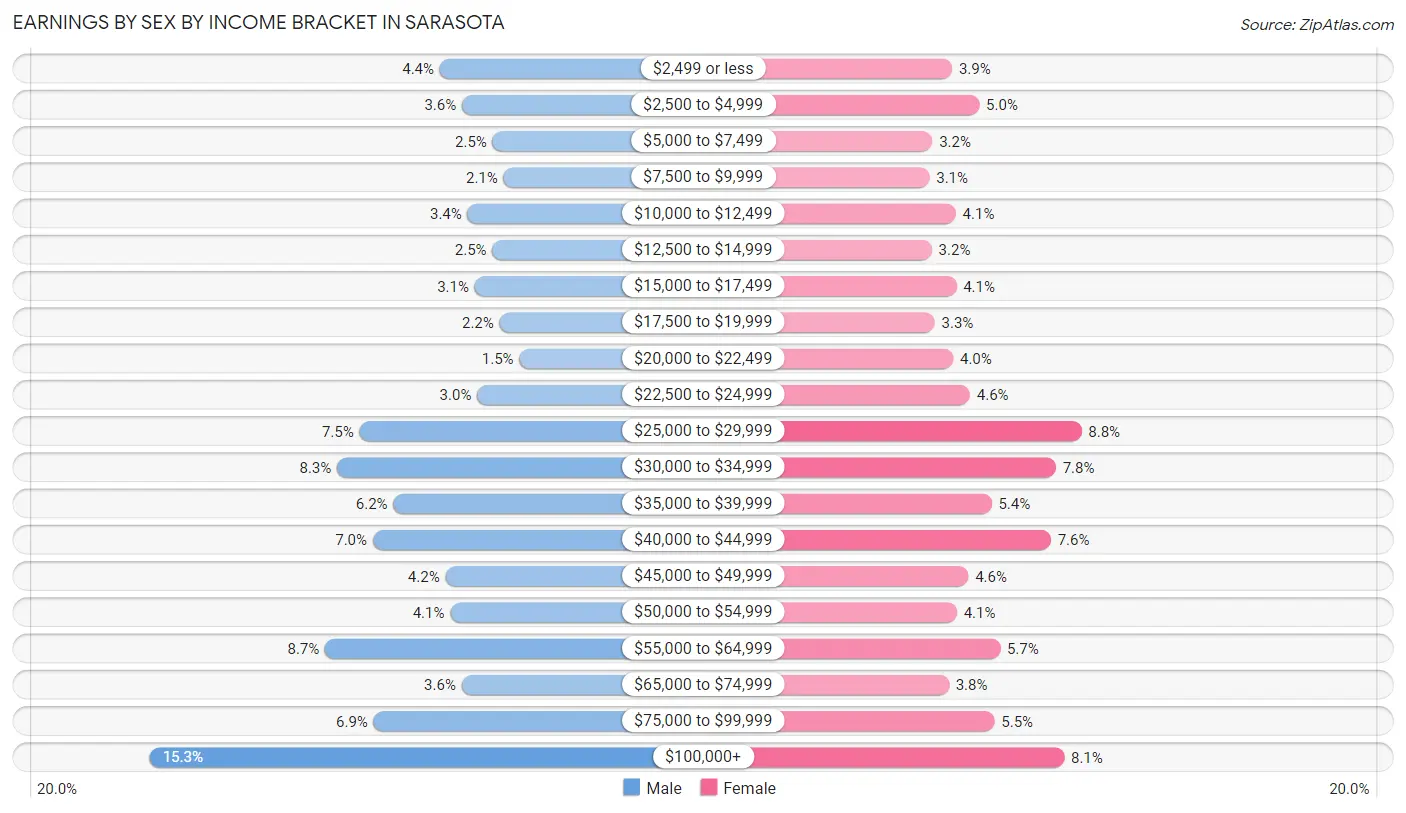
| Income | Male | Female |
| $2,499 or less | 641 (4.4%) | 519 (3.9%) |
| $2,500 to $4,999 | 520 (3.6%) | 653 (5.0%) |
| $5,000 to $7,499 | 355 (2.5%) | 421 (3.2%) |
| $7,500 to $9,999 | 296 (2.1%) | 406 (3.1%) |
| $10,000 to $12,499 | 490 (3.4%) | 537 (4.1%) |
| $12,500 to $14,999 | 356 (2.5%) | 419 (3.2%) |
| $15,000 to $17,499 | 451 (3.1%) | 539 (4.1%) |
| $17,500 to $19,999 | 317 (2.2%) | 433 (3.3%) |
| $20,000 to $22,499 | 210 (1.5%) | 524 (4.0%) |
| $22,500 to $24,999 | 439 (3.0%) | 607 (4.6%) |
| $25,000 to $29,999 | 1,075 (7.4%) | 1,156 (8.8%) |
| $30,000 to $34,999 | 1,195 (8.3%) | 1,030 (7.8%) |
| $35,000 to $39,999 | 892 (6.2%) | 713 (5.4%) |
| $40,000 to $44,999 | 1,003 (7.0%) | 1,005 (7.6%) |
| $45,000 to $49,999 | 610 (4.2%) | 599 (4.5%) |
| $50,000 to $54,999 | 584 (4.1%) | 542 (4.1%) |
| $55,000 to $64,999 | 1,261 (8.7%) | 755 (5.7%) |
| $65,000 to $74,999 | 522 (3.6%) | 502 (3.8%) |
| $75,000 to $99,999 | 998 (6.9%) | 727 (5.5%) |
| $100,000+ | 2,208 (15.3%) | 1,071 (8.1%) |
| Total | 14,423 (100.0%) | 13,158 (100.0%) |
Earnings by Sex by Educational Attainment in Sarasota
Average earnings in Sarasota are $42,875 for men and $34,867 for women, a difference of 18.7%. Men with an educational attainment of graduate degree enjoy the highest average annual earnings of $74,786, while those with less than high school education earn the least with $26,946. Women with an educational attainment of graduate degree earn the most with the average annual earnings of $59,761, while those with less than high school education have the smallest earnings of $18,173.
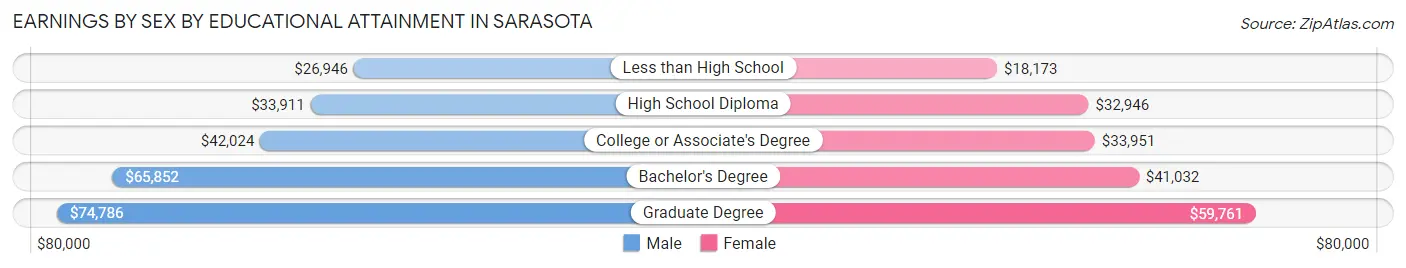
| Educational Attainment | Male Income | Female Income |
| Less than High School | $26,946 | $18,173 |
| High School Diploma | $33,911 | $32,946 |
| College or Associate's Degree | $42,024 | $33,951 |
| Bachelor's Degree | $65,852 | $41,032 |
| Graduate Degree | $74,786 | $59,761 |
| Total | $42,875 | $34,867 |
Family Income in Sarasota
Family Income Brackets in Sarasota
According to the Sarasota family income data, there are 2,349 families falling into the $100,000 to $149,999 income range, which is the most common income bracket and makes up 18.5% of all families. Conversely, the $10,000 to $14,999 income bracket is the least frequent group with only 381 families (3.0%) belonging to this category.
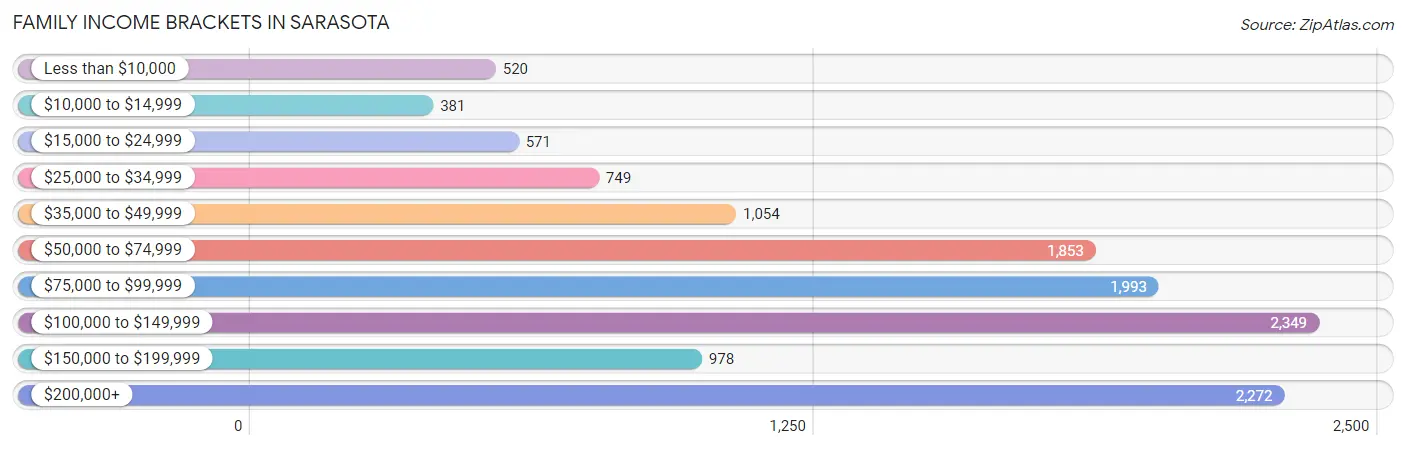
| Income Bracket | # Families | % Families |
| Less than $10,000 | 520 | 4.1% |
| $10,000 to $14,999 | 381 | 3.0% |
| $15,000 to $24,999 | 571 | 4.5% |
| $25,000 to $34,999 | 749 | 5.9% |
| $35,000 to $49,999 | 1,054 | 8.3% |
| $50,000 to $74,999 | 1,853 | 14.6% |
| $75,000 to $99,999 | 1,993 | 15.7% |
| $100,000 to $149,999 | 2,349 | 18.5% |
| $150,000 to $199,999 | 978 | 7.7% |
| $200,000+ | 2,272 | 17.9% |
Family Income by Famaliy Size in Sarasota
6-person families (93 | 0.7%) account for the highest median family income in Sarasota with $110,848 per family, while 2-person families (8,208 | 64.7%) have the highest median income of $46,200 per family member.
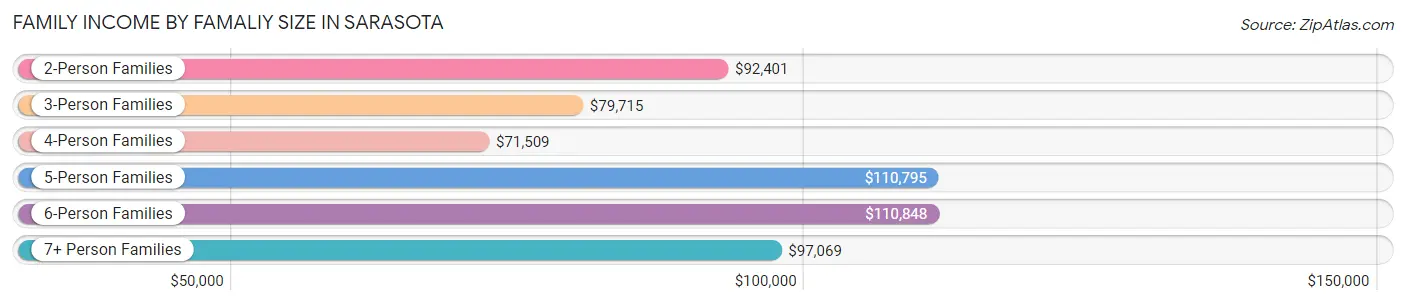
| Income Bracket | # Families | Median Income |
| 2-Person Families | 8,208 (64.7%) | $92,401 |
| 3-Person Families | 2,171 (17.1%) | $79,715 |
| 4-Person Families | 1,732 (13.6%) | $71,509 |
| 5-Person Families | 315 (2.5%) | $110,795 |
| 6-Person Families | 93 (0.7%) | $110,848 |
| 7+ Person Families | 176 (1.4%) | $97,069 |
| Total | 12,695 (100.0%) | $85,853 |
Family Income by Number of Earners in Sarasota
The median family income in Sarasota is $85,853, with families comprising 3+ earners (1,002) having the highest median family income of $110,560, while families with 1 earner (3,909) have the lowest median family income of $77,591, accounting for 7.9% and 30.8% of families, respectively.
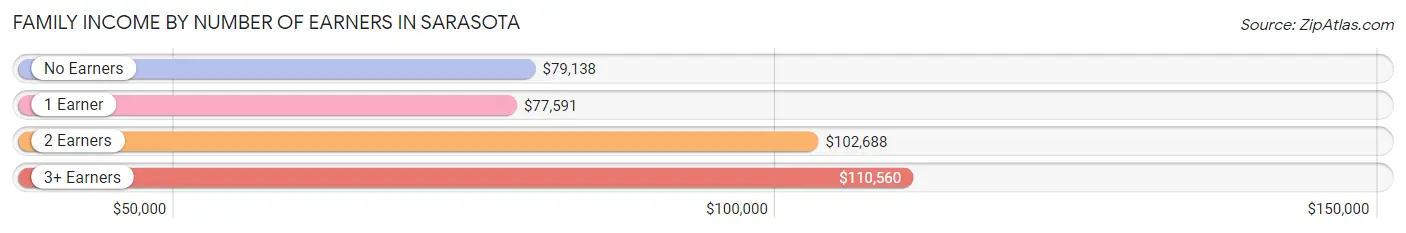
| Number of Earners | # Families | Median Income |
| No Earners | 3,413 (26.9%) | $79,138 |
| 1 Earner | 3,909 (30.8%) | $77,591 |
| 2 Earners | 4,371 (34.4%) | $102,688 |
| 3+ Earners | 1,002 (7.9%) | $110,560 |
| Total | 12,695 (100.0%) | $85,853 |
Household Income in Sarasota
Household Income Brackets in Sarasota
With 3,882 households falling in the category, the $100,000 to $149,999 income range is the most frequent in Sarasota, accounting for 15.6% of all households. In contrast, only 1,169 households (4.7%) fall into the less than $10,000 income bracket, making it the least populous group.
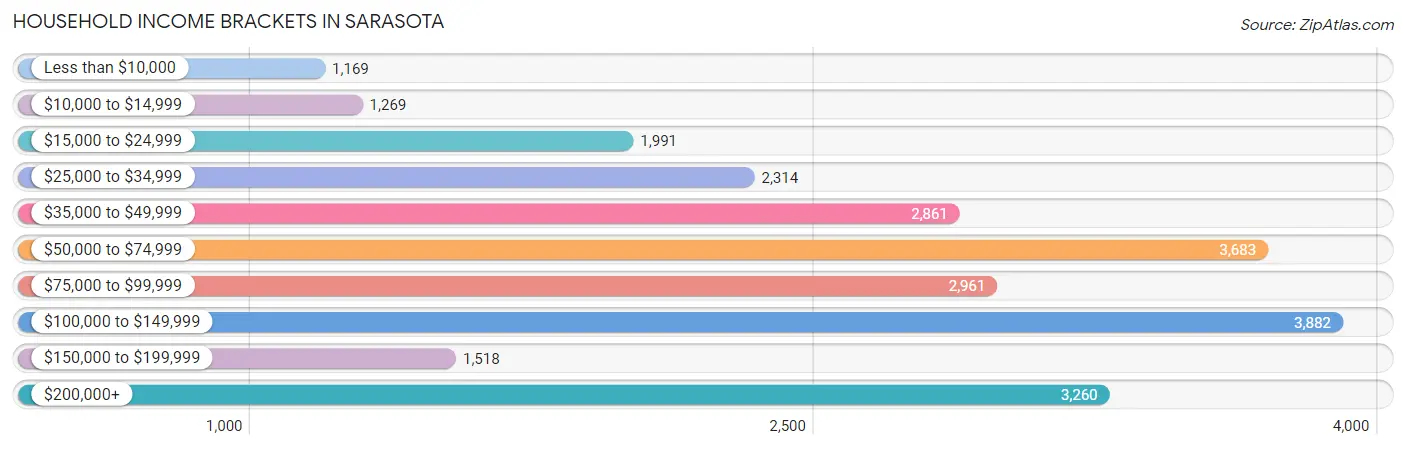
| Income Bracket | # Households | % Households |
| Less than $10,000 | 1,169 | 4.7% |
| $10,000 to $14,999 | 1,269 | 5.1% |
| $15,000 to $24,999 | 1,991 | 8.0% |
| $25,000 to $34,999 | 2,314 | 9.3% |
| $35,000 to $49,999 | 2,861 | 11.5% |
| $50,000 to $74,999 | 3,683 | 14.8% |
| $75,000 to $99,999 | 2,961 | 11.9% |
| $100,000 to $149,999 | 3,882 | 15.6% |
| $150,000 to $199,999 | 1,518 | 6.1% |
| $200,000+ | 3,260 | 13.1% |
Household Income by Householder Age in Sarasota
The median household income in Sarasota is $68,870, with the highest median household income of $72,201 found in the 25 to 44 years age bracket for the primary householder. A total of 5,843 households (23.5%) fall into this category. Meanwhile, the 15 to 24 years age bracket for the primary householder has the lowest median household income of $50,206, with 702 households (2.8%) in this group.
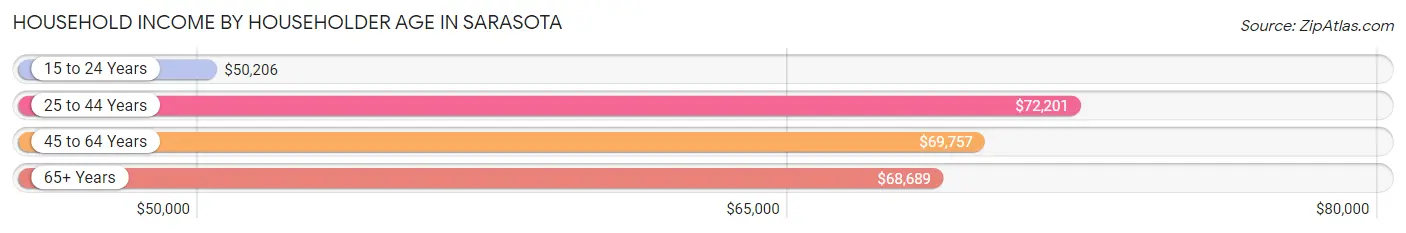
| Income Bracket | # Households | Median Income |
| 15 to 24 Years | 702 (2.8%) | $50,206 |
| 25 to 44 Years | 5,843 (23.5%) | $72,201 |
| 45 to 64 Years | 7,885 (31.7%) | $69,757 |
| 65+ Years | 10,452 (42.0%) | $68,689 |
| Total | 24,882 (100.0%) | $68,870 |
Poverty in Sarasota
Income Below Poverty by Sex and Age in Sarasota
With 13.4% poverty level for males and 14.4% for females among the residents of Sarasota, 5 year old males and 5 year old females are the most vulnerable to poverty, with 103 males (45.6%) and 180 females (48.5%) in their respective age groups living below the poverty level.
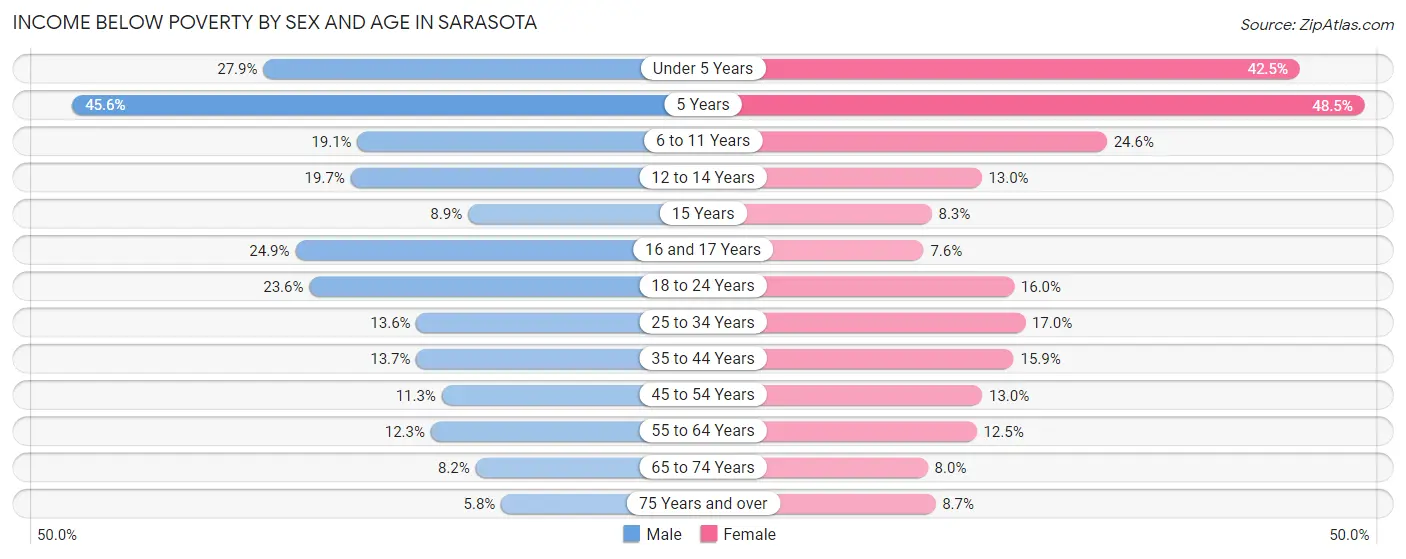
| Age Bracket | Male | Female |
| Under 5 Years | 171 (27.9%) | 470 (42.5%) |
| 5 Years | 103 (45.6%) | 180 (48.5%) |
| 6 to 11 Years | 210 (19.1%) | 287 (24.6%) |
| 12 to 14 Years | 180 (19.7%) | 110 (13.0%) |
| 15 Years | 20 (8.8%) | 21 (8.3%) |
| 16 and 17 Years | 149 (24.9%) | 31 (7.6%) |
| 18 to 24 Years | 373 (23.6%) | 255 (16.0%) |
| 25 to 34 Years | 437 (13.6%) | 558 (17.0%) |
| 35 to 44 Years | 354 (13.7%) | 435 (15.9%) |
| 45 to 54 Years | 361 (11.3%) | 357 (13.0%) |
| 55 to 64 Years | 420 (12.3%) | 538 (12.5%) |
| 65 to 74 Years | 280 (8.2%) | 346 (8.0%) |
| 75 Years and over | 174 (5.8%) | 383 (8.7%) |
| Total | 3,232 (13.4%) | 3,971 (14.4%) |
Income Above Poverty by Sex and Age in Sarasota
According to the poverty statistics in Sarasota, males aged 75 years and over and females aged 16 and 17 years are the age groups that are most secure financially, with 94.2% of males and 92.4% of females in these age groups living above the poverty line.
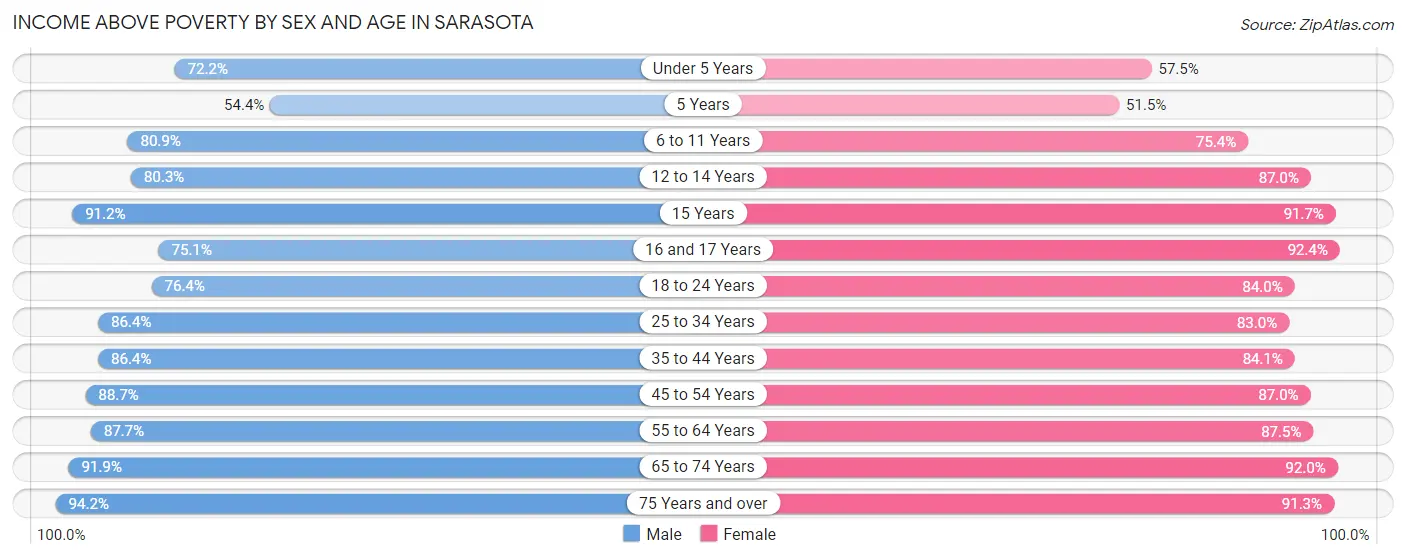
| Age Bracket | Male | Female |
| Under 5 Years | 443 (72.2%) | 636 (57.5%) |
| 5 Years | 123 (54.4%) | 191 (51.5%) |
| 6 to 11 Years | 889 (80.9%) | 880 (75.4%) |
| 12 to 14 Years | 732 (80.3%) | 739 (87.0%) |
| 15 Years | 206 (91.1%) | 231 (91.7%) |
| 16 and 17 Years | 450 (75.1%) | 378 (92.4%) |
| 18 to 24 Years | 1,209 (76.4%) | 1,342 (84.0%) |
| 25 to 34 Years | 2,767 (86.4%) | 2,725 (83.0%) |
| 35 to 44 Years | 2,239 (86.4%) | 2,294 (84.1%) |
| 45 to 54 Years | 2,837 (88.7%) | 2,384 (87.0%) |
| 55 to 64 Years | 2,994 (87.7%) | 3,765 (87.5%) |
| 65 to 74 Years | 3,155 (91.8%) | 3,997 (92.0%) |
| 75 Years and over | 2,839 (94.2%) | 4,037 (91.3%) |
| Total | 20,883 (86.6%) | 23,599 (85.6%) |
Income Below Poverty Among Married-Couple Families in Sarasota
The poverty statistics for married-couple families in Sarasota show that 4.4% or 403 of the total 9,221 families live below the poverty line. Families with 3 or 4 children have the highest poverty rate of 12.2%, comprising of 33 families. On the other hand, families with no children have the lowest poverty rate of 2.8%, which includes 198 families.
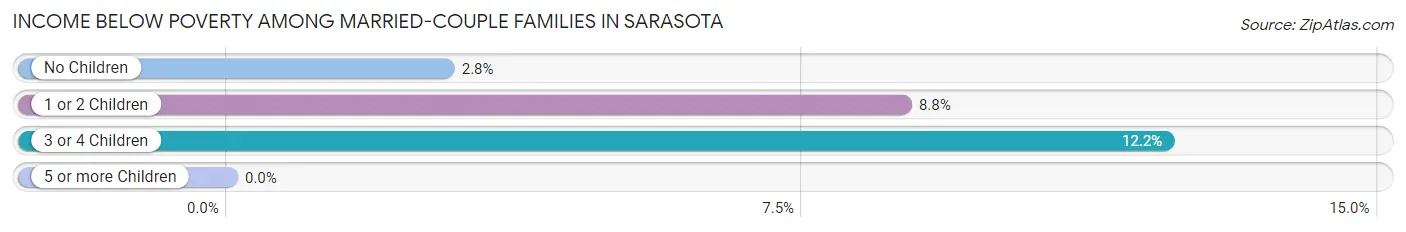
| Children | Above Poverty | Below Poverty |
| No Children | 6,798 (97.2%) | 198 (2.8%) |
| 1 or 2 Children | 1,783 (91.2%) | 172 (8.8%) |
| 3 or 4 Children | 237 (87.8%) | 33 (12.2%) |
| 5 or more Children | 0 (0.0%) | 0 (0.0%) |
| Total | 8,818 (95.6%) | 403 (4.4%) |
Income Below Poverty Among Single-Parent Households in Sarasota
According to the poverty data in Sarasota, 8.8% or 54 single-father households and 27.8% or 793 single-mother households are living below the poverty line. Among single-father households, those with 1 or 2 children have the highest poverty rate, with 45 households (25.0%) experiencing poverty. Likewise, among single-mother households, those with 5 or more children have the highest poverty rate, with 19 households (100.0%) falling below the poverty line.
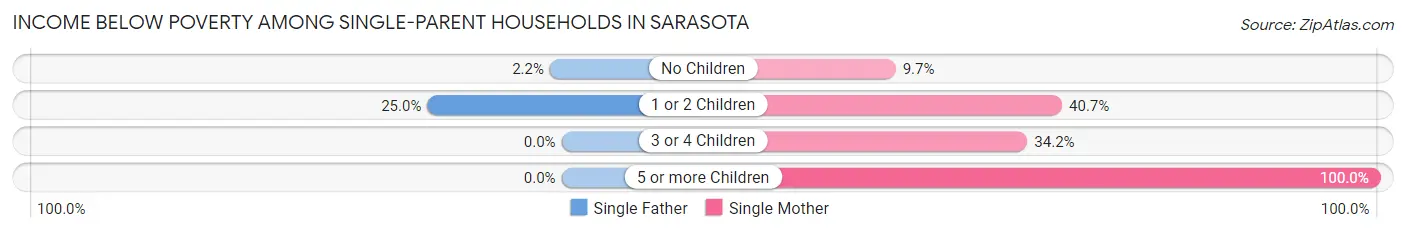
| Children | Single Father | Single Mother |
| No Children | 9 (2.2%) | 114 (9.7%) |
| 1 or 2 Children | 45 (25.0%) | 570 (40.7%) |
| 3 or 4 Children | 0 (0.0%) | 90 (34.2%) |
| 5 or more Children | 0 (0.0%) | 19 (100.0%) |
| Total | 54 (8.8%) | 793 (27.8%) |
Income Below Poverty Among Married-Couple vs Single-Parent Households in Sarasota
The poverty data for Sarasota shows that 403 of the married-couple family households (4.4%) and 847 of the single-parent households (24.4%) are living below the poverty level. Within the married-couple family households, those with 3 or 4 children have the highest poverty rate, with 33 households (12.2%) falling below the poverty line. Among the single-parent households, those with 5 or more children have the highest poverty rate, with 19 household (100.0%) living below poverty.
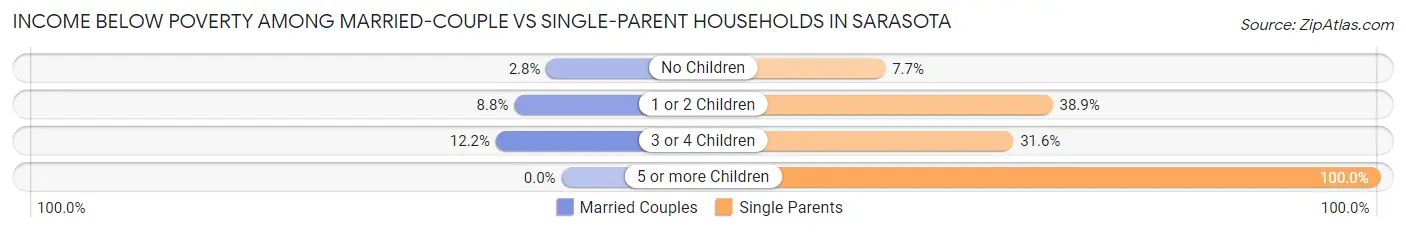
| Children | Married-Couple Families | Single-Parent Households |
| No Children | 198 (2.8%) | 123 (7.7%) |
| 1 or 2 Children | 172 (8.8%) | 615 (38.9%) |
| 3 or 4 Children | 33 (12.2%) | 90 (31.6%) |
| 5 or more Children | 0 (0.0%) | 19 (100.0%) |
| Total | 403 (4.4%) | 847 (24.4%) |
Race in Sarasota
The most populous races in Sarasota are White / Caucasian (39,948 | 72.0%), Hispanic or Latino (8,852 | 16.0%), and Black / African American (8,017 | 14.4%).
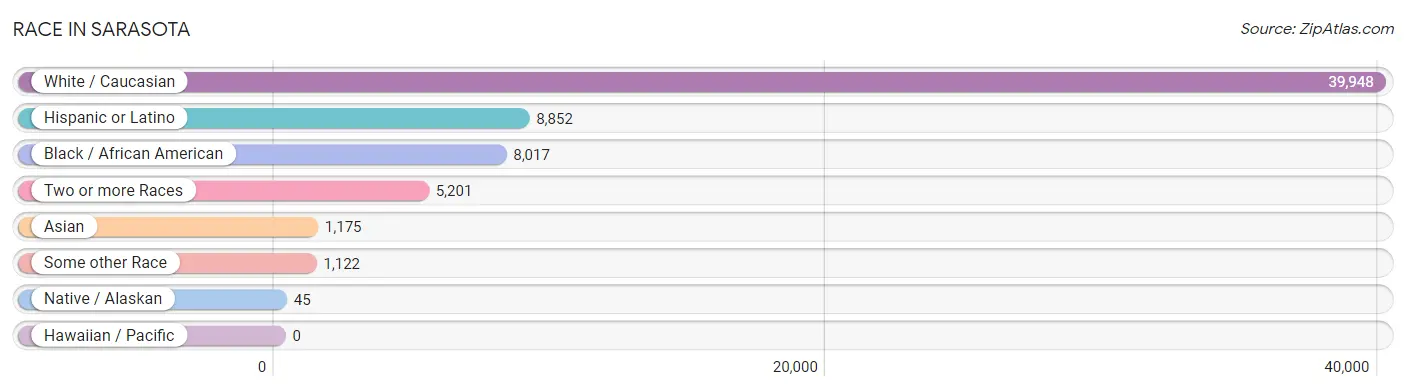
| Race | # Population | % Population |
| Asian | 1,175 | 2.1% |
| Black / African American | 8,017 | 14.4% |
| Hawaiian / Pacific | 0 | 0.0% |
| Hispanic or Latino | 8,852 | 16.0% |
| Native / Alaskan | 45 | 0.1% |
| White / Caucasian | 39,948 | 72.0% |
| Two or more Races | 5,201 | 9.4% |
| Some other Race | 1,122 | 2.0% |
| Total | 55,508 | 100.0% |
Ancestry in Sarasota
The most populous ancestries reported in Sarasota are American (8,229 | 14.8%), German (6,209 | 11.2%), Irish (5,254 | 9.5%), English (4,450 | 8.0%), and Mexican (3,911 | 7.0%), together accounting for 50.5% of all Sarasota residents.
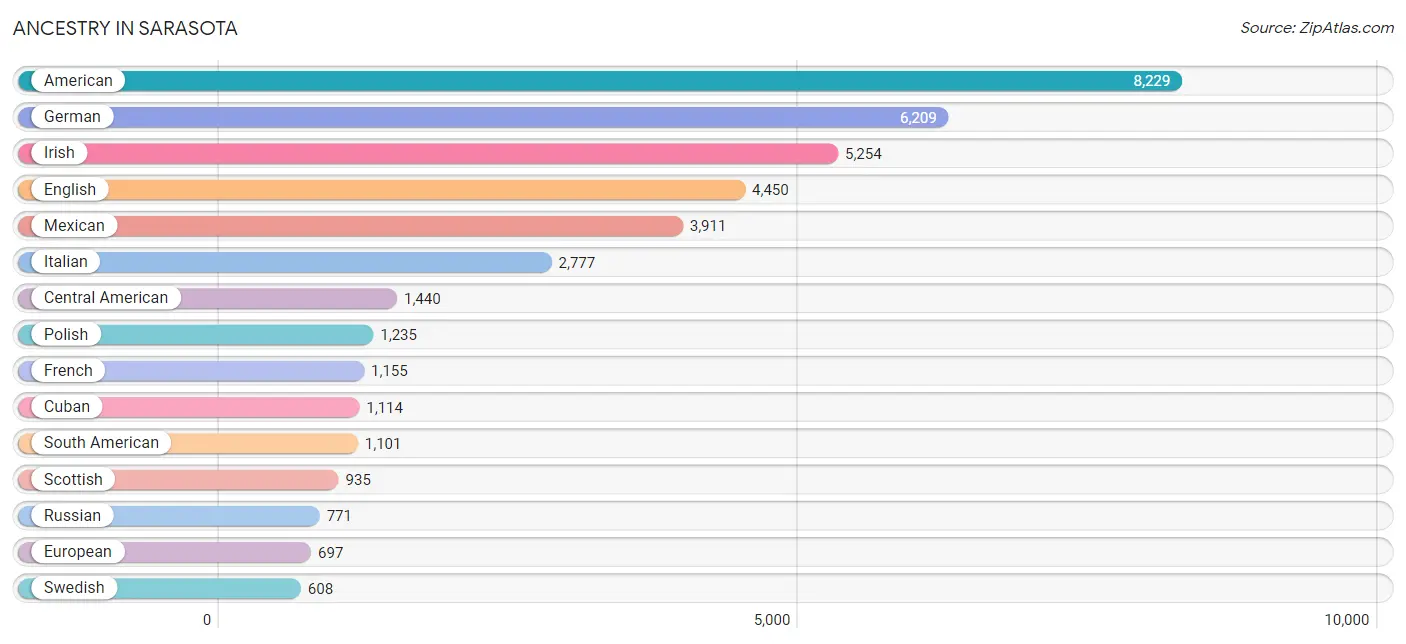
| Ancestry | # Population | % Population |
| African | 192 | 0.4% |
| American | 8,229 | 14.8% |
| Apache | 6 | 0.0% |
| Arab | 344 | 0.6% |
| Argentinean | 48 | 0.1% |
| Armenian | 10 | 0.0% |
| Assyrian / Chaldean / Syriac | 11 | 0.0% |
| Austrian | 213 | 0.4% |
| Barbadian | 12 | 0.0% |
| Basque | 33 | 0.1% |
| Bhutanese | 104 | 0.2% |
| Brazilian | 190 | 0.3% |
| British | 465 | 0.8% |
| Bulgarian | 66 | 0.1% |
| Burmese | 108 | 0.2% |
| Canadian | 241 | 0.4% |
| Cape Verdean | 26 | 0.1% |
| Central American | 1,440 | 2.6% |
| Cherokee | 164 | 0.3% |
| Chickasaw | 9 | 0.0% |
| Chilean | 35 | 0.1% |
| Choctaw | 16 | 0.0% |
| Colombian | 199 | 0.4% |
| Costa Rican | 95 | 0.2% |
| Croatian | 68 | 0.1% |
| Cuban | 1,114 | 2.0% |
| Czech | 212 | 0.4% |
| Czechoslovakian | 97 | 0.2% |
| Danish | 210 | 0.4% |
| Dominican | 107 | 0.2% |
| Dutch | 409 | 0.7% |
| Dutch West Indian | 26 | 0.1% |
| Eastern European | 223 | 0.4% |
| Ecuadorian | 77 | 0.1% |
| Egyptian | 51 | 0.1% |
| English | 4,450 | 8.0% |
| European | 697 | 1.3% |
| Finnish | 152 | 0.3% |
| French | 1,155 | 2.1% |
| French American Indian | 6 | 0.0% |
| French Canadian | 419 | 0.7% |
| German | 6,209 | 11.2% |
| Greek | 113 | 0.2% |
| Guatemalan | 457 | 0.8% |
| Haitian | 90 | 0.2% |
| Honduran | 79 | 0.1% |
| Hungarian | 393 | 0.7% |
| Indian (Asian) | 239 | 0.4% |
| Iranian | 104 | 0.2% |
| Irish | 5,254 | 9.5% |
| Iroquois | 20 | 0.0% |
| Italian | 2,777 | 5.0% |
| Jamaican | 130 | 0.2% |
| Japanese | 38 | 0.1% |
| Korean | 462 | 0.8% |
| Laotian | 18 | 0.0% |
| Latvian | 27 | 0.1% |
| Lebanese | 250 | 0.4% |
| Lithuanian | 135 | 0.2% |
| Malaysian | 36 | 0.1% |
| Maltese | 10 | 0.0% |
| Mexican | 3,911 | 7.0% |
| Mexican American Indian | 31 | 0.1% |
| Moroccan | 12 | 0.0% |
| Navajo | 5 | 0.0% |
| Nicaraguan | 448 | 0.8% |
| Nigerian | 8 | 0.0% |
| Northern European | 82 | 0.2% |
| Norwegian | 244 | 0.4% |
| Pakistani | 32 | 0.1% |
| Palestinian | 24 | 0.0% |
| Panamanian | 98 | 0.2% |
| Pennsylvania German | 5 | 0.0% |
| Peruvian | 534 | 1.0% |
| Polish | 1,235 | 2.2% |
| Portuguese | 159 | 0.3% |
| Puerto Rican | 590 | 1.1% |
| Romanian | 51 | 0.1% |
| Russian | 771 | 1.4% |
| Salvadoran | 263 | 0.5% |
| Scandinavian | 119 | 0.2% |
| Scotch-Irish | 512 | 0.9% |
| Scottish | 935 | 1.7% |
| Seminole | 10 | 0.0% |
| Serbian | 69 | 0.1% |
| Slavic | 49 | 0.1% |
| Slovak | 55 | 0.1% |
| Slovene | 39 | 0.1% |
| South African | 21 | 0.0% |
| South American | 1,101 | 2.0% |
| South American Indian | 16 | 0.0% |
| Spaniard | 72 | 0.1% |
| Spanish | 80 | 0.1% |
| Sri Lankan | 150 | 0.3% |
| Subsaharan African | 273 | 0.5% |
| Swedish | 608 | 1.1% |
| Swiss | 244 | 0.4% |
| Thai | 274 | 0.5% |
| Trinidadian and Tobagonian | 19 | 0.0% |
| Turkish | 166 | 0.3% |
| Ukrainian | 84 | 0.2% |
| Venezuelan | 208 | 0.4% |
| Welsh | 281 | 0.5% |
| Yugoslavian | 56 | 0.1% |
| Zimbabwean | 12 | 0.0% | View All 105 Rows |
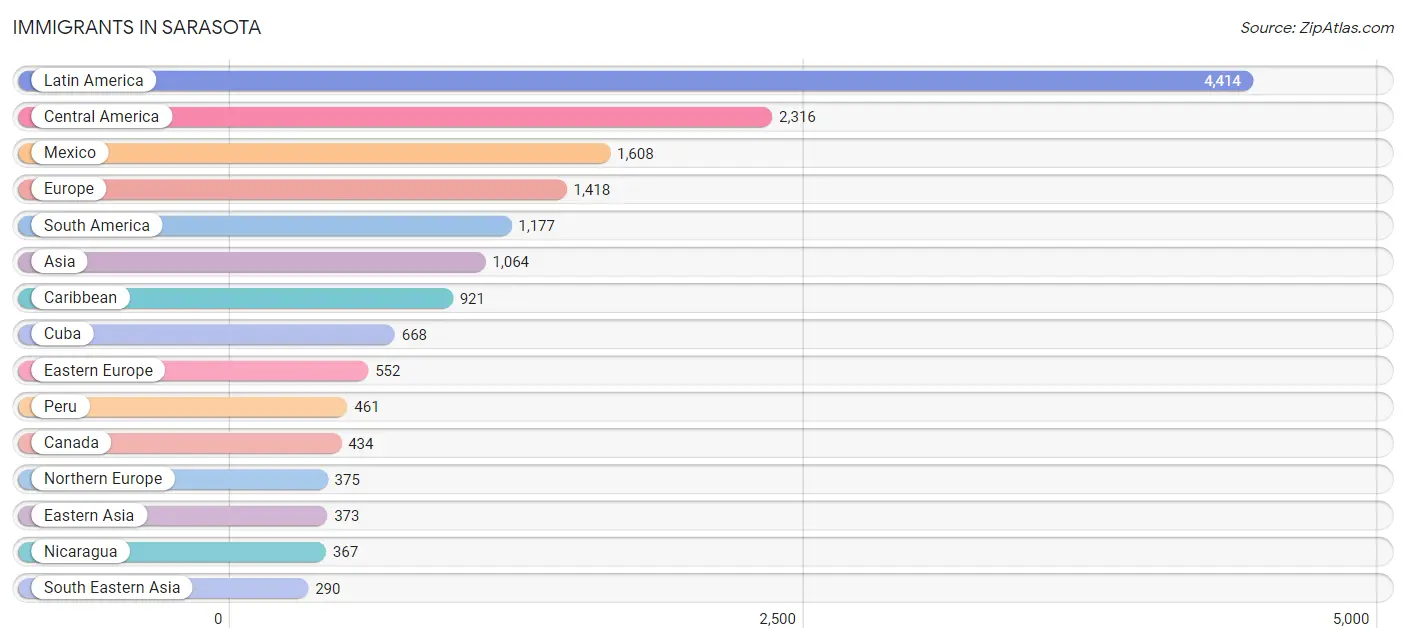
Immigrants in Sarasota
The most numerous immigrant groups reported in Sarasota came from Latin America (4,414 | 8.0%), Central America (2,316 | 4.2%), Mexico (1,608 | 2.9%), Europe (1,418 | 2.5%), and South America (1,177 | 2.1%), together accounting for 19.7% of all Sarasota residents.
| Immigration Origin | # Population | % Population |
| Africa | 265 | 0.5% |
| Argentina | 53 | 0.1% |
| Asia | 1,064 | 1.9% |
| Australia | 42 | 0.1% |
| Austria | 10 | 0.0% |
| Azores | 9 | 0.0% |
| Barbados | 12 | 0.0% |
| Belarus | 59 | 0.1% |
| Bosnia and Herzegovina | 30 | 0.1% |
| Brazil | 211 | 0.4% |
| Bulgaria | 36 | 0.1% |
| Canada | 434 | 0.8% |
| Caribbean | 921 | 1.7% |
| Central America | 2,316 | 4.2% |
| Chile | 29 | 0.1% |
| China | 237 | 0.4% |
| Colombia | 184 | 0.3% |
| Croatia | 11 | 0.0% |
| Cuba | 668 | 1.2% |
| Czechoslovakia | 23 | 0.0% |
| Denmark | 21 | 0.0% |
| Dominican Republic | 97 | 0.2% |
| Eastern Africa | 101 | 0.2% |
| Eastern Asia | 373 | 0.7% |
| Eastern Europe | 552 | 1.0% |
| Ecuador | 24 | 0.0% |
| Egypt | 57 | 0.1% |
| El Salvador | 219 | 0.4% |
| England | 128 | 0.2% |
| Eritrea | 14 | 0.0% |
| Ethiopia | 11 | 0.0% |
| Europe | 1,418 | 2.5% |
| France | 13 | 0.0% |
| Germany | 174 | 0.3% |
| Ghana | 11 | 0.0% |
| Guatemala | 59 | 0.1% |
| Haiti | 65 | 0.1% |
| Honduras | 44 | 0.1% |
| Hong Kong | 9 | 0.0% |
| Hungary | 86 | 0.2% |
| India | 113 | 0.2% |
| Iran | 44 | 0.1% |
| Iraq | 20 | 0.0% |
| Ireland | 17 | 0.0% |
| Israel | 34 | 0.1% |
| Italy | 155 | 0.3% |
| Jamaica | 27 | 0.1% |
| Japan | 38 | 0.1% |
| Kenya | 6 | 0.0% |
| Korea | 98 | 0.2% |
| Laos | 36 | 0.1% |
| Latin America | 4,414 | 8.0% |
| Latvia | 11 | 0.0% |
| Lebanon | 41 | 0.1% |
| Lithuania | 39 | 0.1% |
| Malaysia | 5 | 0.0% |
| Mexico | 1,608 | 2.9% |
| Moldova | 8 | 0.0% |
| Nepal | 27 | 0.1% |
| Netherlands | 11 | 0.0% |
| Nicaragua | 367 | 0.7% |
| Nigeria | 10 | 0.0% |
| Northern Africa | 87 | 0.2% |
| Northern Europe | 375 | 0.7% |
| Norway | 5 | 0.0% |
| Oceania | 42 | 0.1% |
| Panama | 19 | 0.0% |
| Peru | 461 | 0.8% |
| Philippines | 131 | 0.2% |
| Poland | 68 | 0.1% |
| Portugal | 105 | 0.2% |
| Romania | 50 | 0.1% |
| Russia | 29 | 0.1% |
| Saudi Arabia | 7 | 0.0% |
| Scotland | 29 | 0.1% |
| Serbia | 19 | 0.0% |
| South Africa | 52 | 0.1% |
| South America | 1,177 | 2.1% |
| South Central Asia | 199 | 0.4% |
| South Eastern Asia | 290 | 0.5% |
| Southern Europe | 274 | 0.5% |
| Spain | 14 | 0.0% |
| Sweden | 68 | 0.1% |
| Switzerland | 5 | 0.0% |
| Thailand | 17 | 0.0% |
| Trinidad and Tobago | 38 | 0.1% |
| Turkey | 76 | 0.1% |
| Uganda | 16 | 0.0% |
| Ukraine | 72 | 0.1% |
| Venezuela | 215 | 0.4% |
| Vietnam | 101 | 0.2% |
| West Indies | 14 | 0.0% |
| Western Africa | 21 | 0.0% |
| Western Asia | 178 | 0.3% |
| Western Europe | 213 | 0.4% |
| Zimbabwe | 12 | 0.0% | View All 96 Rows |
Sex and Age in Sarasota
Sex and Age in Sarasota
The most populous age groups in Sarasota are 65 to 69 Years (2,097 | 8.1%) for men and 65 to 69 Years (2,724 | 9.2%) for women.
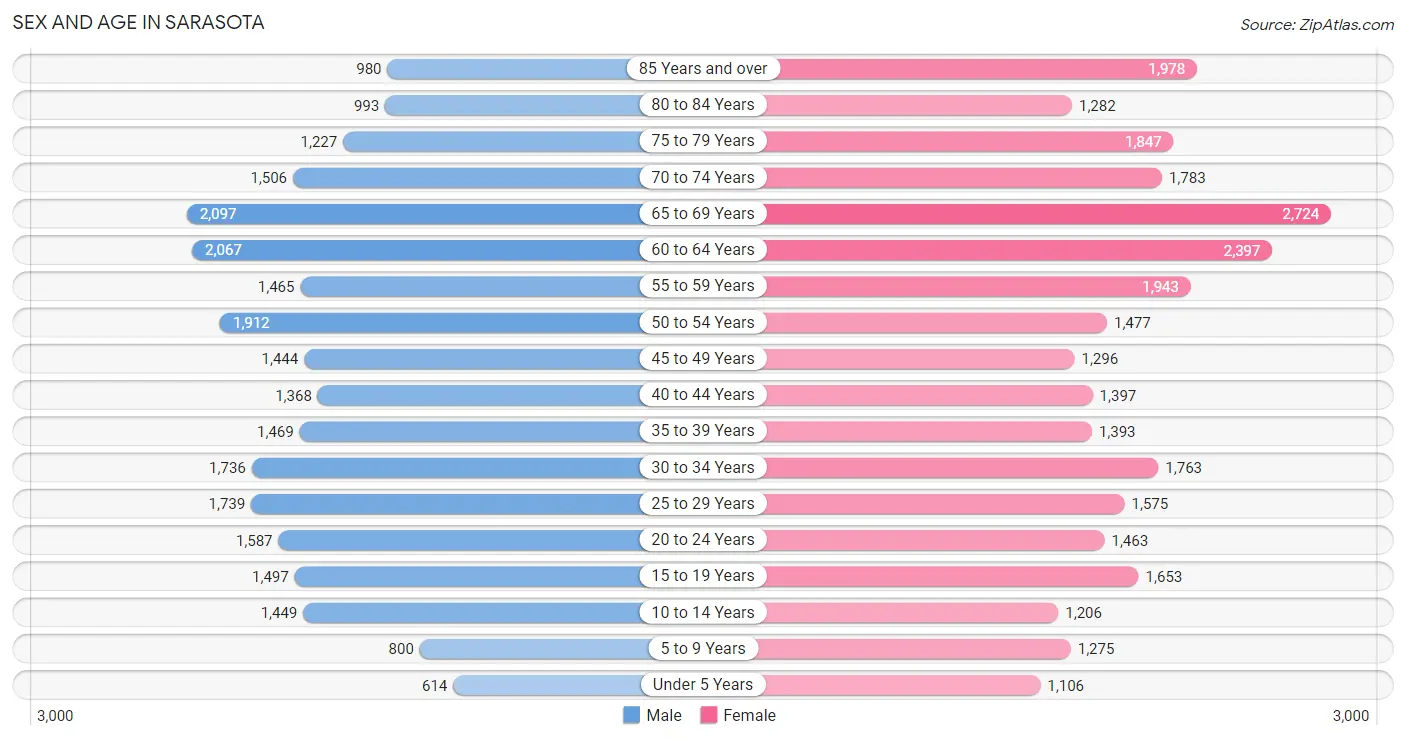
| Age Bracket | Male | Female |
| Under 5 Years | 614 (2.4%) | 1,106 (3.7%) |
| 5 to 9 Years | 800 (3.1%) | 1,275 (4.3%) |
| 10 to 14 Years | 1,449 (5.6%) | 1,206 (4.1%) |
| 15 to 19 Years | 1,497 (5.8%) | 1,653 (5.6%) |
| 20 to 24 Years | 1,587 (6.1%) | 1,463 (5.0%) |
| 25 to 29 Years | 1,739 (6.7%) | 1,575 (5.3%) |
| 30 to 34 Years | 1,736 (6.7%) | 1,763 (6.0%) |
| 35 to 39 Years | 1,469 (5.7%) | 1,393 (4.7%) |
| 40 to 44 Years | 1,368 (5.3%) | 1,397 (4.7%) |
| 45 to 49 Years | 1,444 (5.6%) | 1,296 (4.4%) |
| 50 to 54 Years | 1,912 (7.4%) | 1,477 (5.0%) |
| 55 to 59 Years | 1,465 (5.7%) | 1,943 (6.6%) |
| 60 to 64 Years | 2,067 (8.0%) | 2,397 (8.1%) |
| 65 to 69 Years | 2,097 (8.1%) | 2,724 (9.2%) |
| 70 to 74 Years | 1,506 (5.8%) | 1,783 (6.0%) |
| 75 to 79 Years | 1,227 (4.7%) | 1,847 (6.2%) |
| 80 to 84 Years | 993 (3.8%) | 1,282 (4.3%) |
| 85 Years and over | 980 (3.8%) | 1,978 (6.7%) |
| Total | 25,950 (100.0%) | 29,558 (100.0%) |
Families and Households in Sarasota
Median Family Size in Sarasota
The median family size in Sarasota is 2.75 persons per family, with single female/mother families (2,858 | 22.5%) accounting for the largest median family size of 3.03 persons per family. On the other hand, married-couple families (9,221 | 72.6%) represent the smallest median family size with 2.65 persons per family.
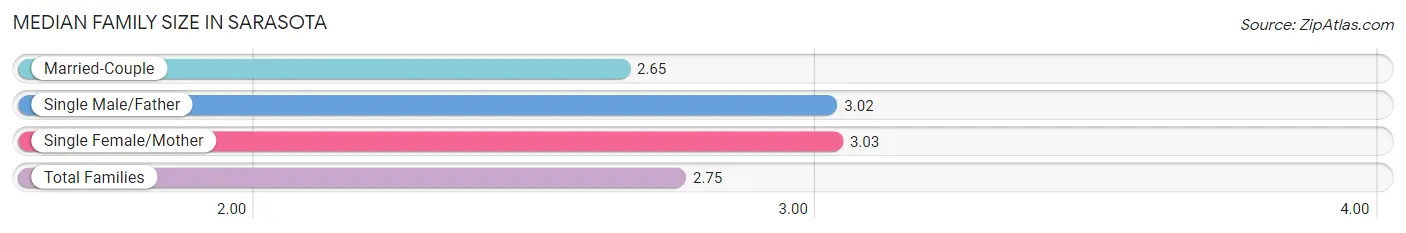
| Family Type | # Families | Family Size |
| Married-Couple | 9,221 (72.6%) | 2.65 |
| Single Male/Father | 616 (4.9%) | 3.02 |
| Single Female/Mother | 2,858 (22.5%) | 3.03 |
| Total Families | 12,695 (100.0%) | 2.75 |
Median Household Size in Sarasota
The median household size in Sarasota is 2.06 persons per household, with single female/mother households (2,858 | 11.5%) accounting for the largest median household size of 3.22 persons per household. non-family households (12,187 | 49.0%) represent the smallest median household size with 1.26 persons per household.
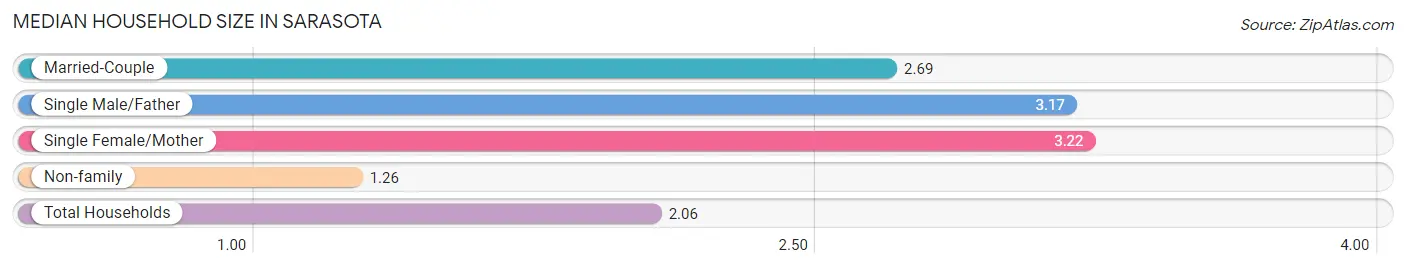
| Household Type | # Households | Household Size |
| Married-Couple | 9,221 (37.1%) | 2.69 |
| Single Male/Father | 616 (2.5%) | 3.17 |
| Single Female/Mother | 2,858 (11.5%) | 3.22 |
| Non-family | 12,187 (49.0%) | 1.26 |
| Total Households | 24,882 (100.0%) | 2.06 |
Household Size by Marriage Status in Sarasota
Out of a total of 24,882 households in Sarasota, 12,695 (51.0%) are family households, while 12,187 (49.0%) are nonfamily households. The most numerous type of family households are 2-person households, comprising 7,843, and the most common type of nonfamily households are 1-person households, comprising 9,853.
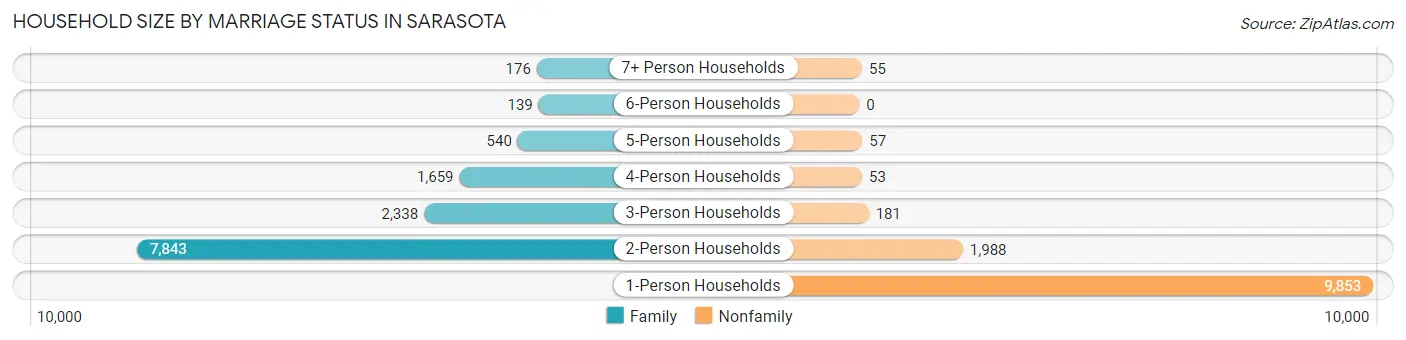
| Household Size | Family Households | Nonfamily Households |
| 1-Person Households | - | 9,853 (39.6%) |
| 2-Person Households | 7,843 (31.5%) | 1,988 (8.0%) |
| 3-Person Households | 2,338 (9.4%) | 181 (0.7%) |
| 4-Person Households | 1,659 (6.7%) | 53 (0.2%) |
| 5-Person Households | 540 (2.2%) | 57 (0.2%) |
| 6-Person Households | 139 (0.6%) | 0 (0.0%) |
| 7+ Person Households | 176 (0.7%) | 55 (0.2%) |
| Total | 12,695 (51.0%) | 12,187 (49.0%) |
Female Fertility in Sarasota
Fertility by Age in Sarasota
Average fertility rate in Sarasota is 41.0 births per 1,000 women. Women in the age bracket of 20 to 34 years have the highest fertility rate with 66.0 births per 1,000 women. Women in the age bracket of 20 to 34 years acount for 72.3% of all women with births.
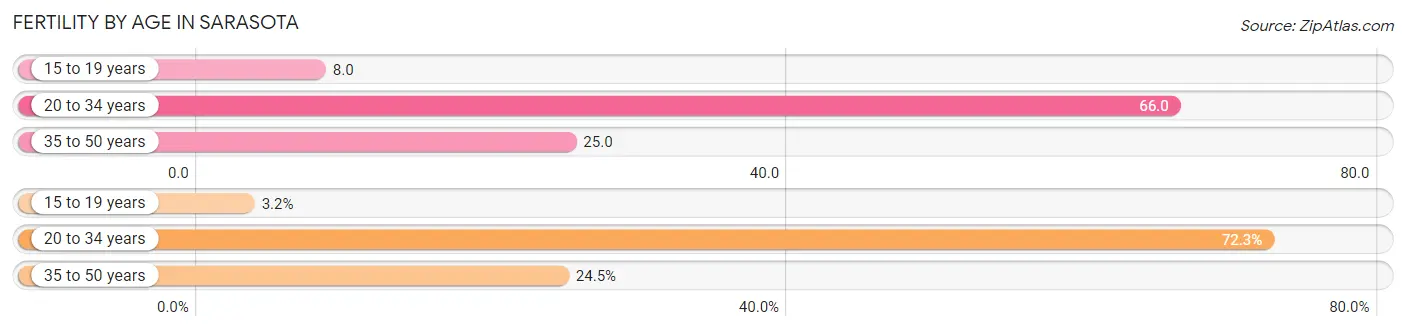
| Age Bracket | Women with Births | Births / 1,000 Women |
| 15 to 19 years | 14 (3.2%) | 8.0 |
| 20 to 34 years | 319 (72.3%) | 66.0 |
| 35 to 50 years | 108 (24.5%) | 25.0 |
| Total | 441 (100.0%) | 41.0 |
Fertility by Age by Marriage Status in Sarasota
47.2% of women with births (441) in Sarasota are married. The highest percentage of unmarried women with births falls into 15 to 19 years age bracket with 100.0% of them unmarried at the time of birth, while the lowest percentage of unmarried women with births belong to 35 to 50 years age bracket with 50.9% of them unmarried.
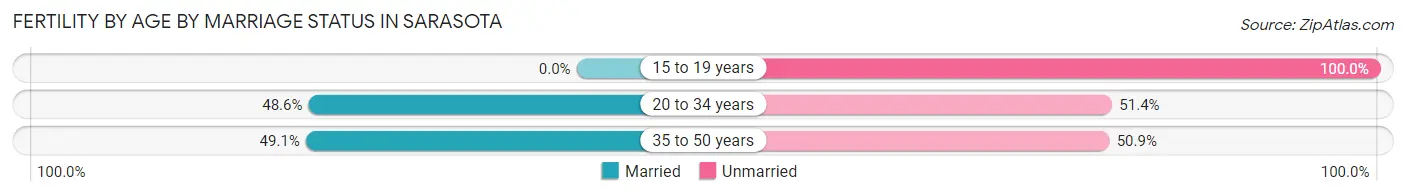
| Age Bracket | Married | Unmarried |
| 15 to 19 years | 0 (0.0%) | 14 (100.0%) |
| 20 to 34 years | 155 (48.6%) | 164 (51.4%) |
| 35 to 50 years | 53 (49.1%) | 55 (50.9%) |
| Total | 208 (47.2%) | 233 (52.8%) |
Fertility by Education in Sarasota
Average fertility rate in Sarasota is 41.0 births per 1,000 women. Women with the education attainment of less than high school have the highest fertility rate of 70.0 births per 1,000 women, while women with the education attainment of bachelor's degree have the lowest fertility at 31.0 births per 1,000 women. Women with the education attainment of college or associate's degree represent 27.7% of all women with births.
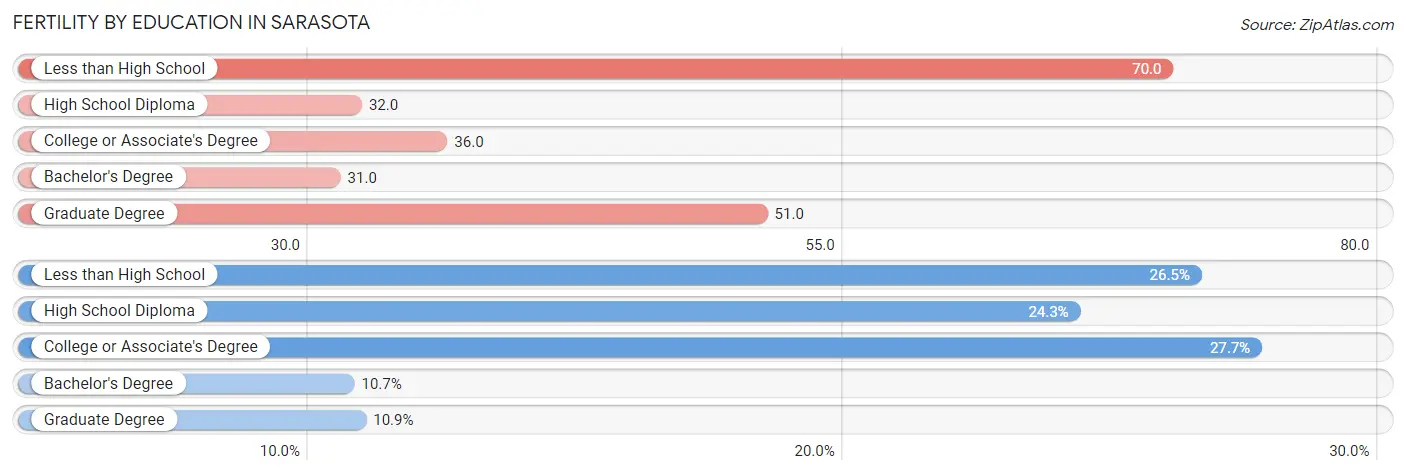
| Educational Attainment | Women with Births | Births / 1,000 Women |
| Less than High School | 117 (26.5%) | 70.0 |
| High School Diploma | 107 (24.3%) | 32.0 |
| College or Associate's Degree | 122 (27.7%) | 36.0 |
| Bachelor's Degree | 47 (10.7%) | 31.0 |
| Graduate Degree | 48 (10.9%) | 51.0 |
| Total | 441 (100.0%) | 41.0 |
Fertility by Education by Marriage Status in Sarasota
52.8% of women with births in Sarasota are unmarried. Women with the educational attainment of bachelor's degree are most likely to be married with 100.0% of them married at childbirth, while women with the educational attainment of high school diploma are least likely to be married with 87.8% of them unmarried at childbirth.
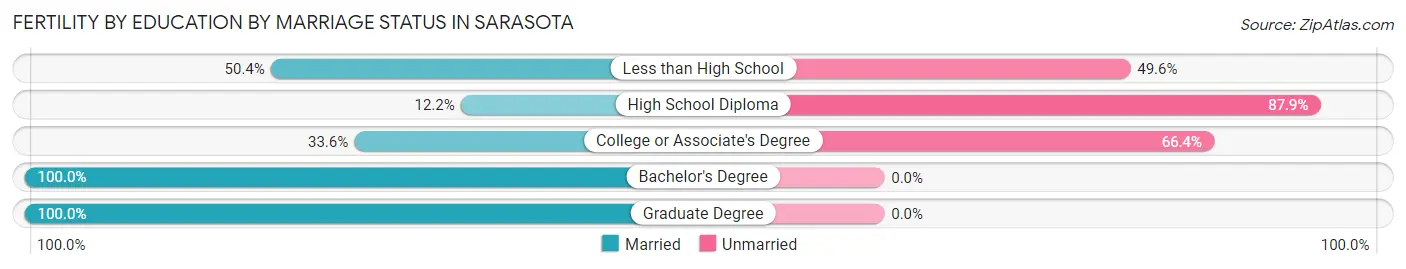
| Educational Attainment | Married | Unmarried |
| Less than High School | 59 (50.4%) | 58 (49.6%) |
| High School Diploma | 13 (12.1%) | 94 (87.8%) |
| College or Associate's Degree | 41 (33.6%) | 81 (66.4%) |
| Bachelor's Degree | 47 (100.0%) | 0 (0.0%) |
| Graduate Degree | 48 (100.0%) | 0 (0.0%) |
| Total | 208 (47.2%) | 233 (52.8%) |
Employment Characteristics in Sarasota
Employment by Class of Employer in Sarasota
Among the 24,654 employed individuals in Sarasota, private company employees (16,949 | 68.8%), self-employed (not incorporated) (2,199 | 8.9%), and self-employed (incorporated) (1,697 | 6.9%) make up the most common classes of employment.
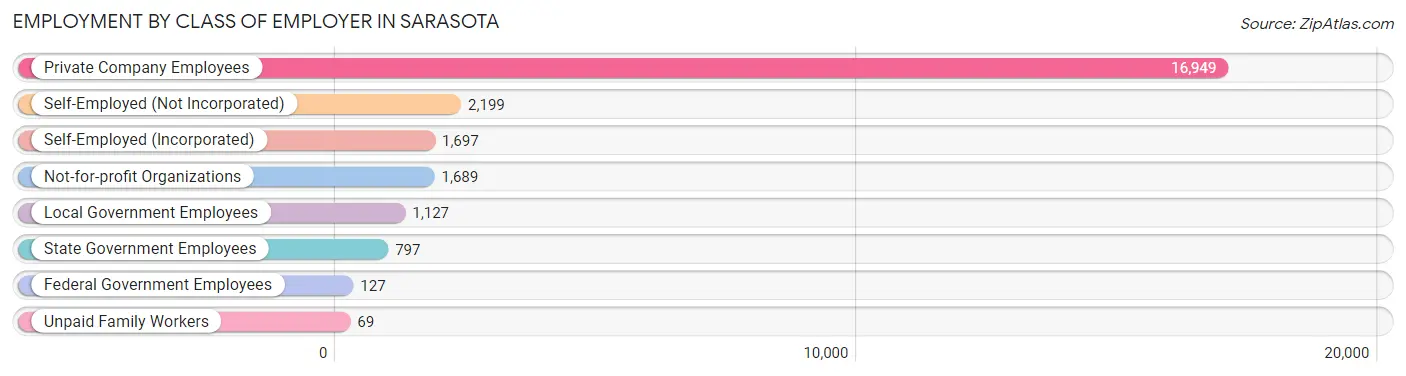
| Employer Class | # Employees | % Employees |
| Private Company Employees | 16,949 | 68.8% |
| Self-Employed (Incorporated) | 1,697 | 6.9% |
| Self-Employed (Not Incorporated) | 2,199 | 8.9% |
| Not-for-profit Organizations | 1,689 | 6.9% |
| Local Government Employees | 1,127 | 4.6% |
| State Government Employees | 797 | 3.2% |
| Federal Government Employees | 127 | 0.5% |
| Unpaid Family Workers | 69 | 0.3% |
| Total | 24,654 | 100.0% |
Employment Status by Age in Sarasota
According to the labor force statistics for Sarasota, out of the total population over 16 years of age (48,579), 53.1% or 25,795 individuals are in the labor force, with 2.9% or 748 of them unemployed. The age group with the highest labor force participation rate is 25 to 29 years, with 86.1% or 2,853 individuals in the labor force. Within the labor force, the 16 to 19 years age range has the highest percentage of unemployed individuals, with 8.3% or 75 of them being unemployed.
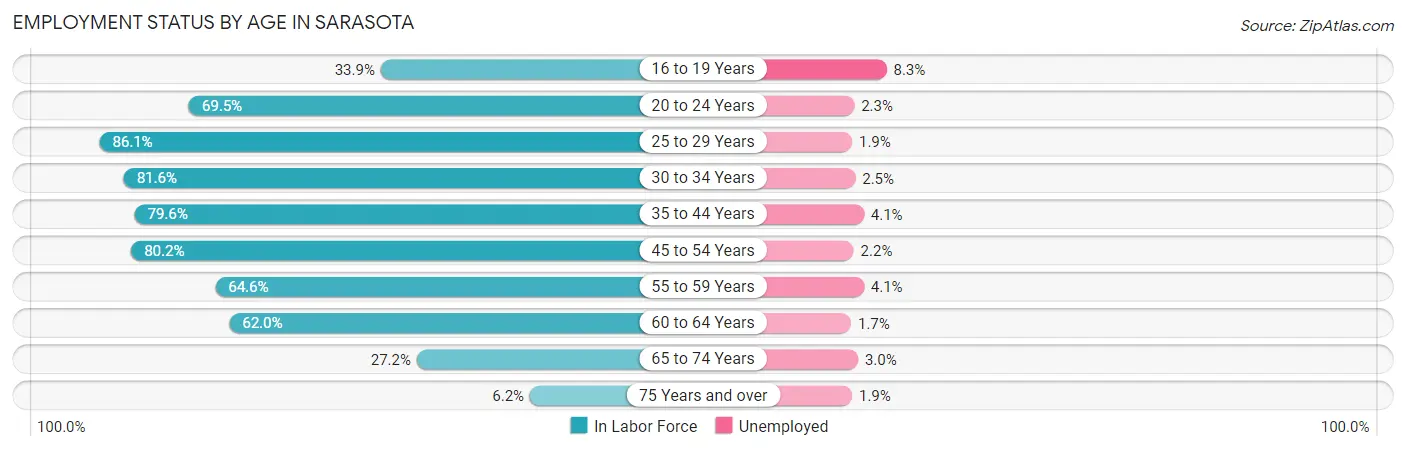
| Age Bracket | In Labor Force | Unemployed |
| 16 to 19 Years | 905 (33.9%) | 75 (8.3%) |
| 20 to 24 Years | 2,120 (69.5%) | 49 (2.3%) |
| 25 to 29 Years | 2,853 (86.1%) | 54 (1.9%) |
| 30 to 34 Years | 2,855 (81.6%) | 71 (2.5%) |
| 35 to 44 Years | 4,479 (79.6%) | 184 (4.1%) |
| 45 to 54 Years | 4,915 (80.2%) | 108 (2.2%) |
| 55 to 59 Years | 2,202 (64.6%) | 90 (4.1%) |
| 60 to 64 Years | 2,768 (62.0%) | 47 (1.7%) |
| 65 to 74 Years | 2,206 (27.2%) | 66 (3.0%) |
| 75 Years and over | 515 (6.2%) | 10 (1.9%) |
| Total | 25,795 (53.1%) | 748 (2.9%) |
Employment Status by Educational Attainment in Sarasota
According to labor force statistics for Sarasota, 75.9% of individuals (20,069) out of the total population between 25 and 64 years of age (26,441) are in the labor force, with 2.8% or 562 of them being unemployed. The group with the highest labor force participation rate are those with the educational attainment of bachelor's degree or higher, with 80.6% or 7,211 individuals in the labor force. Within the labor force, individuals with bachelor's degree or higher education have the highest percentage of unemployment, with 2.9% or 209 of them being unemployed.
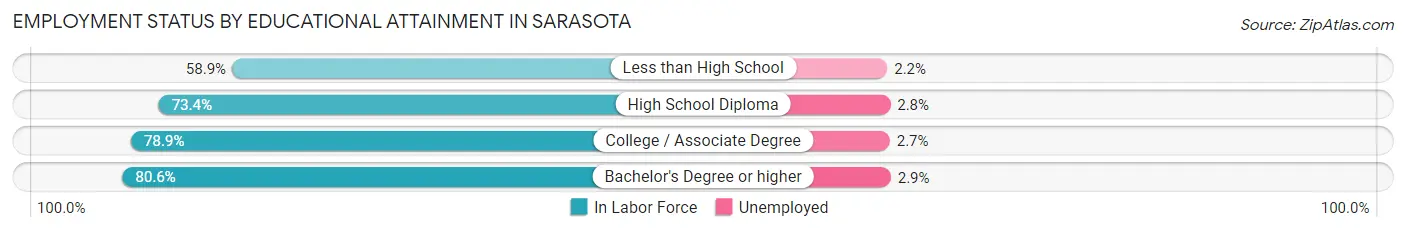
| Educational Attainment | In Labor Force | Unemployed |
| Less than High School | 1,475 (58.9%) | 55 (2.2%) |
| High School Diploma | 5,880 (73.4%) | 224 (2.8%) |
| College / Associate Degree | 5,506 (78.9%) | 188 (2.7%) |
| Bachelor's Degree or higher | 7,211 (80.6%) | 259 (2.9%) |
| Total | 20,069 (75.9%) | 740 (2.8%) |
Employment Occupations by Sex in Sarasota
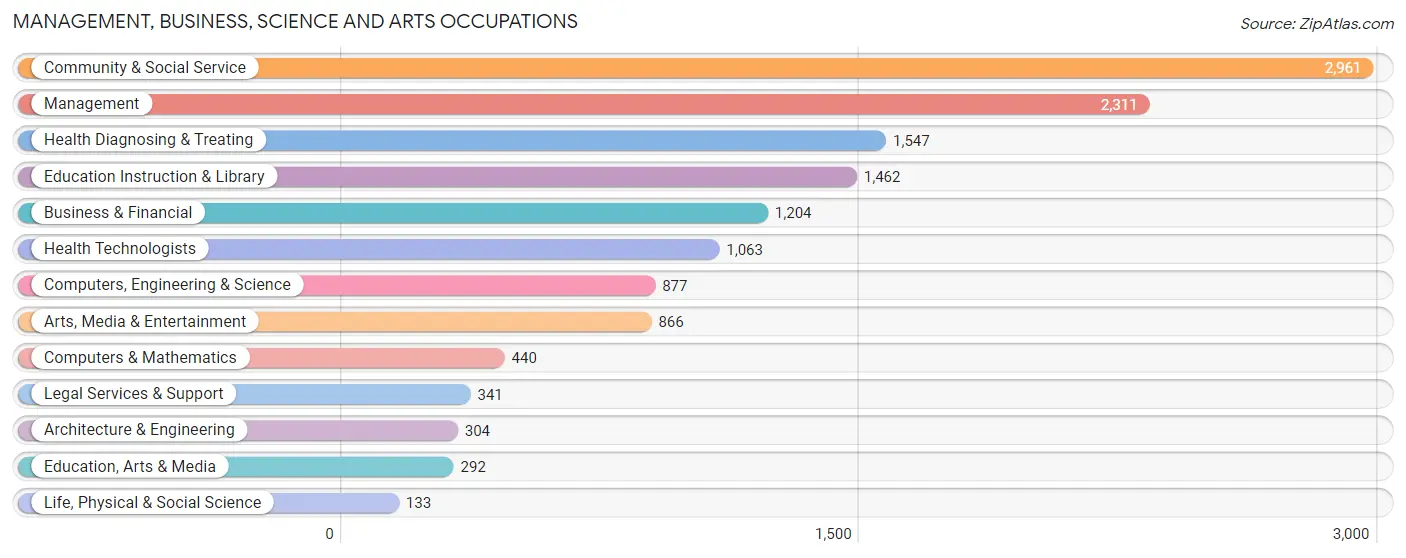
Management, Business, Science and Arts Occupations
The most common Management, Business, Science and Arts occupations in Sarasota are Community & Social Service (2,961 | 11.8%), Management (2,311 | 9.2%), Health Diagnosing & Treating (1,547 | 6.2%), Education Instruction & Library (1,462 | 5.8%), and Business & Financial (1,204 | 4.8%).
Management, Business, Science and Arts Occupations by Sex
Within the Management, Business, Science and Arts occupations in Sarasota, the most male-oriented occupations are Architecture & Engineering (73.7%), Management (70.2%), and Computers & Mathematics (66.8%), while the most female-oriented occupations are Education Instruction & Library (76.1%), Community & Social Service (63.0%), and Education, Arts & Media (61.6%).
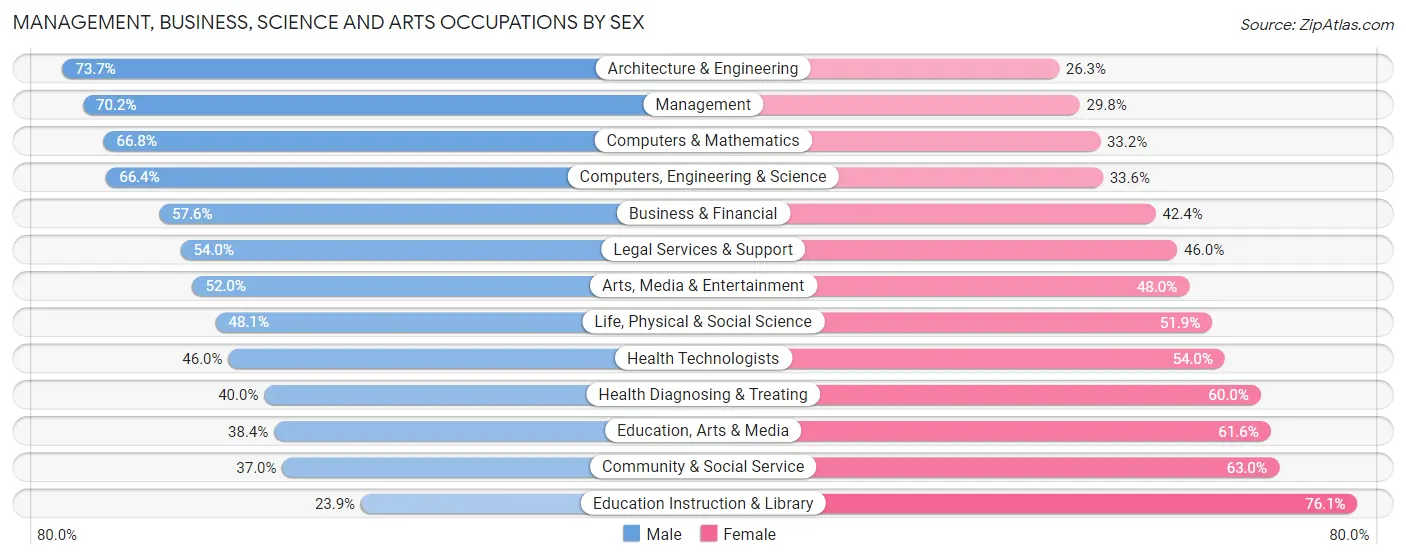
| Occupation | Male | Female |
| Management | 1,623 (70.2%) | 688 (29.8%) |
| Business & Financial | 693 (57.6%) | 511 (42.4%) |
| Computers, Engineering & Science | 582 (66.4%) | 295 (33.6%) |
| Computers & Mathematics | 294 (66.8%) | 146 (33.2%) |
| Architecture & Engineering | 224 (73.7%) | 80 (26.3%) |
| Life, Physical & Social Science | 64 (48.1%) | 69 (51.9%) |
| Community & Social Service | 1,095 (37.0%) | 1,866 (63.0%) |
| Education, Arts & Media | 112 (38.4%) | 180 (61.6%) |
| Legal Services & Support | 184 (54.0%) | 157 (46.0%) |
| Education Instruction & Library | 349 (23.9%) | 1,113 (76.1%) |
| Arts, Media & Entertainment | 450 (52.0%) | 416 (48.0%) |
| Health Diagnosing & Treating | 619 (40.0%) | 928 (60.0%) |
| Health Technologists | 489 (46.0%) | 574 (54.0%) |
| Total (Category) | 4,612 (51.8%) | 4,288 (48.2%) |
| Total (Overall) | 12,867 (51.3%) | 12,194 (48.7%) |
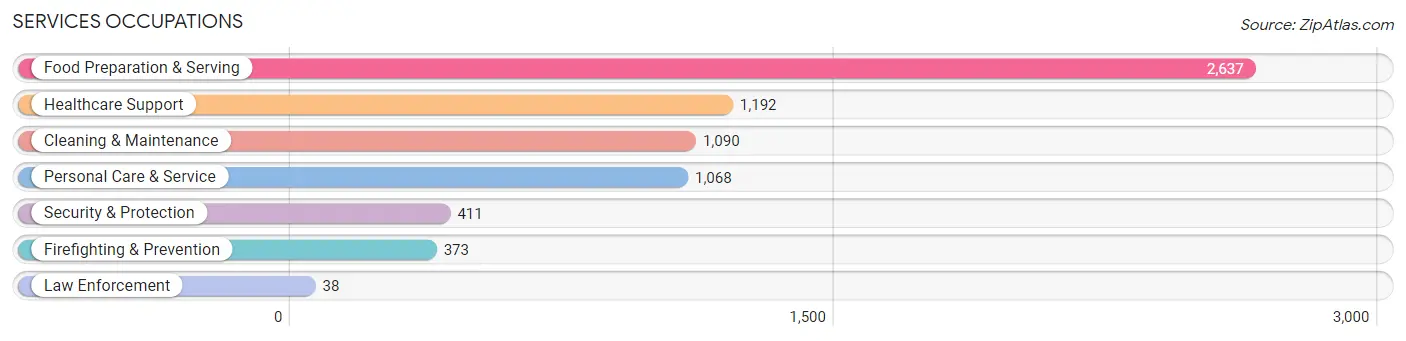
Services Occupations
The most common Services occupations in Sarasota are Food Preparation & Serving (2,637 | 10.5%), Healthcare Support (1,192 | 4.8%), Cleaning & Maintenance (1,090 | 4.3%), Personal Care & Service (1,068 | 4.3%), and Security & Protection (411 | 1.6%).
Services Occupations by Sex
Within the Services occupations in Sarasota, the most male-oriented occupations are Firefighting & Prevention (89.0%), Security & Protection (86.9%), and Law Enforcement (65.8%), while the most female-oriented occupations are Healthcare Support (89.8%), Personal Care & Service (80.5%), and Food Preparation & Serving (50.8%).
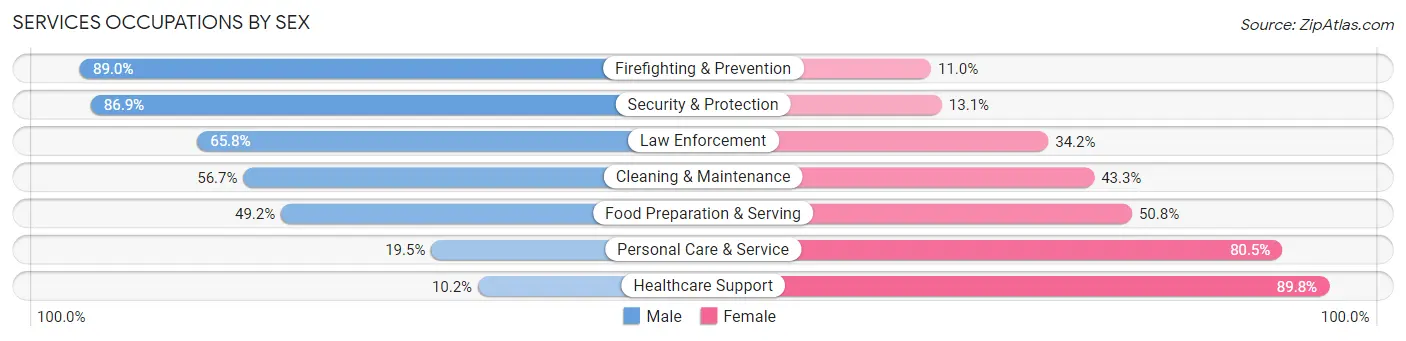
| Occupation | Male | Female |
| Healthcare Support | 122 (10.2%) | 1,070 (89.8%) |
| Security & Protection | 357 (86.9%) | 54 (13.1%) |
| Firefighting & Prevention | 332 (89.0%) | 41 (11.0%) |
| Law Enforcement | 25 (65.8%) | 13 (34.2%) |
| Food Preparation & Serving | 1,298 (49.2%) | 1,339 (50.8%) |
| Cleaning & Maintenance | 618 (56.7%) | 472 (43.3%) |
| Personal Care & Service | 208 (19.5%) | 860 (80.5%) |
| Total (Category) | 2,603 (40.7%) | 3,795 (59.3%) |
| Total (Overall) | 12,867 (51.3%) | 12,194 (48.7%) |
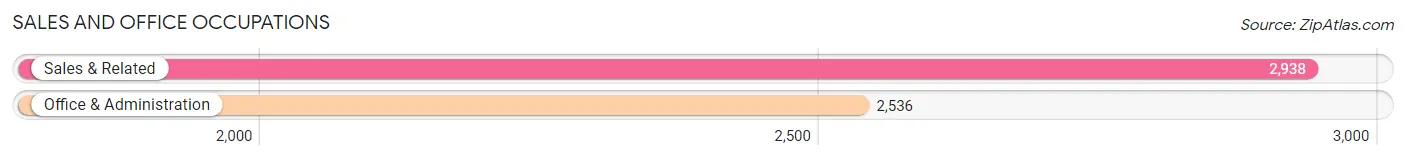
Sales and Office Occupations
The most common Sales and Office occupations in Sarasota are Sales & Related (2,938 | 11.7%), and Office & Administration (2,536 | 10.1%).
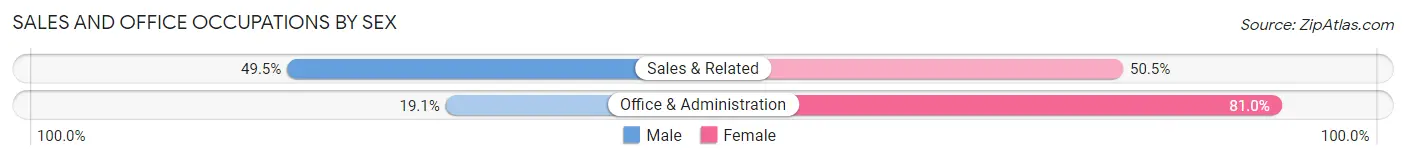
Sales and Office Occupations by Sex
| Occupation | Male | Female |
| Sales & Related | 1,455 (49.5%) | 1,483 (50.5%) |
| Office & Administration | 483 (19.1%) | 2,053 (80.9%) |
| Total (Category) | 1,938 (35.4%) | 3,536 (64.6%) |
| Total (Overall) | 12,867 (51.3%) | 12,194 (48.7%) |
Natural Resources, Construction and Maintenance Occupations
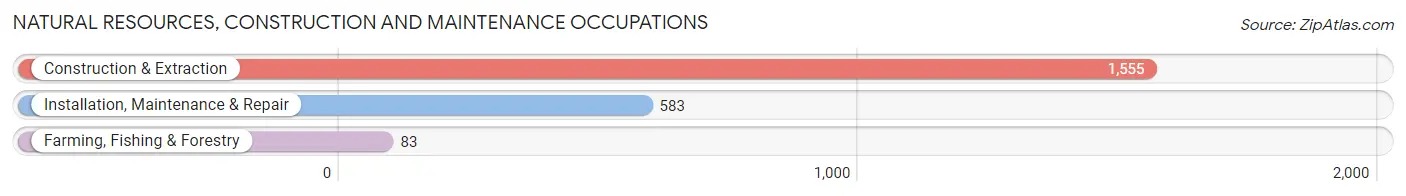
The most common Natural Resources, Construction and Maintenance occupations in Sarasota are Construction & Extraction (1,555 | 6.2%), Installation, Maintenance & Repair (583 | 2.3%), and Farming, Fishing & Forestry (83 | 0.3%).
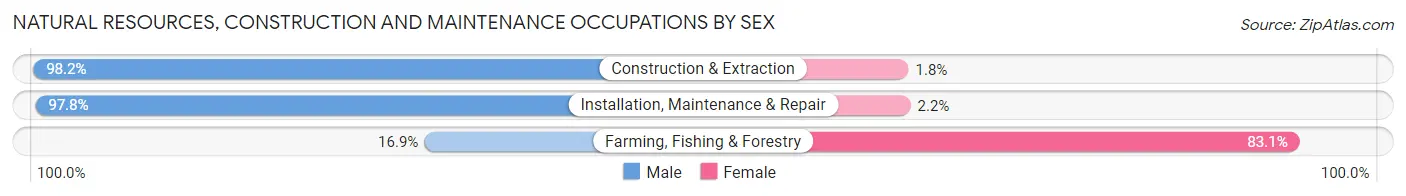
Natural Resources, Construction and Maintenance Occupations by Sex
| Occupation | Male | Female |
| Farming, Fishing & Forestry | 14 (16.9%) | 69 (83.1%) |
| Construction & Extraction | 1,527 (98.2%) | 28 (1.8%) |
| Installation, Maintenance & Repair | 570 (97.8%) | 13 (2.2%) |
| Total (Category) | 2,111 (95.1%) | 110 (5.0%) |
| Total (Overall) | 12,867 (51.3%) | 12,194 (48.7%) |
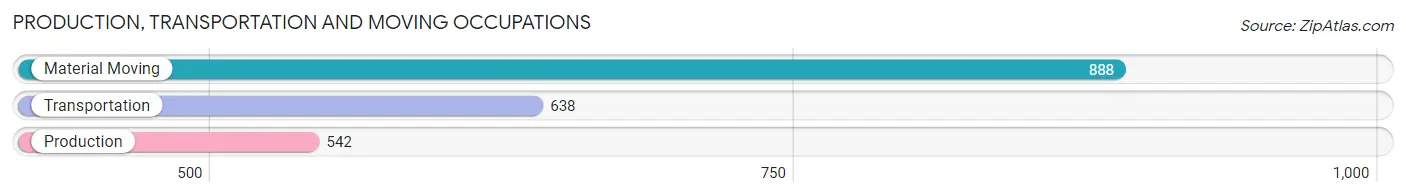
Production, Transportation and Moving Occupations
The most common Production, Transportation and Moving occupations in Sarasota are Material Moving (888 | 3.5%), Transportation (638 | 2.5%), and Production (542 | 2.2%).
Production, Transportation and Moving Occupations by Sex
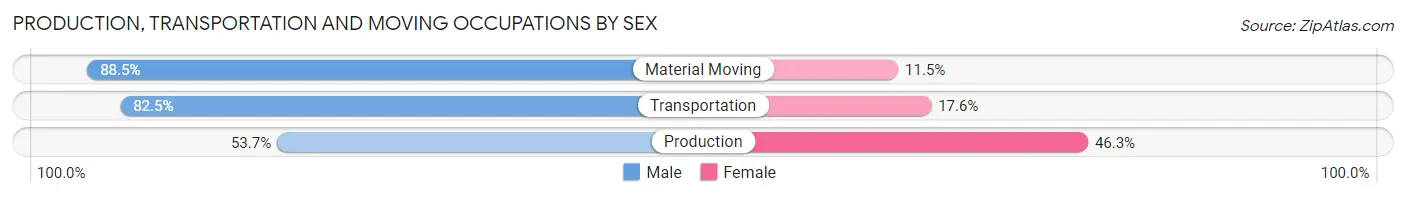
| Occupation | Male | Female |
| Production | 291 (53.7%) | 251 (46.3%) |
| Transportation | 526 (82.5%) | 112 (17.5%) |
| Material Moving | 786 (88.5%) | 102 (11.5%) |
| Total (Category) | 1,603 (77.5%) | 465 (22.5%) |
| Total (Overall) | 12,867 (51.3%) | 12,194 (48.7%) |
Employment Industries by Sex in Sarasota
Employment Industries in Sarasota
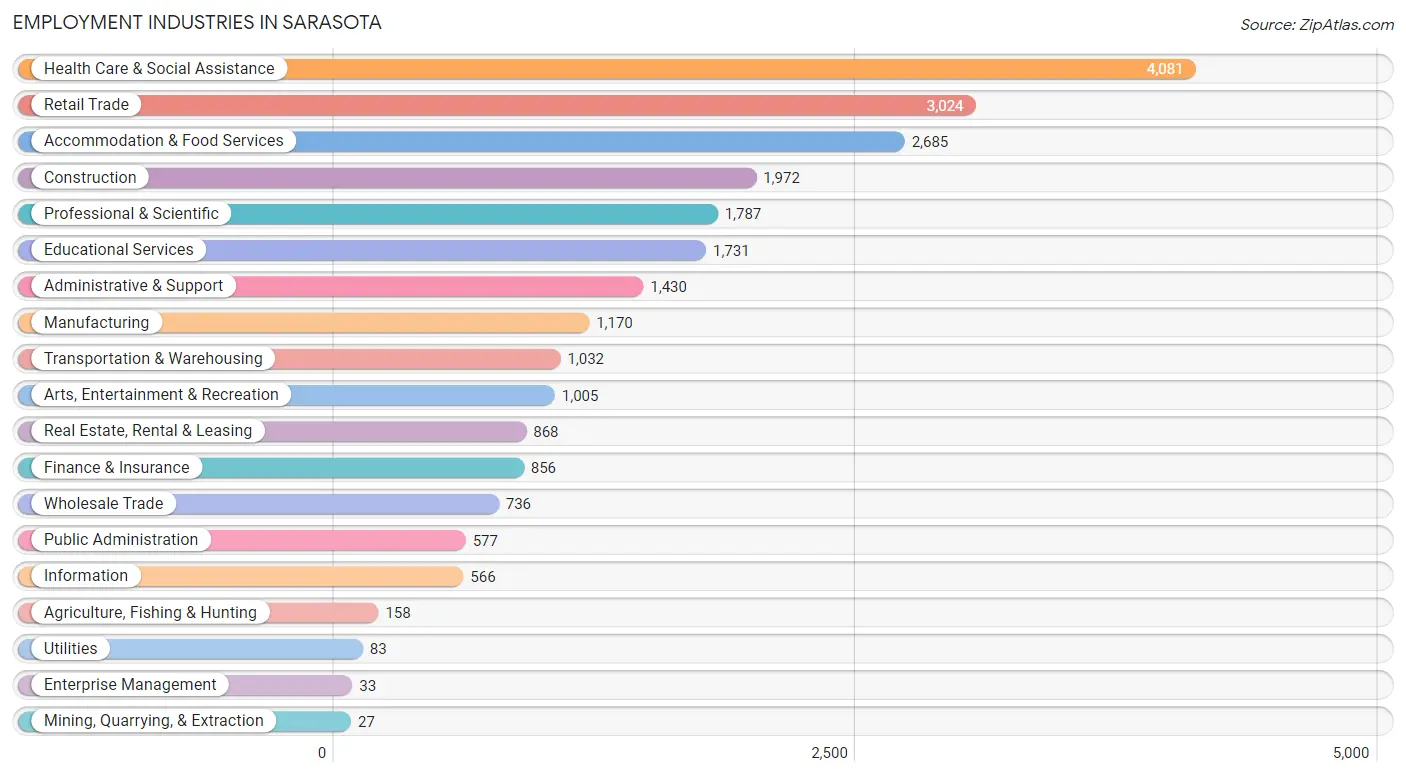
The major employment industries in Sarasota include Health Care & Social Assistance (4,081 | 16.3%), Retail Trade (3,024 | 12.1%), Accommodation & Food Services (2,685 | 10.7%), Construction (1,972 | 7.9%), and Professional & Scientific (1,787 | 7.1%).
Employment Industries by Sex in Sarasota
The Sarasota industries that see more men than women are Mining, Quarrying, & Extraction (100.0%), Enterprise Management (100.0%), and Construction (93.4%), whereas the industries that tend to have a higher number of women are Health Care & Social Assistance (73.1%), Educational Services (70.1%), and Finance & Insurance (53.7%).
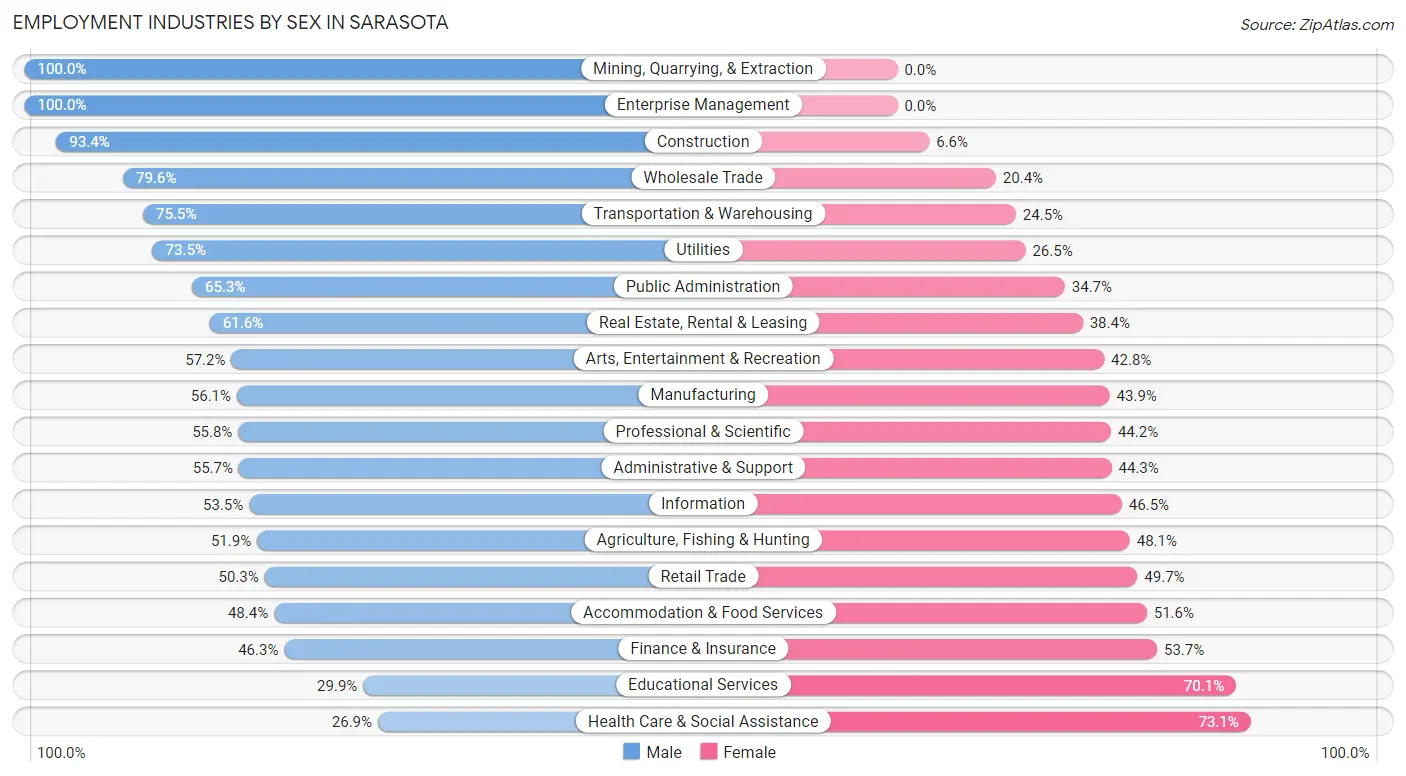
| Industry | Male | Female |
| Agriculture, Fishing & Hunting | 82 (51.9%) | 76 (48.1%) |
| Mining, Quarrying, & Extraction | 27 (100.0%) | 0 (0.0%) |
| Construction | 1,842 (93.4%) | 130 (6.6%) |
| Manufacturing | 656 (56.1%) | 514 (43.9%) |
| Wholesale Trade | 586 (79.6%) | 150 (20.4%) |
| Retail Trade | 1,522 (50.3%) | 1,502 (49.7%) |
| Transportation & Warehousing | 779 (75.5%) | 253 (24.5%) |
| Utilities | 61 (73.5%) | 22 (26.5%) |
| Information | 303 (53.5%) | 263 (46.5%) |
| Finance & Insurance | 396 (46.3%) | 460 (53.7%) |
| Real Estate, Rental & Leasing | 535 (61.6%) | 333 (38.4%) |
| Professional & Scientific | 997 (55.8%) | 790 (44.2%) |
| Enterprise Management | 33 (100.0%) | 0 (0.0%) |
| Administrative & Support | 796 (55.7%) | 634 (44.3%) |
| Educational Services | 518 (29.9%) | 1,213 (70.1%) |
| Health Care & Social Assistance | 1,097 (26.9%) | 2,984 (73.1%) |
| Arts, Entertainment & Recreation | 575 (57.2%) | 430 (42.8%) |
| Accommodation & Food Services | 1,299 (48.4%) | 1,386 (51.6%) |
| Public Administration | 377 (65.3%) | 200 (34.7%) |
| Total | 12,867 (51.3%) | 12,194 (48.7%) |
Education in Sarasota
School Enrollment in Sarasota
The most common levels of schooling among the 9,360 students in Sarasota are college / undergraduate (2,972 | 31.8%), middle school (1,966 | 21.0%), and high school (1,872 | 20.0%).
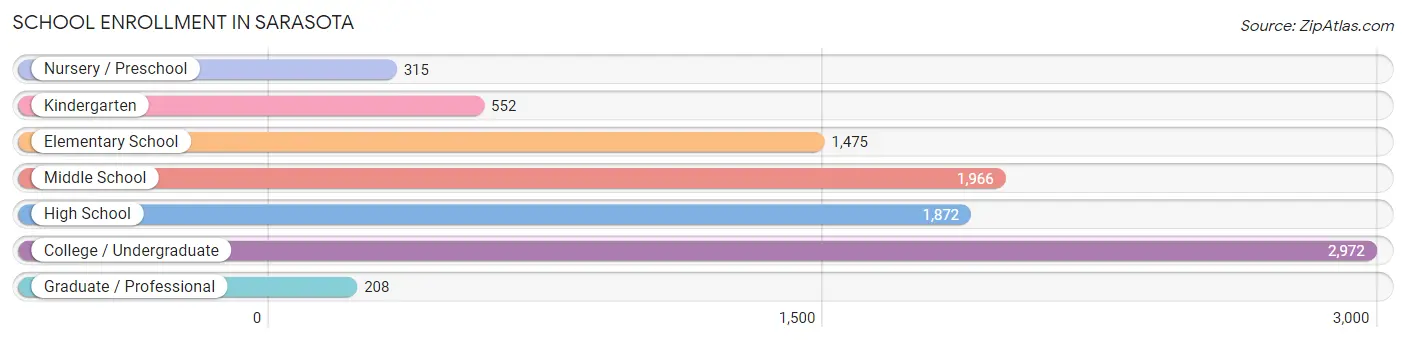
| School Level | # Students | % Students |
| Nursery / Preschool | 315 | 3.4% |
| Kindergarten | 552 | 5.9% |
| Elementary School | 1,475 | 15.8% |
| Middle School | 1,966 | 21.0% |
| High School | 1,872 | 20.0% |
| College / Undergraduate | 2,972 | 31.8% |
| Graduate / Professional | 208 | 2.2% |
| Total | 9,360 | 100.0% |
School Enrollment by Age by Funding Source in Sarasota
Out of a total of 9,360 students who are enrolled in schools in Sarasota, 2,228 (23.8%) attend a private institution, while the remaining 7,132 (76.2%) are enrolled in public schools. The age group of 3 to 4 year olds has the highest likelihood of being enrolled in private schools, with 170 (59.9% in the age bracket) enrolled. Conversely, the age group of 5 to 9 year old has the lowest likelihood of being enrolled in a private school, with 1,683 (94.2% in the age bracket) attending a public institution.
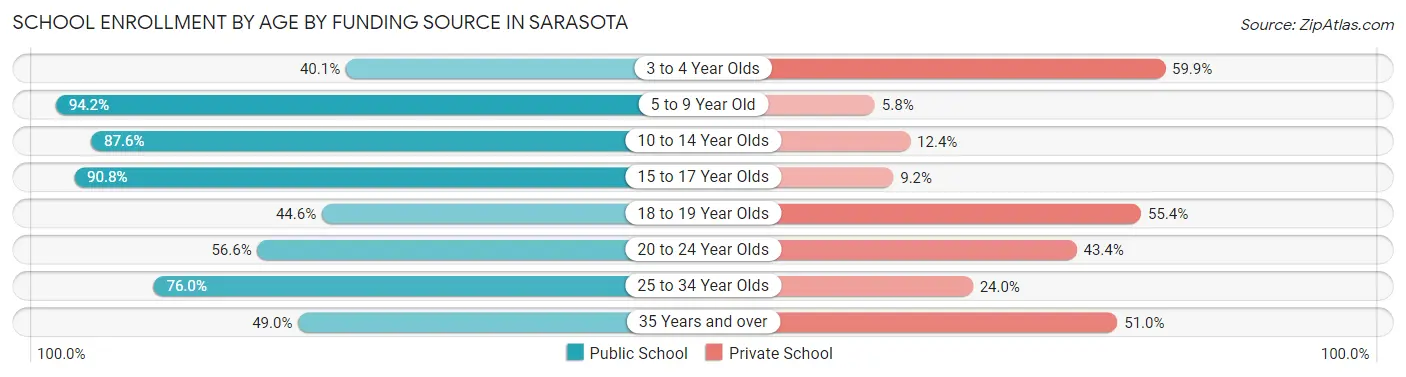
| Age Bracket | Public School | Private School |
| 3 to 4 Year Olds | 114 (40.1%) | 170 (59.9%) |
| 5 to 9 Year Old | 1,683 (94.2%) | 104 (5.8%) |
| 10 to 14 Year Olds | 2,131 (87.6%) | 301 (12.4%) |
| 15 to 17 Year Olds | 1,355 (90.8%) | 138 (9.2%) |
| 18 to 19 Year Olds | 554 (44.6%) | 688 (55.4%) |
| 20 to 24 Year Olds | 676 (56.6%) | 518 (43.4%) |
| 25 to 34 Year Olds | 471 (76.0%) | 149 (24.0%) |
| 35 Years and over | 151 (49.0%) | 157 (51.0%) |
| Total | 7,132 (76.2%) | 2,228 (23.8%) |
Educational Attainment by Field of Study in Sarasota
Business (3,815 | 20.3%), social sciences (2,110 | 11.2%), science & technology (2,069 | 11.0%), education (2,012 | 10.7%), and bio, nature & agricultural (1,174 | 6.2%) are the most common fields of study among 18,772 individuals in Sarasota who have obtained a bachelor's degree or higher.
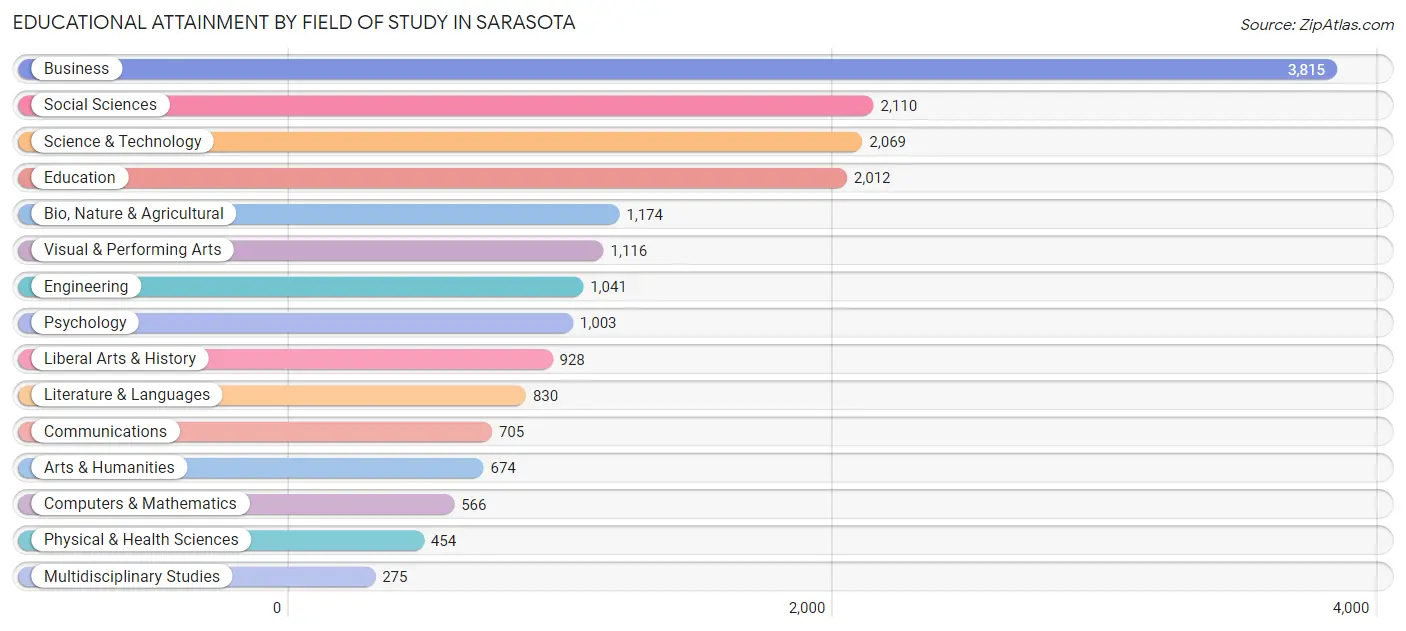
| Field of Study | # Graduates | % Graduates |
| Computers & Mathematics | 566 | 3.0% |
| Bio, Nature & Agricultural | 1,174 | 6.2% |
| Physical & Health Sciences | 454 | 2.4% |
| Psychology | 1,003 | 5.3% |
| Social Sciences | 2,110 | 11.2% |
| Engineering | 1,041 | 5.6% |
| Multidisciplinary Studies | 275 | 1.5% |
| Science & Technology | 2,069 | 11.0% |
| Business | 3,815 | 20.3% |
| Education | 2,012 | 10.7% |
| Literature & Languages | 830 | 4.4% |
| Liberal Arts & History | 928 | 4.9% |
| Visual & Performing Arts | 1,116 | 5.9% |
| Communications | 705 | 3.8% |
| Arts & Humanities | 674 | 3.6% |
| Total | 18,772 | 100.0% |
Transportation & Commute in Sarasota
Vehicle Availability by Sex in Sarasota
The most prevalent vehicle ownership categories in Sarasota are males with 2 vehicles (5,688, accounting for 45.5%) and females with 2 vehicles (4,841, making up 48.5%).
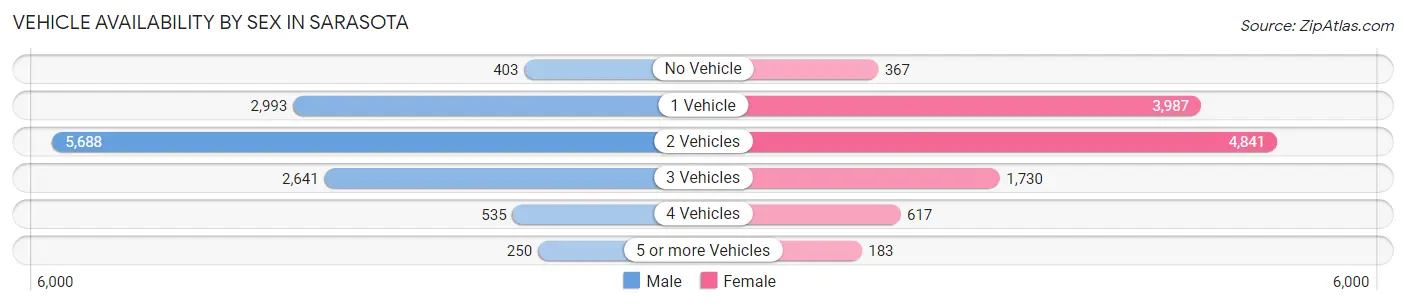
| Vehicles Available | Male | Female |
| No Vehicle | 403 (3.2%) | 367 (3.1%) |
| 1 Vehicle | 2,993 (23.9%) | 3,987 (34.0%) |
| 2 Vehicles | 5,688 (45.5%) | 4,841 (41.3%) |
| 3 Vehicles | 2,641 (21.1%) | 1,730 (14.7%) |
| 4 Vehicles | 535 (4.3%) | 617 (5.3%) |
| 5 or more Vehicles | 250 (2.0%) | 183 (1.6%) |
| Total | 12,510 (100.0%) | 11,725 (100.0%) |
Commute Time in Sarasota
The most frequently occuring commute durations in Sarasota are 20 to 24 minutes (5,737 commuters, 26.8%), 15 to 19 minutes (4,085 commuters, 19.0%), and 30 to 34 minutes (3,647 commuters, 17.0%).
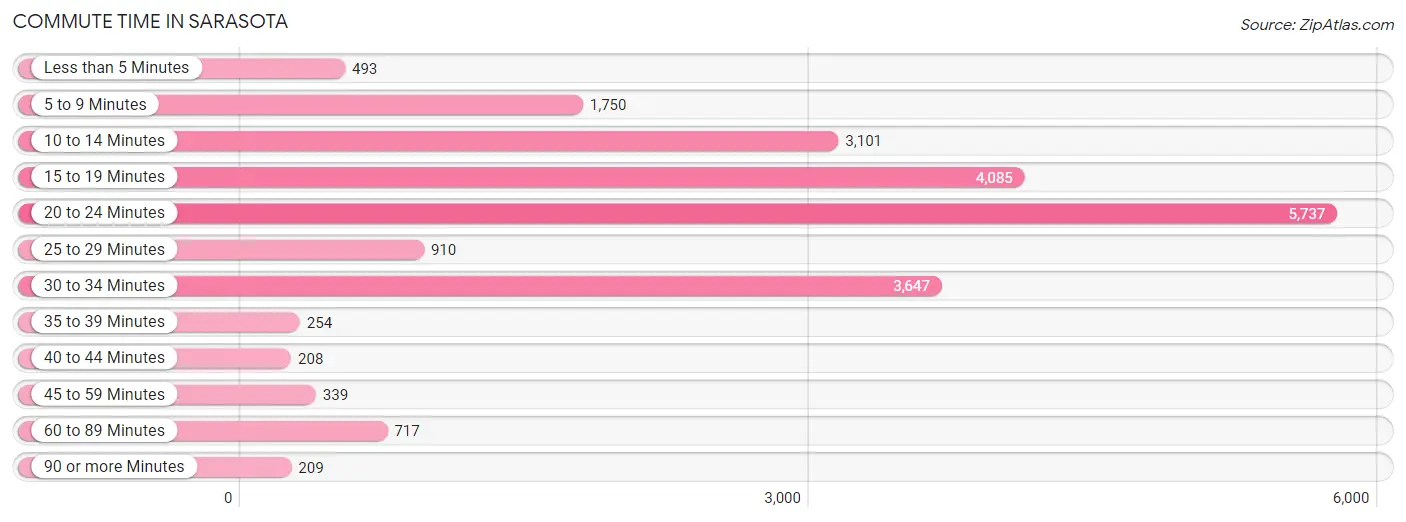
| Commute Time | # Commuters | % Commuters |
| Less than 5 Minutes | 493 | 2.3% |
| 5 to 9 Minutes | 1,750 | 8.2% |
| 10 to 14 Minutes | 3,101 | 14.5% |
| 15 to 19 Minutes | 4,085 | 19.0% |
| 20 to 24 Minutes | 5,737 | 26.8% |
| 25 to 29 Minutes | 910 | 4.2% |
| 30 to 34 Minutes | 3,647 | 17.0% |
| 35 to 39 Minutes | 254 | 1.2% |
| 40 to 44 Minutes | 208 | 1.0% |
| 45 to 59 Minutes | 339 | 1.6% |
| 60 to 89 Minutes | 717 | 3.3% |
| 90 or more Minutes | 209 | 1.0% |
Commute Time by Sex in Sarasota
The most common commute times in Sarasota are 20 to 24 minutes (2,954 commuters, 27.1%) for males and 20 to 24 minutes (2,783 commuters, 26.4%) for females.
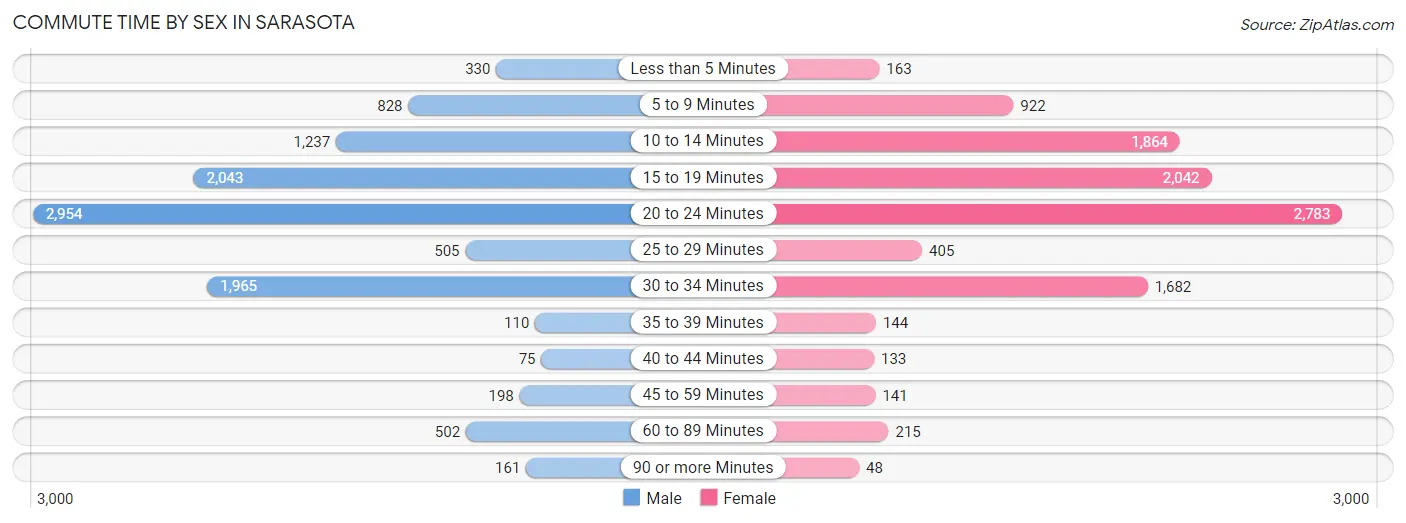
| Commute Time | Male | Female |
| Less than 5 Minutes | 330 (3.0%) | 163 (1.5%) |
| 5 to 9 Minutes | 828 (7.6%) | 922 (8.7%) |
| 10 to 14 Minutes | 1,237 (11.3%) | 1,864 (17.7%) |
| 15 to 19 Minutes | 2,043 (18.7%) | 2,042 (19.4%) |
| 20 to 24 Minutes | 2,954 (27.1%) | 2,783 (26.4%) |
| 25 to 29 Minutes | 505 (4.6%) | 405 (3.8%) |
| 30 to 34 Minutes | 1,965 (18.0%) | 1,682 (16.0%) |
| 35 to 39 Minutes | 110 (1.0%) | 144 (1.4%) |
| 40 to 44 Minutes | 75 (0.7%) | 133 (1.3%) |
| 45 to 59 Minutes | 198 (1.8%) | 141 (1.3%) |
| 60 to 89 Minutes | 502 (4.6%) | 215 (2.0%) |
| 90 or more Minutes | 161 (1.5%) | 48 (0.5%) |
Time of Departure to Work by Sex in Sarasota
The most frequent times of departure to work in Sarasota are 7:00 AM to 7:29 AM (1,797, 16.5%) for males and 8:00 AM to 8:29 AM (1,776, 16.9%) for females.
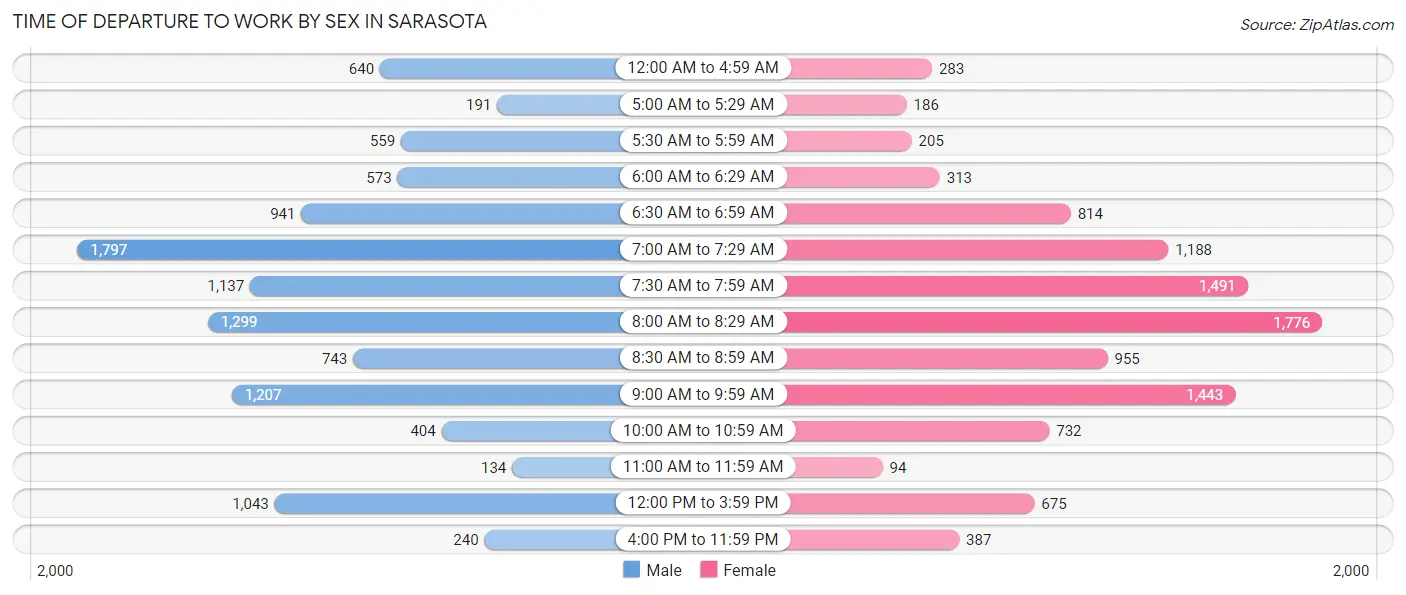
| Time of Departure | Male | Female |
| 12:00 AM to 4:59 AM | 640 (5.9%) | 283 (2.7%) |
| 5:00 AM to 5:29 AM | 191 (1.8%) | 186 (1.8%) |
| 5:30 AM to 5:59 AM | 559 (5.1%) | 205 (1.9%) |
| 6:00 AM to 6:29 AM | 573 (5.2%) | 313 (3.0%) |
| 6:30 AM to 6:59 AM | 941 (8.6%) | 814 (7.7%) |
| 7:00 AM to 7:29 AM | 1,797 (16.5%) | 1,188 (11.3%) |
| 7:30 AM to 7:59 AM | 1,137 (10.4%) | 1,491 (14.1%) |
| 8:00 AM to 8:29 AM | 1,299 (11.9%) | 1,776 (16.9%) |
| 8:30 AM to 8:59 AM | 743 (6.8%) | 955 (9.1%) |
| 9:00 AM to 9:59 AM | 1,207 (11.1%) | 1,443 (13.7%) |
| 10:00 AM to 10:59 AM | 404 (3.7%) | 732 (6.9%) |
| 11:00 AM to 11:59 AM | 134 (1.2%) | 94 (0.9%) |
| 12:00 PM to 3:59 PM | 1,043 (9.6%) | 675 (6.4%) |
| 4:00 PM to 11:59 PM | 240 (2.2%) | 387 (3.7%) |
| Total | 10,908 (100.0%) | 10,542 (100.0%) |
Housing Occupancy in Sarasota
Occupancy by Ownership in Sarasota
Of the total 24,882 dwellings in Sarasota, owner-occupied units account for 14,112 (56.7%), while renter-occupied units make up 10,770 (43.3%).
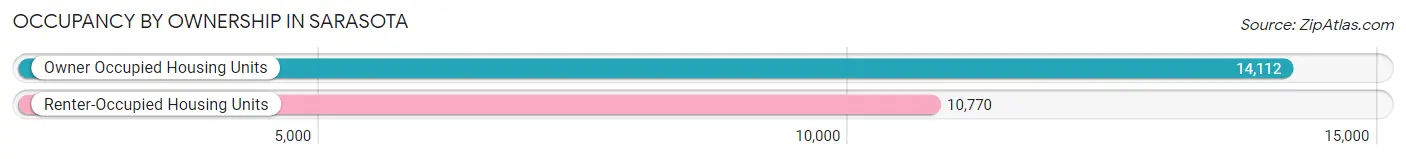
| Occupancy | # Housing Units | % Housing Units |
| Owner Occupied Housing Units | 14,112 | 56.7% |
| Renter-Occupied Housing Units | 10,770 | 43.3% |
| Total Occupied Housing Units | 24,882 | 100.0% |
Occupancy by Household Size in Sarasota
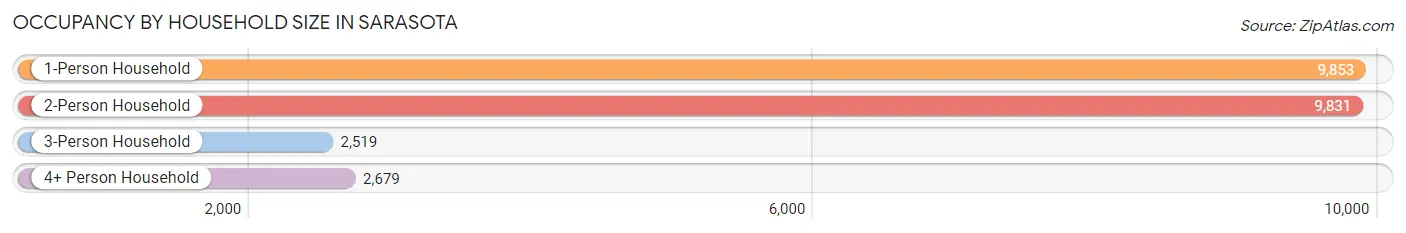
| Household Size | # Housing Units | % Housing Units |
| 1-Person Household | 9,853 | 39.6% |
| 2-Person Household | 9,831 | 39.5% |
| 3-Person Household | 2,519 | 10.1% |
| 4+ Person Household | 2,679 | 10.8% |
| Total Housing Units | 24,882 | 100.0% |
Occupancy by Ownership by Household Size in Sarasota
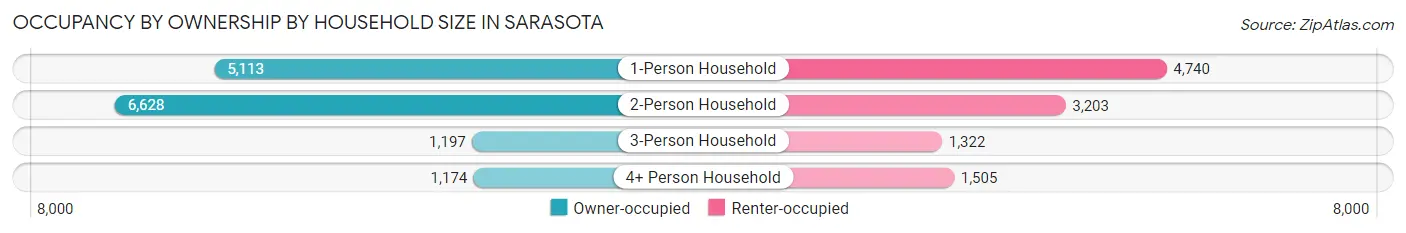
| Household Size | Owner-occupied | Renter-occupied |
| 1-Person Household | 5,113 (51.9%) | 4,740 (48.1%) |
| 2-Person Household | 6,628 (67.4%) | 3,203 (32.6%) |
| 3-Person Household | 1,197 (47.5%) | 1,322 (52.5%) |
| 4+ Person Household | 1,174 (43.8%) | 1,505 (56.2%) |
| Total Housing Units | 14,112 (56.7%) | 10,770 (43.3%) |
Occupancy by Educational Attainment in Sarasota
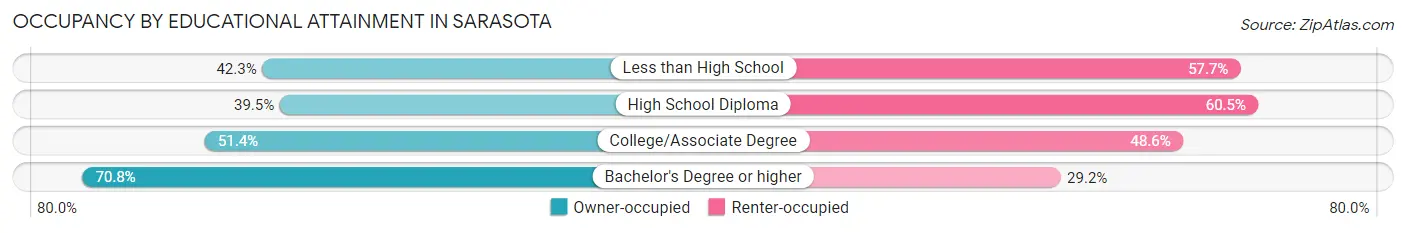
| Household Size | Owner-occupied | Renter-occupied |
| Less than High School | 733 (42.3%) | 1,001 (57.7%) |
| High School Diploma | 2,168 (39.5%) | 3,324 (60.5%) |
| College/Associate Degree | 3,422 (51.4%) | 3,236 (48.6%) |
| Bachelor's Degree or higher | 7,789 (70.8%) | 3,209 (29.2%) |
Occupancy by Age of Householder in Sarasota
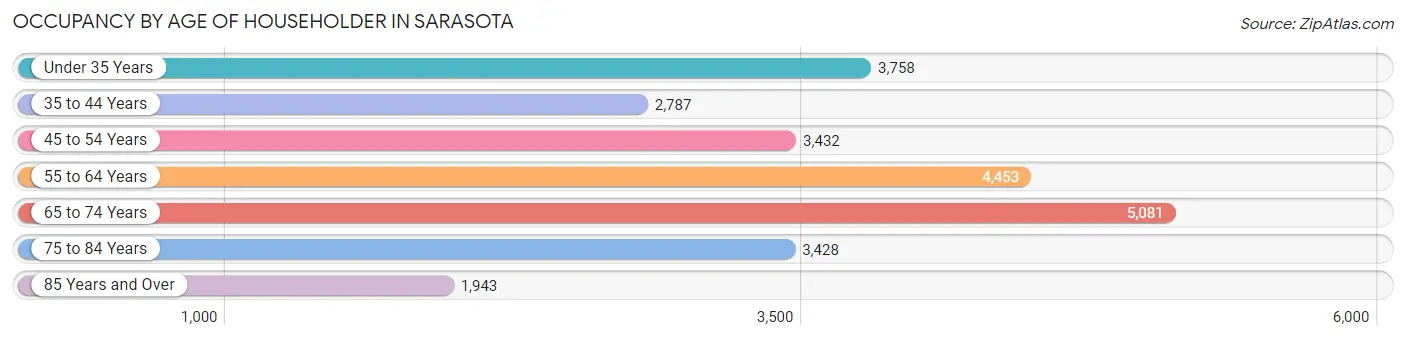
| Age Bracket | # Households | % Households |
| Under 35 Years | 3,758 | 15.1% |
| 35 to 44 Years | 2,787 | 11.2% |
| 45 to 54 Years | 3,432 | 13.8% |
| 55 to 64 Years | 4,453 | 17.9% |
| 65 to 74 Years | 5,081 | 20.4% |
| 75 to 84 Years | 3,428 | 13.8% |
| 85 Years and Over | 1,943 | 7.8% |
| Total | 24,882 | 100.0% |
Housing Finances in Sarasota
Median Income by Occupancy in Sarasota
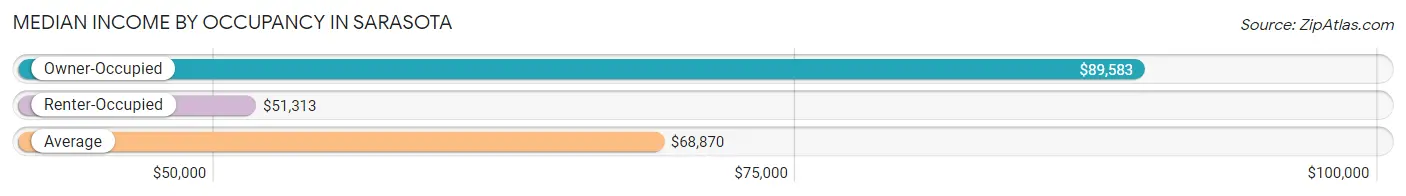
| Occupancy Type | # Households | Median Income |
| Owner-Occupied | 14,112 (56.7%) | $89,583 |
| Renter-Occupied | 10,770 (43.3%) | $51,313 |
| Average | 24,882 (100.0%) | $68,870 |
Occupancy by Householder Income Bracket in Sarasota
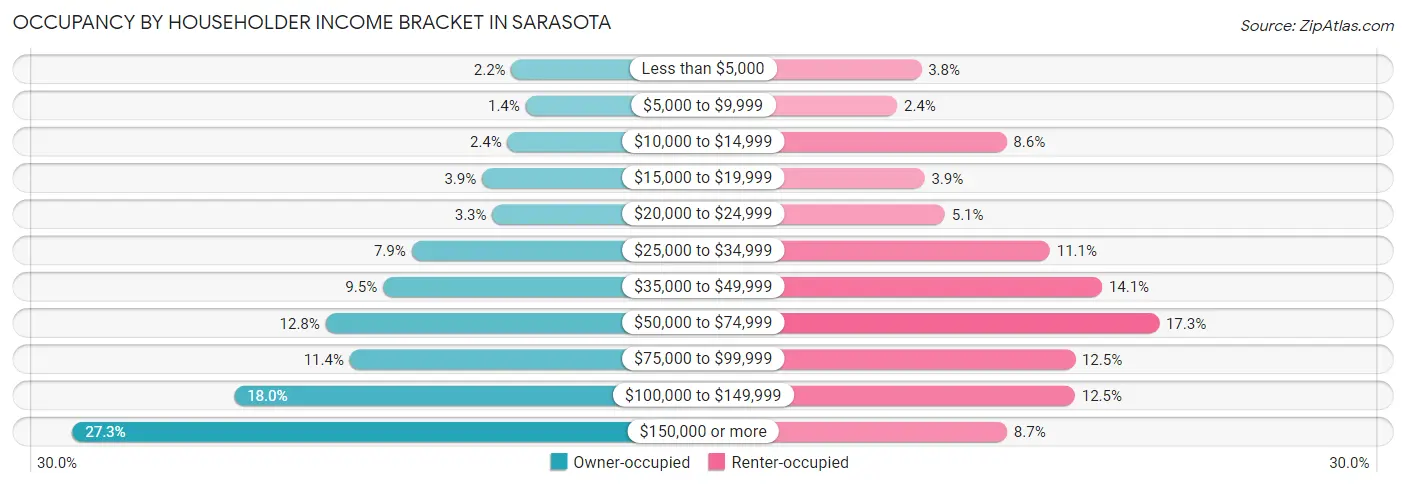
| Income Bracket | Owner-occupied | Renter-occupied |
| Less than $5,000 | 308 (2.2%) | 404 (3.7%) |
| $5,000 to $9,999 | 194 (1.4%) | 255 (2.4%) |
| $10,000 to $14,999 | 338 (2.4%) | 928 (8.6%) |
| $15,000 to $19,999 | 545 (3.9%) | 424 (3.9%) |
| $20,000 to $24,999 | 461 (3.3%) | 549 (5.1%) |
| $25,000 to $34,999 | 1,113 (7.9%) | 1,195 (11.1%) |
| $35,000 to $49,999 | 1,343 (9.5%) | 1,516 (14.1%) |
| $50,000 to $74,999 | 1,807 (12.8%) | 1,867 (17.3%) |
| $75,000 to $99,999 | 1,612 (11.4%) | 1,351 (12.5%) |
| $100,000 to $149,999 | 2,543 (18.0%) | 1,349 (12.5%) |
| $150,000 or more | 3,848 (27.3%) | 932 (8.6%) |
| Total | 14,112 (100.0%) | 10,770 (100.0%) |
Monthly Housing Cost Tiers in Sarasota
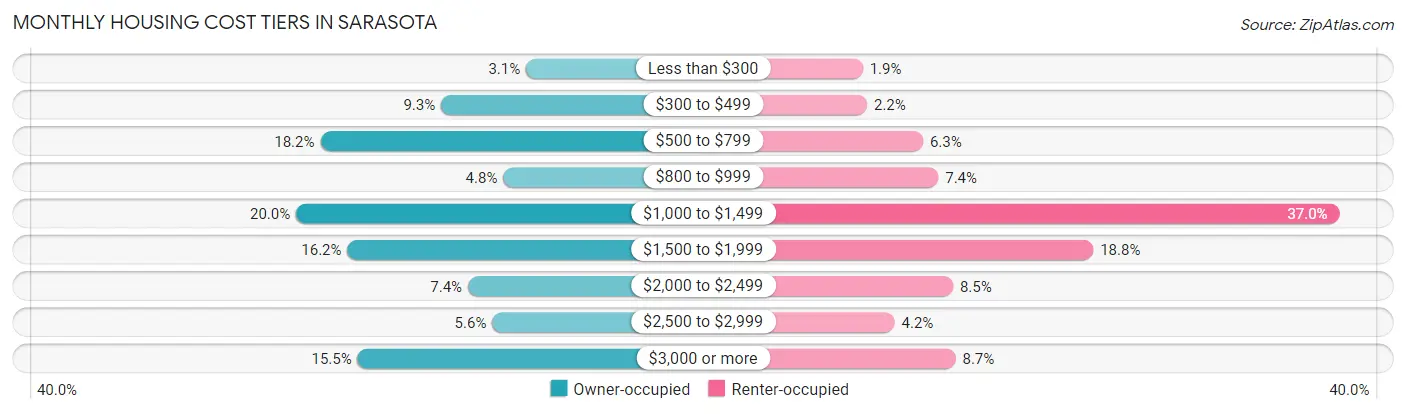
| Monthly Cost | Owner-occupied | Renter-occupied |
| Less than $300 | 433 (3.1%) | 200 (1.9%) |
| $300 to $499 | 1,317 (9.3%) | 235 (2.2%) |
| $500 to $799 | 2,571 (18.2%) | 678 (6.3%) |
| $800 to $999 | 671 (4.8%) | 800 (7.4%) |
| $1,000 to $1,499 | 2,824 (20.0%) | 3,982 (37.0%) |
| $1,500 to $1,999 | 2,290 (16.2%) | 2,029 (18.8%) |
| $2,000 to $2,499 | 1,037 (7.3%) | 916 (8.5%) |
| $2,500 to $2,999 | 785 (5.6%) | 453 (4.2%) |
| $3,000 or more | 2,184 (15.5%) | 937 (8.7%) |
| Total | 14,112 (100.0%) | 10,770 (100.0%) |
Physical Housing Characteristics in Sarasota
Housing Structures in Sarasota
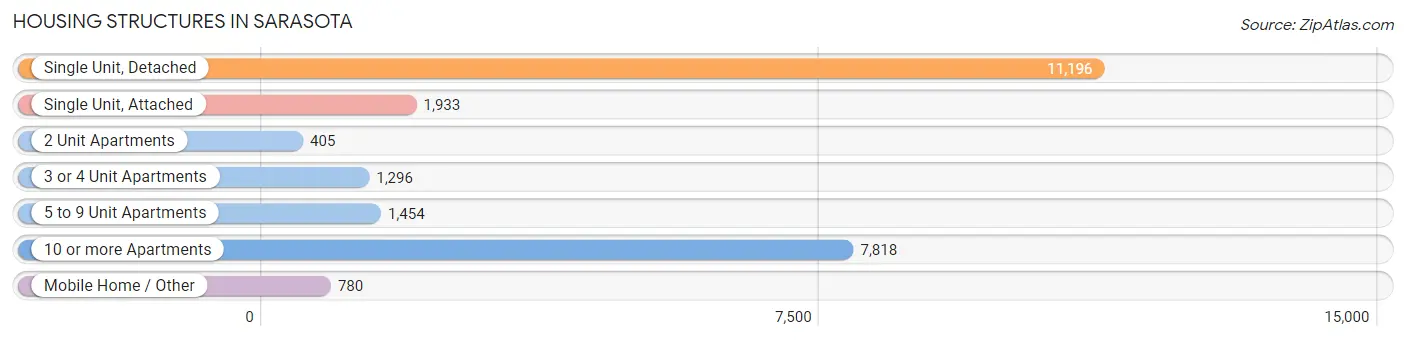
| Structure Type | # Housing Units | % Housing Units |
| Single Unit, Detached | 11,196 | 45.0% |
| Single Unit, Attached | 1,933 | 7.8% |
| 2 Unit Apartments | 405 | 1.6% |
| 3 or 4 Unit Apartments | 1,296 | 5.2% |
| 5 to 9 Unit Apartments | 1,454 | 5.8% |
| 10 or more Apartments | 7,818 | 31.4% |
| Mobile Home / Other | 780 | 3.1% |
| Total | 24,882 | 100.0% |
Housing Structures by Occupancy in Sarasota
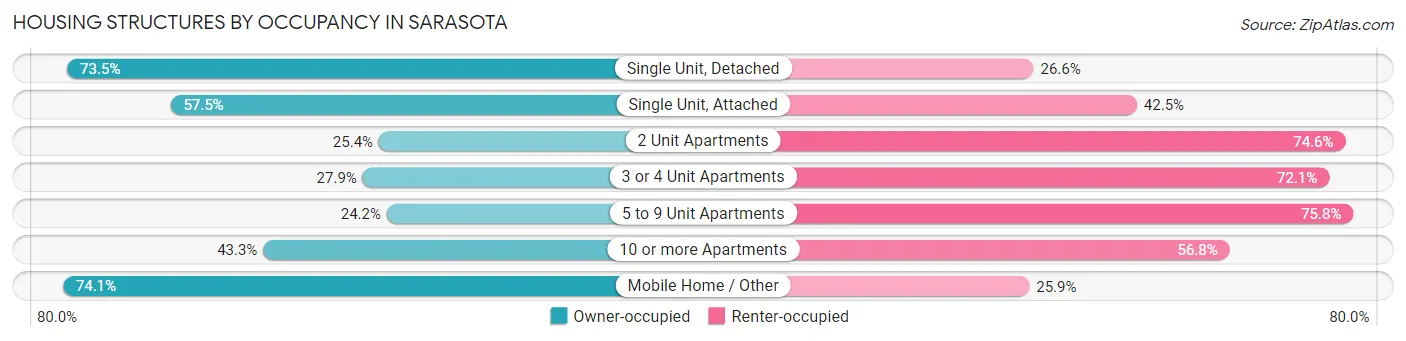
| Structure Type | Owner-occupied | Renter-occupied |
| Single Unit, Detached | 8,224 (73.5%) | 2,972 (26.6%) |
| Single Unit, Attached | 1,112 (57.5%) | 821 (42.5%) |
| 2 Unit Apartments | 103 (25.4%) | 302 (74.6%) |
| 3 or 4 Unit Apartments | 362 (27.9%) | 934 (72.1%) |
| 5 to 9 Unit Apartments | 352 (24.2%) | 1,102 (75.8%) |
| 10 or more Apartments | 3,381 (43.2%) | 4,437 (56.8%) |
| Mobile Home / Other | 578 (74.1%) | 202 (25.9%) |
| Total | 14,112 (56.7%) | 10,770 (43.3%) |
Housing Structures by Number of Rooms in Sarasota
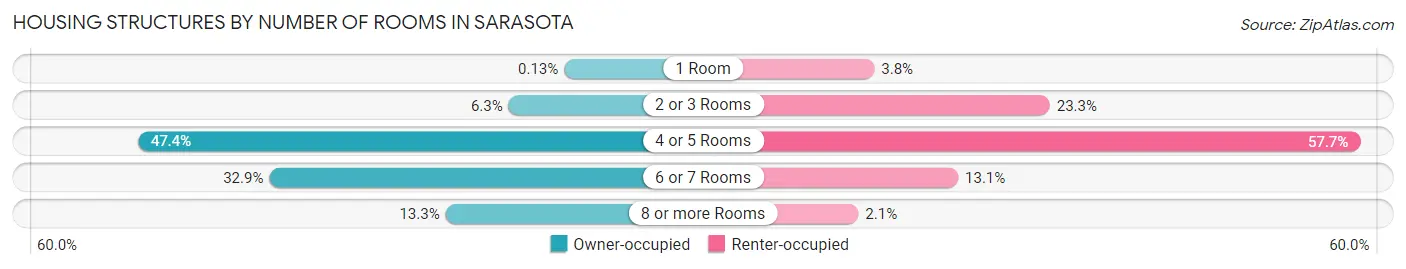
| Number of Rooms | Owner-occupied | Renter-occupied |
| 1 Room | 18 (0.1%) | 411 (3.8%) |
| 2 or 3 Rooms | 888 (6.3%) | 2,508 (23.3%) |
| 4 or 5 Rooms | 6,694 (47.4%) | 6,217 (57.7%) |
| 6 or 7 Rooms | 4,636 (32.9%) | 1,413 (13.1%) |
| 8 or more Rooms | 1,876 (13.3%) | 221 (2.1%) |
| Total | 14,112 (100.0%) | 10,770 (100.0%) |
Housing Structure by Heating Type in Sarasota
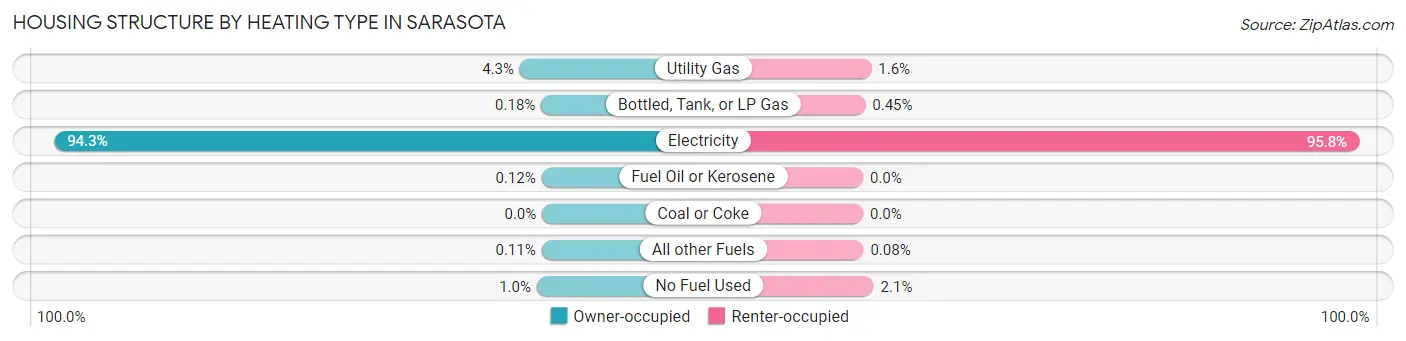
| Heating Type | Owner-occupied | Renter-occupied |
| Utility Gas | 607 (4.3%) | 172 (1.6%) |
| Bottled, Tank, or LP Gas | 25 (0.2%) | 48 (0.4%) |
| Electricity | 13,303 (94.3%) | 10,320 (95.8%) |
| Fuel Oil or Kerosene | 17 (0.1%) | 0 (0.0%) |
| Coal or Coke | 0 (0.0%) | 0 (0.0%) |
| All other Fuels | 15 (0.1%) | 9 (0.1%) |
| No Fuel Used | 145 (1.0%) | 221 (2.1%) |
| Total | 14,112 (100.0%) | 10,770 (100.0%) |
Household Vehicle Usage in Sarasota
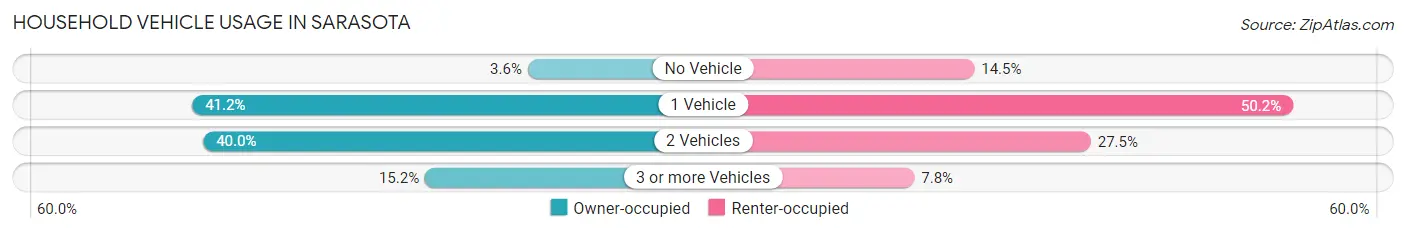
| Vehicles per Household | Owner-occupied | Renter-occupied |
| No Vehicle | 514 (3.6%) | 1,561 (14.5%) |
| 1 Vehicle | 5,817 (41.2%) | 5,405 (50.2%) |
| 2 Vehicles | 5,643 (40.0%) | 2,966 (27.5%) |
| 3 or more Vehicles | 2,138 (15.1%) | 838 (7.8%) |
| Total | 14,112 (100.0%) | 10,770 (100.0%) |
Real Estate & Mortgages in Sarasota
Real Estate and Mortgage Overview in Sarasota
| Characteristic | Without Mortgage | With Mortgage |
| Housing Units | 7,959 | 6,153 |
| Median Property Value | $440,700 | $318,600 |
| Median Household Income | $81,365 | $1,590 |
| Monthly Housing Costs | $799 | $1,391 |
| Real Estate Taxes | $3,269 | $115 |
Property Value by Mortgage Status in Sarasota
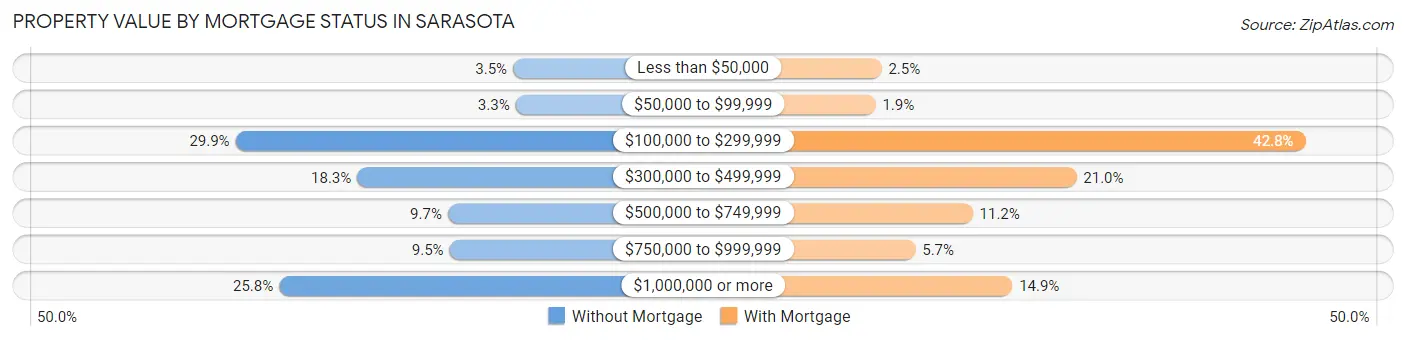
| Property Value | Without Mortgage | With Mortgage |
| Less than $50,000 | 278 (3.5%) | 152 (2.5%) |
| $50,000 to $99,999 | 259 (3.3%) | 117 (1.9%) |
| $100,000 to $299,999 | 2,381 (29.9%) | 2,636 (42.8%) |
| $300,000 to $499,999 | 1,459 (18.3%) | 1,294 (21.0%) |
| $500,000 to $749,999 | 772 (9.7%) | 686 (11.2%) |
| $750,000 to $999,999 | 759 (9.5%) | 350 (5.7%) |
| $1,000,000 or more | 2,051 (25.8%) | 918 (14.9%) |
| Total | 7,959 (100.0%) | 6,153 (100.0%) |
Household Income by Mortgage Status in Sarasota
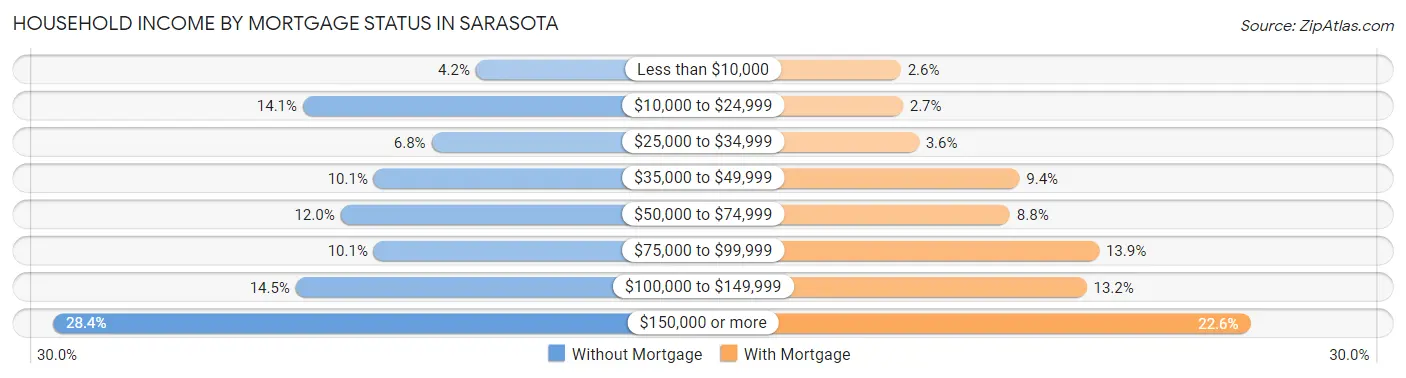
| Household Income | Without Mortgage | With Mortgage |
| Less than $10,000 | 336 (4.2%) | 159 (2.6%) |
| $10,000 to $24,999 | 1,122 (14.1%) | 166 (2.7%) |
| $25,000 to $34,999 | 537 (6.8%) | 222 (3.6%) |
| $35,000 to $49,999 | 800 (10.1%) | 576 (9.4%) |
| $50,000 to $74,999 | 951 (11.9%) | 543 (8.8%) |
| $75,000 to $99,999 | 800 (10.1%) | 856 (13.9%) |
| $100,000 to $149,999 | 1,155 (14.5%) | 812 (13.2%) |
| $150,000 or more | 2,258 (28.4%) | 1,388 (22.6%) |
| Total | 7,959 (100.0%) | 6,153 (100.0%) |
Property Value to Household Income Ratio in Sarasota
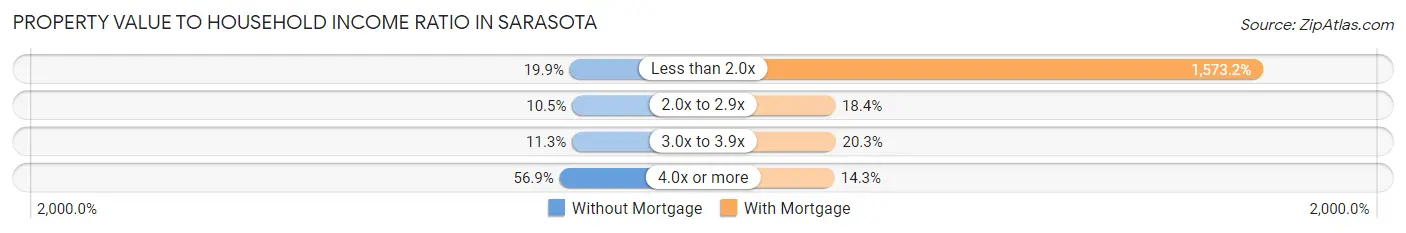
| Value-to-Income Ratio | Without Mortgage | With Mortgage |
| Less than 2.0x | 1,586 (19.9%) | 96,800 (1,573.2%) |
| 2.0x to 2.9x | 837 (10.5%) | 1,134 (18.4%) |
| 3.0x to 3.9x | 901 (11.3%) | 1,251 (20.3%) |
| 4.0x or more | 4,530 (56.9%) | 880 (14.3%) |
| Total | 7,959 (100.0%) | 6,153 (100.0%) |
Real Estate Taxes by Mortgage Status in Sarasota
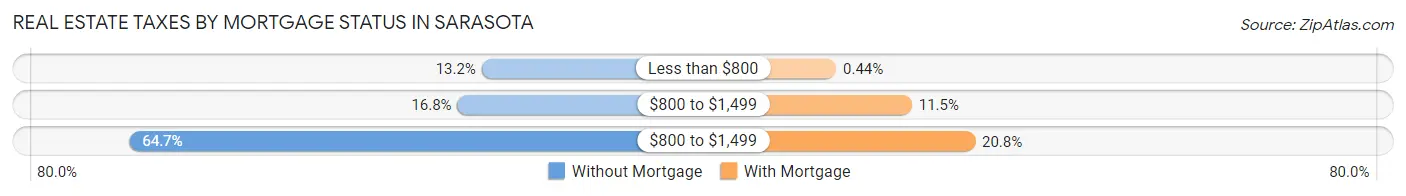
| Property Taxes | Without Mortgage | With Mortgage |
| Less than $800 | 1,051 (13.2%) | 27 (0.4%) |
| $800 to $1,499 | 1,333 (16.8%) | 708 (11.5%) |
| $800 to $1,499 | 5,149 (64.7%) | 1,277 (20.7%) |
| Total | 7,959 (100.0%) | 6,153 (100.0%) |
Health & Disability in Sarasota
Health Insurance Coverage by Age in Sarasota
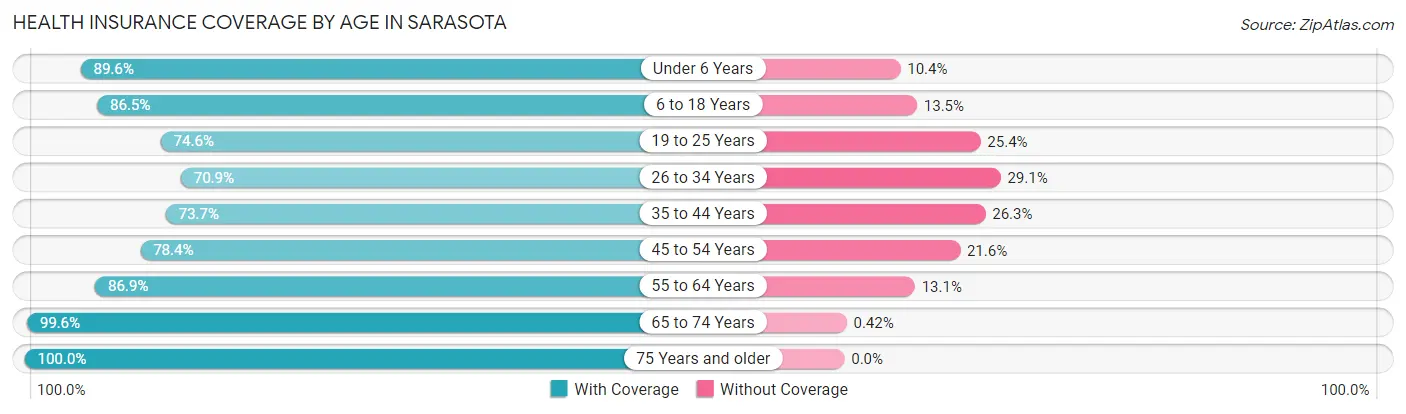
| Age Bracket | With Coverage | Without Coverage |
| Under 6 Years | 2,075 (89.6%) | 242 (10.4%) |
| 6 to 18 Years | 5,453 (86.5%) | 853 (13.5%) |
| 19 to 25 Years | 3,487 (74.6%) | 1,186 (25.4%) |
| 26 to 34 Years | 4,101 (70.9%) | 1,686 (29.1%) |
| 35 to 44 Years | 3,923 (73.7%) | 1,399 (26.3%) |
| 45 to 54 Years | 4,658 (78.4%) | 1,281 (21.6%) |
| 55 to 64 Years | 6,703 (86.9%) | 1,014 (13.1%) |
| 65 to 74 Years | 7,745 (99.6%) | 33 (0.4%) |
| 75 Years and older | 7,433 (100.0%) | 0 (0.0%) |
| Total | 45,578 (85.6%) | 7,694 (14.4%) |
Health Insurance Coverage by Citizenship Status in Sarasota
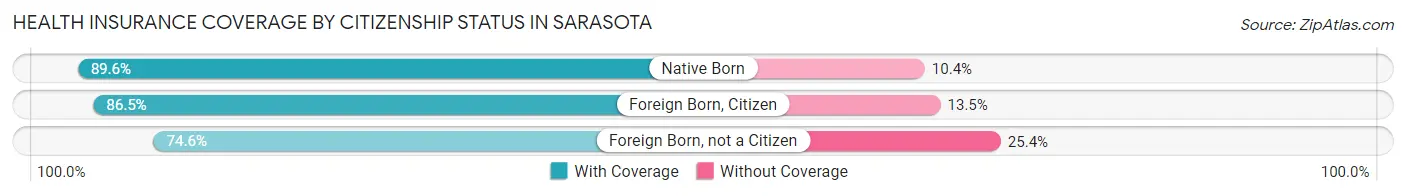
| Citizenship Status | With Coverage | Without Coverage |
| Native Born | 2,075 (89.6%) | 242 (10.4%) |
| Foreign Born, Citizen | 5,453 (86.5%) | 853 (13.5%) |
| Foreign Born, not a Citizen | 3,487 (74.6%) | 1,186 (25.4%) |
Health Insurance Coverage by Household Income in Sarasota
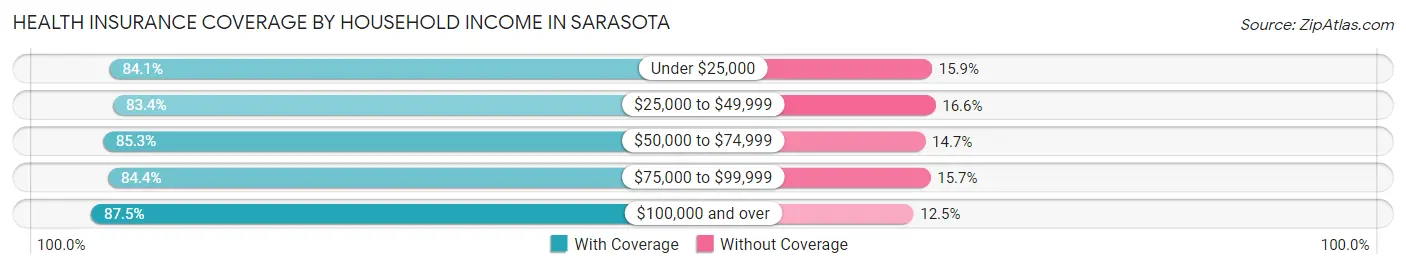
| Household Income | With Coverage | Without Coverage |
| Under $25,000 | 5,762 (84.1%) | 1,091 (15.9%) |
| $25,000 to $49,999 | 8,385 (83.4%) | 1,666 (16.6%) |
| $50,000 to $74,999 | 6,268 (85.3%) | 1,078 (14.7%) |
| $75,000 to $99,999 | 5,827 (84.4%) | 1,081 (15.7%) |
| $100,000 and over | 17,681 (87.5%) | 2,517 (12.5%) |
Public vs Private Health Insurance Coverage by Age in Sarasota
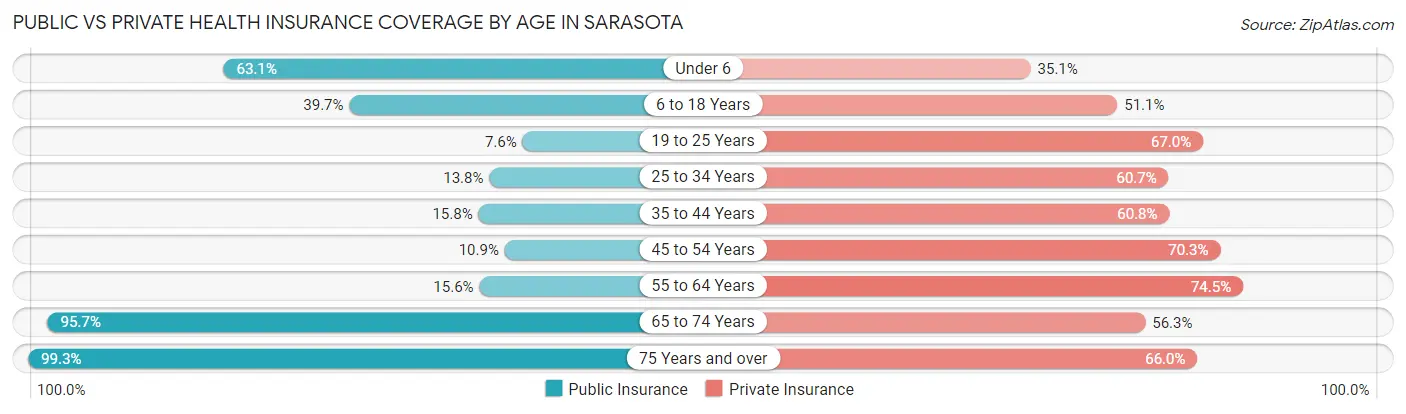
| Age Bracket | Public Insurance | Private Insurance |
| Under 6 | 1,461 (63.1%) | 812 (35.0%) |
| 6 to 18 Years | 2,505 (39.7%) | 3,225 (51.1%) |
| 19 to 25 Years | 354 (7.6%) | 3,133 (67.0%) |
| 25 to 34 Years | 796 (13.8%) | 3,510 (60.7%) |
| 35 to 44 Years | 838 (15.8%) | 3,235 (60.8%) |
| 45 to 54 Years | 646 (10.9%) | 4,173 (70.3%) |
| 55 to 64 Years | 1,202 (15.6%) | 5,746 (74.5%) |
| 65 to 74 Years | 7,447 (95.7%) | 4,382 (56.3%) |
| 75 Years and over | 7,383 (99.3%) | 4,904 (66.0%) |
| Total | 22,632 (42.5%) | 33,120 (62.2%) |
Disability Status by Sex by Age in Sarasota
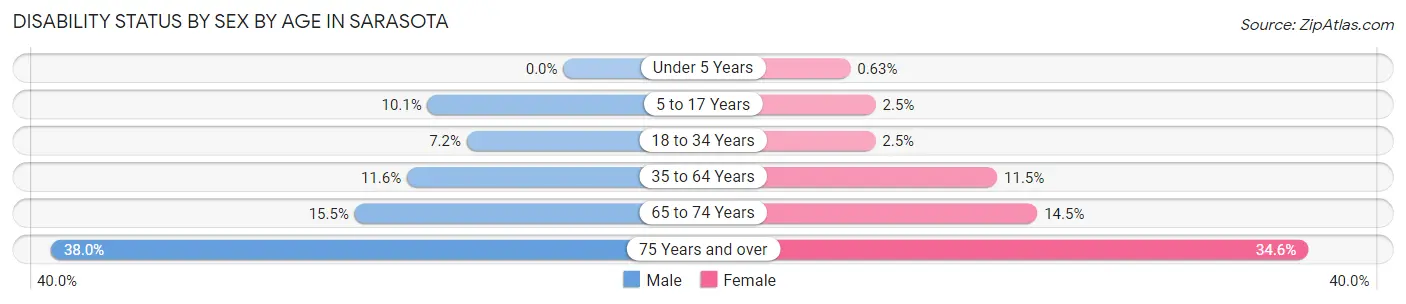
| Age Bracket | Male | Female |
| Under 5 Years | 0 (0.0%) | 7 (0.6%) |
| 5 to 17 Years | 310 (10.1%) | 80 (2.5%) |
| 18 to 34 Years | 387 (7.2%) | 142 (2.5%) |
| 35 to 64 Years | 1,069 (11.6%) | 1,127 (11.5%) |
| 65 to 74 Years | 532 (15.5%) | 630 (14.5%) |
| 75 Years and over | 1,146 (38.0%) | 1,530 (34.6%) |
Disability Class by Sex by Age in Sarasota
Disability Class: Hearing Difficulty
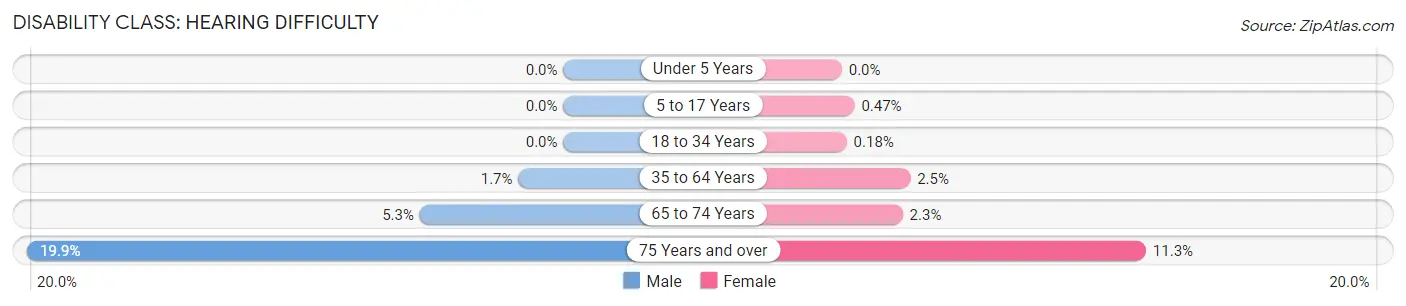
| Age Bracket | Male | Female |
| Under 5 Years | 0 (0.0%) | 0 (0.0%) |
| 5 to 17 Years | 0 (0.0%) | 15 (0.5%) |
| 18 to 34 Years | 0 (0.0%) | 10 (0.2%) |
| 35 to 64 Years | 154 (1.7%) | 248 (2.5%) |
| 65 to 74 Years | 183 (5.3%) | 98 (2.3%) |
| 75 Years and over | 600 (19.9%) | 499 (11.3%) |
Disability Class: Vision Difficulty
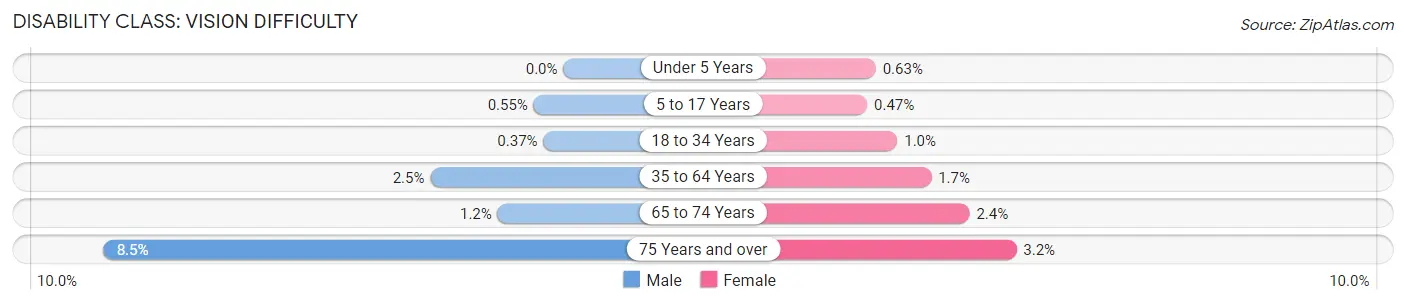
| Age Bracket | Male | Female |
| Under 5 Years | 0 (0.0%) | 7 (0.6%) |
| 5 to 17 Years | 17 (0.5%) | 15 (0.5%) |
| 18 to 34 Years | 20 (0.4%) | 59 (1.0%) |
| 35 to 64 Years | 227 (2.5%) | 162 (1.7%) |
| 65 to 74 Years | 42 (1.2%) | 103 (2.4%) |
| 75 Years and over | 257 (8.5%) | 143 (3.2%) |
Disability Class: Cognitive Difficulty
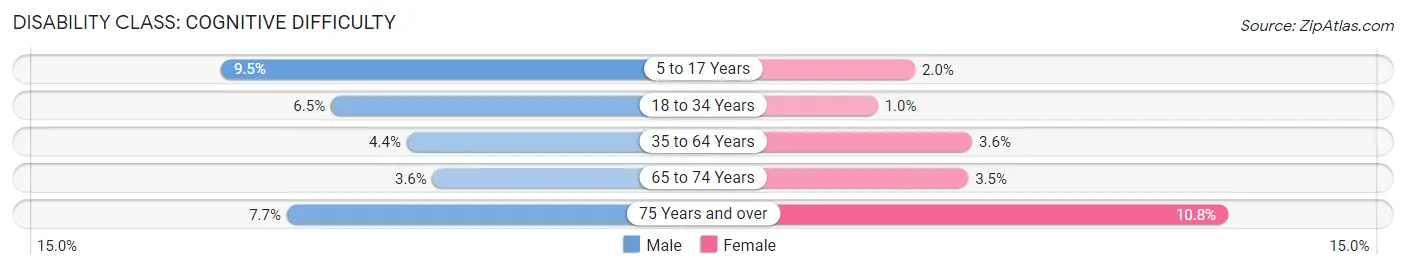
| Age Bracket | Male | Female |
| 5 to 17 Years | 293 (9.5%) | 65 (2.0%) |
| 18 to 34 Years | 349 (6.5%) | 57 (1.0%) |
| 35 to 64 Years | 401 (4.4%) | 355 (3.6%) |
| 65 to 74 Years | 125 (3.6%) | 153 (3.5%) |
| 75 Years and over | 232 (7.7%) | 475 (10.7%) |
Disability Class: Ambulatory Difficulty
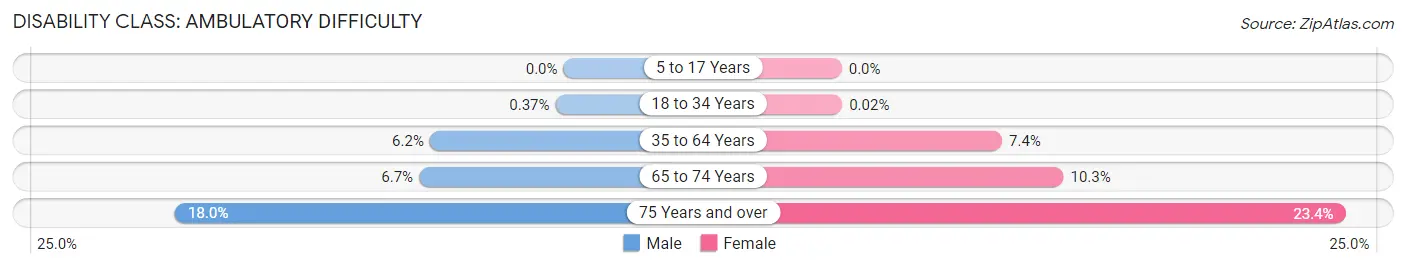
| Age Bracket | Male | Female |
| 5 to 17 Years | 0 (0.0%) | 0 (0.0%) |
| 18 to 34 Years | 20 (0.4%) | 1 (0.0%) |
| 35 to 64 Years | 571 (6.2%) | 727 (7.4%) |
| 65 to 74 Years | 230 (6.7%) | 447 (10.3%) |
| 75 Years and over | 543 (18.0%) | 1,033 (23.4%) |
Disability Class: Self-Care Difficulty
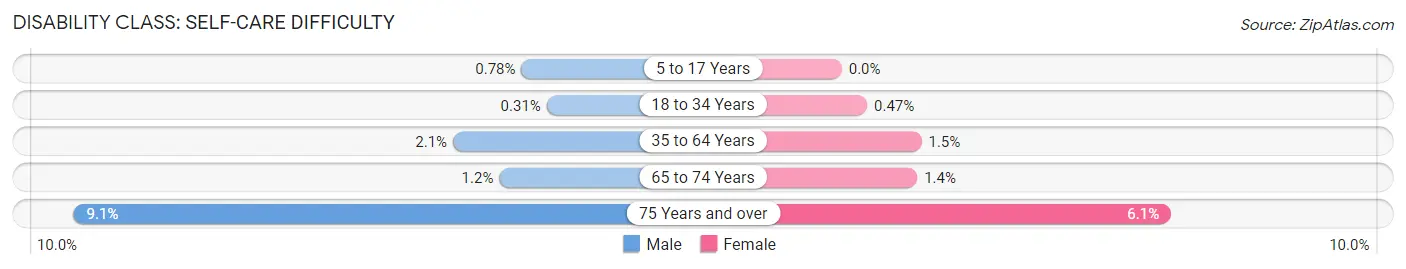
| Age Bracket | Male | Female |
| 5 to 17 Years | 24 (0.8%) | 0 (0.0%) |
| 18 to 34 Years | 17 (0.3%) | 27 (0.5%) |
| 35 to 64 Years | 189 (2.1%) | 145 (1.5%) |
| 65 to 74 Years | 41 (1.2%) | 61 (1.4%) |
| 75 Years and over | 274 (9.1%) | 270 (6.1%) |
Technology Access in Sarasota
Computing Device Access in Sarasota
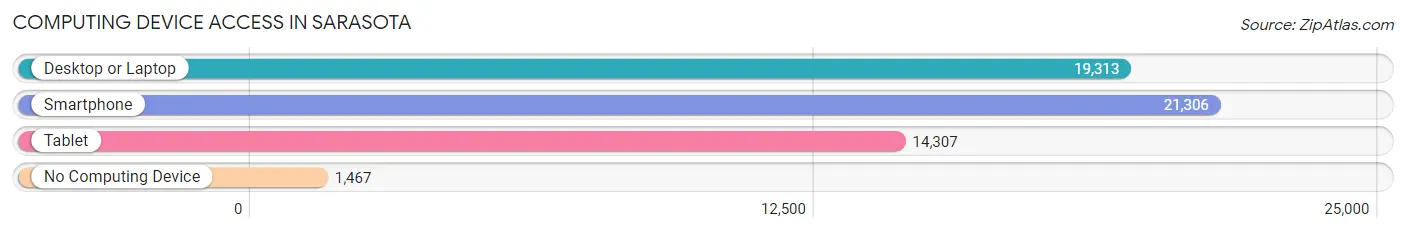
| Device Type | # Households | % Households |
| Desktop or Laptop | 19,313 | 77.6% |
| Smartphone | 21,306 | 85.6% |
| Tablet | 14,307 | 57.5% |
| No Computing Device | 1,467 | 5.9% |
| Total | 24,882 | 100.0% |
Internet Access in Sarasota
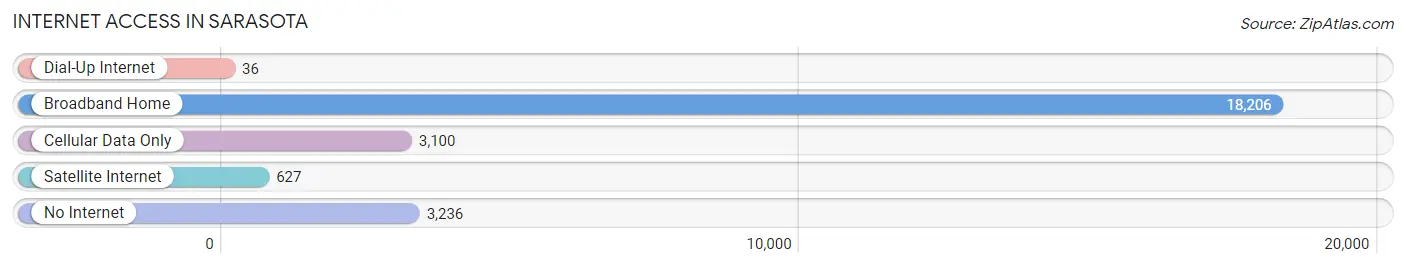
| Internet Type | # Households | % Households |
| Dial-Up Internet | 36 | 0.1% |
| Broadband Home | 18,206 | 73.2% |
| Cellular Data Only | 3,100 | 12.5% |
| Satellite Internet | 627 | 2.5% |
| No Internet | 3,236 | 13.0% |
| Total | 24,882 | 100.0% |
Sarasota Summary
Sarasota, Florida is a city located in the southwestern part of the state on the Gulf of Mexico. It is the county seat of Sarasota County and is the cultural and economic center of the region. The city has a population of approximately 54,000 people and is part of the Bradenton-Sarasota-Venice Metropolitan Statistical Area.
Geography
Sarasota is located on the Gulf Coast of Florida, approximately 60 miles south of Tampa and 50 miles north of Fort Myers. The city is situated on the Sarasota Bay, which is part of the larger Tampa Bay estuary. The city is bordered by the cities of Bradenton to the north, Venice to the south, and Longboat Key to the west. The city is also home to several barrier islands, including Siesta Key, Lido Key, and Longboat Key. The city is located in a humid subtropical climate zone, with hot, humid summers and mild winters.
History
Sarasota was first settled by Native Americans in the late 1700s. The first European settlers arrived in the area in the early 1800s, and the city was officially incorporated in 1902. The city was initially a small fishing village, but it began to grow in the early 1900s when it became a popular tourist destination. The city was also home to several large estates, including the John and Mable Ringling estate, which is now the Ringling Museum of Art. The city experienced a period of rapid growth in the 1950s and 1960s, and it has continued to grow since then.
Economy
Sarasota has a diverse economy that is driven by tourism, healthcare, and financial services. The city is home to several large employers, including Sarasota Memorial Hospital, Sarasota County Government, and the University of South Florida. The city is also home to several large companies, including Publix Super Markets, Bealls Department Stores, and Sun Hydraulics. The city is also home to several large shopping malls, including the Mall at University Town Center and the Westfield Sarasota Square Mall.
Demographics
As of the 2010 census, the population of Sarasota was 54,039. The city has a population that is predominantly white (83.3%), with smaller percentages of African Americans (7.2%), Hispanics (7.1%), and Asians (2.2%). The median household income in the city is $50,867, and the median home value is $220,000. The city has a high rate of homeownership, with 73.3% of residents owning their own homes.
Sarasota is a vibrant city with a rich history, diverse economy, and diverse population. The city is home to several large employers, and it is a popular tourist destination. The city is also home to several large shopping malls, and it is a popular destination for retirees. The city has a high rate of homeownership, and it is a great place to live and work.
Common Questions
What is Per Capita Income in Sarasota?
Per Capita income in Sarasota is $56,404.
What is the Median Family Income in Sarasota?
Median Family Income in Sarasota is $85,853.
What is the Median Household income in Sarasota?
Median Household Income in Sarasota is $68,870.
What is Income or Wage Gap in Sarasota?
Income or Wage Gap in Sarasota is 18.3%.
Women in Sarasota earn 81.7 cents for every dollar earned by a man.
What is Family Income Deficit in Sarasota?
Family Income Deficit in Sarasota is $11,929.
Families that are below poverty line in Sarasota earn $11,929 less on average than the poverty threshold level.
What is Inequality or Gini Index in Sarasota?
Inequality or Gini Index in Sarasota is 0.57.
What is the Total Population of Sarasota?
Total Population of Sarasota is 55,508.
What is the Total Male Population of Sarasota?
Total Male Population of Sarasota is 25,950.
What is the Total Female Population of Sarasota?
Total Female Population of Sarasota is 29,558.
What is the Ratio of Males per 100 Females in Sarasota?
There are 87.79 Males per 100 Females in Sarasota.
What is the Ratio of Females per 100 Males in Sarasota?
There are 113.90 Females per 100 Males in Sarasota.
What is the Median Population Age in Sarasota?
Median Population Age in Sarasota is 49.8 Years.
What is the Average Family Size in Sarasota
Average Family Size in Sarasota is 2.8 People.
What is the Average Household Size in Sarasota
Average Household Size in Sarasota is 2.1 People.
How Large is the Labor Force in Sarasota?
There are 25,795 People in the Labor Forcein in Sarasota.
What is the Percentage of People in the Labor Force in Sarasota?
53.1% of People are in the Labor Force in Sarasota.
What is the Unemployment Rate in Sarasota?
Unemployment Rate in Sarasota is 2.9%.