Callahan, FL Map & Demographics
Callahan Map
Callahan Overview
$28,637
PER CAPITA INCOME
$65,750
AVG FAMILY INCOME
$52,688
AVG HOUSEHOLD INCOME
40.3%
WAGE / INCOME GAP [ % ]
59.7¢/ $1
WAGE / INCOME GAP [ $ ]
0.42
INEQUALITY / GINI INDEX
1,469
TOTAL POPULATION
651
MALE POPULATION
818
FEMALE POPULATION
79.58
MALES / 100 FEMALES
125.65
FEMALES / 100 MALES
37.4
MEDIAN AGE
2.8
AVG FAMILY SIZE
2.4
AVG HOUSEHOLD SIZE
715
LABOR FORCE [ PEOPLE ]
59.0%
PERCENT IN LABOR FORCE
3.0%
UNEMPLOYMENT RATE
Callahan Zip Codes
Callahan Area Codes
Income in Callahan
Income Overview in Callahan
Per Capita Income in Callahan is $28,637, while median incomes of families and households are $65,750 and $52,688 respectively.
| Characteristic | Number | Measure |
| Per Capita Income | 1,469 | $28,637 |
| Median Family Income | 445 | $65,750 |
| Mean Family Income | 445 | $77,028 |
| Median Household Income | 611 | $52,688 |
| Mean Household Income | 611 | $69,596 |
| Income Deficit | 445 | $0 |
| Wage / Income Gap (%) | 1,469 | 40.25% |
| Wage / Income Gap ($) | 1,469 | 59.75¢ per $1 |
| Gini / Inequality Index | 1,469 | 0.42 |
Earnings by Sex in Callahan
Average Earnings in Callahan are $37,083, $52,845 for men and $31,574 for women, a difference of 40.3%.

| Sex | Number | Average Earnings |
| Male | 376 (51.8%) | $52,845 |
| Female | 350 (48.2%) | $31,574 |
| Total | 726 (100.0%) | $37,083 |
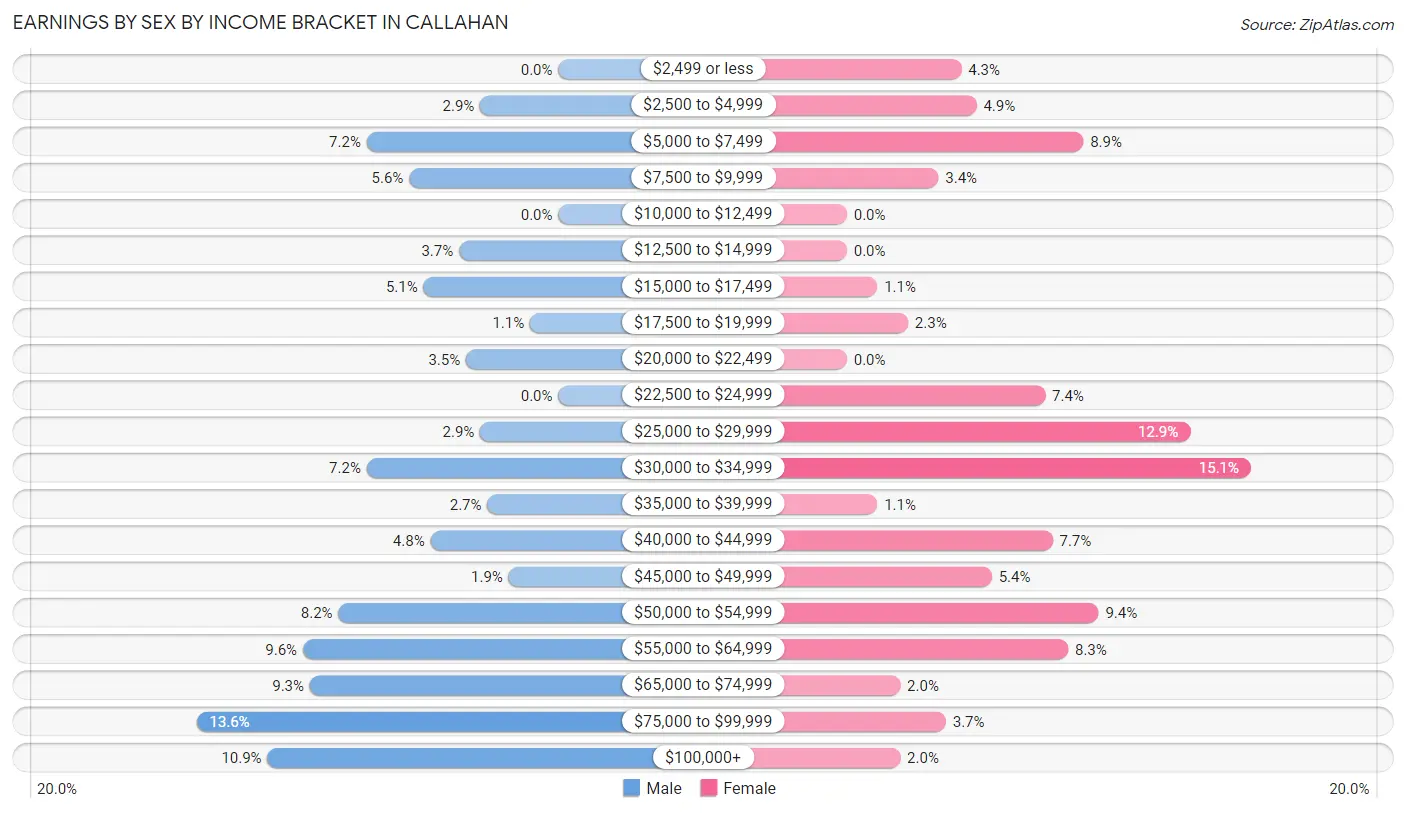
Earnings by Sex by Income Bracket in Callahan
The most common earnings brackets in Callahan are $75,000 to $99,999 for men (51 | 13.6%) and $30,000 to $34,999 for women (53 | 15.1%).
| Income | Male | Female |
| $2,499 or less | 0 (0.0%) | 15 (4.3%) |
| $2,500 to $4,999 | 11 (2.9%) | 17 (4.9%) |
| $5,000 to $7,499 | 27 (7.2%) | 31 (8.9%) |
| $7,500 to $9,999 | 21 (5.6%) | 12 (3.4%) |
| $10,000 to $12,499 | 0 (0.0%) | 0 (0.0%) |
| $12,500 to $14,999 | 14 (3.7%) | 0 (0.0%) |
| $15,000 to $17,499 | 19 (5.1%) | 4 (1.1%) |
| $17,500 to $19,999 | 4 (1.1%) | 8 (2.3%) |
| $20,000 to $22,499 | 13 (3.5%) | 0 (0.0%) |
| $22,500 to $24,999 | 0 (0.0%) | 26 (7.4%) |
| $25,000 to $29,999 | 11 (2.9%) | 45 (12.9%) |
| $30,000 to $34,999 | 27 (7.2%) | 53 (15.1%) |
| $35,000 to $39,999 | 10 (2.7%) | 4 (1.1%) |
| $40,000 to $44,999 | 18 (4.8%) | 27 (7.7%) |
| $45,000 to $49,999 | 7 (1.9%) | 19 (5.4%) |
| $50,000 to $54,999 | 31 (8.2%) | 33 (9.4%) |
| $55,000 to $64,999 | 36 (9.6%) | 29 (8.3%) |
| $65,000 to $74,999 | 35 (9.3%) | 7 (2.0%) |
| $75,000 to $99,999 | 51 (13.6%) | 13 (3.7%) |
| $100,000+ | 41 (10.9%) | 7 (2.0%) |
| Total | 376 (100.0%) | 350 (100.0%) |
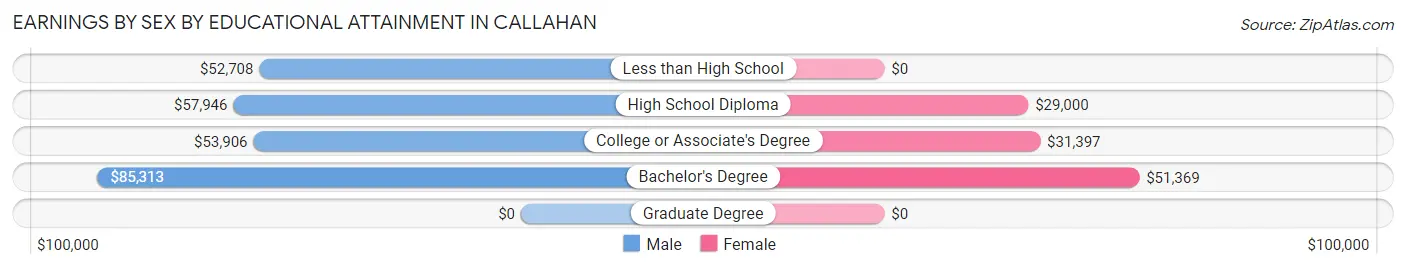
Earnings by Sex by Educational Attainment in Callahan
Average earnings in Callahan are $54,828 for men and $34,063 for women, a difference of 37.9%. Men with an educational attainment of bachelor's degree enjoy the highest average annual earnings of $85,313, while those with less than high school education earn the least with $52,708. Women with an educational attainment of bachelor's degree earn the most with the average annual earnings of $51,369, while those with high school diploma education have the smallest earnings of $29,000.
| Educational Attainment | Male Income | Female Income |
| Less than High School | $52,708 | $0 |
| High School Diploma | $57,946 | $29,000 |
| College or Associate's Degree | $53,906 | $31,397 |
| Bachelor's Degree | $85,313 | $51,369 |
| Graduate Degree | - | - |
| Total | $54,828 | $34,063 |
Family Income in Callahan
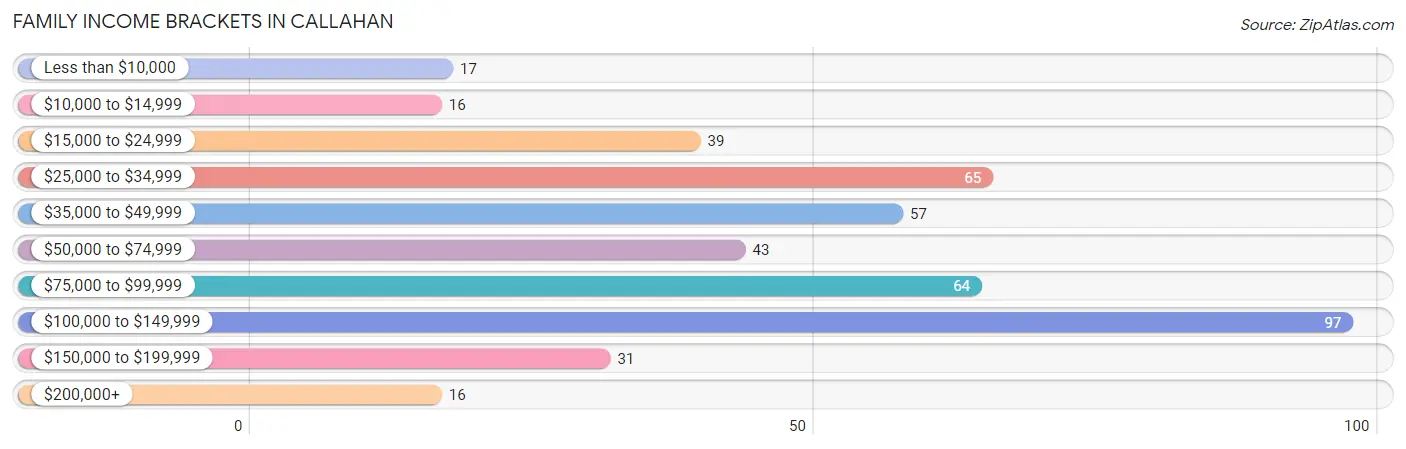
Family Income Brackets in Callahan
According to the Callahan family income data, there are 97 families falling into the $100,000 to $149,999 income range, which is the most common income bracket and makes up 21.8% of all families. Conversely, the $10,000 to $14,999 income bracket is the least frequent group with only 16 families (3.6%) belonging to this category.
| Income Bracket | # Families | % Families |
| Less than $10,000 | 17 | 3.8% |
| $10,000 to $14,999 | 16 | 3.6% |
| $15,000 to $24,999 | 39 | 8.8% |
| $25,000 to $34,999 | 65 | 14.6% |
| $35,000 to $49,999 | 57 | 12.8% |
| $50,000 to $74,999 | 43 | 9.7% |
| $75,000 to $99,999 | 64 | 14.4% |
| $100,000 to $149,999 | 97 | 21.8% |
| $150,000 to $199,999 | 31 | 7.0% |
| $200,000+ | 16 | 3.6% |
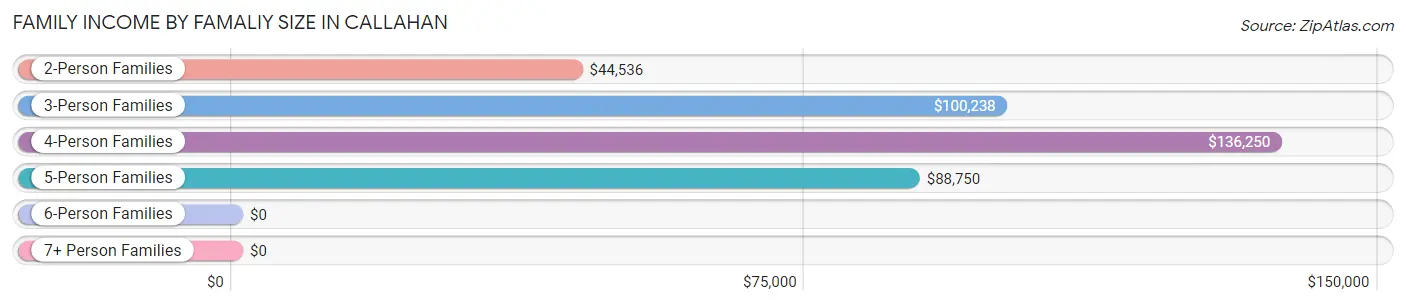
Family Income by Famaliy Size in Callahan
4-person families (54 | 12.1%) account for the highest median family income in Callahan with $136,250 per family, while 4-person families (54 | 12.1%) have the highest median income of $34,062 per family member.
| Income Bracket | # Families | Median Income |
| 2-Person Families | 209 (47.0%) | $44,536 |
| 3-Person Families | 164 (36.8%) | $100,238 |
| 4-Person Families | 54 (12.1%) | $136,250 |
| 5-Person Families | 10 (2.2%) | $88,750 |
| 6-Person Families | 4 (0.9%) | $0 |
| 7+ Person Families | 4 (0.9%) | $0 |
| Total | 445 (100.0%) | $65,750 |
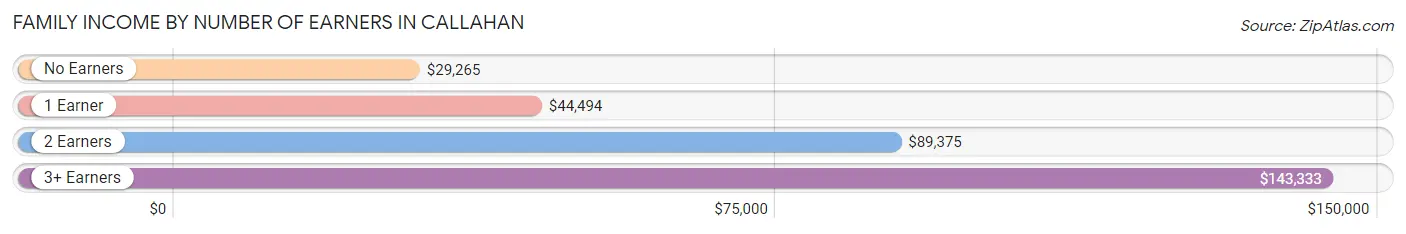
Family Income by Number of Earners in Callahan
The median family income in Callahan is $65,750, with families comprising 3+ earners (32) having the highest median family income of $143,333, while families with no earners (70) have the lowest median family income of $29,265, accounting for 7.2% and 15.7% of families, respectively.
| Number of Earners | # Families | Median Income |
| No Earners | 70 (15.7%) | $29,265 |
| 1 Earner | 161 (36.2%) | $44,494 |
| 2 Earners | 182 (40.9%) | $89,375 |
| 3+ Earners | 32 (7.2%) | $143,333 |
| Total | 445 (100.0%) | $65,750 |
Household Income in Callahan
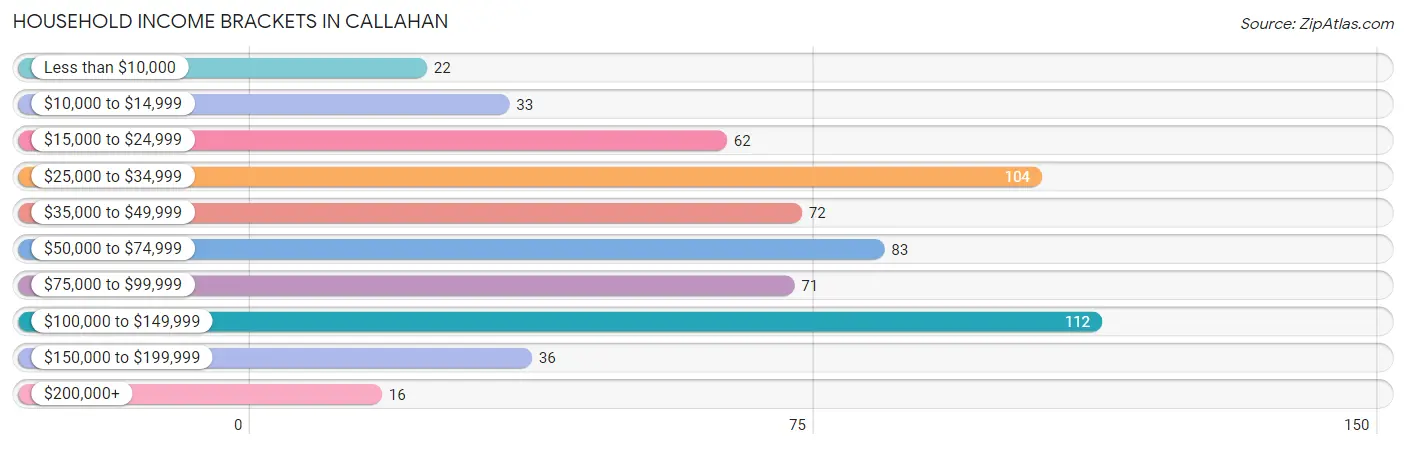
Household Income Brackets in Callahan
With 112 households falling in the category, the $100,000 to $149,999 income range is the most frequent in Callahan, accounting for 18.3% of all households. In contrast, only 16 households (2.6%) fall into the $200,000+ income bracket, making it the least populous group.
| Income Bracket | # Households | % Households |
| Less than $10,000 | 22 | 3.6% |
| $10,000 to $14,999 | 33 | 5.4% |
| $15,000 to $24,999 | 62 | 10.1% |
| $25,000 to $34,999 | 104 | 17.0% |
| $35,000 to $49,999 | 72 | 11.8% |
| $50,000 to $74,999 | 83 | 13.6% |
| $75,000 to $99,999 | 71 | 11.6% |
| $100,000 to $149,999 | 112 | 18.3% |
| $150,000 to $199,999 | 36 | 5.9% |
| $200,000+ | 16 | 2.6% |
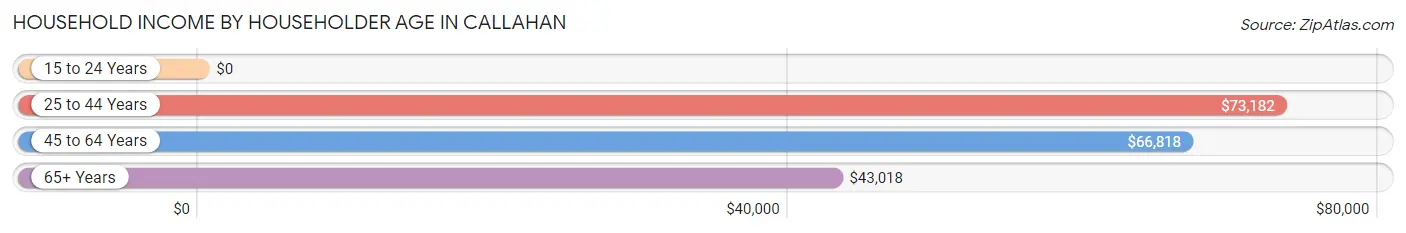
Household Income by Householder Age in Callahan
The median household income in Callahan is $52,688, with the highest median household income of $73,182 found in the 25 to 44 years age bracket for the primary householder. A total of 222 households (36.3%) fall into this category. Meanwhile, the 15 to 24 years age bracket for the primary householder has the lowest median household income of $0, with 12 households (2.0%) in this group.
| Income Bracket | # Households | Median Income |
| 15 to 24 Years | 12 (2.0%) | $0 |
| 25 to 44 Years | 222 (36.3%) | $73,182 |
| 45 to 64 Years | 210 (34.4%) | $66,818 |
| 65+ Years | 167 (27.3%) | $43,018 |
| Total | 611 (100.0%) | $52,688 |
Poverty in Callahan
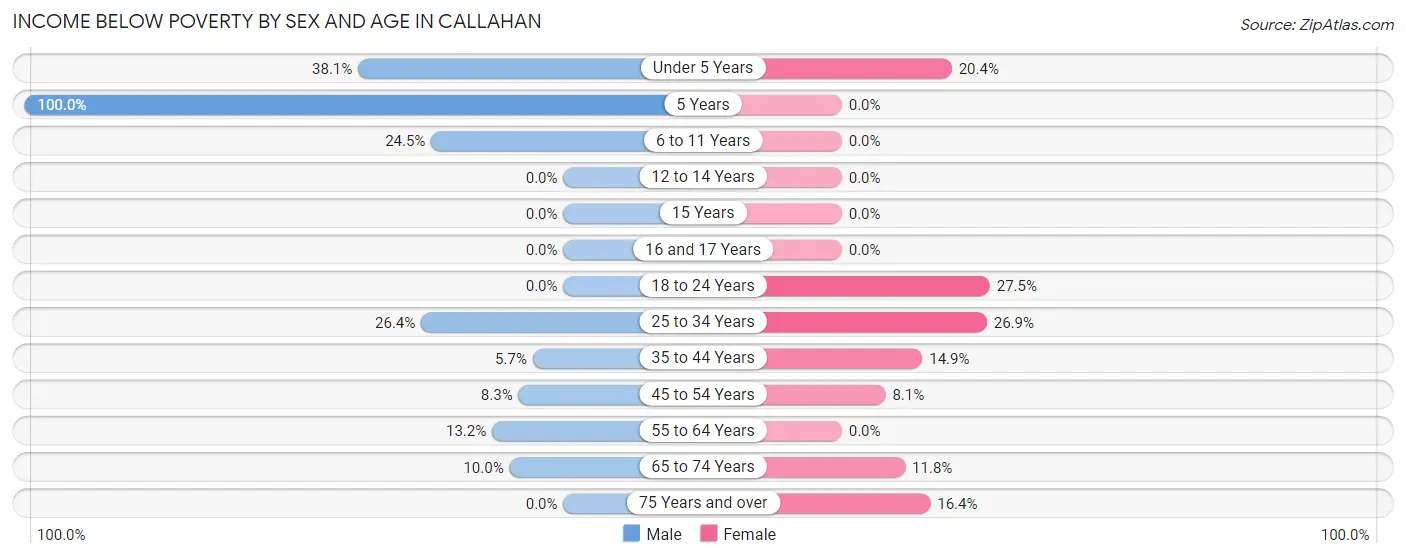
Income Below Poverty by Sex and Age in Callahan
With 13.4% poverty level for males and 14.5% for females among the residents of Callahan, 5 year old males and 18 to 24 year old females are the most vulnerable to poverty, with 7 males (100.0%) and 25 females (27.5%) in their respective age groups living below the poverty level.
| Age Bracket | Male | Female |
| Under 5 Years | 8 (38.1%) | 10 (20.4%) |
| 5 Years | 7 (100.0%) | 0 (0.0%) |
| 6 to 11 Years | 13 (24.5%) | 0 (0.0%) |
| 12 to 14 Years | 0 (0.0%) | 0 (0.0%) |
| 15 Years | 0 (0.0%) | 0 (0.0%) |
| 16 and 17 Years | 0 (0.0%) | 0 (0.0%) |
| 18 to 24 Years | 0 (0.0%) | 25 (27.5%) |
| 25 to 34 Years | 33 (26.4%) | 35 (26.9%) |
| 35 to 44 Years | 5 (5.7%) | 13 (14.9%) |
| 45 to 54 Years | 7 (8.3%) | 9 (8.1%) |
| 55 to 64 Years | 9 (13.2%) | 0 (0.0%) |
| 65 to 74 Years | 5 (10.0%) | 16 (11.8%) |
| 75 Years and over | 0 (0.0%) | 11 (16.4%) |
| Total | 87 (13.4%) | 119 (14.5%) |
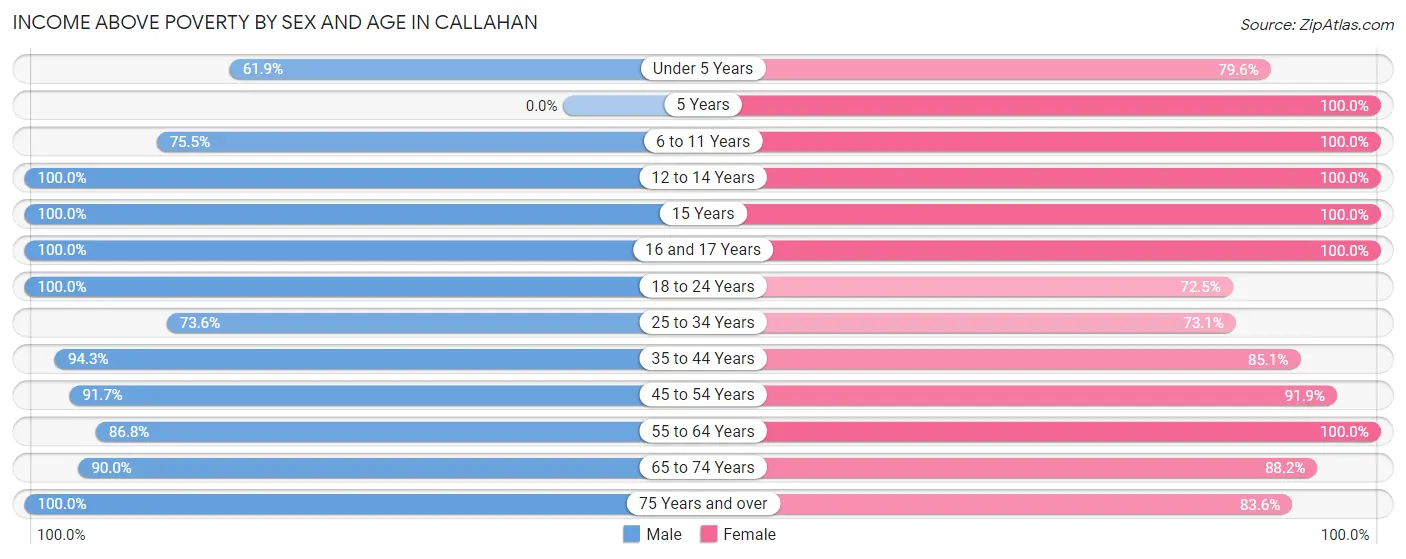
Income Above Poverty by Sex and Age in Callahan
According to the poverty statistics in Callahan, males aged 12 to 14 years and females aged 5 years are the age groups that are most secure financially, with 100.0% of males and 100.0% of females in these age groups living above the poverty line.
| Age Bracket | Male | Female |
| Under 5 Years | 13 (61.9%) | 39 (79.6%) |
| 5 Years | 0 (0.0%) | 6 (100.0%) |
| 6 to 11 Years | 40 (75.5%) | 32 (100.0%) |
| 12 to 14 Years | 43 (100.0%) | 15 (100.0%) |
| 15 Years | 16 (100.0%) | 15 (100.0%) |
| 16 and 17 Years | 11 (100.0%) | 12 (100.0%) |
| 18 to 24 Years | 61 (100.0%) | 66 (72.5%) |
| 25 to 34 Years | 92 (73.6%) | 95 (73.1%) |
| 35 to 44 Years | 83 (94.3%) | 74 (85.1%) |
| 45 to 54 Years | 77 (91.7%) | 102 (91.9%) |
| 55 to 64 Years | 59 (86.8%) | 67 (100.0%) |
| 65 to 74 Years | 45 (90.0%) | 120 (88.2%) |
| 75 Years and over | 24 (100.0%) | 56 (83.6%) |
| Total | 564 (86.6%) | 699 (85.5%) |
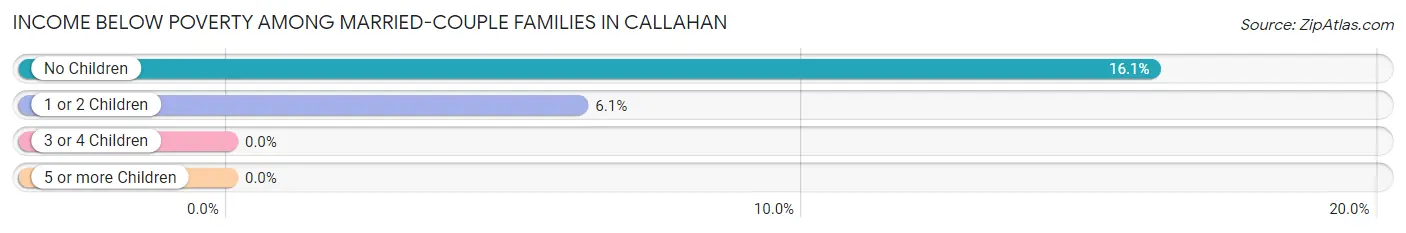
Income Below Poverty Among Married-Couple Families in Callahan
The poverty statistics for married-couple families in Callahan show that 12.4% or 32 of the total 257 families live below the poverty line. Families with no children have the highest poverty rate of 16.1%, comprising of 27 families. On the other hand, families with 3 or 4 children have the lowest poverty rate of 0.0%, which includes 0 families.
| Children | Above Poverty | Below Poverty |
| No Children | 141 (83.9%) | 27 (16.1%) |
| 1 or 2 Children | 77 (93.9%) | 5 (6.1%) |
| 3 or 4 Children | 7 (100.0%) | 0 (0.0%) |
| 5 or more Children | 0 (0.0%) | 0 (0.0%) |
| Total | 225 (87.5%) | 32 (12.4%) |
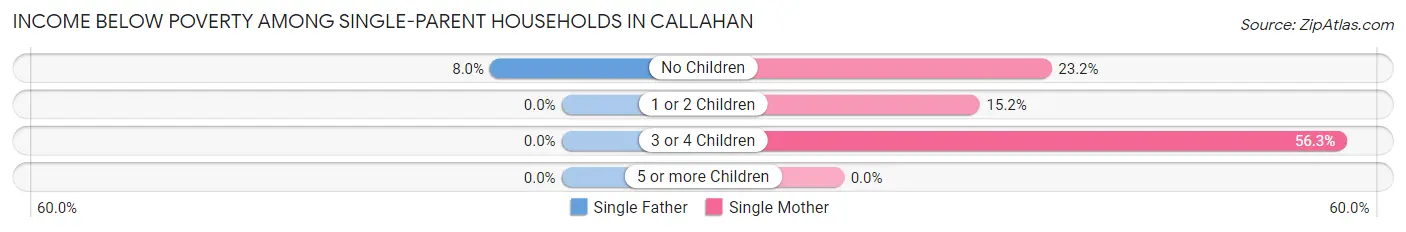
Income Below Poverty Among Single-Parent Households in Callahan
According to the poverty data in Callahan, 5.4% or 2 single-father households and 22.5% or 34 single-mother households are living below the poverty line. Among single-father households, those with no children have the highest poverty rate, with 2 households (8.0%) experiencing poverty. Likewise, among single-mother households, those with 3 or 4 children have the highest poverty rate, with 9 households (56.2%) falling below the poverty line.
| Children | Single Father | Single Mother |
| No Children | 2 (8.0%) | 13 (23.2%) |
| 1 or 2 Children | 0 (0.0%) | 12 (15.2%) |
| 3 or 4 Children | 0 (0.0%) | 9 (56.2%) |
| 5 or more Children | 0 (0.0%) | 0 (0.0%) |
| Total | 2 (5.4%) | 34 (22.5%) |
Income Below Poverty Among Married-Couple vs Single-Parent Households in Callahan
The poverty data for Callahan shows that 32 of the married-couple family households (12.4%) and 36 of the single-parent households (19.2%) are living below the poverty level. Within the married-couple family households, those with no children have the highest poverty rate, with 27 households (16.1%) falling below the poverty line. Among the single-parent households, those with 3 or 4 children have the highest poverty rate, with 9 household (56.2%) living below poverty.
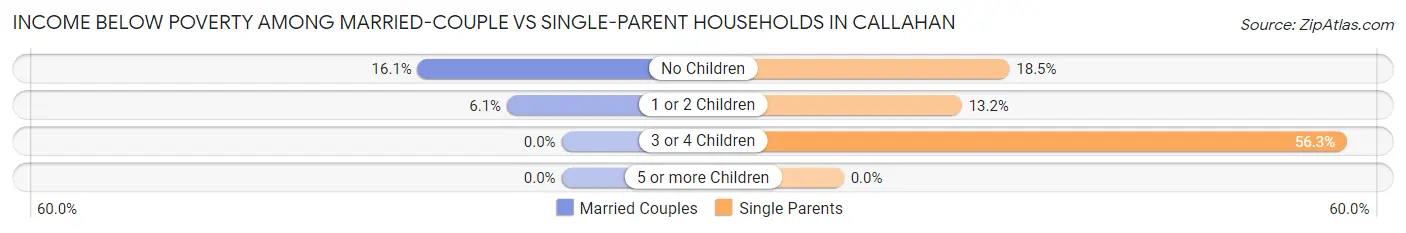
| Children | Married-Couple Families | Single-Parent Households |
| No Children | 27 (16.1%) | 15 (18.5%) |
| 1 or 2 Children | 5 (6.1%) | 12 (13.2%) |
| 3 or 4 Children | 0 (0.0%) | 9 (56.2%) |
| 5 or more Children | 0 (0.0%) | 0 (0.0%) |
| Total | 32 (12.4%) | 36 (19.2%) |
Race in Callahan
The most populous races in Callahan are White / Caucasian (1,221 | 83.1%), Black / African American (171 | 11.6%), and Hispanic or Latino (52 | 3.5%).
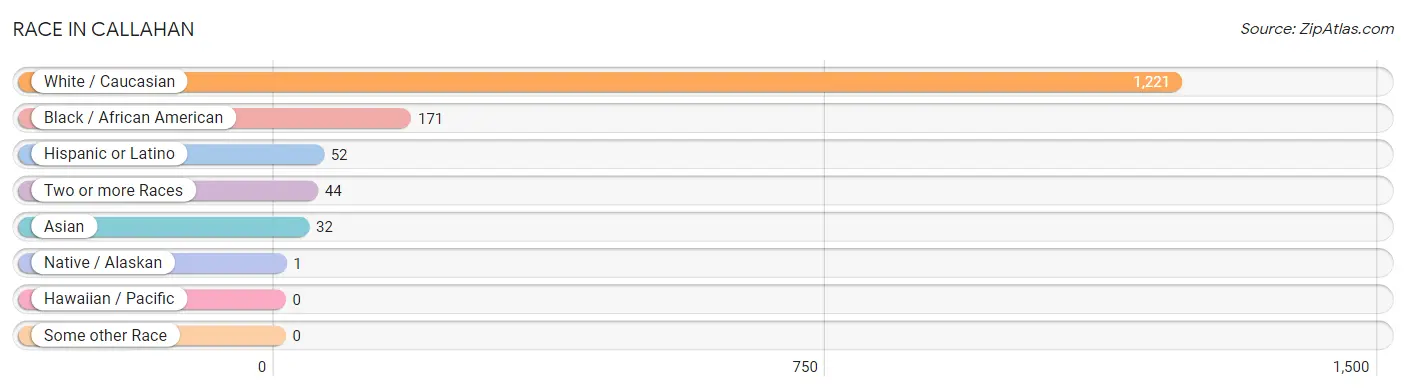
| Race | # Population | % Population |
| Asian | 32 | 2.2% |
| Black / African American | 171 | 11.6% |
| Hawaiian / Pacific | 0 | 0.0% |
| Hispanic or Latino | 52 | 3.5% |
| Native / Alaskan | 1 | 0.1% |
| White / Caucasian | 1,221 | 83.1% |
| Two or more Races | 44 | 3.0% |
| Some other Race | 0 | 0.0% |
| Total | 1,469 | 100.0% |
Ancestry in Callahan
The most populous ancestries reported in Callahan are Irish (261 | 17.8%), American (210 | 14.3%), English (173 | 11.8%), German (165 | 11.2%), and Italian (105 | 7.1%), together accounting for 62.2% of all Callahan residents.
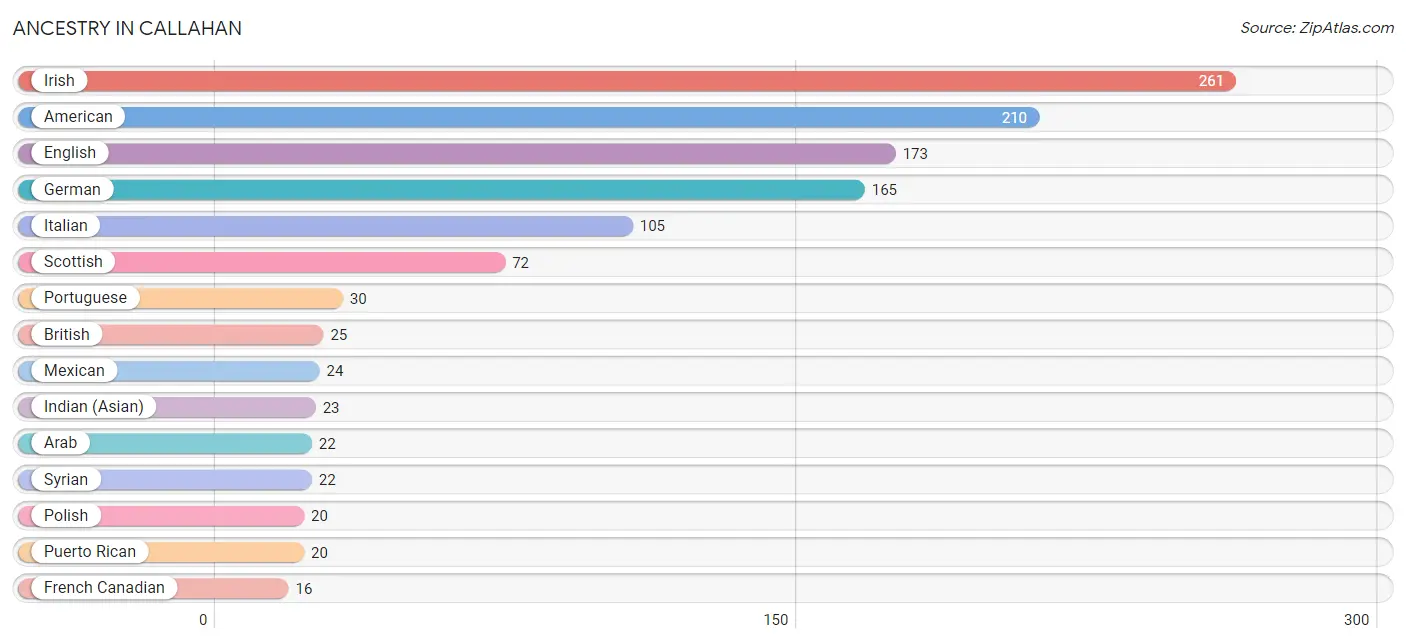
| Ancestry | # Population | % Population |
| American | 210 | 14.3% |
| Arab | 22 | 1.5% |
| British | 25 | 1.7% |
| Canadian | 3 | 0.2% |
| Dutch | 2 | 0.1% |
| English | 173 | 11.8% |
| European | 5 | 0.3% |
| French | 2 | 0.1% |
| French Canadian | 16 | 1.1% |
| German | 165 | 11.2% |
| Indian (Asian) | 23 | 1.6% |
| Irish | 261 | 17.8% |
| Italian | 105 | 7.1% |
| Korean | 9 | 0.6% |
| Mexican | 24 | 1.6% |
| Mexican American Indian | 1 | 0.1% |
| Northern European | 6 | 0.4% |
| Norwegian | 6 | 0.4% |
| Polish | 20 | 1.4% |
| Portuguese | 30 | 2.0% |
| Puerto Rican | 20 | 1.4% |
| Scottish | 72 | 4.9% |
| Spaniard | 8 | 0.5% |
| Swedish | 3 | 0.2% |
| Syrian | 22 | 1.5% | View All 25 Rows |
Immigrants in Callahan
The most numerous immigrant groups reported in Callahan came from Asia (33 | 2.2%), China (17 | 1.2%), Eastern Asia (17 | 1.2%), Philippines (9 | 0.6%), and South Eastern Asia (9 | 0.6%), together accounting for 5.8% of all Callahan residents.
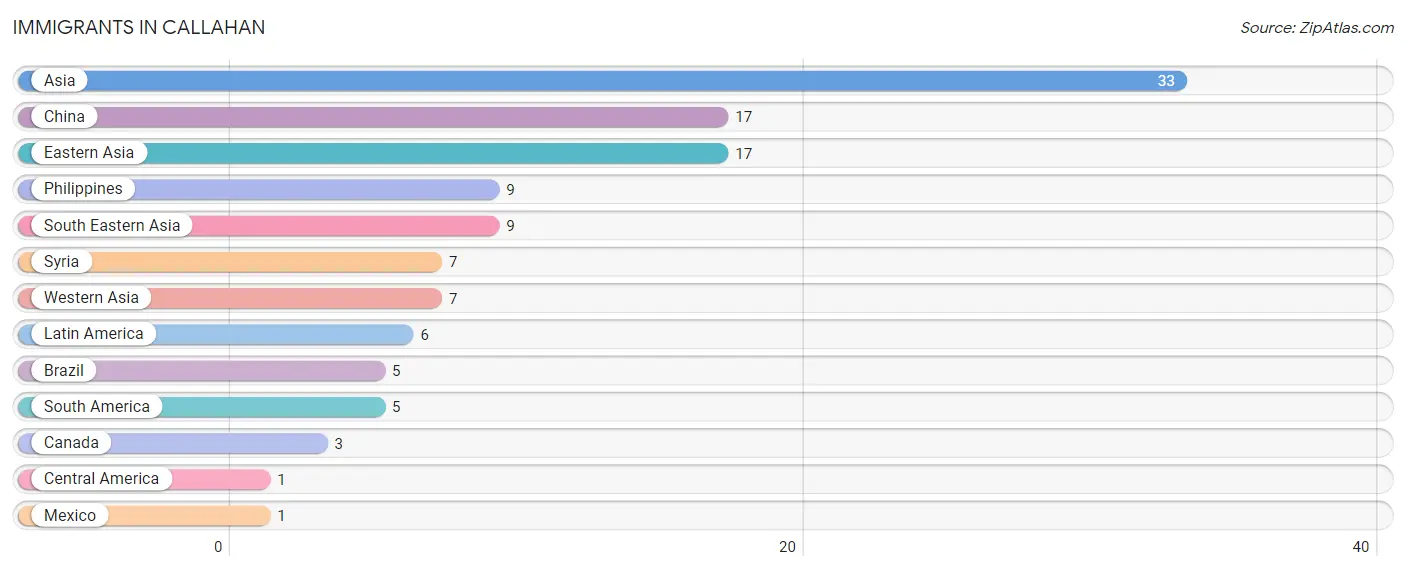
| Immigration Origin | # Population | % Population |
| Asia | 33 | 2.2% |
| Brazil | 5 | 0.3% |
| Canada | 3 | 0.2% |
| Central America | 1 | 0.1% |
| China | 17 | 1.2% |
| Eastern Asia | 17 | 1.2% |
| Latin America | 6 | 0.4% |
| Mexico | 1 | 0.1% |
| Philippines | 9 | 0.6% |
| South America | 5 | 0.3% |
| South Eastern Asia | 9 | 0.6% |
| Syria | 7 | 0.5% |
| Western Asia | 7 | 0.5% | View All 13 Rows |
Sex and Age in Callahan
Sex and Age in Callahan
The most populous age groups in Callahan are 25 to 29 Years (87 | 13.4%) for men and 65 to 69 Years (109 | 13.3%) for women.
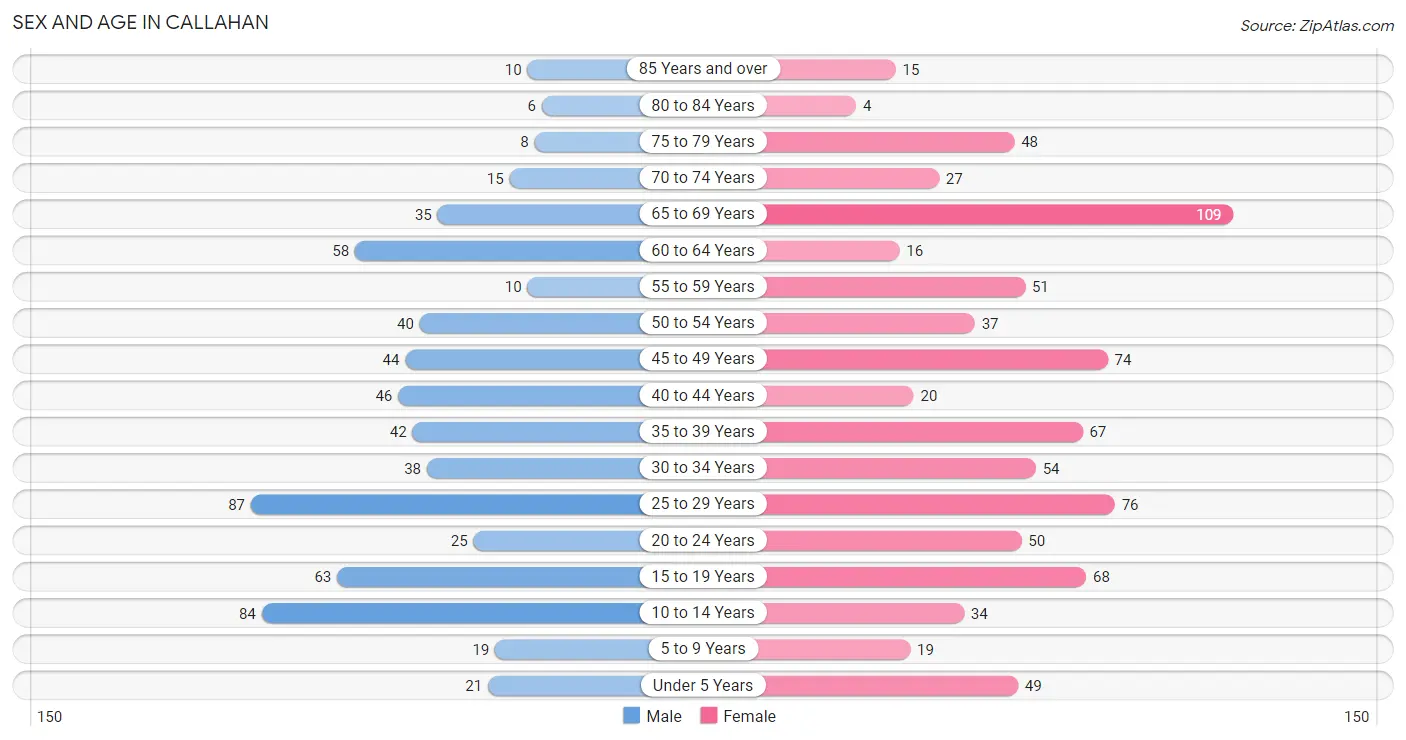
| Age Bracket | Male | Female |
| Under 5 Years | 21 (3.2%) | 49 (6.0%) |
| 5 to 9 Years | 19 (2.9%) | 19 (2.3%) |
| 10 to 14 Years | 84 (12.9%) | 34 (4.2%) |
| 15 to 19 Years | 63 (9.7%) | 68 (8.3%) |
| 20 to 24 Years | 25 (3.8%) | 50 (6.1%) |
| 25 to 29 Years | 87 (13.4%) | 76 (9.3%) |
| 30 to 34 Years | 38 (5.8%) | 54 (6.6%) |
| 35 to 39 Years | 42 (6.5%) | 67 (8.2%) |
| 40 to 44 Years | 46 (7.1%) | 20 (2.4%) |
| 45 to 49 Years | 44 (6.8%) | 74 (9.0%) |
| 50 to 54 Years | 40 (6.1%) | 37 (4.5%) |
| 55 to 59 Years | 10 (1.5%) | 51 (6.2%) |
| 60 to 64 Years | 58 (8.9%) | 16 (2.0%) |
| 65 to 69 Years | 35 (5.4%) | 109 (13.3%) |
| 70 to 74 Years | 15 (2.3%) | 27 (3.3%) |
| 75 to 79 Years | 8 (1.2%) | 48 (5.9%) |
| 80 to 84 Years | 6 (0.9%) | 4 (0.5%) |
| 85 Years and over | 10 (1.5%) | 15 (1.8%) |
| Total | 651 (100.0%) | 818 (100.0%) |
Families and Households in Callahan
Median Family Size in Callahan
The median family size in Callahan is 2.79 persons per family, with married-couple families (257 | 57.8%) accounting for the largest median family size of 2.93 persons per family. On the other hand, single female/mother families (151 | 33.9%) represent the smallest median family size with 2.56 persons per family.
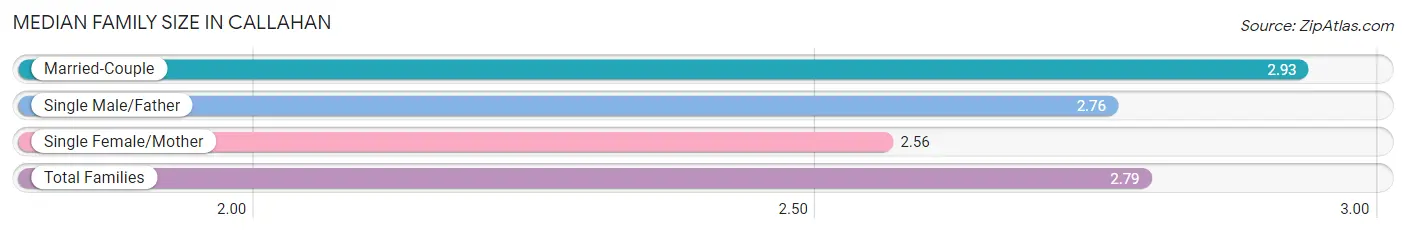
| Family Type | # Families | Family Size |
| Married-Couple | 257 (57.8%) | 2.93 |
| Single Male/Father | 37 (8.3%) | 2.76 |
| Single Female/Mother | 151 (33.9%) | 2.56 |
| Total Families | 445 (100.0%) | 2.79 |
Median Household Size in Callahan
The median household size in Callahan is 2.40 persons per household, with married-couple households (257 | 42.1%) accounting for the largest median household size of 2.95 persons per household. non-family households (166 | 27.2%) represent the smallest median household size with 1.17 persons per household.
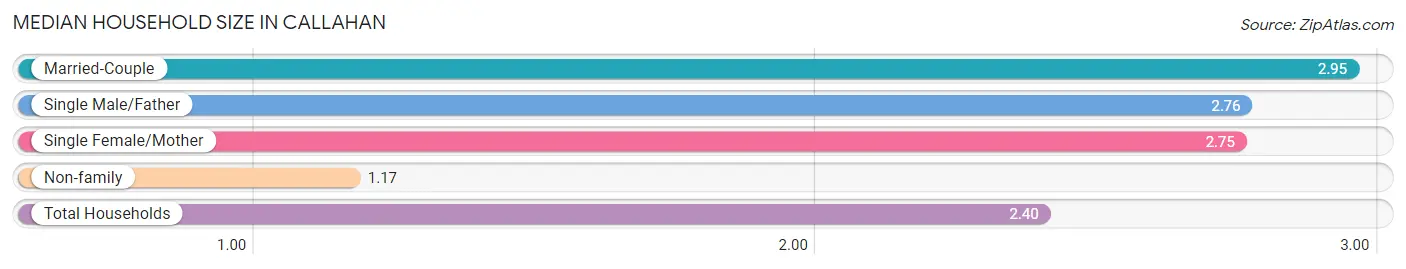
| Household Type | # Households | Household Size |
| Married-Couple | 257 (42.1%) | 2.95 |
| Single Male/Father | 37 (6.1%) | 2.76 |
| Single Female/Mother | 151 (24.7%) | 2.75 |
| Non-family | 166 (27.2%) | 1.17 |
| Total Households | 611 (100.0%) | 2.40 |
Household Size by Marriage Status in Callahan
Out of a total of 611 households in Callahan, 445 (72.8%) are family households, while 166 (27.2%) are nonfamily households. The most numerous type of family households are 2-person households, comprising 193, and the most common type of nonfamily households are 1-person households, comprising 141.
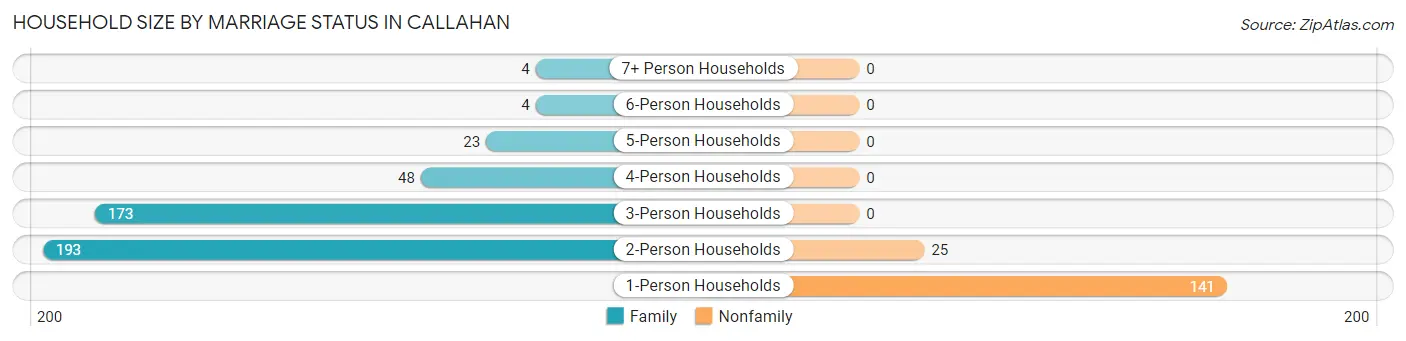
| Household Size | Family Households | Nonfamily Households |
| 1-Person Households | - | 141 (23.1%) |
| 2-Person Households | 193 (31.6%) | 25 (4.1%) |
| 3-Person Households | 173 (28.3%) | 0 (0.0%) |
| 4-Person Households | 48 (7.9%) | 0 (0.0%) |
| 5-Person Households | 23 (3.8%) | 0 (0.0%) |
| 6-Person Households | 4 (0.6%) | 0 (0.0%) |
| 7+ Person Households | 4 (0.6%) | 0 (0.0%) |
| Total | 445 (72.8%) | 166 (27.2%) |
Female Fertility in Callahan
Fertility by Age in Callahan
Average fertility rate in Callahan is 112.0 births per 1,000 women. Women in the age bracket of 20 to 34 years have the highest fertility rate with 206.0 births per 1,000 women. Women in the age bracket of 20 to 34 years acount for 78.7% of all women with births.
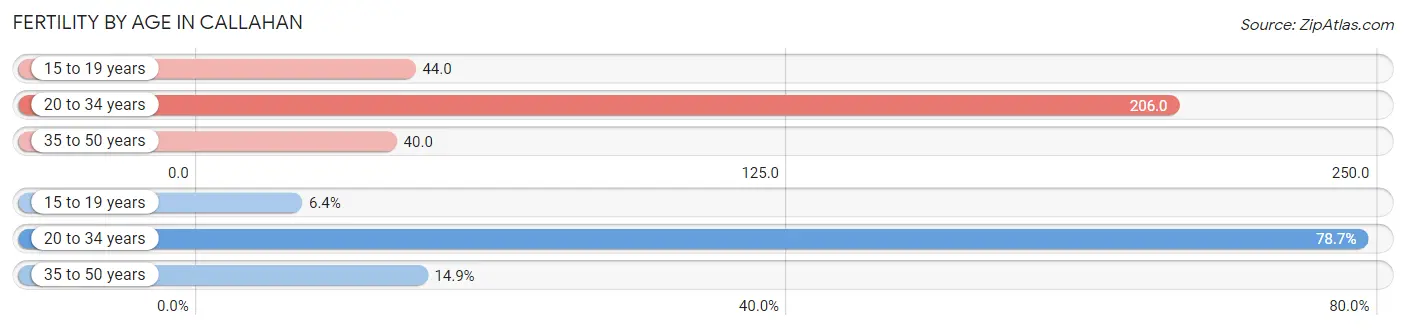
| Age Bracket | Women with Births | Births / 1,000 Women |
| 15 to 19 years | 3 (6.4%) | 44.0 |
| 20 to 34 years | 37 (78.7%) | 206.0 |
| 35 to 50 years | 7 (14.9%) | 40.0 |
| Total | 47 (100.0%) | 112.0 |
Fertility by Age by Marriage Status in Callahan
85.1% of women with births (47) in Callahan are married. The highest percentage of unmarried women with births falls into 15 to 19 years age bracket with 100.0% of them unmarried at the time of birth, while the lowest percentage of unmarried women with births belong to 20 to 34 years age bracket with 0.0% of them unmarried.
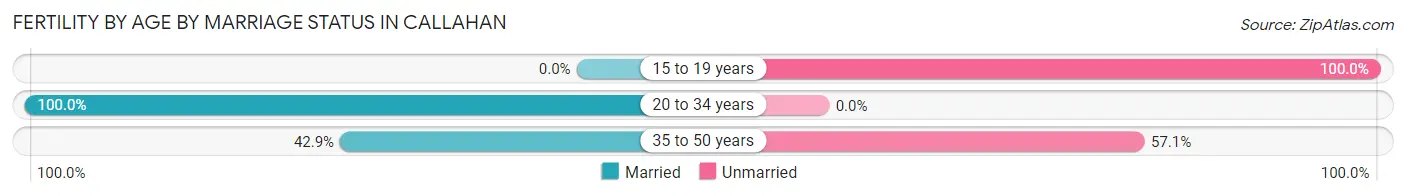
| Age Bracket | Married | Unmarried |
| 15 to 19 years | 0 (0.0%) | 3 (100.0%) |
| 20 to 34 years | 37 (100.0%) | 0 (0.0%) |
| 35 to 50 years | 3 (42.9%) | 4 (57.1%) |
| Total | 40 (85.1%) | 7 (14.9%) |
Fertility by Education in Callahan
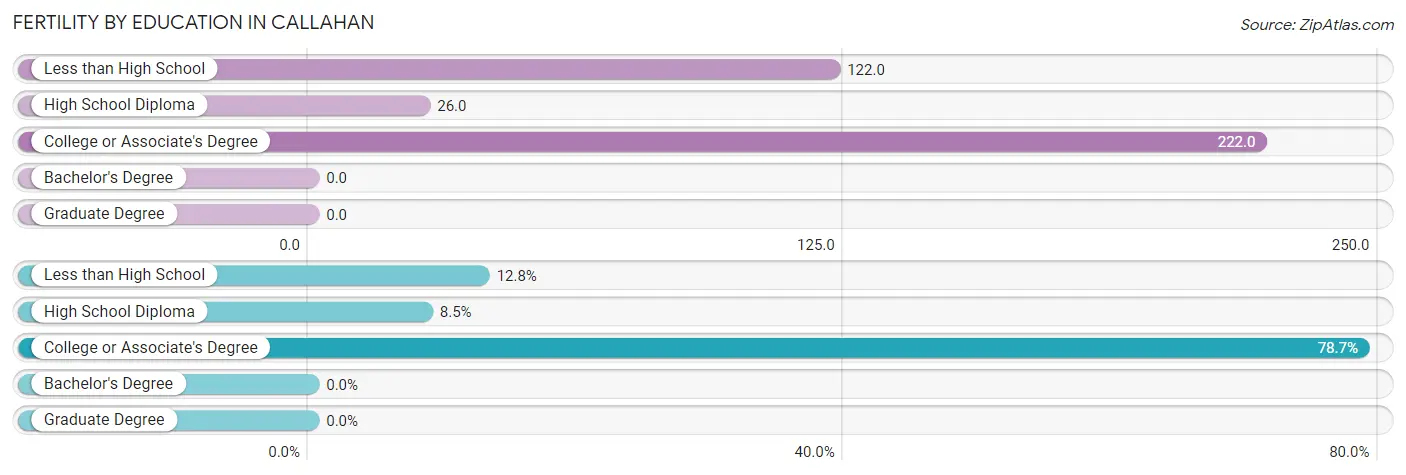
| Educational Attainment | Women with Births | Births / 1,000 Women |
| Less than High School | 6 (12.8%) | 122.0 |
| High School Diploma | 4 (8.5%) | 26.0 |
| College or Associate's Degree | 37 (78.7%) | 222.0 |
| Bachelor's Degree | 0 (0.0%) | 0.0 |
| Graduate Degree | 0 (0.0%) | 0.0 |
| Total | 47 (100.0%) | 112.0 |
Fertility by Education by Marriage Status in Callahan
14.9% of women with births in Callahan are unmarried. Women with the educational attainment of college or associate's degree are most likely to be married with 100.0% of them married at childbirth, while women with the educational attainment of high school diploma are least likely to be married with 100.0% of them unmarried at childbirth.
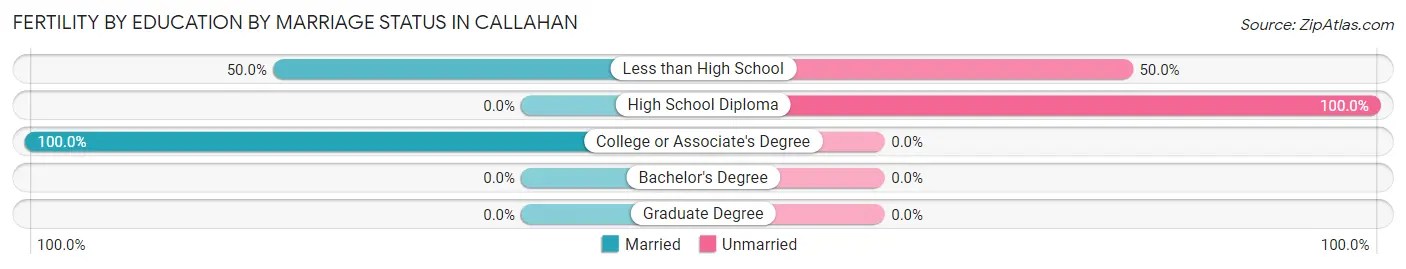
| Educational Attainment | Married | Unmarried |
| Less than High School | 3 (50.0%) | 3 (50.0%) |
| High School Diploma | 0 (0.0%) | 4 (100.0%) |
| College or Associate's Degree | 37 (100.0%) | 0 (0.0%) |
| Bachelor's Degree | 0 (0.0%) | 0 (0.0%) |
| Graduate Degree | 0 (0.0%) | 0 (0.0%) |
| Total | 40 (85.1%) | 7 (14.9%) |
Employment Characteristics in Callahan
Employment by Class of Employer in Callahan
Among the 684 employed individuals in Callahan, private company employees (520 | 76.0%), local government employees (59 | 8.6%), and not-for-profit organizations (41 | 6.0%) make up the most common classes of employment.
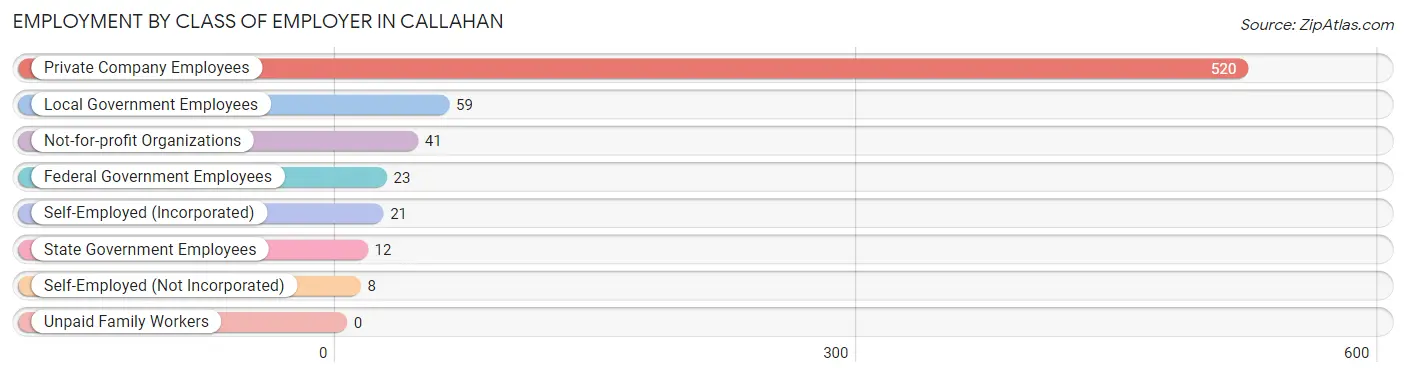
| Employer Class | # Employees | % Employees |
| Private Company Employees | 520 | 76.0% |
| Self-Employed (Incorporated) | 21 | 3.1% |
| Self-Employed (Not Incorporated) | 8 | 1.2% |
| Not-for-profit Organizations | 41 | 6.0% |
| Local Government Employees | 59 | 8.6% |
| State Government Employees | 12 | 1.8% |
| Federal Government Employees | 23 | 3.4% |
| Unpaid Family Workers | 0 | 0.0% |
| Total | 684 | 100.0% |
Employment Status by Age in Callahan
According to the labor force statistics for Callahan, out of the total population over 16 years of age (1,212), 59.0% or 715 individuals are in the labor force, with 3.0% or 21 of them unemployed. The age group with the highest labor force participation rate is 25 to 29 years, with 89.0% or 145 individuals in the labor force. Within the labor force, the 65 to 74 years age range has the highest percentage of unemployed individuals, with 26.9% or 7 of them being unemployed.
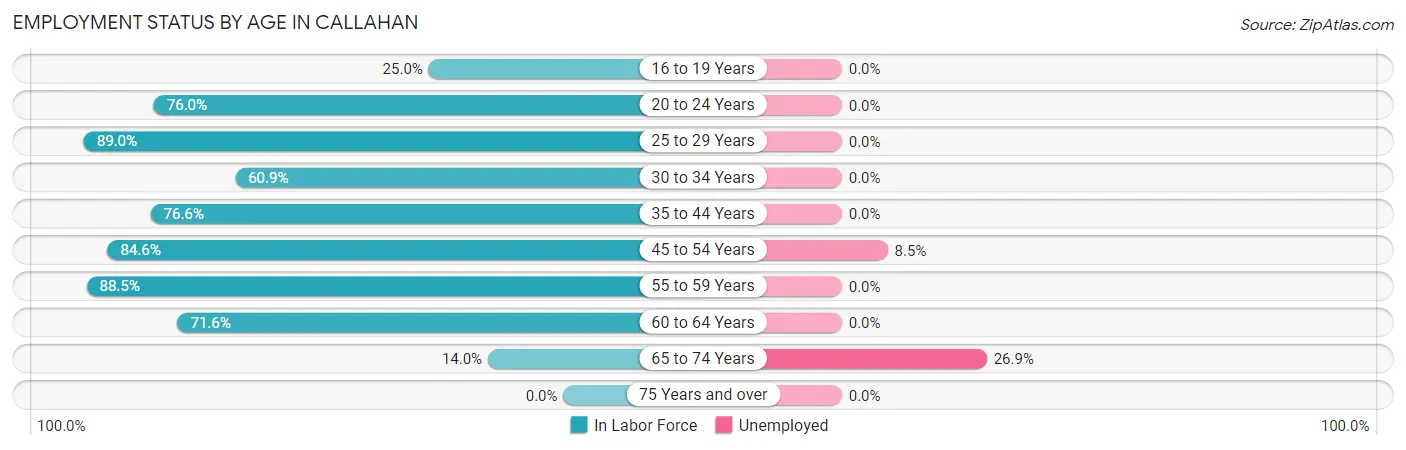
| Age Bracket | In Labor Force | Unemployed |
| 16 to 19 Years | 25 (25.0%) | 0 (0.0%) |
| 20 to 24 Years | 57 (76.0%) | 0 (0.0%) |
| 25 to 29 Years | 145 (89.0%) | 0 (0.0%) |
| 30 to 34 Years | 56 (60.9%) | 0 (0.0%) |
| 35 to 44 Years | 134 (76.6%) | 0 (0.0%) |
| 45 to 54 Years | 165 (84.6%) | 14 (8.5%) |
| 55 to 59 Years | 54 (88.5%) | 0 (0.0%) |
| 60 to 64 Years | 53 (71.6%) | 0 (0.0%) |
| 65 to 74 Years | 26 (14.0%) | 7 (26.9%) |
| 75 Years and over | 0 (0.0%) | 0 (0.0%) |
| Total | 715 (59.0%) | 21 (3.0%) |
Employment Status by Educational Attainment in Callahan
According to labor force statistics for Callahan, 79.9% of individuals (607) out of the total population between 25 and 64 years of age (760) are in the labor force, with 2.3% or 14 of them being unemployed. The group with the highest labor force participation rate are those with the educational attainment of bachelor's degree or higher, with 99.1% or 105 individuals in the labor force. Within the labor force, individuals with less than high school education have the highest percentage of unemployment, with 21.2% or 7 of them being unemployed.
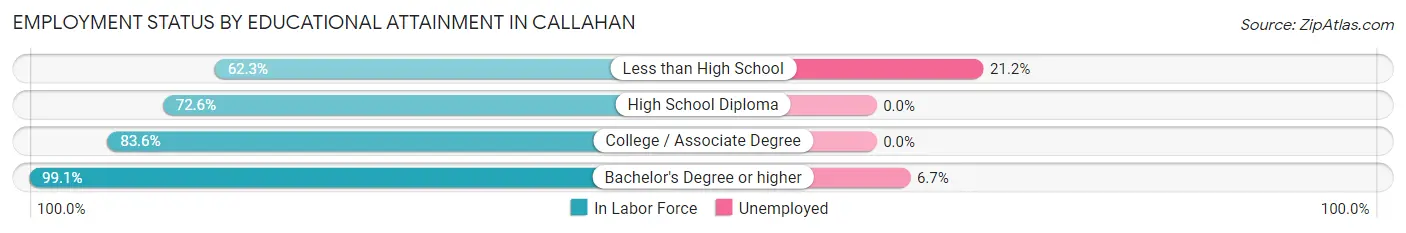
| Educational Attainment | In Labor Force | Unemployed |
| Less than High School | 33 (62.3%) | 11 (21.2%) |
| High School Diploma | 220 (72.6%) | 0 (0.0%) |
| College / Associate Degree | 249 (83.6%) | 0 (0.0%) |
| Bachelor's Degree or higher | 105 (99.1%) | 7 (6.7%) |
| Total | 607 (79.9%) | 17 (2.3%) |
Employment Occupations by Sex in Callahan
Management, Business, Science and Arts Occupations
The most common Management, Business, Science and Arts occupations in Callahan are Management (86 | 12.5%), Health Diagnosing & Treating (38 | 5.5%), Community & Social Service (31 | 4.5%), Education Instruction & Library (18 | 2.6%), and Education, Arts & Media (13 | 1.9%).
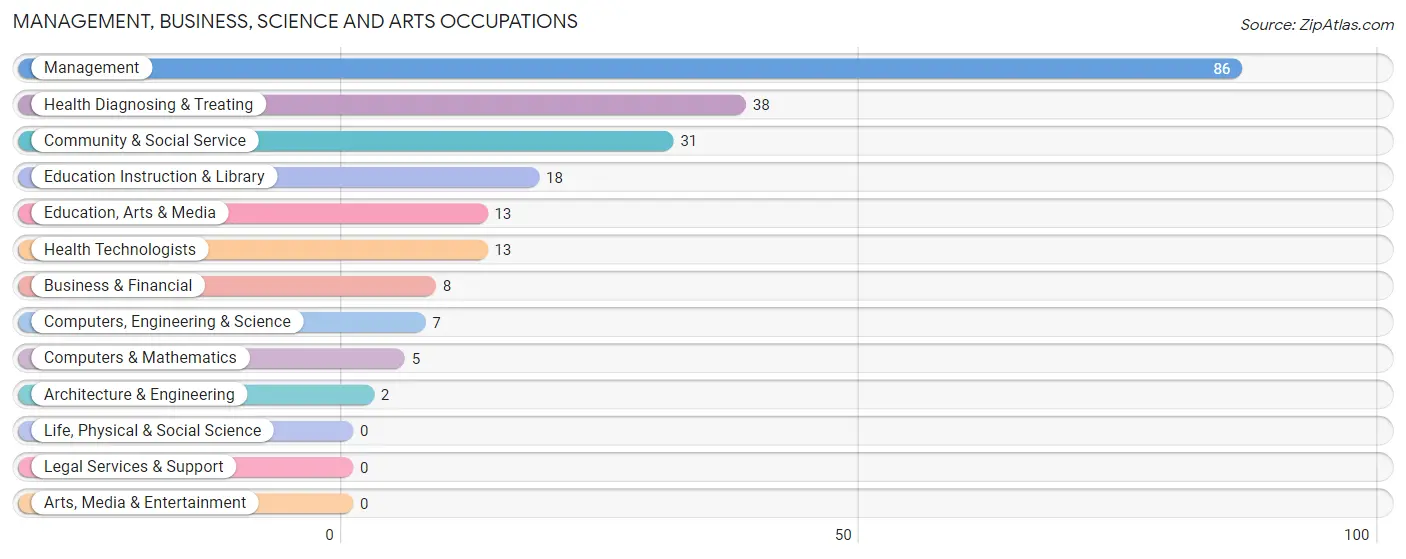
Management, Business, Science and Arts Occupations by Sex
Within the Management, Business, Science and Arts occupations in Callahan, the most male-oriented occupations are Computers, Engineering & Science (100.0%), Computers & Mathematics (100.0%), and Architecture & Engineering (100.0%), while the most female-oriented occupations are Education, Arts & Media (100.0%), Health Diagnosing & Treating (100.0%), and Health Technologists (100.0%).
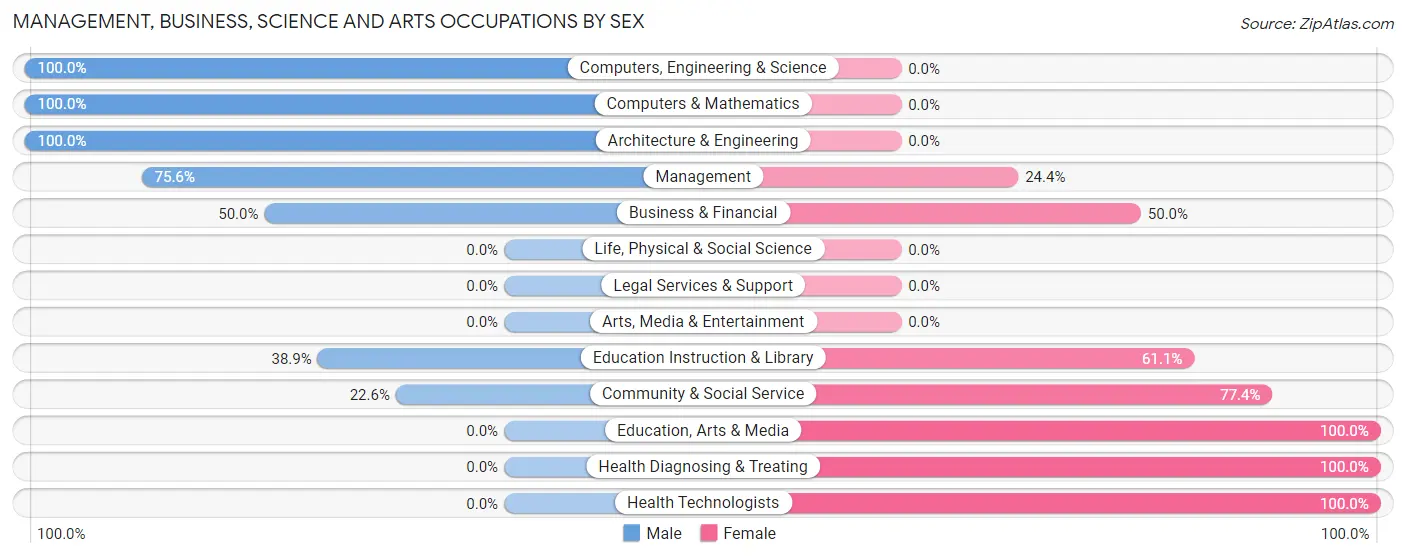
| Occupation | Male | Female |
| Management | 65 (75.6%) | 21 (24.4%) |
| Business & Financial | 4 (50.0%) | 4 (50.0%) |
| Computers, Engineering & Science | 7 (100.0%) | 0 (0.0%) |
| Computers & Mathematics | 5 (100.0%) | 0 (0.0%) |
| Architecture & Engineering | 2 (100.0%) | 0 (0.0%) |
| Life, Physical & Social Science | 0 (0.0%) | 0 (0.0%) |
| Community & Social Service | 7 (22.6%) | 24 (77.4%) |
| Education, Arts & Media | 0 (0.0%) | 13 (100.0%) |
| Legal Services & Support | 0 (0.0%) | 0 (0.0%) |
| Education Instruction & Library | 7 (38.9%) | 11 (61.1%) |
| Arts, Media & Entertainment | 0 (0.0%) | 0 (0.0%) |
| Health Diagnosing & Treating | 0 (0.0%) | 38 (100.0%) |
| Health Technologists | 0 (0.0%) | 13 (100.0%) |
| Total (Category) | 83 (48.8%) | 87 (51.2%) |
| Total (Overall) | 344 (50.1%) | 342 (49.8%) |
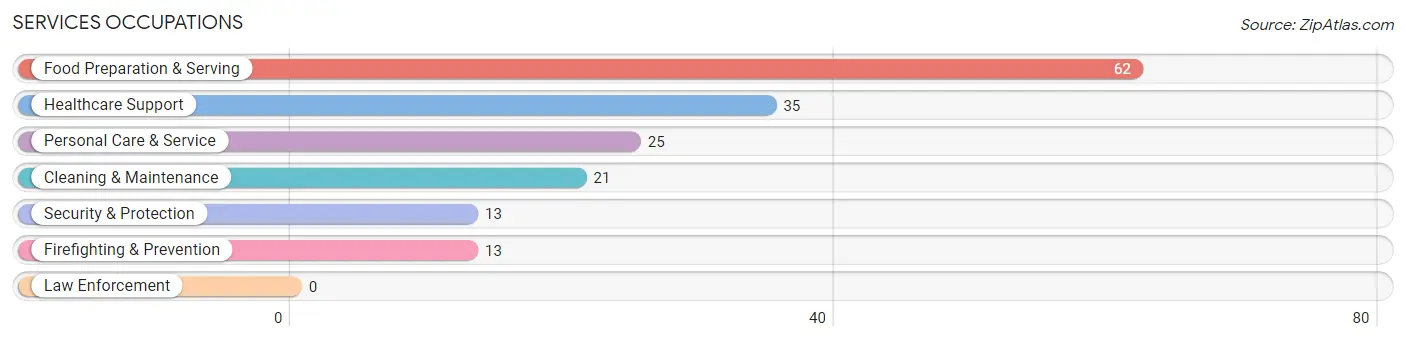
Services Occupations
The most common Services occupations in Callahan are Food Preparation & Serving (62 | 9.0%), Healthcare Support (35 | 5.1%), Personal Care & Service (25 | 3.6%), Cleaning & Maintenance (21 | 3.1%), and Security & Protection (13 | 1.9%).
Services Occupations by Sex
Within the Services occupations in Callahan, the most male-oriented occupations are Cleaning & Maintenance (100.0%), Security & Protection (38.5%), and Firefighting & Prevention (38.5%), while the most female-oriented occupations are Healthcare Support (100.0%), Food Preparation & Serving (74.2%), and Personal Care & Service (68.0%).
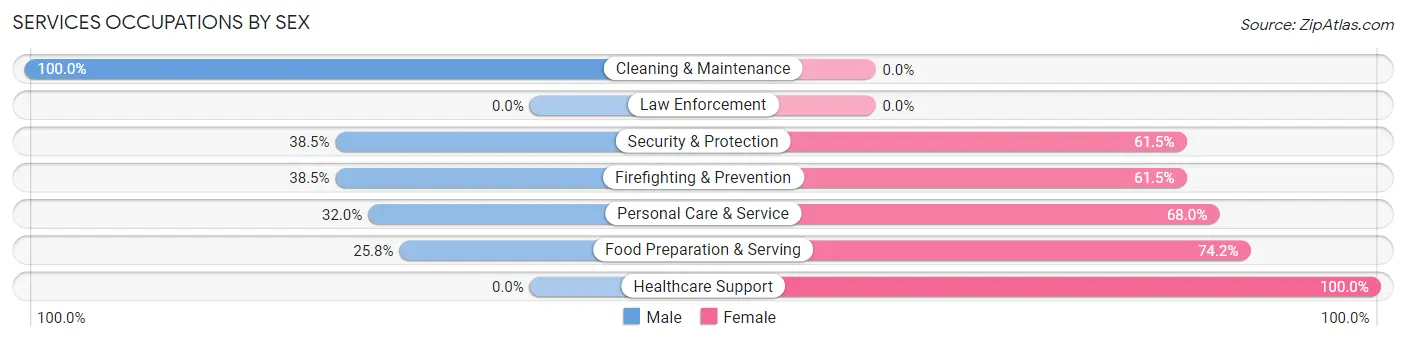
| Occupation | Male | Female |
| Healthcare Support | 0 (0.0%) | 35 (100.0%) |
| Security & Protection | 5 (38.5%) | 8 (61.5%) |
| Firefighting & Prevention | 5 (38.5%) | 8 (61.5%) |
| Law Enforcement | 0 (0.0%) | 0 (0.0%) |
| Food Preparation & Serving | 16 (25.8%) | 46 (74.2%) |
| Cleaning & Maintenance | 21 (100.0%) | 0 (0.0%) |
| Personal Care & Service | 8 (32.0%) | 17 (68.0%) |
| Total (Category) | 50 (32.1%) | 106 (67.9%) |
| Total (Overall) | 344 (50.1%) | 342 (49.8%) |
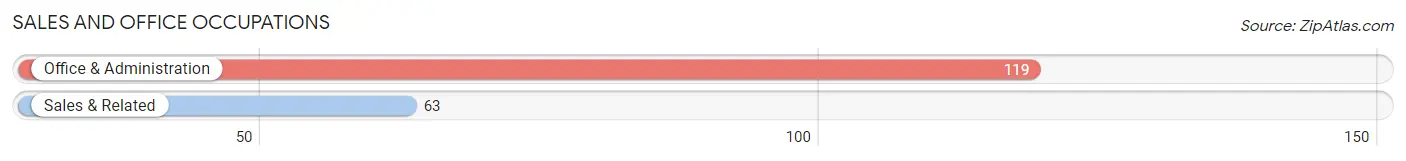
Sales and Office Occupations
The most common Sales and Office occupations in Callahan are Office & Administration (119 | 17.3%), and Sales & Related (63 | 9.2%).
Sales and Office Occupations by Sex
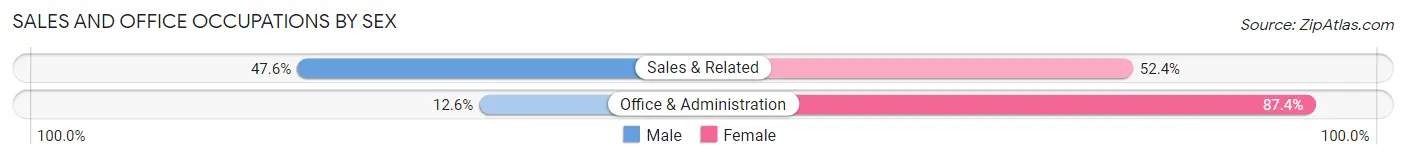
| Occupation | Male | Female |
| Sales & Related | 30 (47.6%) | 33 (52.4%) |
| Office & Administration | 15 (12.6%) | 104 (87.4%) |
| Total (Category) | 45 (24.7%) | 137 (75.3%) |
| Total (Overall) | 344 (50.1%) | 342 (49.8%) |
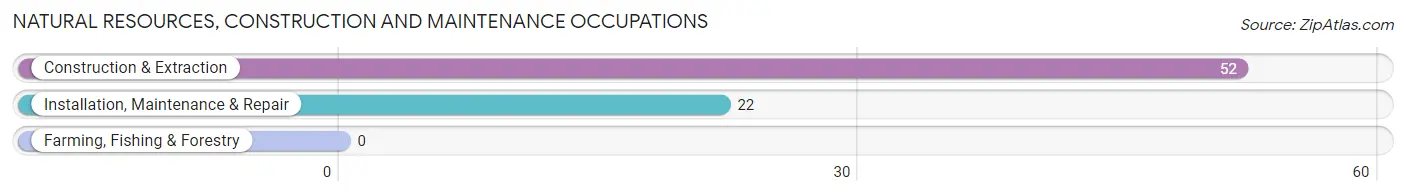
Natural Resources, Construction and Maintenance Occupations
The most common Natural Resources, Construction and Maintenance occupations in Callahan are Construction & Extraction (52 | 7.6%), and Installation, Maintenance & Repair (22 | 3.2%).
Natural Resources, Construction and Maintenance Occupations by Sex
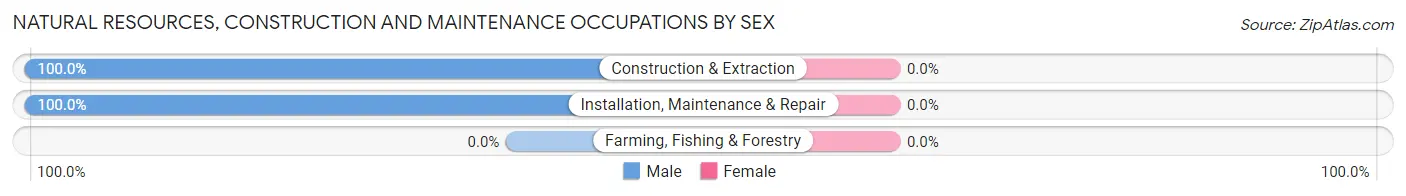
| Occupation | Male | Female |
| Farming, Fishing & Forestry | 0 (0.0%) | 0 (0.0%) |
| Construction & Extraction | 52 (100.0%) | 0 (0.0%) |
| Installation, Maintenance & Repair | 22 (100.0%) | 0 (0.0%) |
| Total (Category) | 74 (100.0%) | 0 (0.0%) |
| Total (Overall) | 344 (50.1%) | 342 (49.8%) |
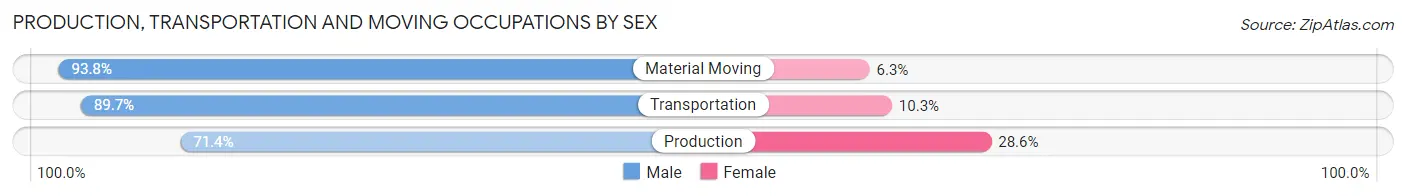
Production, Transportation and Moving Occupations
The most common Production, Transportation and Moving occupations in Callahan are Transportation (58 | 8.5%), Material Moving (32 | 4.7%), and Production (14 | 2.0%).
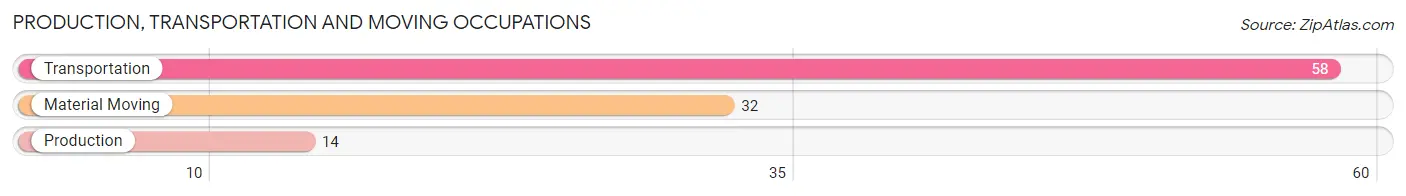
Production, Transportation and Moving Occupations by Sex
| Occupation | Male | Female |
| Production | 10 (71.4%) | 4 (28.6%) |
| Transportation | 52 (89.7%) | 6 (10.3%) |
| Material Moving | 30 (93.8%) | 2 (6.2%) |
| Total (Category) | 92 (88.5%) | 12 (11.5%) |
| Total (Overall) | 344 (50.1%) | 342 (49.8%) |
Employment Industries by Sex in Callahan
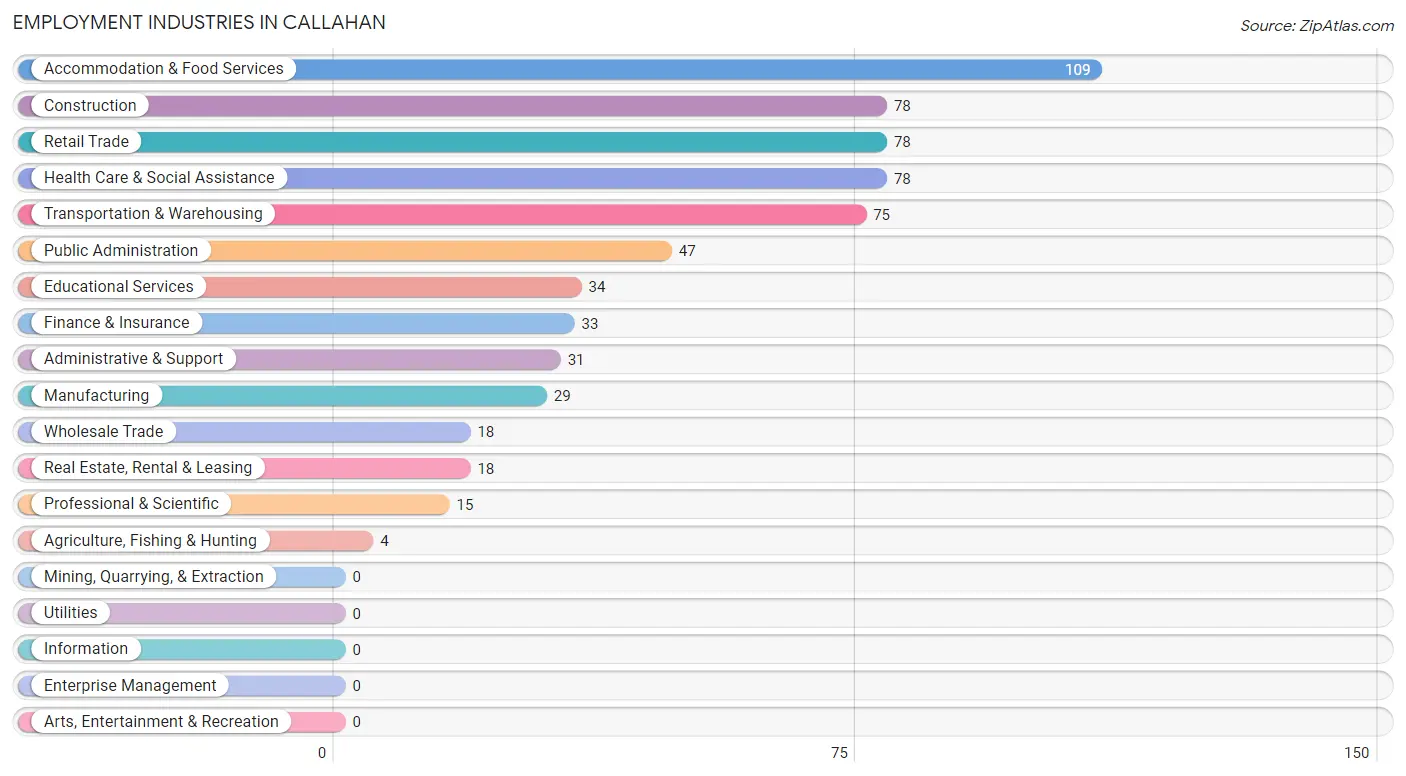
Employment Industries in Callahan
The major employment industries in Callahan include Accommodation & Food Services (109 | 15.9%), Construction (78 | 11.4%), Retail Trade (78 | 11.4%), Health Care & Social Assistance (78 | 11.4%), and Transportation & Warehousing (75 | 10.9%).
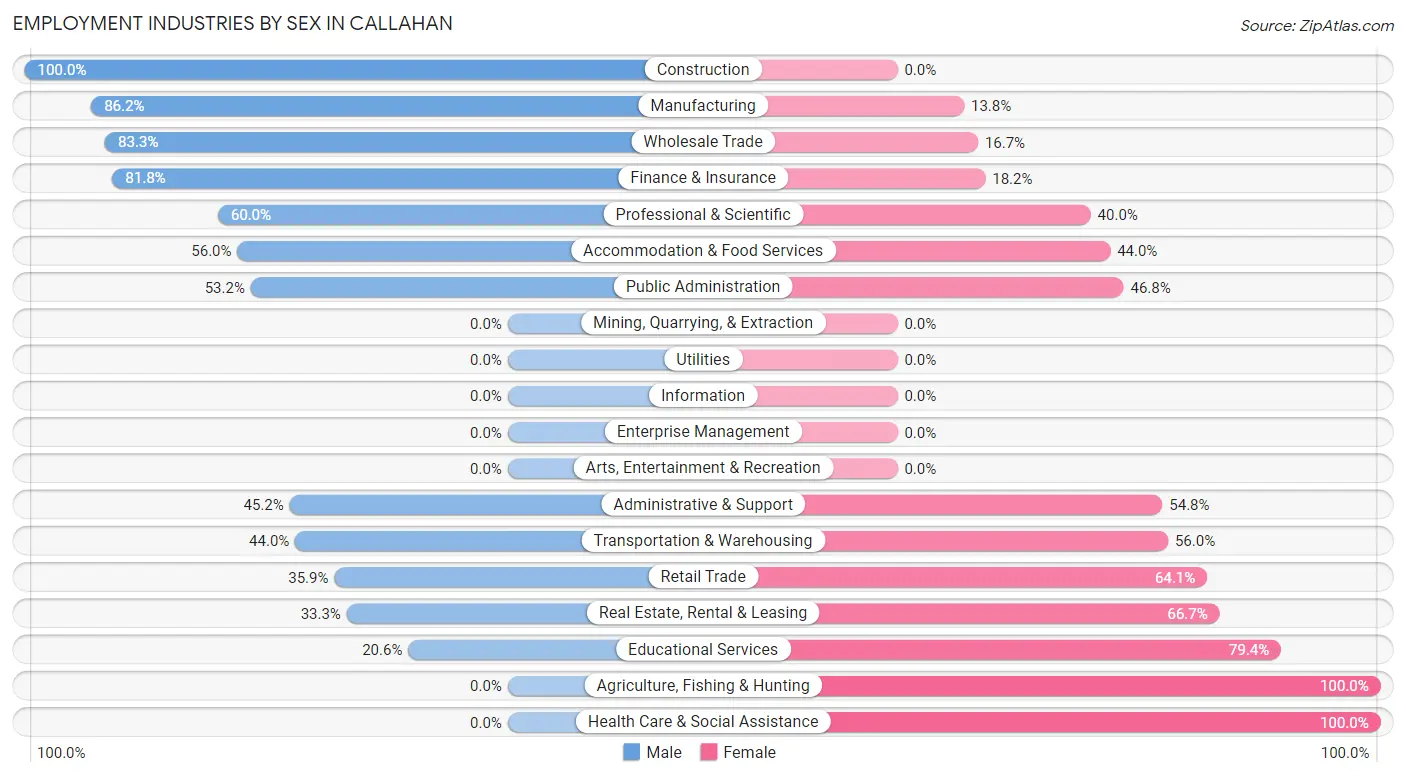
Employment Industries by Sex in Callahan
The Callahan industries that see more men than women are Construction (100.0%), Manufacturing (86.2%), and Wholesale Trade (83.3%), whereas the industries that tend to have a higher number of women are Agriculture, Fishing & Hunting (100.0%), Health Care & Social Assistance (100.0%), and Educational Services (79.4%).
| Industry | Male | Female |
| Agriculture, Fishing & Hunting | 0 (0.0%) | 4 (100.0%) |
| Mining, Quarrying, & Extraction | 0 (0.0%) | 0 (0.0%) |
| Construction | 78 (100.0%) | 0 (0.0%) |
| Manufacturing | 25 (86.2%) | 4 (13.8%) |
| Wholesale Trade | 15 (83.3%) | 3 (16.7%) |
| Retail Trade | 28 (35.9%) | 50 (64.1%) |
| Transportation & Warehousing | 33 (44.0%) | 42 (56.0%) |
| Utilities | 0 (0.0%) | 0 (0.0%) |
| Information | 0 (0.0%) | 0 (0.0%) |
| Finance & Insurance | 27 (81.8%) | 6 (18.2%) |
| Real Estate, Rental & Leasing | 6 (33.3%) | 12 (66.7%) |
| Professional & Scientific | 9 (60.0%) | 6 (40.0%) |
| Enterprise Management | 0 (0.0%) | 0 (0.0%) |
| Administrative & Support | 14 (45.2%) | 17 (54.8%) |
| Educational Services | 7 (20.6%) | 27 (79.4%) |
| Health Care & Social Assistance | 0 (0.0%) | 78 (100.0%) |
| Arts, Entertainment & Recreation | 0 (0.0%) | 0 (0.0%) |
| Accommodation & Food Services | 61 (56.0%) | 48 (44.0%) |
| Public Administration | 25 (53.2%) | 22 (46.8%) |
| Total | 344 (50.1%) | 342 (49.8%) |
Education in Callahan
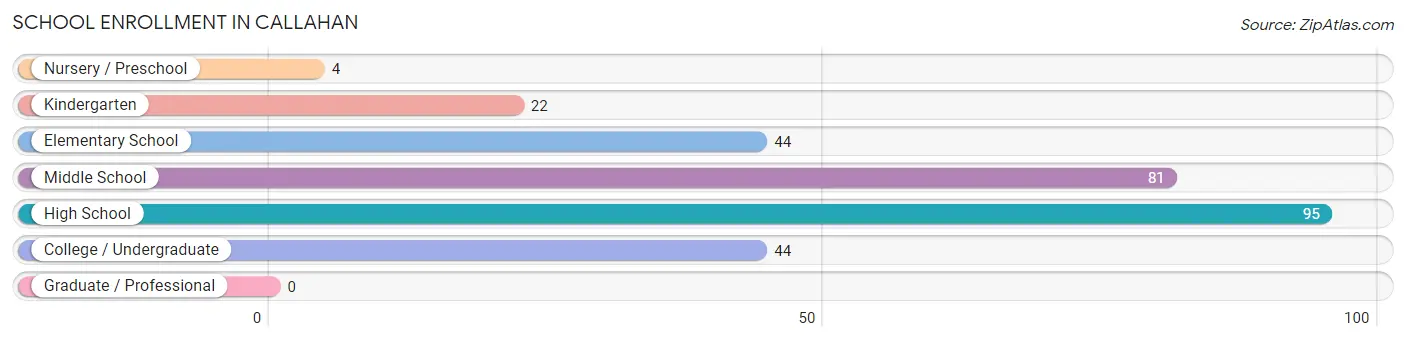
School Enrollment in Callahan
The most common levels of schooling among the 290 students in Callahan are high school (95 | 32.8%), middle school (81 | 27.9%), and elementary school (44 | 15.2%).
| School Level | # Students | % Students |
| Nursery / Preschool | 4 | 1.4% |
| Kindergarten | 22 | 7.6% |
| Elementary School | 44 | 15.2% |
| Middle School | 81 | 27.9% |
| High School | 95 | 32.8% |
| College / Undergraduate | 44 | 15.2% |
| Graduate / Professional | 0 | 0.0% |
| Total | 290 | 100.0% |
School Enrollment by Age by Funding Source in Callahan
Out of a total of 290 students who are enrolled in schools in Callahan, 81 (27.9%) attend a private institution, while the remaining 209 (72.1%) are enrolled in public schools. The age group of 20 to 24 year olds has the highest likelihood of being enrolled in private schools, with 13 (100.0% in the age bracket) enrolled. Conversely, the age group of 3 to 4 year olds has the lowest likelihood of being enrolled in a private school, with 4 (100.0% in the age bracket) attending a public institution.
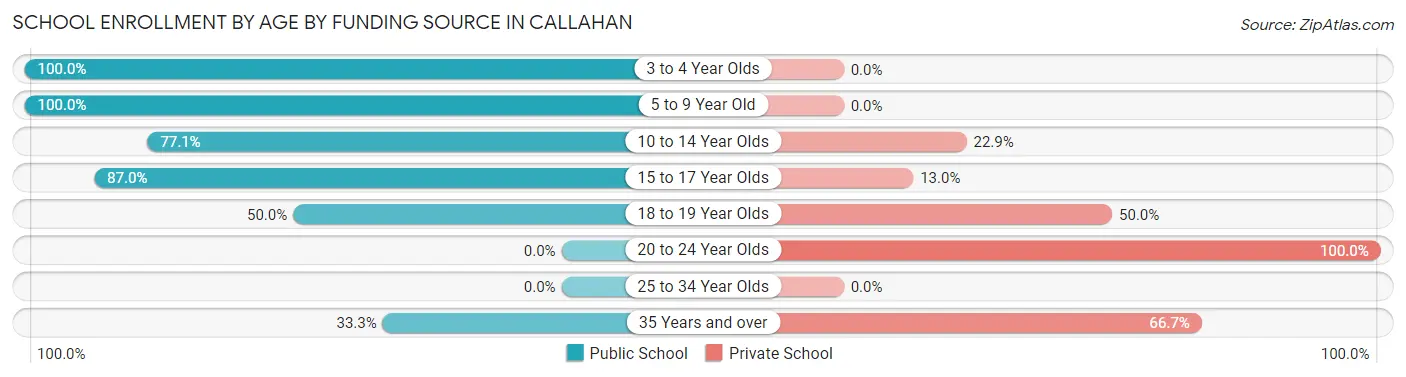
| Age Bracket | Public School | Private School |
| 3 to 4 Year Olds | 4 (100.0%) | 0 (0.0%) |
| 5 to 9 Year Old | 38 (100.0%) | 0 (0.0%) |
| 10 to 14 Year Olds | 91 (77.1%) | 27 (22.9%) |
| 15 to 17 Year Olds | 47 (87.0%) | 7 (13.0%) |
| 18 to 19 Year Olds | 24 (50.0%) | 24 (50.0%) |
| 20 to 24 Year Olds | 0 (0.0%) | 13 (100.0%) |
| 25 to 34 Year Olds | 0 (0.0%) | 0 (0.0%) |
| 35 Years and over | 5 (33.3%) | 10 (66.7%) |
| Total | 209 (72.1%) | 81 (27.9%) |
Educational Attainment by Field of Study in Callahan
Education (61 | 47.7%), business (39 | 30.5%), engineering (8 | 6.2%), visual & performing arts (6 | 4.7%), and science & technology (5 | 3.9%) are the most common fields of study among 128 individuals in Callahan who have obtained a bachelor's degree or higher.
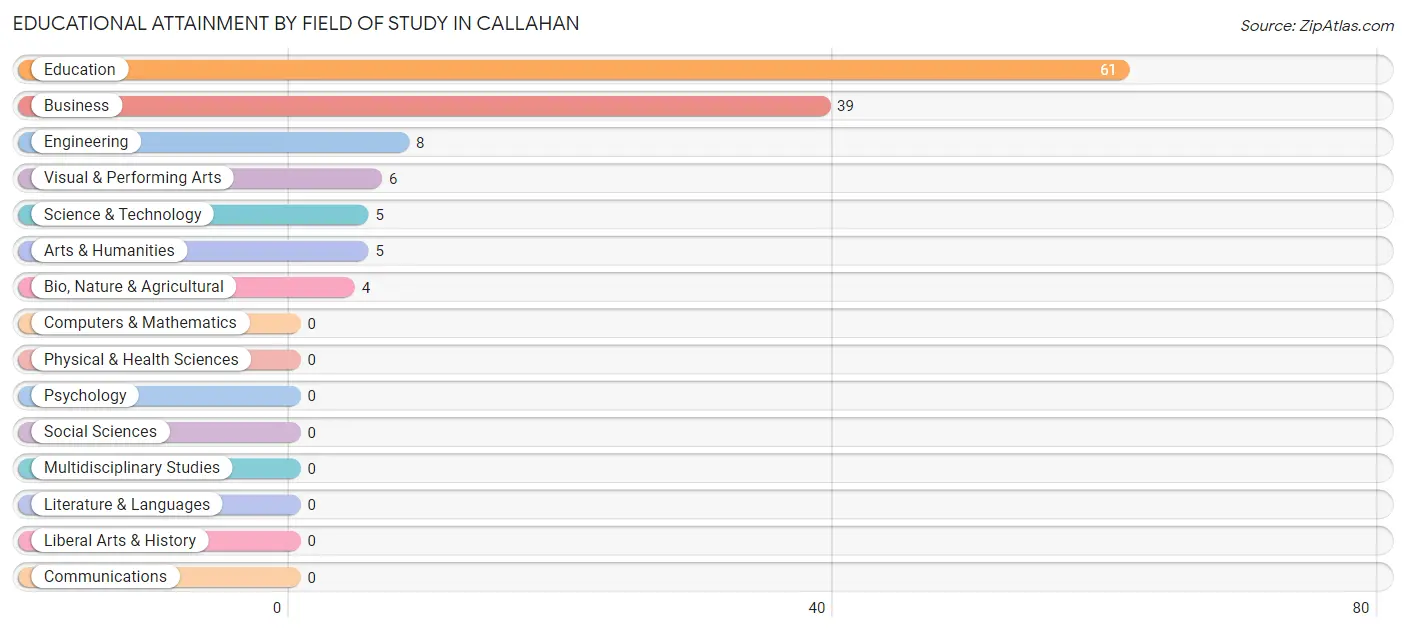
| Field of Study | # Graduates | % Graduates |
| Computers & Mathematics | 0 | 0.0% |
| Bio, Nature & Agricultural | 4 | 3.1% |
| Physical & Health Sciences | 0 | 0.0% |
| Psychology | 0 | 0.0% |
| Social Sciences | 0 | 0.0% |
| Engineering | 8 | 6.2% |
| Multidisciplinary Studies | 0 | 0.0% |
| Science & Technology | 5 | 3.9% |
| Business | 39 | 30.5% |
| Education | 61 | 47.7% |
| Literature & Languages | 0 | 0.0% |
| Liberal Arts & History | 0 | 0.0% |
| Visual & Performing Arts | 6 | 4.7% |
| Communications | 0 | 0.0% |
| Arts & Humanities | 5 | 3.9% |
| Total | 128 | 100.0% |
Transportation & Commute in Callahan
Vehicle Availability by Sex in Callahan
The most prevalent vehicle ownership categories in Callahan are males with 2 vehicles (193, accounting for 56.4%) and females with 2 vehicles (151, making up 56.4%).
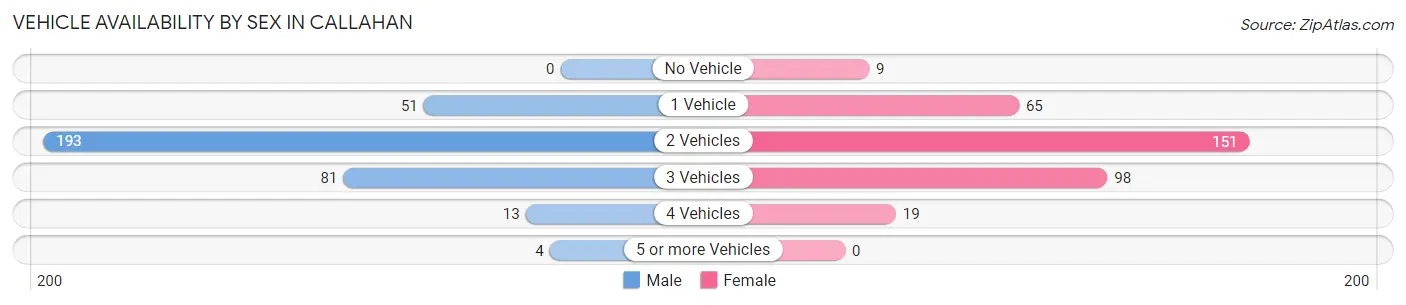
| Vehicles Available | Male | Female |
| No Vehicle | 0 (0.0%) | 9 (2.6%) |
| 1 Vehicle | 51 (14.9%) | 65 (19.0%) |
| 2 Vehicles | 193 (56.4%) | 151 (44.2%) |
| 3 Vehicles | 81 (23.7%) | 98 (28.6%) |
| 4 Vehicles | 13 (3.8%) | 19 (5.6%) |
| 5 or more Vehicles | 4 (1.2%) | 0 (0.0%) |
| Total | 342 (100.0%) | 342 (100.0%) |
Commute Time in Callahan
The most frequently occuring commute durations in Callahan are 30 to 34 minutes (162 commuters, 24.5%), 45 to 59 minutes (101 commuters, 15.3%), and 25 to 29 minutes (94 commuters, 14.2%).
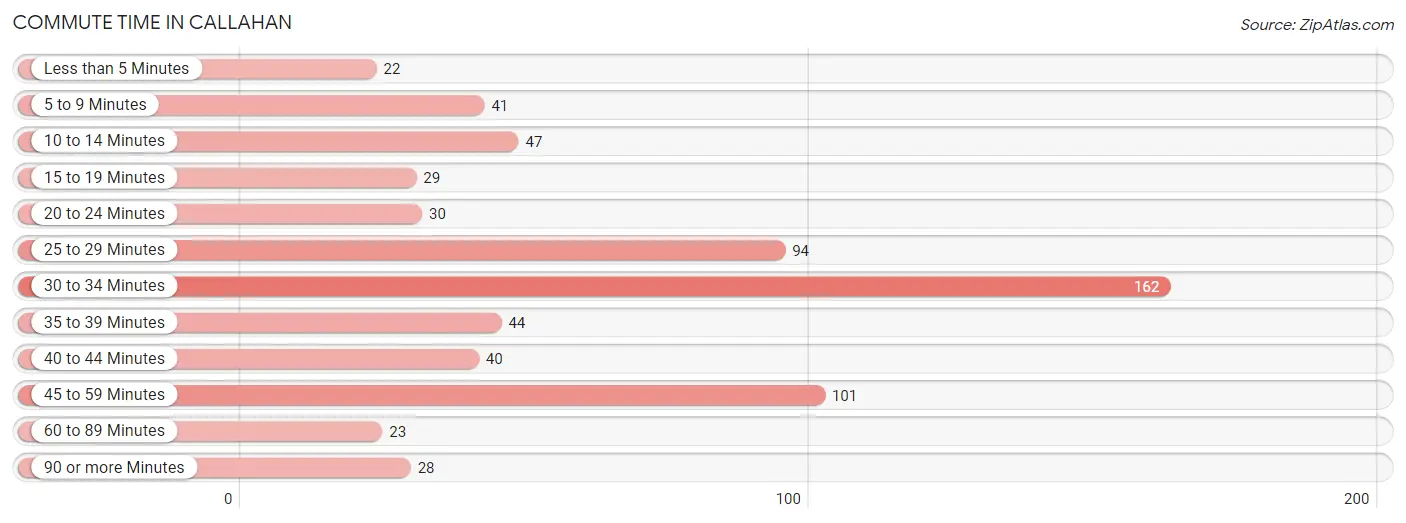
| Commute Time | # Commuters | % Commuters |
| Less than 5 Minutes | 22 | 3.3% |
| 5 to 9 Minutes | 41 | 6.2% |
| 10 to 14 Minutes | 47 | 7.1% |
| 15 to 19 Minutes | 29 | 4.4% |
| 20 to 24 Minutes | 30 | 4.5% |
| 25 to 29 Minutes | 94 | 14.2% |
| 30 to 34 Minutes | 162 | 24.5% |
| 35 to 39 Minutes | 44 | 6.7% |
| 40 to 44 Minutes | 40 | 6.0% |
| 45 to 59 Minutes | 101 | 15.3% |
| 60 to 89 Minutes | 23 | 3.5% |
| 90 or more Minutes | 28 | 4.2% |
Commute Time by Sex in Callahan
The most common commute times in Callahan are 30 to 34 minutes (91 commuters, 27.5%) for males and 30 to 34 minutes (71 commuters, 21.5%) for females.
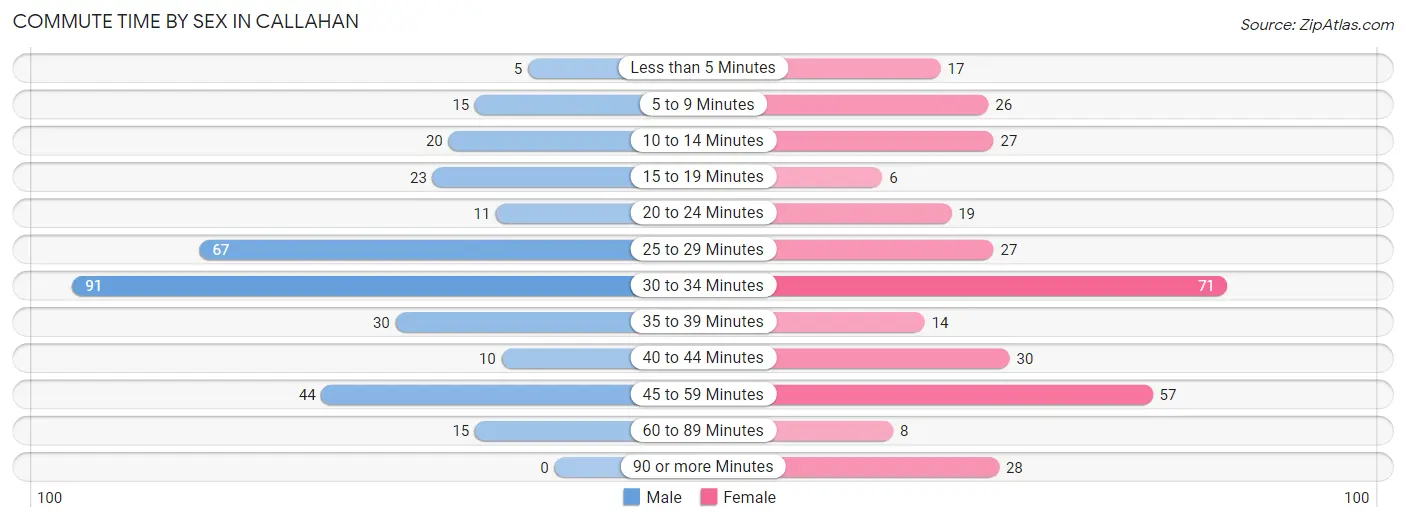
| Commute Time | Male | Female |
| Less than 5 Minutes | 5 (1.5%) | 17 (5.1%) |
| 5 to 9 Minutes | 15 (4.5%) | 26 (7.9%) |
| 10 to 14 Minutes | 20 (6.0%) | 27 (8.2%) |
| 15 to 19 Minutes | 23 (7.0%) | 6 (1.8%) |
| 20 to 24 Minutes | 11 (3.3%) | 19 (5.8%) |
| 25 to 29 Minutes | 67 (20.2%) | 27 (8.2%) |
| 30 to 34 Minutes | 91 (27.5%) | 71 (21.5%) |
| 35 to 39 Minutes | 30 (9.1%) | 14 (4.2%) |
| 40 to 44 Minutes | 10 (3.0%) | 30 (9.1%) |
| 45 to 59 Minutes | 44 (13.3%) | 57 (17.3%) |
| 60 to 89 Minutes | 15 (4.5%) | 8 (2.4%) |
| 90 or more Minutes | 0 (0.0%) | 28 (8.5%) |
Time of Departure to Work by Sex in Callahan
The most frequent times of departure to work in Callahan are 6:00 AM to 6:29 AM (67, 20.2%) for males and 7:00 AM to 7:29 AM (84, 25.5%) for females.
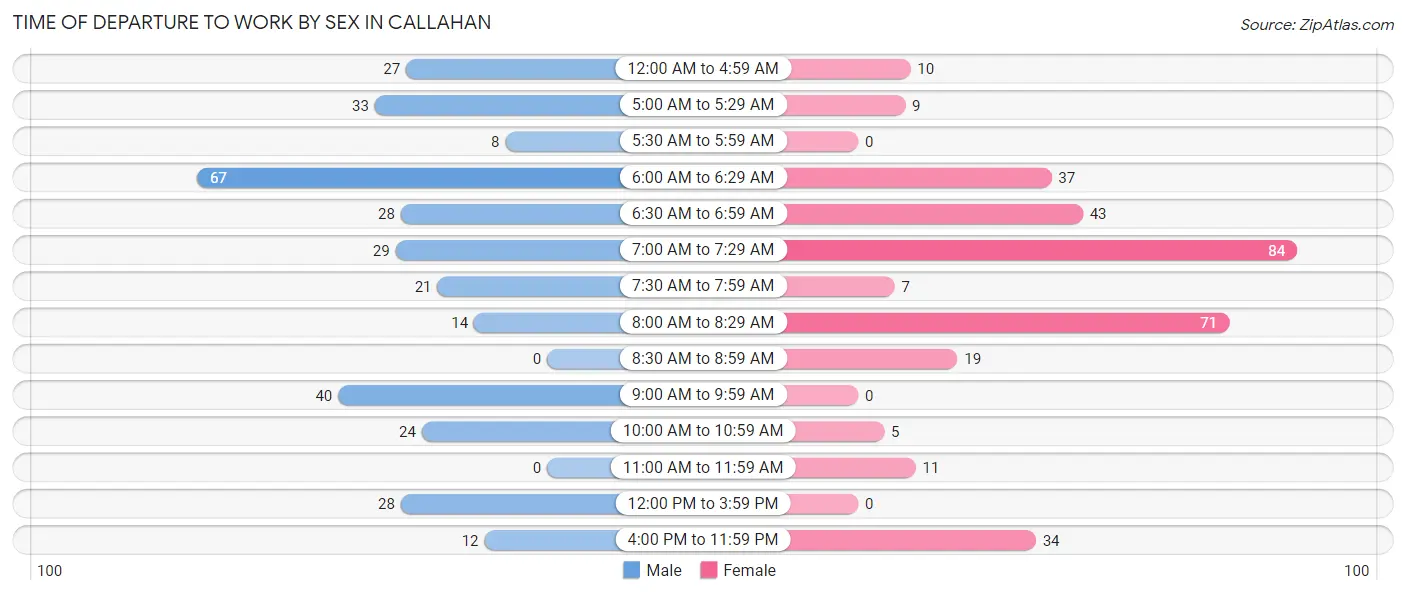
| Time of Departure | Male | Female |
| 12:00 AM to 4:59 AM | 27 (8.2%) | 10 (3.0%) |
| 5:00 AM to 5:29 AM | 33 (10.0%) | 9 (2.7%) |
| 5:30 AM to 5:59 AM | 8 (2.4%) | 0 (0.0%) |
| 6:00 AM to 6:29 AM | 67 (20.2%) | 37 (11.2%) |
| 6:30 AM to 6:59 AM | 28 (8.5%) | 43 (13.0%) |
| 7:00 AM to 7:29 AM | 29 (8.8%) | 84 (25.5%) |
| 7:30 AM to 7:59 AM | 21 (6.3%) | 7 (2.1%) |
| 8:00 AM to 8:29 AM | 14 (4.2%) | 71 (21.5%) |
| 8:30 AM to 8:59 AM | 0 (0.0%) | 19 (5.8%) |
| 9:00 AM to 9:59 AM | 40 (12.1%) | 0 (0.0%) |
| 10:00 AM to 10:59 AM | 24 (7.2%) | 5 (1.5%) |
| 11:00 AM to 11:59 AM | 0 (0.0%) | 11 (3.3%) |
| 12:00 PM to 3:59 PM | 28 (8.5%) | 0 (0.0%) |
| 4:00 PM to 11:59 PM | 12 (3.6%) | 34 (10.3%) |
| Total | 331 (100.0%) | 330 (100.0%) |
Housing Occupancy in Callahan
Occupancy by Ownership in Callahan
Of the total 611 dwellings in Callahan, owner-occupied units account for 381 (62.4%), while renter-occupied units make up 230 (37.6%).
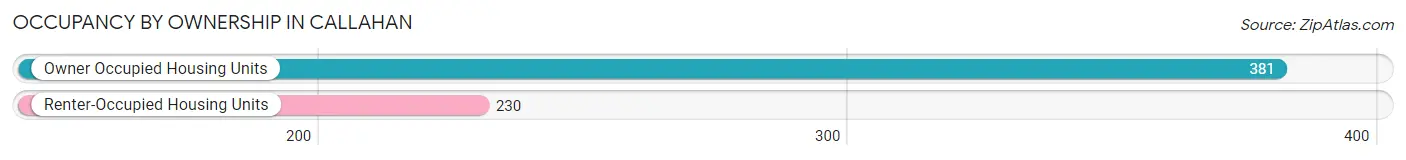
| Occupancy | # Housing Units | % Housing Units |
| Owner Occupied Housing Units | 381 | 62.4% |
| Renter-Occupied Housing Units | 230 | 37.6% |
| Total Occupied Housing Units | 611 | 100.0% |
Occupancy by Household Size in Callahan
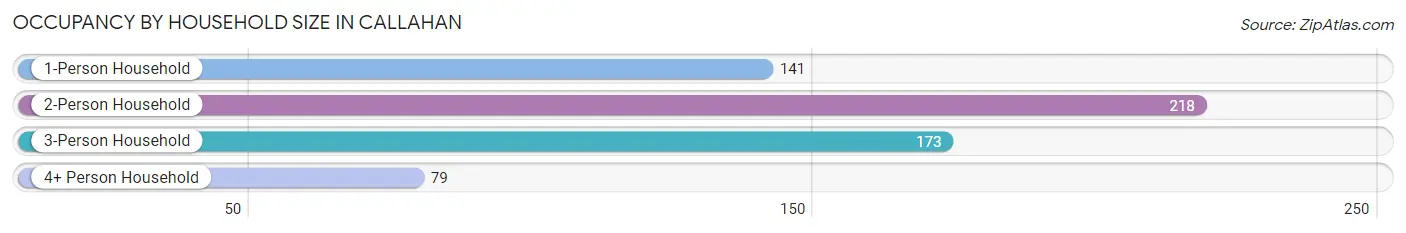
| Household Size | # Housing Units | % Housing Units |
| 1-Person Household | 141 | 23.1% |
| 2-Person Household | 218 | 35.7% |
| 3-Person Household | 173 | 28.3% |
| 4+ Person Household | 79 | 12.9% |
| Total Housing Units | 611 | 100.0% |
Occupancy by Ownership by Household Size in Callahan
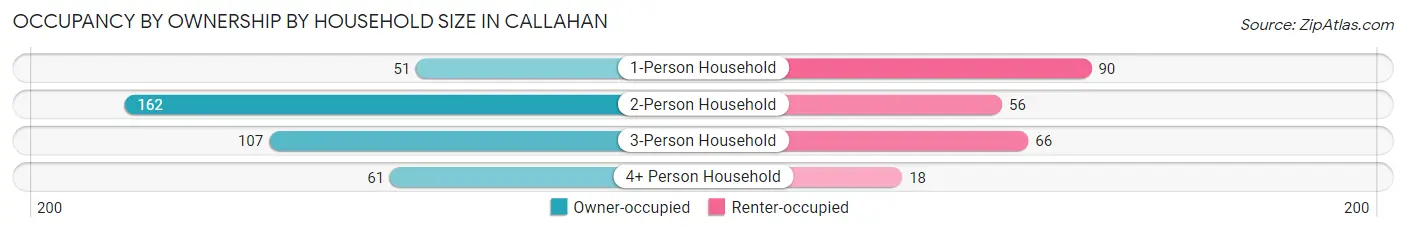
| Household Size | Owner-occupied | Renter-occupied |
| 1-Person Household | 51 (36.2%) | 90 (63.8%) |
| 2-Person Household | 162 (74.3%) | 56 (25.7%) |
| 3-Person Household | 107 (61.9%) | 66 (38.2%) |
| 4+ Person Household | 61 (77.2%) | 18 (22.8%) |
| Total Housing Units | 381 (62.4%) | 230 (37.6%) |
Occupancy by Educational Attainment in Callahan
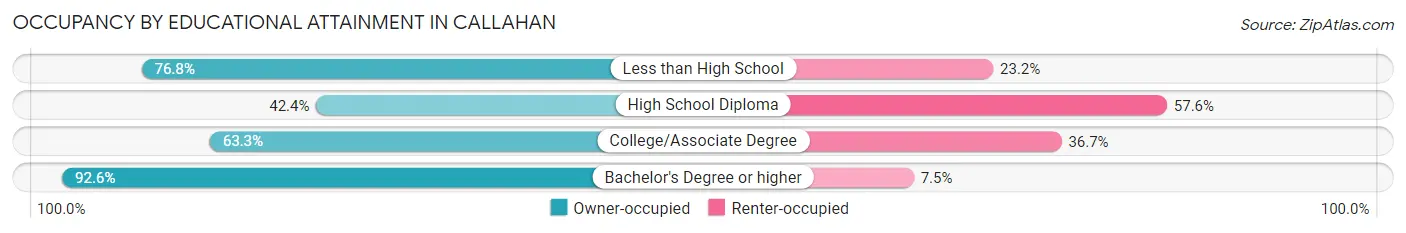
| Household Size | Owner-occupied | Renter-occupied |
| Less than High School | 53 (76.8%) | 16 (23.2%) |
| High School Diploma | 86 (42.4%) | 117 (57.6%) |
| College/Associate Degree | 155 (63.3%) | 90 (36.7%) |
| Bachelor's Degree or higher | 87 (92.5%) | 7 (7.4%) |
Occupancy by Age of Householder in Callahan
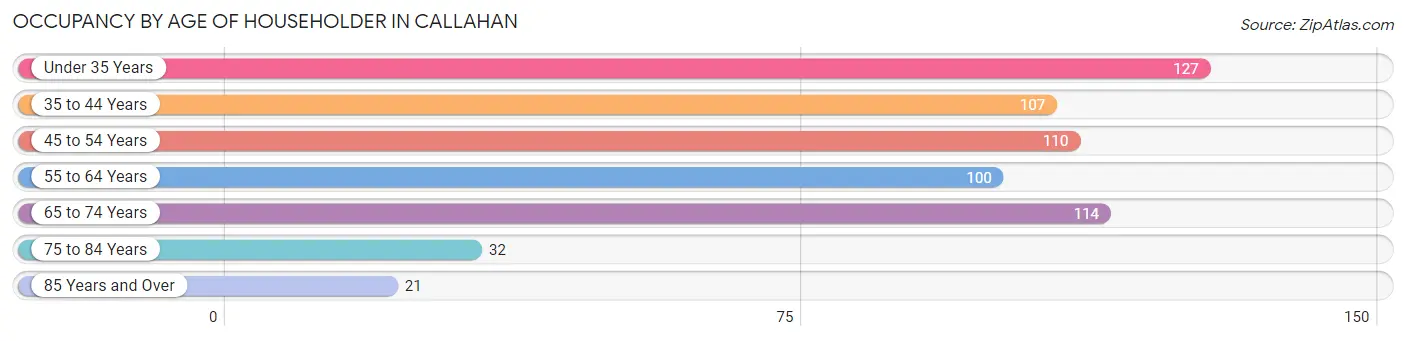
| Age Bracket | # Households | % Households |
| Under 35 Years | 127 | 20.8% |
| 35 to 44 Years | 107 | 17.5% |
| 45 to 54 Years | 110 | 18.0% |
| 55 to 64 Years | 100 | 16.4% |
| 65 to 74 Years | 114 | 18.7% |
| 75 to 84 Years | 32 | 5.2% |
| 85 Years and Over | 21 | 3.4% |
| Total | 611 | 100.0% |
Housing Finances in Callahan
Median Income by Occupancy in Callahan
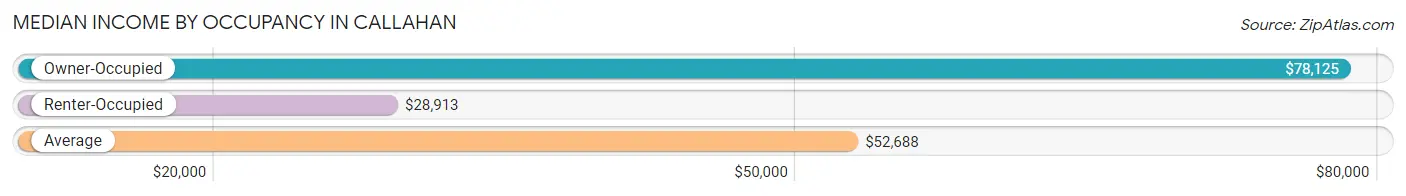
| Occupancy Type | # Households | Median Income |
| Owner-Occupied | 381 (62.4%) | $78,125 |
| Renter-Occupied | 230 (37.6%) | $28,913 |
| Average | 611 (100.0%) | $52,688 |
Occupancy by Householder Income Bracket in Callahan
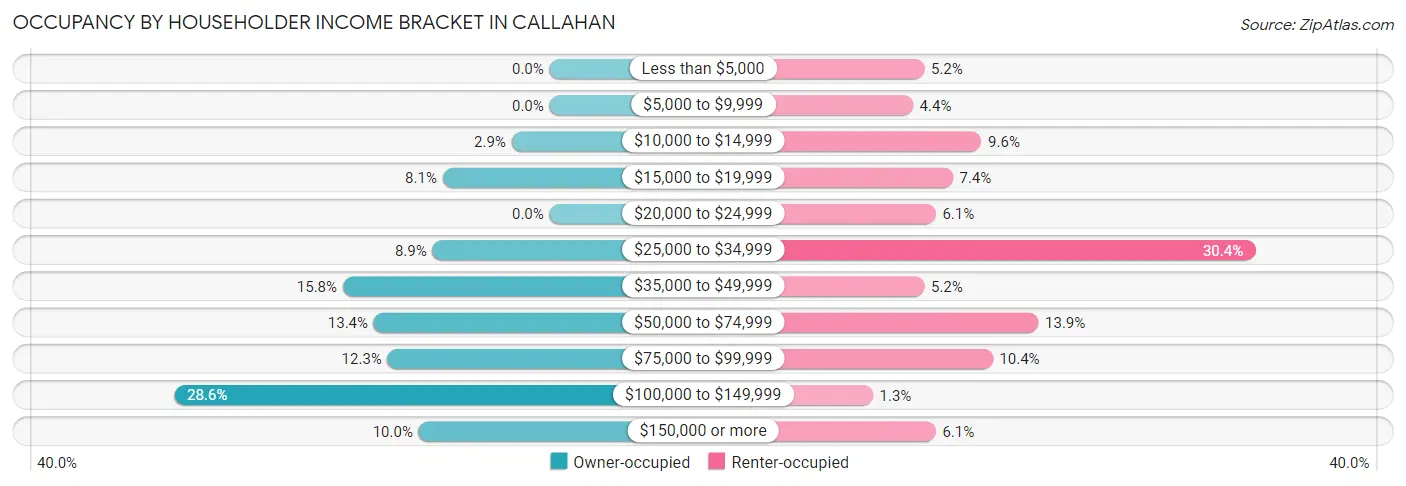
| Income Bracket | Owner-occupied | Renter-occupied |
| Less than $5,000 | 0 (0.0%) | 12 (5.2%) |
| $5,000 to $9,999 | 0 (0.0%) | 10 (4.3%) |
| $10,000 to $14,999 | 11 (2.9%) | 22 (9.6%) |
| $15,000 to $19,999 | 31 (8.1%) | 17 (7.4%) |
| $20,000 to $24,999 | 0 (0.0%) | 14 (6.1%) |
| $25,000 to $34,999 | 34 (8.9%) | 70 (30.4%) |
| $35,000 to $49,999 | 60 (15.8%) | 12 (5.2%) |
| $50,000 to $74,999 | 51 (13.4%) | 32 (13.9%) |
| $75,000 to $99,999 | 47 (12.3%) | 24 (10.4%) |
| $100,000 to $149,999 | 109 (28.6%) | 3 (1.3%) |
| $150,000 or more | 38 (10.0%) | 14 (6.1%) |
| Total | 381 (100.0%) | 230 (100.0%) |
Monthly Housing Cost Tiers in Callahan
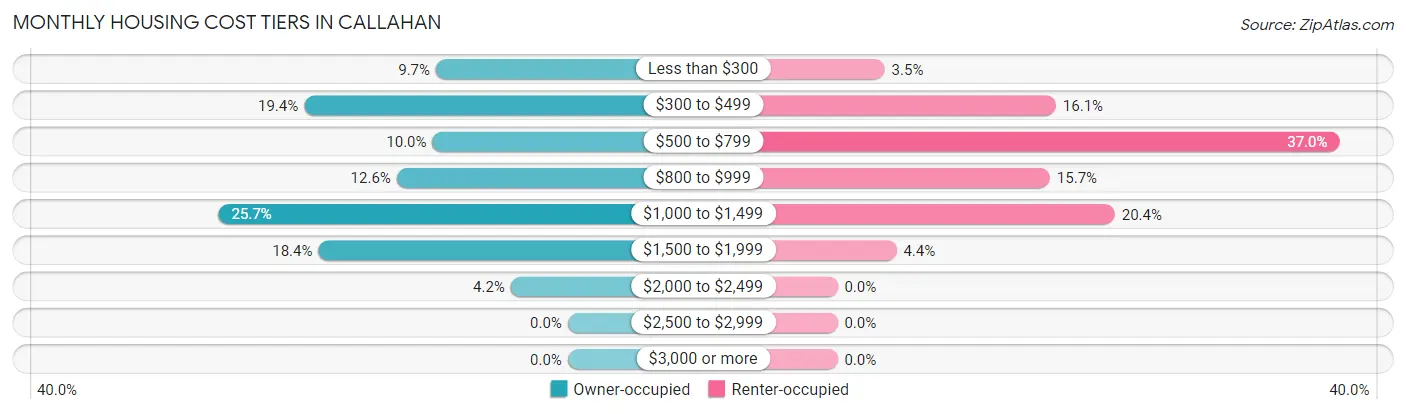
| Monthly Cost | Owner-occupied | Renter-occupied |
| Less than $300 | 37 (9.7%) | 8 (3.5%) |
| $300 to $499 | 74 (19.4%) | 37 (16.1%) |
| $500 to $799 | 38 (10.0%) | 85 (37.0%) |
| $800 to $999 | 48 (12.6%) | 36 (15.7%) |
| $1,000 to $1,499 | 98 (25.7%) | 47 (20.4%) |
| $1,500 to $1,999 | 70 (18.4%) | 10 (4.3%) |
| $2,000 to $2,499 | 16 (4.2%) | 0 (0.0%) |
| $2,500 to $2,999 | 0 (0.0%) | 0 (0.0%) |
| $3,000 or more | 0 (0.0%) | 0 (0.0%) |
| Total | 381 (100.0%) | 230 (100.0%) |
Physical Housing Characteristics in Callahan
Housing Structures in Callahan
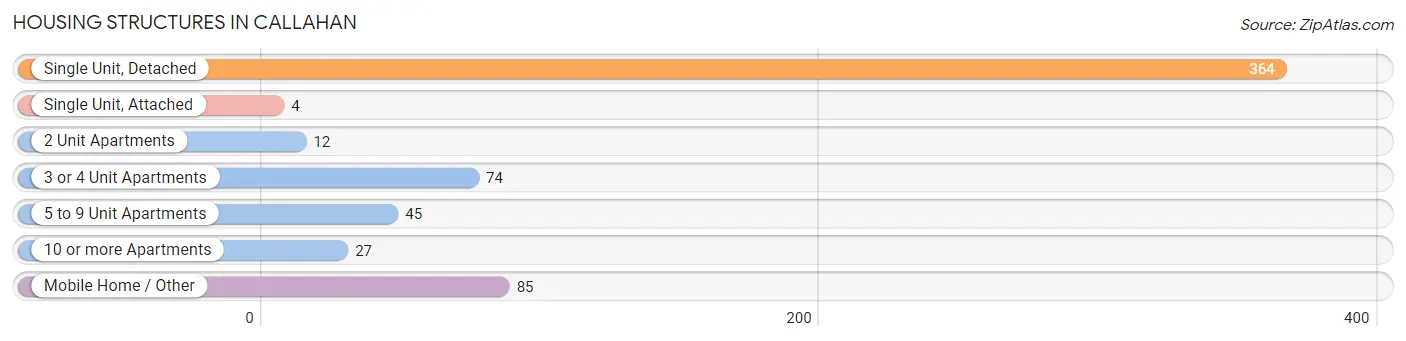
| Structure Type | # Housing Units | % Housing Units |
| Single Unit, Detached | 364 | 59.6% |
| Single Unit, Attached | 4 | 0.6% |
| 2 Unit Apartments | 12 | 2.0% |
| 3 or 4 Unit Apartments | 74 | 12.1% |
| 5 to 9 Unit Apartments | 45 | 7.4% |
| 10 or more Apartments | 27 | 4.4% |
| Mobile Home / Other | 85 | 13.9% |
| Total | 611 | 100.0% |
Housing Structures by Occupancy in Callahan
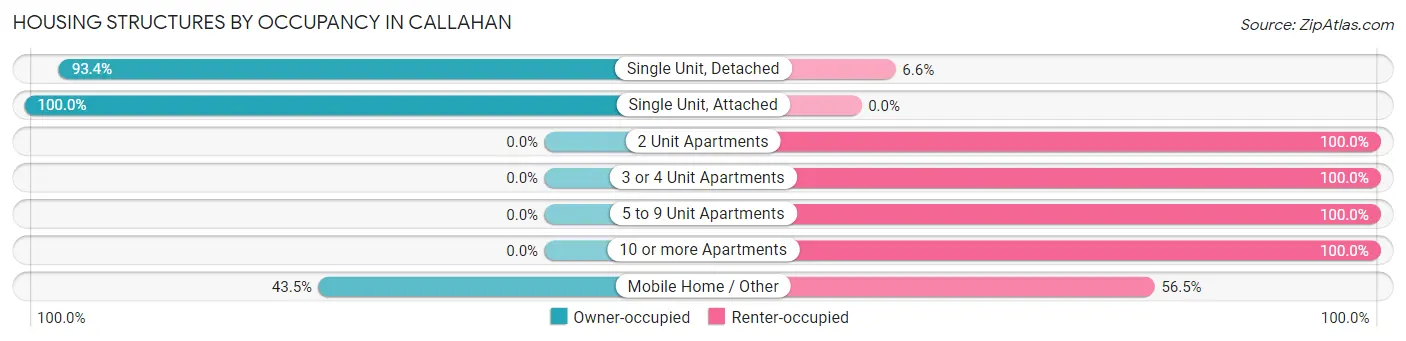
| Structure Type | Owner-occupied | Renter-occupied |
| Single Unit, Detached | 340 (93.4%) | 24 (6.6%) |
| Single Unit, Attached | 4 (100.0%) | 0 (0.0%) |
| 2 Unit Apartments | 0 (0.0%) | 12 (100.0%) |
| 3 or 4 Unit Apartments | 0 (0.0%) | 74 (100.0%) |
| 5 to 9 Unit Apartments | 0 (0.0%) | 45 (100.0%) |
| 10 or more Apartments | 0 (0.0%) | 27 (100.0%) |
| Mobile Home / Other | 37 (43.5%) | 48 (56.5%) |
| Total | 381 (62.4%) | 230 (37.6%) |
Housing Structures by Number of Rooms in Callahan
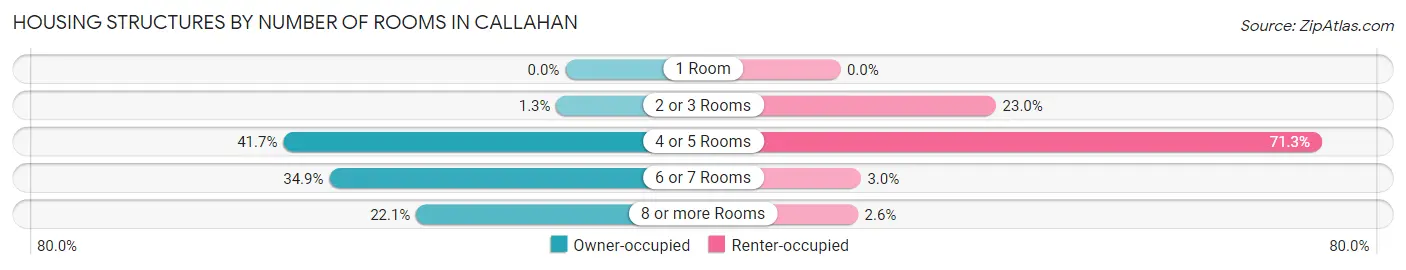
| Number of Rooms | Owner-occupied | Renter-occupied |
| 1 Room | 0 (0.0%) | 0 (0.0%) |
| 2 or 3 Rooms | 5 (1.3%) | 53 (23.0%) |
| 4 or 5 Rooms | 159 (41.7%) | 164 (71.3%) |
| 6 or 7 Rooms | 133 (34.9%) | 7 (3.0%) |
| 8 or more Rooms | 84 (22.1%) | 6 (2.6%) |
| Total | 381 (100.0%) | 230 (100.0%) |
Housing Structure by Heating Type in Callahan
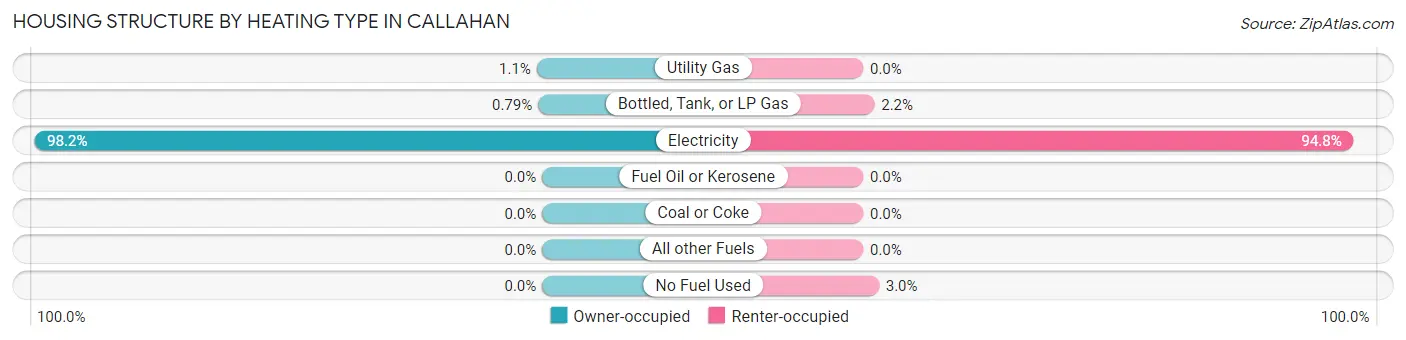
| Heating Type | Owner-occupied | Renter-occupied |
| Utility Gas | 4 (1.1%) | 0 (0.0%) |
| Bottled, Tank, or LP Gas | 3 (0.8%) | 5 (2.2%) |
| Electricity | 374 (98.2%) | 218 (94.8%) |
| Fuel Oil or Kerosene | 0 (0.0%) | 0 (0.0%) |
| Coal or Coke | 0 (0.0%) | 0 (0.0%) |
| All other Fuels | 0 (0.0%) | 0 (0.0%) |
| No Fuel Used | 0 (0.0%) | 7 (3.0%) |
| Total | 381 (100.0%) | 230 (100.0%) |
Household Vehicle Usage in Callahan
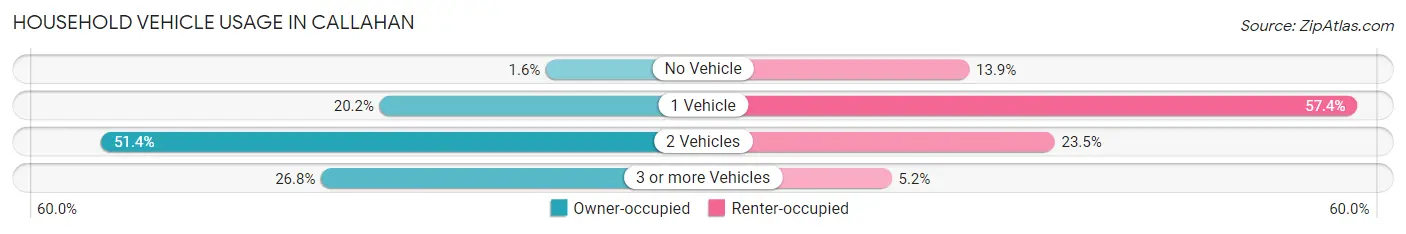
| Vehicles per Household | Owner-occupied | Renter-occupied |
| No Vehicle | 6 (1.6%) | 32 (13.9%) |
| 1 Vehicle | 77 (20.2%) | 132 (57.4%) |
| 2 Vehicles | 196 (51.4%) | 54 (23.5%) |
| 3 or more Vehicles | 102 (26.8%) | 12 (5.2%) |
| Total | 381 (100.0%) | 230 (100.0%) |
Real Estate & Mortgages in Callahan
Real Estate and Mortgage Overview in Callahan
| Characteristic | Without Mortgage | With Mortgage |
| Housing Units | 122 | 259 |
| Median Property Value | $225,900 | $204,000 |
| Median Household Income | $86,964 | $16 |
| Monthly Housing Costs | $451 | $0 |
| Real Estate Taxes | $1,423 | $4 |
Property Value by Mortgage Status in Callahan
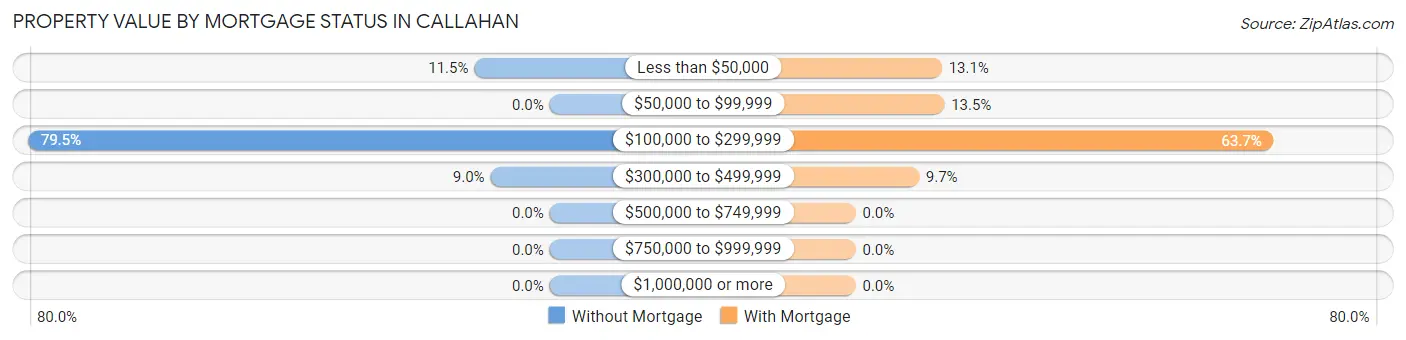
| Property Value | Without Mortgage | With Mortgage |
| Less than $50,000 | 14 (11.5%) | 34 (13.1%) |
| $50,000 to $99,999 | 0 (0.0%) | 35 (13.5%) |
| $100,000 to $299,999 | 97 (79.5%) | 165 (63.7%) |
| $300,000 to $499,999 | 11 (9.0%) | 25 (9.7%) |
| $500,000 to $749,999 | 0 (0.0%) | 0 (0.0%) |
| $750,000 to $999,999 | 0 (0.0%) | 0 (0.0%) |
| $1,000,000 or more | 0 (0.0%) | 0 (0.0%) |
| Total | 122 (100.0%) | 259 (100.0%) |
Household Income by Mortgage Status in Callahan
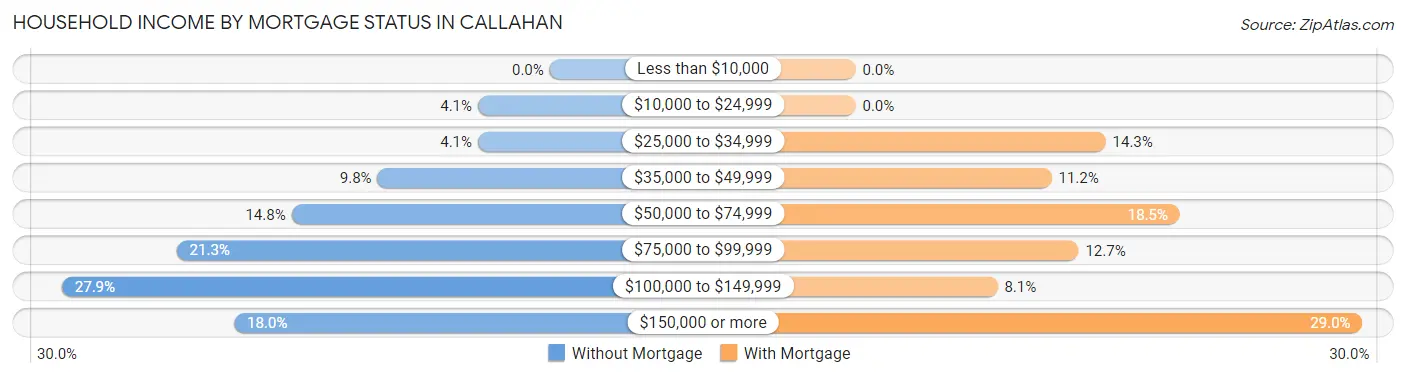
| Household Income | Without Mortgage | With Mortgage |
| Less than $10,000 | 0 (0.0%) | 0 (0.0%) |
| $10,000 to $24,999 | 5 (4.1%) | 0 (0.0%) |
| $25,000 to $34,999 | 5 (4.1%) | 37 (14.3%) |
| $35,000 to $49,999 | 12 (9.8%) | 29 (11.2%) |
| $50,000 to $74,999 | 18 (14.7%) | 48 (18.5%) |
| $75,000 to $99,999 | 26 (21.3%) | 33 (12.7%) |
| $100,000 to $149,999 | 34 (27.9%) | 21 (8.1%) |
| $150,000 or more | 22 (18.0%) | 75 (29.0%) |
| Total | 122 (100.0%) | 259 (100.0%) |
Property Value to Household Income Ratio in Callahan
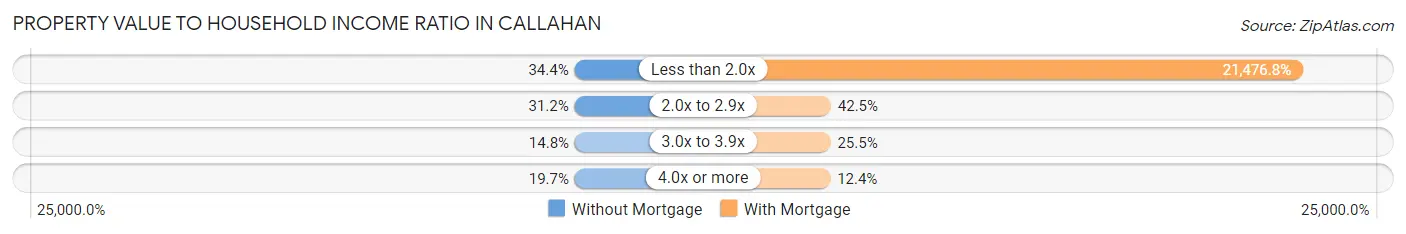
| Value-to-Income Ratio | Without Mortgage | With Mortgage |
| Less than 2.0x | 42 (34.4%) | 55,625 (21,476.8%) |
| 2.0x to 2.9x | 38 (31.1%) | 110 (42.5%) |
| 3.0x to 3.9x | 18 (14.7%) | 66 (25.5%) |
| 4.0x or more | 24 (19.7%) | 32 (12.4%) |
| Total | 122 (100.0%) | 259 (100.0%) |
Real Estate Taxes by Mortgage Status in Callahan
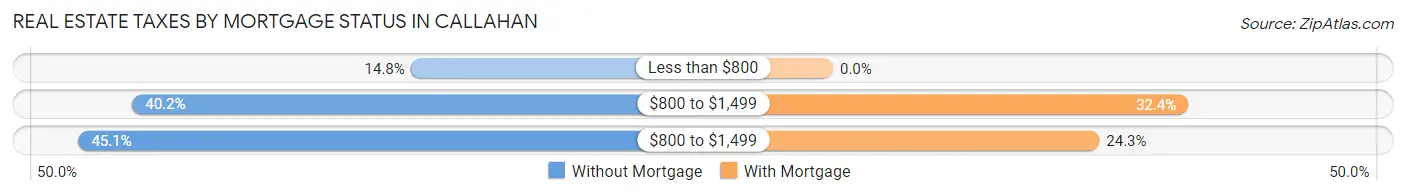
| Property Taxes | Without Mortgage | With Mortgage |
| Less than $800 | 18 (14.7%) | 0 (0.0%) |
| $800 to $1,499 | 49 (40.2%) | 84 (32.4%) |
| $800 to $1,499 | 55 (45.1%) | 63 (24.3%) |
| Total | 122 (100.0%) | 259 (100.0%) |
Health & Disability in Callahan
Health Insurance Coverage by Age in Callahan
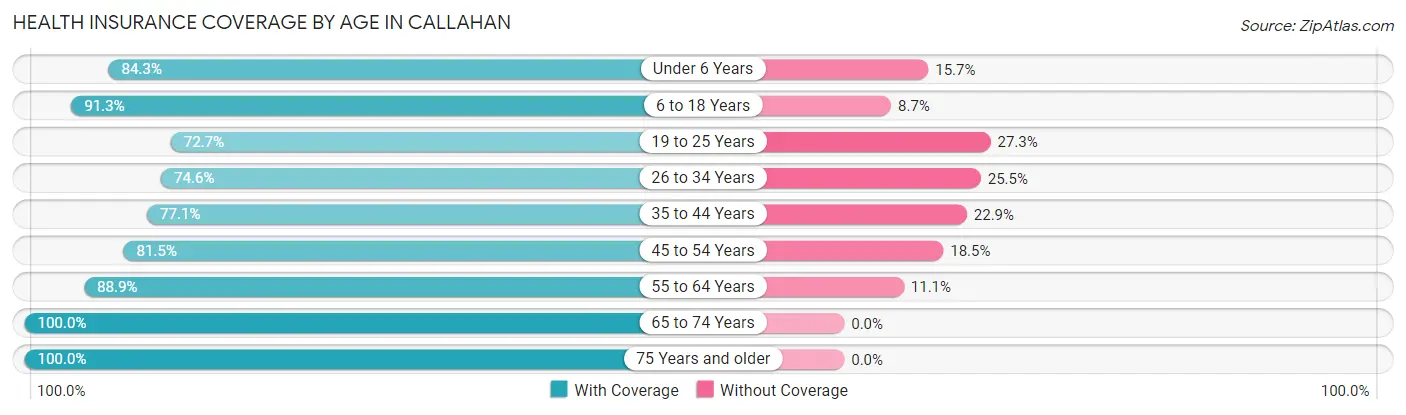
| Age Bracket | With Coverage | Without Coverage |
| Under 6 Years | 70 (84.3%) | 13 (15.7%) |
| 6 to 18 Years | 199 (91.3%) | 19 (8.7%) |
| 19 to 25 Years | 112 (72.7%) | 42 (27.3%) |
| 26 to 34 Years | 167 (74.6%) | 57 (25.5%) |
| 35 to 44 Years | 135 (77.1%) | 40 (22.9%) |
| 45 to 54 Years | 159 (81.5%) | 36 (18.5%) |
| 55 to 64 Years | 120 (88.9%) | 15 (11.1%) |
| 65 to 74 Years | 186 (100.0%) | 0 (0.0%) |
| 75 Years and older | 91 (100.0%) | 0 (0.0%) |
| Total | 1,239 (84.8%) | 222 (15.2%) |
Health Insurance Coverage by Citizenship Status in Callahan
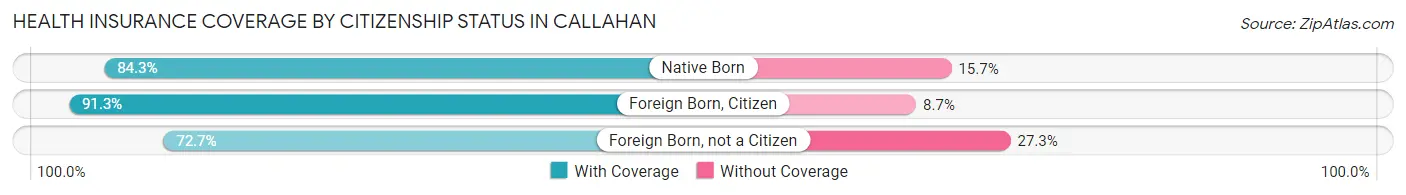
| Citizenship Status | With Coverage | Without Coverage |
| Native Born | 70 (84.3%) | 13 (15.7%) |
| Foreign Born, Citizen | 199 (91.3%) | 19 (8.7%) |
| Foreign Born, not a Citizen | 112 (72.7%) | 42 (27.3%) |
Health Insurance Coverage by Household Income in Callahan
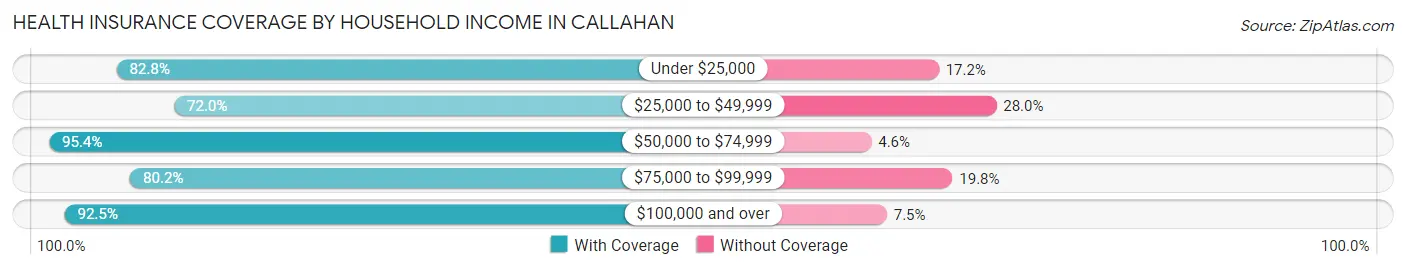
| Household Income | With Coverage | Without Coverage |
| Under $25,000 | 149 (82.8%) | 31 (17.2%) |
| $25,000 to $49,999 | 275 (72.0%) | 107 (28.0%) |
| $50,000 to $74,999 | 187 (95.4%) | 9 (4.6%) |
| $75,000 to $99,999 | 146 (80.2%) | 36 (19.8%) |
| $100,000 and over | 482 (92.5%) | 39 (7.5%) |
Public vs Private Health Insurance Coverage by Age in Callahan
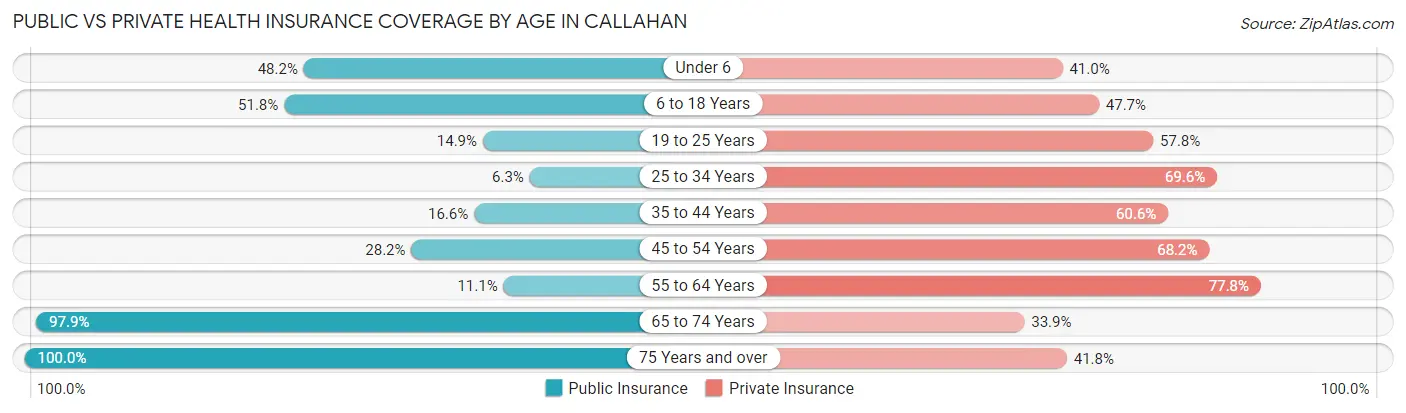
| Age Bracket | Public Insurance | Private Insurance |
| Under 6 | 40 (48.2%) | 34 (41.0%) |
| 6 to 18 Years | 113 (51.8%) | 104 (47.7%) |
| 19 to 25 Years | 23 (14.9%) | 89 (57.8%) |
| 25 to 34 Years | 14 (6.2%) | 156 (69.6%) |
| 35 to 44 Years | 29 (16.6%) | 106 (60.6%) |
| 45 to 54 Years | 55 (28.2%) | 133 (68.2%) |
| 55 to 64 Years | 15 (11.1%) | 105 (77.8%) |
| 65 to 74 Years | 182 (97.9%) | 63 (33.9%) |
| 75 Years and over | 91 (100.0%) | 38 (41.8%) |
| Total | 562 (38.5%) | 828 (56.7%) |
Disability Status by Sex by Age in Callahan
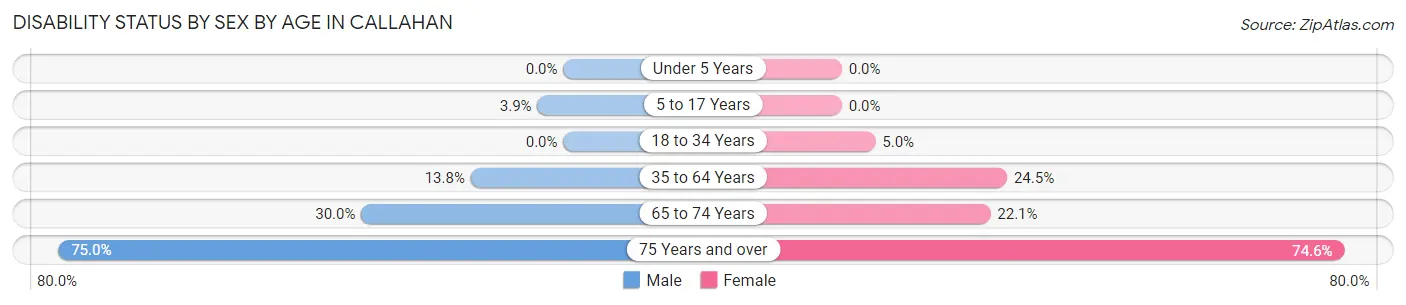
| Age Bracket | Male | Female |
| Under 5 Years | 0 (0.0%) | 0 (0.0%) |
| 5 to 17 Years | 5 (3.8%) | 0 (0.0%) |
| 18 to 34 Years | 0 (0.0%) | 11 (5.0%) |
| 35 to 64 Years | 33 (13.8%) | 65 (24.5%) |
| 65 to 74 Years | 15 (30.0%) | 30 (22.1%) |
| 75 Years and over | 18 (75.0%) | 50 (74.6%) |
Disability Class by Sex by Age in Callahan
Disability Class: Hearing Difficulty
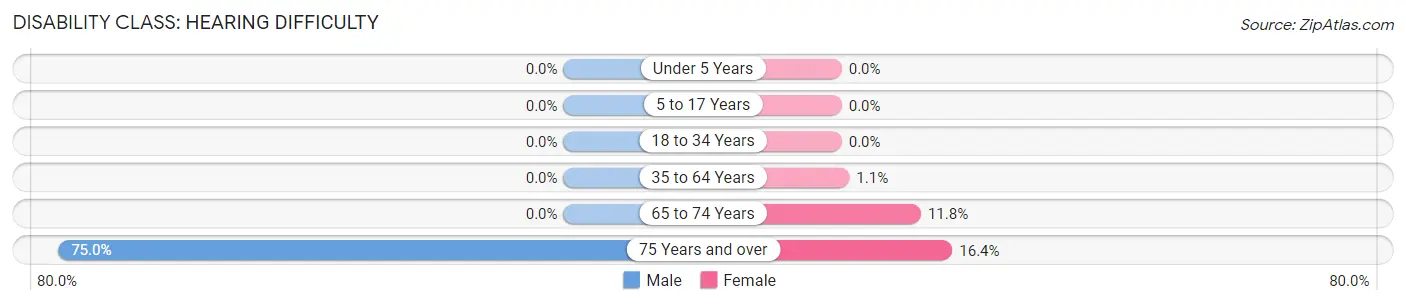
| Age Bracket | Male | Female |
| Under 5 Years | 0 (0.0%) | 0 (0.0%) |
| 5 to 17 Years | 0 (0.0%) | 0 (0.0%) |
| 18 to 34 Years | 0 (0.0%) | 0 (0.0%) |
| 35 to 64 Years | 0 (0.0%) | 3 (1.1%) |
| 65 to 74 Years | 0 (0.0%) | 16 (11.8%) |
| 75 Years and over | 18 (75.0%) | 11 (16.4%) |
Disability Class: Vision Difficulty
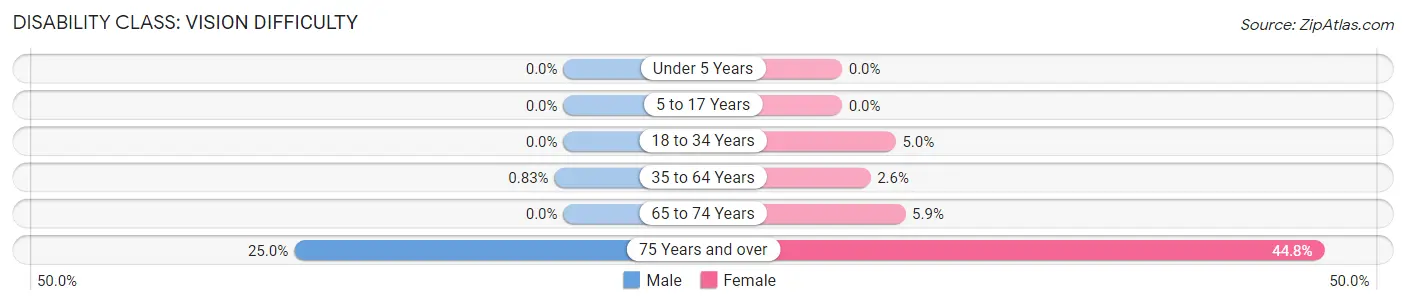
| Age Bracket | Male | Female |
| Under 5 Years | 0 (0.0%) | 0 (0.0%) |
| 5 to 17 Years | 0 (0.0%) | 0 (0.0%) |
| 18 to 34 Years | 0 (0.0%) | 11 (5.0%) |
| 35 to 64 Years | 2 (0.8%) | 7 (2.6%) |
| 65 to 74 Years | 0 (0.0%) | 8 (5.9%) |
| 75 Years and over | 6 (25.0%) | 30 (44.8%) |
Disability Class: Cognitive Difficulty
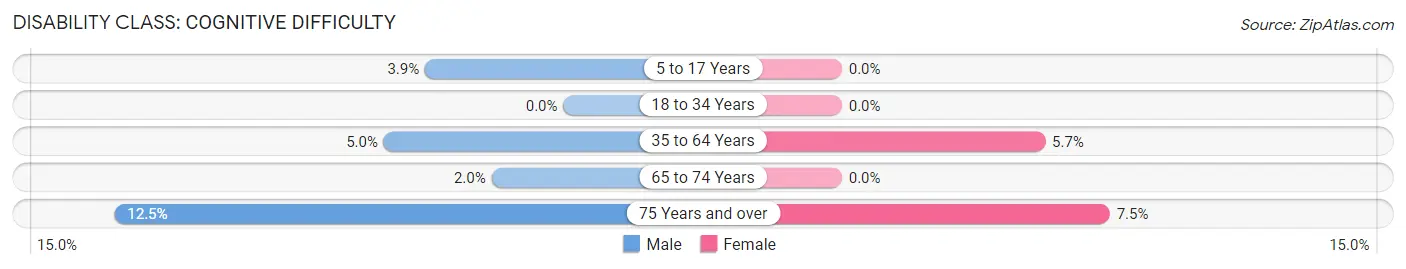
| Age Bracket | Male | Female |
| 5 to 17 Years | 5 (3.8%) | 0 (0.0%) |
| 18 to 34 Years | 0 (0.0%) | 0 (0.0%) |
| 35 to 64 Years | 12 (5.0%) | 15 (5.7%) |
| 65 to 74 Years | 1 (2.0%) | 0 (0.0%) |
| 75 Years and over | 3 (12.5%) | 5 (7.5%) |
Disability Class: Ambulatory Difficulty
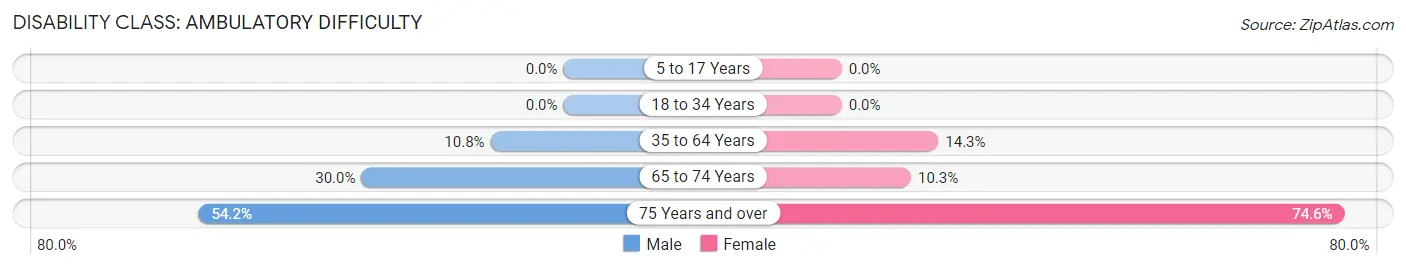
| Age Bracket | Male | Female |
| 5 to 17 Years | 0 (0.0%) | 0 (0.0%) |
| 18 to 34 Years | 0 (0.0%) | 0 (0.0%) |
| 35 to 64 Years | 26 (10.8%) | 38 (14.3%) |
| 65 to 74 Years | 15 (30.0%) | 14 (10.3%) |
| 75 Years and over | 13 (54.2%) | 50 (74.6%) |
Disability Class: Self-Care Difficulty
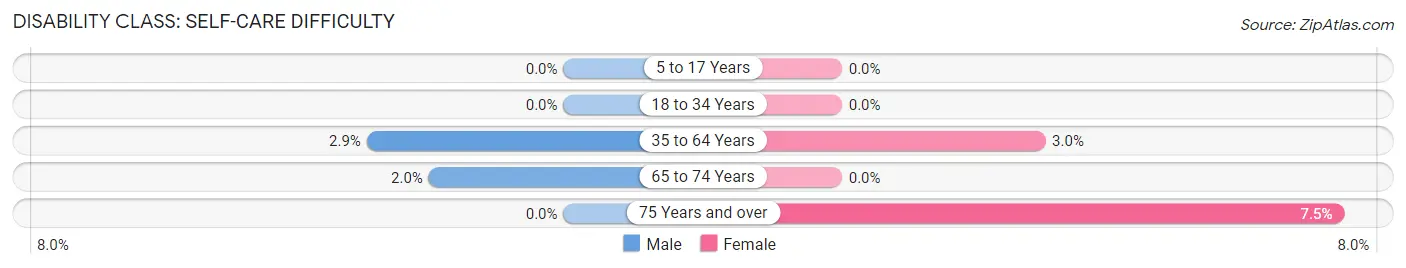
| Age Bracket | Male | Female |
| 5 to 17 Years | 0 (0.0%) | 0 (0.0%) |
| 18 to 34 Years | 0 (0.0%) | 0 (0.0%) |
| 35 to 64 Years | 7 (2.9%) | 8 (3.0%) |
| 65 to 74 Years | 1 (2.0%) | 0 (0.0%) |
| 75 Years and over | 0 (0.0%) | 5 (7.5%) |
Technology Access in Callahan
Computing Device Access in Callahan
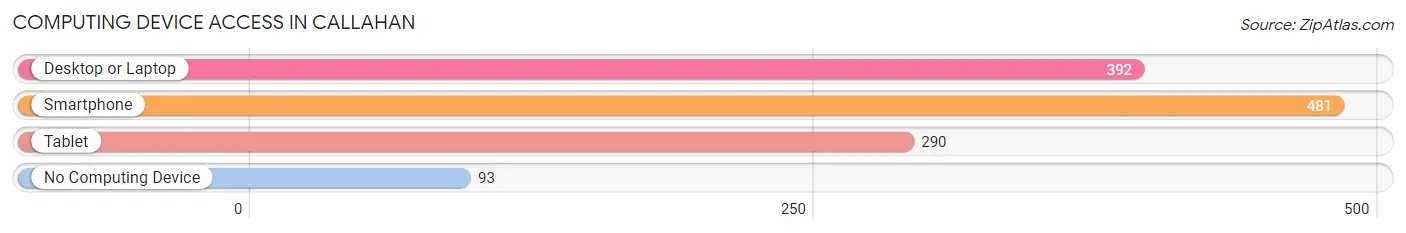
| Device Type | # Households | % Households |
| Desktop or Laptop | 392 | 64.2% |
| Smartphone | 481 | 78.7% |
| Tablet | 290 | 47.5% |
| No Computing Device | 93 | 15.2% |
| Total | 611 | 100.0% |
Internet Access in Callahan
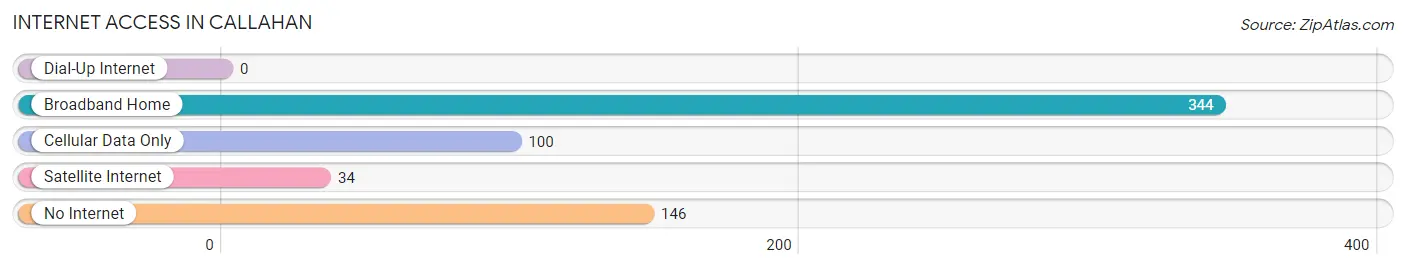
| Internet Type | # Households | % Households |
| Dial-Up Internet | 0 | 0.0% |
| Broadband Home | 344 | 56.3% |
| Cellular Data Only | 100 | 16.4% |
| Satellite Internet | 34 | 5.6% |
| No Internet | 146 | 23.9% |
| Total | 611 | 100.0% |
Callahan Summary
Callahan is a small town located in the northeastern part of Florida, in Nassau County. It is situated on the banks of the St. Marys River, which forms the border between Florida and Georgia. The town was founded in 1854 and was named after a local settler, William Callahan. The population of Callahan was 1,817 in the 2010 census.
History
The area that is now Callahan was originally inhabited by the Timucuan Indians. The first European settlers arrived in the area in the early 1800s. The town was founded in 1854 by William Callahan, a local settler. The town was originally known as Callahan's Station, and was a stop on the Florida, Atlantic and Gulf Central Railroad. The town was officially incorporated in 1887.
In the early 1900s, the town was a major center for the timber industry. The timber industry was the main source of employment for the town's residents. The town also had a thriving agricultural industry, with many farms producing cotton, corn, and other crops.
In the 1950s, the town began to experience a decline in its economy. The timber industry had declined, and the agricultural industry was in decline as well. The town's population began to decline as well, as many of the town's residents moved away in search of better economic opportunities.
Geography
Callahan is located in northeastern Florida, in Nassau County. It is situated on the banks of the St. Marys River, which forms the border between Florida and Georgia. The town is located about 25 miles north of Jacksonville, and about 40 miles south of the Georgia border.
The town has a total area of 2.2 square miles, all of which is land. The town is located in a flat, low-lying area, with an elevation of just 20 feet above sea level. The town is located in a humid subtropical climate zone, with hot, humid summers and mild winters.
Economy
The economy of Callahan is largely based on agriculture and timber. The town is home to several farms, which produce cotton, corn, and other crops. The timber industry is also an important part of the local economy, with several sawmills located in the area.
The town is also home to several small businesses, including restaurants, retail stores, and other services. The town is also home to a few manufacturing companies, which produce a variety of products.
Demographics
As of the 2010 census, the population of Callahan was 1,817. The population is predominantly white, with a small African American population. The median household income in the town is $41,944, and the median age is 41.
The town is served by the Nassau County School District, which operates several elementary, middle, and high schools in the area. The town is also home to a branch of the University of North Florida.
Conclusion
Callahan is a small town located in northeastern Florida, in Nassau County. It was founded in 1854 and was named after a local settler, William Callahan. The town has a population of 1,817, and is largely based on agriculture and timber. The town is served by the Nassau County School District, and is home to a branch of the University of North Florida.
Common Questions
What is Per Capita Income in Callahan?
Per Capita income in Callahan is $28,637.
What is the Median Family Income in Callahan?
Median Family Income in Callahan is $65,750.
What is the Median Household income in Callahan?
Median Household Income in Callahan is $52,688.
What is Income or Wage Gap in Callahan?
Income or Wage Gap in Callahan is 40.3%.
Women in Callahan earn 59.7 cents for every dollar earned by a man.
What is Inequality or Gini Index in Callahan?
Inequality or Gini Index in Callahan is 0.42.
What is the Total Population of Callahan?
Total Population of Callahan is 1,469.
What is the Total Male Population of Callahan?
Total Male Population of Callahan is 651.
What is the Total Female Population of Callahan?
Total Female Population of Callahan is 818.
What is the Ratio of Males per 100 Females in Callahan?
There are 79.58 Males per 100 Females in Callahan.
What is the Ratio of Females per 100 Males in Callahan?
There are 125.65 Females per 100 Males in Callahan.
What is the Median Population Age in Callahan?
Median Population Age in Callahan is 37.4 Years.
What is the Average Family Size in Callahan
Average Family Size in Callahan is 2.8 People.
What is the Average Household Size in Callahan
Average Household Size in Callahan is 2.4 People.
How Large is the Labor Force in Callahan?
There are 715 People in the Labor Forcein in Callahan.
What is the Percentage of People in the Labor Force in Callahan?
59.0% of People are in the Labor Force in Callahan.
What is the Unemployment Rate in Callahan?
Unemployment Rate in Callahan is 3.0%.