West Lealman, FL Map & Demographics
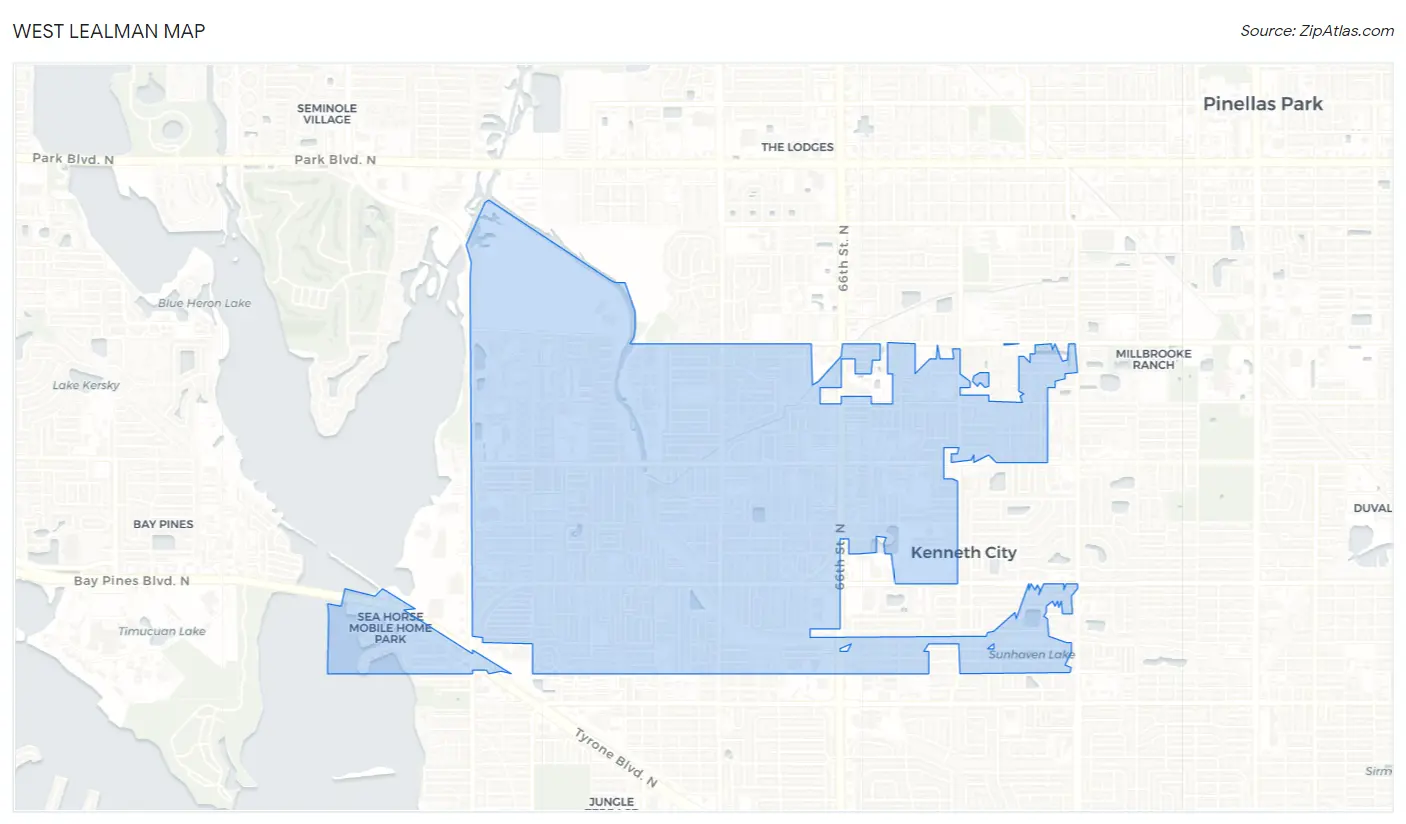
West Lealman Map
West Lealman Overview
$31,121
PER CAPITA INCOME
$65,298
AVG FAMILY INCOME
$44,373
AVG HOUSEHOLD INCOME
17.5%
WAGE / INCOME GAP [ % ]
82.5¢/ $1
WAGE / INCOME GAP [ $ ]
$10,909
FAMILY INCOME DEFICIT
0.46
INEQUALITY / GINI INDEX
14,277
TOTAL POPULATION
6,892
MALE POPULATION
7,385
FEMALE POPULATION
93.32
MALES / 100 FEMALES
107.15
FEMALES / 100 MALES
56.0
MEDIAN AGE
2.9
AVG FAMILY SIZE
2.0
AVG HOUSEHOLD SIZE
6,445
LABOR FORCE [ PEOPLE ]
51.2%
PERCENT IN LABOR FORCE
5.4%
UNEMPLOYMENT RATE
Income in West Lealman
Income Overview in West Lealman
Per Capita Income in West Lealman is $31,121, while median incomes of families and households are $65,298 and $44,373 respectively.
| Characteristic | Number | Measure |
| Per Capita Income | 14,277 | $31,121 |
| Median Family Income | 3,237 | $65,298 |
| Mean Family Income | 3,237 | $73,139 |
| Median Household Income | 6,970 | $44,373 |
| Mean Household Income | 6,970 | $60,557 |
| Income Deficit | 3,237 | $10,909 |
| Wage / Income Gap (%) | 14,277 | 17.48% |
| Wage / Income Gap ($) | 14,277 | 82.52¢ per $1 |
| Gini / Inequality Index | 14,277 | 0.46 |
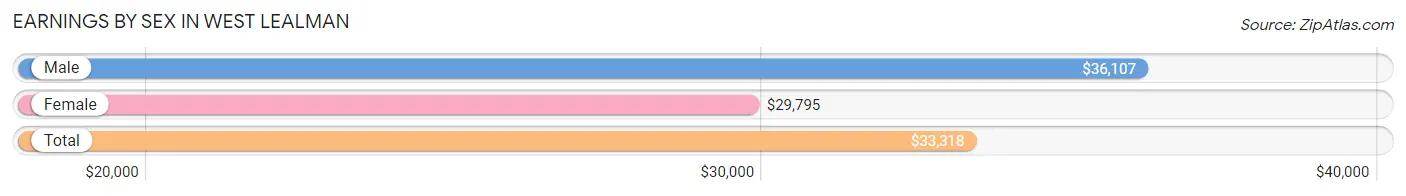
Earnings by Sex in West Lealman
Average Earnings in West Lealman are $33,318, $36,107 for men and $29,795 for women, a difference of 17.5%.
| Sex | Number | Average Earnings |
| Male | 3,541 (51.6%) | $36,107 |
| Female | 3,317 (48.4%) | $29,795 |
| Total | 6,858 (100.0%) | $33,318 |
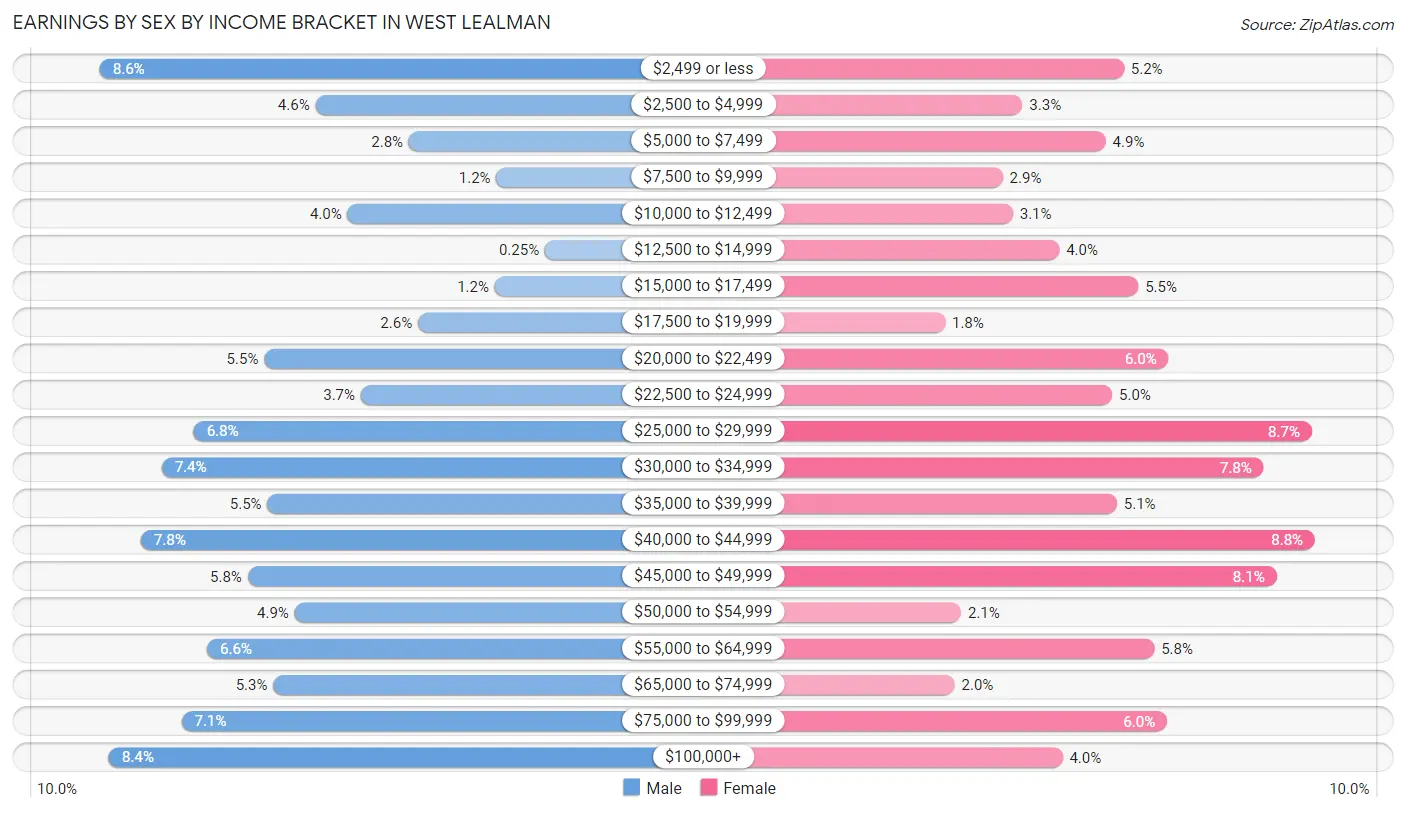
Earnings by Sex by Income Bracket in West Lealman
The most common earnings brackets in West Lealman are $2,499 or less for men (304 | 8.6%) and $40,000 to $44,999 for women (291 | 8.8%).
| Income | Male | Female |
| $2,499 or less | 304 (8.6%) | 172 (5.2%) |
| $2,500 to $4,999 | 161 (4.5%) | 109 (3.3%) |
| $5,000 to $7,499 | 99 (2.8%) | 161 (4.9%) |
| $7,500 to $9,999 | 41 (1.2%) | 97 (2.9%) |
| $10,000 to $12,499 | 140 (4.0%) | 103 (3.1%) |
| $12,500 to $14,999 | 9 (0.3%) | 132 (4.0%) |
| $15,000 to $17,499 | 42 (1.2%) | 181 (5.5%) |
| $17,500 to $19,999 | 93 (2.6%) | 61 (1.8%) |
| $20,000 to $22,499 | 195 (5.5%) | 200 (6.0%) |
| $22,500 to $24,999 | 131 (3.7%) | 165 (5.0%) |
| $25,000 to $29,999 | 242 (6.8%) | 289 (8.7%) |
| $30,000 to $34,999 | 263 (7.4%) | 259 (7.8%) |
| $35,000 to $39,999 | 193 (5.4%) | 168 (5.1%) |
| $40,000 to $44,999 | 277 (7.8%) | 291 (8.8%) |
| $45,000 to $49,999 | 206 (5.8%) | 267 (8.1%) |
| $50,000 to $54,999 | 175 (4.9%) | 71 (2.1%) |
| $55,000 to $64,999 | 233 (6.6%) | 191 (5.8%) |
| $65,000 to $74,999 | 189 (5.3%) | 67 (2.0%) |
| $75,000 to $99,999 | 250 (7.1%) | 199 (6.0%) |
| $100,000+ | 298 (8.4%) | 134 (4.0%) |
| Total | 3,541 (100.0%) | 3,317 (100.0%) |
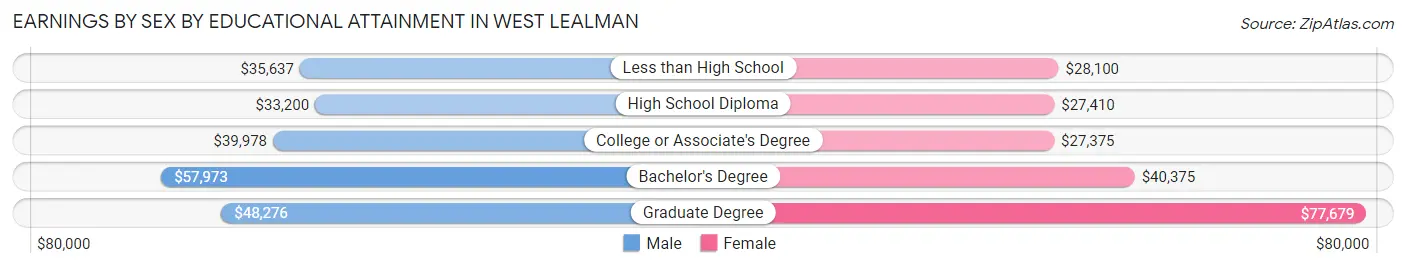
Earnings by Sex by Educational Attainment in West Lealman
Average earnings in West Lealman are $39,030 for men and $32,684 for women, a difference of 16.3%. Men with an educational attainment of bachelor's degree enjoy the highest average annual earnings of $57,973, while those with high school diploma education earn the least with $33,200. Women with an educational attainment of graduate degree earn the most with the average annual earnings of $77,679, while those with college or associate's degree education have the smallest earnings of $27,375.
| Educational Attainment | Male Income | Female Income |
| Less than High School | $35,637 | $28,100 |
| High School Diploma | $33,200 | $27,410 |
| College or Associate's Degree | $39,978 | $27,375 |
| Bachelor's Degree | $57,973 | $40,375 |
| Graduate Degree | $48,276 | $77,679 |
| Total | $39,030 | $32,684 |
Family Income in West Lealman
Family Income Brackets in West Lealman
According to the West Lealman family income data, there are 622 families falling into the $75,000 to $99,999 income range, which is the most common income bracket and makes up 19.2% of all families. Conversely, the $10,000 to $14,999 income bracket is the least frequent group with only 58 families (1.8%) belonging to this category.
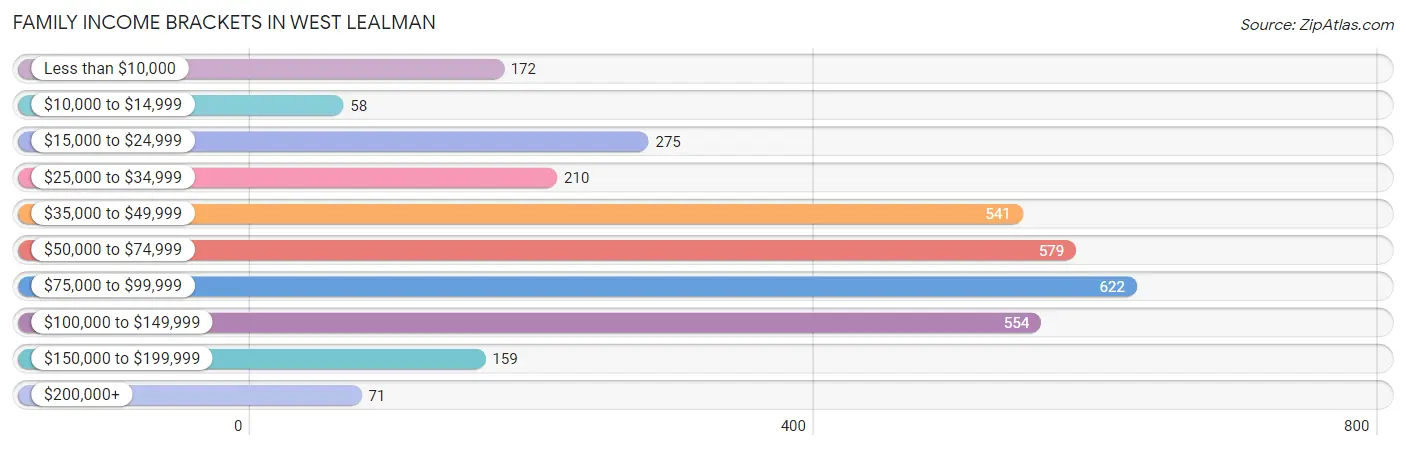
| Income Bracket | # Families | % Families |
| Less than $10,000 | 172 | 5.3% |
| $10,000 to $14,999 | 58 | 1.8% |
| $15,000 to $24,999 | 275 | 8.5% |
| $25,000 to $34,999 | 210 | 6.5% |
| $35,000 to $49,999 | 541 | 16.7% |
| $50,000 to $74,999 | 579 | 17.9% |
| $75,000 to $99,999 | 622 | 19.2% |
| $100,000 to $149,999 | 554 | 17.1% |
| $150,000 to $199,999 | 159 | 4.9% |
| $200,000+ | 71 | 2.2% |
Family Income by Famaliy Size in West Lealman
5-person families (132 | 4.1%) account for the highest median family income in West Lealman with $90,395 per family, while 3-person families (550 | 17.0%) have the highest median income of $27,984 per family member.
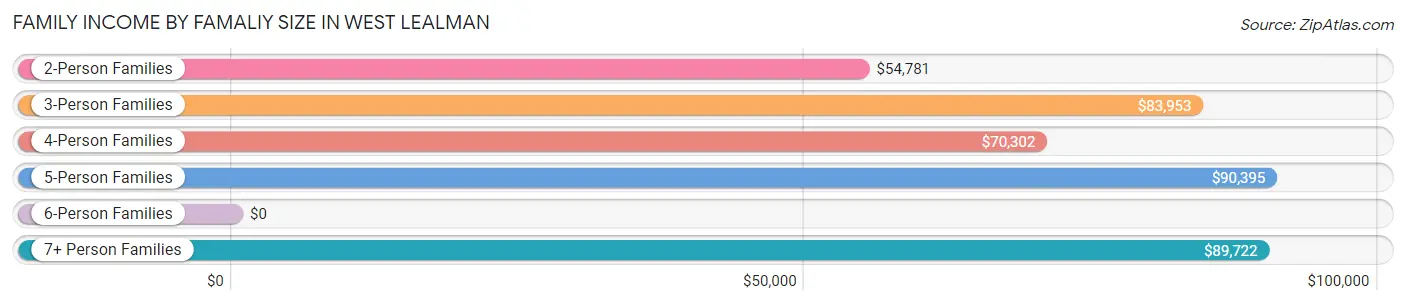
| Income Bracket | # Families | Median Income |
| 2-Person Families | 2,120 (65.5%) | $54,781 |
| 3-Person Families | 550 (17.0%) | $83,953 |
| 4-Person Families | 385 (11.9%) | $70,302 |
| 5-Person Families | 132 (4.1%) | $90,395 |
| 6-Person Families | 14 (0.4%) | $0 |
| 7+ Person Families | 36 (1.1%) | $89,722 |
| Total | 3,237 (100.0%) | $65,298 |
Family Income by Number of Earners in West Lealman
The median family income in West Lealman is $65,298, with families comprising 3+ earners (218) having the highest median family income of $110,735, while families with no earners (872) have the lowest median family income of $39,557, accounting for 6.7% and 26.9% of families, respectively.
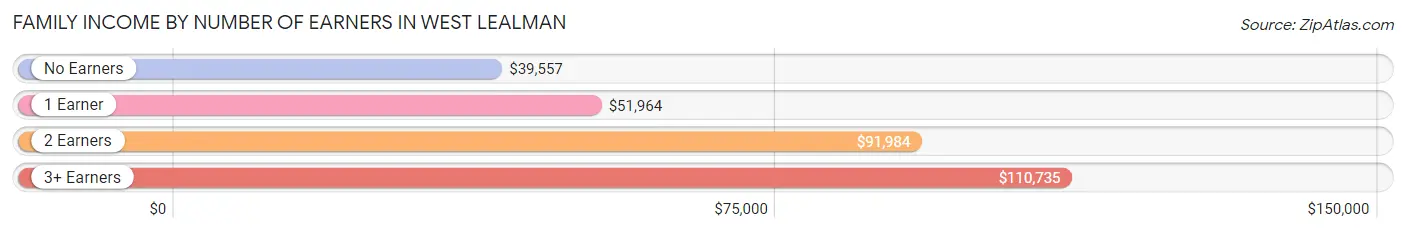
| Number of Earners | # Families | Median Income |
| No Earners | 872 (26.9%) | $39,557 |
| 1 Earner | 1,059 (32.7%) | $51,964 |
| 2 Earners | 1,088 (33.6%) | $91,984 |
| 3+ Earners | 218 (6.7%) | $110,735 |
| Total | 3,237 (100.0%) | $65,298 |
Household Income in West Lealman
Household Income Brackets in West Lealman
With 1,296 households falling in the category, the $35,000 to $49,999 income range is the most frequent in West Lealman, accounting for 18.6% of all households. In contrast, only 167 households (2.4%) fall into the $200,000+ income bracket, making it the least populous group.
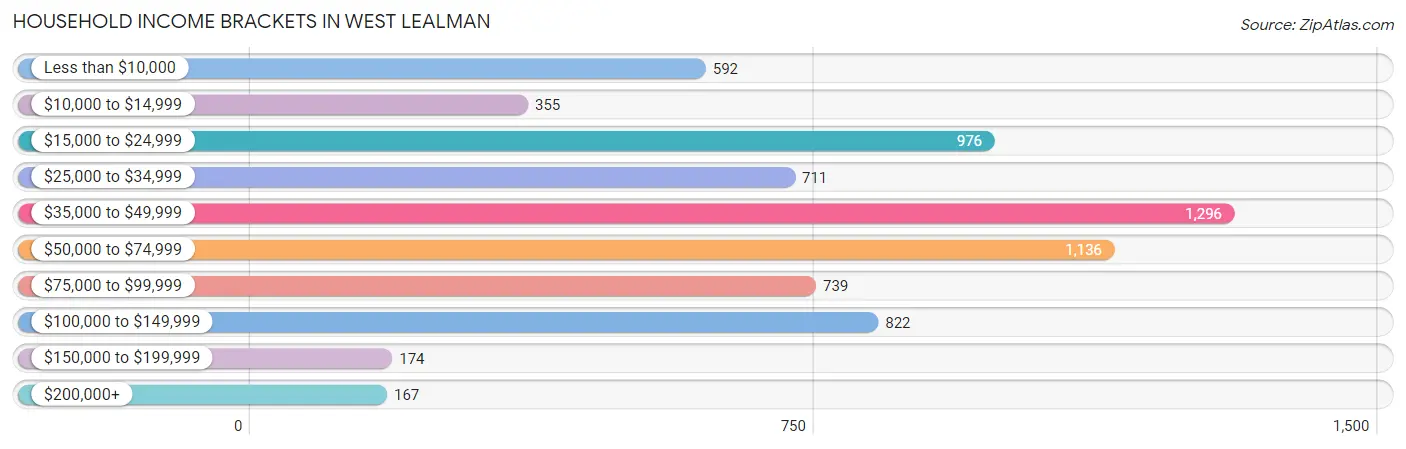
| Income Bracket | # Households | % Households |
| Less than $10,000 | 592 | 8.5% |
| $10,000 to $14,999 | 355 | 5.1% |
| $15,000 to $24,999 | 976 | 14.0% |
| $25,000 to $34,999 | 711 | 10.2% |
| $35,000 to $49,999 | 1,296 | 18.6% |
| $50,000 to $74,999 | 1,136 | 16.3% |
| $75,000 to $99,999 | 739 | 10.6% |
| $100,000 to $149,999 | 822 | 11.8% |
| $150,000 to $199,999 | 174 | 2.5% |
| $200,000+ | 167 | 2.4% |
Household Income by Householder Age in West Lealman
The median household income in West Lealman is $44,373, with the highest median household income of $67,714 found in the 25 to 44 years age bracket for the primary householder. A total of 1,118 households (16.0%) fall into this category. Meanwhile, the 65+ years age bracket for the primary householder has the lowest median household income of $35,606, with 3,241 households (46.5%) in this group.
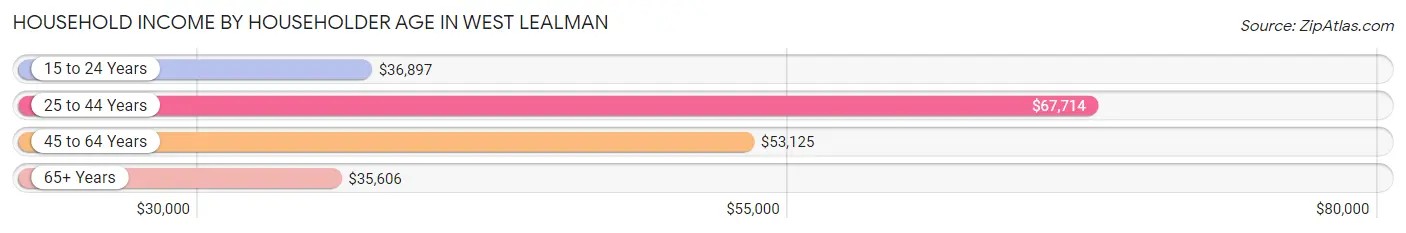
| Income Bracket | # Households | Median Income |
| 15 to 24 Years | 84 (1.2%) | $36,897 |
| 25 to 44 Years | 1,118 (16.0%) | $67,714 |
| 45 to 64 Years | 2,527 (36.3%) | $53,125 |
| 65+ Years | 3,241 (46.5%) | $35,606 |
| Total | 6,970 (100.0%) | $44,373 |
Poverty in West Lealman
Income Below Poverty by Sex and Age in West Lealman
With 14.2% poverty level for males and 17.8% for females among the residents of West Lealman, 6 to 11 year old males and under 5 year old females are the most vulnerable to poverty, with 108 males (31.6%) and 61 females (36.5%) in their respective age groups living below the poverty level.
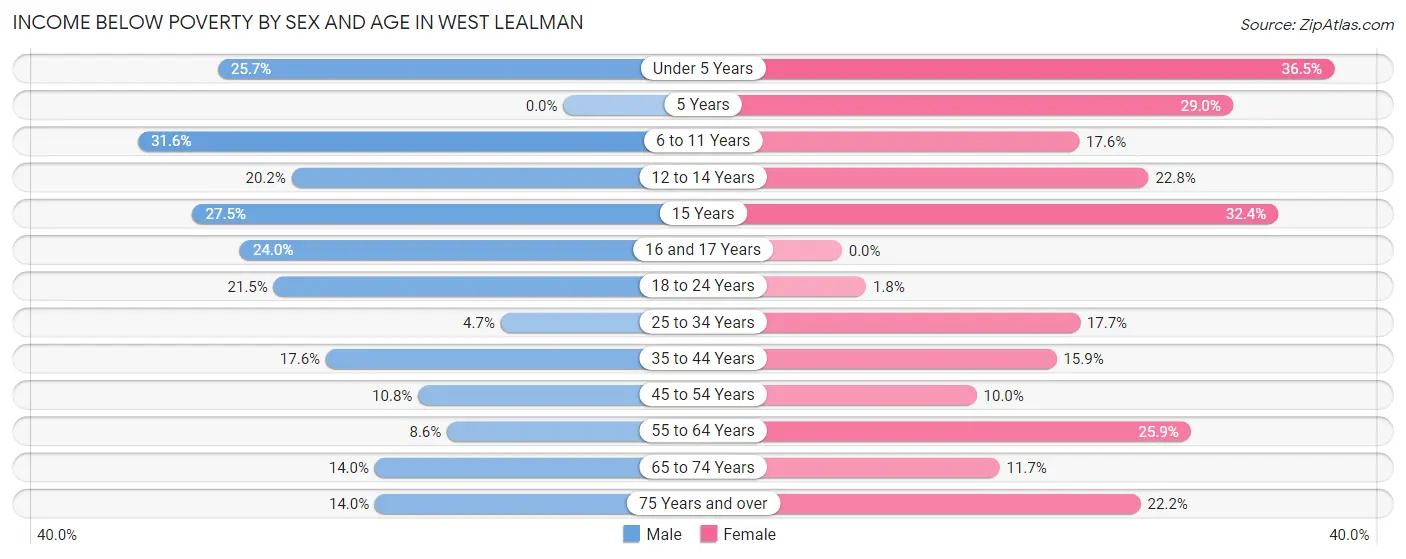
| Age Bracket | Male | Female |
| Under 5 Years | 49 (25.7%) | 61 (36.5%) |
| 5 Years | 0 (0.0%) | 18 (29.0%) |
| 6 to 11 Years | 108 (31.6%) | 43 (17.6%) |
| 12 to 14 Years | 44 (20.2%) | 46 (22.8%) |
| 15 Years | 30 (27.5%) | 23 (32.4%) |
| 16 and 17 Years | 30 (24.0%) | 0 (0.0%) |
| 18 to 24 Years | 74 (21.5%) | 6 (1.8%) |
| 25 to 34 Years | 26 (4.6%) | 119 (17.7%) |
| 35 to 44 Years | 110 (17.6%) | 102 (15.9%) |
| 45 to 54 Years | 93 (10.8%) | 83 (10.0%) |
| 55 to 64 Years | 110 (8.6%) | 394 (25.9%) |
| 65 to 74 Years | 159 (14.0%) | 166 (11.7%) |
| 75 Years and over | 137 (14.0%) | 249 (22.2%) |
| Total | 970 (14.2%) | 1,310 (17.8%) |
Income Above Poverty by Sex and Age in West Lealman
According to the poverty statistics in West Lealman, males aged 5 years and females aged 16 and 17 years are the age groups that are most secure financially, with 100.0% of males and 100.0% of females in these age groups living above the poverty line.
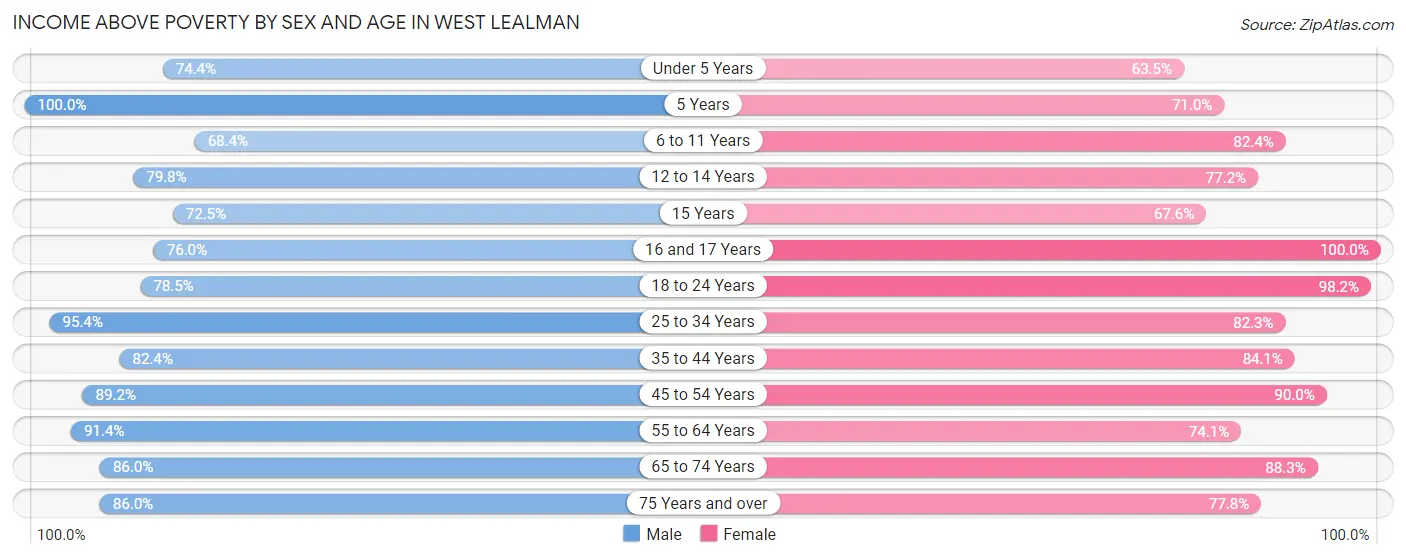
| Age Bracket | Male | Female |
| Under 5 Years | 142 (74.4%) | 106 (63.5%) |
| 5 Years | 70 (100.0%) | 44 (71.0%) |
| 6 to 11 Years | 234 (68.4%) | 201 (82.4%) |
| 12 to 14 Years | 174 (79.8%) | 156 (77.2%) |
| 15 Years | 79 (72.5%) | 48 (67.6%) |
| 16 and 17 Years | 95 (76.0%) | 71 (100.0%) |
| 18 to 24 Years | 270 (78.5%) | 328 (98.2%) |
| 25 to 34 Years | 533 (95.4%) | 554 (82.3%) |
| 35 to 44 Years | 514 (82.4%) | 538 (84.1%) |
| 45 to 54 Years | 770 (89.2%) | 746 (90.0%) |
| 55 to 64 Years | 1,164 (91.4%) | 1,127 (74.1%) |
| 65 to 74 Years | 977 (86.0%) | 1,251 (88.3%) |
| 75 Years and over | 843 (86.0%) | 873 (77.8%) |
| Total | 5,865 (85.8%) | 6,043 (82.2%) |
Income Below Poverty Among Married-Couple Families in West Lealman
The poverty statistics for married-couple families in West Lealman show that 7.3% or 160 of the total 2,199 families live below the poverty line. Families with 3 or 4 children have the highest poverty rate of 29.4%, comprising of 15 families. On the other hand, families with no children have the lowest poverty rate of 6.5%, which includes 114 families.
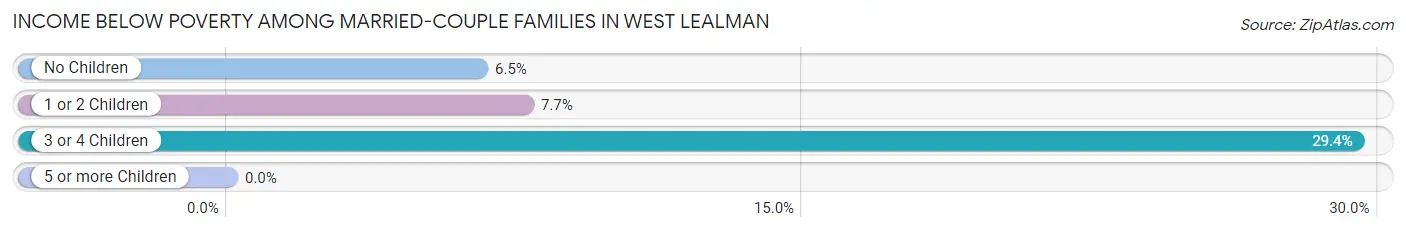
| Children | Above Poverty | Below Poverty |
| No Children | 1,633 (93.5%) | 114 (6.5%) |
| 1 or 2 Children | 370 (92.3%) | 31 (7.7%) |
| 3 or 4 Children | 36 (70.6%) | 15 (29.4%) |
| 5 or more Children | 0 (0.0%) | 0 (0.0%) |
| Total | 2,039 (92.7%) | 160 (7.3%) |
Income Below Poverty Among Single-Parent Households in West Lealman
According to the poverty data in West Lealman, 23.7% or 97 single-father households and 16.4% or 103 single-mother households are living below the poverty line. Among single-father households, those with 3 or 4 children have the highest poverty rate, with 53 households (64.6%) experiencing poverty. Likewise, among single-mother households, those with 5 or more children have the highest poverty rate, with 6 households (100.0%) falling below the poverty line.
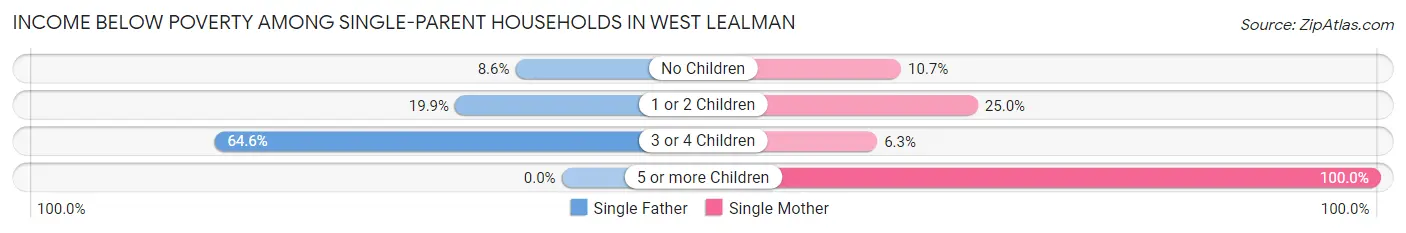
| Children | Single Father | Single Mother |
| No Children | 16 (8.6%) | 35 (10.7%) |
| 1 or 2 Children | 28 (19.9%) | 58 (25.0%) |
| 3 or 4 Children | 53 (64.6%) | 4 (6.2%) |
| 5 or more Children | 0 (0.0%) | 6 (100.0%) |
| Total | 97 (23.7%) | 103 (16.4%) |
Income Below Poverty Among Married-Couple vs Single-Parent Households in West Lealman
The poverty data for West Lealman shows that 160 of the married-couple family households (7.3%) and 200 of the single-parent households (19.3%) are living below the poverty level. Within the married-couple family households, those with 3 or 4 children have the highest poverty rate, with 15 households (29.4%) falling below the poverty line. Among the single-parent households, those with 5 or more children have the highest poverty rate, with 6 household (100.0%) living below poverty.
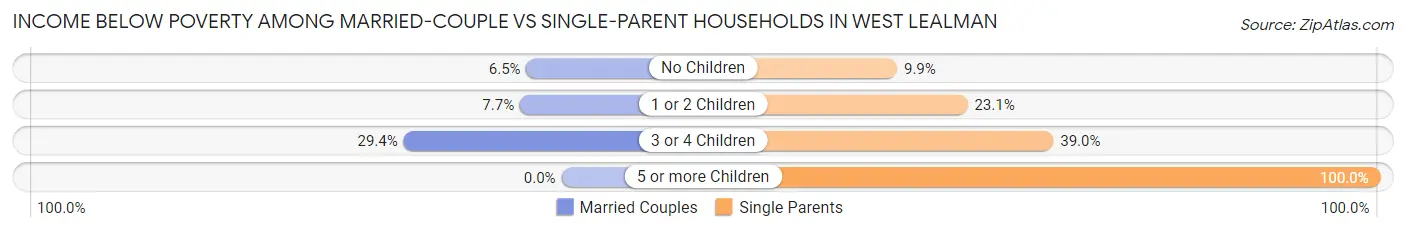
| Children | Married-Couple Families | Single-Parent Households |
| No Children | 114 (6.5%) | 51 (9.9%) |
| 1 or 2 Children | 31 (7.7%) | 86 (23.1%) |
| 3 or 4 Children | 15 (29.4%) | 57 (39.0%) |
| 5 or more Children | 0 (0.0%) | 6 (100.0%) |
| Total | 160 (7.3%) | 200 (19.3%) |
Race in West Lealman
The most populous races in West Lealman are White / Caucasian (11,608 | 81.3%), Hispanic or Latino (1,584 | 11.1%), and Two or more Races (1,041 | 7.3%).
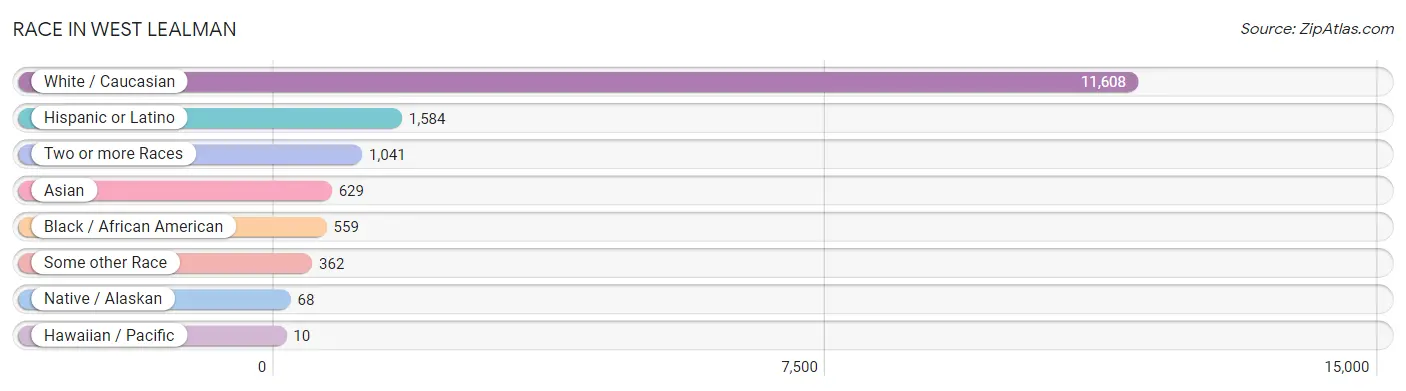
| Race | # Population | % Population |
| Asian | 629 | 4.4% |
| Black / African American | 559 | 3.9% |
| Hawaiian / Pacific | 10 | 0.1% |
| Hispanic or Latino | 1,584 | 11.1% |
| Native / Alaskan | 68 | 0.5% |
| White / Caucasian | 11,608 | 81.3% |
| Two or more Races | 1,041 | 7.3% |
| Some other Race | 362 | 2.5% |
| Total | 14,277 | 100.0% |
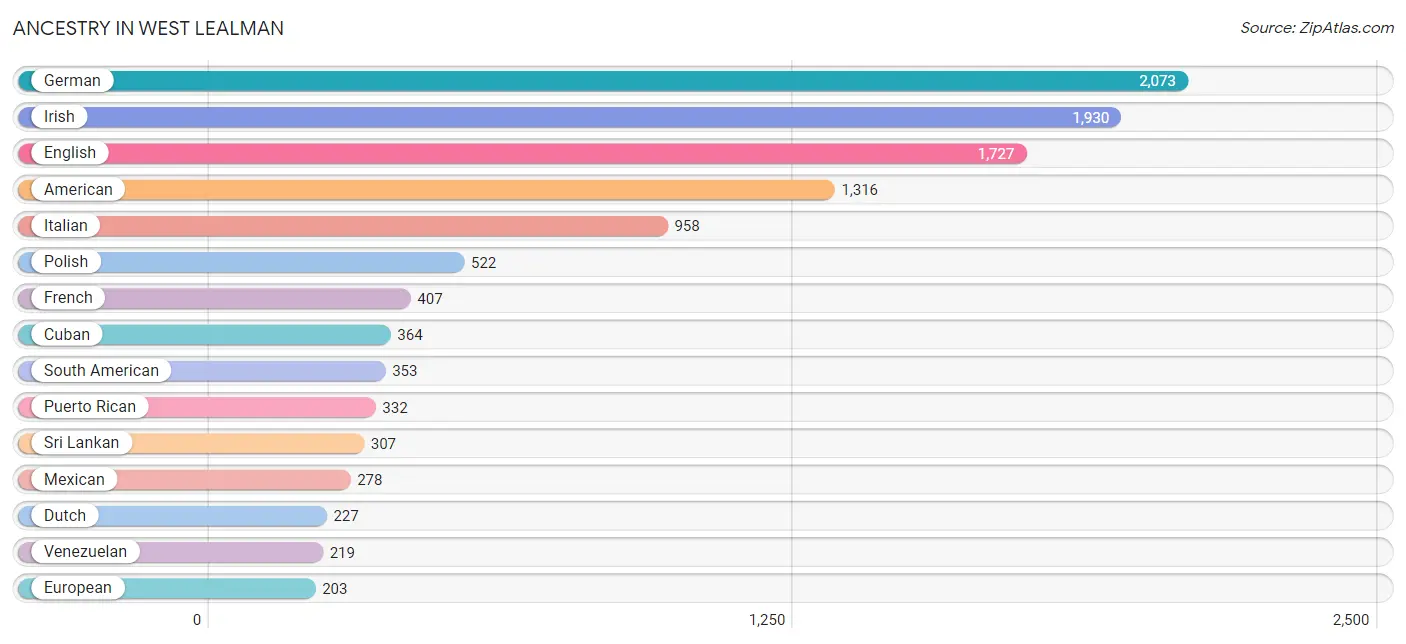
Ancestry in West Lealman
The most populous ancestries reported in West Lealman are German (2,073 | 14.5%), Irish (1,930 | 13.5%), English (1,727 | 12.1%), American (1,316 | 9.2%), and Italian (958 | 6.7%), together accounting for 56.1% of all West Lealman residents.
| Ancestry | # Population | % Population |
| African | 10 | 0.1% |
| American | 1,316 | 9.2% |
| Arab | 74 | 0.5% |
| Austrian | 34 | 0.2% |
| Bangladeshi | 9 | 0.1% |
| Bhutanese | 59 | 0.4% |
| Blackfeet | 14 | 0.1% |
| Brazilian | 9 | 0.1% |
| British | 131 | 0.9% |
| Burmese | 16 | 0.1% |
| Canadian | 103 | 0.7% |
| Cape Verdean | 8 | 0.1% |
| Central American | 77 | 0.5% |
| Cherokee | 21 | 0.2% |
| Chilean | 12 | 0.1% |
| Chippewa | 7 | 0.1% |
| Costa Rican | 10 | 0.1% |
| Creek | 12 | 0.1% |
| Cuban | 364 | 2.5% |
| Czech | 61 | 0.4% |
| Czechoslovakian | 18 | 0.1% |
| Danish | 61 | 0.4% |
| Dominican | 105 | 0.7% |
| Dutch | 227 | 1.6% |
| Ecuadorian | 76 | 0.5% |
| English | 1,727 | 12.1% |
| European | 203 | 1.4% |
| Finnish | 31 | 0.2% |
| French | 407 | 2.9% |
| French Canadian | 151 | 1.1% |
| German | 2,073 | 14.5% |
| Greek | 47 | 0.3% |
| Guamanian / Chamorro | 34 | 0.2% |
| Guatemalan | 3 | 0.0% |
| Haitian | 15 | 0.1% |
| Honduran | 55 | 0.4% |
| Hungarian | 112 | 0.8% |
| Indian (Asian) | 29 | 0.2% |
| Indonesian | 82 | 0.6% |
| Iranian | 78 | 0.5% |
| Irish | 1,930 | 13.5% |
| Italian | 958 | 6.7% |
| Jamaican | 48 | 0.3% |
| Japanese | 39 | 0.3% |
| Korean | 155 | 1.1% |
| Lebanese | 36 | 0.3% |
| Lithuanian | 176 | 1.2% |
| Malaysian | 18 | 0.1% |
| Menominee | 24 | 0.2% |
| Mexican | 278 | 1.9% |
| Native Hawaiian | 10 | 0.1% |
| Nicaraguan | 9 | 0.1% |
| Norwegian | 76 | 0.5% |
| Pakistani | 15 | 0.1% |
| Palestinian | 38 | 0.3% |
| Peruvian | 46 | 0.3% |
| Polish | 522 | 3.7% |
| Portuguese | 69 | 0.5% |
| Puerto Rican | 332 | 2.3% |
| Romanian | 67 | 0.5% |
| Russian | 127 | 0.9% |
| Scandinavian | 98 | 0.7% |
| Scotch-Irish | 180 | 1.3% |
| Scottish | 181 | 1.3% |
| Seminole | 1 | 0.0% |
| Serbian | 18 | 0.1% |
| Slavic | 9 | 0.1% |
| Slovak | 54 | 0.4% |
| South American | 353 | 2.5% |
| Spaniard | 25 | 0.2% |
| Sri Lankan | 307 | 2.1% |
| Subsaharan African | 18 | 0.1% |
| Swedish | 82 | 0.6% |
| Swiss | 35 | 0.3% |
| Syrian | 11 | 0.1% |
| Thai | 11 | 0.1% |
| Trinidadian and Tobagonian | 22 | 0.2% |
| Ukrainian | 86 | 0.6% |
| Venezuelan | 219 | 1.5% |
| Welsh | 45 | 0.3% |
| West Indian | 1 | 0.0% | View All 81 Rows |
Immigrants in West Lealman
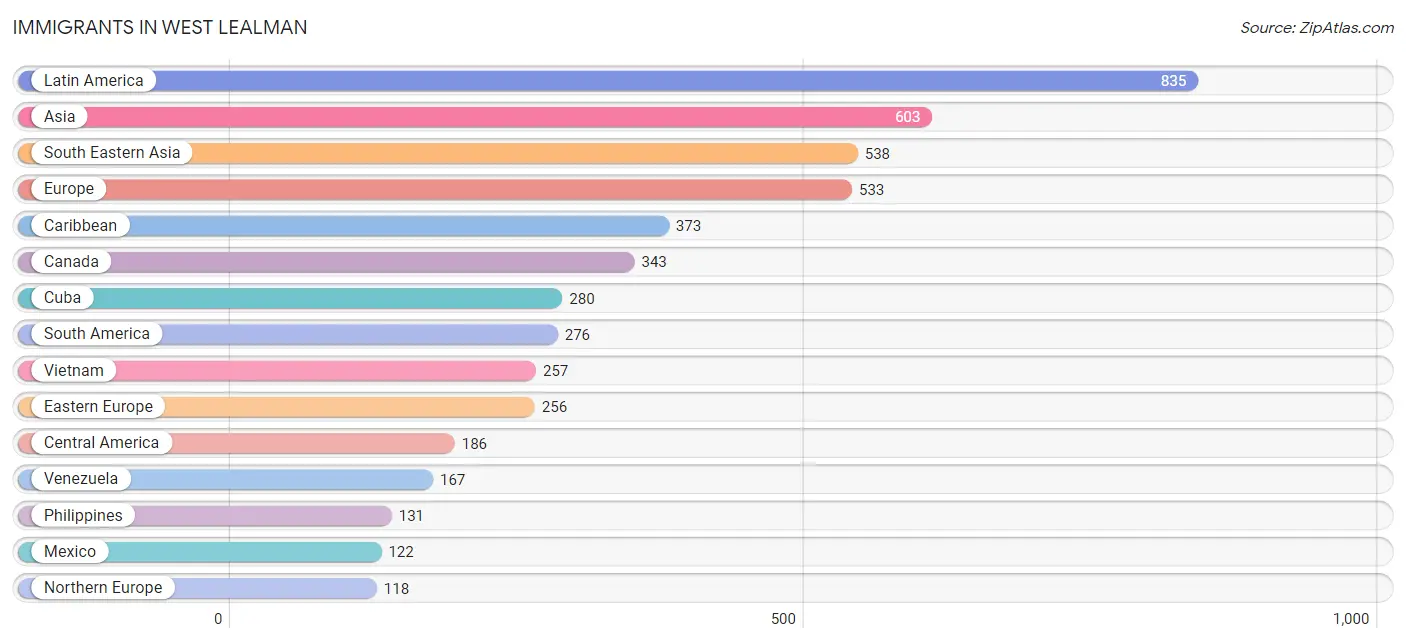
The most numerous immigrant groups reported in West Lealman came from Latin America (835 | 5.9%), Asia (603 | 4.2%), South Eastern Asia (538 | 3.8%), Europe (533 | 3.7%), and Caribbean (373 | 2.6%), together accounting for 20.2% of all West Lealman residents.
| Immigration Origin | # Population | % Population |
| Asia | 603 | 4.2% |
| Brazil | 9 | 0.1% |
| Cambodia | 9 | 0.1% |
| Canada | 343 | 2.4% |
| Caribbean | 373 | 2.6% |
| Central America | 186 | 1.3% |
| China | 17 | 0.1% |
| Cuba | 280 | 2.0% |
| Czechoslovakia | 8 | 0.1% |
| Dominican Republic | 65 | 0.5% |
| Eastern Asia | 33 | 0.2% |
| Eastern Europe | 256 | 1.8% |
| Ecuador | 54 | 0.4% |
| England | 48 | 0.3% |
| Europe | 533 | 3.7% |
| France | 5 | 0.0% |
| Germany | 43 | 0.3% |
| Greece | 6 | 0.0% |
| Honduras | 55 | 0.4% |
| Indonesia | 31 | 0.2% |
| Iran | 21 | 0.2% |
| Ireland | 40 | 0.3% |
| Italy | 73 | 0.5% |
| Jamaica | 22 | 0.2% |
| Korea | 16 | 0.1% |
| Laos | 4 | 0.0% |
| Latin America | 835 | 5.9% |
| Lithuania | 96 | 0.7% |
| Mexico | 122 | 0.9% |
| Nicaragua | 9 | 0.1% |
| Northern Europe | 118 | 0.8% |
| Peru | 46 | 0.3% |
| Philippines | 131 | 0.9% |
| Poland | 91 | 0.6% |
| Portugal | 23 | 0.2% |
| Romania | 17 | 0.1% |
| Scotland | 24 | 0.2% |
| Serbia | 28 | 0.2% |
| South America | 276 | 1.9% |
| South Central Asia | 21 | 0.2% |
| South Eastern Asia | 538 | 3.8% |
| Southern Europe | 102 | 0.7% |
| Sweden | 6 | 0.0% |
| Switzerland | 9 | 0.1% |
| Thailand | 24 | 0.2% |
| Trinidad and Tobago | 6 | 0.0% |
| Ukraine | 16 | 0.1% |
| Venezuela | 167 | 1.2% |
| Vietnam | 257 | 1.8% |
| Western Asia | 11 | 0.1% |
| Western Europe | 57 | 0.4% | View All 51 Rows |
Sex and Age in West Lealman
Sex and Age in West Lealman
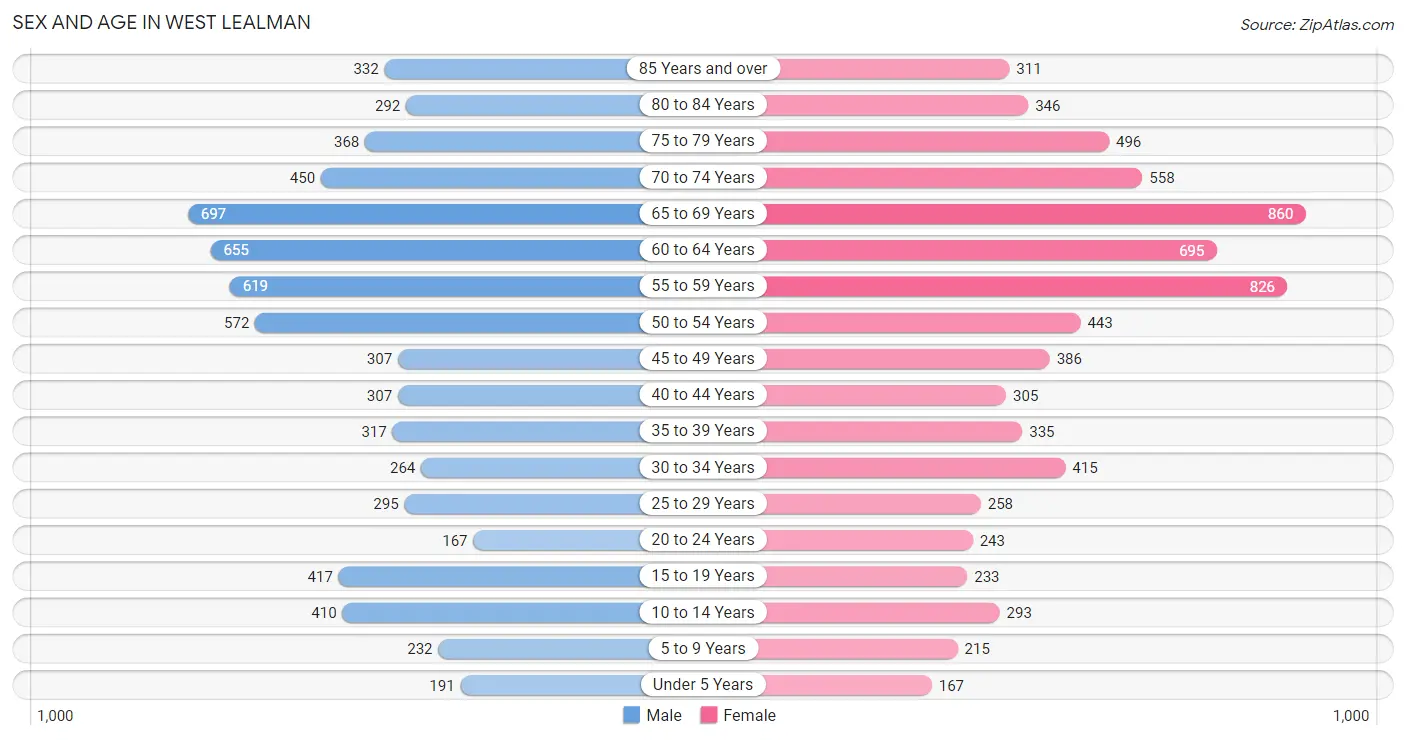
The most populous age groups in West Lealman are 65 to 69 Years (697 | 10.1%) for men and 65 to 69 Years (860 | 11.7%) for women.
| Age Bracket | Male | Female |
| Under 5 Years | 191 (2.8%) | 167 (2.3%) |
| 5 to 9 Years | 232 (3.4%) | 215 (2.9%) |
| 10 to 14 Years | 410 (5.9%) | 293 (4.0%) |
| 15 to 19 Years | 417 (6.0%) | 233 (3.2%) |
| 20 to 24 Years | 167 (2.4%) | 243 (3.3%) |
| 25 to 29 Years | 295 (4.3%) | 258 (3.5%) |
| 30 to 34 Years | 264 (3.8%) | 415 (5.6%) |
| 35 to 39 Years | 317 (4.6%) | 335 (4.5%) |
| 40 to 44 Years | 307 (4.4%) | 305 (4.1%) |
| 45 to 49 Years | 307 (4.4%) | 386 (5.2%) |
| 50 to 54 Years | 572 (8.3%) | 443 (6.0%) |
| 55 to 59 Years | 619 (9.0%) | 826 (11.2%) |
| 60 to 64 Years | 655 (9.5%) | 695 (9.4%) |
| 65 to 69 Years | 697 (10.1%) | 860 (11.7%) |
| 70 to 74 Years | 450 (6.5%) | 558 (7.6%) |
| 75 to 79 Years | 368 (5.3%) | 496 (6.7%) |
| 80 to 84 Years | 292 (4.2%) | 346 (4.7%) |
| 85 Years and over | 332 (4.8%) | 311 (4.2%) |
| Total | 6,892 (100.0%) | 7,385 (100.0%) |
Families and Households in West Lealman
Median Family Size in West Lealman
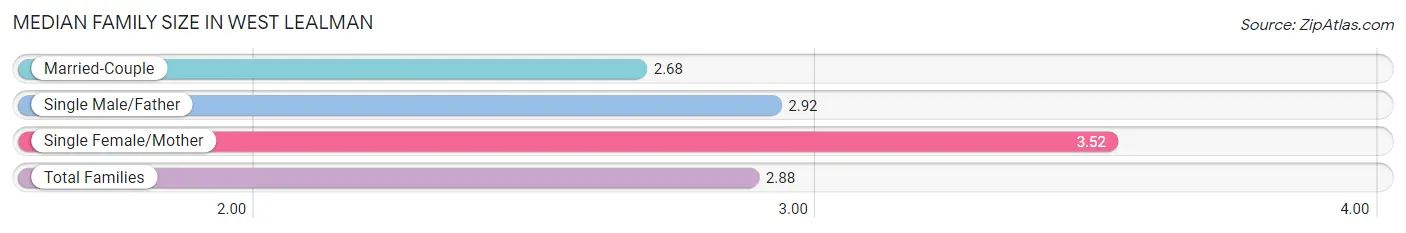
The median family size in West Lealman is 2.88 persons per family, with single female/mother families (629 | 19.4%) accounting for the largest median family size of 3.52 persons per family. On the other hand, married-couple families (2,199 | 67.9%) represent the smallest median family size with 2.68 persons per family.
| Family Type | # Families | Family Size |
| Married-Couple | 2,199 (67.9%) | 2.68 |
| Single Male/Father | 409 (12.6%) | 2.92 |
| Single Female/Mother | 629 (19.4%) | 3.52 |
| Total Families | 3,237 (100.0%) | 2.88 |
Median Household Size in West Lealman
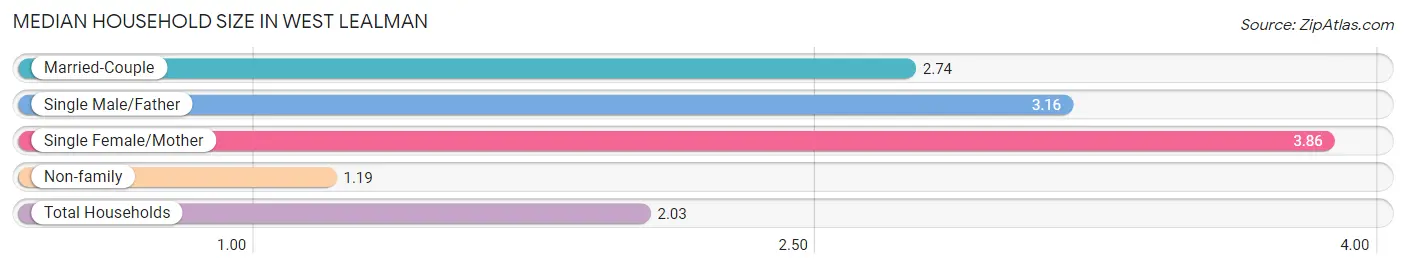
The median household size in West Lealman is 2.03 persons per household, with single female/mother households (629 | 9.0%) accounting for the largest median household size of 3.86 persons per household. non-family households (3,733 | 53.6%) represent the smallest median household size with 1.19 persons per household.
| Household Type | # Households | Household Size |
| Married-Couple | 2,199 (31.6%) | 2.74 |
| Single Male/Father | 409 (5.9%) | 3.16 |
| Single Female/Mother | 629 (9.0%) | 3.86 |
| Non-family | 3,733 (53.6%) | 1.19 |
| Total Households | 6,970 (100.0%) | 2.03 |
Household Size by Marriage Status in West Lealman
Out of a total of 6,970 households in West Lealman, 3,237 (46.4%) are family households, while 3,733 (53.6%) are nonfamily households. The most numerous type of family households are 2-person households, comprising 1,991, and the most common type of nonfamily households are 1-person households, comprising 3,180.
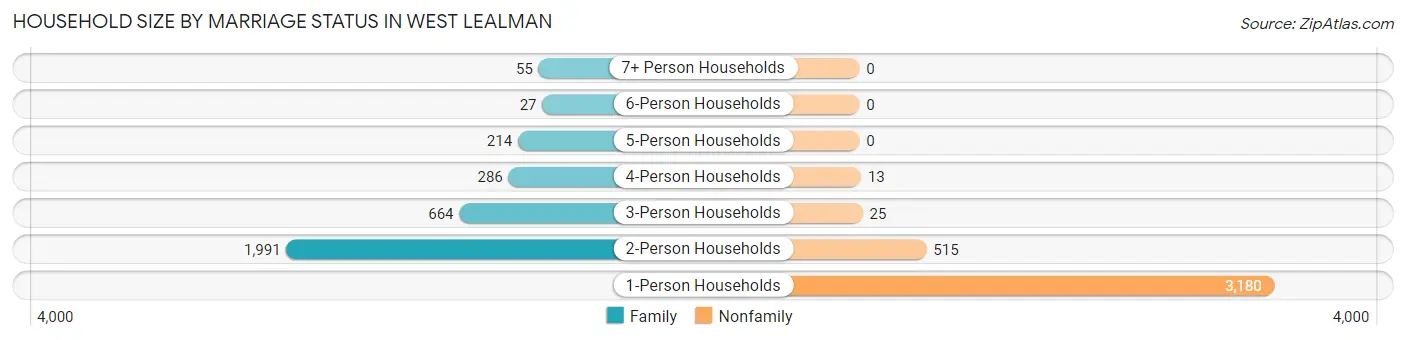
| Household Size | Family Households | Nonfamily Households |
| 1-Person Households | - | 3,180 (45.6%) |
| 2-Person Households | 1,991 (28.6%) | 515 (7.4%) |
| 3-Person Households | 664 (9.5%) | 25 (0.4%) |
| 4-Person Households | 286 (4.1%) | 13 (0.2%) |
| 5-Person Households | 214 (3.1%) | 0 (0.0%) |
| 6-Person Households | 27 (0.4%) | 0 (0.0%) |
| 7+ Person Households | 55 (0.8%) | 0 (0.0%) |
| Total | 3,237 (46.4%) | 3,733 (53.6%) |
Female Fertility in West Lealman
Fertility by Age in West Lealman
Average fertility rate in West Lealman is 47.0 births per 1,000 women. Women in the age bracket of 35 to 50 years have the highest fertility rate with 80.0 births per 1,000 women. Women in the age bracket of 35 to 50 years acount for 84.3% of all women with births.
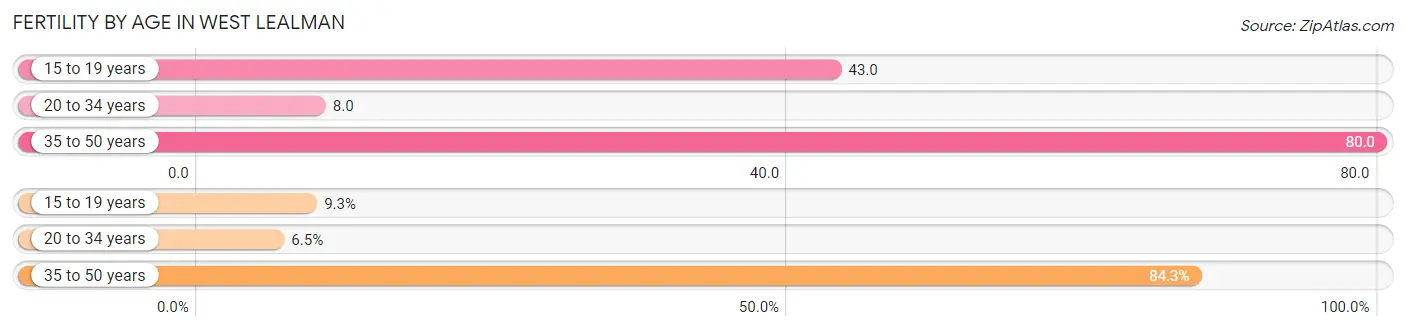
| Age Bracket | Women with Births | Births / 1,000 Women |
| 15 to 19 years | 10 (9.3%) | 43.0 |
| 20 to 34 years | 7 (6.5%) | 8.0 |
| 35 to 50 years | 91 (84.3%) | 80.0 |
| Total | 108 (100.0%) | 47.0 |
Fertility by Age by Marriage Status in West Lealman
90.7% of women with births (108) in West Lealman are married. The highest percentage of unmarried women with births falls into 15 to 19 years age bracket with 100.0% of them unmarried at the time of birth, while the lowest percentage of unmarried women with births belong to 20 to 34 years age bracket with 0.0% of them unmarried.
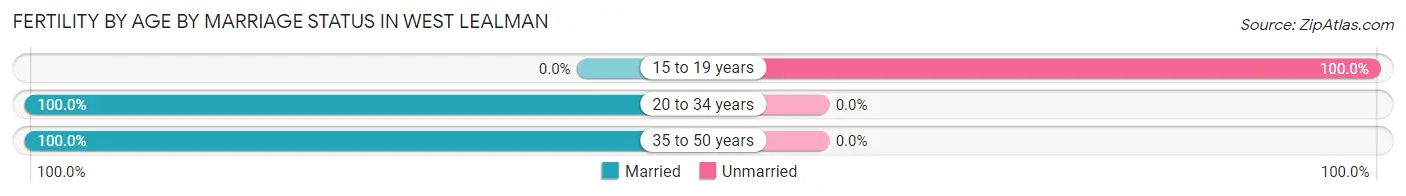
| Age Bracket | Married | Unmarried |
| 15 to 19 years | 0 (0.0%) | 10 (100.0%) |
| 20 to 34 years | 7 (100.0%) | 0 (0.0%) |
| 35 to 50 years | 91 (100.0%) | 0 (0.0%) |
| Total | 98 (90.7%) | 10 (9.3%) |
Fertility by Education in West Lealman
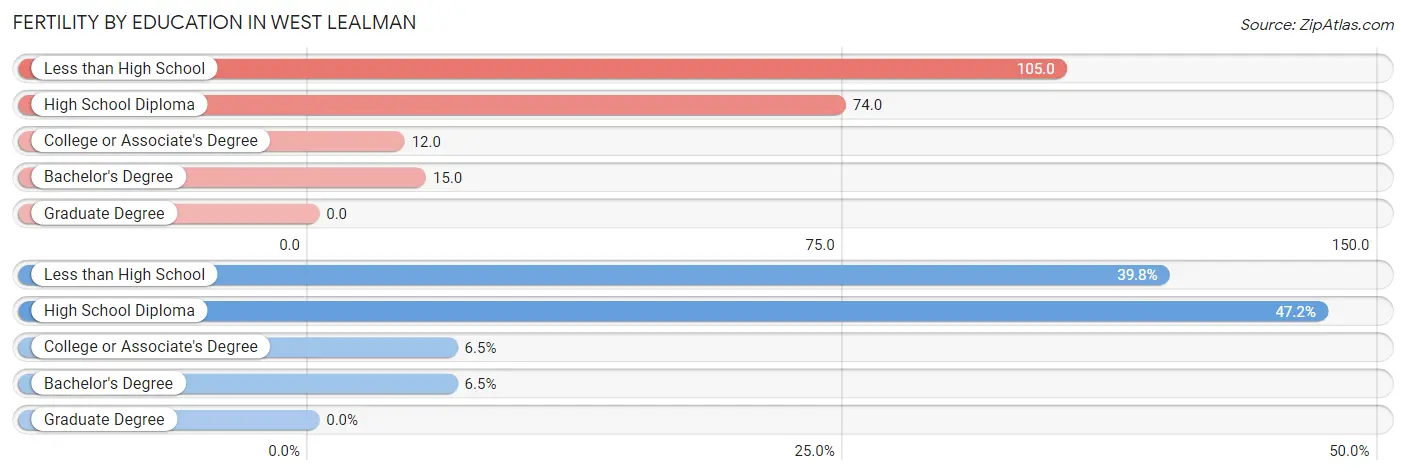
| Educational Attainment | Women with Births | Births / 1,000 Women |
| Less than High School | 43 (39.8%) | 105.0 |
| High School Diploma | 51 (47.2%) | 74.0 |
| College or Associate's Degree | 7 (6.5%) | 12.0 |
| Bachelor's Degree | 7 (6.5%) | 15.0 |
| Graduate Degree | 0 (0.0%) | 0.0 |
| Total | 108 (100.0%) | 47.0 |
Fertility by Education by Marriage Status in West Lealman
9.3% of women with births in West Lealman are unmarried. Women with the educational attainment of high school diploma are most likely to be married with 100.0% of them married at childbirth, while women with the educational attainment of less than high school are least likely to be married with 23.3% of them unmarried at childbirth.
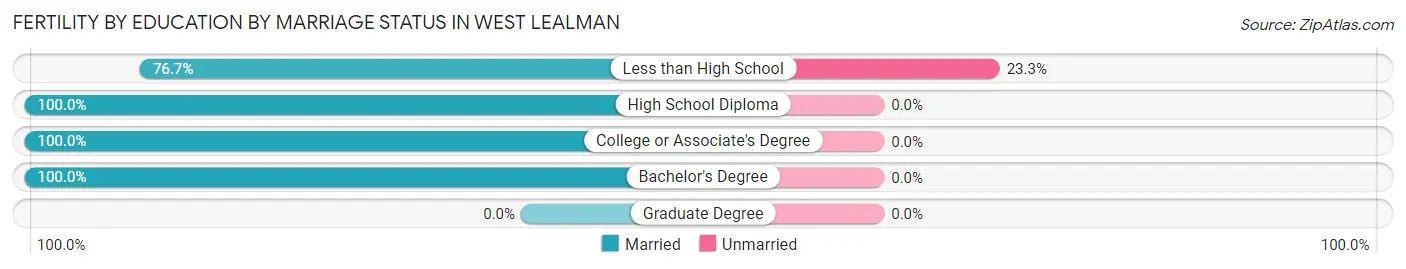
| Educational Attainment | Married | Unmarried |
| Less than High School | 33 (76.7%) | 10 (23.3%) |
| High School Diploma | 51 (100.0%) | 0 (0.0%) |
| College or Associate's Degree | 7 (100.0%) | 0 (0.0%) |
| Bachelor's Degree | 7 (100.0%) | 0 (0.0%) |
| Graduate Degree | 0 (0.0%) | 0 (0.0%) |
| Total | 98 (90.7%) | 10 (9.3%) |
Employment Characteristics in West Lealman
Employment by Class of Employer in West Lealman
Among the 5,960 employed individuals in West Lealman, private company employees (4,267 | 71.6%), not-for-profit organizations (503 | 8.4%), and local government employees (416 | 7.0%) make up the most common classes of employment.
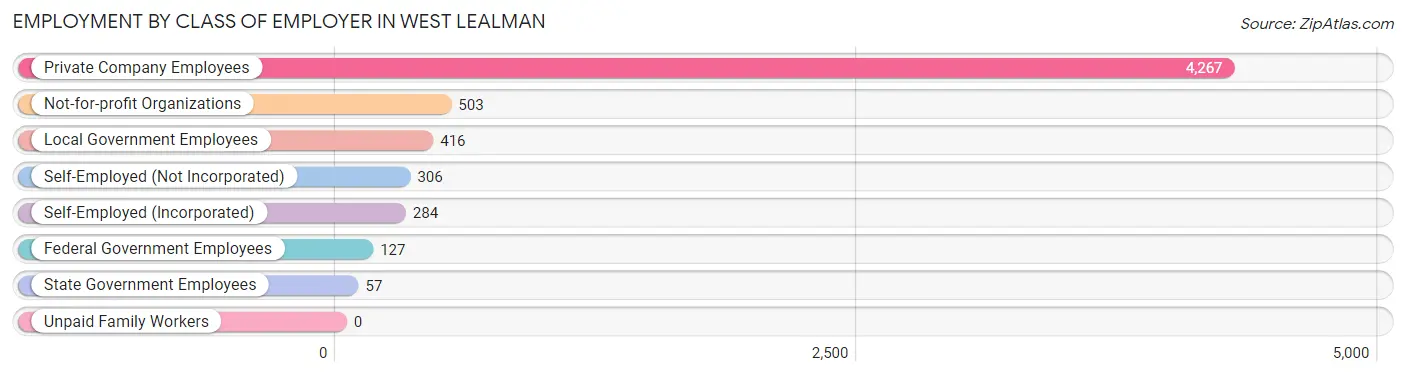
| Employer Class | # Employees | % Employees |
| Private Company Employees | 4,267 | 71.6% |
| Self-Employed (Incorporated) | 284 | 4.8% |
| Self-Employed (Not Incorporated) | 306 | 5.1% |
| Not-for-profit Organizations | 503 | 8.4% |
| Local Government Employees | 416 | 7.0% |
| State Government Employees | 57 | 1.0% |
| Federal Government Employees | 127 | 2.1% |
| Unpaid Family Workers | 0 | 0.0% |
| Total | 5,960 | 100.0% |
Employment Status by Age in West Lealman
According to the labor force statistics for West Lealman, out of the total population over 16 years of age (12,587), 51.2% or 6,445 individuals are in the labor force, with 5.4% or 348 of them unemployed. The age group with the highest labor force participation rate is 25 to 29 years, with 98.6% or 545 individuals in the labor force. Within the labor force, the 16 to 19 years age range has the highest percentage of unemployed individuals, with 18.7% or 45 of them being unemployed.
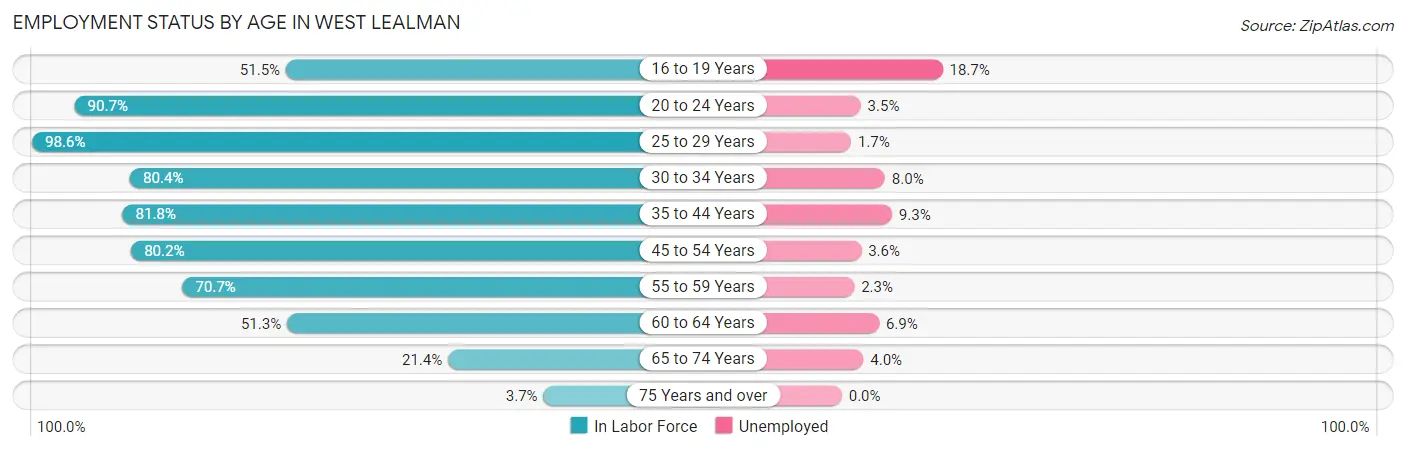
| Age Bracket | In Labor Force | Unemployed |
| 16 to 19 Years | 241 (51.5%) | 45 (18.7%) |
| 20 to 24 Years | 372 (90.7%) | 13 (3.5%) |
| 25 to 29 Years | 545 (98.6%) | 9 (1.7%) |
| 30 to 34 Years | 546 (80.4%) | 44 (8.0%) |
| 35 to 44 Years | 1,034 (81.8%) | 96 (9.3%) |
| 45 to 54 Years | 1,370 (80.2%) | 49 (3.6%) |
| 55 to 59 Years | 1,022 (70.7%) | 24 (2.3%) |
| 60 to 64 Years | 693 (51.3%) | 48 (6.9%) |
| 65 to 74 Years | 549 (21.4%) | 22 (4.0%) |
| 75 Years and over | 79 (3.7%) | 0 (0.0%) |
| Total | 6,445 (51.2%) | 348 (5.4%) |
Employment Status by Educational Attainment in West Lealman
According to labor force statistics for West Lealman, 74.4% of individuals (5,207) out of the total population between 25 and 64 years of age (6,999) are in the labor force, with 5.2% or 271 of them being unemployed. The group with the highest labor force participation rate are those with the educational attainment of bachelor's degree or higher, with 86.6% or 1,174 individuals in the labor force. Within the labor force, individuals with less than high school education have the highest percentage of unemployment, with 11.2% or 62 of them being unemployed.
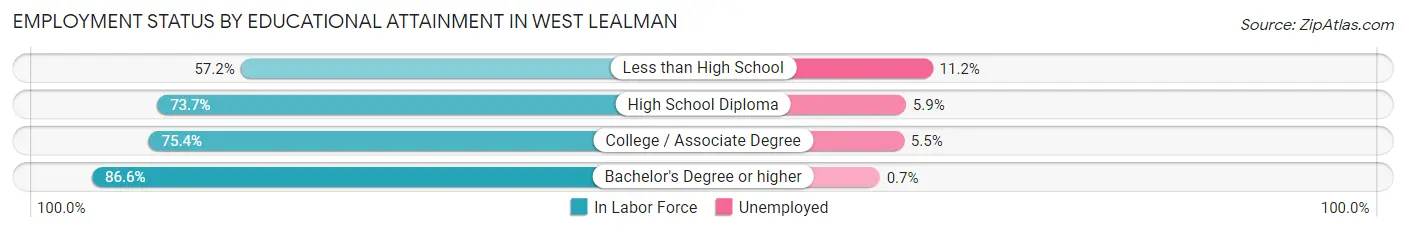
| Educational Attainment | In Labor Force | Unemployed |
| Less than High School | 553 (57.2%) | 108 (11.2%) |
| High School Diploma | 1,884 (73.7%) | 151 (5.9%) |
| College / Associate Degree | 1,598 (75.4%) | 117 (5.5%) |
| Bachelor's Degree or higher | 1,174 (86.6%) | 9 (0.7%) |
| Total | 5,207 (74.4%) | 364 (5.2%) |
Employment Occupations by Sex in West Lealman
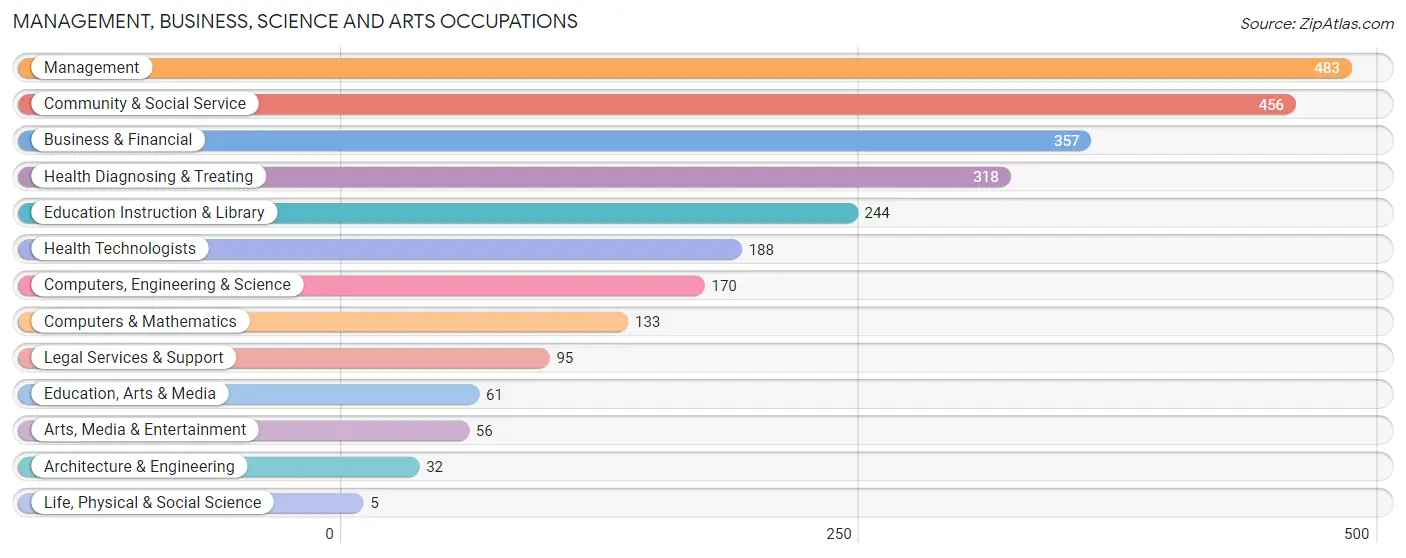
Management, Business, Science and Arts Occupations
The most common Management, Business, Science and Arts occupations in West Lealman are Management (483 | 7.9%), Community & Social Service (456 | 7.5%), Business & Financial (357 | 5.9%), Health Diagnosing & Treating (318 | 5.2%), and Education Instruction & Library (244 | 4.0%).
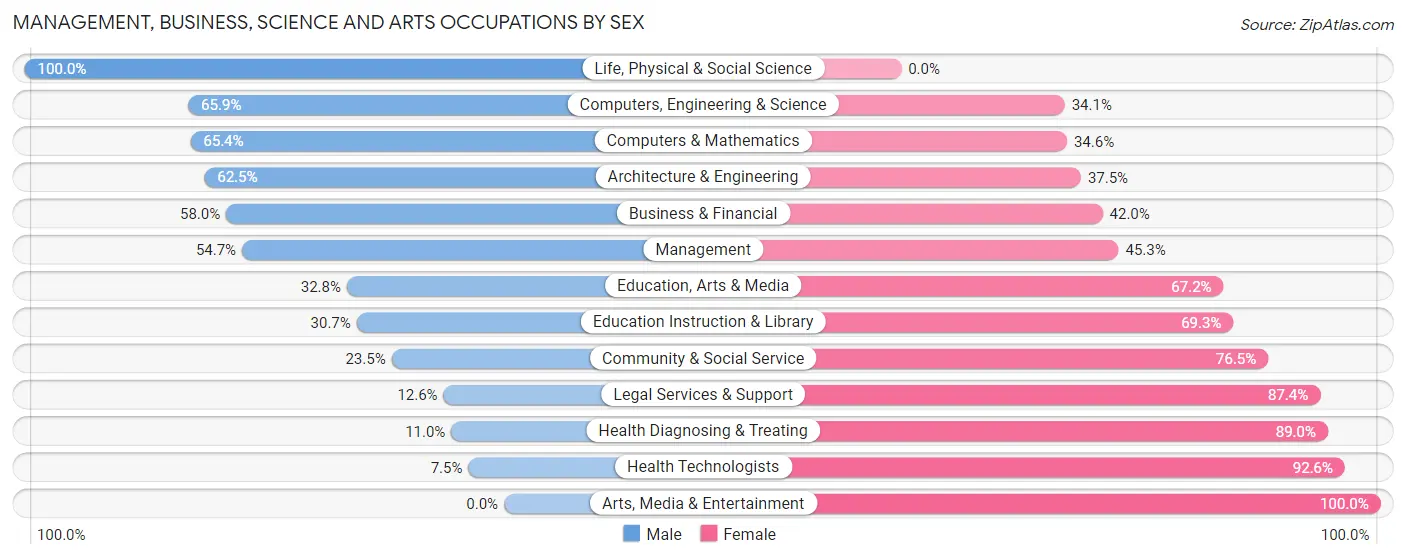
Management, Business, Science and Arts Occupations by Sex
Within the Management, Business, Science and Arts occupations in West Lealman, the most male-oriented occupations are Life, Physical & Social Science (100.0%), Computers, Engineering & Science (65.9%), and Computers & Mathematics (65.4%), while the most female-oriented occupations are Arts, Media & Entertainment (100.0%), Health Technologists (92.5%), and Health Diagnosing & Treating (89.0%).
| Occupation | Male | Female |
| Management | 264 (54.7%) | 219 (45.3%) |
| Business & Financial | 207 (58.0%) | 150 (42.0%) |
| Computers, Engineering & Science | 112 (65.9%) | 58 (34.1%) |
| Computers & Mathematics | 87 (65.4%) | 46 (34.6%) |
| Architecture & Engineering | 20 (62.5%) | 12 (37.5%) |
| Life, Physical & Social Science | 5 (100.0%) | 0 (0.0%) |
| Community & Social Service | 107 (23.5%) | 349 (76.5%) |
| Education, Arts & Media | 20 (32.8%) | 41 (67.2%) |
| Legal Services & Support | 12 (12.6%) | 83 (87.4%) |
| Education Instruction & Library | 75 (30.7%) | 169 (69.3%) |
| Arts, Media & Entertainment | 0 (0.0%) | 56 (100.0%) |
| Health Diagnosing & Treating | 35 (11.0%) | 283 (89.0%) |
| Health Technologists | 14 (7.4%) | 174 (92.5%) |
| Total (Category) | 725 (40.6%) | 1,059 (59.4%) |
| Total (Overall) | 3,090 (50.7%) | 3,004 (49.3%) |
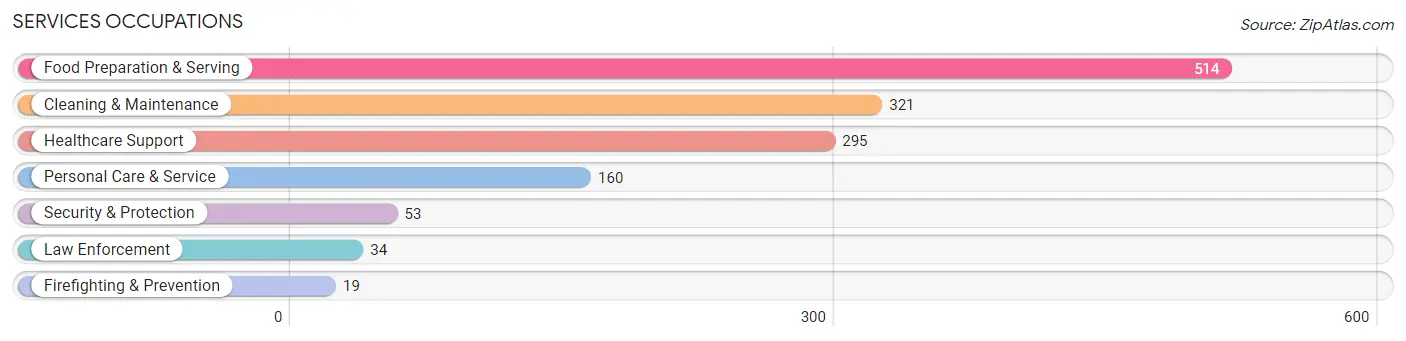
Services Occupations
The most common Services occupations in West Lealman are Food Preparation & Serving (514 | 8.4%), Cleaning & Maintenance (321 | 5.3%), Healthcare Support (295 | 4.8%), Personal Care & Service (160 | 2.6%), and Security & Protection (53 | 0.9%).
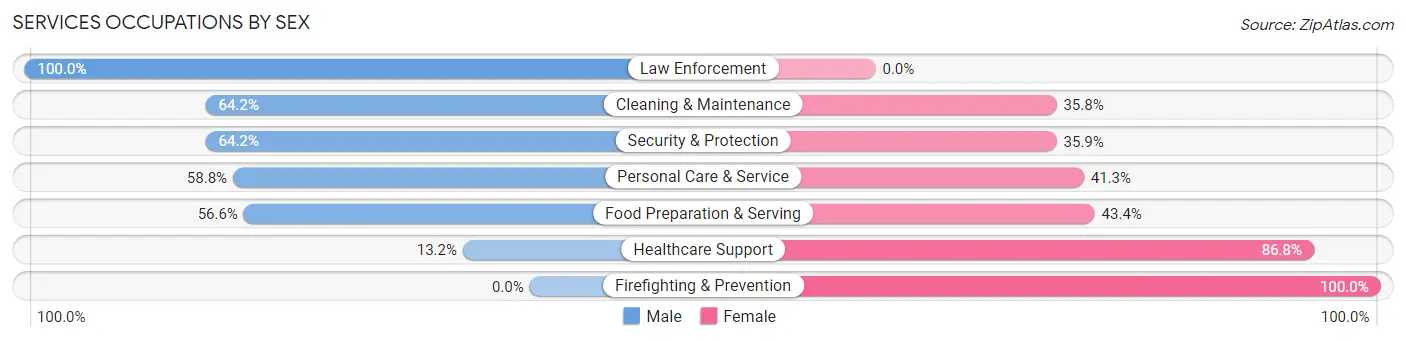
Services Occupations by Sex
Within the Services occupations in West Lealman, the most male-oriented occupations are Law Enforcement (100.0%), Cleaning & Maintenance (64.2%), and Security & Protection (64.1%), while the most female-oriented occupations are Firefighting & Prevention (100.0%), Healthcare Support (86.8%), and Food Preparation & Serving (43.4%).
| Occupation | Male | Female |
| Healthcare Support | 39 (13.2%) | 256 (86.8%) |
| Security & Protection | 34 (64.1%) | 19 (35.8%) |
| Firefighting & Prevention | 0 (0.0%) | 19 (100.0%) |
| Law Enforcement | 34 (100.0%) | 0 (0.0%) |
| Food Preparation & Serving | 291 (56.6%) | 223 (43.4%) |
| Cleaning & Maintenance | 206 (64.2%) | 115 (35.8%) |
| Personal Care & Service | 94 (58.8%) | 66 (41.2%) |
| Total (Category) | 664 (49.4%) | 679 (50.6%) |
| Total (Overall) | 3,090 (50.7%) | 3,004 (49.3%) |
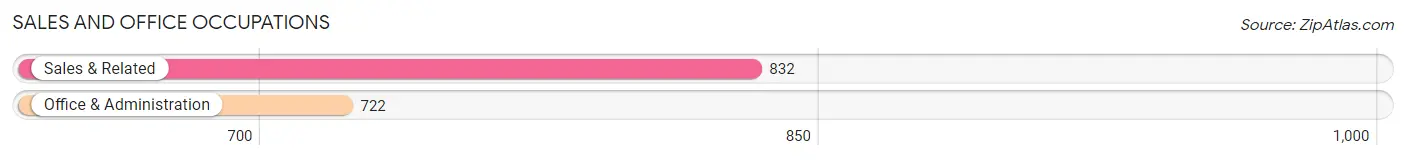
Sales and Office Occupations
The most common Sales and Office occupations in West Lealman are Sales & Related (832 | 13.7%), and Office & Administration (722 | 11.8%).
Sales and Office Occupations by Sex
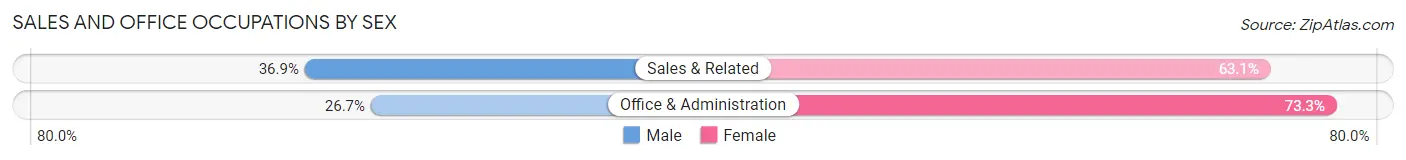
| Occupation | Male | Female |
| Sales & Related | 307 (36.9%) | 525 (63.1%) |
| Office & Administration | 193 (26.7%) | 529 (73.3%) |
| Total (Category) | 500 (32.2%) | 1,054 (67.8%) |
| Total (Overall) | 3,090 (50.7%) | 3,004 (49.3%) |
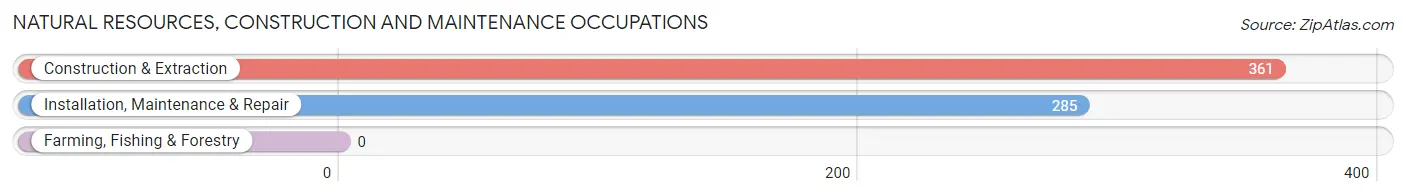
Natural Resources, Construction and Maintenance Occupations
The most common Natural Resources, Construction and Maintenance occupations in West Lealman are Construction & Extraction (361 | 5.9%), and Installation, Maintenance & Repair (285 | 4.7%).
Natural Resources, Construction and Maintenance Occupations by Sex
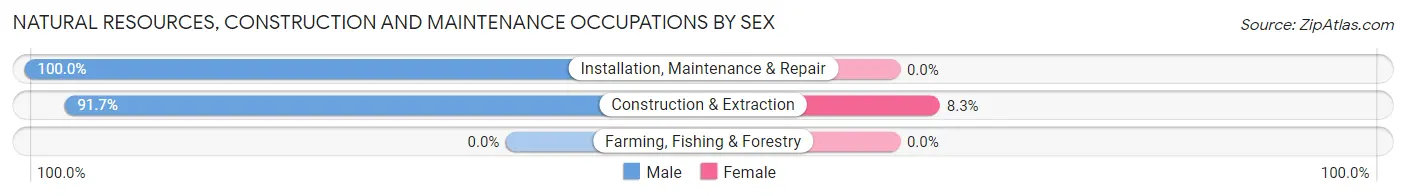
| Occupation | Male | Female |
| Farming, Fishing & Forestry | 0 (0.0%) | 0 (0.0%) |
| Construction & Extraction | 331 (91.7%) | 30 (8.3%) |
| Installation, Maintenance & Repair | 285 (100.0%) | 0 (0.0%) |
| Total (Category) | 616 (95.4%) | 30 (4.6%) |
| Total (Overall) | 3,090 (50.7%) | 3,004 (49.3%) |
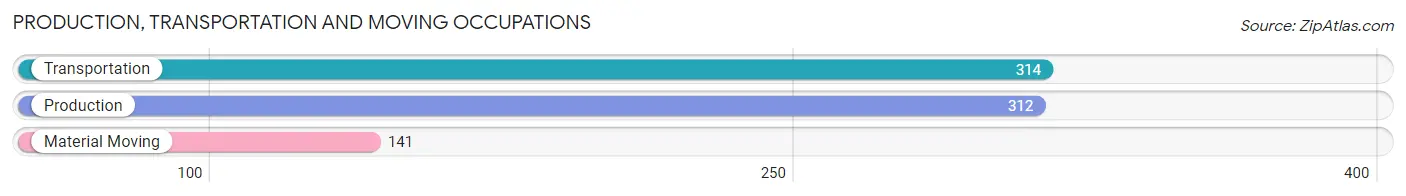
Production, Transportation and Moving Occupations
The most common Production, Transportation and Moving occupations in West Lealman are Transportation (314 | 5.1%), Production (312 | 5.1%), and Material Moving (141 | 2.3%).
Production, Transportation and Moving Occupations by Sex
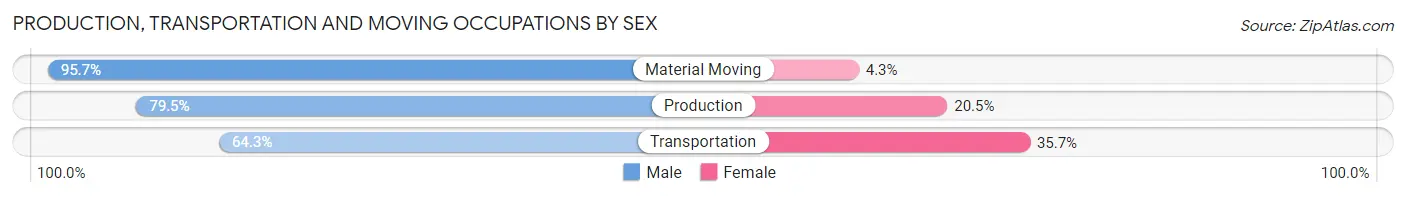
| Occupation | Male | Female |
| Production | 248 (79.5%) | 64 (20.5%) |
| Transportation | 202 (64.3%) | 112 (35.7%) |
| Material Moving | 135 (95.7%) | 6 (4.3%) |
| Total (Category) | 585 (76.3%) | 182 (23.7%) |
| Total (Overall) | 3,090 (50.7%) | 3,004 (49.3%) |
Employment Industries by Sex in West Lealman
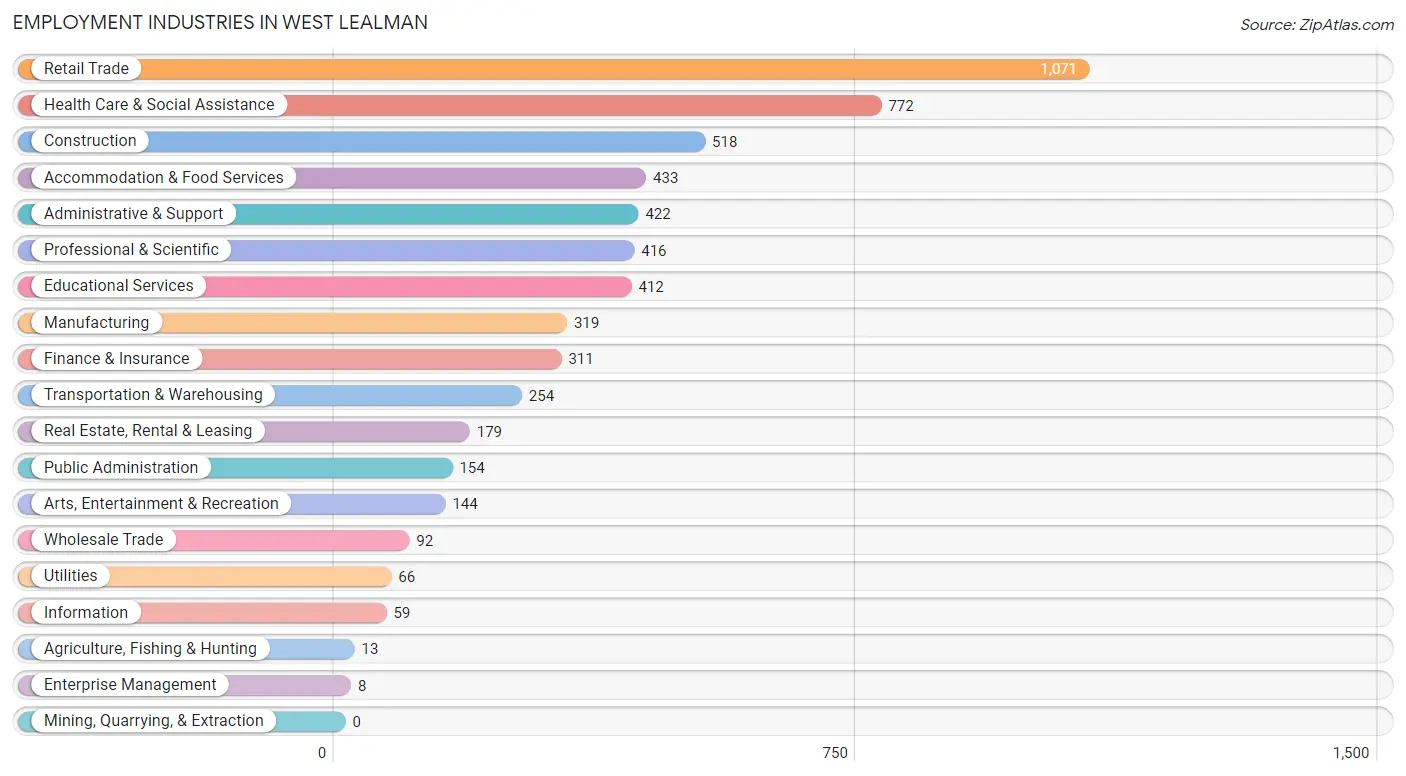
Employment Industries in West Lealman
The major employment industries in West Lealman include Retail Trade (1,071 | 17.6%), Health Care & Social Assistance (772 | 12.7%), Construction (518 | 8.5%), Accommodation & Food Services (433 | 7.1%), and Administrative & Support (422 | 6.9%).
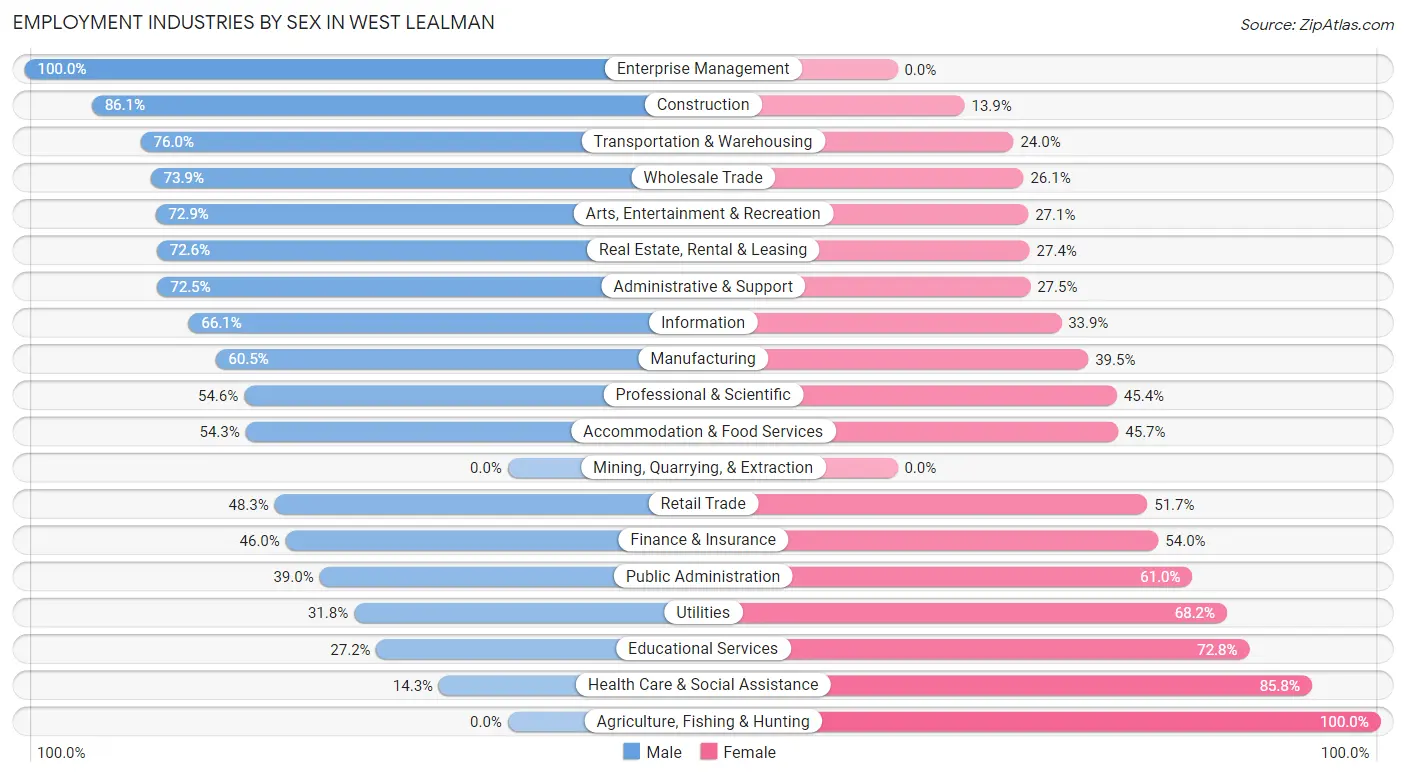
Employment Industries by Sex in West Lealman
The West Lealman industries that see more men than women are Enterprise Management (100.0%), Construction (86.1%), and Transportation & Warehousing (76.0%), whereas the industries that tend to have a higher number of women are Agriculture, Fishing & Hunting (100.0%), Health Care & Social Assistance (85.8%), and Educational Services (72.8%).
| Industry | Male | Female |
| Agriculture, Fishing & Hunting | 0 (0.0%) | 13 (100.0%) |
| Mining, Quarrying, & Extraction | 0 (0.0%) | 0 (0.0%) |
| Construction | 446 (86.1%) | 72 (13.9%) |
| Manufacturing | 193 (60.5%) | 126 (39.5%) |
| Wholesale Trade | 68 (73.9%) | 24 (26.1%) |
| Retail Trade | 517 (48.3%) | 554 (51.7%) |
| Transportation & Warehousing | 193 (76.0%) | 61 (24.0%) |
| Utilities | 21 (31.8%) | 45 (68.2%) |
| Information | 39 (66.1%) | 20 (33.9%) |
| Finance & Insurance | 143 (46.0%) | 168 (54.0%) |
| Real Estate, Rental & Leasing | 130 (72.6%) | 49 (27.4%) |
| Professional & Scientific | 227 (54.6%) | 189 (45.4%) |
| Enterprise Management | 8 (100.0%) | 0 (0.0%) |
| Administrative & Support | 306 (72.5%) | 116 (27.5%) |
| Educational Services | 112 (27.2%) | 300 (72.8%) |
| Health Care & Social Assistance | 110 (14.2%) | 662 (85.8%) |
| Arts, Entertainment & Recreation | 105 (72.9%) | 39 (27.1%) |
| Accommodation & Food Services | 235 (54.3%) | 198 (45.7%) |
| Public Administration | 60 (39.0%) | 94 (61.0%) |
| Total | 3,090 (50.7%) | 3,004 (49.3%) |
Education in West Lealman
School Enrollment in West Lealman
The most common levels of schooling among the 2,134 students in West Lealman are middle school (678 | 31.8%), high school (455 | 21.3%), and college / undergraduate (354 | 16.6%).
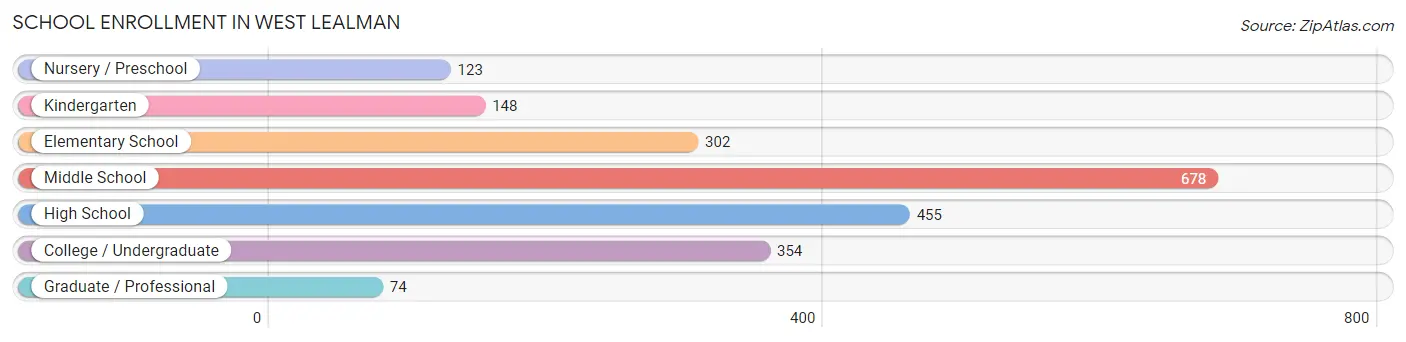
| School Level | # Students | % Students |
| Nursery / Preschool | 123 | 5.8% |
| Kindergarten | 148 | 6.9% |
| Elementary School | 302 | 14.1% |
| Middle School | 678 | 31.8% |
| High School | 455 | 21.3% |
| College / Undergraduate | 354 | 16.6% |
| Graduate / Professional | 74 | 3.5% |
| Total | 2,134 | 100.0% |
School Enrollment by Age by Funding Source in West Lealman
Out of a total of 2,134 students who are enrolled in schools in West Lealman, 346 (16.2%) attend a private institution, while the remaining 1,788 (83.8%) are enrolled in public schools. The age group of 35 years and over has the highest likelihood of being enrolled in private schools, with 80 (55.6% in the age bracket) enrolled. Conversely, the age group of 25 to 34 year olds has the lowest likelihood of being enrolled in a private school, with 84 (100.0% in the age bracket) attending a public institution.
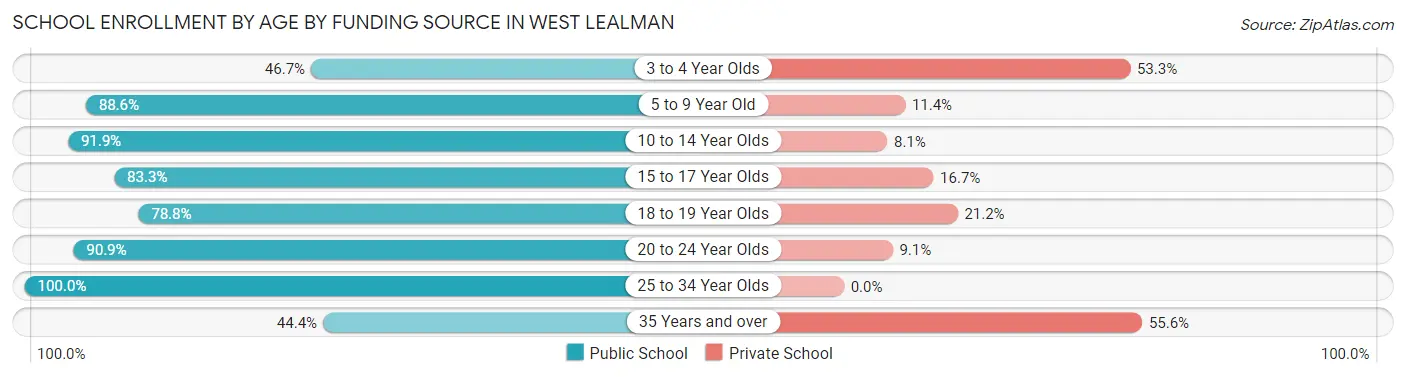
| Age Bracket | Public School | Private School |
| 3 to 4 Year Olds | 49 (46.7%) | 56 (53.3%) |
| 5 to 9 Year Old | 396 (88.6%) | 51 (11.4%) |
| 10 to 14 Year Olds | 637 (91.9%) | 56 (8.1%) |
| 15 to 17 Year Olds | 315 (83.3%) | 63 (16.7%) |
| 18 to 19 Year Olds | 93 (78.8%) | 25 (21.2%) |
| 20 to 24 Year Olds | 150 (90.9%) | 15 (9.1%) |
| 25 to 34 Year Olds | 84 (100.0%) | 0 (0.0%) |
| 35 Years and over | 64 (44.4%) | 80 (55.6%) |
| Total | 1,788 (83.8%) | 346 (16.2%) |
Educational Attainment by Field of Study in West Lealman
Business (556 | 21.8%), education (425 | 16.7%), science & technology (277 | 10.9%), psychology (213 | 8.4%), and arts & humanities (177 | 6.9%) are the most common fields of study among 2,549 individuals in West Lealman who have obtained a bachelor's degree or higher.
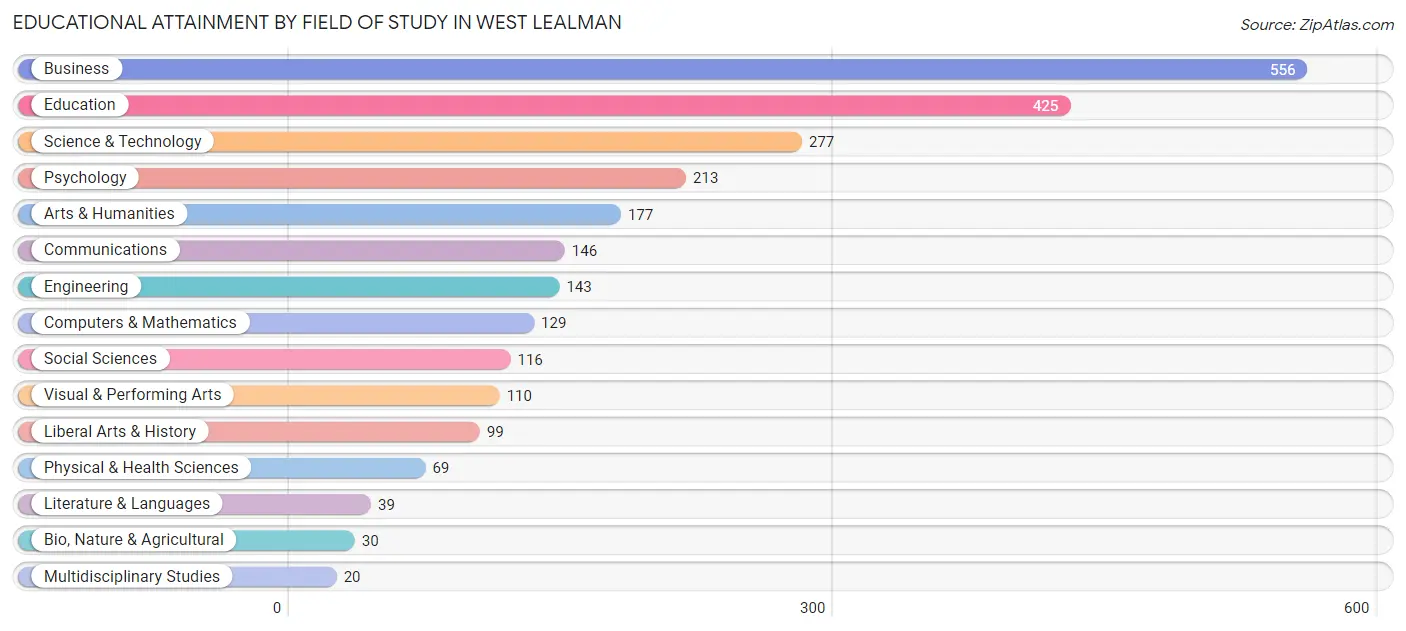
| Field of Study | # Graduates | % Graduates |
| Computers & Mathematics | 129 | 5.1% |
| Bio, Nature & Agricultural | 30 | 1.2% |
| Physical & Health Sciences | 69 | 2.7% |
| Psychology | 213 | 8.4% |
| Social Sciences | 116 | 4.5% |
| Engineering | 143 | 5.6% |
| Multidisciplinary Studies | 20 | 0.8% |
| Science & Technology | 277 | 10.9% |
| Business | 556 | 21.8% |
| Education | 425 | 16.7% |
| Literature & Languages | 39 | 1.5% |
| Liberal Arts & History | 99 | 3.9% |
| Visual & Performing Arts | 110 | 4.3% |
| Communications | 146 | 5.7% |
| Arts & Humanities | 177 | 6.9% |
| Total | 2,549 | 100.0% |
Transportation & Commute in West Lealman
Vehicle Availability by Sex in West Lealman
The most prevalent vehicle ownership categories in West Lealman are males with 2 vehicles (1,106, accounting for 36.6%) and females with 2 vehicles (1,008, making up 37.7%).
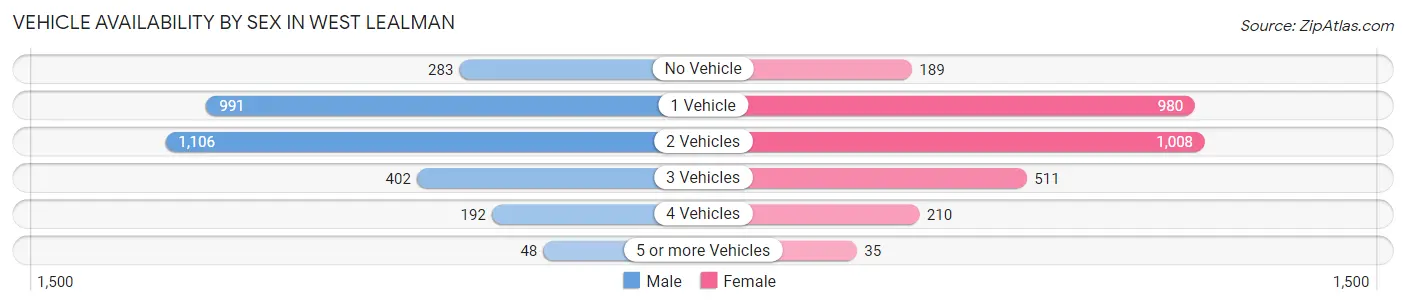
| Vehicles Available | Male | Female |
| No Vehicle | 283 (9.4%) | 189 (6.4%) |
| 1 Vehicle | 991 (32.8%) | 980 (33.4%) |
| 2 Vehicles | 1,106 (36.6%) | 1,008 (34.4%) |
| 3 Vehicles | 402 (13.3%) | 511 (17.4%) |
| 4 Vehicles | 192 (6.4%) | 210 (7.2%) |
| 5 or more Vehicles | 48 (1.6%) | 35 (1.2%) |
| Total | 3,022 (100.0%) | 2,933 (100.0%) |
Commute Time in West Lealman
The most frequently occuring commute durations in West Lealman are 15 to 19 minutes (1,183 commuters, 21.7%), 20 to 24 minutes (891 commuters, 16.3%), and 10 to 14 minutes (706 commuters, 12.9%).
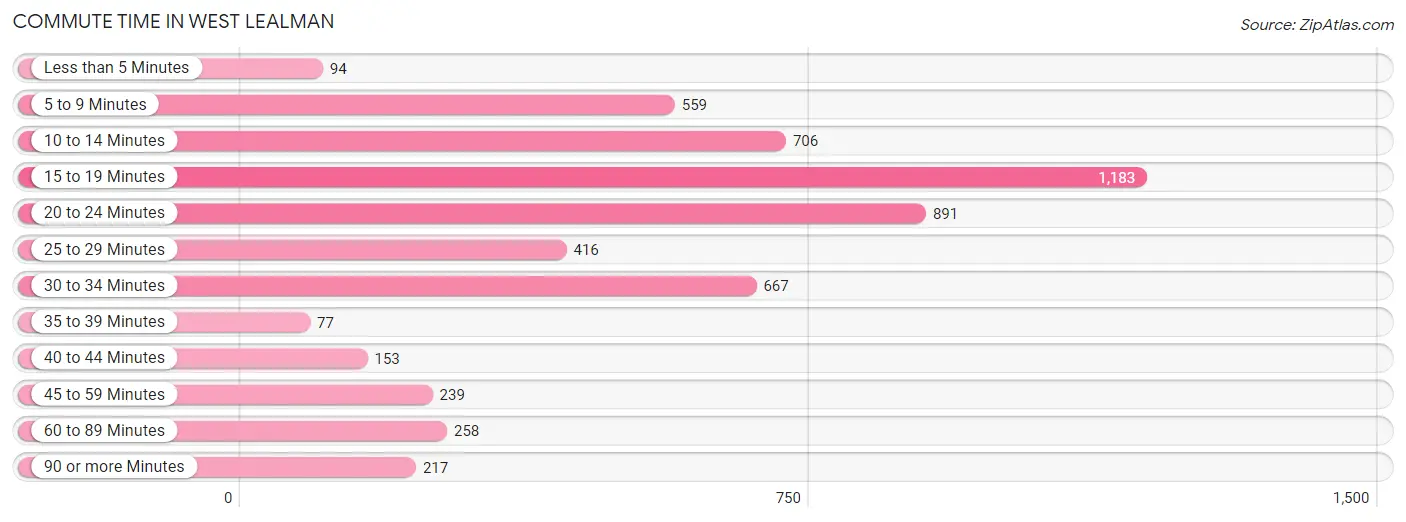
| Commute Time | # Commuters | % Commuters |
| Less than 5 Minutes | 94 | 1.7% |
| 5 to 9 Minutes | 559 | 10.2% |
| 10 to 14 Minutes | 706 | 12.9% |
| 15 to 19 Minutes | 1,183 | 21.7% |
| 20 to 24 Minutes | 891 | 16.3% |
| 25 to 29 Minutes | 416 | 7.6% |
| 30 to 34 Minutes | 667 | 12.2% |
| 35 to 39 Minutes | 77 | 1.4% |
| 40 to 44 Minutes | 153 | 2.8% |
| 45 to 59 Minutes | 239 | 4.4% |
| 60 to 89 Minutes | 258 | 4.7% |
| 90 or more Minutes | 217 | 4.0% |
Commute Time by Sex in West Lealman
The most common commute times in West Lealman are 15 to 19 minutes (648 commuters, 23.0%) for males and 15 to 19 minutes (535 commuters, 20.2%) for females.
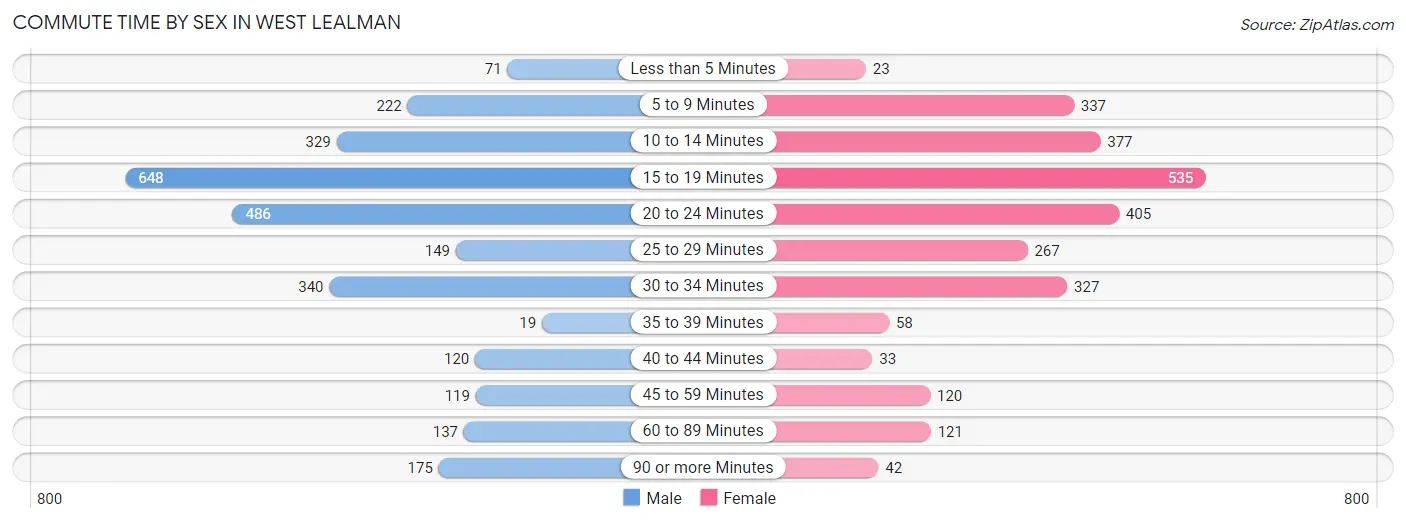
| Commute Time | Male | Female |
| Less than 5 Minutes | 71 (2.5%) | 23 (0.9%) |
| 5 to 9 Minutes | 222 (7.9%) | 337 (12.7%) |
| 10 to 14 Minutes | 329 (11.7%) | 377 (14.2%) |
| 15 to 19 Minutes | 648 (23.0%) | 535 (20.2%) |
| 20 to 24 Minutes | 486 (17.3%) | 405 (15.3%) |
| 25 to 29 Minutes | 149 (5.3%) | 267 (10.1%) |
| 30 to 34 Minutes | 340 (12.1%) | 327 (12.4%) |
| 35 to 39 Minutes | 19 (0.7%) | 58 (2.2%) |
| 40 to 44 Minutes | 120 (4.3%) | 33 (1.3%) |
| 45 to 59 Minutes | 119 (4.2%) | 120 (4.5%) |
| 60 to 89 Minutes | 137 (4.9%) | 121 (4.6%) |
| 90 or more Minutes | 175 (6.2%) | 42 (1.6%) |
Time of Departure to Work by Sex in West Lealman
The most frequent times of departure to work in West Lealman are 7:00 AM to 7:29 AM (397, 14.1%) for males and 7:30 AM to 7:59 AM (526, 19.9%) for females.
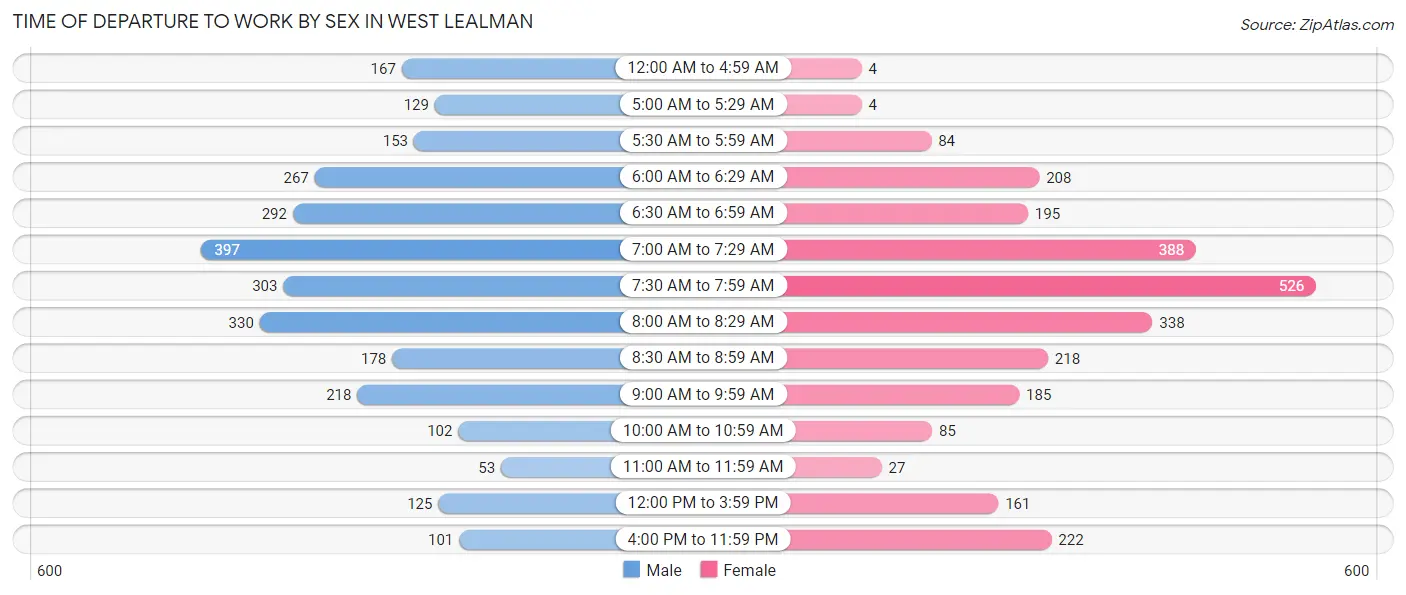
| Time of Departure | Male | Female |
| 12:00 AM to 4:59 AM | 167 (5.9%) | 4 (0.2%) |
| 5:00 AM to 5:29 AM | 129 (4.6%) | 4 (0.2%) |
| 5:30 AM to 5:59 AM | 153 (5.4%) | 84 (3.2%) |
| 6:00 AM to 6:29 AM | 267 (9.5%) | 208 (7.9%) |
| 6:30 AM to 6:59 AM | 292 (10.4%) | 195 (7.4%) |
| 7:00 AM to 7:29 AM | 397 (14.1%) | 388 (14.7%) |
| 7:30 AM to 7:59 AM | 303 (10.8%) | 526 (19.9%) |
| 8:00 AM to 8:29 AM | 330 (11.7%) | 338 (12.8%) |
| 8:30 AM to 8:59 AM | 178 (6.3%) | 218 (8.2%) |
| 9:00 AM to 9:59 AM | 218 (7.7%) | 185 (7.0%) |
| 10:00 AM to 10:59 AM | 102 (3.6%) | 85 (3.2%) |
| 11:00 AM to 11:59 AM | 53 (1.9%) | 27 (1.0%) |
| 12:00 PM to 3:59 PM | 125 (4.4%) | 161 (6.1%) |
| 4:00 PM to 11:59 PM | 101 (3.6%) | 222 (8.4%) |
| Total | 2,815 (100.0%) | 2,645 (100.0%) |
Housing Occupancy in West Lealman
Occupancy by Ownership in West Lealman
Of the total 6,970 dwellings in West Lealman, owner-occupied units account for 5,302 (76.1%), while renter-occupied units make up 1,668 (23.9%).
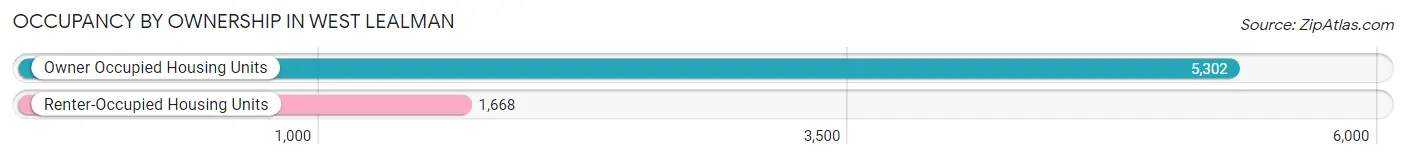
| Occupancy | # Housing Units | % Housing Units |
| Owner Occupied Housing Units | 5,302 | 76.1% |
| Renter-Occupied Housing Units | 1,668 | 23.9% |
| Total Occupied Housing Units | 6,970 | 100.0% |
Occupancy by Household Size in West Lealman
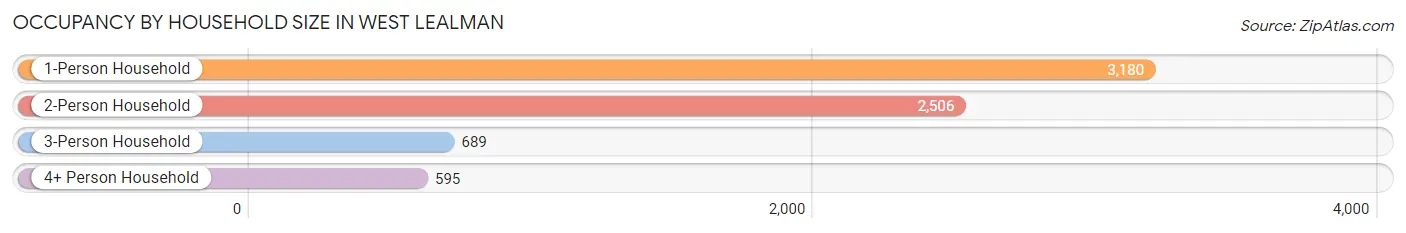
| Household Size | # Housing Units | % Housing Units |
| 1-Person Household | 3,180 | 45.6% |
| 2-Person Household | 2,506 | 35.9% |
| 3-Person Household | 689 | 9.9% |
| 4+ Person Household | 595 | 8.5% |
| Total Housing Units | 6,970 | 100.0% |
Occupancy by Ownership by Household Size in West Lealman
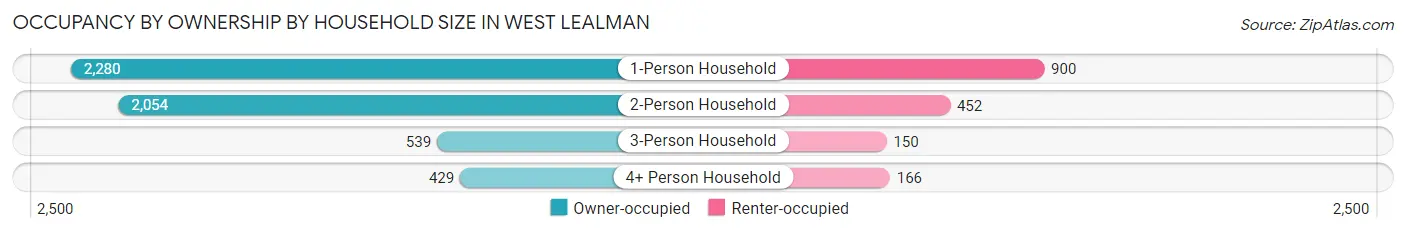
| Household Size | Owner-occupied | Renter-occupied |
| 1-Person Household | 2,280 (71.7%) | 900 (28.3%) |
| 2-Person Household | 2,054 (82.0%) | 452 (18.0%) |
| 3-Person Household | 539 (78.2%) | 150 (21.8%) |
| 4+ Person Household | 429 (72.1%) | 166 (27.9%) |
| Total Housing Units | 5,302 (76.1%) | 1,668 (23.9%) |
Occupancy by Educational Attainment in West Lealman
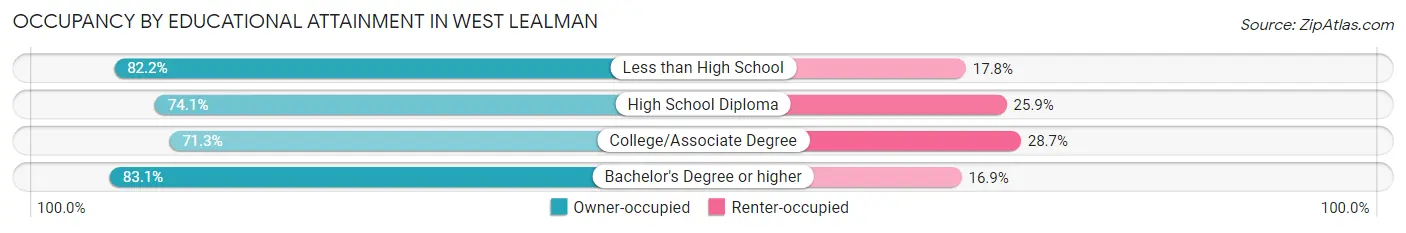
| Household Size | Owner-occupied | Renter-occupied |
| Less than High School | 541 (82.2%) | 117 (17.8%) |
| High School Diploma | 1,846 (74.1%) | 644 (25.9%) |
| College/Associate Degree | 1,579 (71.3%) | 635 (28.7%) |
| Bachelor's Degree or higher | 1,336 (83.1%) | 272 (16.9%) |
Occupancy by Age of Householder in West Lealman
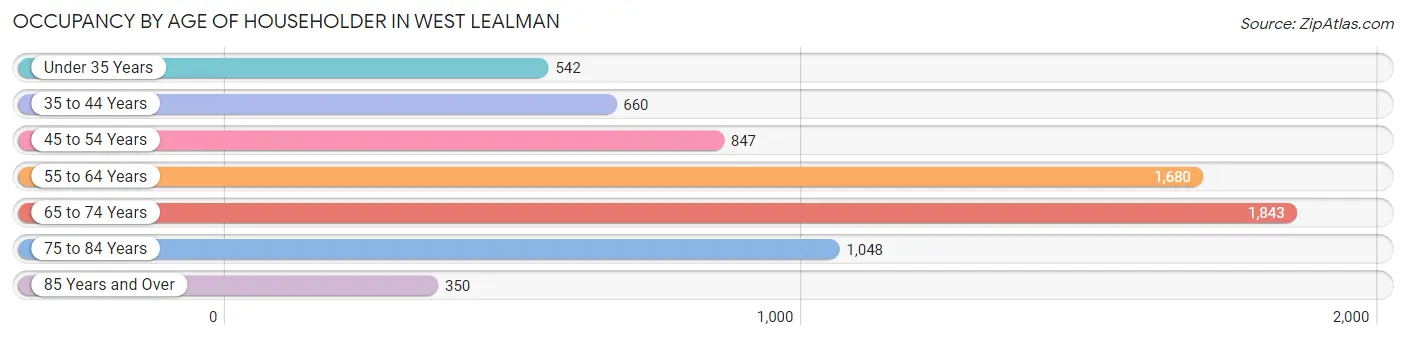
| Age Bracket | # Households | % Households |
| Under 35 Years | 542 | 7.8% |
| 35 to 44 Years | 660 | 9.5% |
| 45 to 54 Years | 847 | 12.1% |
| 55 to 64 Years | 1,680 | 24.1% |
| 65 to 74 Years | 1,843 | 26.4% |
| 75 to 84 Years | 1,048 | 15.0% |
| 85 Years and Over | 350 | 5.0% |
| Total | 6,970 | 100.0% |
Housing Finances in West Lealman
Median Income by Occupancy in West Lealman
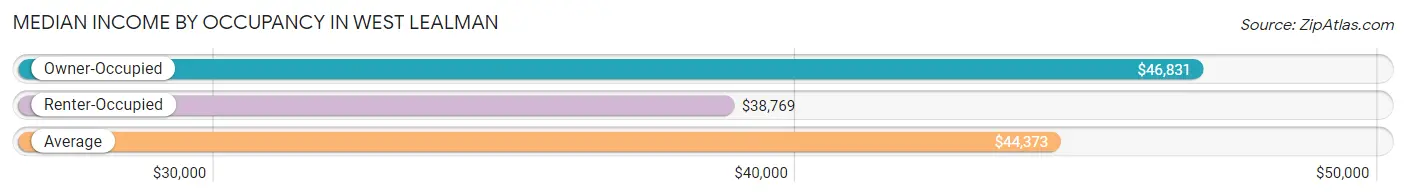
| Occupancy Type | # Households | Median Income |
| Owner-Occupied | 5,302 (76.1%) | $46,831 |
| Renter-Occupied | 1,668 (23.9%) | $38,769 |
| Average | 6,970 (100.0%) | $44,373 |
Occupancy by Householder Income Bracket in West Lealman
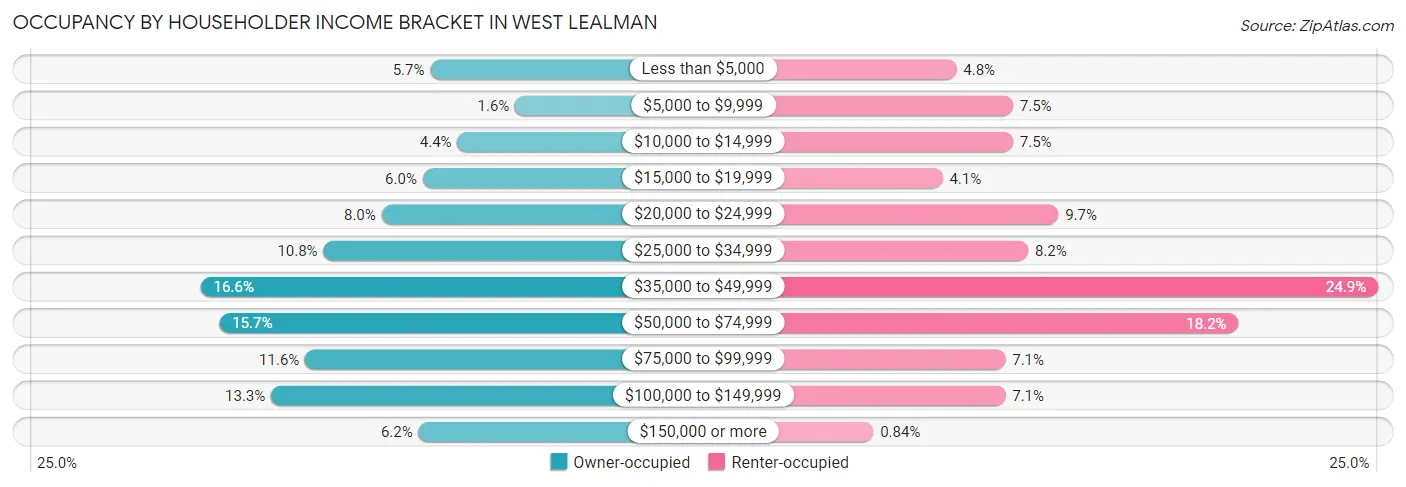
| Income Bracket | Owner-occupied | Renter-occupied |
| Less than $5,000 | 301 (5.7%) | 80 (4.8%) |
| $5,000 to $9,999 | 87 (1.6%) | 125 (7.5%) |
| $10,000 to $14,999 | 233 (4.4%) | 125 (7.5%) |
| $15,000 to $19,999 | 320 (6.0%) | 69 (4.1%) |
| $20,000 to $24,999 | 424 (8.0%) | 161 (9.7%) |
| $25,000 to $34,999 | 571 (10.8%) | 137 (8.2%) |
| $35,000 to $49,999 | 881 (16.6%) | 415 (24.9%) |
| $50,000 to $74,999 | 834 (15.7%) | 304 (18.2%) |
| $75,000 to $99,999 | 617 (11.6%) | 119 (7.1%) |
| $100,000 to $149,999 | 703 (13.3%) | 119 (7.1%) |
| $150,000 or more | 331 (6.2%) | 14 (0.8%) |
| Total | 5,302 (100.0%) | 1,668 (100.0%) |
Monthly Housing Cost Tiers in West Lealman
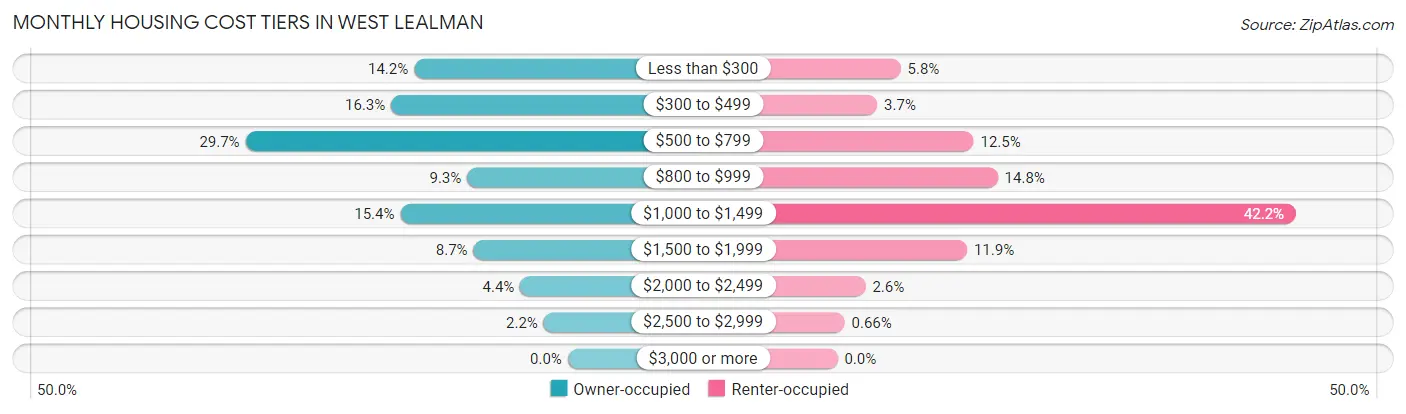
| Monthly Cost | Owner-occupied | Renter-occupied |
| Less than $300 | 750 (14.1%) | 97 (5.8%) |
| $300 to $499 | 862 (16.3%) | 61 (3.7%) |
| $500 to $799 | 1,573 (29.7%) | 209 (12.5%) |
| $800 to $999 | 491 (9.3%) | 246 (14.7%) |
| $1,000 to $1,499 | 817 (15.4%) | 704 (42.2%) |
| $1,500 to $1,999 | 460 (8.7%) | 199 (11.9%) |
| $2,000 to $2,499 | 232 (4.4%) | 43 (2.6%) |
| $2,500 to $2,999 | 117 (2.2%) | 11 (0.7%) |
| $3,000 or more | 0 (0.0%) | 0 (0.0%) |
| Total | 5,302 (100.0%) | 1,668 (100.0%) |
Physical Housing Characteristics in West Lealman
Housing Structures in West Lealman
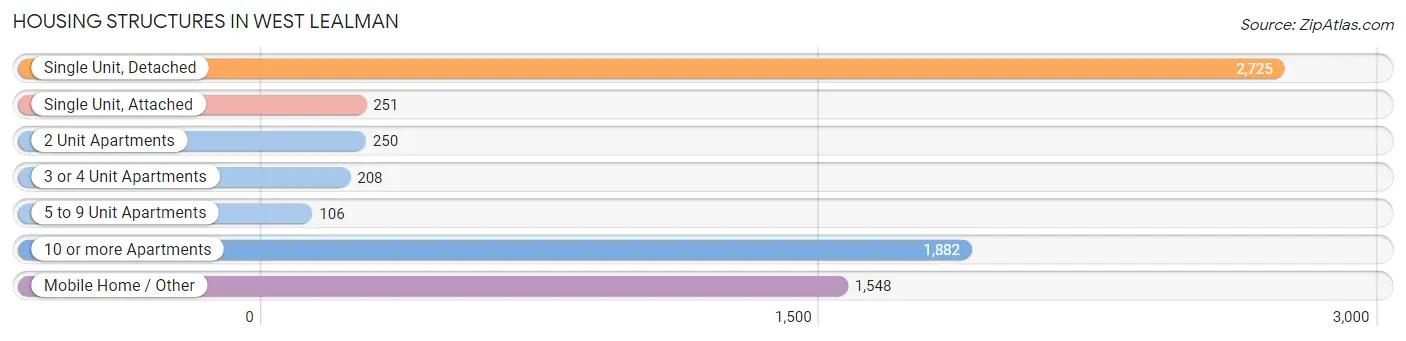
| Structure Type | # Housing Units | % Housing Units |
| Single Unit, Detached | 2,725 | 39.1% |
| Single Unit, Attached | 251 | 3.6% |
| 2 Unit Apartments | 250 | 3.6% |
| 3 or 4 Unit Apartments | 208 | 3.0% |
| 5 to 9 Unit Apartments | 106 | 1.5% |
| 10 or more Apartments | 1,882 | 27.0% |
| Mobile Home / Other | 1,548 | 22.2% |
| Total | 6,970 | 100.0% |
Housing Structures by Occupancy in West Lealman
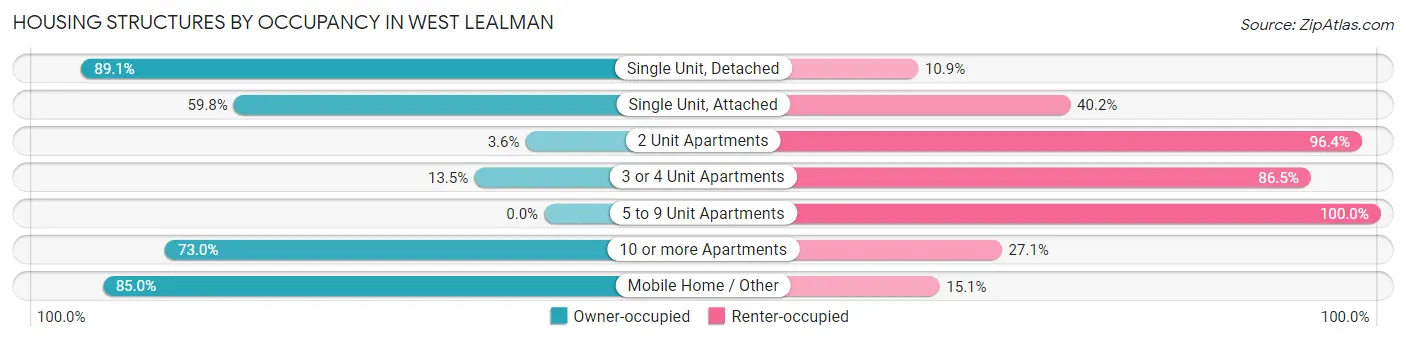
| Structure Type | Owner-occupied | Renter-occupied |
| Single Unit, Detached | 2,427 (89.1%) | 298 (10.9%) |
| Single Unit, Attached | 150 (59.8%) | 101 (40.2%) |
| 2 Unit Apartments | 9 (3.6%) | 241 (96.4%) |
| 3 or 4 Unit Apartments | 28 (13.5%) | 180 (86.5%) |
| 5 to 9 Unit Apartments | 0 (0.0%) | 106 (100.0%) |
| 10 or more Apartments | 1,373 (73.0%) | 509 (27.1%) |
| Mobile Home / Other | 1,315 (85.0%) | 233 (15.0%) |
| Total | 5,302 (76.1%) | 1,668 (23.9%) |
Housing Structures by Number of Rooms in West Lealman
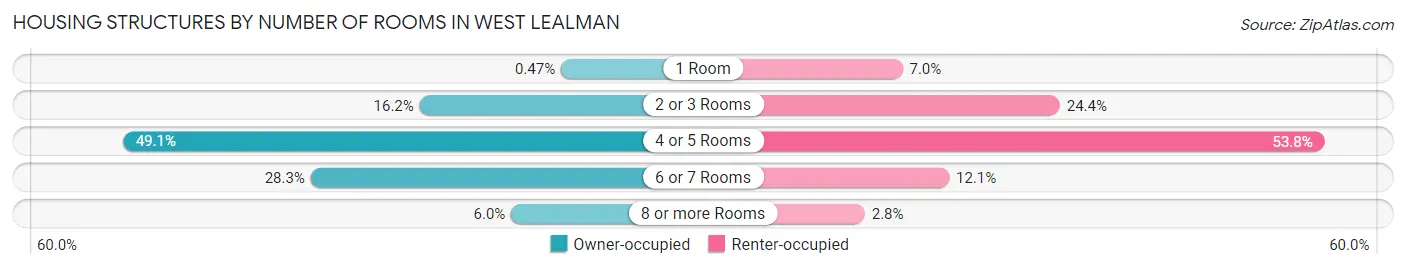
| Number of Rooms | Owner-occupied | Renter-occupied |
| 1 Room | 25 (0.5%) | 116 (7.0%) |
| 2 or 3 Rooms | 857 (16.2%) | 407 (24.4%) |
| 4 or 5 Rooms | 2,604 (49.1%) | 897 (53.8%) |
| 6 or 7 Rooms | 1,498 (28.2%) | 202 (12.1%) |
| 8 or more Rooms | 318 (6.0%) | 46 (2.8%) |
| Total | 5,302 (100.0%) | 1,668 (100.0%) |
Housing Structure by Heating Type in West Lealman
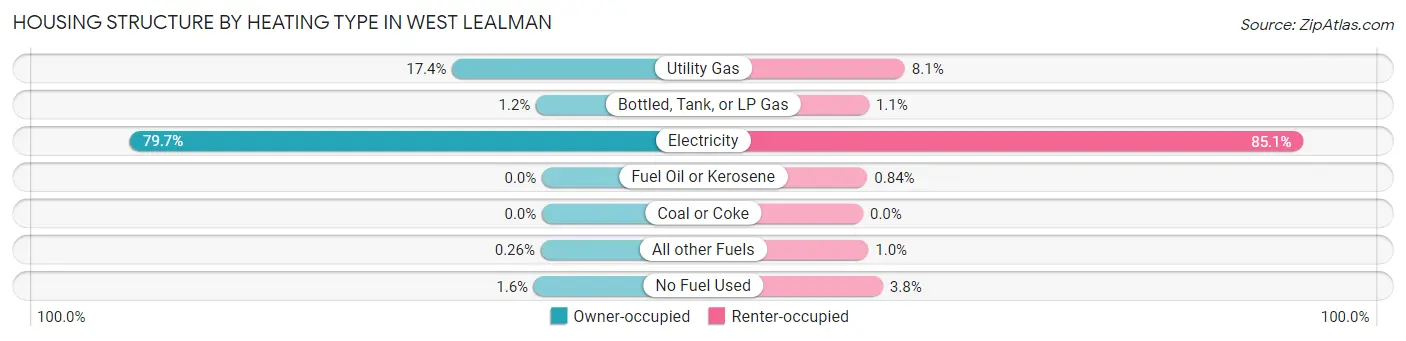
| Heating Type | Owner-occupied | Renter-occupied |
| Utility Gas | 920 (17.3%) | 135 (8.1%) |
| Bottled, Tank, or LP Gas | 61 (1.1%) | 19 (1.1%) |
| Electricity | 4,223 (79.6%) | 1,419 (85.1%) |
| Fuel Oil or Kerosene | 0 (0.0%) | 14 (0.8%) |
| Coal or Coke | 0 (0.0%) | 0 (0.0%) |
| All other Fuels | 14 (0.3%) | 17 (1.0%) |
| No Fuel Used | 84 (1.6%) | 64 (3.8%) |
| Total | 5,302 (100.0%) | 1,668 (100.0%) |
Household Vehicle Usage in West Lealman
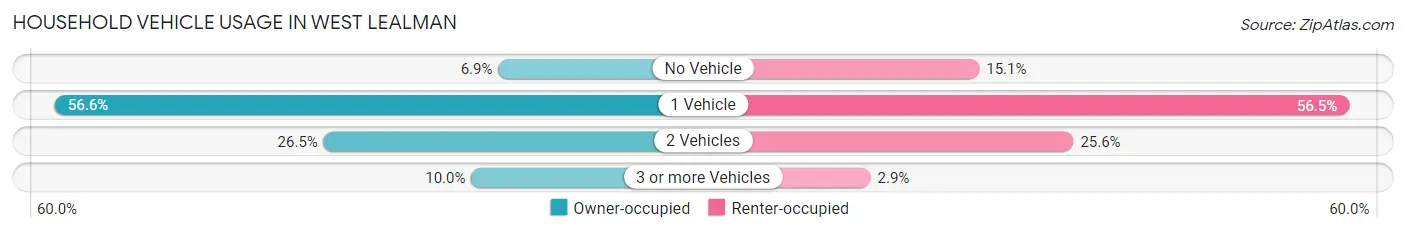
| Vehicles per Household | Owner-occupied | Renter-occupied |
| No Vehicle | 368 (6.9%) | 251 (15.0%) |
| 1 Vehicle | 3,001 (56.6%) | 942 (56.5%) |
| 2 Vehicles | 1,405 (26.5%) | 427 (25.6%) |
| 3 or more Vehicles | 528 (10.0%) | 48 (2.9%) |
| Total | 5,302 (100.0%) | 1,668 (100.0%) |
Real Estate & Mortgages in West Lealman
Real Estate and Mortgage Overview in West Lealman
| Characteristic | Without Mortgage | With Mortgage |
| Housing Units | 3,294 | 2,008 |
| Median Property Value | $102,300 | $215,700 |
| Median Household Income | $35,168 | $173 |
| Monthly Housing Costs | $519 | $0 |
| Real Estate Taxes | $978 | $92 |
Property Value by Mortgage Status in West Lealman
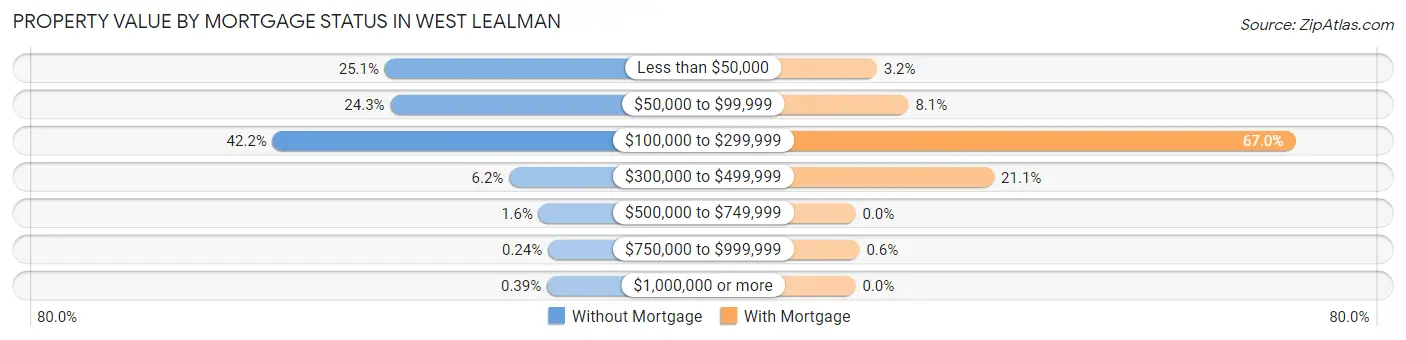
| Property Value | Without Mortgage | With Mortgage |
| Less than $50,000 | 827 (25.1%) | 65 (3.2%) |
| $50,000 to $99,999 | 799 (24.3%) | 162 (8.1%) |
| $100,000 to $299,999 | 1,390 (42.2%) | 1,345 (67.0%) |
| $300,000 to $499,999 | 203 (6.2%) | 424 (21.1%) |
| $500,000 to $749,999 | 54 (1.6%) | 0 (0.0%) |
| $750,000 to $999,999 | 8 (0.2%) | 12 (0.6%) |
| $1,000,000 or more | 13 (0.4%) | 0 (0.0%) |
| Total | 3,294 (100.0%) | 2,008 (100.0%) |
Household Income by Mortgage Status in West Lealman
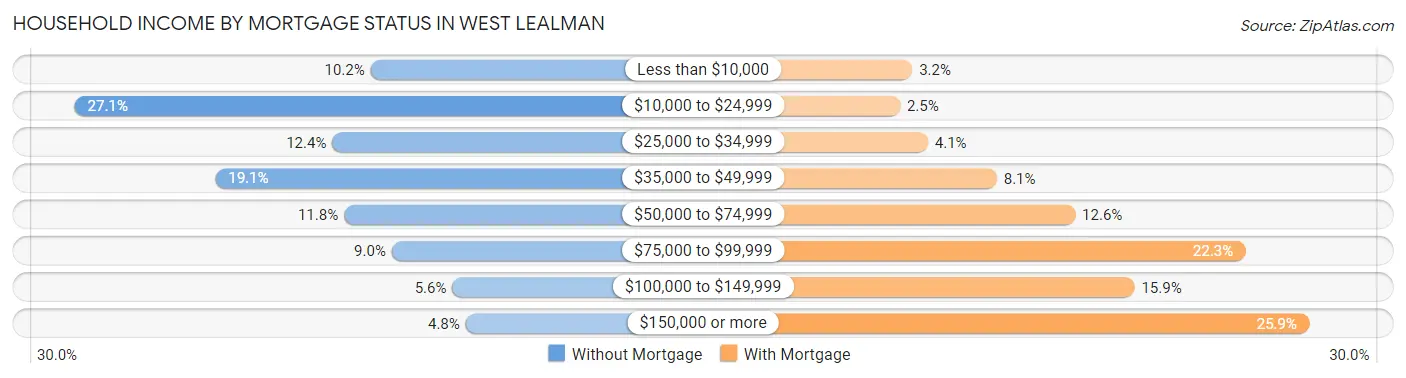
| Household Income | Without Mortgage | With Mortgage |
| Less than $10,000 | 337 (10.2%) | 65 (3.2%) |
| $10,000 to $24,999 | 894 (27.1%) | 51 (2.5%) |
| $25,000 to $34,999 | 409 (12.4%) | 83 (4.1%) |
| $35,000 to $49,999 | 629 (19.1%) | 162 (8.1%) |
| $50,000 to $74,999 | 387 (11.7%) | 252 (12.6%) |
| $75,000 to $99,999 | 297 (9.0%) | 447 (22.3%) |
| $100,000 to $149,999 | 183 (5.6%) | 320 (15.9%) |
| $150,000 or more | 158 (4.8%) | 520 (25.9%) |
| Total | 3,294 (100.0%) | 2,008 (100.0%) |
Property Value to Household Income Ratio in West Lealman
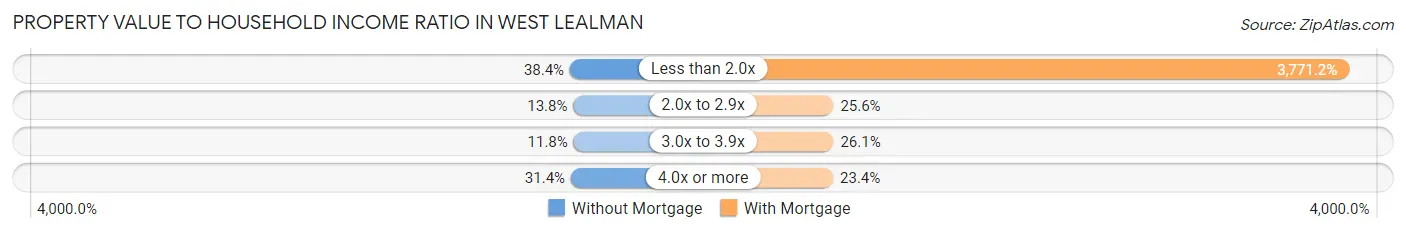
| Value-to-Income Ratio | Without Mortgage | With Mortgage |
| Less than 2.0x | 1,266 (38.4%) | 75,726 (3,771.2%) |
| 2.0x to 2.9x | 456 (13.8%) | 514 (25.6%) |
| 3.0x to 3.9x | 387 (11.7%) | 523 (26.1%) |
| 4.0x or more | 1,033 (31.4%) | 470 (23.4%) |
| Total | 3,294 (100.0%) | 2,008 (100.0%) |
Real Estate Taxes by Mortgage Status in West Lealman
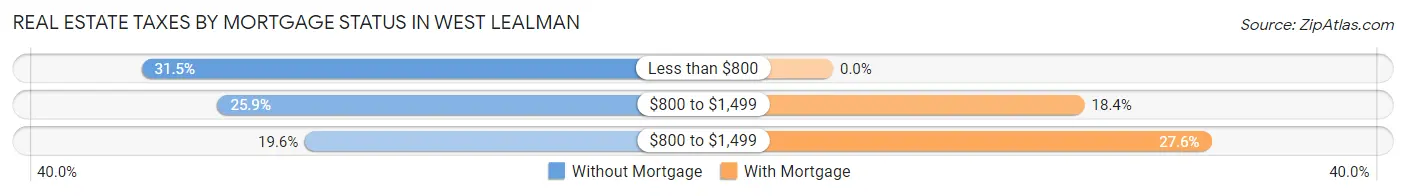
| Property Taxes | Without Mortgage | With Mortgage |
| Less than $800 | 1,036 (31.5%) | 0 (0.0%) |
| $800 to $1,499 | 853 (25.9%) | 369 (18.4%) |
| $800 to $1,499 | 645 (19.6%) | 555 (27.6%) |
| Total | 3,294 (100.0%) | 2,008 (100.0%) |
Health & Disability in West Lealman
Health Insurance Coverage by Age in West Lealman
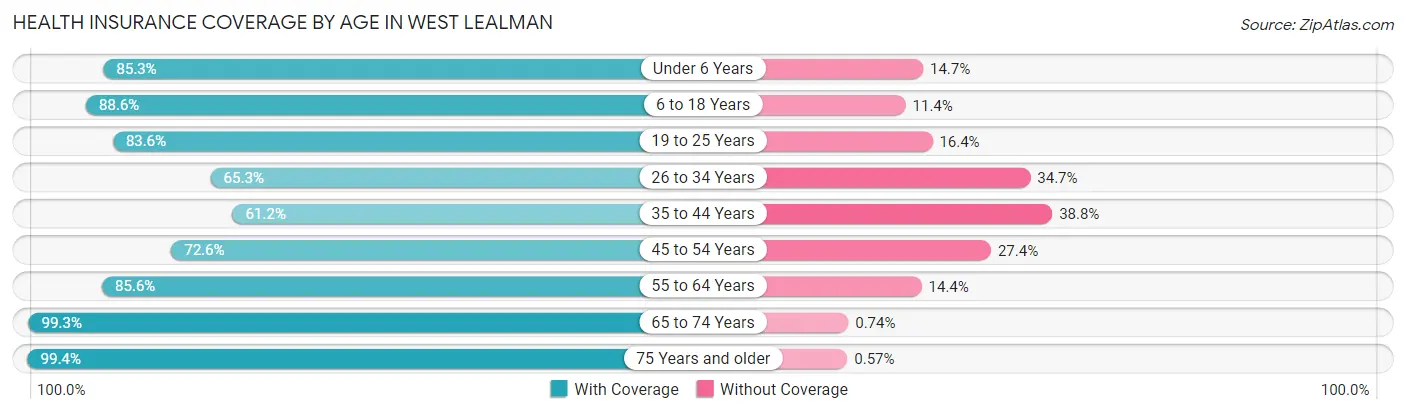
| Age Bracket | With Coverage | Without Coverage |
| Under 6 Years | 418 (85.3%) | 72 (14.7%) |
| 6 to 18 Years | 1,362 (88.6%) | 176 (11.4%) |
| 19 to 25 Years | 554 (83.6%) | 109 (16.4%) |
| 26 to 34 Years | 715 (65.3%) | 380 (34.7%) |
| 35 to 44 Years | 774 (61.2%) | 490 (38.8%) |
| 45 to 54 Years | 1,229 (72.6%) | 463 (27.4%) |
| 55 to 64 Years | 2,392 (85.6%) | 403 (14.4%) |
| 65 to 74 Years | 2,534 (99.3%) | 19 (0.7%) |
| 75 Years and older | 2,090 (99.4%) | 12 (0.6%) |
| Total | 12,068 (85.0%) | 2,124 (15.0%) |
Health Insurance Coverage by Citizenship Status in West Lealman
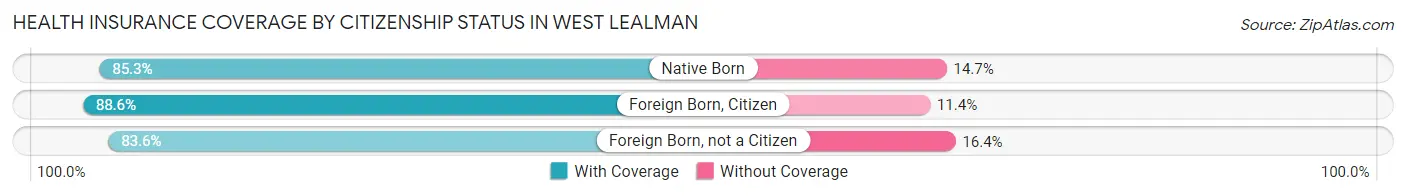
| Citizenship Status | With Coverage | Without Coverage |
| Native Born | 418 (85.3%) | 72 (14.7%) |
| Foreign Born, Citizen | 1,362 (88.6%) | 176 (11.4%) |
| Foreign Born, not a Citizen | 554 (83.6%) | 109 (16.4%) |
Health Insurance Coverage by Household Income in West Lealman
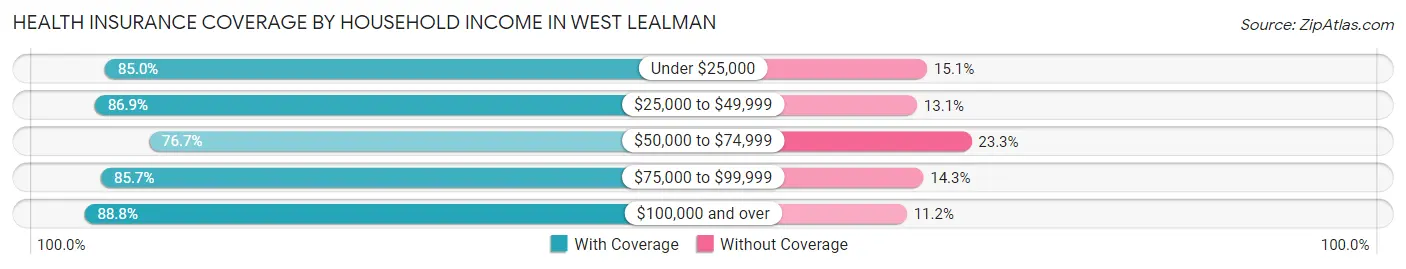
| Household Income | With Coverage | Without Coverage |
| Under $25,000 | 2,253 (85.0%) | 399 (15.0%) |
| $25,000 to $49,999 | 3,013 (86.9%) | 456 (13.1%) |
| $50,000 to $74,999 | 1,892 (76.7%) | 576 (23.3%) |
| $75,000 to $99,999 | 1,738 (85.7%) | 291 (14.3%) |
| $100,000 and over | 3,153 (88.8%) | 399 (11.2%) |
Public vs Private Health Insurance Coverage by Age in West Lealman
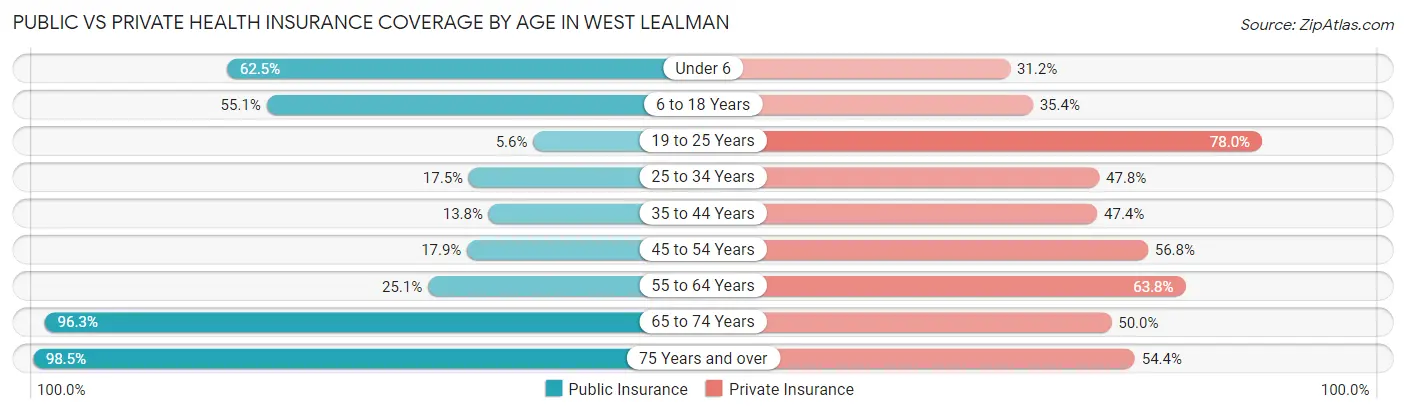
| Age Bracket | Public Insurance | Private Insurance |
| Under 6 | 306 (62.5%) | 153 (31.2%) |
| 6 to 18 Years | 847 (55.1%) | 545 (35.4%) |
| 19 to 25 Years | 37 (5.6%) | 517 (78.0%) |
| 25 to 34 Years | 192 (17.5%) | 523 (47.8%) |
| 35 to 44 Years | 175 (13.8%) | 599 (47.4%) |
| 45 to 54 Years | 302 (17.8%) | 961 (56.8%) |
| 55 to 64 Years | 702 (25.1%) | 1,782 (63.8%) |
| 65 to 74 Years | 2,458 (96.3%) | 1,277 (50.0%) |
| 75 Years and over | 2,070 (98.5%) | 1,143 (54.4%) |
| Total | 7,089 (49.9%) | 7,500 (52.8%) |
Disability Status by Sex by Age in West Lealman
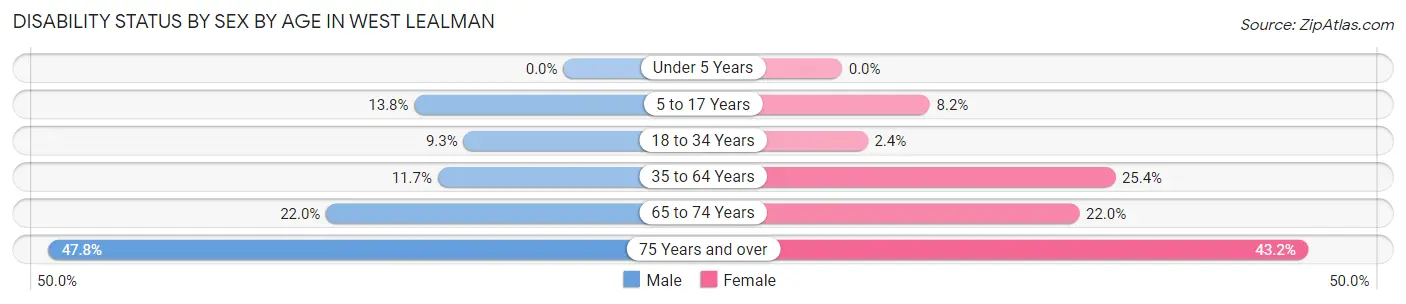
| Age Bracket | Male | Female |
| Under 5 Years | 0 (0.0%) | 0 (0.0%) |
| 5 to 17 Years | 121 (13.8%) | 53 (8.2%) |
| 18 to 34 Years | 83 (9.3%) | 24 (2.4%) |
| 35 to 64 Years | 322 (11.7%) | 758 (25.4%) |
| 65 to 74 Years | 250 (22.0%) | 312 (22.0%) |
| 75 Years and over | 468 (47.8%) | 485 (43.2%) |
Disability Class by Sex by Age in West Lealman
Disability Class: Hearing Difficulty
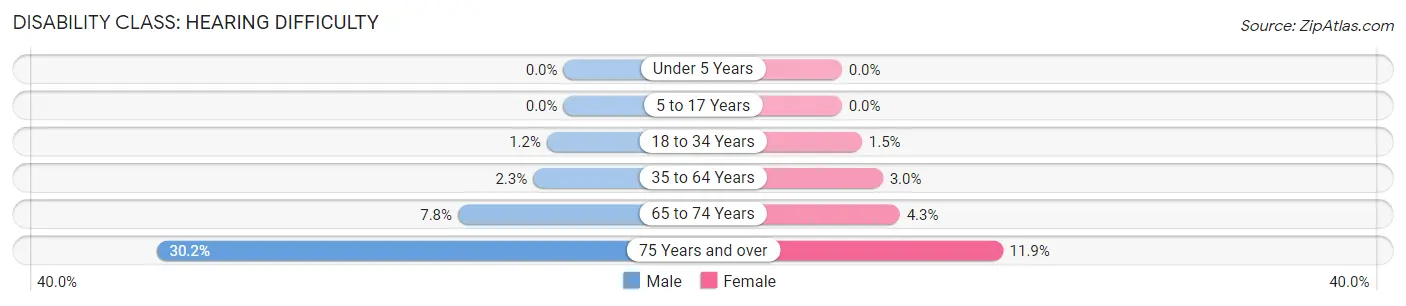
| Age Bracket | Male | Female |
| Under 5 Years | 0 (0.0%) | 0 (0.0%) |
| 5 to 17 Years | 0 (0.0%) | 0 (0.0%) |
| 18 to 34 Years | 11 (1.2%) | 15 (1.5%) |
| 35 to 64 Years | 62 (2.2%) | 91 (3.0%) |
| 65 to 74 Years | 89 (7.8%) | 61 (4.3%) |
| 75 Years and over | 296 (30.2%) | 134 (11.9%) |
Disability Class: Vision Difficulty
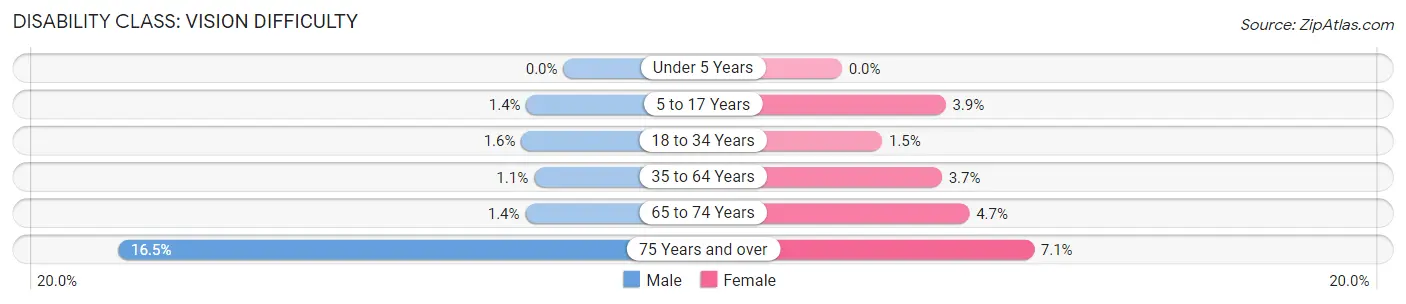
| Age Bracket | Male | Female |
| Under 5 Years | 0 (0.0%) | 0 (0.0%) |
| 5 to 17 Years | 12 (1.4%) | 25 (3.8%) |
| 18 to 34 Years | 14 (1.6%) | 15 (1.5%) |
| 35 to 64 Years | 30 (1.1%) | 111 (3.7%) |
| 65 to 74 Years | 16 (1.4%) | 67 (4.7%) |
| 75 Years and over | 162 (16.5%) | 80 (7.1%) |
Disability Class: Cognitive Difficulty
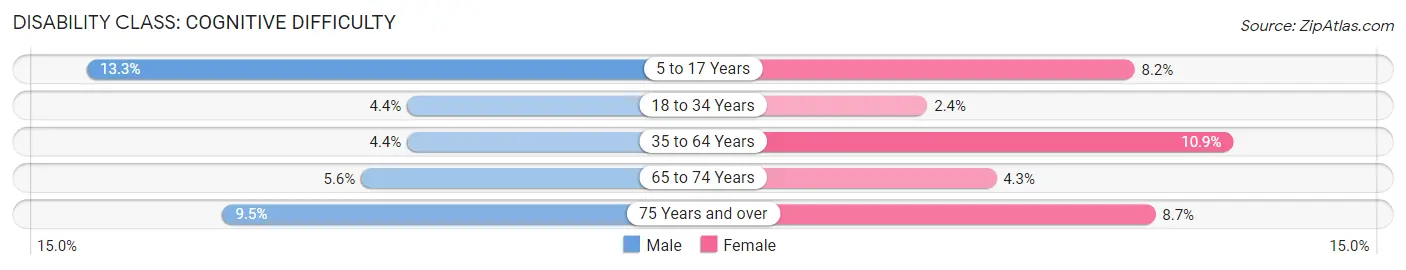
| Age Bracket | Male | Female |
| 5 to 17 Years | 116 (13.3%) | 53 (8.2%) |
| 18 to 34 Years | 39 (4.3%) | 24 (2.4%) |
| 35 to 64 Years | 120 (4.3%) | 326 (10.9%) |
| 65 to 74 Years | 64 (5.6%) | 61 (4.3%) |
| 75 Years and over | 93 (9.5%) | 98 (8.7%) |
Disability Class: Ambulatory Difficulty
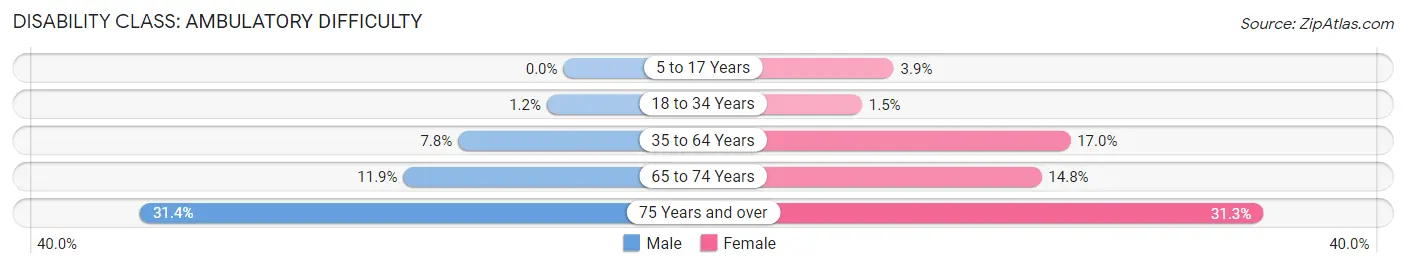
| Age Bracket | Male | Female |
| 5 to 17 Years | 0 (0.0%) | 25 (3.8%) |
| 18 to 34 Years | 11 (1.2%) | 15 (1.5%) |
| 35 to 64 Years | 216 (7.8%) | 507 (17.0%) |
| 65 to 74 Years | 135 (11.9%) | 210 (14.8%) |
| 75 Years and over | 308 (31.4%) | 351 (31.3%) |
Disability Class: Self-Care Difficulty
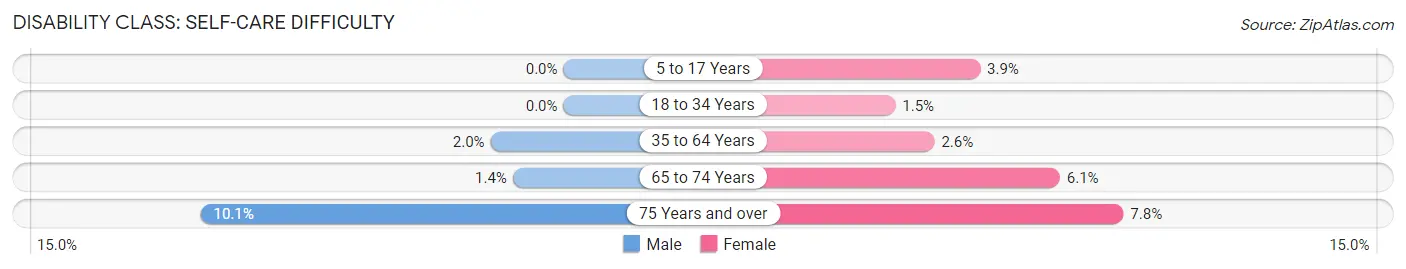
| Age Bracket | Male | Female |
| 5 to 17 Years | 0 (0.0%) | 25 (3.8%) |
| 18 to 34 Years | 0 (0.0%) | 15 (1.5%) |
| 35 to 64 Years | 56 (2.0%) | 77 (2.6%) |
| 65 to 74 Years | 16 (1.4%) | 86 (6.1%) |
| 75 Years and over | 99 (10.1%) | 88 (7.8%) |
Technology Access in West Lealman
Computing Device Access in West Lealman
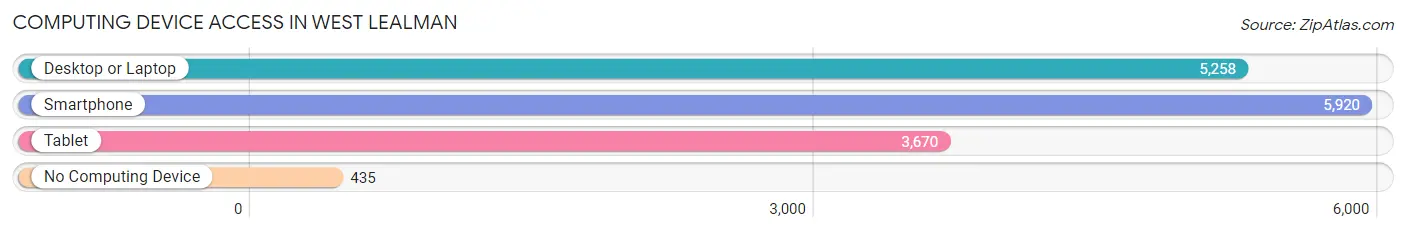
| Device Type | # Households | % Households |
| Desktop or Laptop | 5,258 | 75.4% |
| Smartphone | 5,920 | 84.9% |
| Tablet | 3,670 | 52.6% |
| No Computing Device | 435 | 6.2% |
| Total | 6,970 | 100.0% |
Internet Access in West Lealman
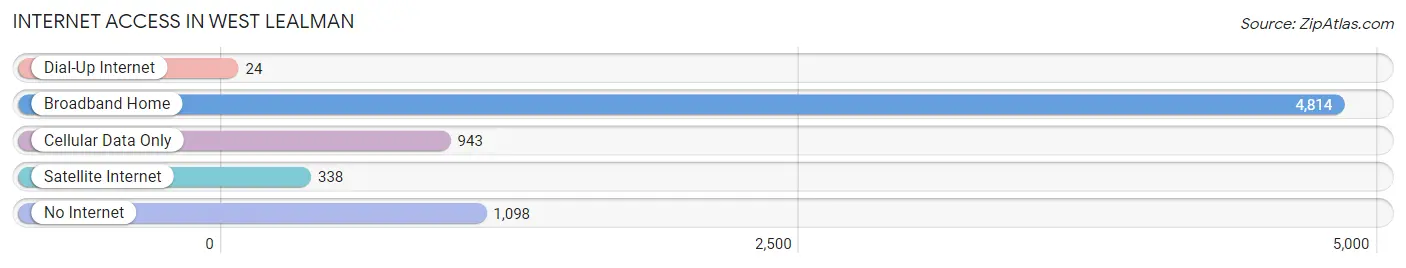
| Internet Type | # Households | % Households |
| Dial-Up Internet | 24 | 0.3% |
| Broadband Home | 4,814 | 69.1% |
| Cellular Data Only | 943 | 13.5% |
| Satellite Internet | 338 | 4.9% |
| No Internet | 1,098 | 15.8% |
| Total | 6,970 | 100.0% |
West Lealman Summary
West Lealman is an unincorporated census-designated place located in Pinellas County, Florida. It is located just north of St. Petersburg and is part of the Tampa Bay Area. The population was estimated to be 16,845 in 2019.
History
West Lealman was originally part of the Lealman area, which was settled in the late 19th century by settlers from the British Isles. The area was named after the Lealman family, who were among the first settlers. The area was originally a farming community, but in the early 20th century, it began to develop into a residential area.
In the 1950s, the area was annexed by the City of St. Petersburg, and the name was changed to West Lealman. The area was then developed into a residential neighborhood, with many homes being built in the 1950s and 1960s.
Geography
West Lealman is located in Pinellas County, Florida, just north of St. Petersburg. It is bordered by the cities of St. Petersburg, Kenneth City, and Pinellas Park. The area is located on the Gulf Coast of Florida, and is part of the Tampa Bay Area.
The area is mostly flat, with some low hills in the northern part of the area. The area is mostly residential, with some commercial and industrial areas.
Economy
West Lealman is primarily a residential area, with some commercial and industrial areas. The area is home to several small businesses, including restaurants, retail stores, and professional services.
The area is also home to several large employers, including Bayfront Health St. Petersburg, BayCare Health System, and Pinellas County Schools.
Demographics
As of the 2019 census, the population of West Lealman was estimated to be 16,845. The population is mostly white (77.3%), with smaller percentages of African American (14.2%), Hispanic (4.7%), and Asian (2.7%) residents.
The median household income in West Lealman is $45,845, and the median home value is $164,400. The area has a high rate of homeownership, with 73.3% of residents owning their homes.
Conclusion
West Lealman is an unincorporated census-designated place located in Pinellas County, Florida. It is located just north of St. Petersburg and is part of the Tampa Bay Area. The area is mostly residential, with some commercial and industrial areas. The population is mostly white, with smaller percentages of African American, Hispanic, and Asian residents. The median household income in West Lealman is $45,845, and the median home value is $164,400. The area has a high rate of homeownership, with 73.3% of residents owning their homes.
Common Questions
What is Per Capita Income in West Lealman?
Per Capita income in West Lealman is $31,121.
What is the Median Family Income in West Lealman?
Median Family Income in West Lealman is $65,298.
What is the Median Household income in West Lealman?
Median Household Income in West Lealman is $44,373.
What is Income or Wage Gap in West Lealman?
Income or Wage Gap in West Lealman is 17.5%.
Women in West Lealman earn 82.5 cents for every dollar earned by a man.
What is Family Income Deficit in West Lealman?
Family Income Deficit in West Lealman is $10,909.
Families that are below poverty line in West Lealman earn $10,909 less on average than the poverty threshold level.
What is Inequality or Gini Index in West Lealman?
Inequality or Gini Index in West Lealman is 0.46.
What is the Total Population of West Lealman?
Total Population of West Lealman is 14,277.
What is the Total Male Population of West Lealman?
Total Male Population of West Lealman is 6,892.
What is the Total Female Population of West Lealman?
Total Female Population of West Lealman is 7,385.
What is the Ratio of Males per 100 Females in West Lealman?
There are 93.32 Males per 100 Females in West Lealman.
What is the Ratio of Females per 100 Males in West Lealman?
There are 107.15 Females per 100 Males in West Lealman.
What is the Median Population Age in West Lealman?
Median Population Age in West Lealman is 56.0 Years.
What is the Average Family Size in West Lealman
Average Family Size in West Lealman is 2.9 People.
What is the Average Household Size in West Lealman
Average Household Size in West Lealman is 2.0 People.
How Large is the Labor Force in West Lealman?
There are 6,445 People in the Labor Forcein in West Lealman.
What is the Percentage of People in the Labor Force in West Lealman?
51.2% of People are in the Labor Force in West Lealman.
What is the Unemployment Rate in West Lealman?
Unemployment Rate in West Lealman is 5.4%.