Brent, FL Map & Demographics
Brent Map
Brent Overview
$18,963
PER CAPITA INCOME
$52,443
AVG FAMILY INCOME
$44,053
AVG HOUSEHOLD INCOME
6.7%
WAGE / INCOME GAP [ % ]
93.3¢/ $1
WAGE / INCOME GAP [ $ ]
$13,883
FAMILY INCOME DEFICIT
0.42
INEQUALITY / GINI INDEX
22,969
TOTAL POPULATION
12,107
MALE POPULATION
10,862
FEMALE POPULATION
111.46
MALES / 100 FEMALES
89.72
FEMALES / 100 MALES
25.5
MEDIAN AGE
3.3
AVG FAMILY SIZE
2.4
AVG HOUSEHOLD SIZE
11,030
LABOR FORCE [ PEOPLE ]
60.1%
PERCENT IN LABOR FORCE
6.6%
UNEMPLOYMENT RATE
Income in Brent
Income Overview in Brent
Per Capita Income in Brent is $18,963, while median incomes of families and households are $52,443 and $44,053 respectively.
| Characteristic | Number | Measure |
| Per Capita Income | 22,969 | $18,963 |
| Median Family Income | 4,166 | $52,443 |
| Mean Family Income | 4,166 | $60,724 |
| Median Household Income | 7,372 | $44,053 |
| Mean Household Income | 7,372 | $53,291 |
| Income Deficit | 4,166 | $13,883 |
| Wage / Income Gap (%) | 22,969 | 6.67% |
| Wage / Income Gap ($) | 22,969 | 93.33¢ per $1 |
| Gini / Inequality Index | 22,969 | 0.42 |
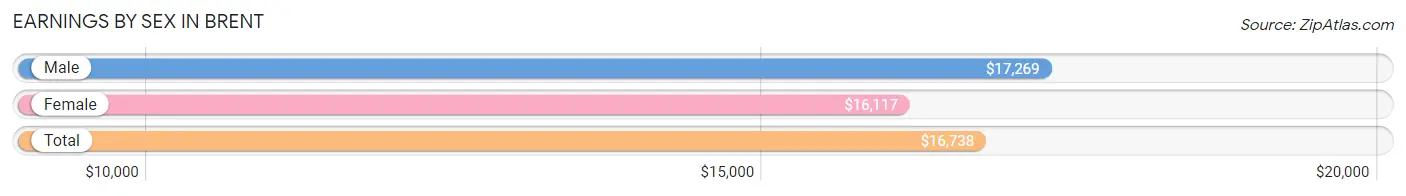
Earnings by Sex in Brent
Average Earnings in Brent are $16,738, $17,269 for men and $16,117 for women, a difference of 6.7%.
| Sex | Number | Average Earnings |
| Male | 6,489 (52.1%) | $17,269 |
| Female | 5,965 (47.9%) | $16,117 |
| Total | 12,454 (100.0%) | $16,738 |
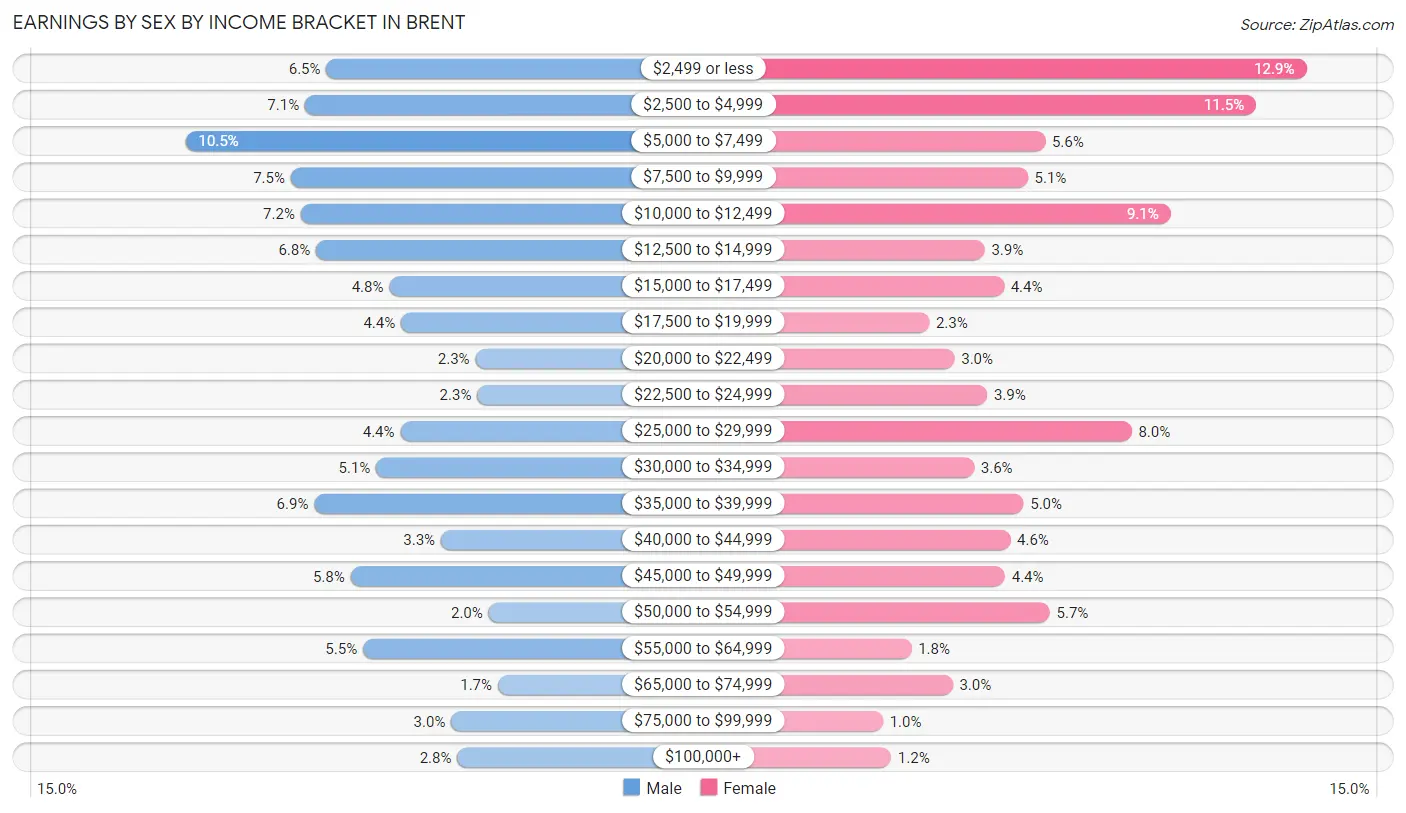
Earnings by Sex by Income Bracket in Brent
The most common earnings brackets in Brent are $5,000 to $7,499 for men (680 | 10.5%) and $2,499 or less for women (770 | 12.9%).
| Income | Male | Female |
| $2,499 or less | 423 (6.5%) | 770 (12.9%) |
| $2,500 to $4,999 | 462 (7.1%) | 686 (11.5%) |
| $5,000 to $7,499 | 680 (10.5%) | 332 (5.6%) |
| $7,500 to $9,999 | 488 (7.5%) | 303 (5.1%) |
| $10,000 to $12,499 | 470 (7.2%) | 543 (9.1%) |
| $12,500 to $14,999 | 442 (6.8%) | 231 (3.9%) |
| $15,000 to $17,499 | 308 (4.8%) | 263 (4.4%) |
| $17,500 to $19,999 | 287 (4.4%) | 138 (2.3%) |
| $20,000 to $22,499 | 151 (2.3%) | 180 (3.0%) |
| $22,500 to $24,999 | 148 (2.3%) | 235 (3.9%) |
| $25,000 to $29,999 | 288 (4.4%) | 477 (8.0%) |
| $30,000 to $34,999 | 332 (5.1%) | 213 (3.6%) |
| $35,000 to $39,999 | 445 (6.9%) | 296 (5.0%) |
| $40,000 to $44,999 | 214 (3.3%) | 274 (4.6%) |
| $45,000 to $49,999 | 379 (5.8%) | 265 (4.4%) |
| $50,000 to $54,999 | 127 (2.0%) | 340 (5.7%) |
| $55,000 to $64,999 | 356 (5.5%) | 108 (1.8%) |
| $65,000 to $74,999 | 110 (1.7%) | 177 (3.0%) |
| $75,000 to $99,999 | 195 (3.0%) | 60 (1.0%) |
| $100,000+ | 184 (2.8%) | 74 (1.2%) |
| Total | 6,489 (100.0%) | 5,965 (100.0%) |
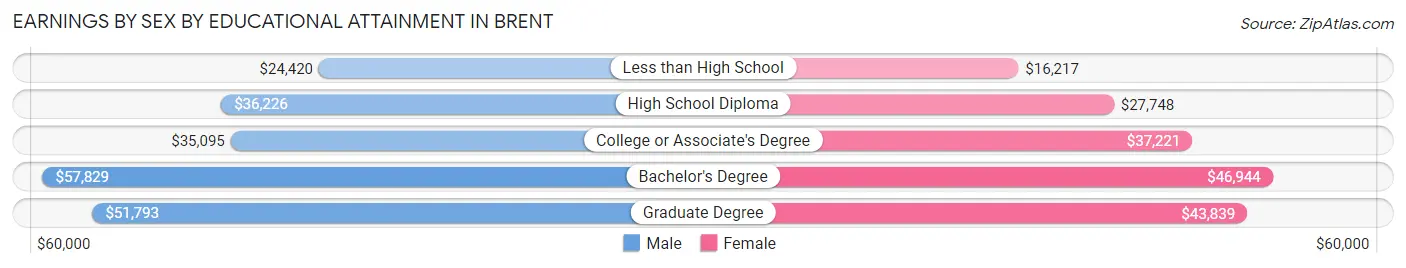
Earnings by Sex by Educational Attainment in Brent
Average earnings in Brent are $37,244 for men and $32,983 for women, a difference of 11.4%. Men with an educational attainment of bachelor's degree enjoy the highest average annual earnings of $57,829, while those with less than high school education earn the least with $24,420. Women with an educational attainment of bachelor's degree earn the most with the average annual earnings of $46,944, while those with less than high school education have the smallest earnings of $16,217.
| Educational Attainment | Male Income | Female Income |
| Less than High School | $24,420 | $16,217 |
| High School Diploma | $36,226 | $27,748 |
| College or Associate's Degree | $35,095 | $37,221 |
| Bachelor's Degree | $57,829 | $46,944 |
| Graduate Degree | $51,793 | $43,839 |
| Total | $37,244 | $32,983 |
Family Income in Brent
Family Income Brackets in Brent
According to the Brent family income data, there are 1,008 families falling into the $50,000 to $74,999 income range, which is the most common income bracket and makes up 24.2% of all families. Conversely, the $200,000+ income bracket is the least frequent group with only 50 families (1.2%) belonging to this category.
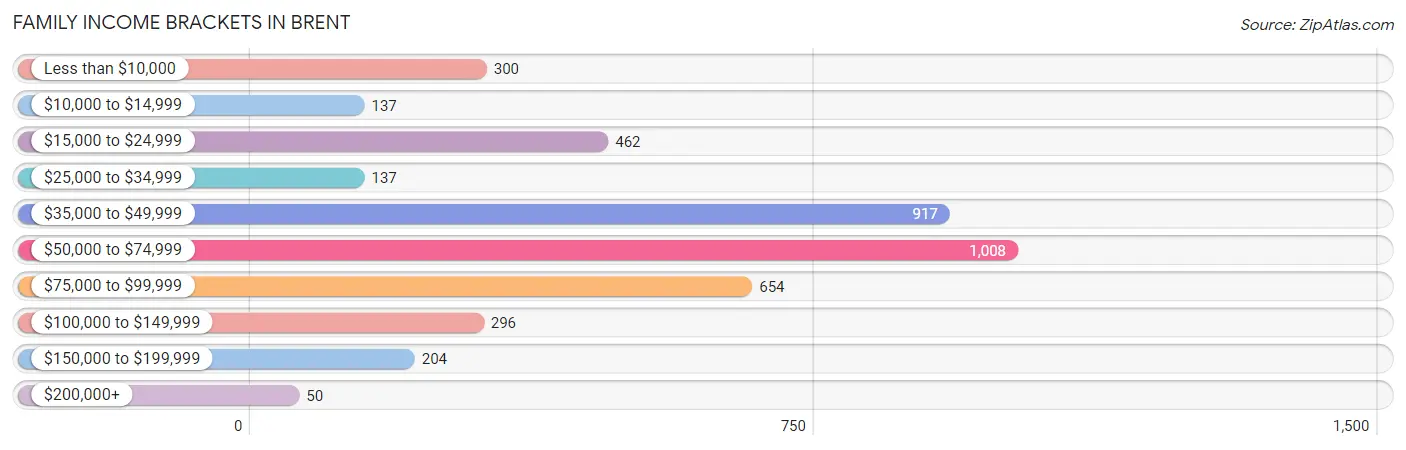
| Income Bracket | # Families | % Families |
| Less than $10,000 | 300 | 7.2% |
| $10,000 to $14,999 | 137 | 3.3% |
| $15,000 to $24,999 | 462 | 11.1% |
| $25,000 to $34,999 | 137 | 3.3% |
| $35,000 to $49,999 | 917 | 22.0% |
| $50,000 to $74,999 | 1,008 | 24.2% |
| $75,000 to $99,999 | 654 | 15.7% |
| $100,000 to $149,999 | 296 | 7.1% |
| $150,000 to $199,999 | 204 | 4.9% |
| $200,000+ | 50 | 1.2% |
Family Income by Famaliy Size in Brent
3-person families (781 | 18.8%) account for the highest median family income in Brent with $76,936 per family, while 3-person families (781 | 18.8%) have the highest median income of $25,645 per family member.
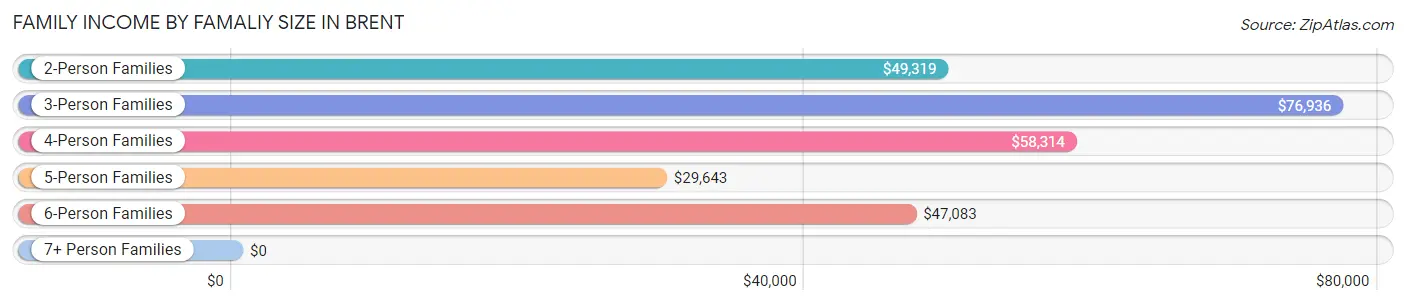
| Income Bracket | # Families | Median Income |
| 2-Person Families | 2,043 (49.0%) | $49,319 |
| 3-Person Families | 781 (18.8%) | $76,936 |
| 4-Person Families | 738 (17.7%) | $58,314 |
| 5-Person Families | 344 (8.3%) | $29,643 |
| 6-Person Families | 207 (5.0%) | $47,083 |
| 7+ Person Families | 53 (1.3%) | $0 |
| Total | 4,166 (100.0%) | $52,443 |
Family Income by Number of Earners in Brent
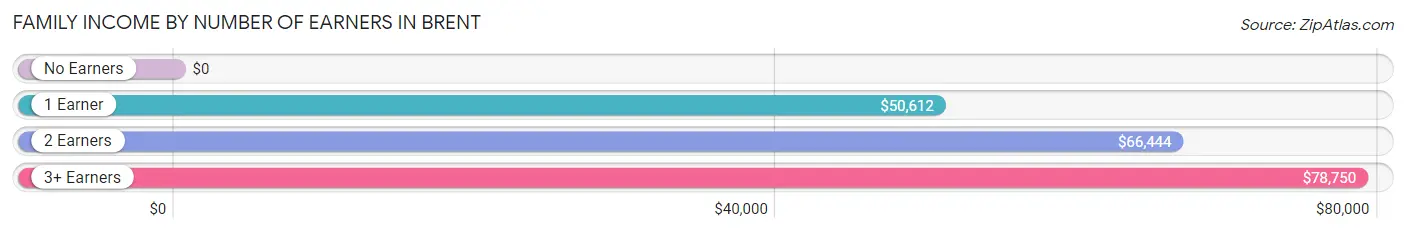
| Number of Earners | # Families | Median Income |
| No Earners | 714 (17.1%) | $0 |
| 1 Earner | 1,846 (44.3%) | $50,612 |
| 2 Earners | 1,262 (30.3%) | $66,444 |
| 3+ Earners | 344 (8.3%) | $78,750 |
| Total | 4,166 (100.0%) | $52,443 |
Household Income in Brent
Household Income Brackets in Brent
With 1,474 households falling in the category, the $50,000 to $74,999 income range is the most frequent in Brent, accounting for 20.0% of all households. In contrast, only 59 households (0.8%) fall into the $200,000+ income bracket, making it the least populous group.
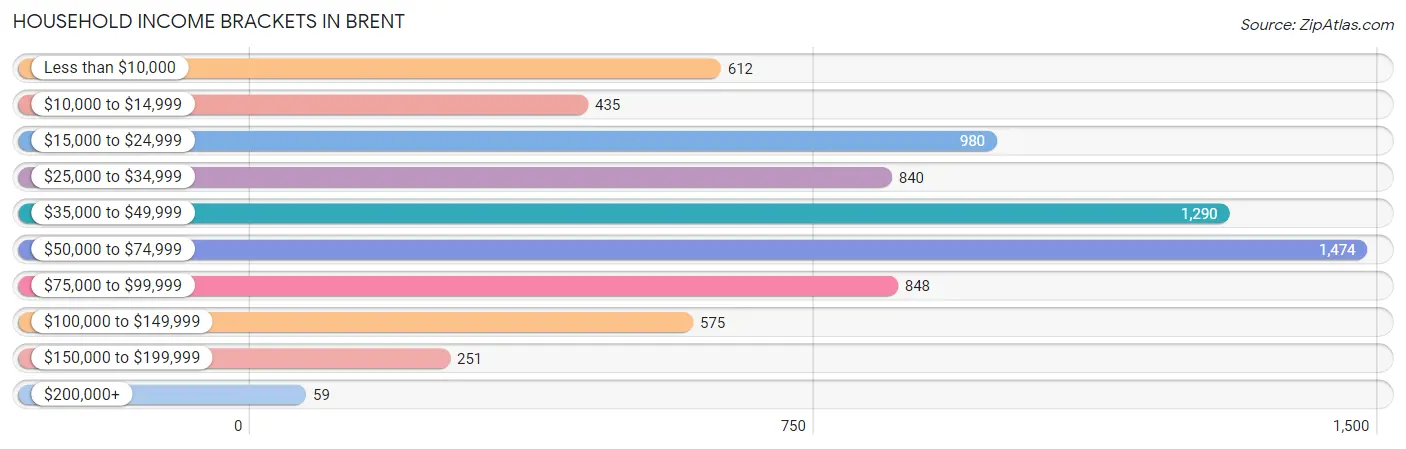
| Income Bracket | # Households | % Households |
| Less than $10,000 | 612 | 8.3% |
| $10,000 to $14,999 | 435 | 5.9% |
| $15,000 to $24,999 | 980 | 13.3% |
| $25,000 to $34,999 | 840 | 11.4% |
| $35,000 to $49,999 | 1,290 | 17.5% |
| $50,000 to $74,999 | 1,474 | 20.0% |
| $75,000 to $99,999 | 848 | 11.5% |
| $100,000 to $149,999 | 575 | 7.8% |
| $150,000 to $199,999 | 251 | 3.4% |
| $200,000+ | 59 | 0.8% |
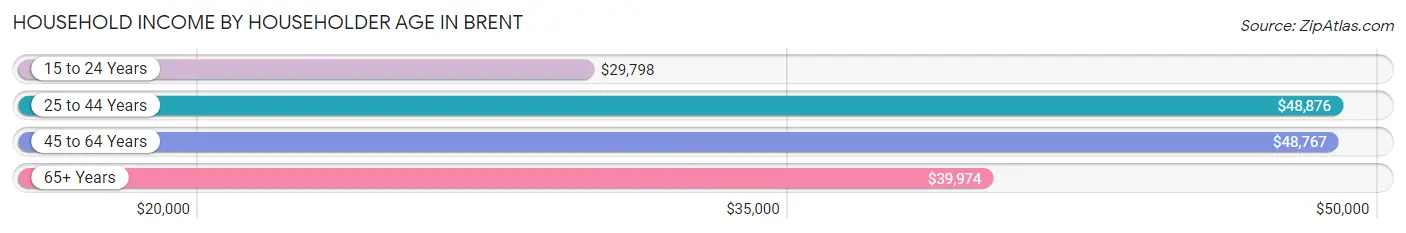
Household Income by Householder Age in Brent
The median household income in Brent is $44,053, with the highest median household income of $48,876 found in the 25 to 44 years age bracket for the primary householder. A total of 2,434 households (33.0%) fall into this category. Meanwhile, the 15 to 24 years age bracket for the primary householder has the lowest median household income of $29,798, with 453 households (6.1%) in this group.
| Income Bracket | # Households | Median Income |
| 15 to 24 Years | 453 (6.1%) | $29,798 |
| 25 to 44 Years | 2,434 (33.0%) | $48,876 |
| 45 to 64 Years | 2,457 (33.3%) | $48,767 |
| 65+ Years | 2,028 (27.5%) | $39,974 |
| Total | 7,372 (100.0%) | $44,053 |
Poverty in Brent
Income Below Poverty by Sex and Age in Brent
With 21.0% poverty level for males and 26.9% for females among the residents of Brent, 6 to 11 year old males and 5 year old females are the most vulnerable to poverty, with 563 males (40.9%) and 13 females (100.0%) in their respective age groups living below the poverty level.
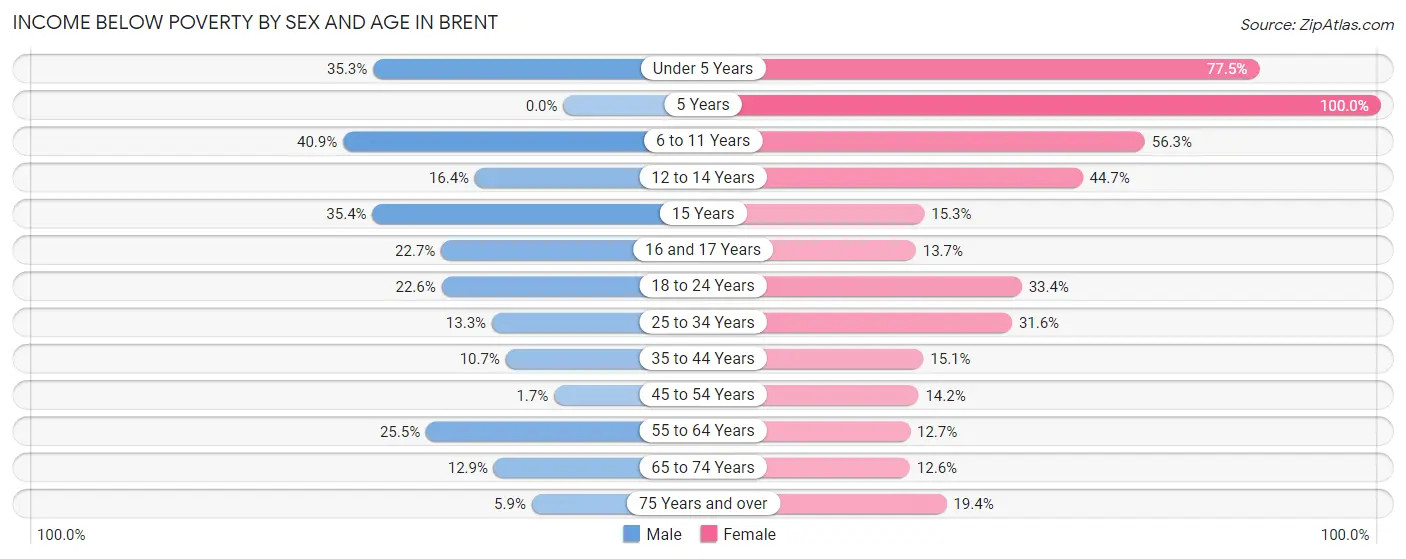
| Age Bracket | Male | Female |
| Under 5 Years | 327 (35.3%) | 347 (77.5%) |
| 5 Years | 0 (0.0%) | 13 (100.0%) |
| 6 to 11 Years | 563 (40.9%) | 342 (56.2%) |
| 12 to 14 Years | 76 (16.4%) | 231 (44.7%) |
| 15 Years | 28 (35.4%) | 17 (15.3%) |
| 16 and 17 Years | 83 (22.7%) | 18 (13.7%) |
| 18 to 24 Years | 196 (22.6%) | 190 (33.4%) |
| 25 to 34 Years | 150 (13.3%) | 427 (31.6%) |
| 35 to 44 Years | 135 (10.7%) | 144 (15.1%) |
| 45 to 54 Years | 9 (1.7%) | 137 (14.2%) |
| 55 to 64 Years | 321 (25.5%) | 168 (12.7%) |
| 65 to 74 Years | 113 (12.9%) | 99 (12.6%) |
| 75 Years and over | 33 (5.9%) | 103 (19.4%) |
| Total | 2,034 (21.0%) | 2,236 (26.9%) |
Income Above Poverty by Sex and Age in Brent
According to the poverty statistics in Brent, males aged 5 years and females aged 65 to 74 years are the age groups that are most secure financially, with 100.0% of males and 87.4% of females in these age groups living above the poverty line.
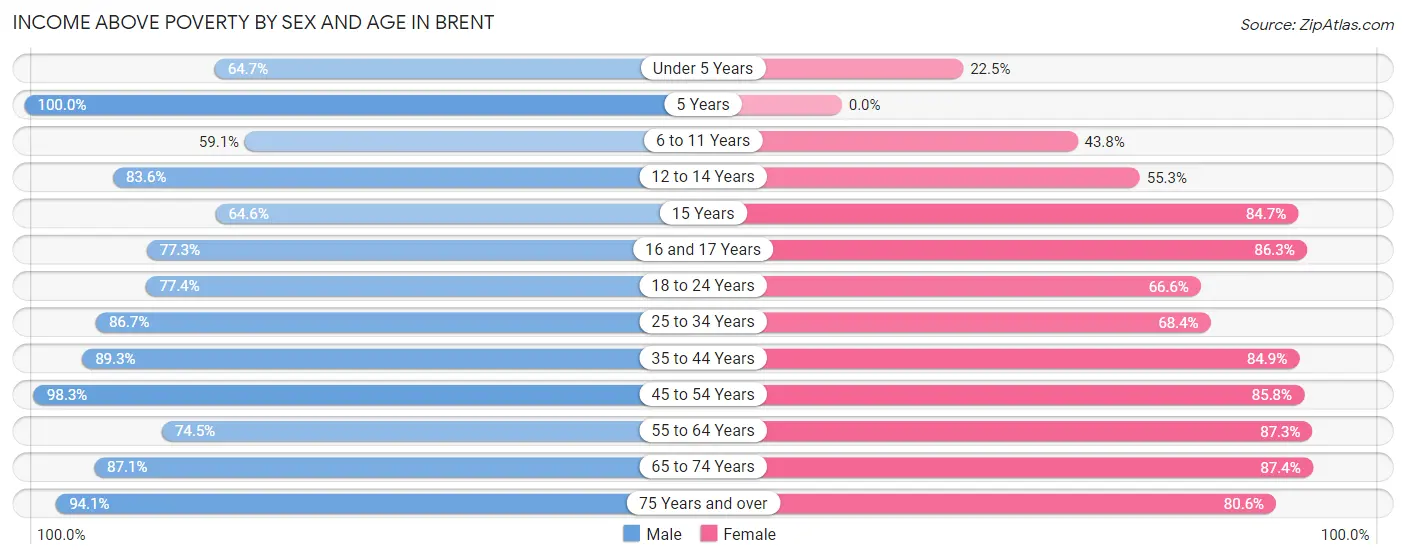
| Age Bracket | Male | Female |
| Under 5 Years | 599 (64.7%) | 101 (22.5%) |
| 5 Years | 8 (100.0%) | 0 (0.0%) |
| 6 to 11 Years | 814 (59.1%) | 266 (43.8%) |
| 12 to 14 Years | 387 (83.6%) | 286 (55.3%) |
| 15 Years | 51 (64.6%) | 94 (84.7%) |
| 16 and 17 Years | 283 (77.3%) | 113 (86.3%) |
| 18 to 24 Years | 671 (77.4%) | 379 (66.6%) |
| 25 to 34 Years | 981 (86.7%) | 925 (68.4%) |
| 35 to 44 Years | 1,127 (89.3%) | 807 (84.9%) |
| 45 to 54 Years | 510 (98.3%) | 825 (85.8%) |
| 55 to 64 Years | 938 (74.5%) | 1,158 (87.3%) |
| 65 to 74 Years | 762 (87.1%) | 684 (87.4%) |
| 75 Years and over | 529 (94.1%) | 427 (80.6%) |
| Total | 7,660 (79.0%) | 6,065 (73.1%) |
Income Below Poverty Among Married-Couple Families in Brent
The poverty statistics for married-couple families in Brent show that 5.3% or 132 of the total 2,501 families live below the poverty line. Families with 3 or 4 children have the highest poverty rate of 38.6%, comprising of 86 families. On the other hand, families with 5 or more children have the lowest poverty rate of 0.0%, which includes 0 families.
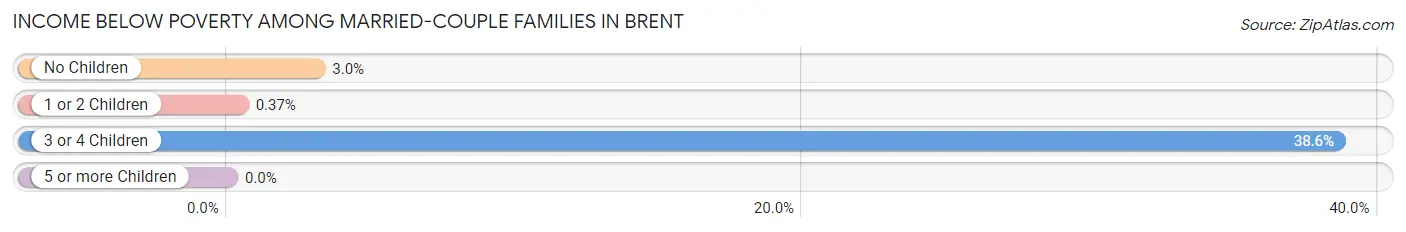
| Children | Above Poverty | Below Poverty |
| No Children | 1,371 (97.0%) | 43 (3.0%) |
| 1 or 2 Children | 818 (99.6%) | 3 (0.4%) |
| 3 or 4 Children | 137 (61.4%) | 86 (38.6%) |
| 5 or more Children | 43 (100.0%) | 0 (0.0%) |
| Total | 2,369 (94.7%) | 132 (5.3%) |
Income Below Poverty Among Single-Parent Households in Brent
According to the poverty data in Brent, 20.1% or 44 single-father households and 44.3% or 640 single-mother households are living below the poverty line. Among single-father households, those with 5 or more children have the highest poverty rate, with 10 households (100.0%) experiencing poverty. Likewise, among single-mother households, those with 5 or more children have the highest poverty rate, with 14 households (100.0%) falling below the poverty line.
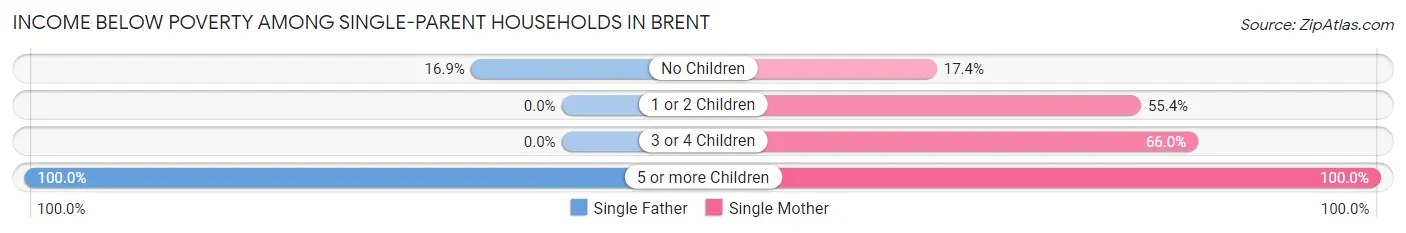
| Children | Single Father | Single Mother |
| No Children | 34 (16.9%) | 93 (17.3%) |
| 1 or 2 Children | 0 (0.0%) | 304 (55.4%) |
| 3 or 4 Children | 0 (0.0%) | 229 (66.0%) |
| 5 or more Children | 10 (100.0%) | 14 (100.0%) |
| Total | 44 (20.1%) | 640 (44.3%) |
Income Below Poverty Among Married-Couple vs Single-Parent Households in Brent
The poverty data for Brent shows that 132 of the married-couple family households (5.3%) and 684 of the single-parent households (41.1%) are living below the poverty level. Within the married-couple family households, those with 3 or 4 children have the highest poverty rate, with 86 households (38.6%) falling below the poverty line. Among the single-parent households, those with 5 or more children have the highest poverty rate, with 24 household (100.0%) living below poverty.
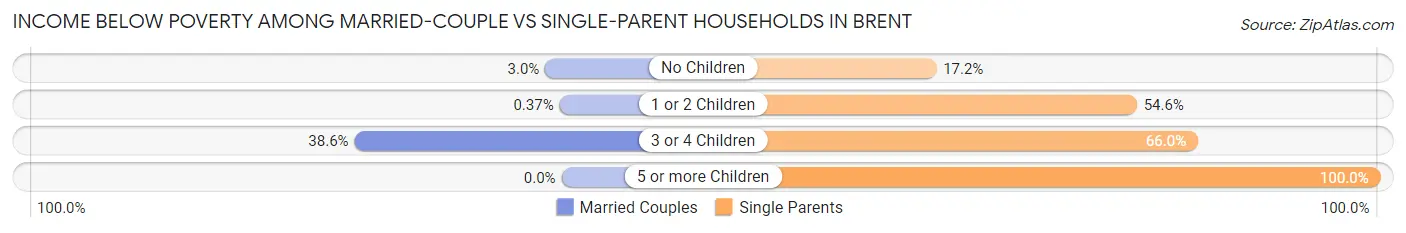
| Children | Married-Couple Families | Single-Parent Households |
| No Children | 43 (3.0%) | 127 (17.2%) |
| 1 or 2 Children | 3 (0.4%) | 304 (54.6%) |
| 3 or 4 Children | 86 (38.6%) | 229 (66.0%) |
| 5 or more Children | 0 (0.0%) | 24 (100.0%) |
| Total | 132 (5.3%) | 684 (41.1%) |
Race in Brent
The most populous races in Brent are White / Caucasian (11,996 | 52.2%), Black / African American (6,855 | 29.8%), and Two or more Races (2,161 | 9.4%).
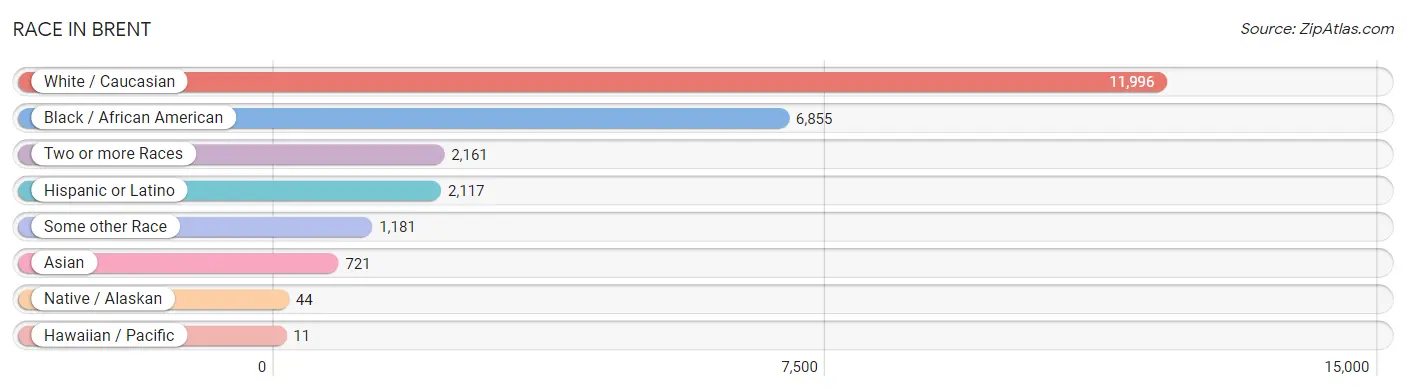
| Race | # Population | % Population |
| Asian | 721 | 3.1% |
| Black / African American | 6,855 | 29.8% |
| Hawaiian / Pacific | 11 | 0.1% |
| Hispanic or Latino | 2,117 | 9.2% |
| Native / Alaskan | 44 | 0.2% |
| White / Caucasian | 11,996 | 52.2% |
| Two or more Races | 2,161 | 9.4% |
| Some other Race | 1,181 | 5.1% |
| Total | 22,969 | 100.0% |
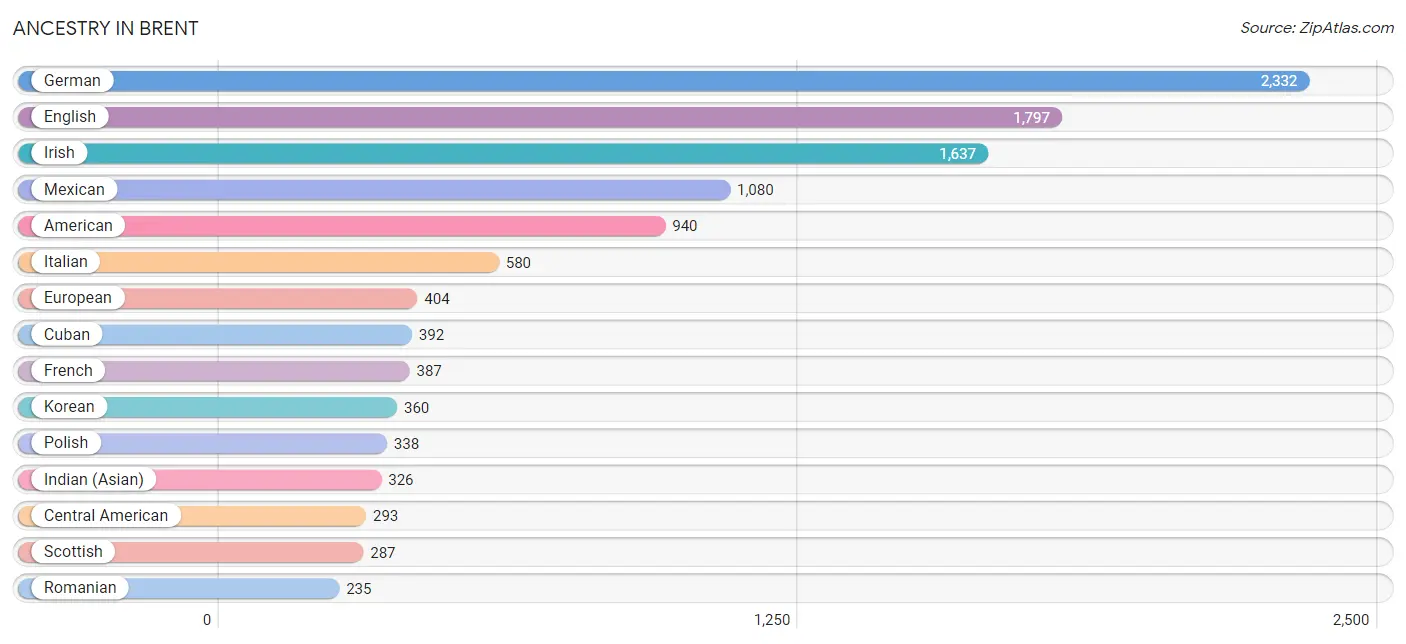
Ancestry in Brent
The most populous ancestries reported in Brent are German (2,332 | 10.2%), English (1,797 | 7.8%), Irish (1,637 | 7.1%), Mexican (1,080 | 4.7%), and American (940 | 4.1%), together accounting for 33.9% of all Brent residents.
| Ancestry | # Population | % Population |
| African | 87 | 0.4% |
| American | 940 | 4.1% |
| Arab | 21 | 0.1% |
| Austrian | 4 | 0.0% |
| Belgian | 70 | 0.3% |
| Bhutanese | 15 | 0.1% |
| Blackfeet | 114 | 0.5% |
| Bolivian | 8 | 0.0% |
| Brazilian | 23 | 0.1% |
| British | 47 | 0.2% |
| Burmese | 74 | 0.3% |
| Cajun | 8 | 0.0% |
| Canadian | 5 | 0.0% |
| Central American | 293 | 1.3% |
| Central American Indian | 9 | 0.0% |
| Cherokee | 53 | 0.2% |
| Colombian | 25 | 0.1% |
| Creek | 35 | 0.2% |
| Cuban | 392 | 1.7% |
| Danish | 36 | 0.2% |
| Dominican | 8 | 0.0% |
| Dutch | 117 | 0.5% |
| Eastern European | 5 | 0.0% |
| Ecuadorian | 21 | 0.1% |
| English | 1,797 | 7.8% |
| European | 404 | 1.8% |
| French | 387 | 1.7% |
| French American Indian | 7 | 0.0% |
| French Canadian | 25 | 0.1% |
| German | 2,332 | 10.2% |
| Greek | 58 | 0.3% |
| Guamanian / Chamorro | 110 | 0.5% |
| Guatemalan | 16 | 0.1% |
| Guyanese | 8 | 0.0% |
| Honduran | 158 | 0.7% |
| Hungarian | 24 | 0.1% |
| Indian (Asian) | 326 | 1.4% |
| Iranian | 39 | 0.2% |
| Irish | 1,637 | 7.1% |
| Italian | 580 | 2.5% |
| Jamaican | 51 | 0.2% |
| Japanese | 59 | 0.3% |
| Jordanian | 18 | 0.1% |
| Kenyan | 46 | 0.2% |
| Korean | 360 | 1.6% |
| Laotian | 20 | 0.1% |
| Macedonian | 11 | 0.1% |
| Malaysian | 31 | 0.1% |
| Mexican | 1,080 | 4.7% |
| Navajo | 11 | 0.1% |
| Nicaraguan | 52 | 0.2% |
| Nigerian | 59 | 0.3% |
| Northern European | 7 | 0.0% |
| Norwegian | 93 | 0.4% |
| Palestinian | 3 | 0.0% |
| Peruvian | 4 | 0.0% |
| Polish | 338 | 1.5% |
| Portuguese | 52 | 0.2% |
| Pueblo | 10 | 0.0% |
| Puerto Rican | 160 | 0.7% |
| Romanian | 235 | 1.0% |
| Russian | 80 | 0.4% |
| Salvadoran | 67 | 0.3% |
| Scandinavian | 60 | 0.3% |
| Scotch-Irish | 186 | 0.8% |
| Scottish | 287 | 1.3% |
| Sioux | 10 | 0.0% |
| South American | 58 | 0.3% |
| Spaniard | 63 | 0.3% |
| Spanish | 25 | 0.1% |
| Sri Lankan | 117 | 0.5% |
| Subsaharan African | 216 | 0.9% |
| Swedish | 90 | 0.4% |
| Swiss | 23 | 0.1% |
| Thai | 44 | 0.2% |
| Turkish | 23 | 0.1% |
| Ukrainian | 26 | 0.1% |
| Welsh | 227 | 1.0% |
| Zimbabwean | 8 | 0.0% | View All 79 Rows |
Immigrants in Brent
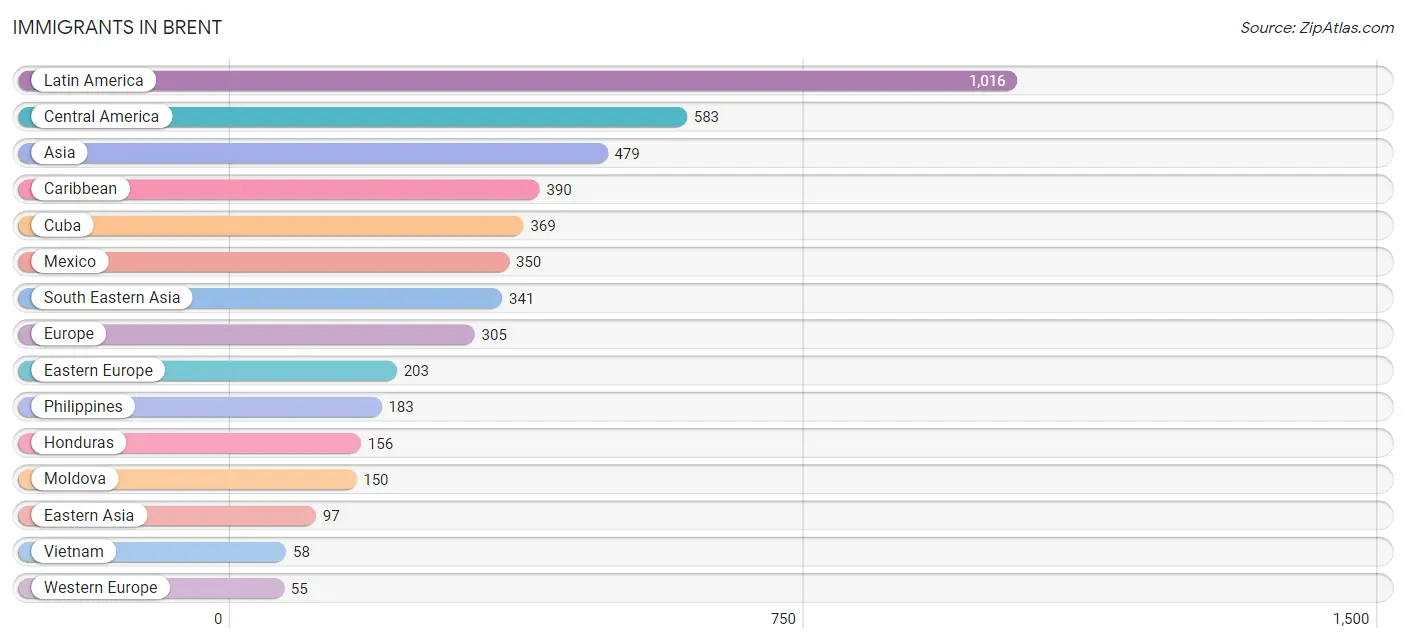
The most numerous immigrant groups reported in Brent came from Latin America (1,016 | 4.4%), Central America (583 | 2.5%), Asia (479 | 2.1%), Caribbean (390 | 1.7%), and Cuba (369 | 1.6%), together accounting for 12.4% of all Brent residents.
| Immigration Origin | # Population | % Population |
| Africa | 29 | 0.1% |
| Asia | 479 | 2.1% |
| Bahamas | 10 | 0.0% |
| Brazil | 23 | 0.1% |
| Cambodia | 39 | 0.2% |
| Canada | 5 | 0.0% |
| Caribbean | 390 | 1.7% |
| Central America | 583 | 2.5% |
| China | 45 | 0.2% |
| Cuba | 369 | 1.6% |
| Eastern Africa | 4 | 0.0% |
| Eastern Asia | 97 | 0.4% |
| Eastern Europe | 203 | 0.9% |
| El Salvador | 42 | 0.2% |
| England | 11 | 0.1% |
| Europe | 305 | 1.3% |
| France | 13 | 0.1% |
| Germany | 42 | 0.2% |
| Greece | 21 | 0.1% |
| Guatemala | 22 | 0.1% |
| Guyana | 20 | 0.1% |
| Honduras | 156 | 0.7% |
| India | 8 | 0.0% |
| Indonesia | 42 | 0.2% |
| Iran | 17 | 0.1% |
| Israel | 3 | 0.0% |
| Jamaica | 11 | 0.1% |
| Japan | 20 | 0.1% |
| Korea | 32 | 0.1% |
| Kuwait | 13 | 0.1% |
| Laos | 19 | 0.1% |
| Latin America | 1,016 | 4.4% |
| Mexico | 350 | 1.5% |
| Moldova | 150 | 0.6% |
| Nigeria | 19 | 0.1% |
| North Macedonia | 11 | 0.1% |
| Northern Europe | 11 | 0.1% |
| Oceania | 22 | 0.1% |
| Panama | 13 | 0.1% |
| Philippines | 183 | 0.8% |
| Poland | 17 | 0.1% |
| Russia | 25 | 0.1% |
| South America | 43 | 0.2% |
| South Central Asia | 25 | 0.1% |
| South Eastern Asia | 341 | 1.5% |
| Southern Europe | 36 | 0.2% |
| Spain | 15 | 0.1% |
| Vietnam | 58 | 0.3% |
| Western Africa | 25 | 0.1% |
| Western Asia | 16 | 0.1% |
| Western Europe | 55 | 0.2% |
| Zimbabwe | 4 | 0.0% | View All 52 Rows |
Sex and Age in Brent
Sex and Age in Brent
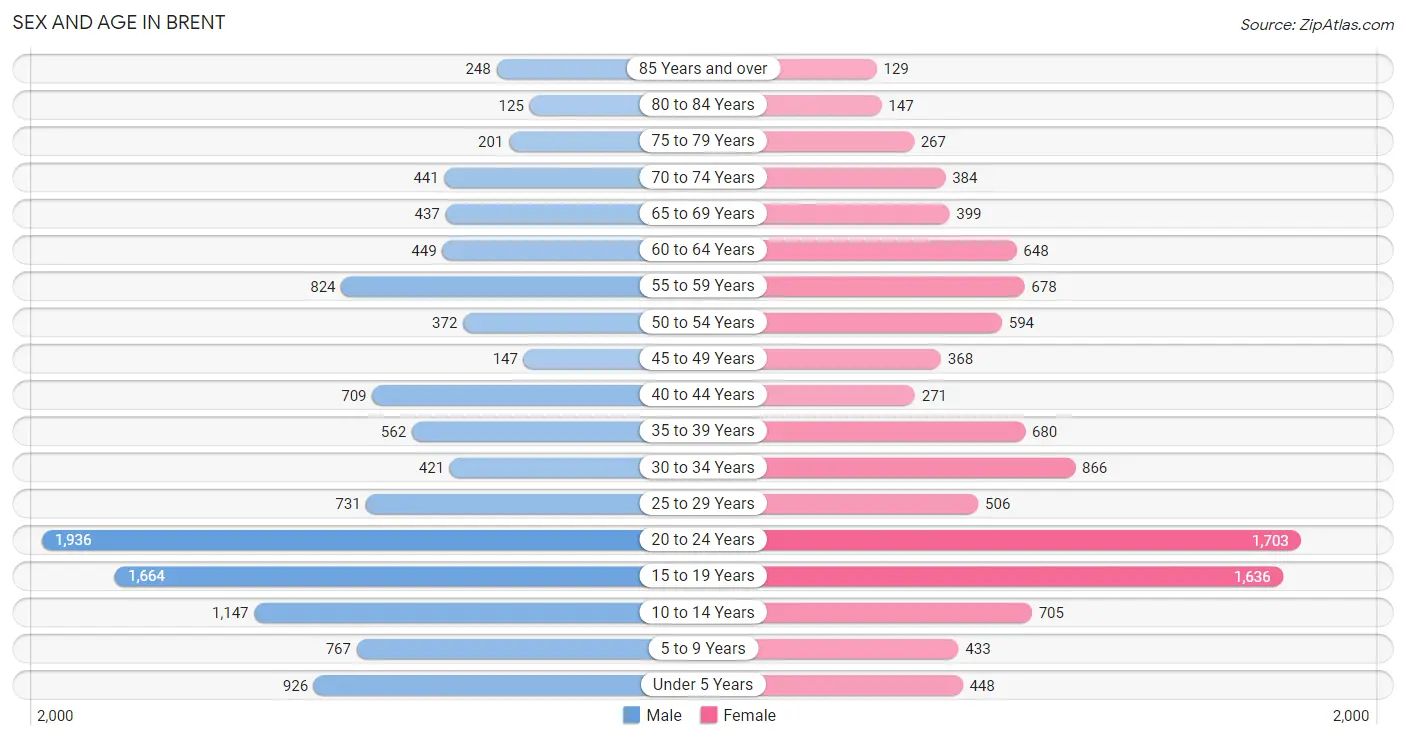
The most populous age groups in Brent are 20 to 24 Years (1,936 | 16.0%) for men and 20 to 24 Years (1,703 | 15.7%) for women.
| Age Bracket | Male | Female |
| Under 5 Years | 926 (7.6%) | 448 (4.1%) |
| 5 to 9 Years | 767 (6.3%) | 433 (4.0%) |
| 10 to 14 Years | 1,147 (9.5%) | 705 (6.5%) |
| 15 to 19 Years | 1,664 (13.7%) | 1,636 (15.1%) |
| 20 to 24 Years | 1,936 (16.0%) | 1,703 (15.7%) |
| 25 to 29 Years | 731 (6.0%) | 506 (4.7%) |
| 30 to 34 Years | 421 (3.5%) | 866 (8.0%) |
| 35 to 39 Years | 562 (4.6%) | 680 (6.3%) |
| 40 to 44 Years | 709 (5.9%) | 271 (2.5%) |
| 45 to 49 Years | 147 (1.2%) | 368 (3.4%) |
| 50 to 54 Years | 372 (3.1%) | 594 (5.5%) |
| 55 to 59 Years | 824 (6.8%) | 678 (6.2%) |
| 60 to 64 Years | 449 (3.7%) | 648 (6.0%) |
| 65 to 69 Years | 437 (3.6%) | 399 (3.7%) |
| 70 to 74 Years | 441 (3.6%) | 384 (3.5%) |
| 75 to 79 Years | 201 (1.7%) | 267 (2.5%) |
| 80 to 84 Years | 125 (1.0%) | 147 (1.3%) |
| 85 Years and over | 248 (2.1%) | 129 (1.2%) |
| Total | 12,107 (100.0%) | 10,862 (100.0%) |
Families and Households in Brent
Median Family Size in Brent
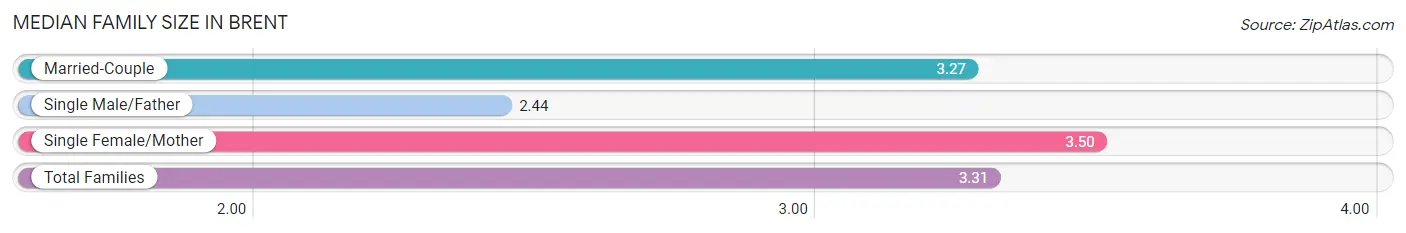
The median family size in Brent is 3.31 persons per family, with single female/mother families (1,446 | 34.7%) accounting for the largest median family size of 3.5 persons per family. On the other hand, single male/father families (219 | 5.3%) represent the smallest median family size with 2.44 persons per family.
| Family Type | # Families | Family Size |
| Married-Couple | 2,501 (60.0%) | 3.27 |
| Single Male/Father | 219 (5.3%) | 2.44 |
| Single Female/Mother | 1,446 (34.7%) | 3.50 |
| Total Families | 4,166 (100.0%) | 3.31 |
Median Household Size in Brent
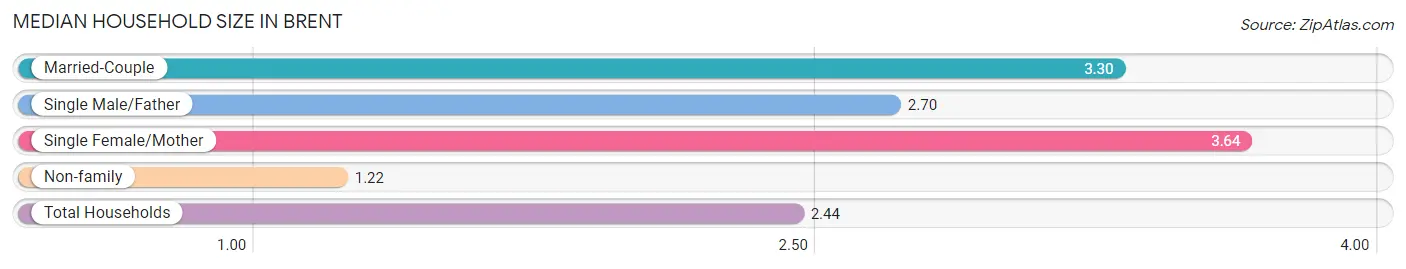
The median household size in Brent is 2.44 persons per household, with single female/mother households (1,446 | 19.6%) accounting for the largest median household size of 3.64 persons per household. non-family households (3,206 | 43.5%) represent the smallest median household size with 1.22 persons per household.
| Household Type | # Households | Household Size |
| Married-Couple | 2,501 (33.9%) | 3.30 |
| Single Male/Father | 219 (3.0%) | 2.70 |
| Single Female/Mother | 1,446 (19.6%) | 3.64 |
| Non-family | 3,206 (43.5%) | 1.22 |
| Total Households | 7,372 (100.0%) | 2.44 |
Household Size by Marriage Status in Brent
Out of a total of 7,372 households in Brent, 4,166 (56.5%) are family households, while 3,206 (43.5%) are nonfamily households. The most numerous type of family households are 2-person households, comprising 1,906, and the most common type of nonfamily households are 1-person households, comprising 2,620.
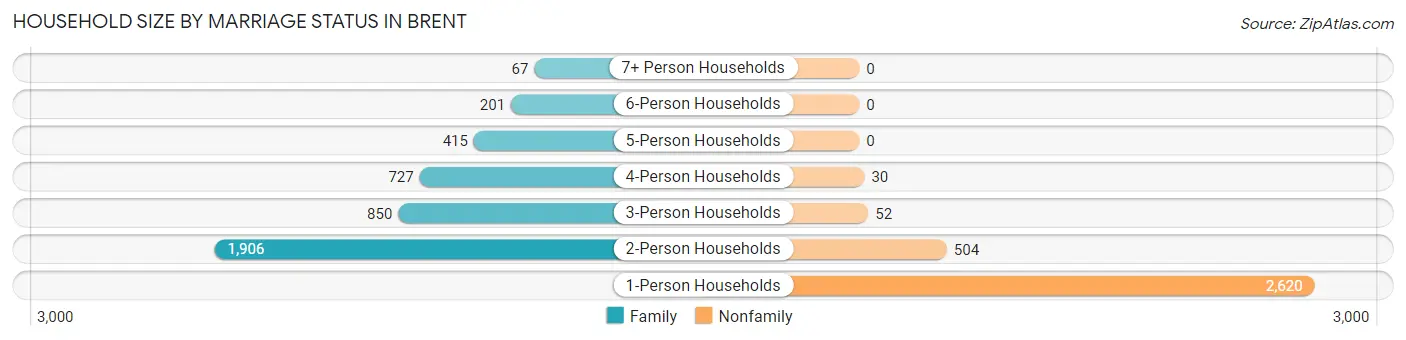
| Household Size | Family Households | Nonfamily Households |
| 1-Person Households | - | 2,620 (35.5%) |
| 2-Person Households | 1,906 (25.9%) | 504 (6.8%) |
| 3-Person Households | 850 (11.5%) | 52 (0.7%) |
| 4-Person Households | 727 (9.9%) | 30 (0.4%) |
| 5-Person Households | 415 (5.6%) | 0 (0.0%) |
| 6-Person Households | 201 (2.7%) | 0 (0.0%) |
| 7+ Person Households | 67 (0.9%) | 0 (0.0%) |
| Total | 4,166 (56.5%) | 3,206 (43.5%) |
Female Fertility in Brent
Fertility by Age in Brent
Average fertility rate in Brent is 40.0 births per 1,000 women. Women in the age bracket of 20 to 34 years have the highest fertility rate with 73.0 births per 1,000 women. Women in the age bracket of 20 to 34 years acount for 89.2% of all women with births.
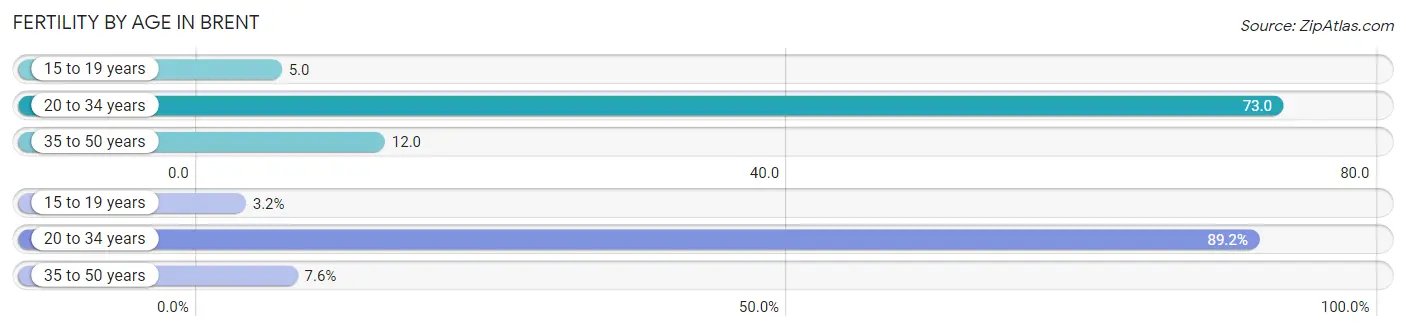
| Age Bracket | Women with Births | Births / 1,000 Women |
| 15 to 19 years | 8 (3.2%) | 5.0 |
| 20 to 34 years | 223 (89.2%) | 73.0 |
| 35 to 50 years | 19 (7.6%) | 12.0 |
| Total | 250 (100.0%) | 40.0 |
Fertility by Age by Marriage Status in Brent
72.8% of women with births (250) in Brent are married. The highest percentage of unmarried women with births falls into 15 to 19 years age bracket with 100.0% of them unmarried at the time of birth, while the lowest percentage of unmarried women with births belong to 20 to 34 years age bracket with 18.4% of them unmarried.
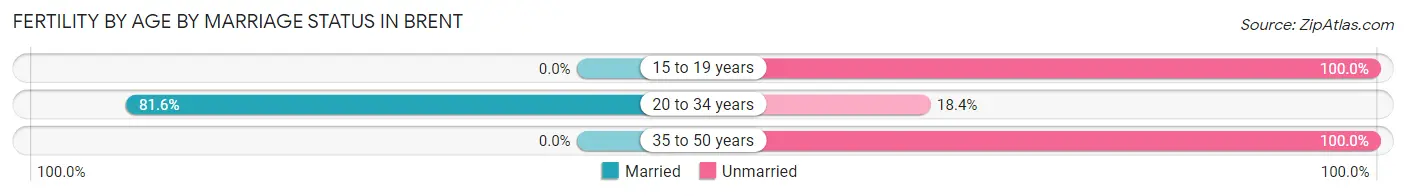
| Age Bracket | Married | Unmarried |
| 15 to 19 years | 0 (0.0%) | 8 (100.0%) |
| 20 to 34 years | 182 (81.6%) | 41 (18.4%) |
| 35 to 50 years | 0 (0.0%) | 19 (100.0%) |
| Total | 182 (72.8%) | 68 (27.2%) |
Fertility by Education in Brent
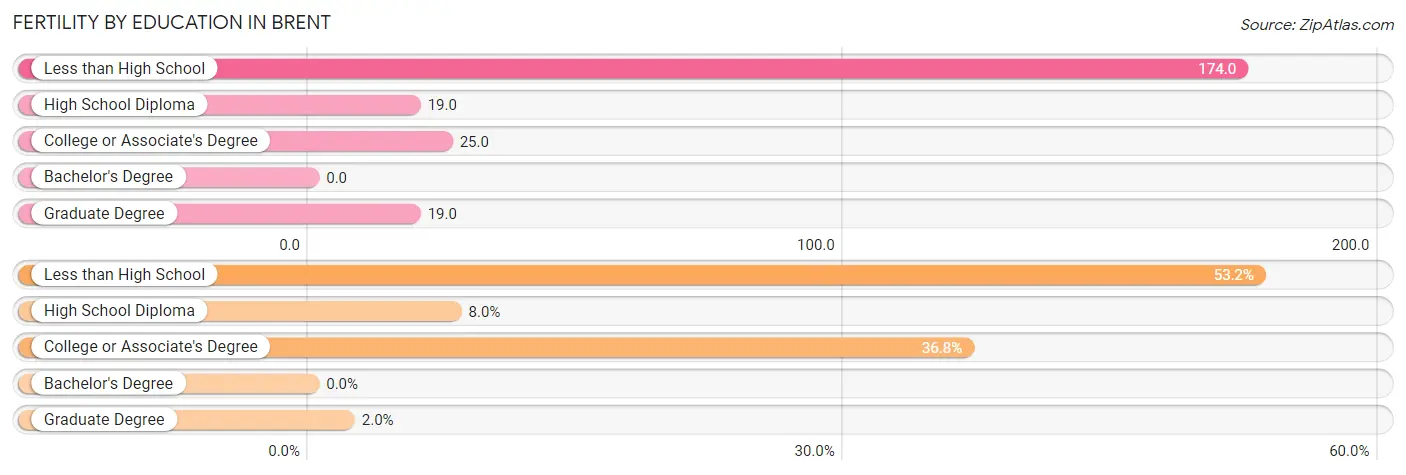
| Educational Attainment | Women with Births | Births / 1,000 Women |
| Less than High School | 133 (53.2%) | 174.0 |
| High School Diploma | 20 (8.0%) | 19.0 |
| College or Associate's Degree | 92 (36.8%) | 25.0 |
| Bachelor's Degree | 0 (0.0%) | 0.0 |
| Graduate Degree | 5 (2.0%) | 19.0 |
| Total | 250 (100.0%) | 40.0 |
Fertility by Education by Marriage Status in Brent
27.2% of women with births in Brent are unmarried. Women with the educational attainment of graduate degree are most likely to be married with 100.0% of them married at childbirth, while women with the educational attainment of high school diploma are least likely to be married with 100.0% of them unmarried at childbirth.
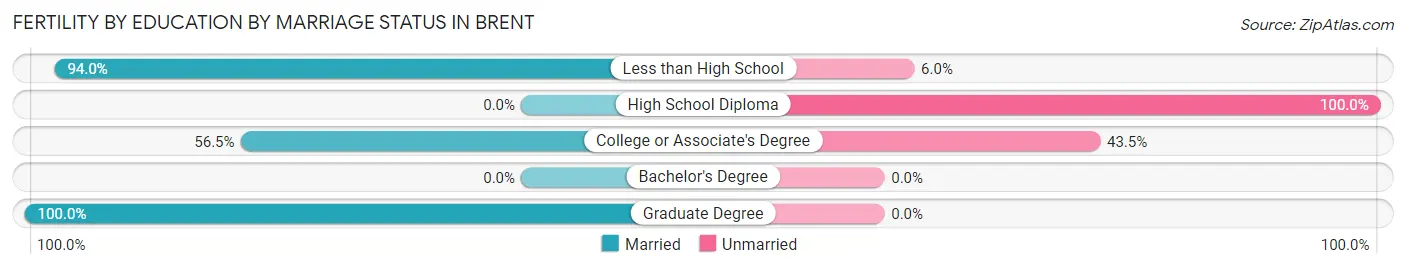
| Educational Attainment | Married | Unmarried |
| Less than High School | 125 (94.0%) | 8 (6.0%) |
| High School Diploma | 0 (0.0%) | 20 (100.0%) |
| College or Associate's Degree | 52 (56.5%) | 40 (43.5%) |
| Bachelor's Degree | 0 (0.0%) | 0 (0.0%) |
| Graduate Degree | 5 (100.0%) | 0 (0.0%) |
| Total | 182 (72.8%) | 68 (27.2%) |
Employment Characteristics in Brent
Employment by Class of Employer in Brent
Among the 10,177 employed individuals in Brent, private company employees (5,969 | 58.7%), not-for-profit organizations (2,527 | 24.8%), and self-employed (not incorporated) (534 | 5.2%) make up the most common classes of employment.
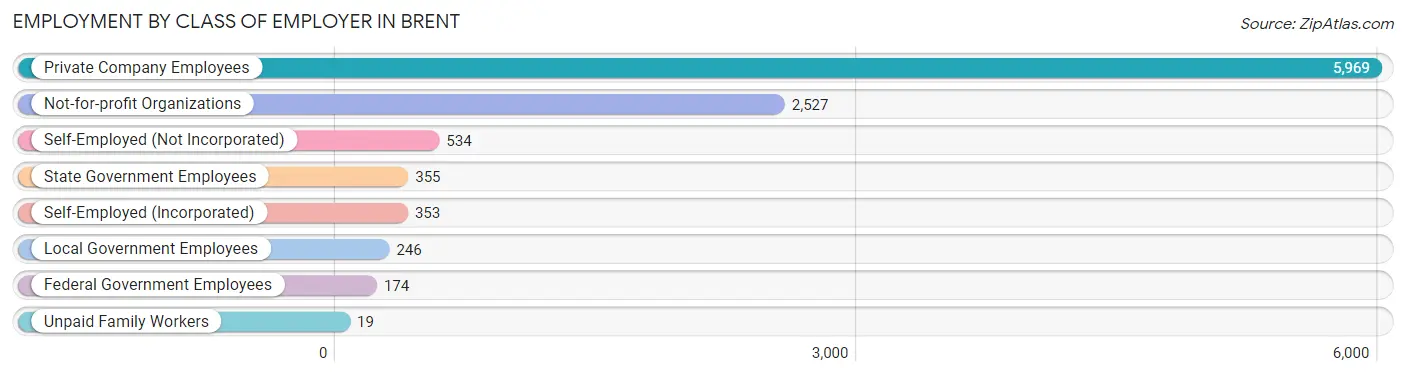
| Employer Class | # Employees | % Employees |
| Private Company Employees | 5,969 | 58.7% |
| Self-Employed (Incorporated) | 353 | 3.5% |
| Self-Employed (Not Incorporated) | 534 | 5.2% |
| Not-for-profit Organizations | 2,527 | 24.8% |
| Local Government Employees | 246 | 2.4% |
| State Government Employees | 355 | 3.5% |
| Federal Government Employees | 174 | 1.7% |
| Unpaid Family Workers | 19 | 0.2% |
| Total | 10,177 | 100.0% |
Employment Status by Age in Brent
According to the labor force statistics for Brent, out of the total population over 16 years of age (18,353), 60.1% or 11,030 individuals are in the labor force, with 6.6% or 728 of them unemployed. The age group with the highest labor force participation rate is 25 to 29 years, with 87.7% or 1,085 individuals in the labor force. Within the labor force, the 65 to 74 years age range has the highest percentage of unemployed individuals, with 21.8% or 89 of them being unemployed.
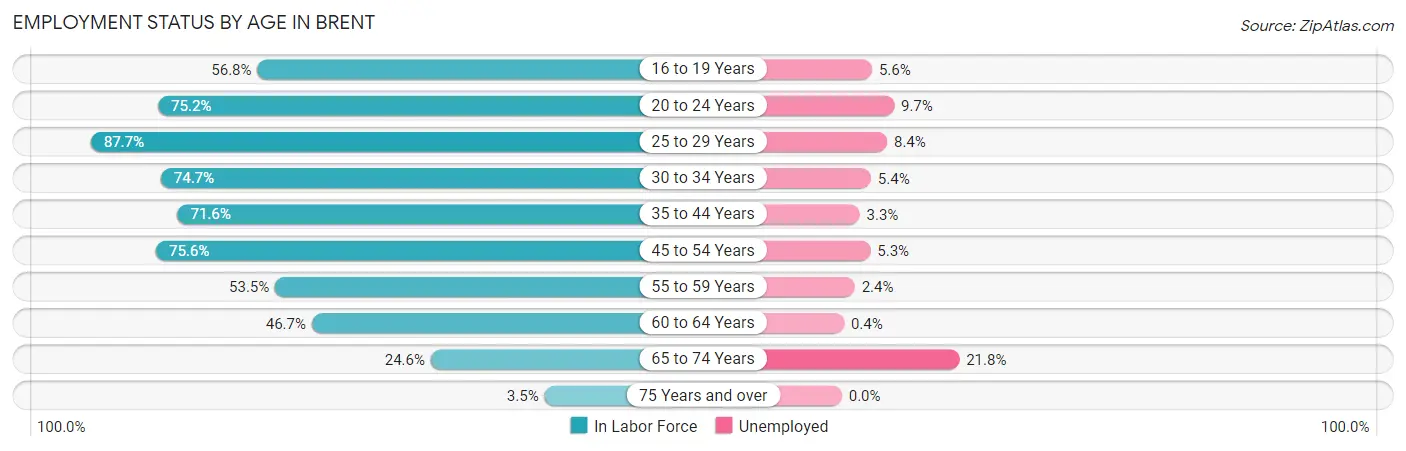
| Age Bracket | In Labor Force | Unemployed |
| 16 to 19 Years | 1,766 (56.8%) | 99 (5.6%) |
| 20 to 24 Years | 2,737 (75.2%) | 265 (9.7%) |
| 25 to 29 Years | 1,085 (87.7%) | 91 (8.4%) |
| 30 to 34 Years | 961 (74.7%) | 52 (5.4%) |
| 35 to 44 Years | 1,591 (71.6%) | 53 (3.3%) |
| 45 to 54 Years | 1,120 (75.6%) | 59 (5.3%) |
| 55 to 59 Years | 804 (53.5%) | 19 (2.4%) |
| 60 to 64 Years | 512 (46.7%) | 2 (0.4%) |
| 65 to 74 Years | 409 (24.6%) | 89 (21.8%) |
| 75 Years and over | 39 (3.5%) | 0 (0.0%) |
| Total | 11,030 (60.1%) | 728 (6.6%) |
Employment Status by Educational Attainment in Brent
According to labor force statistics for Brent, 68.8% of individuals (6,072) out of the total population between 25 and 64 years of age (8,826) are in the labor force, with 4.5% or 273 of them being unemployed. The group with the highest labor force participation rate are those with the educational attainment of bachelor's degree or higher, with 87.8% or 1,505 individuals in the labor force. Within the labor force, individuals with high school diploma education have the highest percentage of unemployment, with 9.9% or 172 of them being unemployed.
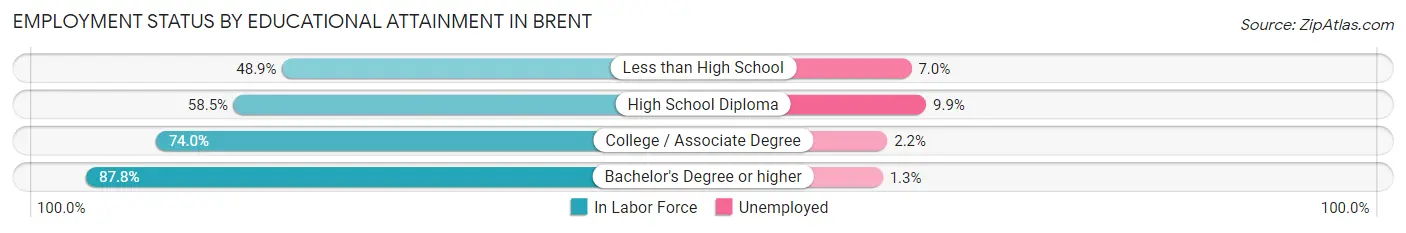
| Educational Attainment | In Labor Force | Unemployed |
| Less than High School | 457 (48.9%) | 65 (7.0%) |
| High School Diploma | 1,740 (58.5%) | 295 (9.9%) |
| College / Associate Degree | 2,370 (74.0%) | 70 (2.2%) |
| Bachelor's Degree or higher | 1,505 (87.8%) | 22 (1.3%) |
| Total | 6,072 (68.8%) | 397 (4.5%) |
Employment Occupations by Sex in Brent
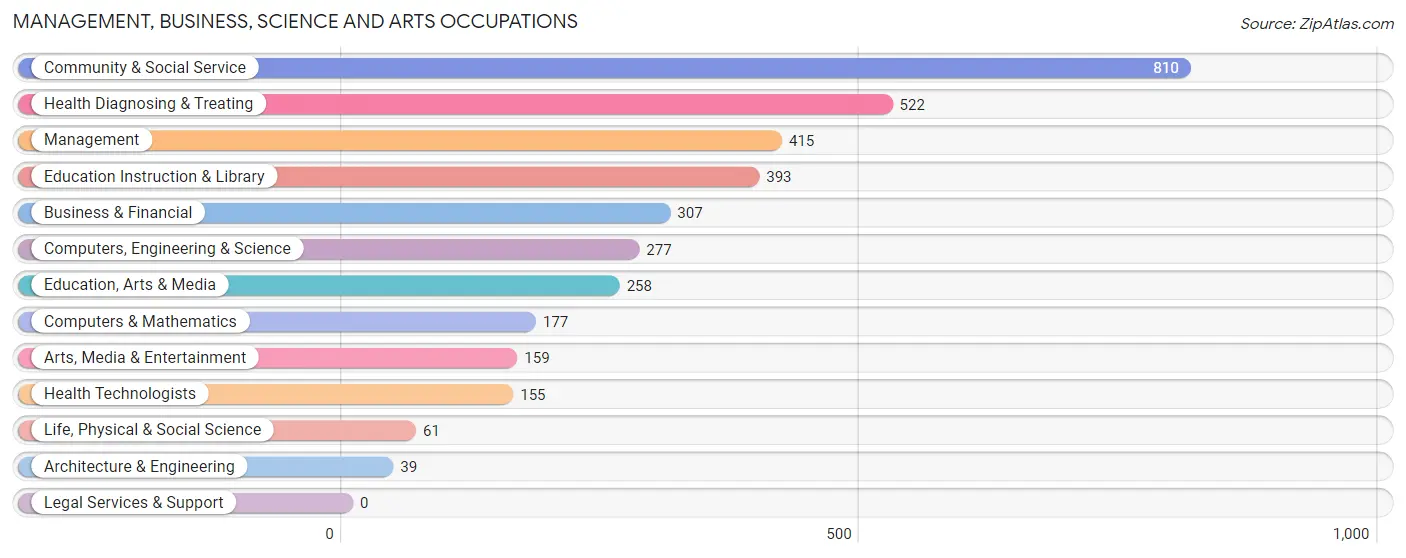
Management, Business, Science and Arts Occupations
The most common Management, Business, Science and Arts occupations in Brent are Community & Social Service (810 | 7.9%), Health Diagnosing & Treating (522 | 5.1%), Management (415 | 4.0%), Education Instruction & Library (393 | 3.8%), and Business & Financial (307 | 3.0%).
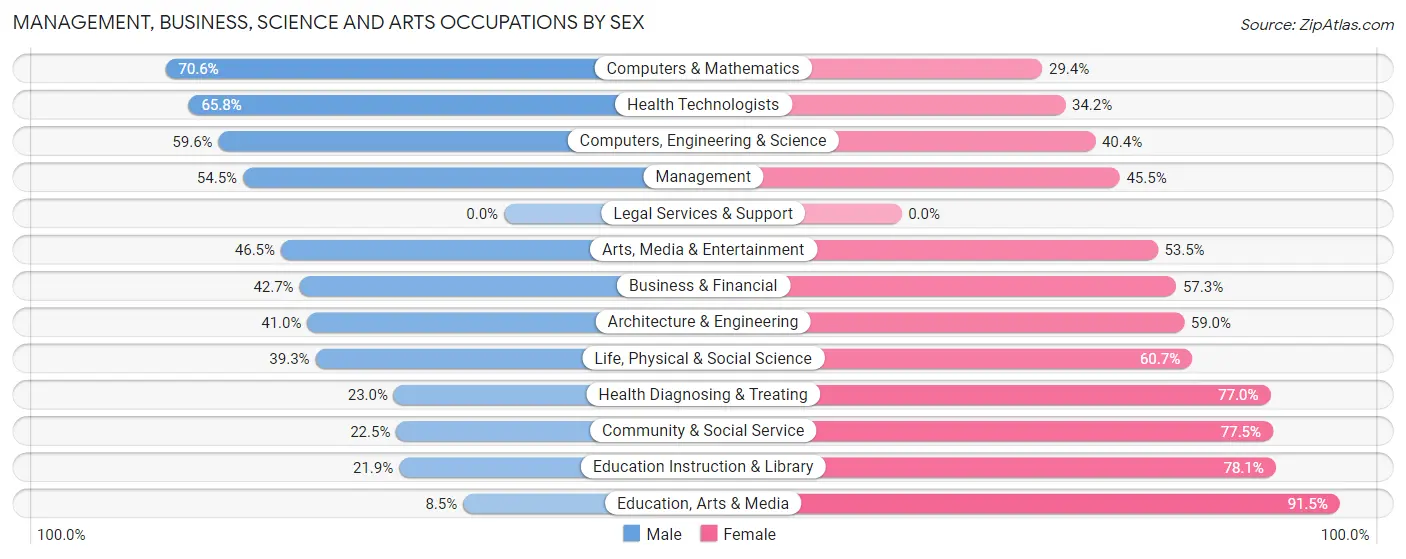
Management, Business, Science and Arts Occupations by Sex
Within the Management, Business, Science and Arts occupations in Brent, the most male-oriented occupations are Computers & Mathematics (70.6%), Health Technologists (65.8%), and Computers, Engineering & Science (59.6%), while the most female-oriented occupations are Education, Arts & Media (91.5%), Education Instruction & Library (78.1%), and Community & Social Service (77.5%).
| Occupation | Male | Female |
| Management | 226 (54.5%) | 189 (45.5%) |
| Business & Financial | 131 (42.7%) | 176 (57.3%) |
| Computers, Engineering & Science | 165 (59.6%) | 112 (40.4%) |
| Computers & Mathematics | 125 (70.6%) | 52 (29.4%) |
| Architecture & Engineering | 16 (41.0%) | 23 (59.0%) |
| Life, Physical & Social Science | 24 (39.3%) | 37 (60.7%) |
| Community & Social Service | 182 (22.5%) | 628 (77.5%) |
| Education, Arts & Media | 22 (8.5%) | 236 (91.5%) |
| Legal Services & Support | 0 (0.0%) | 0 (0.0%) |
| Education Instruction & Library | 86 (21.9%) | 307 (78.1%) |
| Arts, Media & Entertainment | 74 (46.5%) | 85 (53.5%) |
| Health Diagnosing & Treating | 120 (23.0%) | 402 (77.0%) |
| Health Technologists | 102 (65.8%) | 53 (34.2%) |
| Total (Category) | 824 (35.3%) | 1,507 (64.6%) |
| Total (Overall) | 5,464 (53.1%) | 4,829 (46.9%) |
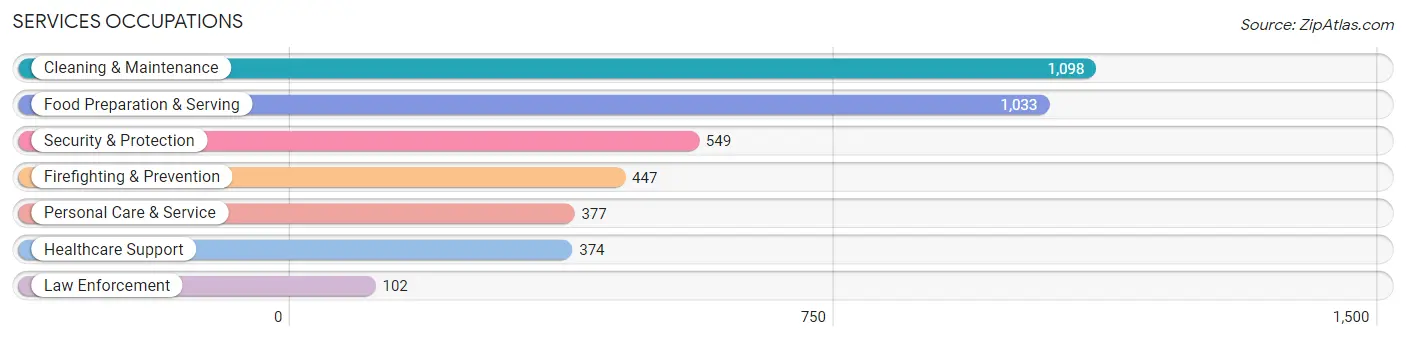
Services Occupations
The most common Services occupations in Brent are Cleaning & Maintenance (1,098 | 10.7%), Food Preparation & Serving (1,033 | 10.0%), Security & Protection (549 | 5.3%), Firefighting & Prevention (447 | 4.3%), and Personal Care & Service (377 | 3.7%).
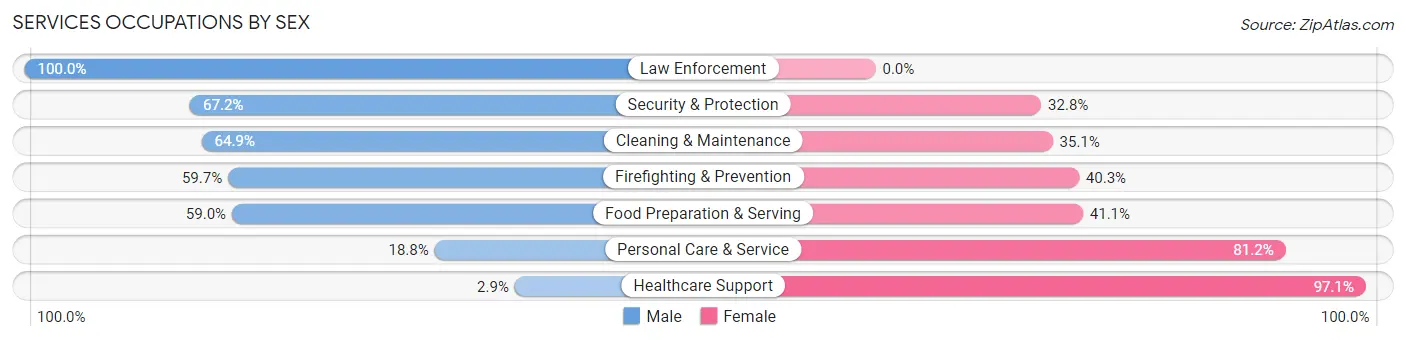
Services Occupations by Sex
Within the Services occupations in Brent, the most male-oriented occupations are Law Enforcement (100.0%), Security & Protection (67.2%), and Cleaning & Maintenance (64.9%), while the most female-oriented occupations are Healthcare Support (97.1%), Personal Care & Service (81.2%), and Food Preparation & Serving (41.0%).
| Occupation | Male | Female |
| Healthcare Support | 11 (2.9%) | 363 (97.1%) |
| Security & Protection | 369 (67.2%) | 180 (32.8%) |
| Firefighting & Prevention | 267 (59.7%) | 180 (40.3%) |
| Law Enforcement | 102 (100.0%) | 0 (0.0%) |
| Food Preparation & Serving | 609 (59.0%) | 424 (41.0%) |
| Cleaning & Maintenance | 713 (64.9%) | 385 (35.1%) |
| Personal Care & Service | 71 (18.8%) | 306 (81.2%) |
| Total (Category) | 1,773 (51.7%) | 1,658 (48.3%) |
| Total (Overall) | 5,464 (53.1%) | 4,829 (46.9%) |
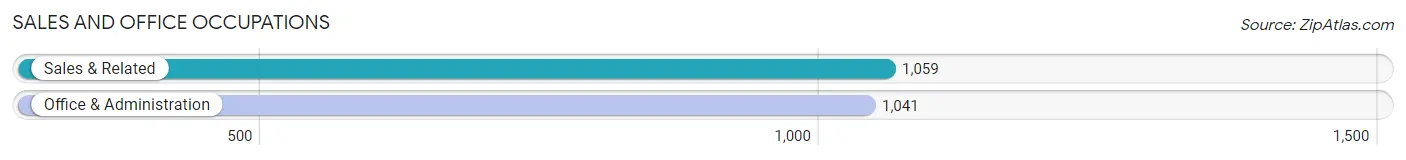
Sales and Office Occupations
The most common Sales and Office occupations in Brent are Sales & Related (1,059 | 10.3%), and Office & Administration (1,041 | 10.1%).
Sales and Office Occupations by Sex
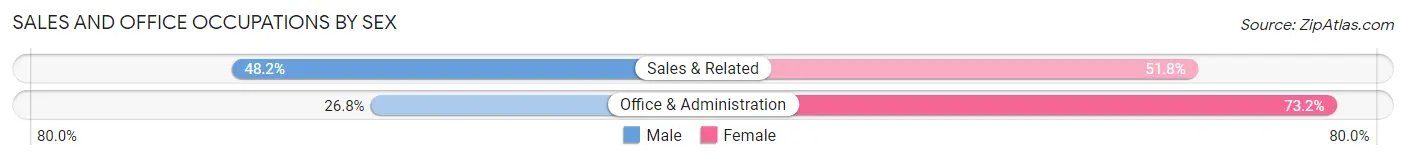
| Occupation | Male | Female |
| Sales & Related | 510 (48.2%) | 549 (51.8%) |
| Office & Administration | 279 (26.8%) | 762 (73.2%) |
| Total (Category) | 789 (37.6%) | 1,311 (62.4%) |
| Total (Overall) | 5,464 (53.1%) | 4,829 (46.9%) |
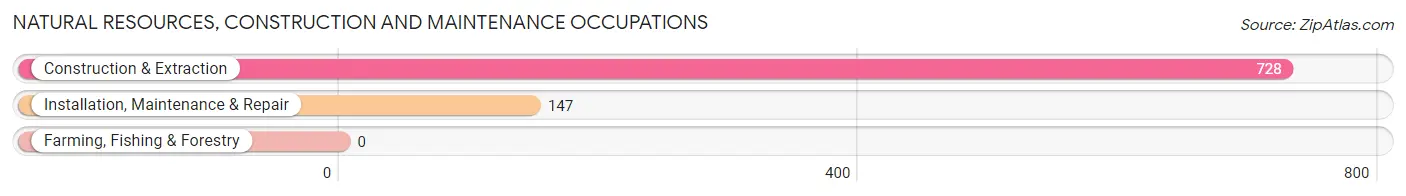
Natural Resources, Construction and Maintenance Occupations
The most common Natural Resources, Construction and Maintenance occupations in Brent are Construction & Extraction (728 | 7.1%), and Installation, Maintenance & Repair (147 | 1.4%).
Natural Resources, Construction and Maintenance Occupations by Sex
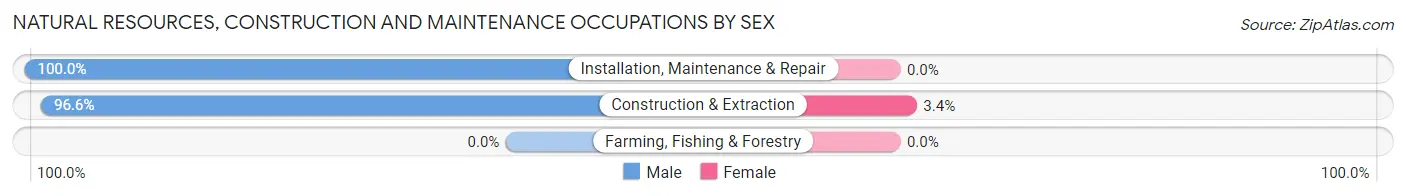
| Occupation | Male | Female |
| Farming, Fishing & Forestry | 0 (0.0%) | 0 (0.0%) |
| Construction & Extraction | 703 (96.6%) | 25 (3.4%) |
| Installation, Maintenance & Repair | 147 (100.0%) | 0 (0.0%) |
| Total (Category) | 850 (97.1%) | 25 (2.9%) |
| Total (Overall) | 5,464 (53.1%) | 4,829 (46.9%) |
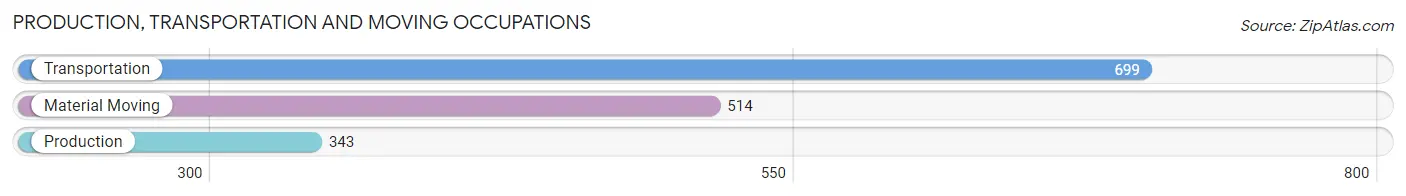
Production, Transportation and Moving Occupations
The most common Production, Transportation and Moving occupations in Brent are Transportation (699 | 6.8%), Material Moving (514 | 5.0%), and Production (343 | 3.3%).
Production, Transportation and Moving Occupations by Sex
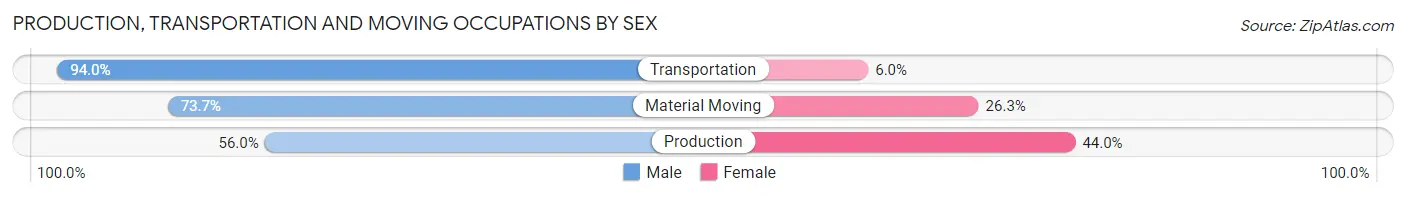
| Occupation | Male | Female |
| Production | 192 (56.0%) | 151 (44.0%) |
| Transportation | 657 (94.0%) | 42 (6.0%) |
| Material Moving | 379 (73.7%) | 135 (26.3%) |
| Total (Category) | 1,228 (78.9%) | 328 (21.1%) |
| Total (Overall) | 5,464 (53.1%) | 4,829 (46.9%) |
Employment Industries by Sex in Brent
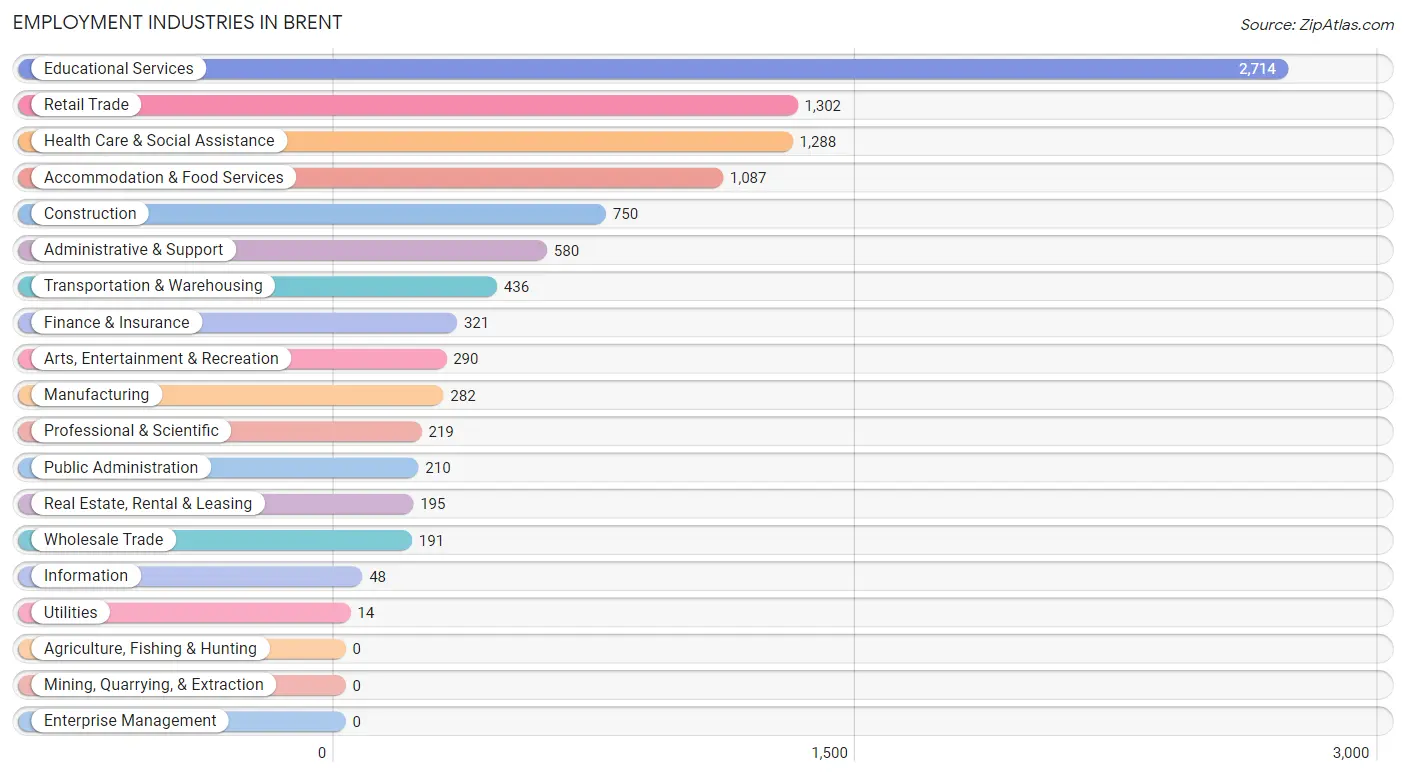
Employment Industries in Brent
The major employment industries in Brent include Educational Services (2,714 | 26.4%), Retail Trade (1,302 | 12.7%), Health Care & Social Assistance (1,288 | 12.5%), Accommodation & Food Services (1,087 | 10.6%), and Construction (750 | 7.3%).
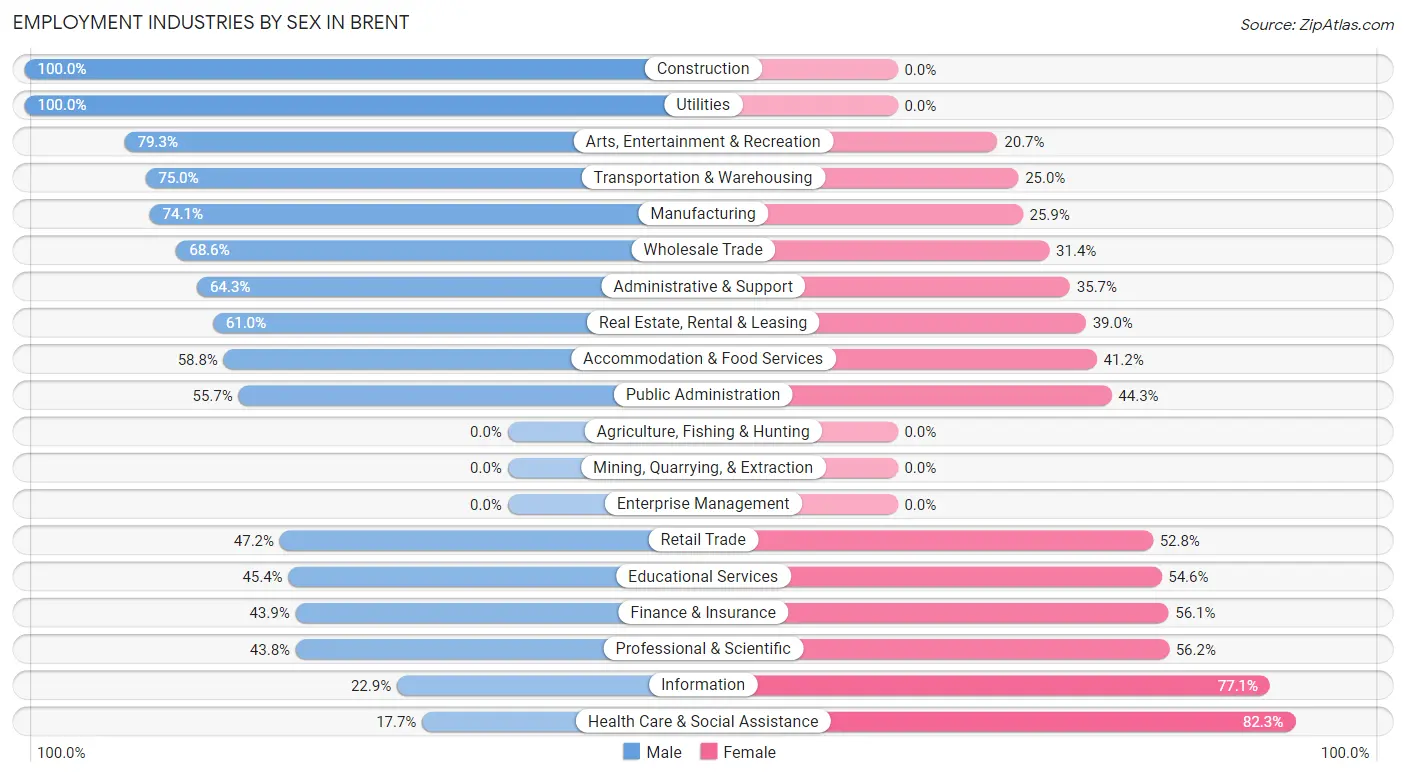
Employment Industries by Sex in Brent
The Brent industries that see more men than women are Construction (100.0%), Utilities (100.0%), and Arts, Entertainment & Recreation (79.3%), whereas the industries that tend to have a higher number of women are Health Care & Social Assistance (82.3%), Information (77.1%), and Professional & Scientific (56.2%).
| Industry | Male | Female |
| Agriculture, Fishing & Hunting | 0 (0.0%) | 0 (0.0%) |
| Mining, Quarrying, & Extraction | 0 (0.0%) | 0 (0.0%) |
| Construction | 750 (100.0%) | 0 (0.0%) |
| Manufacturing | 209 (74.1%) | 73 (25.9%) |
| Wholesale Trade | 131 (68.6%) | 60 (31.4%) |
| Retail Trade | 614 (47.2%) | 688 (52.8%) |
| Transportation & Warehousing | 327 (75.0%) | 109 (25.0%) |
| Utilities | 14 (100.0%) | 0 (0.0%) |
| Information | 11 (22.9%) | 37 (77.1%) |
| Finance & Insurance | 141 (43.9%) | 180 (56.1%) |
| Real Estate, Rental & Leasing | 119 (61.0%) | 76 (39.0%) |
| Professional & Scientific | 96 (43.8%) | 123 (56.2%) |
| Enterprise Management | 0 (0.0%) | 0 (0.0%) |
| Administrative & Support | 373 (64.3%) | 207 (35.7%) |
| Educational Services | 1,232 (45.4%) | 1,482 (54.6%) |
| Health Care & Social Assistance | 228 (17.7%) | 1,060 (82.3%) |
| Arts, Entertainment & Recreation | 230 (79.3%) | 60 (20.7%) |
| Accommodation & Food Services | 639 (58.8%) | 448 (41.2%) |
| Public Administration | 117 (55.7%) | 93 (44.3%) |
| Total | 5,464 (53.1%) | 4,829 (46.9%) |
Education in Brent
School Enrollment in Brent
The most common levels of schooling among the 9,144 students in Brent are college / undergraduate (5,483 | 60.0%), elementary school (1,316 | 14.4%), and middle school (1,145 | 12.5%).
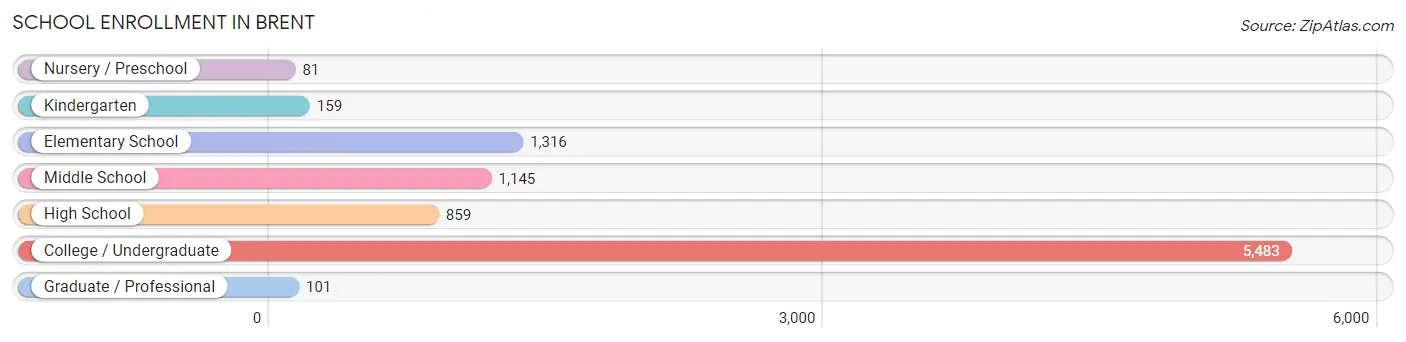
| School Level | # Students | % Students |
| Nursery / Preschool | 81 | 0.9% |
| Kindergarten | 159 | 1.7% |
| Elementary School | 1,316 | 14.4% |
| Middle School | 1,145 | 12.5% |
| High School | 859 | 9.4% |
| College / Undergraduate | 5,483 | 60.0% |
| Graduate / Professional | 101 | 1.1% |
| Total | 9,144 | 100.0% |
School Enrollment by Age by Funding Source in Brent
Out of a total of 9,144 students who are enrolled in schools in Brent, 5,221 (57.1%) attend a private institution, while the remaining 3,923 (42.9%) are enrolled in public schools. The age group of 20 to 24 year olds has the highest likelihood of being enrolled in private schools, with 2,536 (91.9% in the age bracket) enrolled. Conversely, the age group of 5 to 9 year old has the lowest likelihood of being enrolled in a private school, with 1,100 (94.5% in the age bracket) attending a public institution.
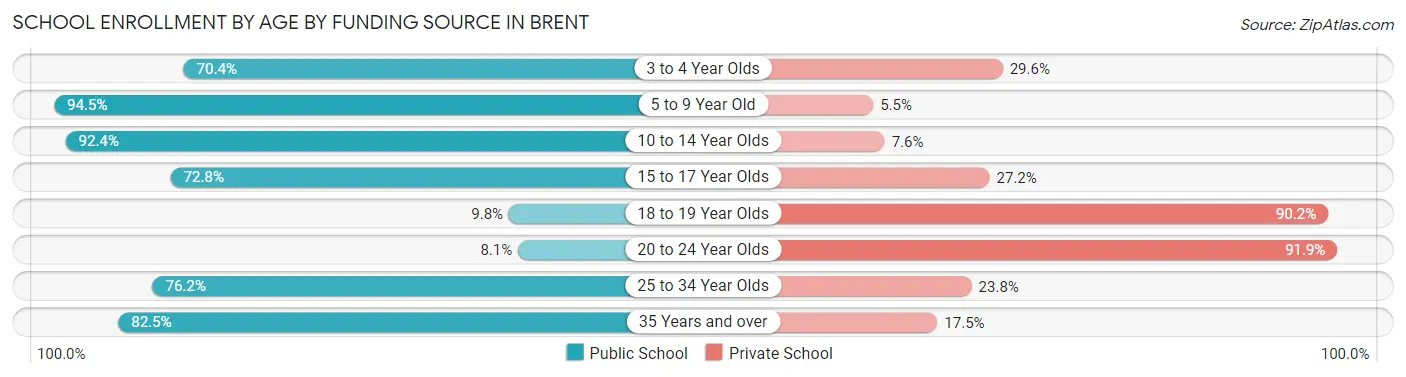
| Age Bracket | Public School | Private School |
| 3 to 4 Year Olds | 57 (70.4%) | 24 (29.6%) |
| 5 to 9 Year Old | 1,100 (94.5%) | 64 (5.5%) |
| 10 to 14 Year Olds | 1,486 (92.4%) | 123 (7.6%) |
| 15 to 17 Year Olds | 477 (72.8%) | 178 (27.2%) |
| 18 to 19 Year Olds | 240 (9.8%) | 2,212 (90.2%) |
| 20 to 24 Year Olds | 223 (8.1%) | 2,536 (91.9%) |
| 25 to 34 Year Olds | 131 (76.2%) | 41 (23.8%) |
| 35 Years and over | 208 (82.5%) | 44 (17.5%) |
| Total | 3,923 (42.9%) | 5,221 (57.1%) |
Educational Attainment by Field of Study in Brent
Business (485 | 22.3%), education (246 | 11.3%), social sciences (227 | 10.4%), science & technology (185 | 8.5%), and psychology (176 | 8.1%) are the most common fields of study among 2,177 individuals in Brent who have obtained a bachelor's degree or higher.
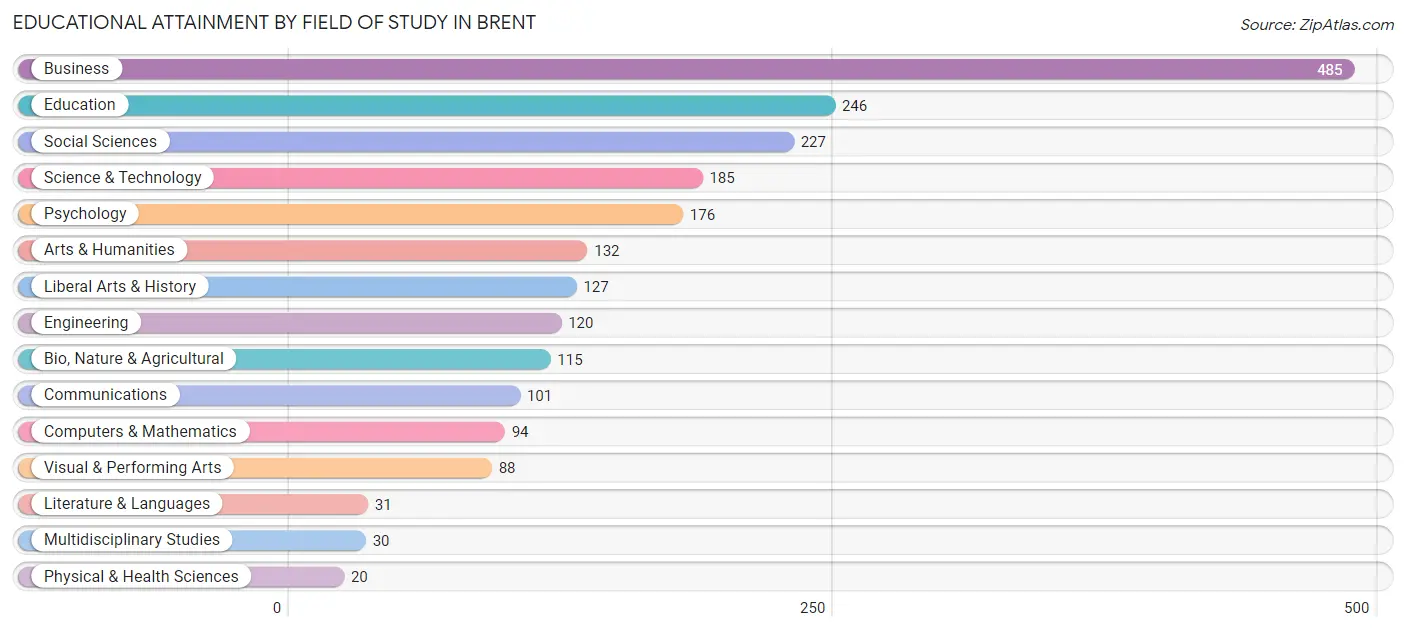
| Field of Study | # Graduates | % Graduates |
| Computers & Mathematics | 94 | 4.3% |
| Bio, Nature & Agricultural | 115 | 5.3% |
| Physical & Health Sciences | 20 | 0.9% |
| Psychology | 176 | 8.1% |
| Social Sciences | 227 | 10.4% |
| Engineering | 120 | 5.5% |
| Multidisciplinary Studies | 30 | 1.4% |
| Science & Technology | 185 | 8.5% |
| Business | 485 | 22.3% |
| Education | 246 | 11.3% |
| Literature & Languages | 31 | 1.4% |
| Liberal Arts & History | 127 | 5.8% |
| Visual & Performing Arts | 88 | 4.0% |
| Communications | 101 | 4.6% |
| Arts & Humanities | 132 | 6.1% |
| Total | 2,177 | 100.0% |
Transportation & Commute in Brent
Vehicle Availability by Sex in Brent
The most prevalent vehicle ownership categories in Brent are males with 2 vehicles (1,780, accounting for 46.7%) and females with 2 vehicles (1,312, making up 54.7%).
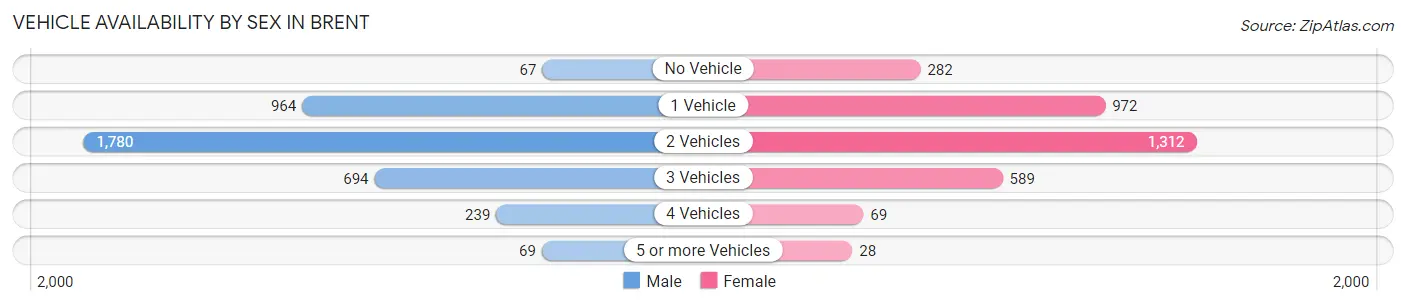
| Vehicles Available | Male | Female |
| No Vehicle | 67 (1.8%) | 282 (8.7%) |
| 1 Vehicle | 964 (25.3%) | 972 (29.9%) |
| 2 Vehicles | 1,780 (46.7%) | 1,312 (40.3%) |
| 3 Vehicles | 694 (18.2%) | 589 (18.1%) |
| 4 Vehicles | 239 (6.3%) | 69 (2.1%) |
| 5 or more Vehicles | 69 (1.8%) | 28 (0.9%) |
| Total | 3,813 (100.0%) | 3,252 (100.0%) |
Commute Time in Brent
The most frequently occuring commute durations in Brent are 15 to 19 minutes (2,000 commuters, 26.9%), 5 to 9 minutes (1,182 commuters, 15.9%), and 20 to 24 minutes (1,145 commuters, 15.4%).
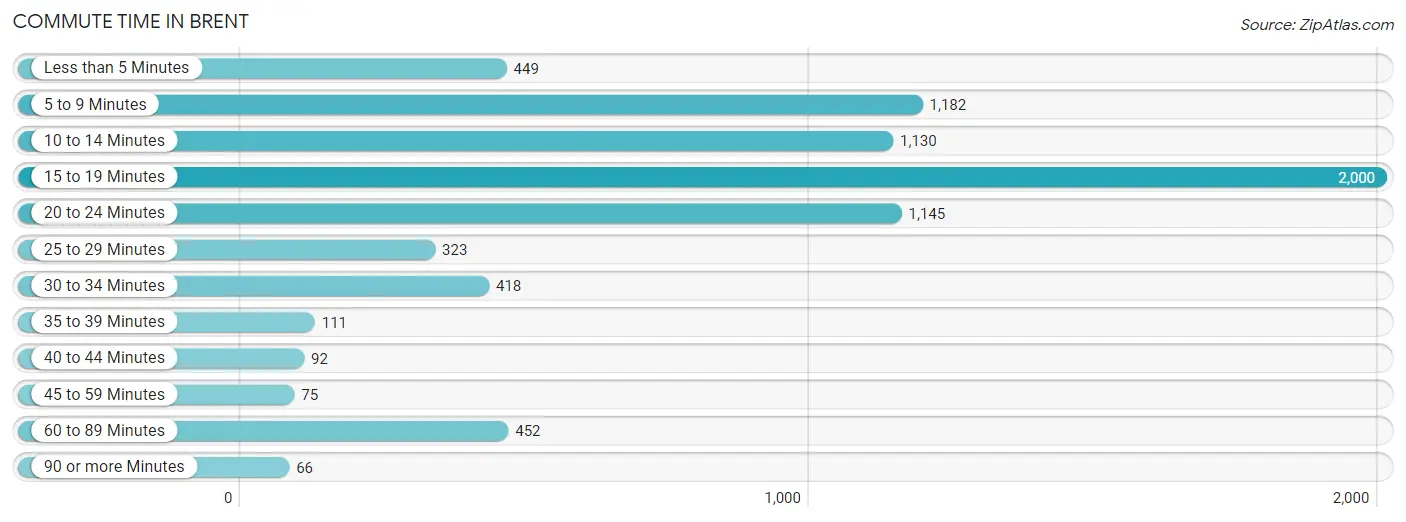
| Commute Time | # Commuters | % Commuters |
| Less than 5 Minutes | 449 | 6.0% |
| 5 to 9 Minutes | 1,182 | 15.9% |
| 10 to 14 Minutes | 1,130 | 15.2% |
| 15 to 19 Minutes | 2,000 | 26.9% |
| 20 to 24 Minutes | 1,145 | 15.4% |
| 25 to 29 Minutes | 323 | 4.3% |
| 30 to 34 Minutes | 418 | 5.6% |
| 35 to 39 Minutes | 111 | 1.5% |
| 40 to 44 Minutes | 92 | 1.2% |
| 45 to 59 Minutes | 75 | 1.0% |
| 60 to 89 Minutes | 452 | 6.1% |
| 90 or more Minutes | 66 | 0.9% |
Commute Time by Sex in Brent
The most common commute times in Brent are 15 to 19 minutes (1,043 commuters, 26.5%) for males and 15 to 19 minutes (957 commuters, 27.3%) for females.
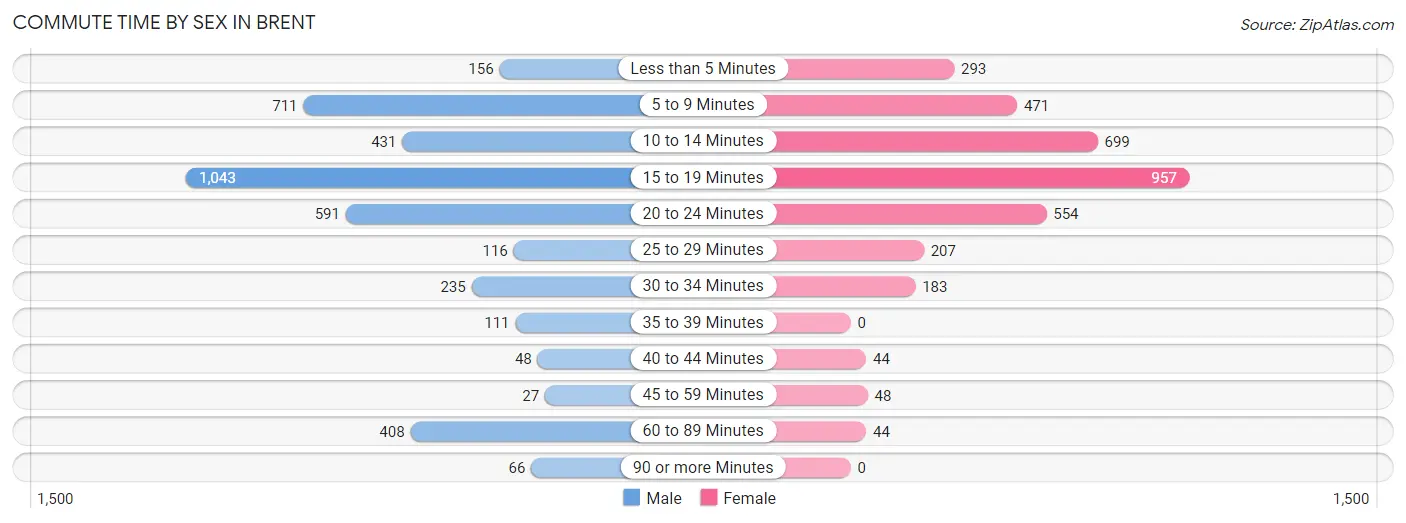
| Commute Time | Male | Female |
| Less than 5 Minutes | 156 (4.0%) | 293 (8.4%) |
| 5 to 9 Minutes | 711 (18.0%) | 471 (13.5%) |
| 10 to 14 Minutes | 431 (10.9%) | 699 (20.0%) |
| 15 to 19 Minutes | 1,043 (26.5%) | 957 (27.3%) |
| 20 to 24 Minutes | 591 (15.0%) | 554 (15.8%) |
| 25 to 29 Minutes | 116 (2.9%) | 207 (5.9%) |
| 30 to 34 Minutes | 235 (6.0%) | 183 (5.2%) |
| 35 to 39 Minutes | 111 (2.8%) | 0 (0.0%) |
| 40 to 44 Minutes | 48 (1.2%) | 44 (1.3%) |
| 45 to 59 Minutes | 27 (0.7%) | 48 (1.4%) |
| 60 to 89 Minutes | 408 (10.3%) | 44 (1.3%) |
| 90 or more Minutes | 66 (1.7%) | 0 (0.0%) |
Time of Departure to Work by Sex in Brent
The most frequent times of departure to work in Brent are 7:00 AM to 7:29 AM (635, 16.1%) for males and 7:30 AM to 7:59 AM (724, 20.7%) for females.
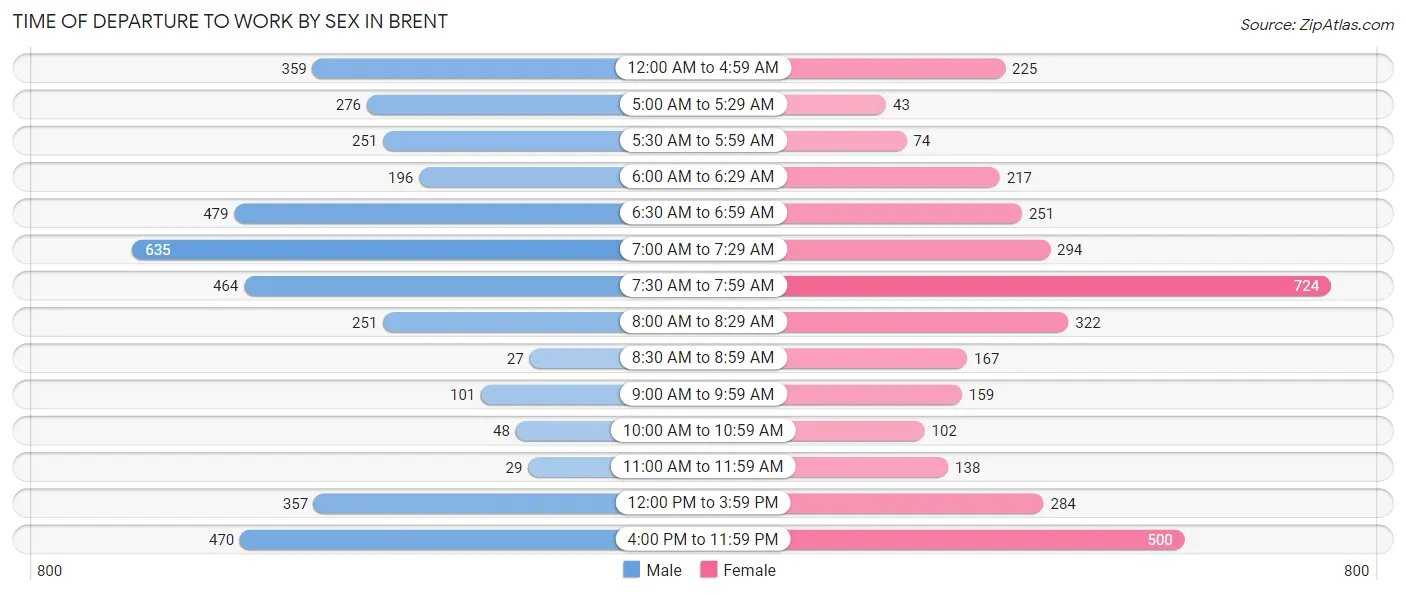
| Time of Departure | Male | Female |
| 12:00 AM to 4:59 AM | 359 (9.1%) | 225 (6.4%) |
| 5:00 AM to 5:29 AM | 276 (7.0%) | 43 (1.2%) |
| 5:30 AM to 5:59 AM | 251 (6.4%) | 74 (2.1%) |
| 6:00 AM to 6:29 AM | 196 (5.0%) | 217 (6.2%) |
| 6:30 AM to 6:59 AM | 479 (12.1%) | 251 (7.2%) |
| 7:00 AM to 7:29 AM | 635 (16.1%) | 294 (8.4%) |
| 7:30 AM to 7:59 AM | 464 (11.8%) | 724 (20.7%) |
| 8:00 AM to 8:29 AM | 251 (6.4%) | 322 (9.2%) |
| 8:30 AM to 8:59 AM | 27 (0.7%) | 167 (4.8%) |
| 9:00 AM to 9:59 AM | 101 (2.6%) | 159 (4.5%) |
| 10:00 AM to 10:59 AM | 48 (1.2%) | 102 (2.9%) |
| 11:00 AM to 11:59 AM | 29 (0.7%) | 138 (3.9%) |
| 12:00 PM to 3:59 PM | 357 (9.0%) | 284 (8.1%) |
| 4:00 PM to 11:59 PM | 470 (11.9%) | 500 (14.3%) |
| Total | 3,943 (100.0%) | 3,500 (100.0%) |
Housing Occupancy in Brent
Occupancy by Ownership in Brent
Of the total 7,372 dwellings in Brent, owner-occupied units account for 3,601 (48.8%), while renter-occupied units make up 3,771 (51.1%).
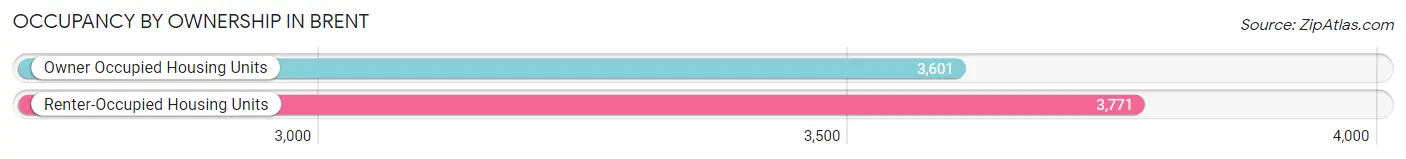
| Occupancy | # Housing Units | % Housing Units |
| Owner Occupied Housing Units | 3,601 | 48.8% |
| Renter-Occupied Housing Units | 3,771 | 51.1% |
| Total Occupied Housing Units | 7,372 | 100.0% |
Occupancy by Household Size in Brent
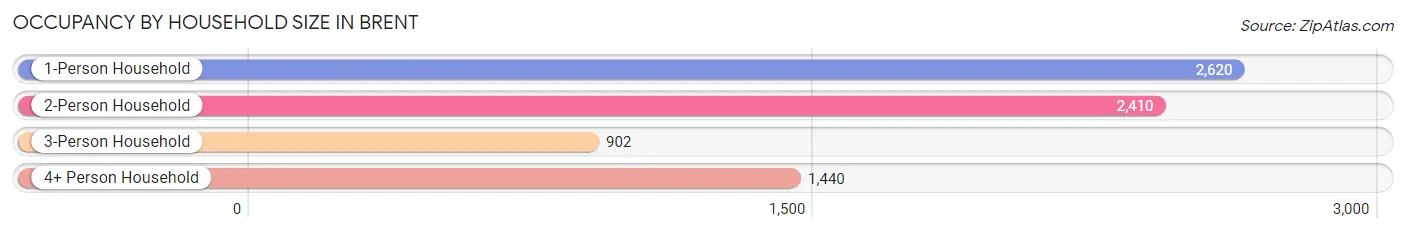
| Household Size | # Housing Units | % Housing Units |
| 1-Person Household | 2,620 | 35.5% |
| 2-Person Household | 2,410 | 32.7% |
| 3-Person Household | 902 | 12.2% |
| 4+ Person Household | 1,440 | 19.5% |
| Total Housing Units | 7,372 | 100.0% |
Occupancy by Ownership by Household Size in Brent
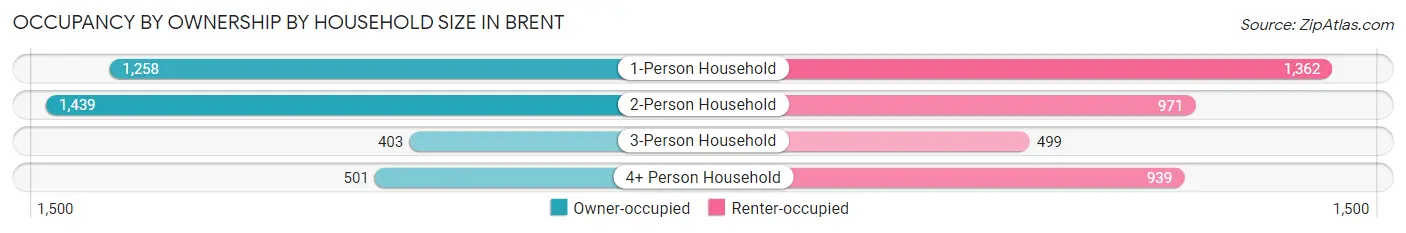
| Household Size | Owner-occupied | Renter-occupied |
| 1-Person Household | 1,258 (48.0%) | 1,362 (52.0%) |
| 2-Person Household | 1,439 (59.7%) | 971 (40.3%) |
| 3-Person Household | 403 (44.7%) | 499 (55.3%) |
| 4+ Person Household | 501 (34.8%) | 939 (65.2%) |
| Total Housing Units | 3,601 (48.8%) | 3,771 (51.1%) |
Occupancy by Educational Attainment in Brent
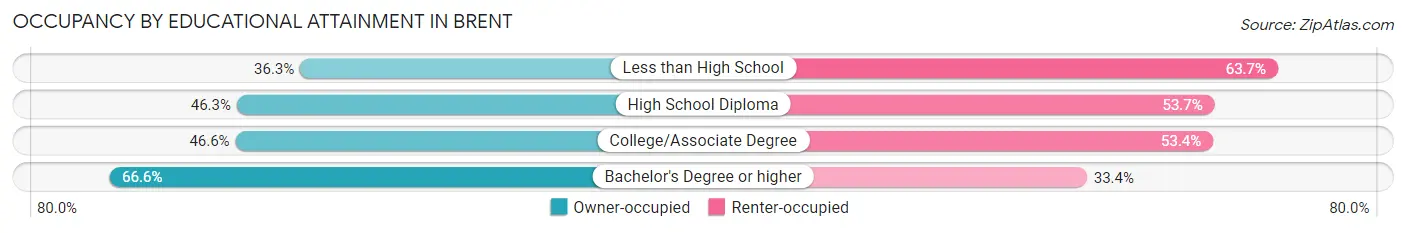
| Household Size | Owner-occupied | Renter-occupied |
| Less than High School | 359 (36.3%) | 630 (63.7%) |
| High School Diploma | 1,094 (46.3%) | 1,267 (53.7%) |
| College/Associate Degree | 1,233 (46.6%) | 1,415 (53.4%) |
| Bachelor's Degree or higher | 915 (66.6%) | 459 (33.4%) |
Occupancy by Age of Householder in Brent
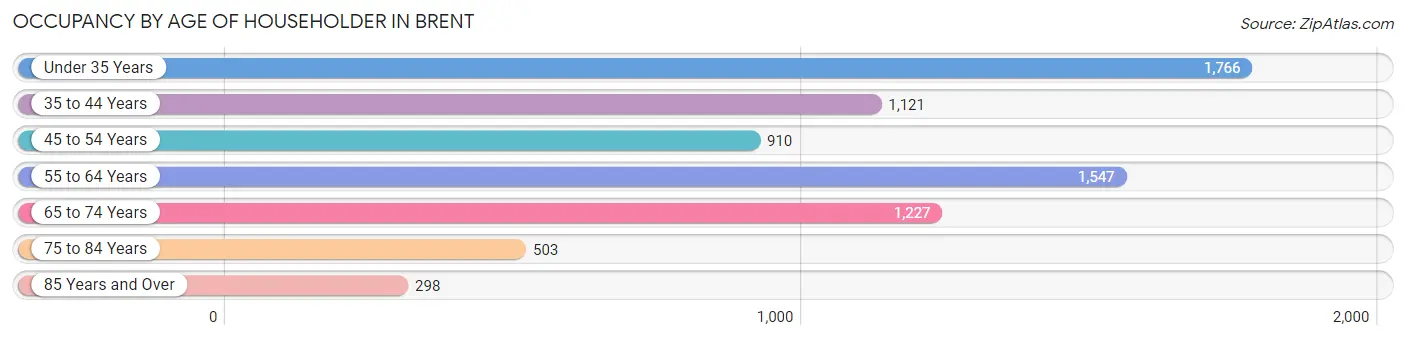
| Age Bracket | # Households | % Households |
| Under 35 Years | 1,766 | 24.0% |
| 35 to 44 Years | 1,121 | 15.2% |
| 45 to 54 Years | 910 | 12.3% |
| 55 to 64 Years | 1,547 | 21.0% |
| 65 to 74 Years | 1,227 | 16.6% |
| 75 to 84 Years | 503 | 6.8% |
| 85 Years and Over | 298 | 4.0% |
| Total | 7,372 | 100.0% |
Housing Finances in Brent
Median Income by Occupancy in Brent
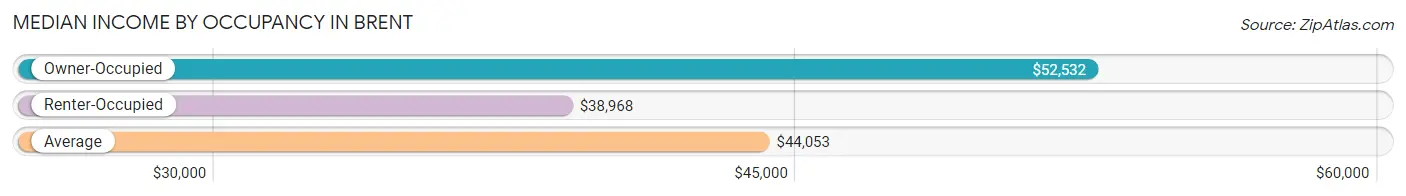
| Occupancy Type | # Households | Median Income |
| Owner-Occupied | 3,601 (48.8%) | $52,532 |
| Renter-Occupied | 3,771 (51.1%) | $38,968 |
| Average | 7,372 (100.0%) | $44,053 |
Occupancy by Householder Income Bracket in Brent
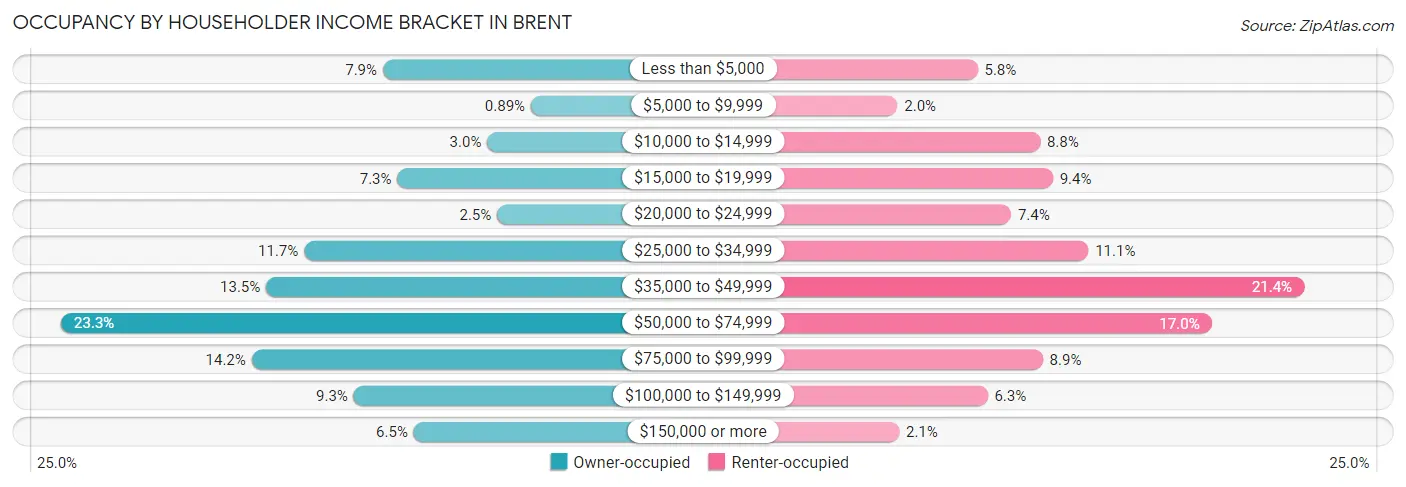
| Income Bracket | Owner-occupied | Renter-occupied |
| Less than $5,000 | 286 (7.9%) | 219 (5.8%) |
| $5,000 to $9,999 | 32 (0.9%) | 75 (2.0%) |
| $10,000 to $14,999 | 107 (3.0%) | 331 (8.8%) |
| $15,000 to $19,999 | 261 (7.2%) | 354 (9.4%) |
| $20,000 to $24,999 | 90 (2.5%) | 279 (7.4%) |
| $25,000 to $34,999 | 421 (11.7%) | 418 (11.1%) |
| $35,000 to $49,999 | 486 (13.5%) | 805 (21.3%) |
| $50,000 to $74,999 | 838 (23.3%) | 639 (17.0%) |
| $75,000 to $99,999 | 511 (14.2%) | 336 (8.9%) |
| $100,000 to $149,999 | 336 (9.3%) | 237 (6.3%) |
| $150,000 or more | 233 (6.5%) | 78 (2.1%) |
| Total | 3,601 (100.0%) | 3,771 (100.0%) |
Monthly Housing Cost Tiers in Brent
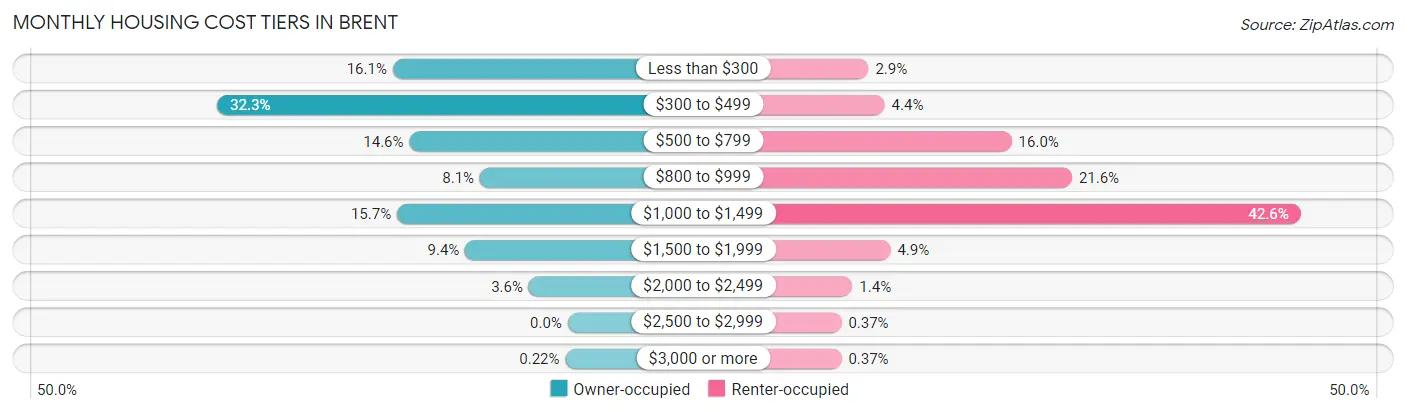
| Monthly Cost | Owner-occupied | Renter-occupied |
| Less than $300 | 580 (16.1%) | 108 (2.9%) |
| $300 to $499 | 1,162 (32.3%) | 164 (4.3%) |
| $500 to $799 | 525 (14.6%) | 605 (16.0%) |
| $800 to $999 | 291 (8.1%) | 814 (21.6%) |
| $1,000 to $1,499 | 566 (15.7%) | 1,608 (42.6%) |
| $1,500 to $1,999 | 340 (9.4%) | 184 (4.9%) |
| $2,000 to $2,499 | 129 (3.6%) | 52 (1.4%) |
| $2,500 to $2,999 | 0 (0.0%) | 14 (0.4%) |
| $3,000 or more | 8 (0.2%) | 14 (0.4%) |
| Total | 3,601 (100.0%) | 3,771 (100.0%) |
Physical Housing Characteristics in Brent
Housing Structures in Brent
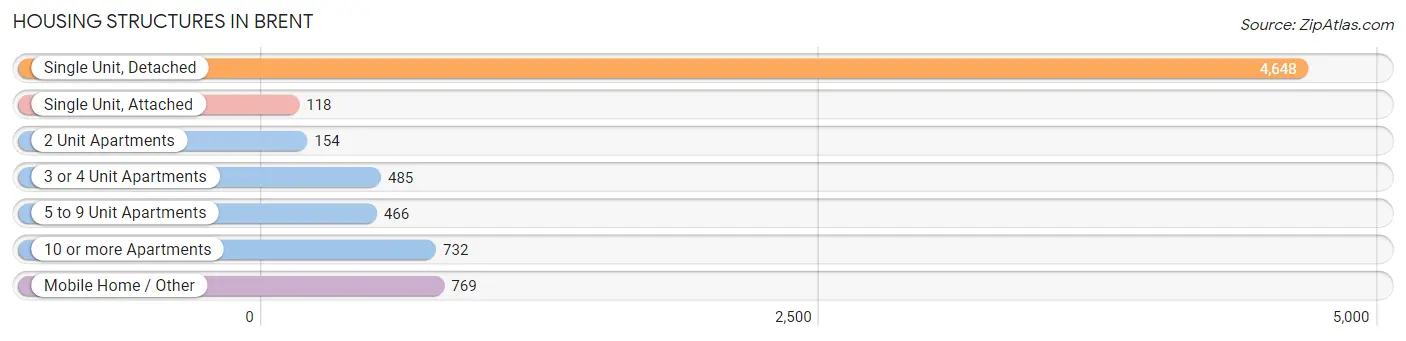
| Structure Type | # Housing Units | % Housing Units |
| Single Unit, Detached | 4,648 | 63.0% |
| Single Unit, Attached | 118 | 1.6% |
| 2 Unit Apartments | 154 | 2.1% |
| 3 or 4 Unit Apartments | 485 | 6.6% |
| 5 to 9 Unit Apartments | 466 | 6.3% |
| 10 or more Apartments | 732 | 9.9% |
| Mobile Home / Other | 769 | 10.4% |
| Total | 7,372 | 100.0% |
Housing Structures by Occupancy in Brent
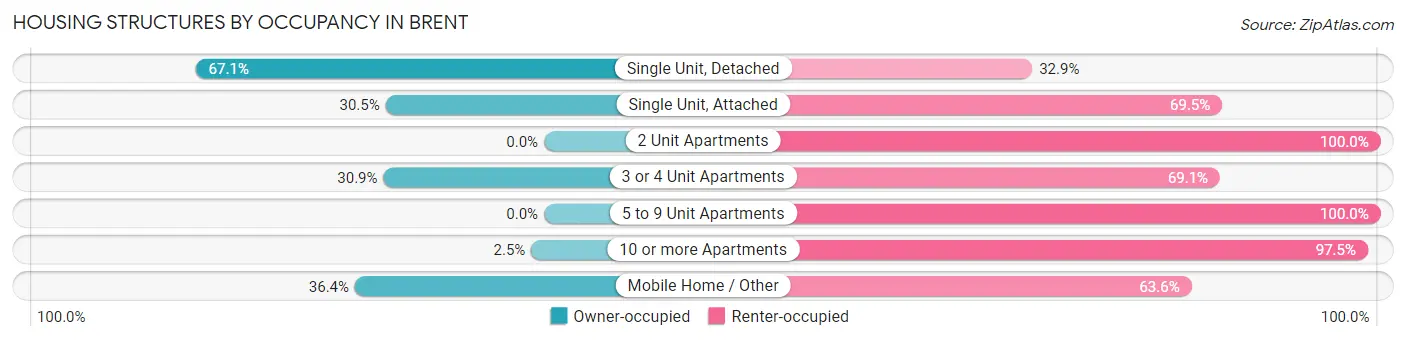
| Structure Type | Owner-occupied | Renter-occupied |
| Single Unit, Detached | 3,117 (67.1%) | 1,531 (32.9%) |
| Single Unit, Attached | 36 (30.5%) | 82 (69.5%) |
| 2 Unit Apartments | 0 (0.0%) | 154 (100.0%) |
| 3 or 4 Unit Apartments | 150 (30.9%) | 335 (69.1%) |
| 5 to 9 Unit Apartments | 0 (0.0%) | 466 (100.0%) |
| 10 or more Apartments | 18 (2.5%) | 714 (97.5%) |
| Mobile Home / Other | 280 (36.4%) | 489 (63.6%) |
| Total | 3,601 (48.8%) | 3,771 (51.1%) |
Housing Structures by Number of Rooms in Brent
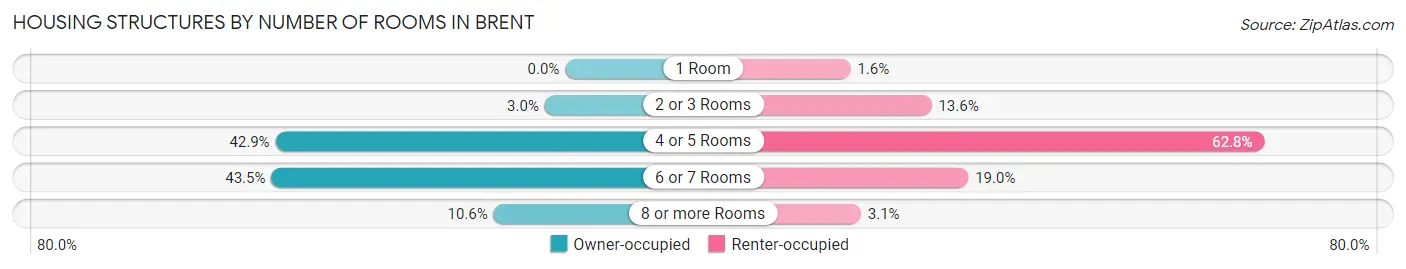
| Number of Rooms | Owner-occupied | Renter-occupied |
| 1 Room | 0 (0.0%) | 59 (1.6%) |
| 2 or 3 Rooms | 109 (3.0%) | 511 (13.6%) |
| 4 or 5 Rooms | 1,544 (42.9%) | 2,368 (62.8%) |
| 6 or 7 Rooms | 1,566 (43.5%) | 716 (19.0%) |
| 8 or more Rooms | 382 (10.6%) | 117 (3.1%) |
| Total | 3,601 (100.0%) | 3,771 (100.0%) |
Housing Structure by Heating Type in Brent
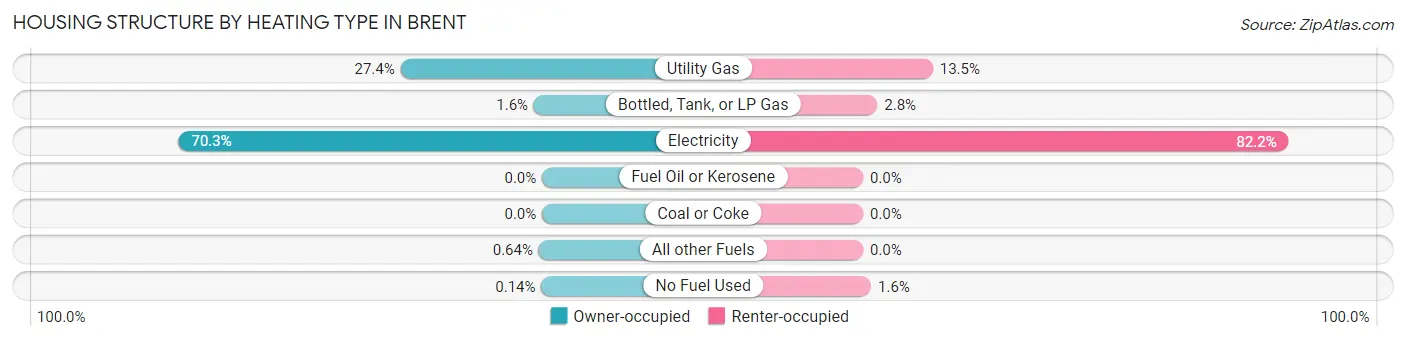
| Heating Type | Owner-occupied | Renter-occupied |
| Utility Gas | 985 (27.4%) | 508 (13.5%) |
| Bottled, Tank, or LP Gas | 57 (1.6%) | 104 (2.8%) |
| Electricity | 2,531 (70.3%) | 3,100 (82.2%) |
| Fuel Oil or Kerosene | 0 (0.0%) | 0 (0.0%) |
| Coal or Coke | 0 (0.0%) | 0 (0.0%) |
| All other Fuels | 23 (0.6%) | 0 (0.0%) |
| No Fuel Used | 5 (0.1%) | 59 (1.6%) |
| Total | 3,601 (100.0%) | 3,771 (100.0%) |
Household Vehicle Usage in Brent
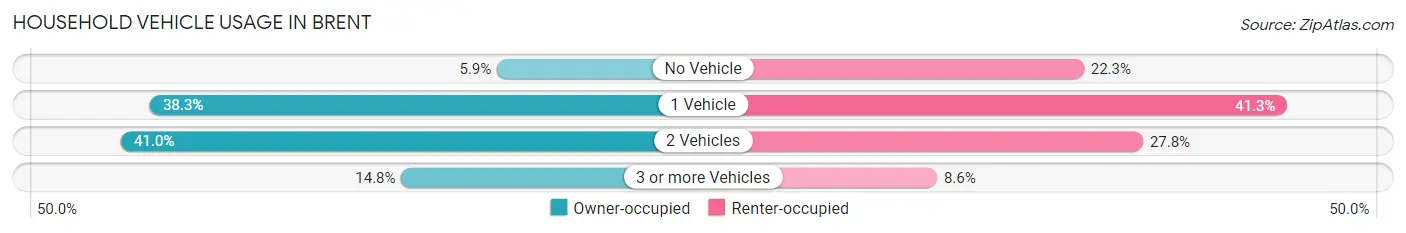
| Vehicles per Household | Owner-occupied | Renter-occupied |
| No Vehicle | 212 (5.9%) | 841 (22.3%) |
| 1 Vehicle | 1,379 (38.3%) | 1,557 (41.3%) |
| 2 Vehicles | 1,476 (41.0%) | 1,049 (27.8%) |
| 3 or more Vehicles | 534 (14.8%) | 324 (8.6%) |
| Total | 3,601 (100.0%) | 3,771 (100.0%) |
Real Estate & Mortgages in Brent
Real Estate and Mortgage Overview in Brent
| Characteristic | Without Mortgage | With Mortgage |
| Housing Units | 1,980 | 1,621 |
| Median Property Value | $90,800 | $130,100 |
| Median Household Income | $43,627 | $187 |
| Monthly Housing Costs | $341 | $8 |
| Real Estate Taxes | $573 | $35 |
Property Value by Mortgage Status in Brent
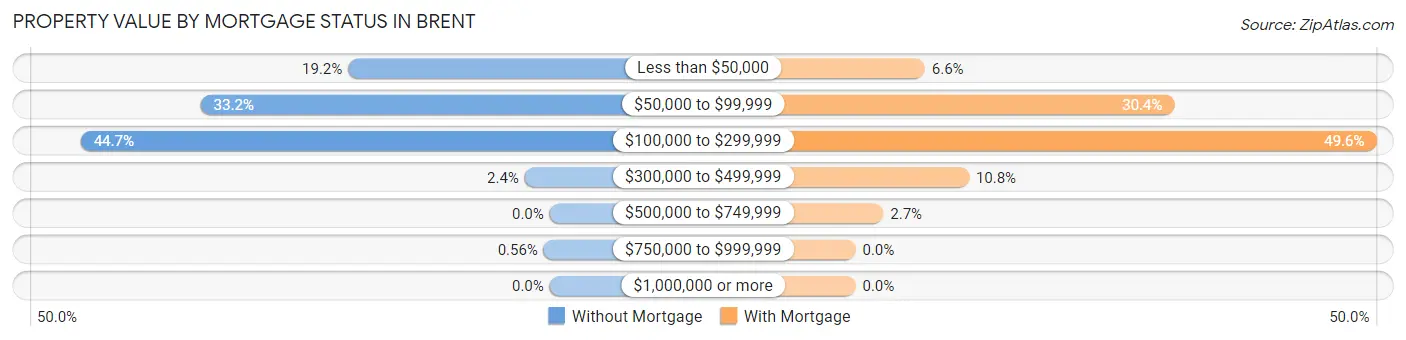
| Property Value | Without Mortgage | With Mortgage |
| Less than $50,000 | 380 (19.2%) | 107 (6.6%) |
| $50,000 to $99,999 | 658 (33.2%) | 492 (30.3%) |
| $100,000 to $299,999 | 884 (44.7%) | 804 (49.6%) |
| $300,000 to $499,999 | 47 (2.4%) | 175 (10.8%) |
| $500,000 to $749,999 | 0 (0.0%) | 43 (2.6%) |
| $750,000 to $999,999 | 11 (0.6%) | 0 (0.0%) |
| $1,000,000 or more | 0 (0.0%) | 0 (0.0%) |
| Total | 1,980 (100.0%) | 1,621 (100.0%) |
Household Income by Mortgage Status in Brent
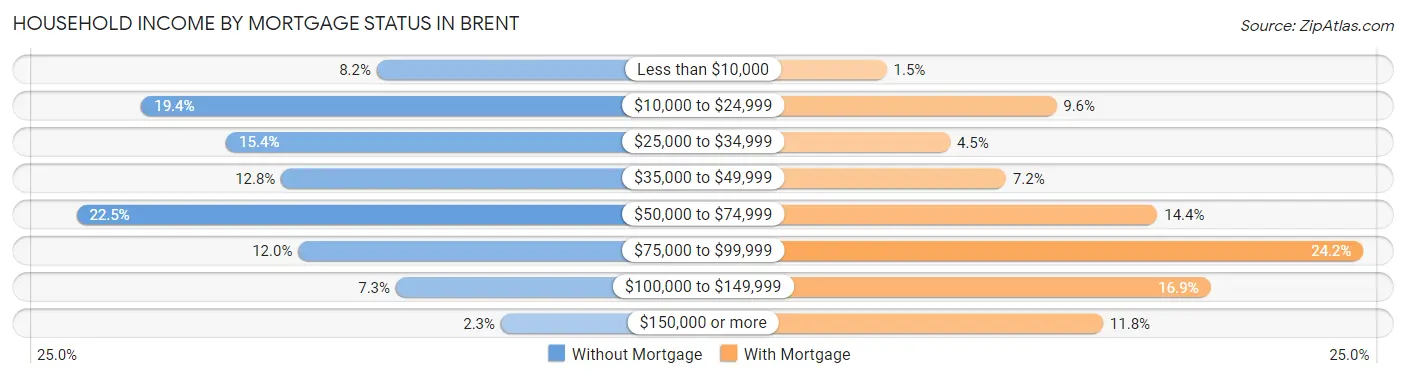
| Household Income | Without Mortgage | With Mortgage |
| Less than $10,000 | 163 (8.2%) | 24 (1.5%) |
| $10,000 to $24,999 | 385 (19.4%) | 155 (9.6%) |
| $25,000 to $34,999 | 305 (15.4%) | 73 (4.5%) |
| $35,000 to $49,999 | 253 (12.8%) | 116 (7.2%) |
| $50,000 to $74,999 | 446 (22.5%) | 233 (14.4%) |
| $75,000 to $99,999 | 237 (12.0%) | 392 (24.2%) |
| $100,000 to $149,999 | 145 (7.3%) | 274 (16.9%) |
| $150,000 or more | 46 (2.3%) | 191 (11.8%) |
| Total | 1,980 (100.0%) | 1,621 (100.0%) |
Property Value to Household Income Ratio in Brent
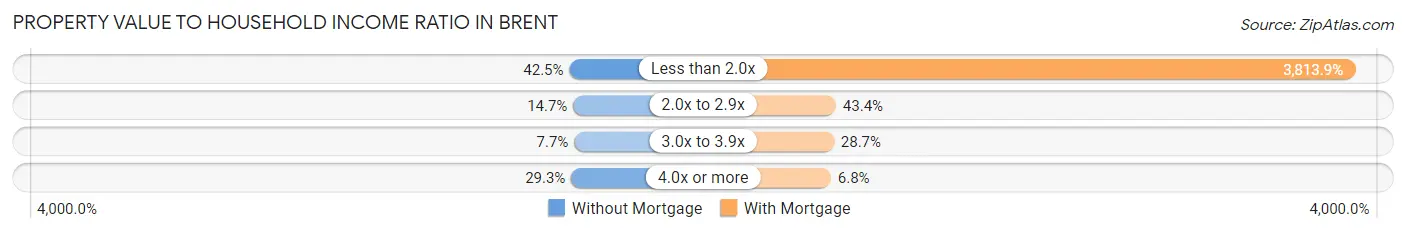
| Value-to-Income Ratio | Without Mortgage | With Mortgage |
| Less than 2.0x | 842 (42.5%) | 61,823 (3,813.9%) |
| 2.0x to 2.9x | 290 (14.6%) | 703 (43.4%) |
| 3.0x to 3.9x | 153 (7.7%) | 465 (28.7%) |
| 4.0x or more | 581 (29.3%) | 110 (6.8%) |
| Total | 1,980 (100.0%) | 1,621 (100.0%) |
Real Estate Taxes by Mortgage Status in Brent
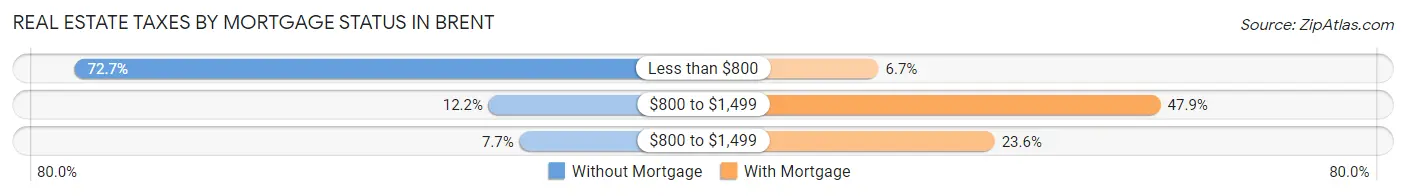
| Property Taxes | Without Mortgage | With Mortgage |
| Less than $800 | 1,439 (72.7%) | 108 (6.7%) |
| $800 to $1,499 | 241 (12.2%) | 776 (47.9%) |
| $800 to $1,499 | 152 (7.7%) | 383 (23.6%) |
| Total | 1,980 (100.0%) | 1,621 (100.0%) |
Health & Disability in Brent
Health Insurance Coverage by Age in Brent
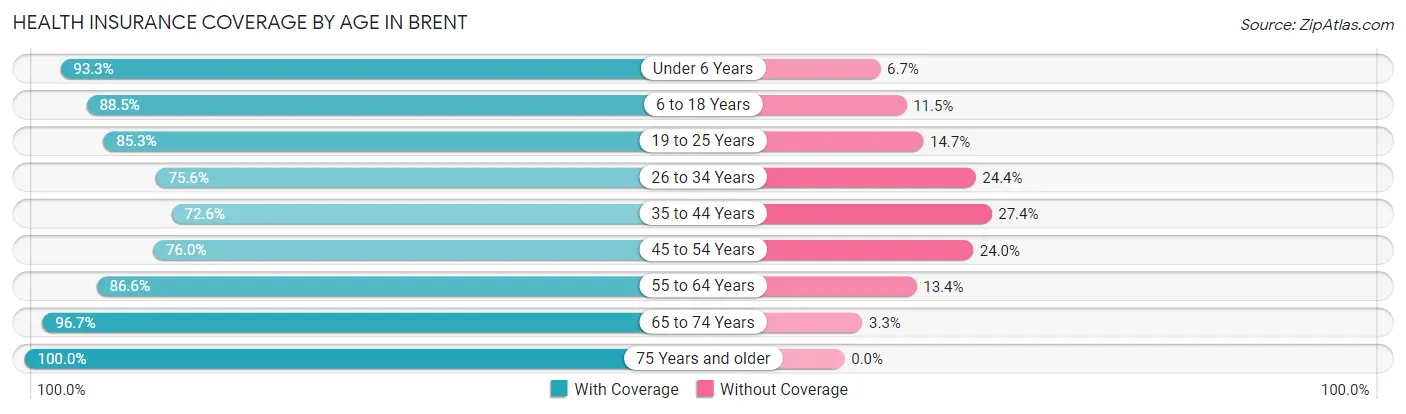
| Age Bracket | With Coverage | Without Coverage |
| Under 6 Years | 1,302 (93.3%) | 93 (6.7%) |
| 6 to 18 Years | 4,155 (88.5%) | 542 (11.5%) |
| 19 to 25 Years | 4,715 (85.3%) | 811 (14.7%) |
| 26 to 34 Years | 1,716 (75.6%) | 555 (24.4%) |
| 35 to 44 Years | 1,613 (72.6%) | 609 (27.4%) |
| 45 to 54 Years | 1,126 (76.0%) | 355 (24.0%) |
| 55 to 64 Years | 2,238 (86.6%) | 347 (13.4%) |
| 65 to 74 Years | 1,603 (96.7%) | 55 (3.3%) |
| 75 Years and older | 1,092 (100.0%) | 0 (0.0%) |
| Total | 19,560 (85.3%) | 3,367 (14.7%) |
Health Insurance Coverage by Citizenship Status in Brent
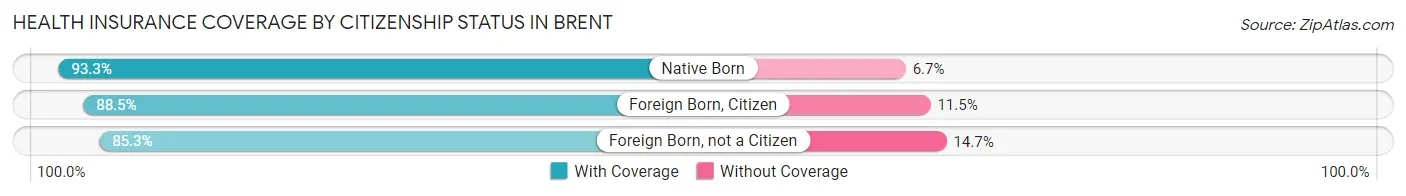
| Citizenship Status | With Coverage | Without Coverage |
| Native Born | 1,302 (93.3%) | 93 (6.7%) |
| Foreign Born, Citizen | 4,155 (88.5%) | 542 (11.5%) |
| Foreign Born, not a Citizen | 4,715 (85.3%) | 811 (14.7%) |
Health Insurance Coverage by Household Income in Brent
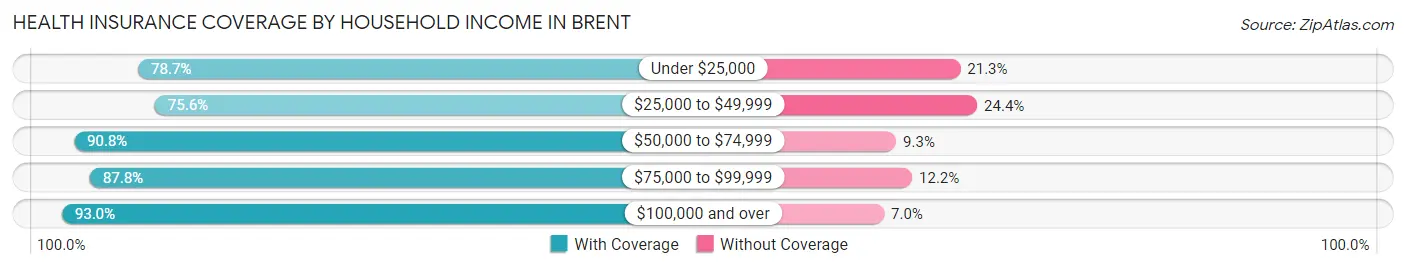
| Household Income | With Coverage | Without Coverage |
| Under $25,000 | 3,251 (78.7%) | 879 (21.3%) |
| $25,000 to $49,999 | 3,404 (75.6%) | 1,100 (24.4%) |
| $50,000 to $74,999 | 3,779 (90.7%) | 385 (9.2%) |
| $75,000 to $99,999 | 2,302 (87.8%) | 321 (12.2%) |
| $100,000 and over | 2,410 (93.0%) | 181 (7.0%) |
Public vs Private Health Insurance Coverage by Age in Brent
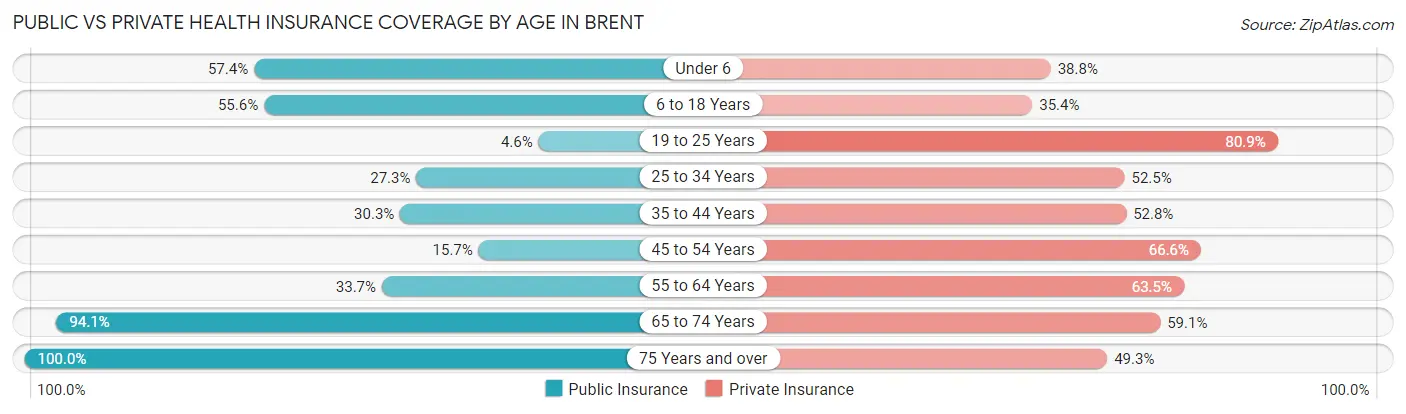
| Age Bracket | Public Insurance | Private Insurance |
| Under 6 | 801 (57.4%) | 541 (38.8%) |
| 6 to 18 Years | 2,610 (55.6%) | 1,661 (35.4%) |
| 19 to 25 Years | 255 (4.6%) | 4,469 (80.9%) |
| 25 to 34 Years | 620 (27.3%) | 1,192 (52.5%) |
| 35 to 44 Years | 673 (30.3%) | 1,173 (52.8%) |
| 45 to 54 Years | 233 (15.7%) | 987 (66.6%) |
| 55 to 64 Years | 871 (33.7%) | 1,641 (63.5%) |
| 65 to 74 Years | 1,560 (94.1%) | 980 (59.1%) |
| 75 Years and over | 1,092 (100.0%) | 538 (49.3%) |
| Total | 8,715 (38.0%) | 13,182 (57.5%) |
Disability Status by Sex by Age in Brent
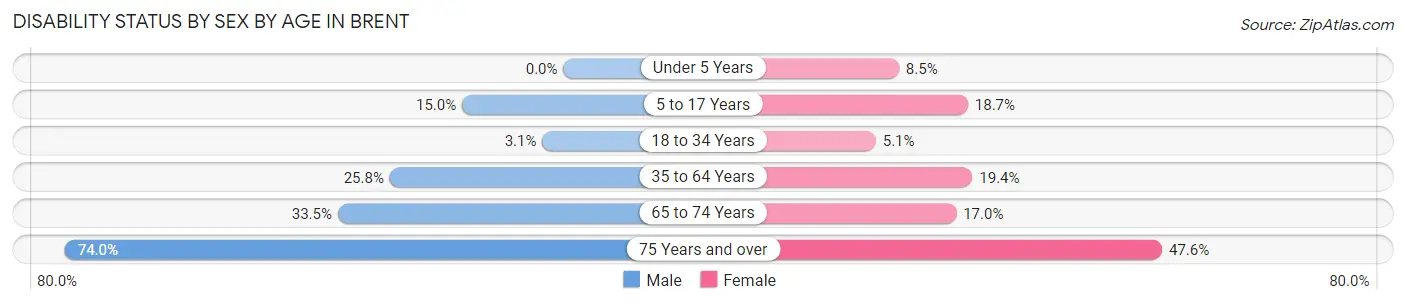
| Age Bracket | Male | Female |
| Under 5 Years | 0 (0.0%) | 38 (8.5%) |
| 5 to 17 Years | 358 (15.0%) | 269 (18.7%) |
| 18 to 34 Years | 134 (3.1%) | 223 (5.1%) |
| 35 to 64 Years | 786 (25.8%) | 628 (19.4%) |
| 65 to 74 Years | 293 (33.5%) | 133 (17.0%) |
| 75 Years and over | 416 (74.0%) | 252 (47.5%) |
Disability Class by Sex by Age in Brent
Disability Class: Hearing Difficulty
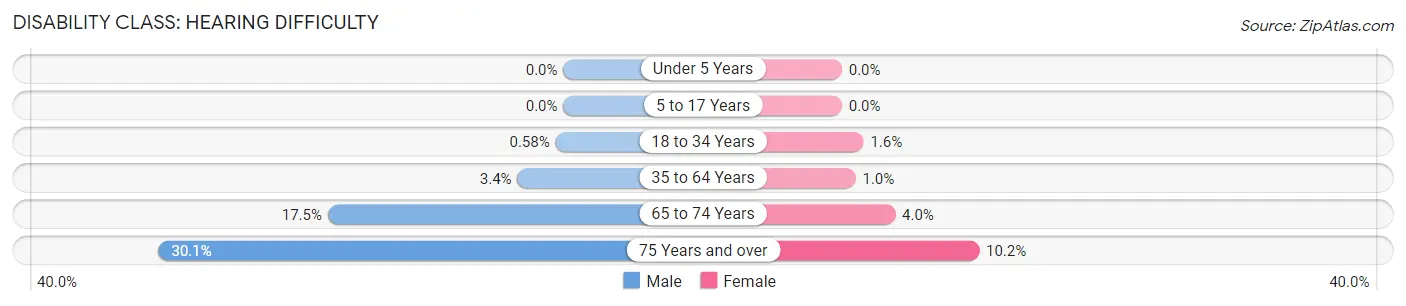
| Age Bracket | Male | Female |
| Under 5 Years | 0 (0.0%) | 0 (0.0%) |
| 5 to 17 Years | 0 (0.0%) | 0 (0.0%) |
| 18 to 34 Years | 25 (0.6%) | 71 (1.6%) |
| 35 to 64 Years | 104 (3.4%) | 33 (1.0%) |
| 65 to 74 Years | 153 (17.5%) | 31 (4.0%) |
| 75 Years and over | 169 (30.1%) | 54 (10.2%) |
Disability Class: Vision Difficulty
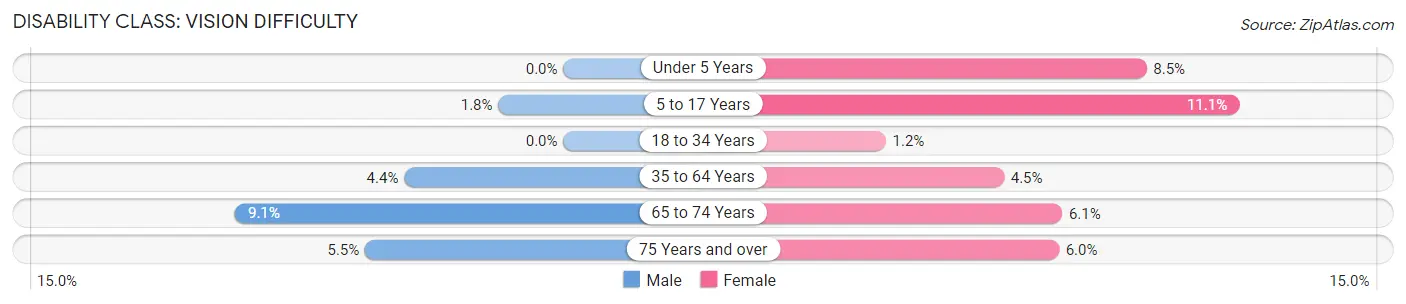
| Age Bracket | Male | Female |
| Under 5 Years | 0 (0.0%) | 38 (8.5%) |
| 5 to 17 Years | 43 (1.8%) | 159 (11.1%) |
| 18 to 34 Years | 0 (0.0%) | 54 (1.2%) |
| 35 to 64 Years | 135 (4.4%) | 146 (4.5%) |
| 65 to 74 Years | 80 (9.1%) | 48 (6.1%) |
| 75 Years and over | 31 (5.5%) | 32 (6.0%) |
Disability Class: Cognitive Difficulty
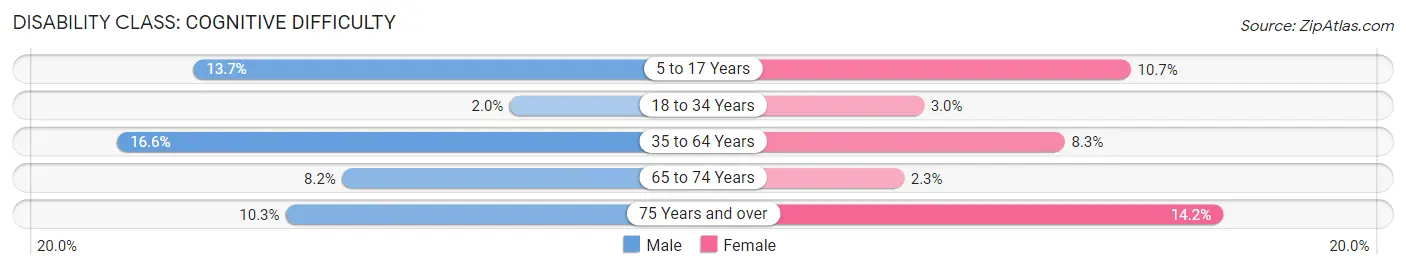
| Age Bracket | Male | Female |
| 5 to 17 Years | 327 (13.7%) | 154 (10.7%) |
| 18 to 34 Years | 86 (2.0%) | 134 (3.0%) |
| 35 to 64 Years | 505 (16.6%) | 268 (8.3%) |
| 65 to 74 Years | 72 (8.2%) | 18 (2.3%) |
| 75 Years and over | 58 (10.3%) | 75 (14.1%) |
Disability Class: Ambulatory Difficulty
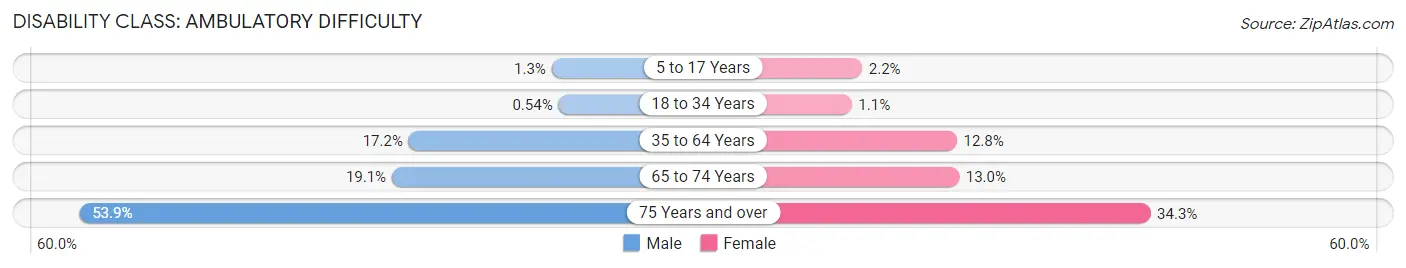
| Age Bracket | Male | Female |
| 5 to 17 Years | 31 (1.3%) | 32 (2.2%) |
| 18 to 34 Years | 23 (0.5%) | 47 (1.1%) |
| 35 to 64 Years | 525 (17.2%) | 414 (12.8%) |
| 65 to 74 Years | 167 (19.1%) | 102 (13.0%) |
| 75 Years and over | 303 (53.9%) | 182 (34.3%) |
Disability Class: Self-Care Difficulty
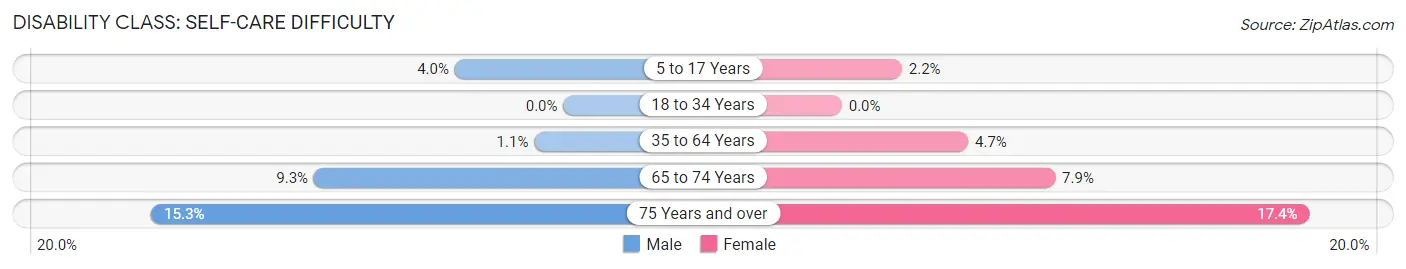
| Age Bracket | Male | Female |
| 5 to 17 Years | 96 (4.0%) | 32 (2.2%) |
| 18 to 34 Years | 0 (0.0%) | 0 (0.0%) |
| 35 to 64 Years | 33 (1.1%) | 152 (4.7%) |
| 65 to 74 Years | 81 (9.3%) | 62 (7.9%) |
| 75 Years and over | 86 (15.3%) | 92 (17.4%) |
Technology Access in Brent
Computing Device Access in Brent
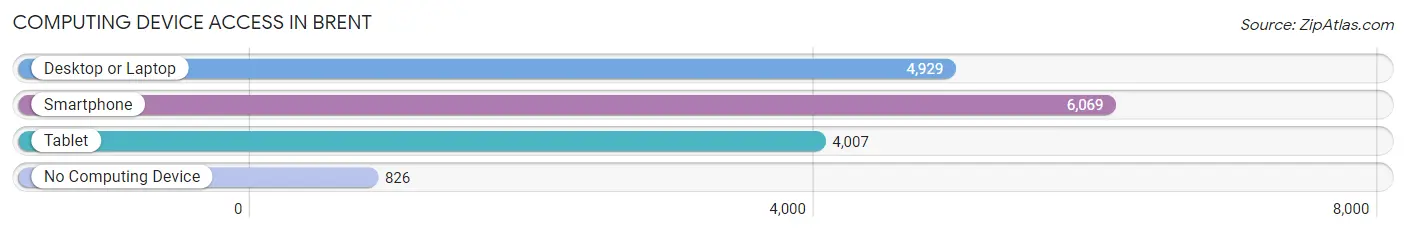
| Device Type | # Households | % Households |
| Desktop or Laptop | 4,929 | 66.9% |
| Smartphone | 6,069 | 82.3% |
| Tablet | 4,007 | 54.3% |
| No Computing Device | 826 | 11.2% |
| Total | 7,372 | 100.0% |
Internet Access in Brent
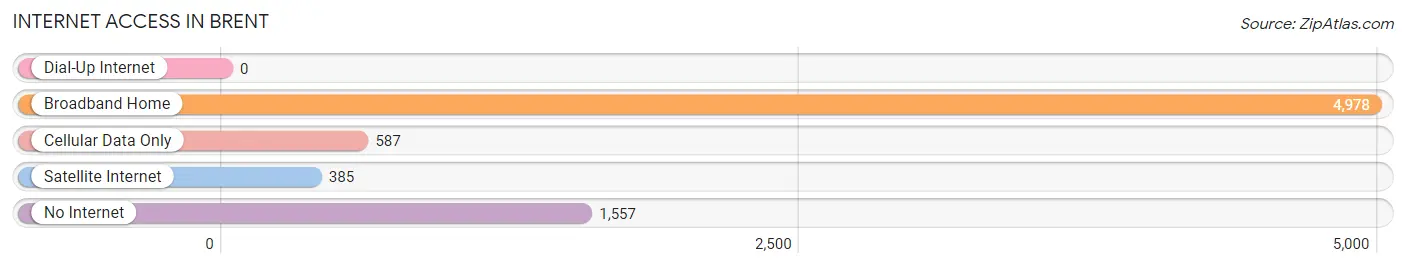
| Internet Type | # Households | % Households |
| Dial-Up Internet | 0 | 0.0% |
| Broadband Home | 4,978 | 67.5% |
| Cellular Data Only | 587 | 8.0% |
| Satellite Internet | 385 | 5.2% |
| No Internet | 1,557 | 21.1% |
| Total | 7,372 | 100.0% |
Brent Summary
Brent is a small city located in Santa Rosa County, Florida. It is situated on the western edge of the Florida Panhandle, approximately 20 miles northeast of Pensacola. The city is bordered by the Blackwater River to the north and the Escambia River to the south. As of the 2010 census, the population of Brent was 1,919.
History
The area that is now Brent was originally inhabited by Native American tribes, including the Creek and Choctaw. The first European settlers arrived in the area in the early 1800s. The settlement was originally known as “Brent’s Landing”, named after the family who owned the land. In 1844, the settlement was officially incorporated as the town of Brent.
In the late 1800s, the town began to grow and prosper. The economy was largely based on the timber industry, as well as the production of naval stores. The town also had a thriving agricultural sector, with cotton, corn, and peanuts being the main crops.
In the early 1900s, the town began to decline. The timber industry had largely moved away, and the agricultural sector was in decline. In the 1950s, the town began to experience a resurgence, as the nearby Eglin Air Force Base began to expand. This brought new jobs and economic growth to the area.
Geography
Brent is located in the western part of Santa Rosa County, Florida. It is situated on the western edge of the Florida Panhandle, approximately 20 miles northeast of Pensacola. The city is bordered by the Blackwater River to the north and the Escambia River to the south.
The city has a total area of 4.2 square miles, all of which is land. The terrain is mostly flat, with some rolling hills. The climate is humid subtropical, with hot, humid summers and mild winters.
Economy
The economy of Brent is largely based on the military, as the nearby Eglin Air Force Base is a major employer in the area. Other major employers include the Santa Rosa County School District, the Santa Rosa County Sheriff’s Office, and the Santa Rosa County Health Department.
The city also has a thriving tourism industry, as it is located near several popular beaches and attractions. The city is also home to several small businesses, including restaurants, retail stores, and service providers.
Demographics
As of the 2010 census, the population of Brent was 1,919. The racial makeup of the city was 79.3% White, 15.2% African American, 0.7% Native American, 0.7% Asian, 0.1% Pacific Islander, 1.7% from other races, and 2.1% from two or more races. Hispanic or Latino of any race were 4.2% of the population.
The median household income in Brent was $41,944, and the median family income was $50,938. The per capita income was $20,945. About 11.3% of families and 14.2% of the population were below the poverty line, including 19.2% of those under age 18 and 8.2% of those age 65 or over.
Common Questions
What is Per Capita Income in Brent?
Per Capita income in Brent is $18,963.
What is the Median Family Income in Brent?
Median Family Income in Brent is $52,443.
What is the Median Household income in Brent?
Median Household Income in Brent is $44,053.
What is Income or Wage Gap in Brent?
Income or Wage Gap in Brent is 6.7%.
Women in Brent earn 93.3 cents for every dollar earned by a man.
What is Family Income Deficit in Brent?
Family Income Deficit in Brent is $13,883.
Families that are below poverty line in Brent earn $13,883 less on average than the poverty threshold level.
What is Inequality or Gini Index in Brent?
Inequality or Gini Index in Brent is 0.42.
What is the Total Population of Brent?
Total Population of Brent is 22,969.
What is the Total Male Population of Brent?
Total Male Population of Brent is 12,107.
What is the Total Female Population of Brent?
Total Female Population of Brent is 10,862.
What is the Ratio of Males per 100 Females in Brent?
There are 111.46 Males per 100 Females in Brent.
What is the Ratio of Females per 100 Males in Brent?
There are 89.72 Females per 100 Males in Brent.
What is the Median Population Age in Brent?
Median Population Age in Brent is 25.5 Years.
What is the Average Family Size in Brent
Average Family Size in Brent is 3.3 People.
What is the Average Household Size in Brent
Average Household Size in Brent is 2.4 People.
How Large is the Labor Force in Brent?
There are 11,030 People in the Labor Forcein in Brent.
What is the Percentage of People in the Labor Force in Brent?
60.1% of People are in the Labor Force in Brent.
What is the Unemployment Rate in Brent?
Unemployment Rate in Brent is 6.6%.