Ferry Pass, FL Map & Demographics
Ferry Pass Map
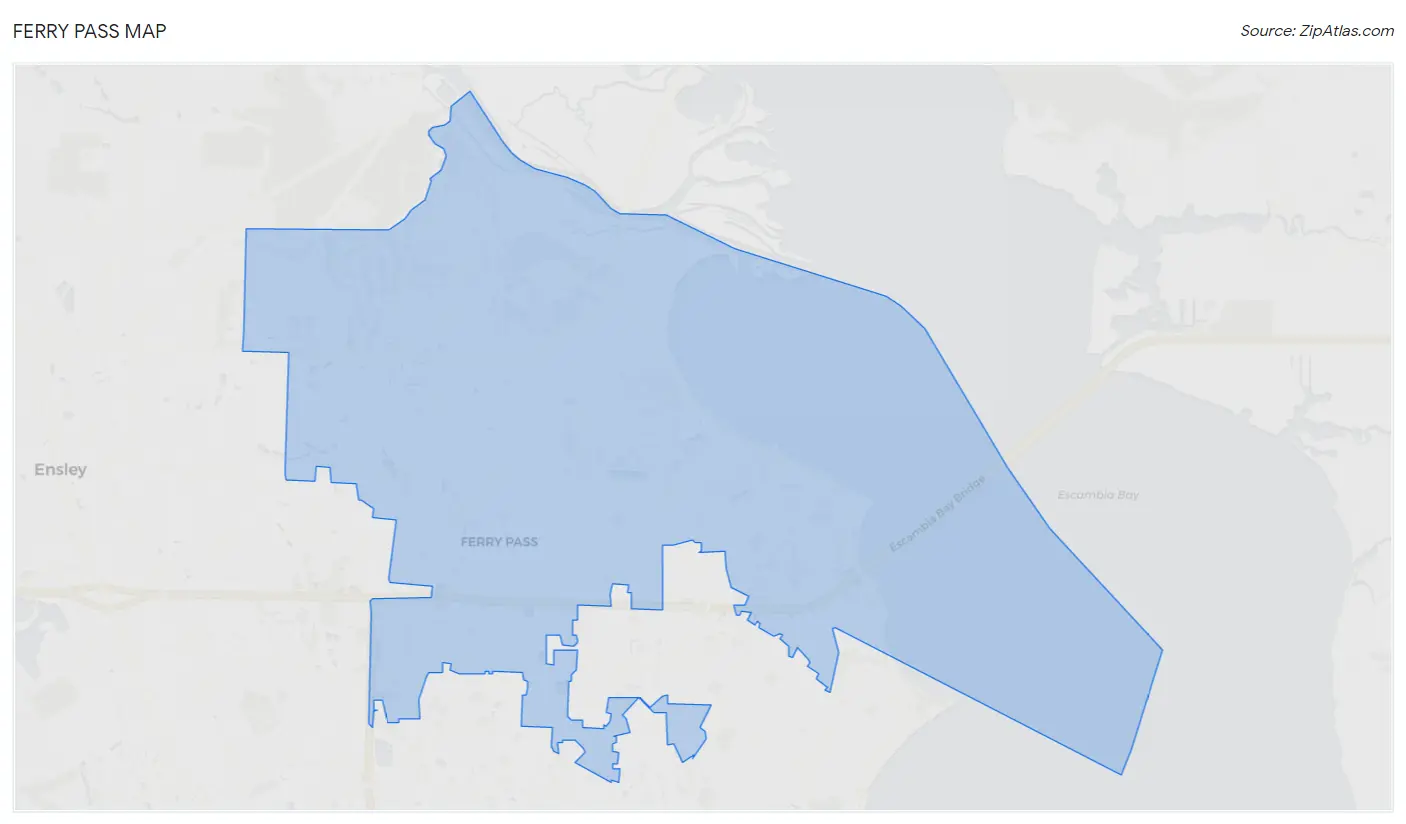
Ferry Pass Overview
$33,999
PER CAPITA INCOME
$75,402
AVG FAMILY INCOME
$62,420
AVG HOUSEHOLD INCOME
30.9%
WAGE / INCOME GAP [ % ]
69.1¢/ $1
WAGE / INCOME GAP [ $ ]
$10,242
FAMILY INCOME DEFICIT
0.44
INEQUALITY / GINI INDEX
32,447
TOTAL POPULATION
14,625
MALE POPULATION
17,822
FEMALE POPULATION
82.06
MALES / 100 FEMALES
121.86
FEMALES / 100 MALES
35.9
MEDIAN AGE
2.8
AVG FAMILY SIZE
2.2
AVG HOUSEHOLD SIZE
17,146
LABOR FORCE [ PEOPLE ]
62.3%
PERCENT IN LABOR FORCE
8.0%
UNEMPLOYMENT RATE
Income in Ferry Pass
Income Overview in Ferry Pass
Per Capita Income in Ferry Pass is $33,999, while median incomes of families and households are $75,402 and $62,420 respectively.
| Characteristic | Number | Measure |
| Per Capita Income | 32,447 | $33,999 |
| Median Family Income | 7,239 | $75,402 |
| Mean Family Income | 7,239 | $91,223 |
| Median Household Income | 13,224 | $62,420 |
| Mean Household Income | 13,224 | $78,142 |
| Income Deficit | 7,239 | $10,242 |
| Wage / Income Gap (%) | 32,447 | 30.87% |
| Wage / Income Gap ($) | 32,447 | 69.13¢ per $1 |
| Gini / Inequality Index | 32,447 | 0.44 |
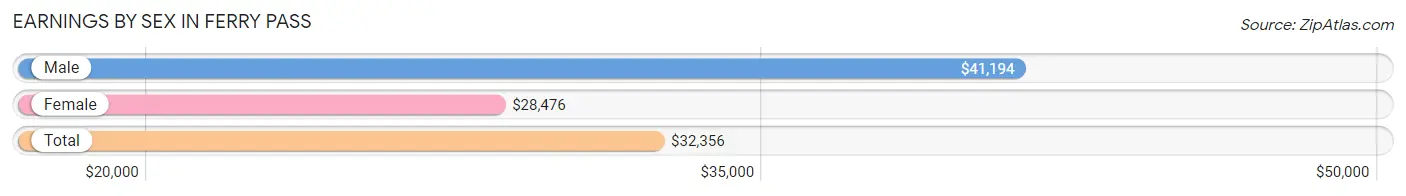
Earnings by Sex in Ferry Pass
Average Earnings in Ferry Pass are $32,356, $41,194 for men and $28,476 for women, a difference of 30.9%.
| Sex | Number | Average Earnings |
| Male | 8,713 (48.2%) | $41,194 |
| Female | 9,350 (51.8%) | $28,476 |
| Total | 18,063 (100.0%) | $32,356 |
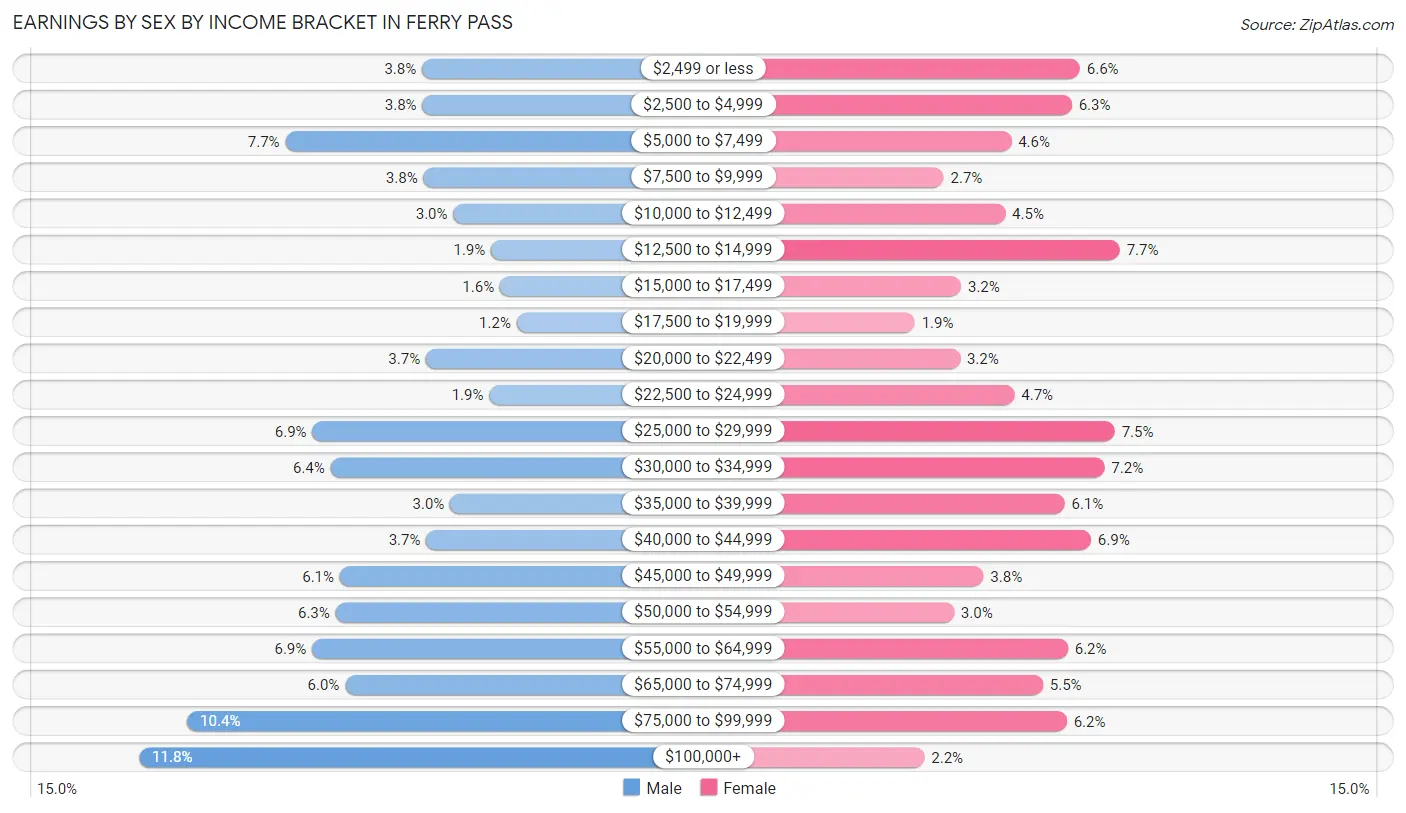
Earnings by Sex by Income Bracket in Ferry Pass
The most common earnings brackets in Ferry Pass are $100,000+ for men (1,026 | 11.8%) and $12,500 to $14,999 for women (717 | 7.7%).
| Income | Male | Female |
| $2,499 or less | 334 (3.8%) | 612 (6.6%) |
| $2,500 to $4,999 | 333 (3.8%) | 591 (6.3%) |
| $5,000 to $7,499 | 668 (7.7%) | 432 (4.6%) |
| $7,500 to $9,999 | 330 (3.8%) | 254 (2.7%) |
| $10,000 to $12,499 | 257 (2.9%) | 416 (4.4%) |
| $12,500 to $14,999 | 165 (1.9%) | 717 (7.7%) |
| $15,000 to $17,499 | 143 (1.6%) | 300 (3.2%) |
| $17,500 to $19,999 | 102 (1.2%) | 179 (1.9%) |
| $20,000 to $22,499 | 324 (3.7%) | 297 (3.2%) |
| $22,500 to $24,999 | 169 (1.9%) | 440 (4.7%) |
| $25,000 to $29,999 | 602 (6.9%) | 704 (7.5%) |
| $30,000 to $34,999 | 558 (6.4%) | 677 (7.2%) |
| $35,000 to $39,999 | 265 (3.0%) | 572 (6.1%) |
| $40,000 to $44,999 | 323 (3.7%) | 641 (6.9%) |
| $45,000 to $49,999 | 535 (6.1%) | 359 (3.8%) |
| $50,000 to $54,999 | 545 (6.3%) | 281 (3.0%) |
| $55,000 to $64,999 | 603 (6.9%) | 581 (6.2%) |
| $65,000 to $74,999 | 522 (6.0%) | 515 (5.5%) |
| $75,000 to $99,999 | 909 (10.4%) | 578 (6.2%) |
| $100,000+ | 1,026 (11.8%) | 204 (2.2%) |
| Total | 8,713 (100.0%) | 9,350 (100.0%) |
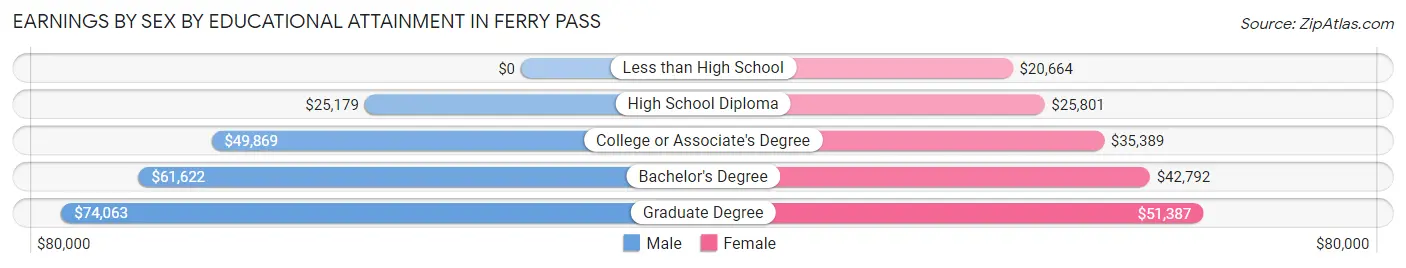
Earnings by Sex by Educational Attainment in Ferry Pass
Average earnings in Ferry Pass are $50,311 for men and $34,720 for women, a difference of 31.0%. Men with an educational attainment of graduate degree enjoy the highest average annual earnings of $74,063, while those with high school diploma education earn the least with $25,179. Women with an educational attainment of graduate degree earn the most with the average annual earnings of $51,387, while those with less than high school education have the smallest earnings of $20,664.
| Educational Attainment | Male Income | Female Income |
| Less than High School | - | - |
| High School Diploma | $25,179 | $25,801 |
| College or Associate's Degree | $49,869 | $35,389 |
| Bachelor's Degree | $61,622 | $42,792 |
| Graduate Degree | $74,063 | $51,387 |
| Total | $50,311 | $34,720 |
Family Income in Ferry Pass
Family Income Brackets in Ferry Pass
According to the Ferry Pass family income data, there are 1,513 families falling into the $100,000 to $149,999 income range, which is the most common income bracket and makes up 20.9% of all families. Conversely, the $10,000 to $14,999 income bracket is the least frequent group with only 166 families (2.3%) belonging to this category.
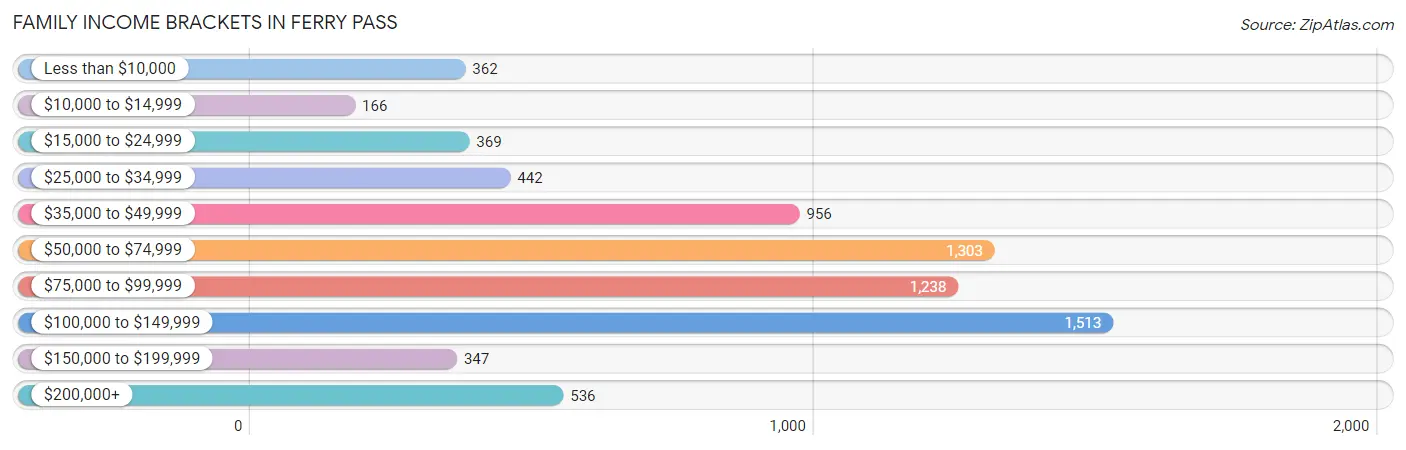
| Income Bracket | # Families | % Families |
| Less than $10,000 | 362 | 5.0% |
| $10,000 to $14,999 | 166 | 2.3% |
| $15,000 to $24,999 | 369 | 5.1% |
| $25,000 to $34,999 | 442 | 6.1% |
| $35,000 to $49,999 | 956 | 13.2% |
| $50,000 to $74,999 | 1,303 | 18.0% |
| $75,000 to $99,999 | 1,238 | 17.1% |
| $100,000 to $149,999 | 1,513 | 20.9% |
| $150,000 to $199,999 | 347 | 4.8% |
| $200,000+ | 536 | 7.4% |
Family Income by Famaliy Size in Ferry Pass
4-person families (1,073 | 14.8%) account for the highest median family income in Ferry Pass with $83,225 per family, while 2-person families (4,176 | 57.7%) have the highest median income of $38,778 per family member.
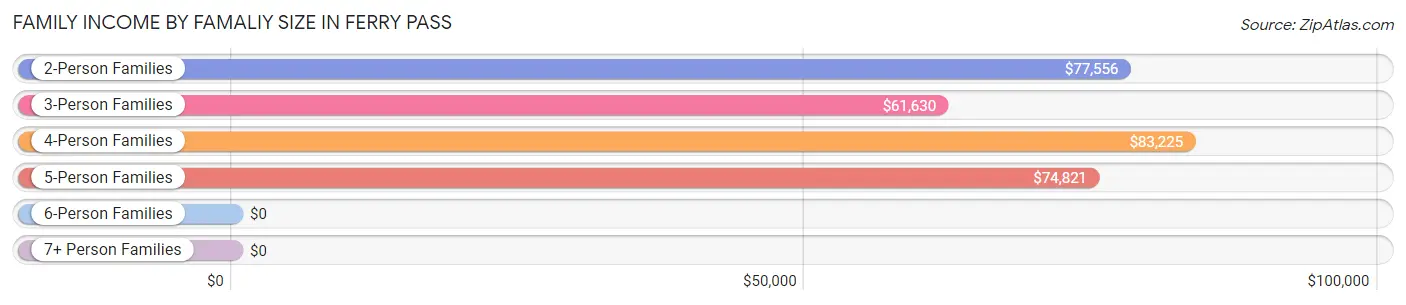
| Income Bracket | # Families | Median Income |
| 2-Person Families | 4,176 (57.7%) | $77,556 |
| 3-Person Families | 1,694 (23.4%) | $61,630 |
| 4-Person Families | 1,073 (14.8%) | $83,225 |
| 5-Person Families | 269 (3.7%) | $74,821 |
| 6-Person Families | 12 (0.2%) | $0 |
| 7+ Person Families | 15 (0.2%) | $0 |
| Total | 7,239 (100.0%) | $75,402 |
Family Income by Number of Earners in Ferry Pass
The median family income in Ferry Pass is $75,402, with families comprising 3+ earners (538) having the highest median family income of $112,356, while families with 1 earner (3,000) have the lowest median family income of $52,134, accounting for 7.4% and 41.4% of families, respectively.
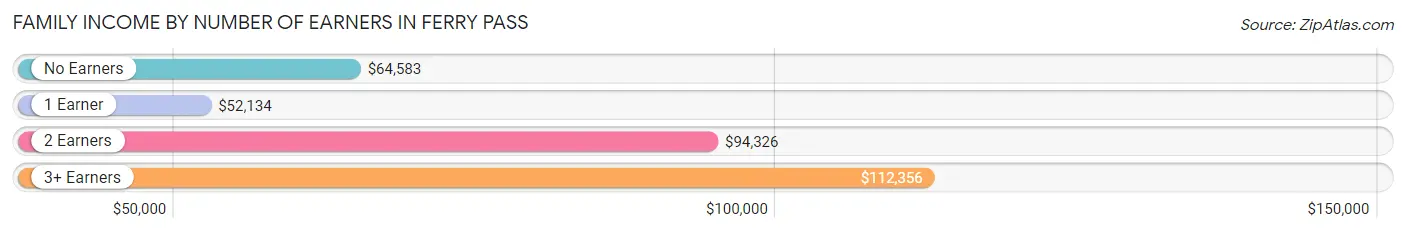
| Number of Earners | # Families | Median Income |
| No Earners | 1,023 (14.1%) | $64,583 |
| 1 Earner | 3,000 (41.4%) | $52,134 |
| 2 Earners | 2,678 (37.0%) | $94,326 |
| 3+ Earners | 538 (7.4%) | $112,356 |
| Total | 7,239 (100.0%) | $75,402 |
Household Income in Ferry Pass
Household Income Brackets in Ferry Pass
With 2,248 households falling in the category, the $50,000 to $74,999 income range is the most frequent in Ferry Pass, accounting for 17.0% of all households. In contrast, only 622 households (4.7%) fall into the $150,000 to $199,999 income bracket, making it the least populous group.
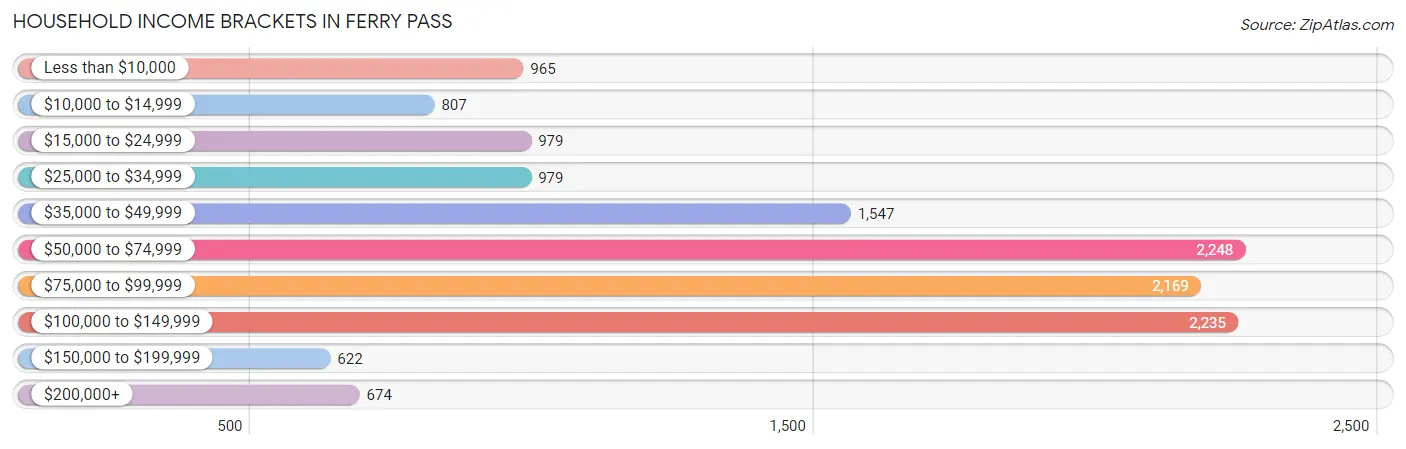
| Income Bracket | # Households | % Households |
| Less than $10,000 | 965 | 7.3% |
| $10,000 to $14,999 | 807 | 6.1% |
| $15,000 to $24,999 | 979 | 7.4% |
| $25,000 to $34,999 | 979 | 7.4% |
| $35,000 to $49,999 | 1,547 | 11.7% |
| $50,000 to $74,999 | 2,248 | 17.0% |
| $75,000 to $99,999 | 2,169 | 16.4% |
| $100,000 to $149,999 | 2,235 | 16.9% |
| $150,000 to $199,999 | 622 | 4.7% |
| $200,000+ | 674 | 5.1% |
Household Income by Householder Age in Ferry Pass
The median household income in Ferry Pass is $62,420, with the highest median household income of $75,673 found in the 45 to 64 years age bracket for the primary householder. A total of 3,969 households (30.0%) fall into this category. Meanwhile, the 15 to 24 years age bracket for the primary householder has the lowest median household income of $45,688, with 1,246 households (9.4%) in this group.
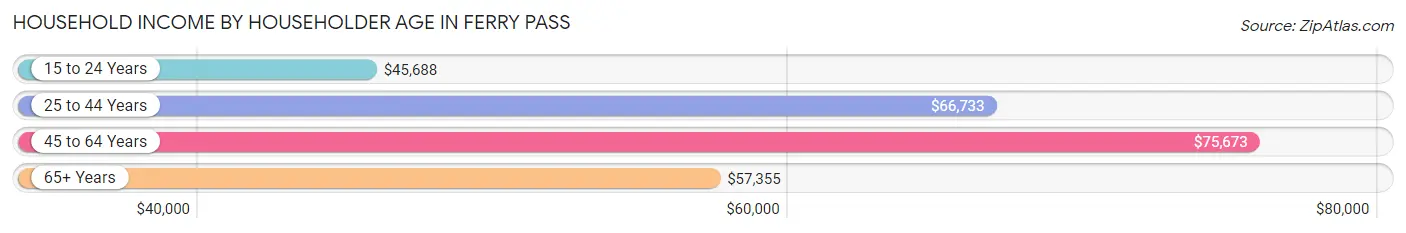
| Income Bracket | # Households | Median Income |
| 15 to 24 Years | 1,246 (9.4%) | $45,688 |
| 25 to 44 Years | 4,332 (32.8%) | $66,733 |
| 45 to 64 Years | 3,969 (30.0%) | $75,673 |
| 65+ Years | 3,677 (27.8%) | $57,355 |
| Total | 13,224 (100.0%) | $62,420 |
Poverty in Ferry Pass
Income Below Poverty by Sex and Age in Ferry Pass
With 13.4% poverty level for males and 16.5% for females among the residents of Ferry Pass, 5 year old males and 18 to 24 year old females are the most vulnerable to poverty, with 64 males (59.8%) and 570 females (27.2%) in their respective age groups living below the poverty level.
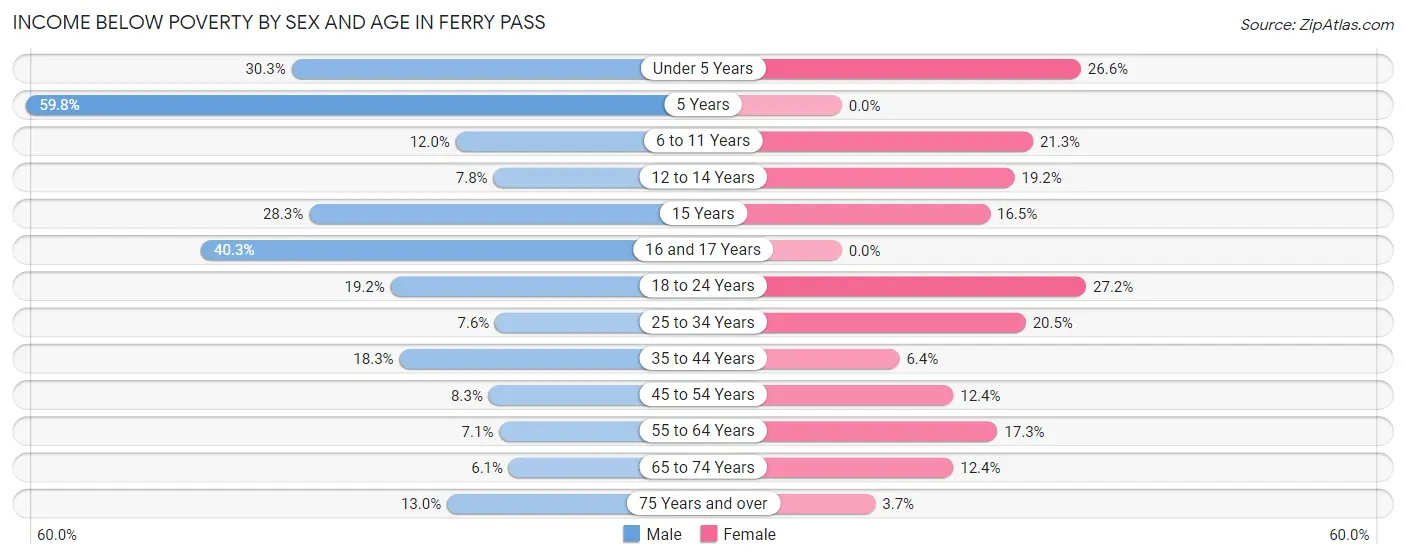
| Age Bracket | Male | Female |
| Under 5 Years | 228 (30.3%) | 196 (26.6%) |
| 5 Years | 64 (59.8%) | 0 (0.0%) |
| 6 to 11 Years | 97 (12.0%) | 281 (21.3%) |
| 12 to 14 Years | 30 (7.8%) | 66 (19.2%) |
| 15 Years | 34 (28.3%) | 18 (16.5%) |
| 16 and 17 Years | 119 (40.3%) | 0 (0.0%) |
| 18 to 24 Years | 332 (19.2%) | 570 (27.2%) |
| 25 to 34 Years | 168 (7.6%) | 566 (20.5%) |
| 35 to 44 Years | 270 (18.3%) | 101 (6.4%) |
| 45 to 54 Years | 112 (8.3%) | 177 (12.4%) |
| 55 to 64 Years | 118 (7.1%) | 339 (17.3%) |
| 65 to 74 Years | 86 (6.1%) | 233 (12.4%) |
| 75 Years and over | 124 (13.0%) | 46 (3.7%) |
| Total | 1,782 (13.4%) | 2,593 (16.5%) |
Income Above Poverty by Sex and Age in Ferry Pass
According to the poverty statistics in Ferry Pass, males aged 65 to 74 years and females aged 5 years are the age groups that are most secure financially, with 93.9% of males and 100.0% of females in these age groups living above the poverty line.
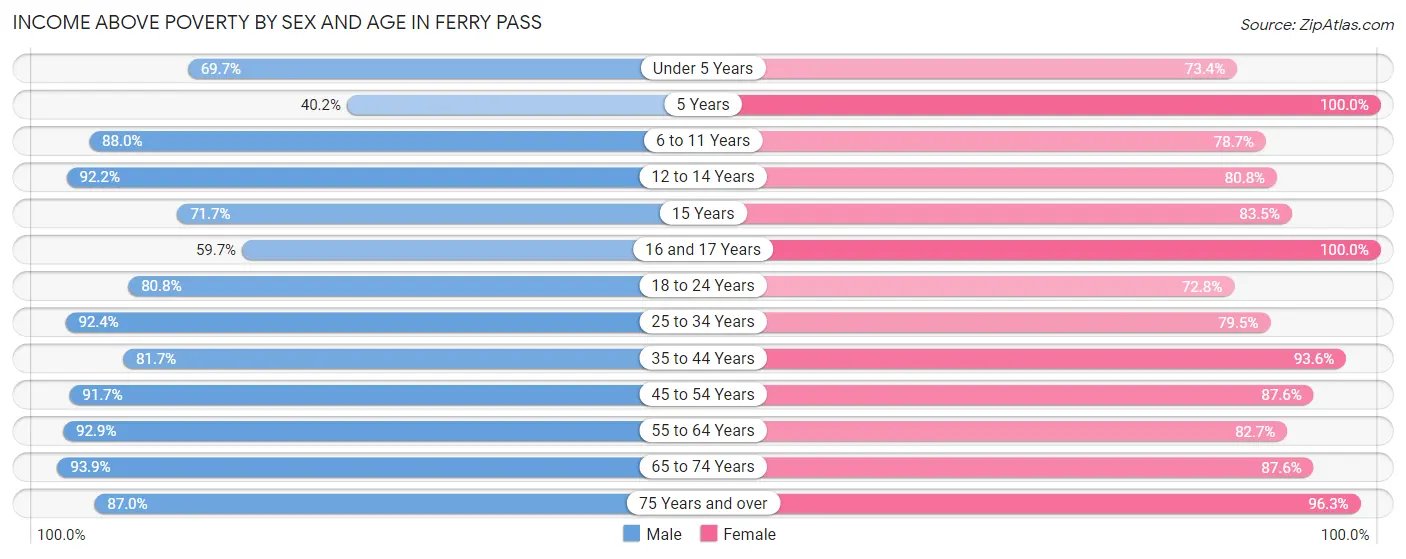
| Age Bracket | Male | Female |
| Under 5 Years | 525 (69.7%) | 540 (73.4%) |
| 5 Years | 43 (40.2%) | 100 (100.0%) |
| 6 to 11 Years | 712 (88.0%) | 1,039 (78.7%) |
| 12 to 14 Years | 355 (92.2%) | 277 (80.8%) |
| 15 Years | 86 (71.7%) | 91 (83.5%) |
| 16 and 17 Years | 176 (59.7%) | 182 (100.0%) |
| 18 to 24 Years | 1,394 (80.8%) | 1,525 (72.8%) |
| 25 to 34 Years | 2,044 (92.4%) | 2,197 (79.5%) |
| 35 to 44 Years | 1,209 (81.7%) | 1,471 (93.6%) |
| 45 to 54 Years | 1,235 (91.7%) | 1,248 (87.6%) |
| 55 to 64 Years | 1,534 (92.9%) | 1,617 (82.7%) |
| 65 to 74 Years | 1,331 (93.9%) | 1,643 (87.6%) |
| 75 Years and over | 833 (87.0%) | 1,183 (96.3%) |
| Total | 11,477 (86.6%) | 13,113 (83.5%) |
Income Below Poverty Among Married-Couple Families in Ferry Pass
The poverty statistics for married-couple families in Ferry Pass show that 4.4% or 196 of the total 4,470 families live below the poverty line. Families with 3 or 4 children have the highest poverty rate of 24.5%, comprising of 35 families. On the other hand, families with 5 or more children have the lowest poverty rate of 0.0%, which includes 0 families.
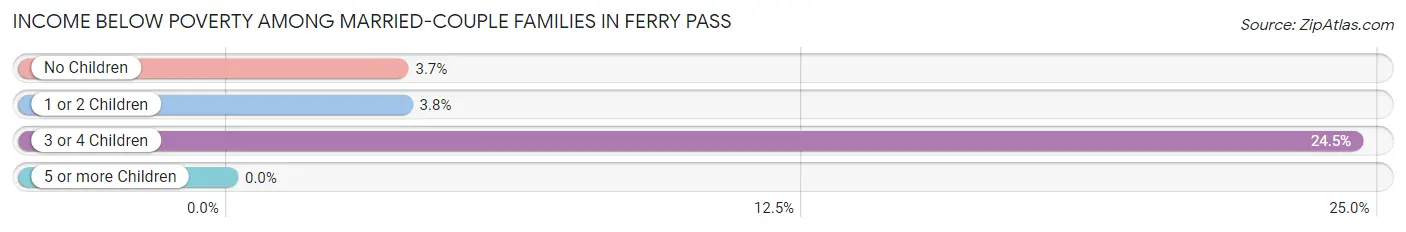
| Children | Above Poverty | Below Poverty |
| No Children | 3,089 (96.3%) | 119 (3.7%) |
| 1 or 2 Children | 1,064 (96.2%) | 42 (3.8%) |
| 3 or 4 Children | 108 (75.5%) | 35 (24.5%) |
| 5 or more Children | 13 (100.0%) | 0 (0.0%) |
| Total | 4,274 (95.6%) | 196 (4.4%) |
Income Below Poverty Among Single-Parent Households in Ferry Pass
According to the poverty data in Ferry Pass, 4.7% or 25 single-father households and 26.9% or 602 single-mother households are living below the poverty line. Among single-father households, those with 1 or 2 children have the highest poverty rate, with 12 households (9.9%) experiencing poverty. Likewise, among single-mother households, those with 3 or 4 children have the highest poverty rate, with 50 households (42.0%) falling below the poverty line.
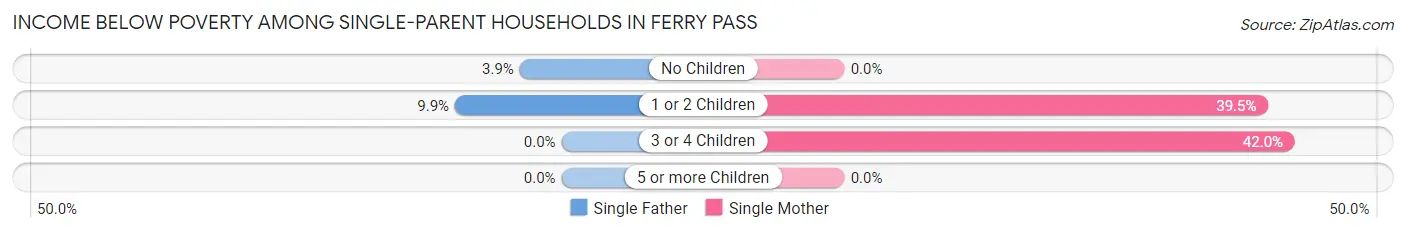
| Children | Single Father | Single Mother |
| No Children | 13 (3.9%) | 0 (0.0%) |
| 1 or 2 Children | 12 (9.9%) | 552 (39.5%) |
| 3 or 4 Children | 0 (0.0%) | 50 (42.0%) |
| 5 or more Children | 0 (0.0%) | 0 (0.0%) |
| Total | 25 (4.7%) | 602 (26.9%) |
Income Below Poverty Among Married-Couple vs Single-Parent Households in Ferry Pass
The poverty data for Ferry Pass shows that 196 of the married-couple family households (4.4%) and 627 of the single-parent households (22.6%) are living below the poverty level. Within the married-couple family households, those with 3 or 4 children have the highest poverty rate, with 35 households (24.5%) falling below the poverty line. Among the single-parent households, those with 1 or 2 children have the highest poverty rate, with 564 household (37.2%) living below poverty.
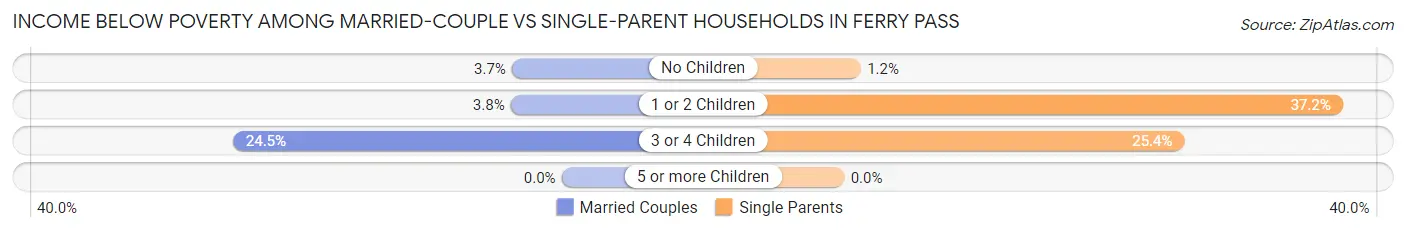
| Children | Married-Couple Families | Single-Parent Households |
| No Children | 119 (3.7%) | 13 (1.2%) |
| 1 or 2 Children | 42 (3.8%) | 564 (37.2%) |
| 3 or 4 Children | 35 (24.5%) | 50 (25.4%) |
| 5 or more Children | 0 (0.0%) | 0 (0.0%) |
| Total | 196 (4.4%) | 627 (22.6%) |
Race in Ferry Pass
The most populous races in Ferry Pass are White / Caucasian (21,685 | 66.8%), Black / African American (6,999 | 21.6%), and Two or more Races (2,768 | 8.5%).
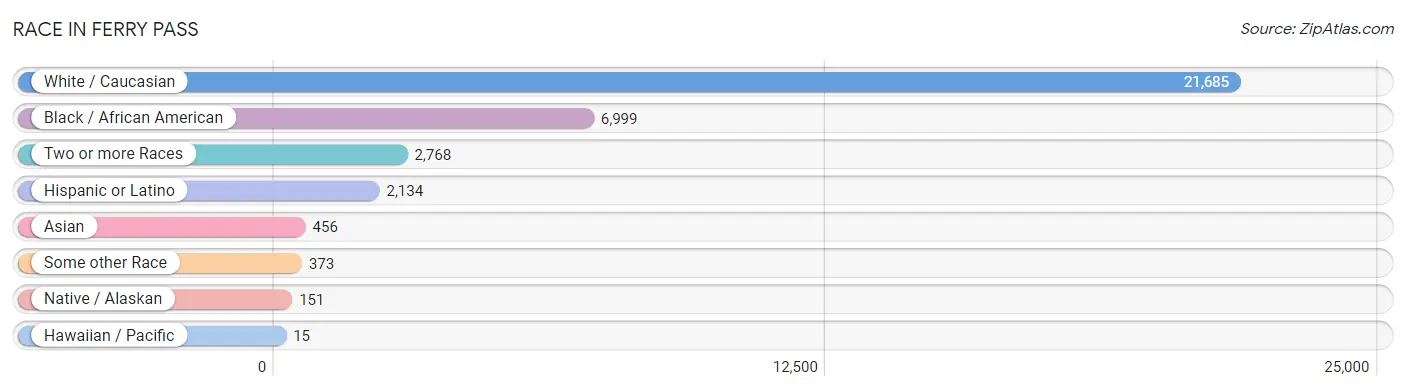
| Race | # Population | % Population |
| Asian | 456 | 1.4% |
| Black / African American | 6,999 | 21.6% |
| Hawaiian / Pacific | 15 | 0.1% |
| Hispanic or Latino | 2,134 | 6.6% |
| Native / Alaskan | 151 | 0.5% |
| White / Caucasian | 21,685 | 66.8% |
| Two or more Races | 2,768 | 8.5% |
| Some other Race | 373 | 1.1% |
| Total | 32,447 | 100.0% |
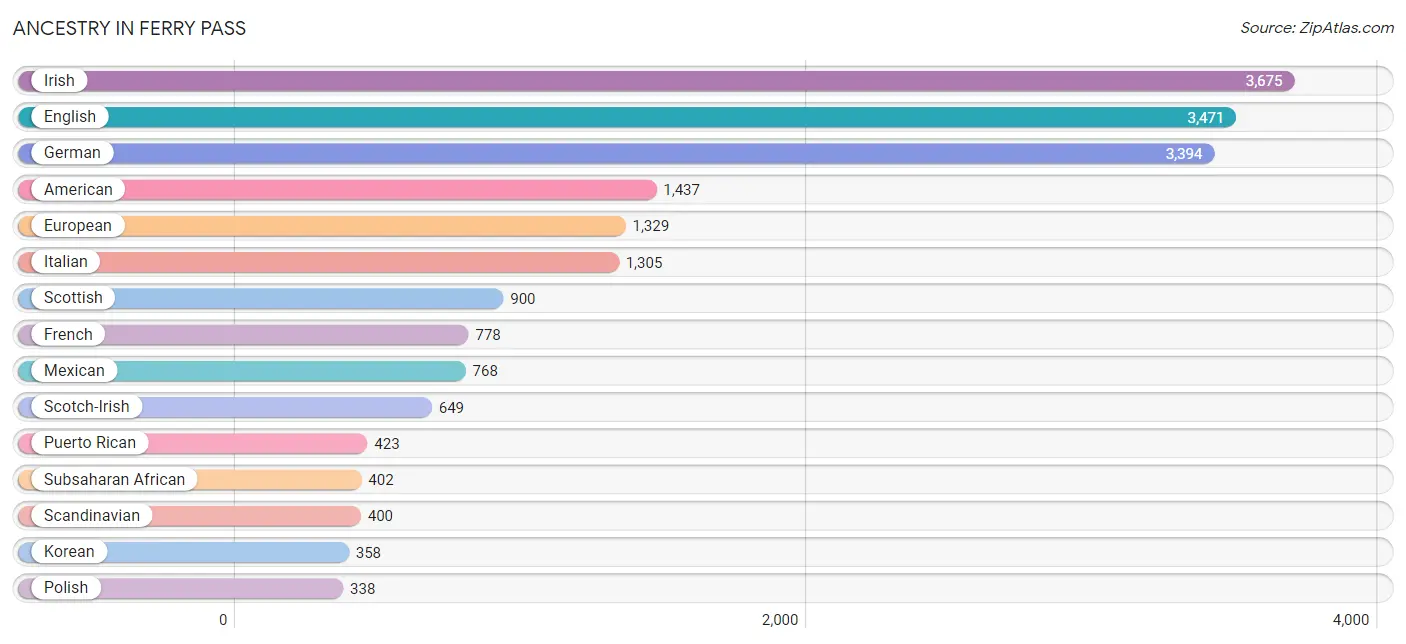
Ancestry in Ferry Pass
The most populous ancestries reported in Ferry Pass are Irish (3,675 | 11.3%), English (3,471 | 10.7%), German (3,394 | 10.5%), American (1,437 | 4.4%), and European (1,329 | 4.1%), together accounting for 41.0% of all Ferry Pass residents.
| Ancestry | # Population | % Population |
| African | 300 | 0.9% |
| American | 1,437 | 4.4% |
| Apache | 2 | 0.0% |
| Arab | 65 | 0.2% |
| Austrian | 17 | 0.1% |
| Bahamian | 6 | 0.0% |
| Barbadian | 6 | 0.0% |
| Belgian | 69 | 0.2% |
| Bhutanese | 158 | 0.5% |
| Brazilian | 76 | 0.2% |
| British | 146 | 0.4% |
| Burmese | 12 | 0.0% |
| Cajun | 20 | 0.1% |
| Celtic | 21 | 0.1% |
| Central American | 199 | 0.6% |
| Central American Indian | 5 | 0.0% |
| Cherokee | 248 | 0.8% |
| Chilean | 21 | 0.1% |
| Chippewa | 3 | 0.0% |
| Choctaw | 13 | 0.0% |
| Colombian | 114 | 0.4% |
| Costa Rican | 19 | 0.1% |
| Creek | 103 | 0.3% |
| Croatian | 38 | 0.1% |
| Cuban | 64 | 0.2% |
| Czech | 97 | 0.3% |
| Danish | 43 | 0.1% |
| Dominican | 7 | 0.0% |
| Dutch | 229 | 0.7% |
| Eastern European | 24 | 0.1% |
| Egyptian | 8 | 0.0% |
| English | 3,471 | 10.7% |
| European | 1,329 | 4.1% |
| Finnish | 59 | 0.2% |
| French | 778 | 2.4% |
| French Canadian | 121 | 0.4% |
| German | 3,394 | 10.5% |
| Ghanaian | 33 | 0.1% |
| Greek | 96 | 0.3% |
| Guyanese | 18 | 0.1% |
| Haitian | 235 | 0.7% |
| Honduran | 135 | 0.4% |
| Hungarian | 306 | 0.9% |
| Indian (Asian) | 59 | 0.2% |
| Iranian | 28 | 0.1% |
| Irish | 3,675 | 11.3% |
| Iroquois | 89 | 0.3% |
| Italian | 1,305 | 4.0% |
| Jamaican | 78 | 0.2% |
| Japanese | 34 | 0.1% |
| Kenyan | 3 | 0.0% |
| Korean | 358 | 1.1% |
| Lebanese | 16 | 0.1% |
| Lithuanian | 98 | 0.3% |
| Maltese | 11 | 0.0% |
| Mexican | 768 | 2.4% |
| Mexican American Indian | 63 | 0.2% |
| Moroccan | 10 | 0.0% |
| Native Hawaiian | 104 | 0.3% |
| Navajo | 50 | 0.2% |
| Northern European | 9 | 0.0% |
| Norwegian | 230 | 0.7% |
| Pennsylvania German | 7 | 0.0% |
| Peruvian | 86 | 0.3% |
| Polish | 338 | 1.0% |
| Portuguese | 30 | 0.1% |
| Pueblo | 23 | 0.1% |
| Puerto Rican | 423 | 1.3% |
| Romanian | 43 | 0.1% |
| Russian | 282 | 0.9% |
| Salvadoran | 45 | 0.1% |
| Scandinavian | 400 | 1.2% |
| Scotch-Irish | 649 | 2.0% |
| Scottish | 900 | 2.8% |
| Slovak | 96 | 0.3% |
| South American | 271 | 0.8% |
| Spaniard | 334 | 1.0% |
| Spanish | 42 | 0.1% |
| Sri Lankan | 130 | 0.4% |
| Subsaharan African | 402 | 1.2% |
| Swedish | 301 | 0.9% |
| Swiss | 53 | 0.2% |
| Syrian | 31 | 0.1% |
| Thai | 51 | 0.2% |
| Turkish | 23 | 0.1% |
| Venezuelan | 50 | 0.2% |
| Welsh | 178 | 0.5% |
| West Indian | 9 | 0.0% |
| Yugoslavian | 8 | 0.0% | View All 89 Rows |
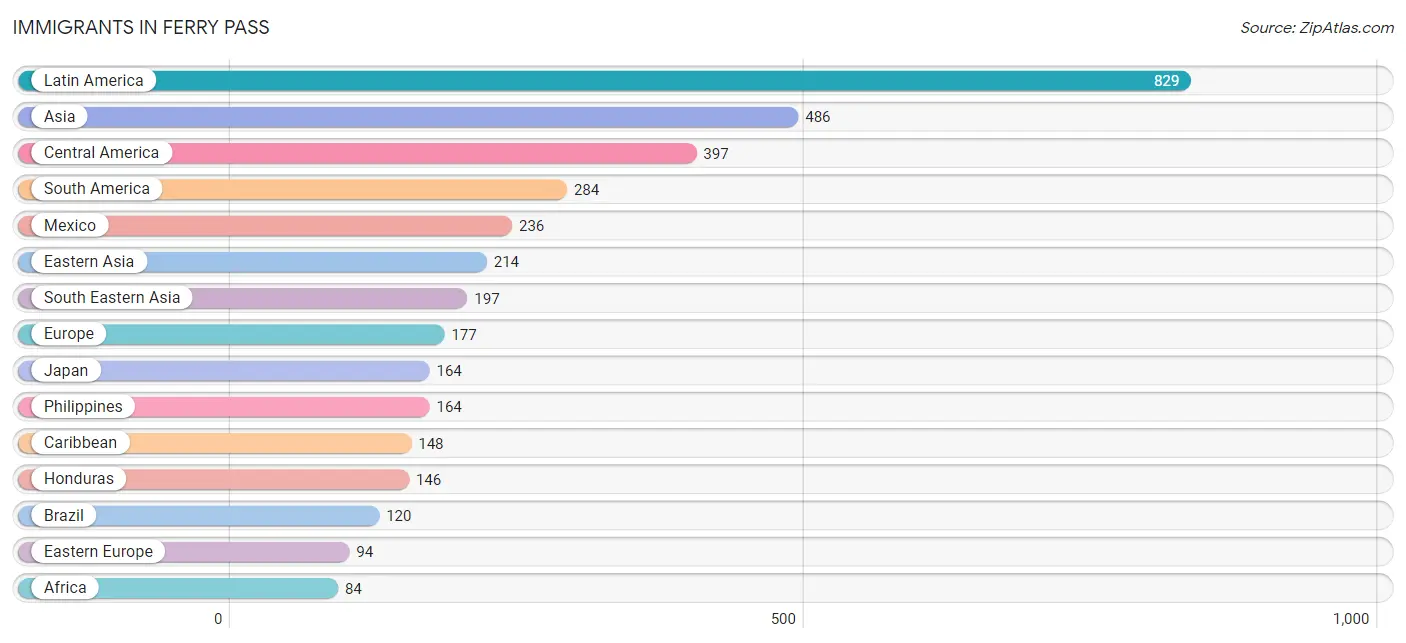
Immigrants in Ferry Pass
The most numerous immigrant groups reported in Ferry Pass came from Latin America (829 | 2.5%), Asia (486 | 1.5%), Central America (397 | 1.2%), South America (284 | 0.9%), and Mexico (236 | 0.7%), together accounting for 6.9% of all Ferry Pass residents.
| Immigration Origin | # Population | % Population |
| Africa | 84 | 0.3% |
| Asia | 486 | 1.5% |
| Bahamas | 6 | 0.0% |
| Belgium | 7 | 0.0% |
| Bolivia | 10 | 0.0% |
| Brazil | 120 | 0.4% |
| Cambodia | 15 | 0.1% |
| Canada | 23 | 0.1% |
| Caribbean | 148 | 0.5% |
| Central America | 397 | 1.2% |
| China | 38 | 0.1% |
| Colombia | 61 | 0.2% |
| Cuba | 6 | 0.0% |
| Dominican Republic | 7 | 0.0% |
| Eastern Asia | 214 | 0.7% |
| Eastern Europe | 94 | 0.3% |
| Egypt | 8 | 0.0% |
| El Salvador | 15 | 0.1% |
| England | 41 | 0.1% |
| Europe | 177 | 0.5% |
| Germany | 14 | 0.0% |
| Ghana | 33 | 0.1% |
| Guyana | 18 | 0.1% |
| Haiti | 75 | 0.2% |
| Honduras | 146 | 0.4% |
| Hong Kong | 11 | 0.0% |
| India | 33 | 0.1% |
| Iran | 28 | 0.1% |
| Jamaica | 54 | 0.2% |
| Japan | 164 | 0.5% |
| Kazakhstan | 6 | 0.0% |
| Korea | 12 | 0.0% |
| Latin America | 829 | 2.5% |
| Lithuania | 28 | 0.1% |
| Mexico | 236 | 0.7% |
| Morocco | 10 | 0.0% |
| Nigeria | 33 | 0.1% |
| Northern Africa | 18 | 0.1% |
| Northern Europe | 52 | 0.2% |
| Oceania | 8 | 0.0% |
| Peru | 25 | 0.1% |
| Philippines | 164 | 0.5% |
| Poland | 36 | 0.1% |
| Russia | 30 | 0.1% |
| Scotland | 11 | 0.0% |
| South America | 284 | 0.9% |
| South Central Asia | 75 | 0.2% |
| South Eastern Asia | 197 | 0.6% |
| Southern Europe | 10 | 0.0% |
| Spain | 10 | 0.0% |
| Sri Lanka | 8 | 0.0% |
| Taiwan | 12 | 0.0% |
| Venezuela | 50 | 0.2% |
| Vietnam | 18 | 0.1% |
| Western Africa | 66 | 0.2% |
| Western Europe | 21 | 0.1% | View All 56 Rows |
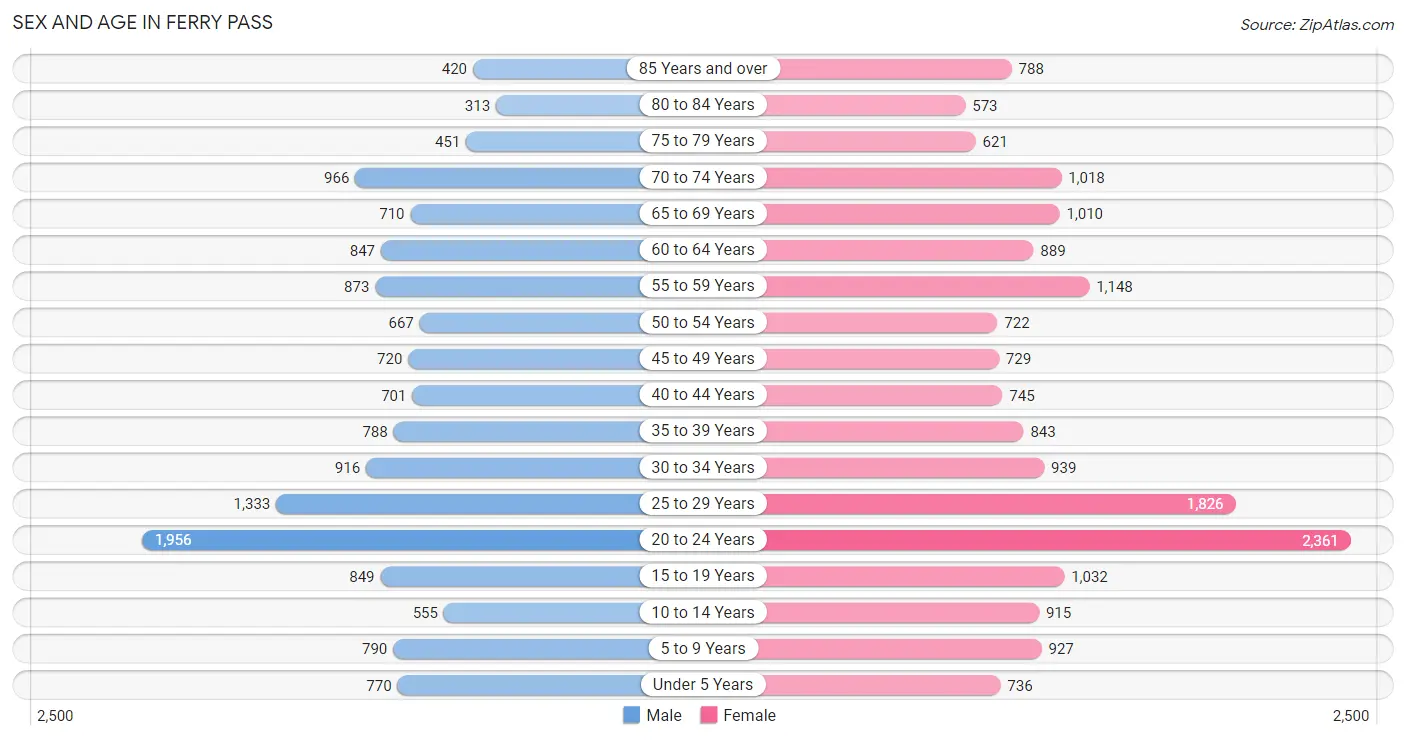
Sex and Age in Ferry Pass
Sex and Age in Ferry Pass
The most populous age groups in Ferry Pass are 20 to 24 Years (1,956 | 13.4%) for men and 20 to 24 Years (2,361 | 13.3%) for women.
| Age Bracket | Male | Female |
| Under 5 Years | 770 (5.3%) | 736 (4.1%) |
| 5 to 9 Years | 790 (5.4%) | 927 (5.2%) |
| 10 to 14 Years | 555 (3.8%) | 915 (5.1%) |
| 15 to 19 Years | 849 (5.8%) | 1,032 (5.8%) |
| 20 to 24 Years | 1,956 (13.4%) | 2,361 (13.3%) |
| 25 to 29 Years | 1,333 (9.1%) | 1,826 (10.2%) |
| 30 to 34 Years | 916 (6.3%) | 939 (5.3%) |
| 35 to 39 Years | 788 (5.4%) | 843 (4.7%) |
| 40 to 44 Years | 701 (4.8%) | 745 (4.2%) |
| 45 to 49 Years | 720 (4.9%) | 729 (4.1%) |
| 50 to 54 Years | 667 (4.6%) | 722 (4.1%) |
| 55 to 59 Years | 873 (6.0%) | 1,148 (6.4%) |
| 60 to 64 Years | 847 (5.8%) | 889 (5.0%) |
| 65 to 69 Years | 710 (4.9%) | 1,010 (5.7%) |
| 70 to 74 Years | 966 (6.6%) | 1,018 (5.7%) |
| 75 to 79 Years | 451 (3.1%) | 621 (3.5%) |
| 80 to 84 Years | 313 (2.1%) | 573 (3.2%) |
| 85 Years and over | 420 (2.9%) | 788 (4.4%) |
| Total | 14,625 (100.0%) | 17,822 (100.0%) |
Families and Households in Ferry Pass
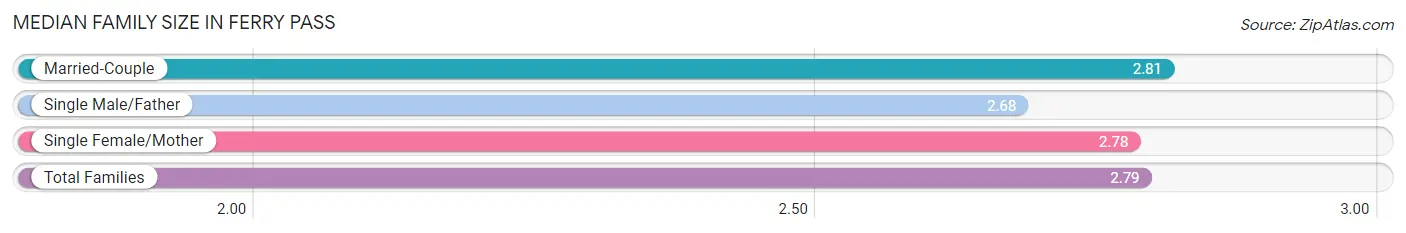
Median Family Size in Ferry Pass
The median family size in Ferry Pass is 2.79 persons per family, with married-couple families (4,470 | 61.8%) accounting for the largest median family size of 2.81 persons per family. On the other hand, single male/father families (533 | 7.4%) represent the smallest median family size with 2.68 persons per family.
| Family Type | # Families | Family Size |
| Married-Couple | 4,470 (61.8%) | 2.81 |
| Single Male/Father | 533 (7.4%) | 2.68 |
| Single Female/Mother | 2,236 (30.9%) | 2.78 |
| Total Families | 7,239 (100.0%) | 2.79 |
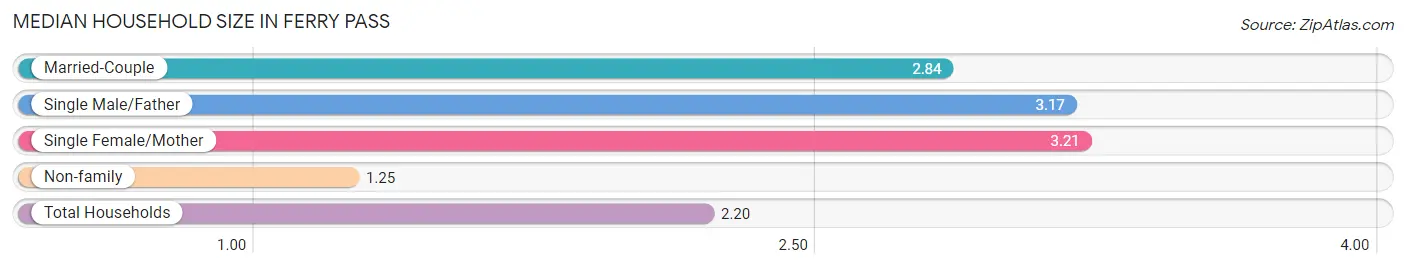
Median Household Size in Ferry Pass
The median household size in Ferry Pass is 2.20 persons per household, with single female/mother households (2,236 | 16.9%) accounting for the largest median household size of 3.21 persons per household. non-family households (5,985 | 45.3%) represent the smallest median household size with 1.25 persons per household.
| Household Type | # Households | Household Size |
| Married-Couple | 4,470 (33.8%) | 2.84 |
| Single Male/Father | 533 (4.0%) | 3.17 |
| Single Female/Mother | 2,236 (16.9%) | 3.21 |
| Non-family | 5,985 (45.3%) | 1.25 |
| Total Households | 13,224 (100.0%) | 2.20 |
Household Size by Marriage Status in Ferry Pass
Out of a total of 13,224 households in Ferry Pass, 7,239 (54.7%) are family households, while 5,985 (45.3%) are nonfamily households. The most numerous type of family households are 2-person households, comprising 3,757, and the most common type of nonfamily households are 1-person households, comprising 4,926.
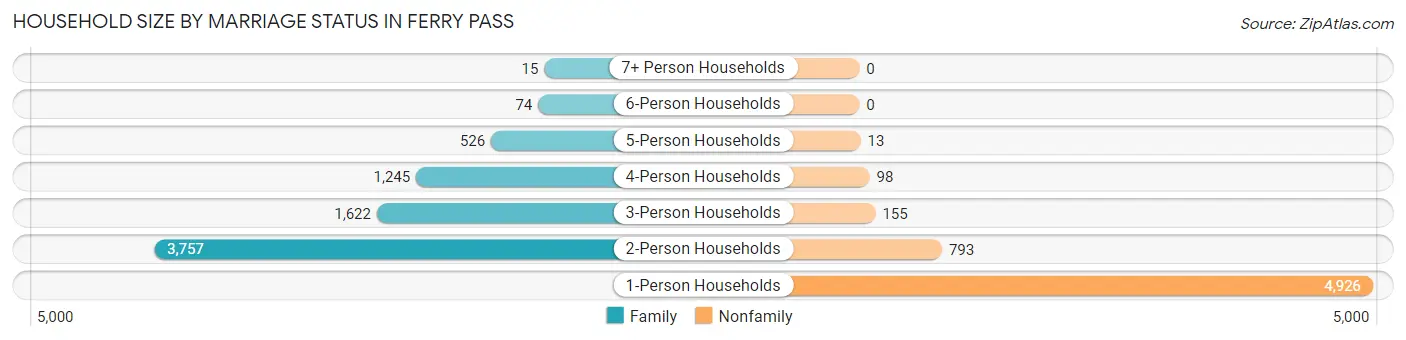
| Household Size | Family Households | Nonfamily Households |
| 1-Person Households | - | 4,926 (37.2%) |
| 2-Person Households | 3,757 (28.4%) | 793 (6.0%) |
| 3-Person Households | 1,622 (12.3%) | 155 (1.2%) |
| 4-Person Households | 1,245 (9.4%) | 98 (0.7%) |
| 5-Person Households | 526 (4.0%) | 13 (0.1%) |
| 6-Person Households | 74 (0.6%) | 0 (0.0%) |
| 7+ Person Households | 15 (0.1%) | 0 (0.0%) |
| Total | 7,239 (54.7%) | 5,985 (45.3%) |
Female Fertility in Ferry Pass
Fertility by Age in Ferry Pass
Average fertility rate in Ferry Pass is 48.0 births per 1,000 women. Women in the age bracket of 20 to 34 years have the highest fertility rate with 62.0 births per 1,000 women. Women in the age bracket of 20 to 34 years acount for 77.9% of all women with births.
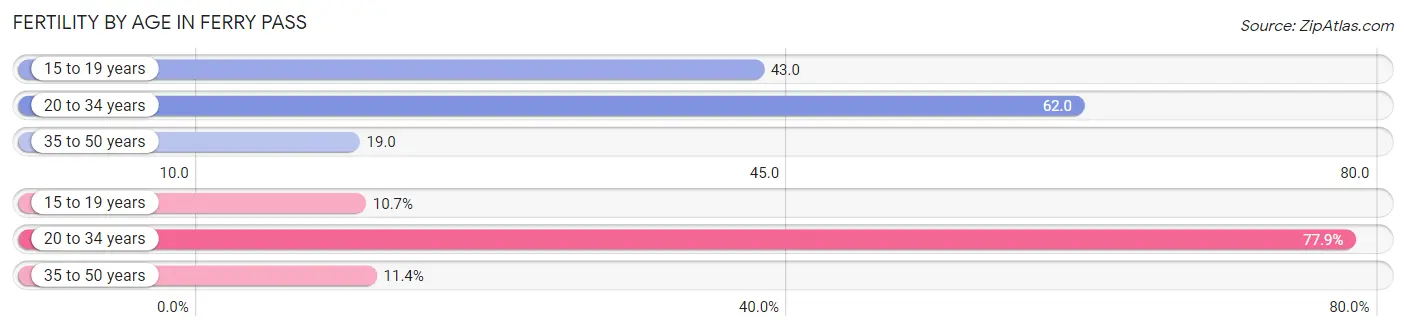
| Age Bracket | Women with Births | Births / 1,000 Women |
| 15 to 19 years | 44 (10.7%) | 43.0 |
| 20 to 34 years | 320 (77.9%) | 62.0 |
| 35 to 50 years | 47 (11.4%) | 19.0 |
| Total | 411 (100.0%) | 48.0 |
Fertility by Age by Marriage Status in Ferry Pass
30.9% of women with births (411) in Ferry Pass are married. The highest percentage of unmarried women with births falls into 15 to 19 years age bracket with 100.0% of them unmarried at the time of birth, while the lowest percentage of unmarried women with births belong to 35 to 50 years age bracket with 0.0% of them unmarried.
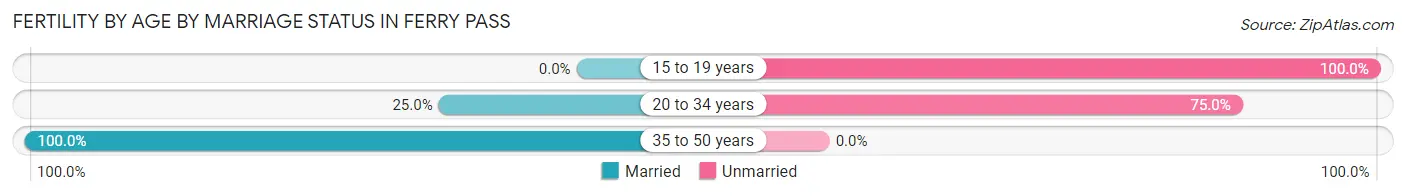
| Age Bracket | Married | Unmarried |
| 15 to 19 years | 0 (0.0%) | 44 (100.0%) |
| 20 to 34 years | 80 (25.0%) | 240 (75.0%) |
| 35 to 50 years | 47 (100.0%) | 0 (0.0%) |
| Total | 127 (30.9%) | 284 (69.1%) |
Fertility by Education in Ferry Pass
Average fertility rate in Ferry Pass is 48.0 births per 1,000 women. Women with the education attainment of less than high school have the highest fertility rate of 130.0 births per 1,000 women, while women with the education attainment of college or associate's degree have the lowest fertility at 24.0 births per 1,000 women. Women with the education attainment of less than high school represent 23.4% of all women with births.
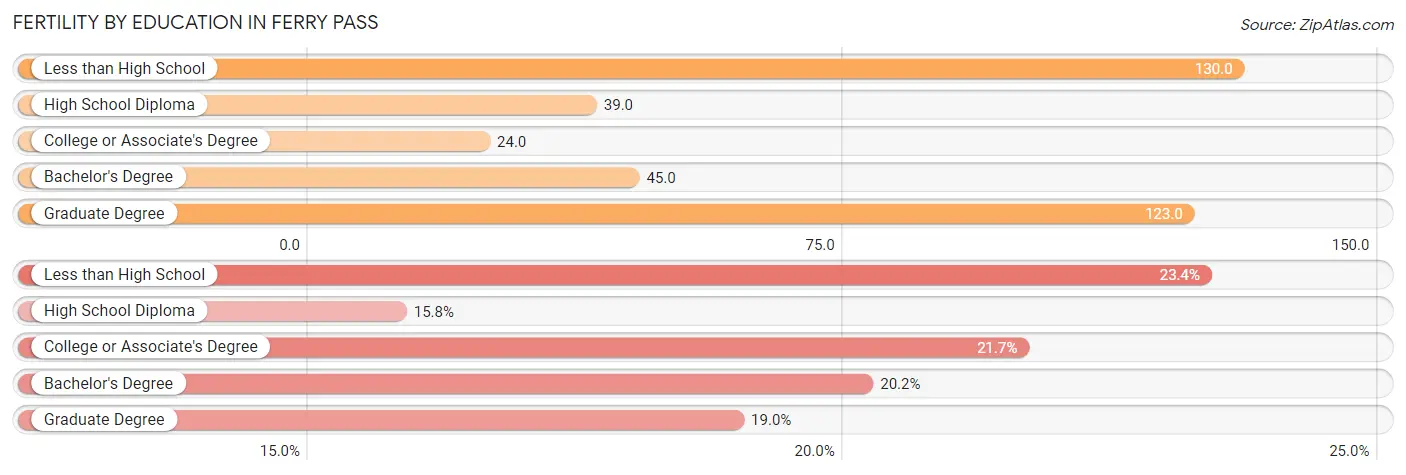
| Educational Attainment | Women with Births | Births / 1,000 Women |
| Less than High School | 96 (23.4%) | 130.0 |
| High School Diploma | 65 (15.8%) | 39.0 |
| College or Associate's Degree | 89 (21.6%) | 24.0 |
| Bachelor's Degree | 83 (20.2%) | 45.0 |
| Graduate Degree | 78 (19.0%) | 123.0 |
| Total | 411 (100.0%) | 48.0 |
Fertility by Education by Marriage Status in Ferry Pass
69.1% of women with births in Ferry Pass are unmarried. Women with the educational attainment of graduate degree are most likely to be married with 65.4% of them married at childbirth, while women with the educational attainment of less than high school are least likely to be married with 100.0% of them unmarried at childbirth.
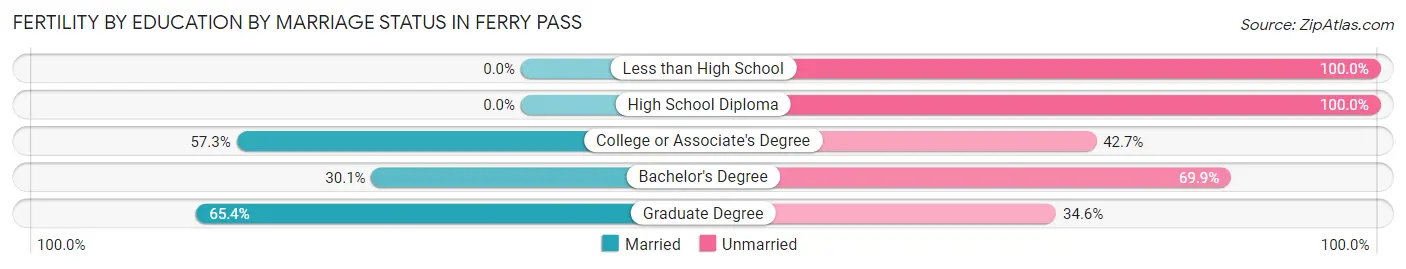
| Educational Attainment | Married | Unmarried |
| Less than High School | 0 (0.0%) | 96 (100.0%) |
| High School Diploma | 0 (0.0%) | 65 (100.0%) |
| College or Associate's Degree | 51 (57.3%) | 38 (42.7%) |
| Bachelor's Degree | 25 (30.1%) | 58 (69.9%) |
| Graduate Degree | 51 (65.4%) | 27 (34.6%) |
| Total | 127 (30.9%) | 284 (69.1%) |
Employment Characteristics in Ferry Pass
Employment by Class of Employer in Ferry Pass
Among the 15,348 employed individuals in Ferry Pass, private company employees (9,699 | 63.2%), not-for-profit organizations (2,155 | 14.0%), and federal government employees (822 | 5.4%) make up the most common classes of employment.
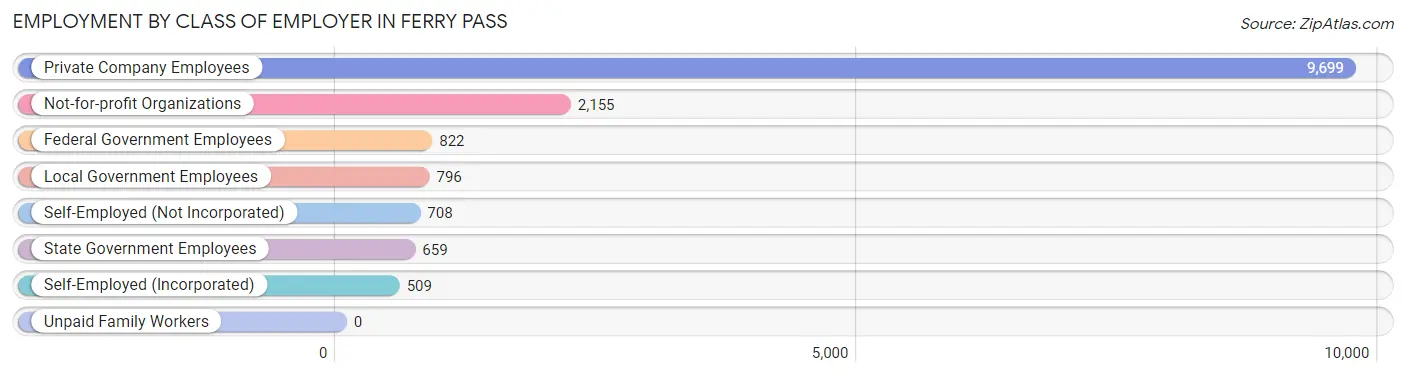
| Employer Class | # Employees | % Employees |
| Private Company Employees | 9,699 | 63.2% |
| Self-Employed (Incorporated) | 509 | 3.3% |
| Self-Employed (Not Incorporated) | 708 | 4.6% |
| Not-for-profit Organizations | 2,155 | 14.0% |
| Local Government Employees | 796 | 5.2% |
| State Government Employees | 659 | 4.3% |
| Federal Government Employees | 822 | 5.4% |
| Unpaid Family Workers | 0 | 0.0% |
| Total | 15,348 | 100.0% |
Employment Status by Age in Ferry Pass
According to the labor force statistics for Ferry Pass, out of the total population over 16 years of age (27,522), 62.3% or 17,146 individuals are in the labor force, with 8.0% or 1,372 of them unemployed. The age group with the highest labor force participation rate is 30 to 34 years, with 91.5% or 1,697 individuals in the labor force. Within the labor force, the 45 to 54 years age range has the highest percentage of unemployed individuals, with 18.6% or 475 of them being unemployed.
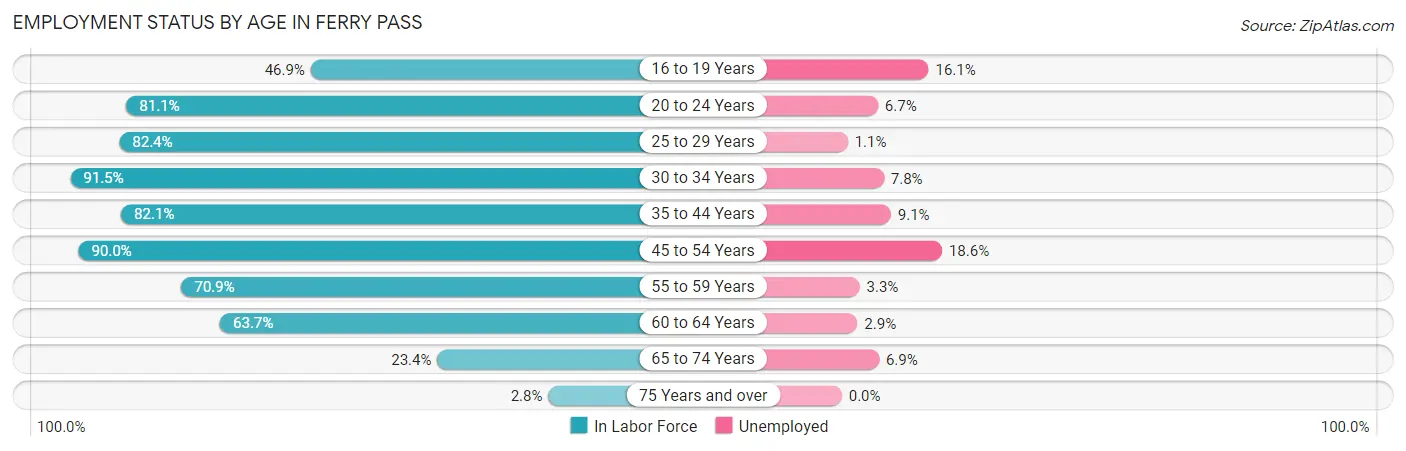
| Age Bracket | In Labor Force | Unemployed |
| 16 to 19 Years | 773 (46.9%) | 124 (16.1%) |
| 20 to 24 Years | 3,501 (81.1%) | 235 (6.7%) |
| 25 to 29 Years | 2,603 (82.4%) | 29 (1.1%) |
| 30 to 34 Years | 1,697 (91.5%) | 132 (7.8%) |
| 35 to 44 Years | 2,526 (82.1%) | 230 (9.1%) |
| 45 to 54 Years | 2,554 (90.0%) | 475 (18.6%) |
| 55 to 59 Years | 1,433 (70.9%) | 47 (3.3%) |
| 60 to 64 Years | 1,106 (63.7%) | 32 (2.9%) |
| 65 to 74 Years | 867 (23.4%) | 60 (6.9%) |
| 75 Years and over | 89 (2.8%) | 0 (0.0%) |
| Total | 17,146 (62.3%) | 1,372 (8.0%) |
Employment Status by Educational Attainment in Ferry Pass
According to labor force statistics for Ferry Pass, 81.2% of individuals (11,925) out of the total population between 25 and 64 years of age (14,686) are in the labor force, with 8.0% or 954 of them being unemployed. The group with the highest labor force participation rate are those with the educational attainment of bachelor's degree or higher, with 89.1% or 4,426 individuals in the labor force. Within the labor force, individuals with bachelor's degree or higher education have the highest percentage of unemployment, with 12.3% or 544 of them being unemployed.
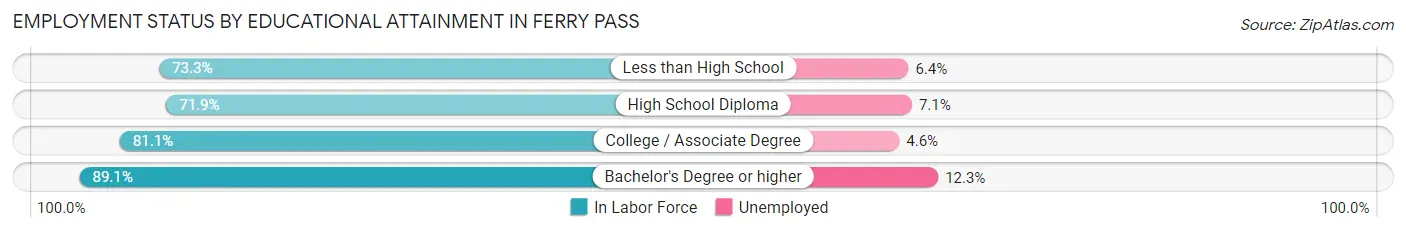
| Educational Attainment | In Labor Force | Unemployed |
| Less than High School | 770 (73.3%) | 67 (6.4%) |
| High School Diploma | 2,363 (71.9%) | 233 (7.1%) |
| College / Associate Degree | 4,365 (81.1%) | 248 (4.6%) |
| Bachelor's Degree or higher | 4,426 (89.1%) | 611 (12.3%) |
| Total | 11,925 (81.2%) | 1,175 (8.0%) |
Employment Occupations by Sex in Ferry Pass
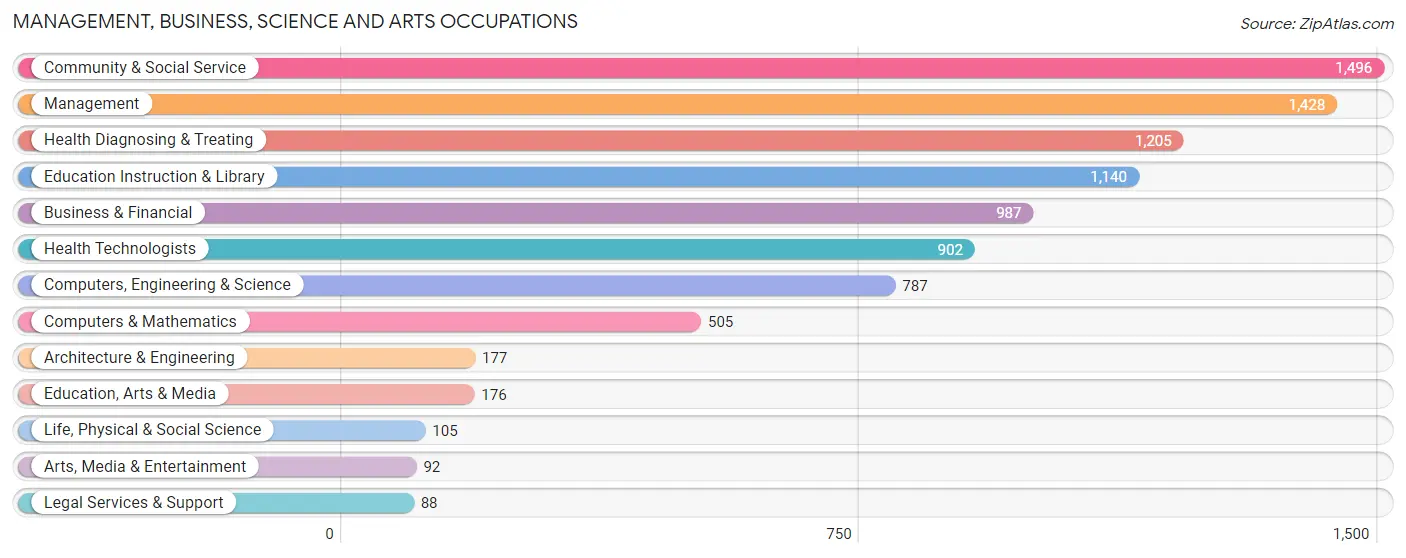
Management, Business, Science and Arts Occupations
The most common Management, Business, Science and Arts occupations in Ferry Pass are Community & Social Service (1,496 | 9.8%), Management (1,428 | 9.3%), Health Diagnosing & Treating (1,205 | 7.9%), Education Instruction & Library (1,140 | 7.4%), and Business & Financial (987 | 6.5%).
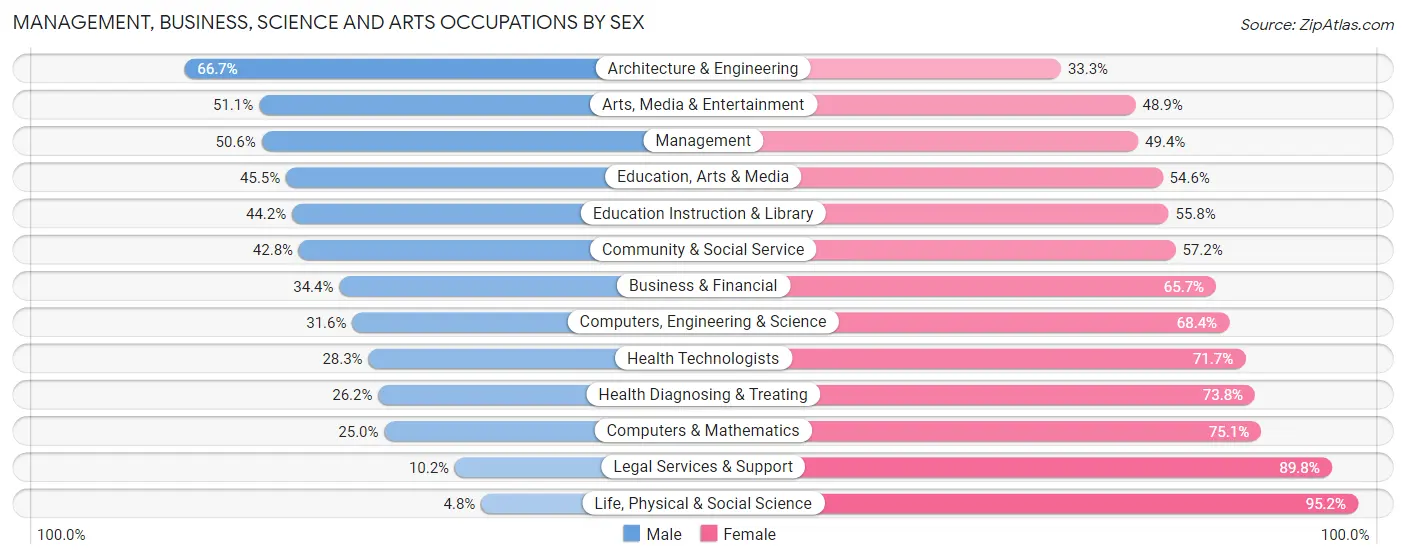
Management, Business, Science and Arts Occupations by Sex
Within the Management, Business, Science and Arts occupations in Ferry Pass, the most male-oriented occupations are Architecture & Engineering (66.7%), Arts, Media & Entertainment (51.1%), and Management (50.6%), while the most female-oriented occupations are Life, Physical & Social Science (95.2%), Legal Services & Support (89.8%), and Computers & Mathematics (75.0%).
| Occupation | Male | Female |
| Management | 722 (50.6%) | 706 (49.4%) |
| Business & Financial | 339 (34.4%) | 648 (65.6%) |
| Computers, Engineering & Science | 249 (31.6%) | 538 (68.4%) |
| Computers & Mathematics | 126 (24.9%) | 379 (75.0%) |
| Architecture & Engineering | 118 (66.7%) | 59 (33.3%) |
| Life, Physical & Social Science | 5 (4.8%) | 100 (95.2%) |
| Community & Social Service | 640 (42.8%) | 856 (57.2%) |
| Education, Arts & Media | 80 (45.5%) | 96 (54.5%) |
| Legal Services & Support | 9 (10.2%) | 79 (89.8%) |
| Education Instruction & Library | 504 (44.2%) | 636 (55.8%) |
| Arts, Media & Entertainment | 47 (51.1%) | 45 (48.9%) |
| Health Diagnosing & Treating | 316 (26.2%) | 889 (73.8%) |
| Health Technologists | 255 (28.3%) | 647 (71.7%) |
| Total (Category) | 2,266 (38.4%) | 3,637 (61.6%) |
| Total (Overall) | 7,153 (46.7%) | 8,157 (53.3%) |
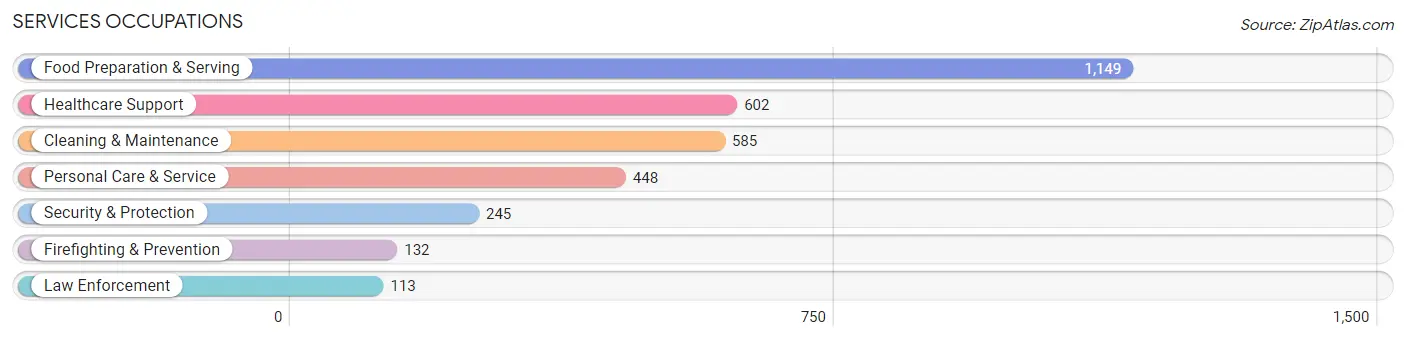
Services Occupations
The most common Services occupations in Ferry Pass are Food Preparation & Serving (1,149 | 7.5%), Healthcare Support (602 | 3.9%), Cleaning & Maintenance (585 | 3.8%), Personal Care & Service (448 | 2.9%), and Security & Protection (245 | 1.6%).
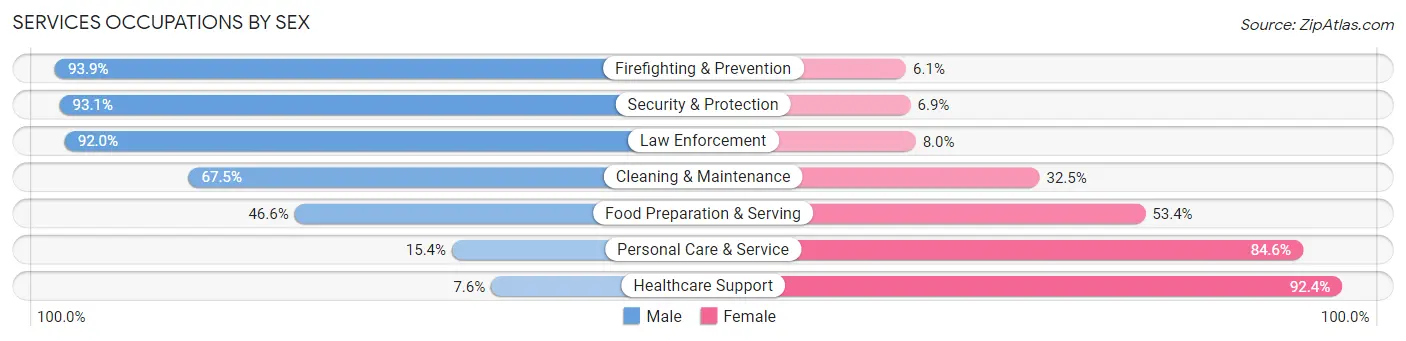
Services Occupations by Sex
Within the Services occupations in Ferry Pass, the most male-oriented occupations are Firefighting & Prevention (93.9%), Security & Protection (93.1%), and Law Enforcement (92.0%), while the most female-oriented occupations are Healthcare Support (92.4%), Personal Care & Service (84.6%), and Food Preparation & Serving (53.4%).
| Occupation | Male | Female |
| Healthcare Support | 46 (7.6%) | 556 (92.4%) |
| Security & Protection | 228 (93.1%) | 17 (6.9%) |
| Firefighting & Prevention | 124 (93.9%) | 8 (6.1%) |
| Law Enforcement | 104 (92.0%) | 9 (8.0%) |
| Food Preparation & Serving | 535 (46.6%) | 614 (53.4%) |
| Cleaning & Maintenance | 395 (67.5%) | 190 (32.5%) |
| Personal Care & Service | 69 (15.4%) | 379 (84.6%) |
| Total (Category) | 1,273 (42.0%) | 1,756 (58.0%) |
| Total (Overall) | 7,153 (46.7%) | 8,157 (53.3%) |
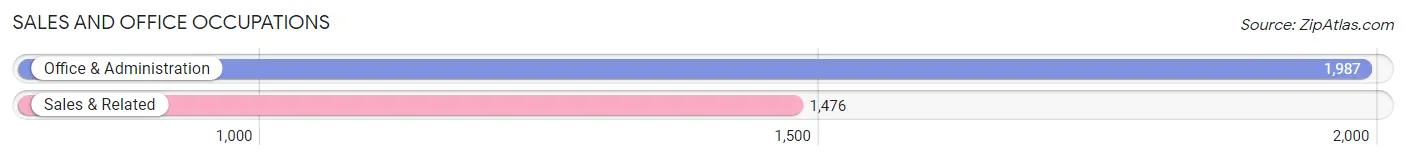
Sales and Office Occupations
The most common Sales and Office occupations in Ferry Pass are Office & Administration (1,987 | 13.0%), and Sales & Related (1,476 | 9.6%).
Sales and Office Occupations by Sex
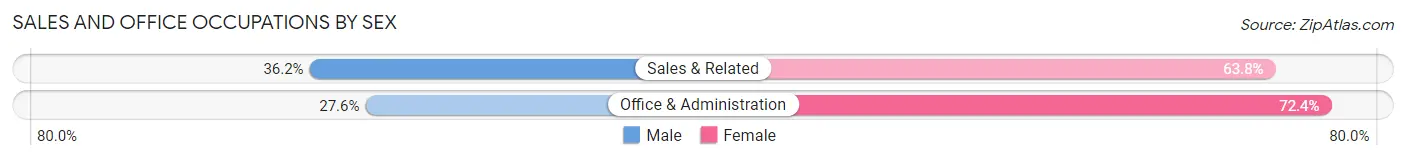
| Occupation | Male | Female |
| Sales & Related | 534 (36.2%) | 942 (63.8%) |
| Office & Administration | 548 (27.6%) | 1,439 (72.4%) |
| Total (Category) | 1,082 (31.2%) | 2,381 (68.8%) |
| Total (Overall) | 7,153 (46.7%) | 8,157 (53.3%) |
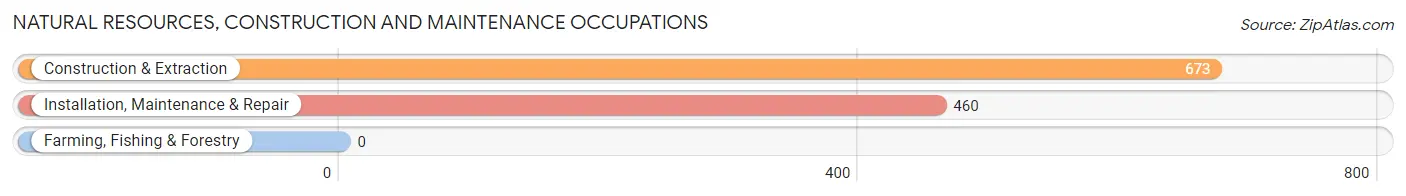
Natural Resources, Construction and Maintenance Occupations
The most common Natural Resources, Construction and Maintenance occupations in Ferry Pass are Construction & Extraction (673 | 4.4%), and Installation, Maintenance & Repair (460 | 3.0%).
Natural Resources, Construction and Maintenance Occupations by Sex
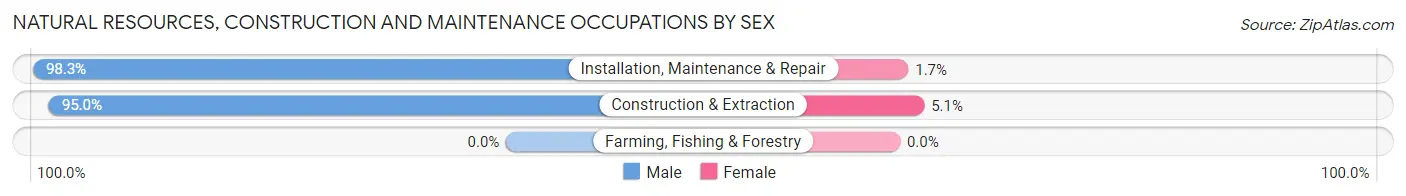
| Occupation | Male | Female |
| Farming, Fishing & Forestry | 0 (0.0%) | 0 (0.0%) |
| Construction & Extraction | 639 (95.0%) | 34 (5.1%) |
| Installation, Maintenance & Repair | 452 (98.3%) | 8 (1.7%) |
| Total (Category) | 1,091 (96.3%) | 42 (3.7%) |
| Total (Overall) | 7,153 (46.7%) | 8,157 (53.3%) |
Production, Transportation and Moving Occupations
The most common Production, Transportation and Moving occupations in Ferry Pass are Production (883 | 5.8%), Transportation (454 | 3.0%), and Material Moving (445 | 2.9%).
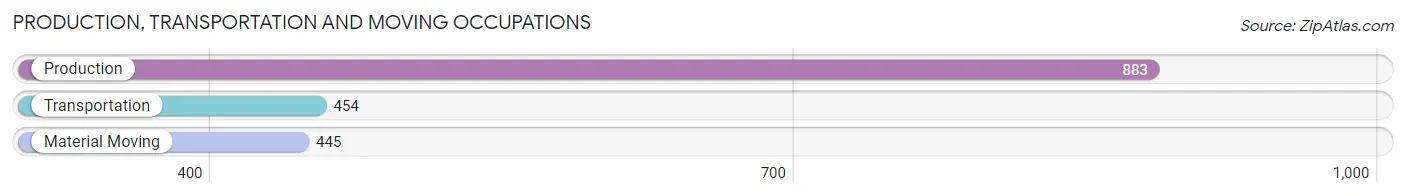
Production, Transportation and Moving Occupations by Sex
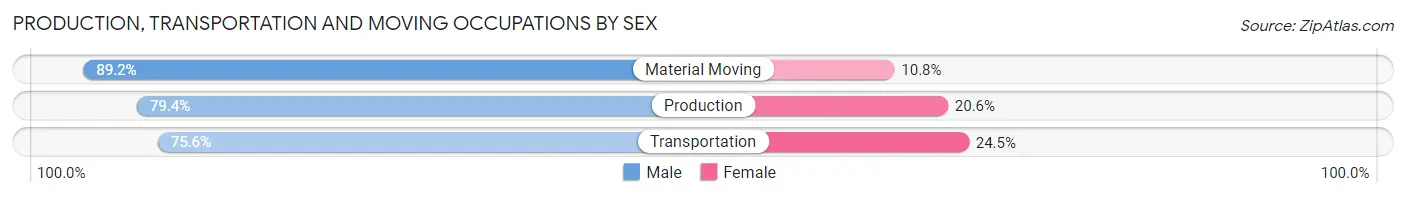
| Occupation | Male | Female |
| Production | 701 (79.4%) | 182 (20.6%) |
| Transportation | 343 (75.5%) | 111 (24.4%) |
| Material Moving | 397 (89.2%) | 48 (10.8%) |
| Total (Category) | 1,441 (80.9%) | 341 (19.1%) |
| Total (Overall) | 7,153 (46.7%) | 8,157 (53.3%) |
Employment Industries by Sex in Ferry Pass
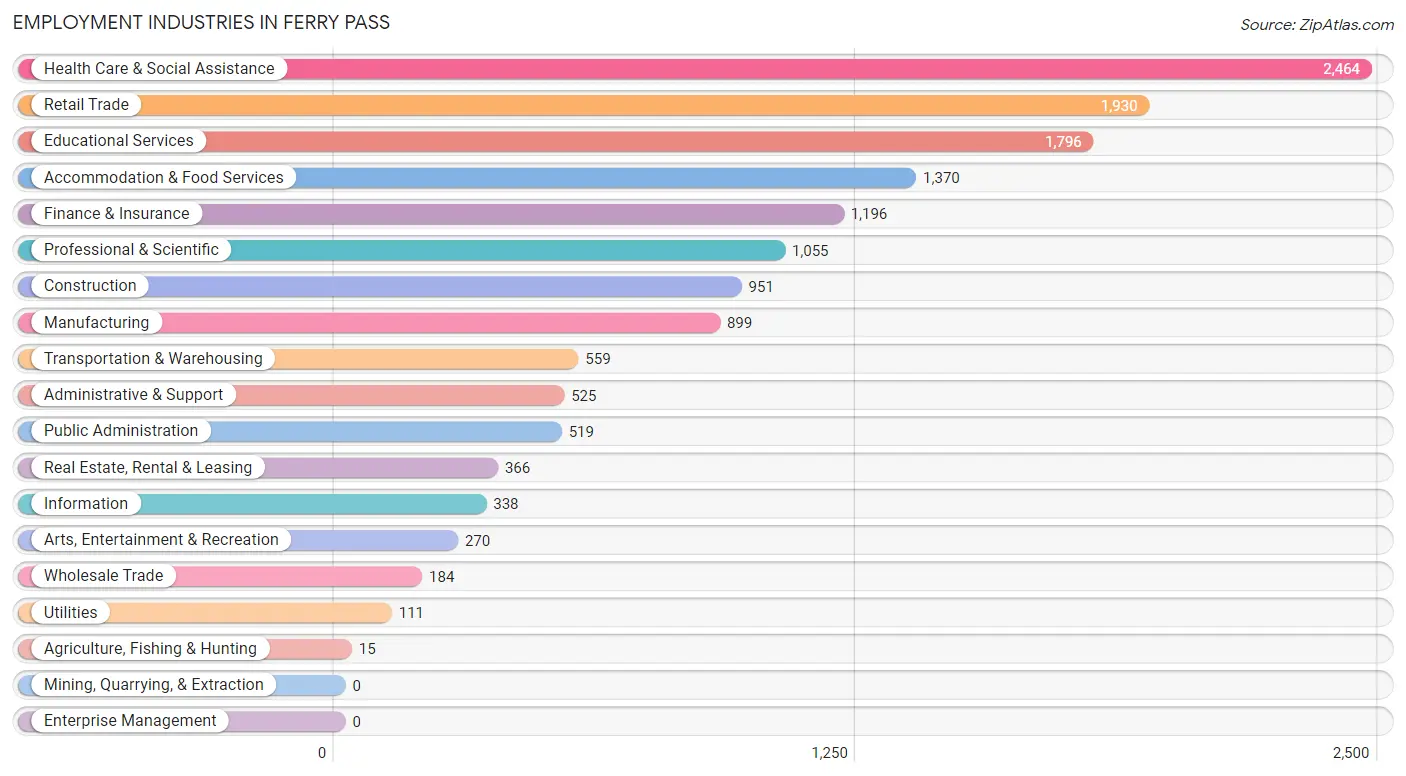
Employment Industries in Ferry Pass
The major employment industries in Ferry Pass include Health Care & Social Assistance (2,464 | 16.1%), Retail Trade (1,930 | 12.6%), Educational Services (1,796 | 11.7%), Accommodation & Food Services (1,370 | 8.9%), and Finance & Insurance (1,196 | 7.8%).
Employment Industries by Sex in Ferry Pass
The Ferry Pass industries that see more men than women are Agriculture, Fishing & Hunting (100.0%), Construction (84.0%), and Transportation & Warehousing (81.6%), whereas the industries that tend to have a higher number of women are Health Care & Social Assistance (86.9%), Information (80.5%), and Finance & Insurance (67.6%).
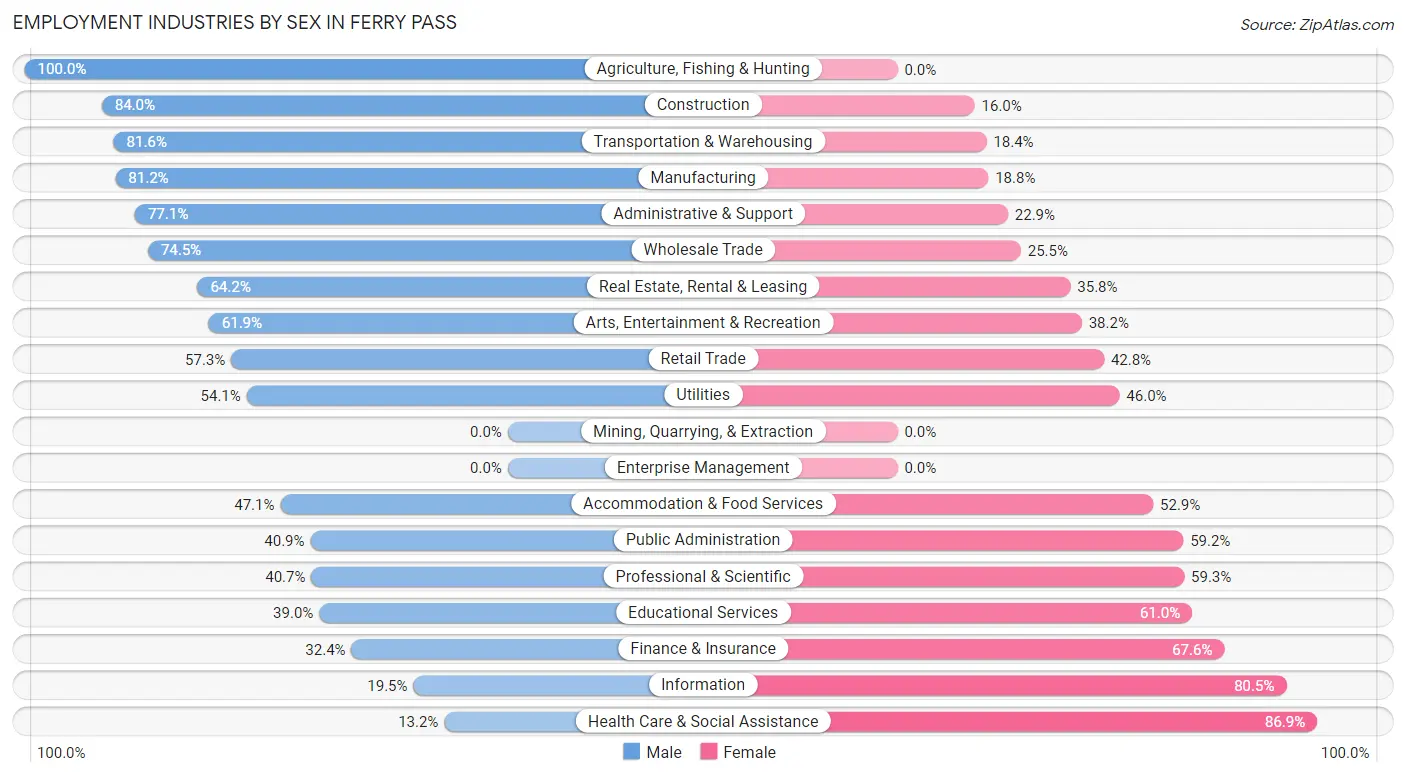
| Industry | Male | Female |
| Agriculture, Fishing & Hunting | 15 (100.0%) | 0 (0.0%) |
| Mining, Quarrying, & Extraction | 0 (0.0%) | 0 (0.0%) |
| Construction | 799 (84.0%) | 152 (16.0%) |
| Manufacturing | 730 (81.2%) | 169 (18.8%) |
| Wholesale Trade | 137 (74.5%) | 47 (25.5%) |
| Retail Trade | 1,105 (57.3%) | 825 (42.7%) |
| Transportation & Warehousing | 456 (81.6%) | 103 (18.4%) |
| Utilities | 60 (54.0%) | 51 (46.0%) |
| Information | 66 (19.5%) | 272 (80.5%) |
| Finance & Insurance | 387 (32.4%) | 809 (67.6%) |
| Real Estate, Rental & Leasing | 235 (64.2%) | 131 (35.8%) |
| Professional & Scientific | 429 (40.7%) | 626 (59.3%) |
| Enterprise Management | 0 (0.0%) | 0 (0.0%) |
| Administrative & Support | 405 (77.1%) | 120 (22.9%) |
| Educational Services | 701 (39.0%) | 1,095 (61.0%) |
| Health Care & Social Assistance | 324 (13.2%) | 2,140 (86.9%) |
| Arts, Entertainment & Recreation | 167 (61.9%) | 103 (38.2%) |
| Accommodation & Food Services | 645 (47.1%) | 725 (52.9%) |
| Public Administration | 212 (40.8%) | 307 (59.2%) |
| Total | 7,153 (46.7%) | 8,157 (53.3%) |
Education in Ferry Pass
School Enrollment in Ferry Pass
The most common levels of schooling among the 8,082 students in Ferry Pass are college / undergraduate (3,372 | 41.7%), elementary school (1,462 | 18.1%), and middle school (1,320 | 16.3%).
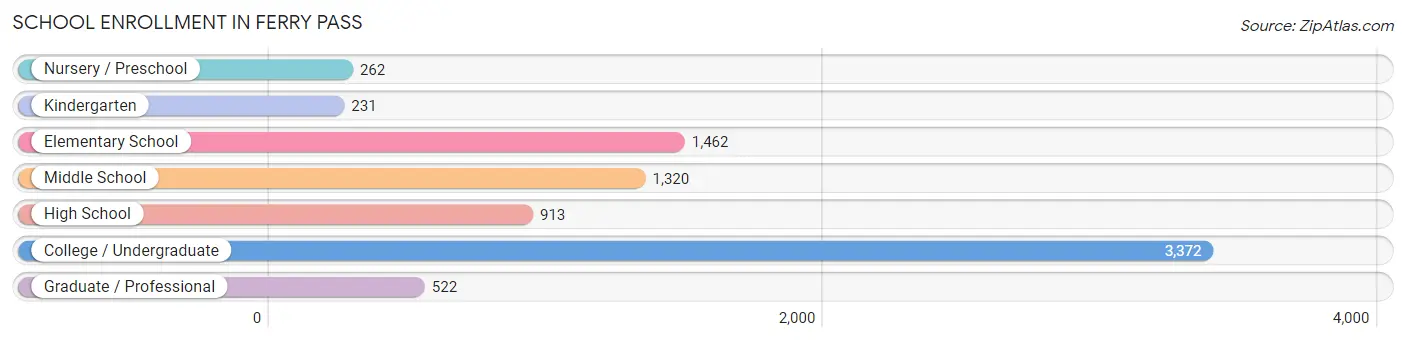
| School Level | # Students | % Students |
| Nursery / Preschool | 262 | 3.2% |
| Kindergarten | 231 | 2.9% |
| Elementary School | 1,462 | 18.1% |
| Middle School | 1,320 | 16.3% |
| High School | 913 | 11.3% |
| College / Undergraduate | 3,372 | 41.7% |
| Graduate / Professional | 522 | 6.5% |
| Total | 8,082 | 100.0% |
School Enrollment by Age by Funding Source in Ferry Pass
Out of a total of 8,082 students who are enrolled in schools in Ferry Pass, 2,117 (26.2%) attend a private institution, while the remaining 5,965 (73.8%) are enrolled in public schools. The age group of 3 to 4 year olds has the highest likelihood of being enrolled in private schools, with 62 (47.3% in the age bracket) enrolled. Conversely, the age group of 35 years and over has the lowest likelihood of being enrolled in a private school, with 332 (91.0% in the age bracket) attending a public institution.
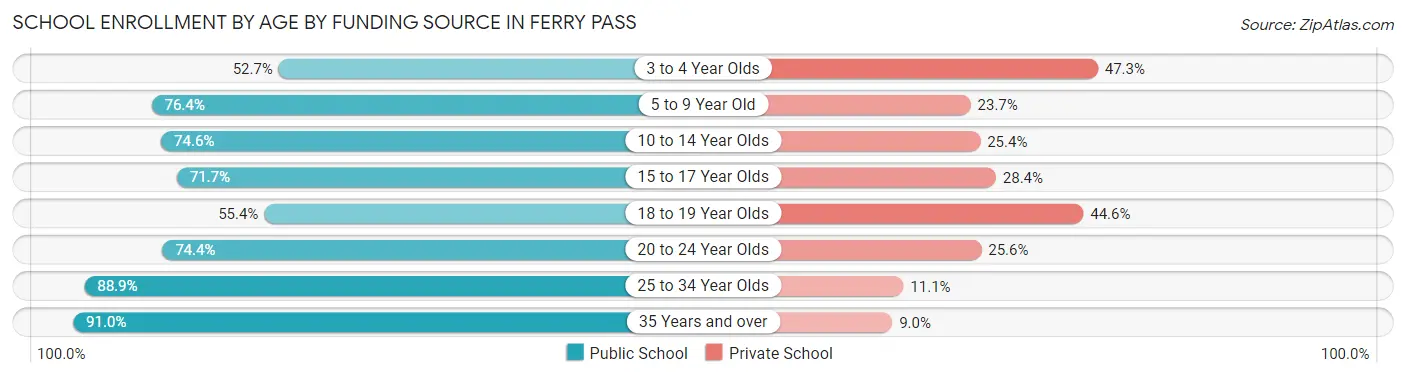
| Age Bracket | Public School | Private School |
| 3 to 4 Year Olds | 69 (52.7%) | 62 (47.3%) |
| 5 to 9 Year Old | 1,311 (76.3%) | 406 (23.6%) |
| 10 to 14 Year Olds | 1,096 (74.6%) | 374 (25.4%) |
| 15 to 17 Year Olds | 503 (71.7%) | 199 (28.3%) |
| 18 to 19 Year Olds | 531 (55.4%) | 428 (44.6%) |
| 20 to 24 Year Olds | 1,575 (74.4%) | 543 (25.6%) |
| 25 to 34 Year Olds | 551 (88.9%) | 69 (11.1%) |
| 35 Years and over | 332 (91.0%) | 33 (9.0%) |
| Total | 5,965 (73.8%) | 2,117 (26.2%) |
Educational Attainment by Field of Study in Ferry Pass
Science & technology (1,558 | 19.6%), business (1,483 | 18.7%), education (856 | 10.8%), arts & humanities (551 | 6.9%), and social sciences (527 | 6.6%) are the most common fields of study among 7,939 individuals in Ferry Pass who have obtained a bachelor's degree or higher.
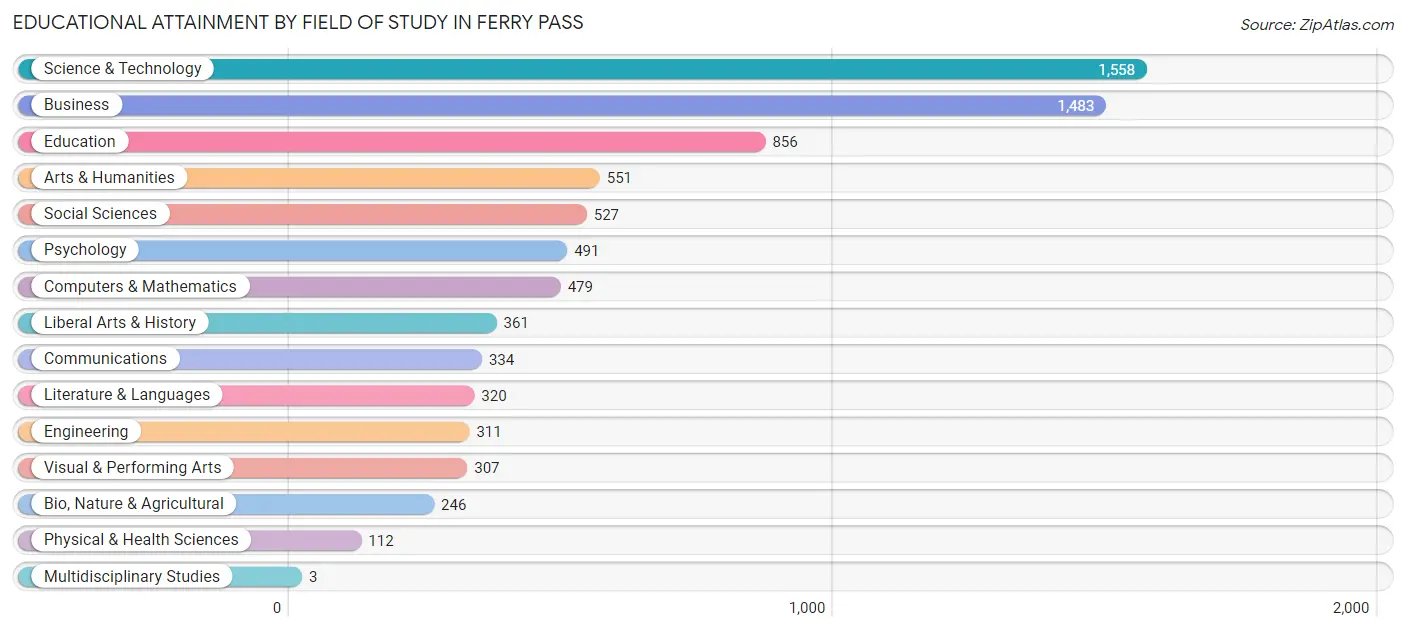
| Field of Study | # Graduates | % Graduates |
| Computers & Mathematics | 479 | 6.0% |
| Bio, Nature & Agricultural | 246 | 3.1% |
| Physical & Health Sciences | 112 | 1.4% |
| Psychology | 491 | 6.2% |
| Social Sciences | 527 | 6.6% |
| Engineering | 311 | 3.9% |
| Multidisciplinary Studies | 3 | 0.0% |
| Science & Technology | 1,558 | 19.6% |
| Business | 1,483 | 18.7% |
| Education | 856 | 10.8% |
| Literature & Languages | 320 | 4.0% |
| Liberal Arts & History | 361 | 4.5% |
| Visual & Performing Arts | 307 | 3.9% |
| Communications | 334 | 4.2% |
| Arts & Humanities | 551 | 6.9% |
| Total | 7,939 | 100.0% |
Transportation & Commute in Ferry Pass
Vehicle Availability by Sex in Ferry Pass
The most prevalent vehicle ownership categories in Ferry Pass are males with 2 vehicles (3,785, accounting for 53.8%) and females with 2 vehicles (2,960, making up 51.5%).
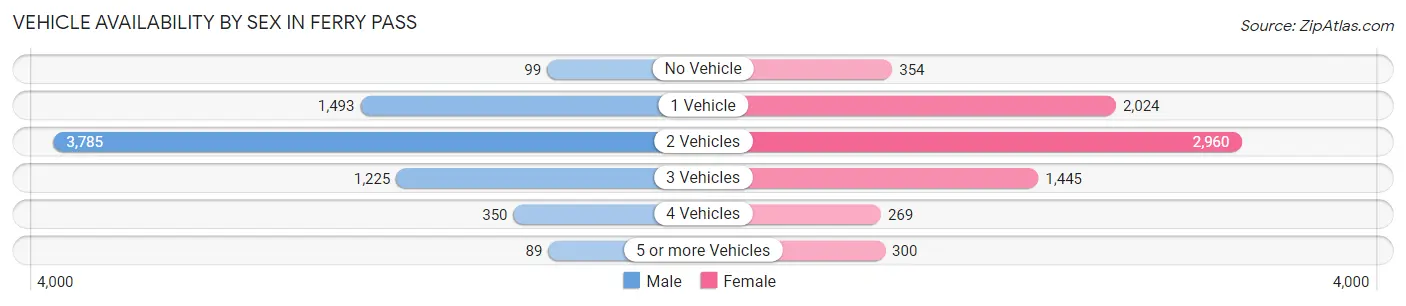
| Vehicles Available | Male | Female |
| No Vehicle | 99 (1.4%) | 354 (4.8%) |
| 1 Vehicle | 1,493 (21.2%) | 2,024 (27.5%) |
| 2 Vehicles | 3,785 (53.8%) | 2,960 (40.3%) |
| 3 Vehicles | 1,225 (17.4%) | 1,445 (19.7%) |
| 4 Vehicles | 350 (5.0%) | 269 (3.7%) |
| 5 or more Vehicles | 89 (1.3%) | 300 (4.1%) |
| Total | 7,041 (100.0%) | 7,352 (100.0%) |
Commute Time in Ferry Pass
The most frequently occuring commute durations in Ferry Pass are 15 to 19 minutes (3,005 commuters, 21.5%), 20 to 24 minutes (2,251 commuters, 16.1%), and 10 to 14 minutes (2,192 commuters, 15.7%).
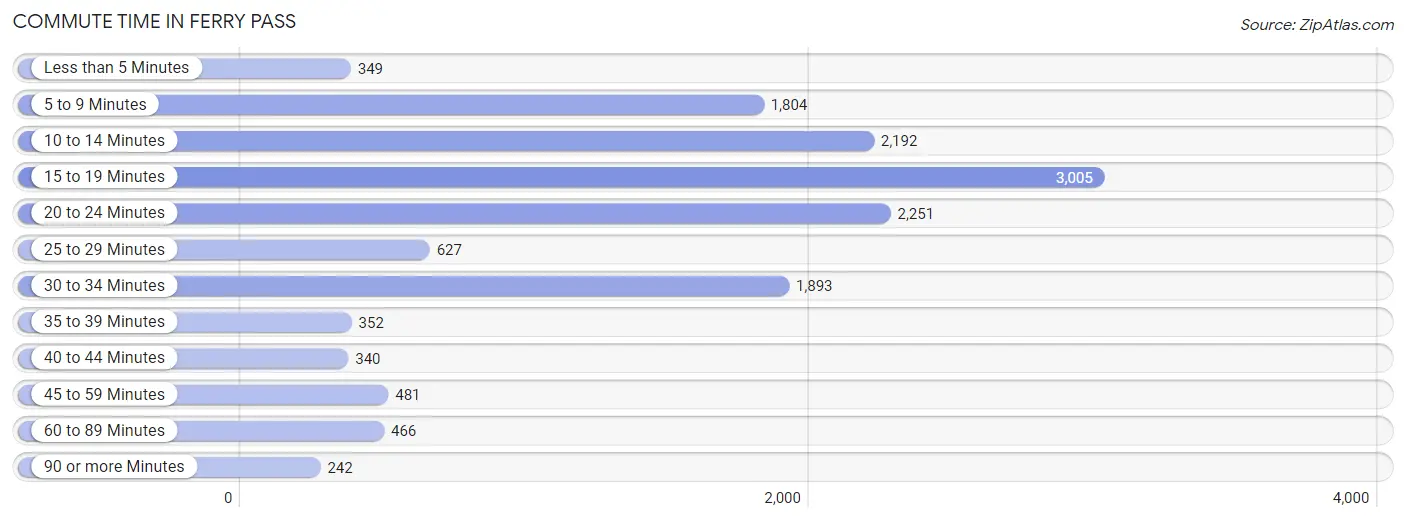
| Commute Time | # Commuters | % Commuters |
| Less than 5 Minutes | 349 | 2.5% |
| 5 to 9 Minutes | 1,804 | 12.9% |
| 10 to 14 Minutes | 2,192 | 15.7% |
| 15 to 19 Minutes | 3,005 | 21.5% |
| 20 to 24 Minutes | 2,251 | 16.1% |
| 25 to 29 Minutes | 627 | 4.5% |
| 30 to 34 Minutes | 1,893 | 13.5% |
| 35 to 39 Minutes | 352 | 2.5% |
| 40 to 44 Minutes | 340 | 2.4% |
| 45 to 59 Minutes | 481 | 3.4% |
| 60 to 89 Minutes | 466 | 3.3% |
| 90 or more Minutes | 242 | 1.7% |
Commute Time by Sex in Ferry Pass
The most common commute times in Ferry Pass are 15 to 19 minutes (1,293 commuters, 18.6%) for males and 15 to 19 minutes (1,712 commuters, 24.3%) for females.
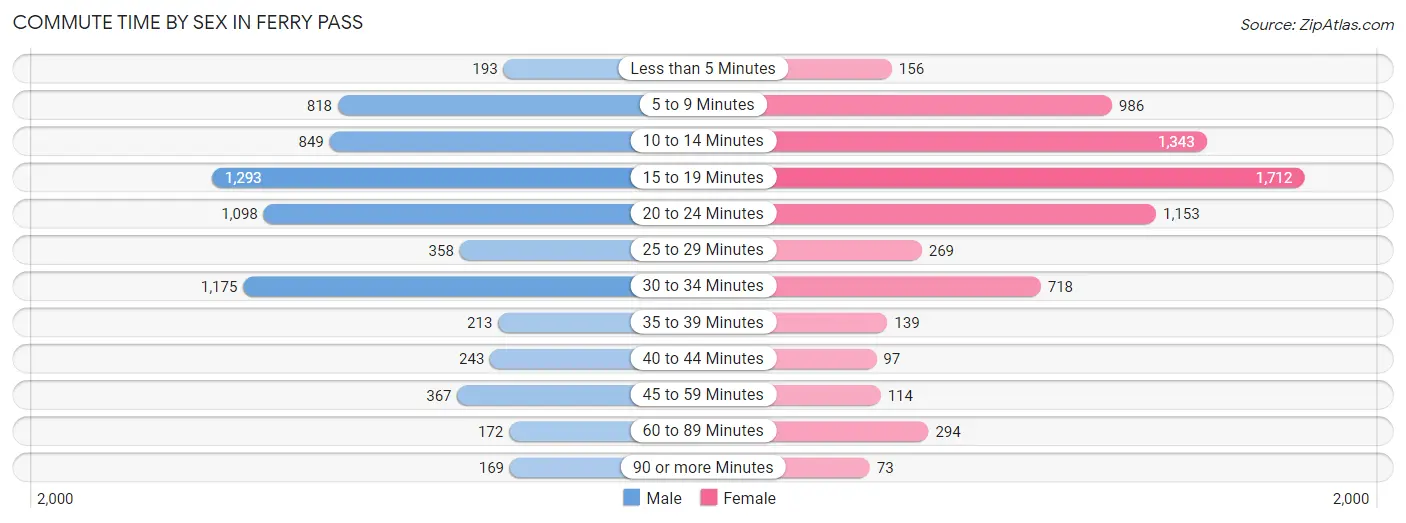
| Commute Time | Male | Female |
| Less than 5 Minutes | 193 (2.8%) | 156 (2.2%) |
| 5 to 9 Minutes | 818 (11.8%) | 986 (14.0%) |
| 10 to 14 Minutes | 849 (12.2%) | 1,343 (19.0%) |
| 15 to 19 Minutes | 1,293 (18.6%) | 1,712 (24.3%) |
| 20 to 24 Minutes | 1,098 (15.8%) | 1,153 (16.4%) |
| 25 to 29 Minutes | 358 (5.1%) | 269 (3.8%) |
| 30 to 34 Minutes | 1,175 (16.9%) | 718 (10.2%) |
| 35 to 39 Minutes | 213 (3.1%) | 139 (2.0%) |
| 40 to 44 Minutes | 243 (3.5%) | 97 (1.4%) |
| 45 to 59 Minutes | 367 (5.3%) | 114 (1.6%) |
| 60 to 89 Minutes | 172 (2.5%) | 294 (4.2%) |
| 90 or more Minutes | 169 (2.4%) | 73 (1.0%) |
Time of Departure to Work by Sex in Ferry Pass
The most frequent times of departure to work in Ferry Pass are 6:00 AM to 6:29 AM (993, 14.3%) for males and 7:00 AM to 7:29 AM (898, 12.7%) for females.
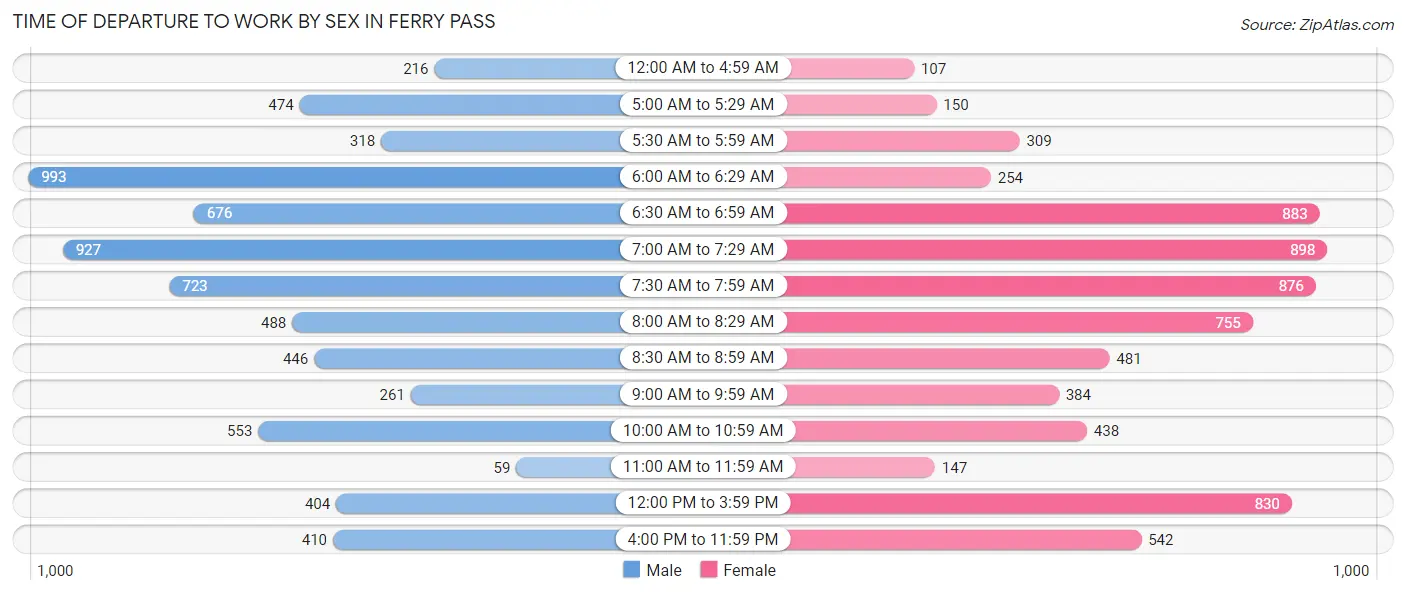
| Time of Departure | Male | Female |
| 12:00 AM to 4:59 AM | 216 (3.1%) | 107 (1.5%) |
| 5:00 AM to 5:29 AM | 474 (6.8%) | 150 (2.1%) |
| 5:30 AM to 5:59 AM | 318 (4.6%) | 309 (4.4%) |
| 6:00 AM to 6:29 AM | 993 (14.3%) | 254 (3.6%) |
| 6:30 AM to 6:59 AM | 676 (9.7%) | 883 (12.5%) |
| 7:00 AM to 7:29 AM | 927 (13.3%) | 898 (12.7%) |
| 7:30 AM to 7:59 AM | 723 (10.4%) | 876 (12.4%) |
| 8:00 AM to 8:29 AM | 488 (7.0%) | 755 (10.7%) |
| 8:30 AM to 8:59 AM | 446 (6.4%) | 481 (6.8%) |
| 9:00 AM to 9:59 AM | 261 (3.8%) | 384 (5.4%) |
| 10:00 AM to 10:59 AM | 553 (8.0%) | 438 (6.2%) |
| 11:00 AM to 11:59 AM | 59 (0.9%) | 147 (2.1%) |
| 12:00 PM to 3:59 PM | 404 (5.8%) | 830 (11.8%) |
| 4:00 PM to 11:59 PM | 410 (5.9%) | 542 (7.7%) |
| Total | 6,948 (100.0%) | 7,054 (100.0%) |
Housing Occupancy in Ferry Pass
Occupancy by Ownership in Ferry Pass
Of the total 13,224 dwellings in Ferry Pass, owner-occupied units account for 5,926 (44.8%), while renter-occupied units make up 7,298 (55.2%).
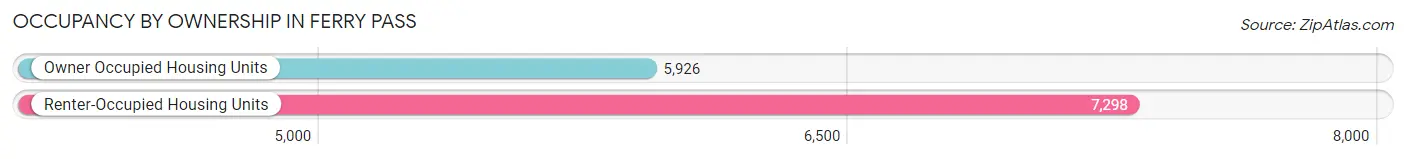
| Occupancy | # Housing Units | % Housing Units |
| Owner Occupied Housing Units | 5,926 | 44.8% |
| Renter-Occupied Housing Units | 7,298 | 55.2% |
| Total Occupied Housing Units | 13,224 | 100.0% |
Occupancy by Household Size in Ferry Pass
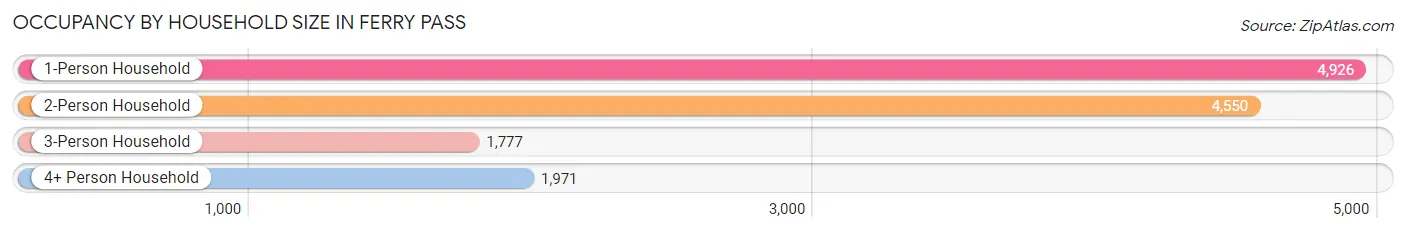
| Household Size | # Housing Units | % Housing Units |
| 1-Person Household | 4,926 | 37.2% |
| 2-Person Household | 4,550 | 34.4% |
| 3-Person Household | 1,777 | 13.4% |
| 4+ Person Household | 1,971 | 14.9% |
| Total Housing Units | 13,224 | 100.0% |
Occupancy by Ownership by Household Size in Ferry Pass
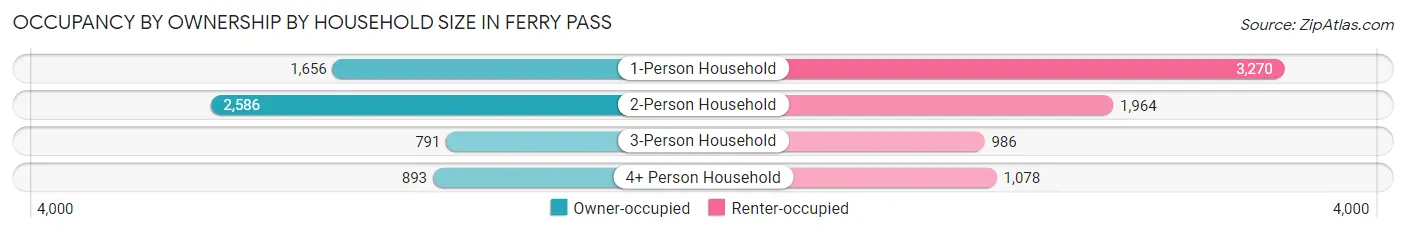
| Household Size | Owner-occupied | Renter-occupied |
| 1-Person Household | 1,656 (33.6%) | 3,270 (66.4%) |
| 2-Person Household | 2,586 (56.8%) | 1,964 (43.2%) |
| 3-Person Household | 791 (44.5%) | 986 (55.5%) |
| 4+ Person Household | 893 (45.3%) | 1,078 (54.7%) |
| Total Housing Units | 5,926 (44.8%) | 7,298 (55.2%) |
Occupancy by Educational Attainment in Ferry Pass
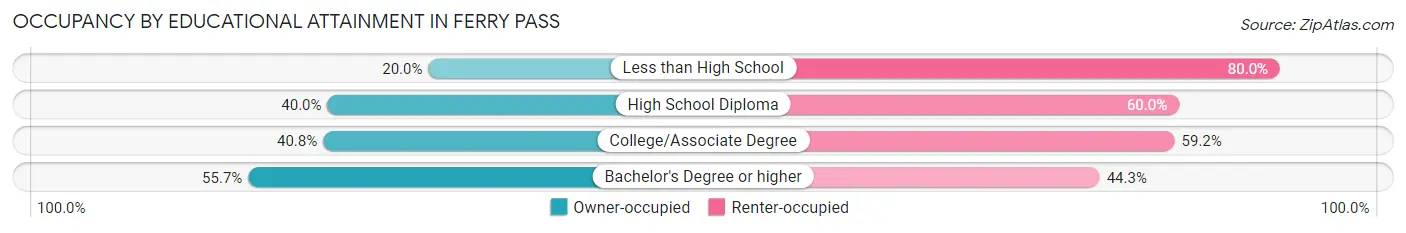
| Household Size | Owner-occupied | Renter-occupied |
| Less than High School | 103 (20.0%) | 413 (80.0%) |
| High School Diploma | 1,168 (40.0%) | 1,754 (60.0%) |
| College/Associate Degree | 2,183 (40.8%) | 3,163 (59.2%) |
| Bachelor's Degree or higher | 2,472 (55.7%) | 1,968 (44.3%) |
Occupancy by Age of Householder in Ferry Pass
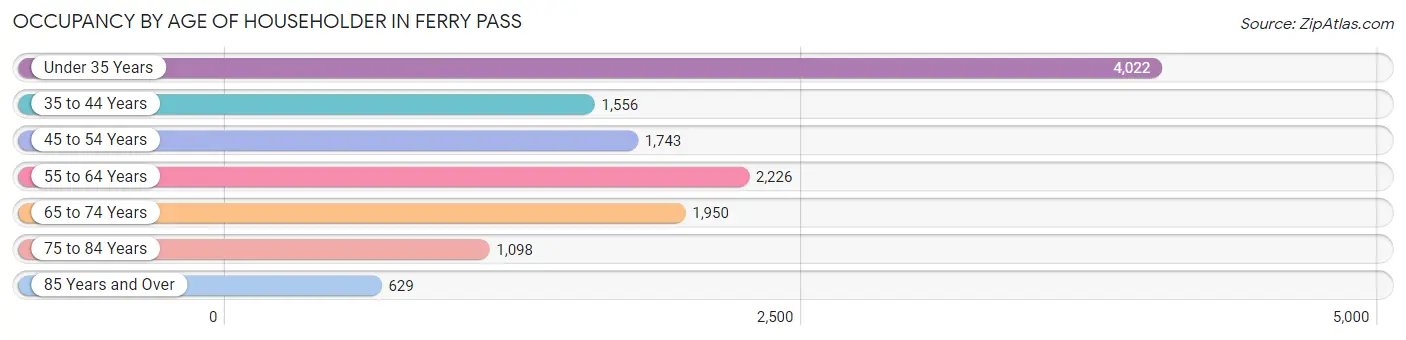
| Age Bracket | # Households | % Households |
| Under 35 Years | 4,022 | 30.4% |
| 35 to 44 Years | 1,556 | 11.8% |
| 45 to 54 Years | 1,743 | 13.2% |
| 55 to 64 Years | 2,226 | 16.8% |
| 65 to 74 Years | 1,950 | 14.7% |
| 75 to 84 Years | 1,098 | 8.3% |
| 85 Years and Over | 629 | 4.8% |
| Total | 13,224 | 100.0% |
Housing Finances in Ferry Pass
Median Income by Occupancy in Ferry Pass
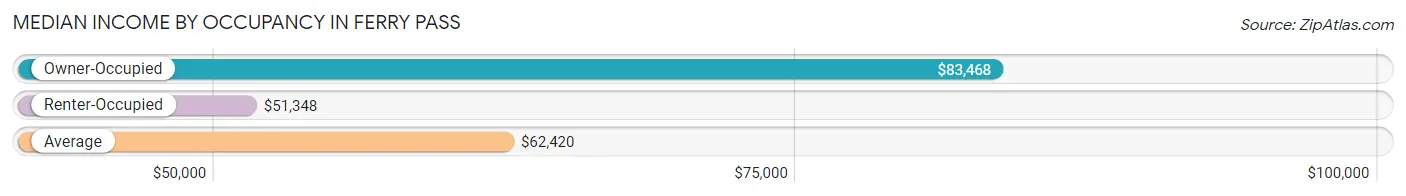
| Occupancy Type | # Households | Median Income |
| Owner-Occupied | 5,926 (44.8%) | $83,468 |
| Renter-Occupied | 7,298 (55.2%) | $51,348 |
| Average | 13,224 (100.0%) | $62,420 |
Occupancy by Householder Income Bracket in Ferry Pass
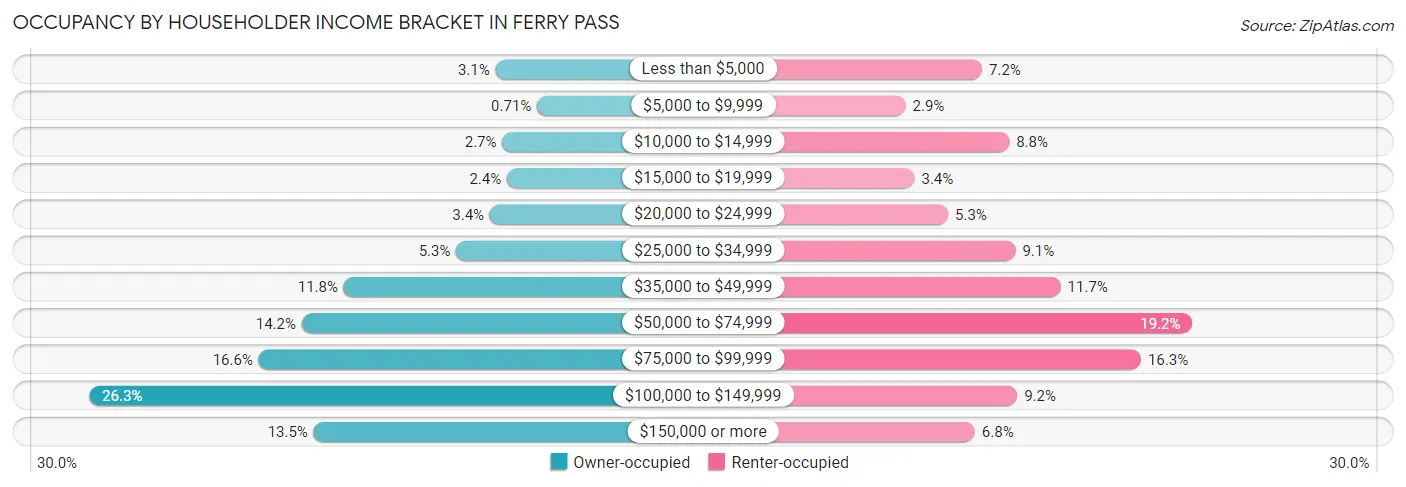
| Income Bracket | Owner-occupied | Renter-occupied |
| Less than $5,000 | 183 (3.1%) | 528 (7.2%) |
| $5,000 to $9,999 | 42 (0.7%) | 209 (2.9%) |
| $10,000 to $14,999 | 160 (2.7%) | 641 (8.8%) |
| $15,000 to $19,999 | 144 (2.4%) | 246 (3.4%) |
| $20,000 to $24,999 | 202 (3.4%) | 386 (5.3%) |
| $25,000 to $34,999 | 316 (5.3%) | 667 (9.1%) |
| $35,000 to $49,999 | 697 (11.8%) | 855 (11.7%) |
| $50,000 to $74,999 | 839 (14.2%) | 1,404 (19.2%) |
| $75,000 to $99,999 | 985 (16.6%) | 1,190 (16.3%) |
| $100,000 to $149,999 | 1,559 (26.3%) | 674 (9.2%) |
| $150,000 or more | 799 (13.5%) | 498 (6.8%) |
| Total | 5,926 (100.0%) | 7,298 (100.0%) |
Monthly Housing Cost Tiers in Ferry Pass
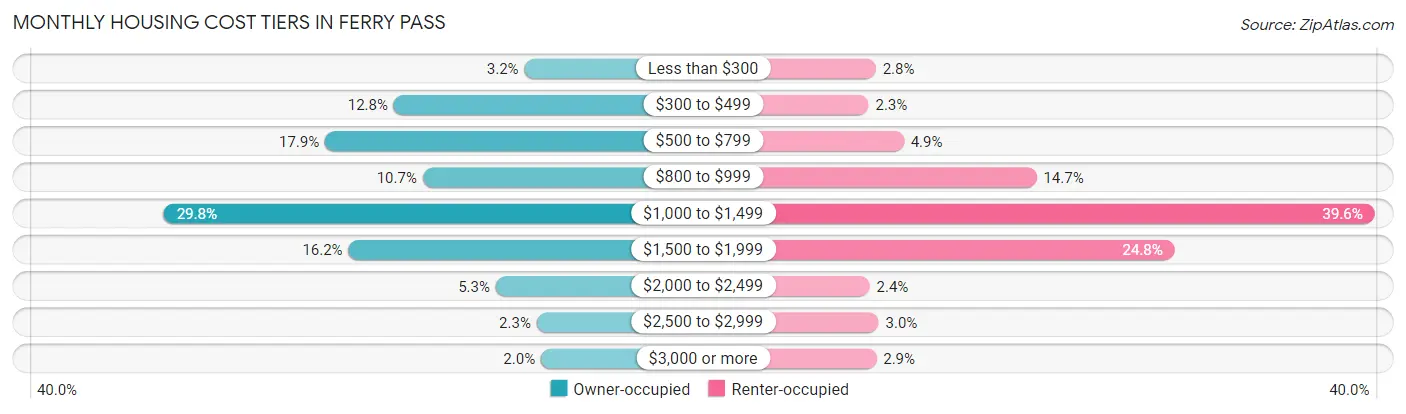
| Monthly Cost | Owner-occupied | Renter-occupied |
| Less than $300 | 189 (3.2%) | 206 (2.8%) |
| $300 to $499 | 759 (12.8%) | 167 (2.3%) |
| $500 to $799 | 1,059 (17.9%) | 356 (4.9%) |
| $800 to $999 | 633 (10.7%) | 1,070 (14.7%) |
| $1,000 to $1,499 | 1,763 (29.7%) | 2,887 (39.6%) |
| $1,500 to $1,999 | 957 (16.2%) | 1,812 (24.8%) |
| $2,000 to $2,499 | 314 (5.3%) | 173 (2.4%) |
| $2,500 to $2,999 | 135 (2.3%) | 221 (3.0%) |
| $3,000 or more | 117 (2.0%) | 209 (2.9%) |
| Total | 5,926 (100.0%) | 7,298 (100.0%) |
Physical Housing Characteristics in Ferry Pass
Housing Structures in Ferry Pass
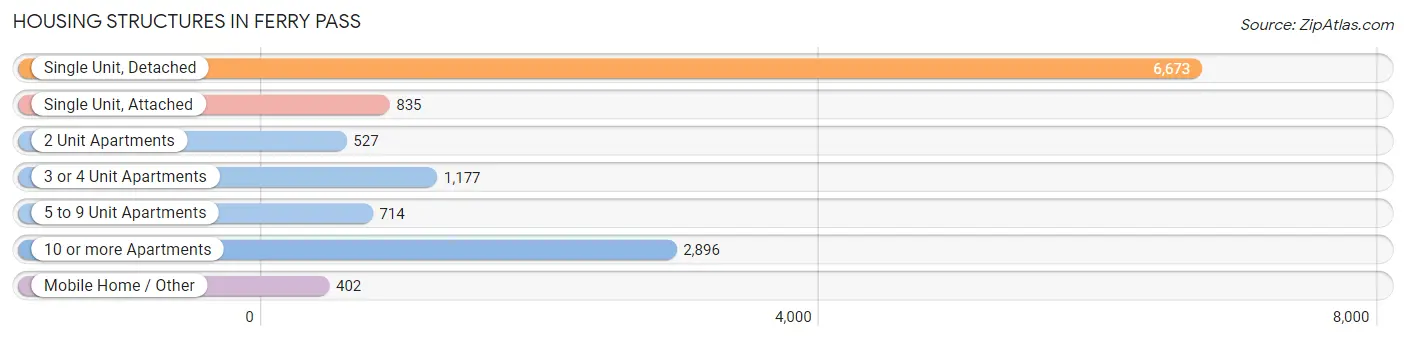
| Structure Type | # Housing Units | % Housing Units |
| Single Unit, Detached | 6,673 | 50.5% |
| Single Unit, Attached | 835 | 6.3% |
| 2 Unit Apartments | 527 | 4.0% |
| 3 or 4 Unit Apartments | 1,177 | 8.9% |
| 5 to 9 Unit Apartments | 714 | 5.4% |
| 10 or more Apartments | 2,896 | 21.9% |
| Mobile Home / Other | 402 | 3.0% |
| Total | 13,224 | 100.0% |
Housing Structures by Occupancy in Ferry Pass
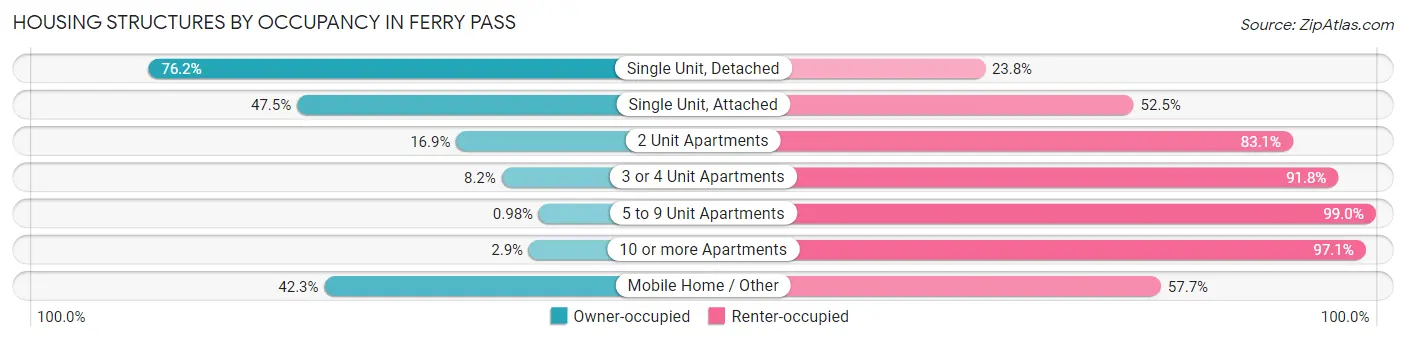
| Structure Type | Owner-occupied | Renter-occupied |
| Single Unit, Detached | 5,083 (76.2%) | 1,590 (23.8%) |
| Single Unit, Attached | 397 (47.5%) | 438 (52.5%) |
| 2 Unit Apartments | 89 (16.9%) | 438 (83.1%) |
| 3 or 4 Unit Apartments | 96 (8.2%) | 1,081 (91.8%) |
| 5 to 9 Unit Apartments | 7 (1.0%) | 707 (99.0%) |
| 10 or more Apartments | 84 (2.9%) | 2,812 (97.1%) |
| Mobile Home / Other | 170 (42.3%) | 232 (57.7%) |
| Total | 5,926 (44.8%) | 7,298 (55.2%) |
Housing Structures by Number of Rooms in Ferry Pass
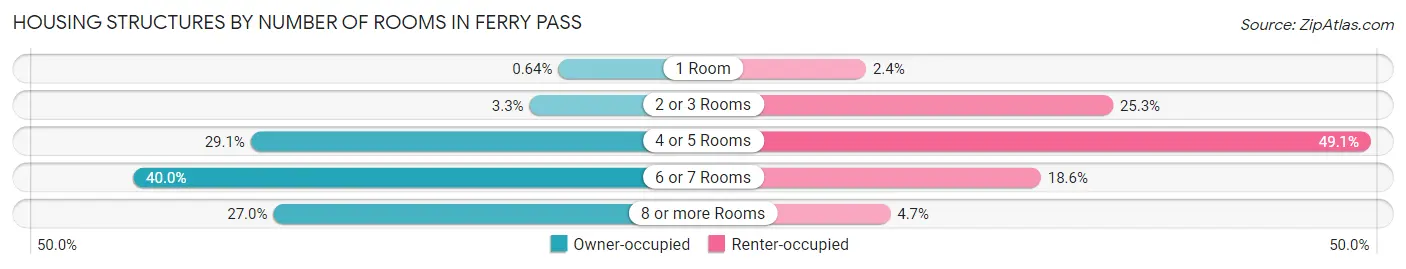
| Number of Rooms | Owner-occupied | Renter-occupied |
| 1 Room | 38 (0.6%) | 176 (2.4%) |
| 2 or 3 Rooms | 196 (3.3%) | 1,843 (25.3%) |
| 4 or 5 Rooms | 1,724 (29.1%) | 3,583 (49.1%) |
| 6 or 7 Rooms | 2,368 (40.0%) | 1,356 (18.6%) |
| 8 or more Rooms | 1,600 (27.0%) | 340 (4.7%) |
| Total | 5,926 (100.0%) | 7,298 (100.0%) |
Housing Structure by Heating Type in Ferry Pass
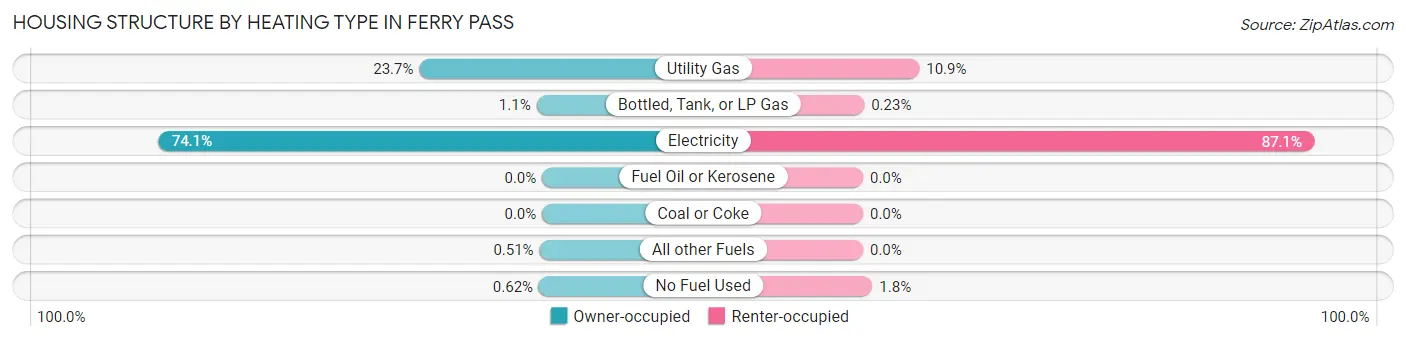
| Heating Type | Owner-occupied | Renter-occupied |
| Utility Gas | 1,406 (23.7%) | 793 (10.9%) |
| Bottled, Tank, or LP Gas | 64 (1.1%) | 17 (0.2%) |
| Electricity | 4,389 (74.1%) | 6,356 (87.1%) |
| Fuel Oil or Kerosene | 0 (0.0%) | 0 (0.0%) |
| Coal or Coke | 0 (0.0%) | 0 (0.0%) |
| All other Fuels | 30 (0.5%) | 0 (0.0%) |
| No Fuel Used | 37 (0.6%) | 132 (1.8%) |
| Total | 5,926 (100.0%) | 7,298 (100.0%) |
Household Vehicle Usage in Ferry Pass
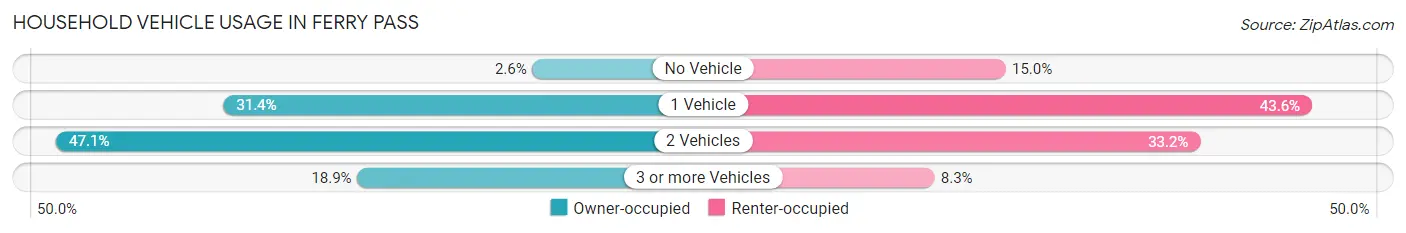
| Vehicles per Household | Owner-occupied | Renter-occupied |
| No Vehicle | 153 (2.6%) | 1,091 (14.9%) |
| 1 Vehicle | 1,863 (31.4%) | 3,181 (43.6%) |
| 2 Vehicles | 2,788 (47.0%) | 2,420 (33.2%) |
| 3 or more Vehicles | 1,122 (18.9%) | 606 (8.3%) |
| Total | 5,926 (100.0%) | 7,298 (100.0%) |
Real Estate & Mortgages in Ferry Pass
Real Estate and Mortgage Overview in Ferry Pass
| Characteristic | Without Mortgage | With Mortgage |
| Housing Units | 2,203 | 3,723 |
| Median Property Value | $218,900 | $196,400 |
| Median Household Income | $76,042 | $527 |
| Monthly Housing Costs | $561 | $117 |
| Real Estate Taxes | $1,290 | $223 |
Property Value by Mortgage Status in Ferry Pass
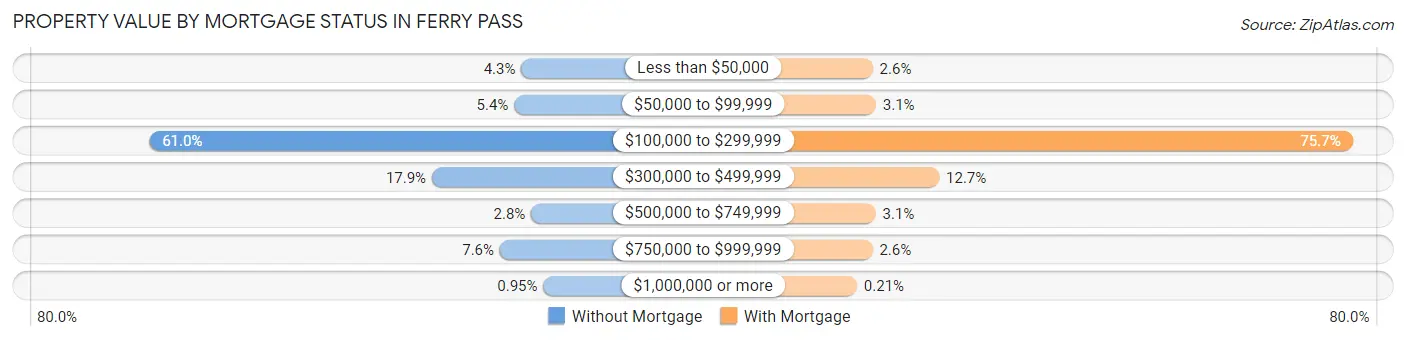
| Property Value | Without Mortgage | With Mortgage |
| Less than $50,000 | 95 (4.3%) | 97 (2.6%) |
| $50,000 to $99,999 | 119 (5.4%) | 115 (3.1%) |
| $100,000 to $299,999 | 1,344 (61.0%) | 2,819 (75.7%) |
| $300,000 to $499,999 | 395 (17.9%) | 474 (12.7%) |
| $500,000 to $749,999 | 62 (2.8%) | 114 (3.1%) |
| $750,000 to $999,999 | 167 (7.6%) | 96 (2.6%) |
| $1,000,000 or more | 21 (0.9%) | 8 (0.2%) |
| Total | 2,203 (100.0%) | 3,723 (100.0%) |
Household Income by Mortgage Status in Ferry Pass
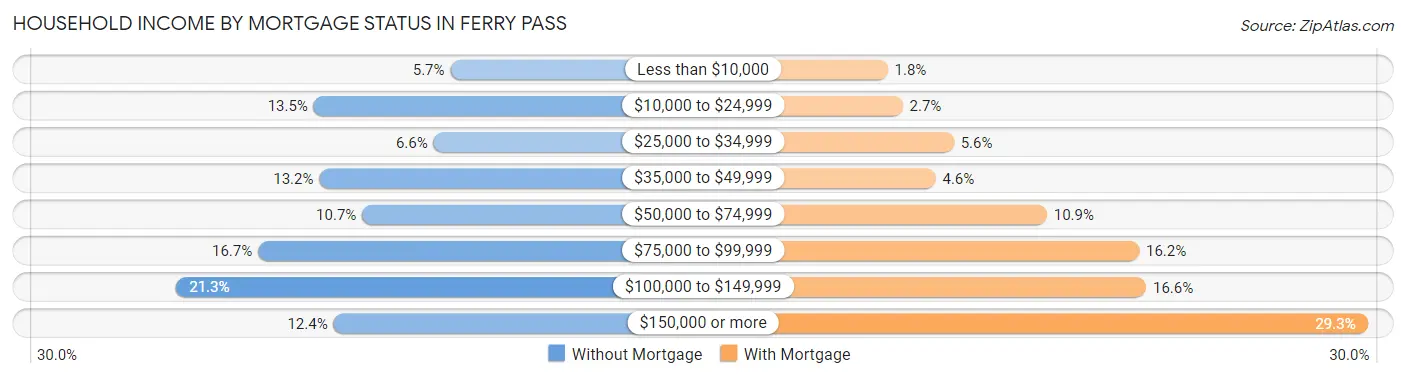
| Household Income | Without Mortgage | With Mortgage |
| Less than $10,000 | 125 (5.7%) | 68 (1.8%) |
| $10,000 to $24,999 | 297 (13.5%) | 100 (2.7%) |
| $25,000 to $34,999 | 146 (6.6%) | 209 (5.6%) |
| $35,000 to $49,999 | 290 (13.2%) | 170 (4.6%) |
| $50,000 to $74,999 | 236 (10.7%) | 407 (10.9%) |
| $75,000 to $99,999 | 367 (16.7%) | 603 (16.2%) |
| $100,000 to $149,999 | 470 (21.3%) | 618 (16.6%) |
| $150,000 or more | 272 (12.3%) | 1,089 (29.2%) |
| Total | 2,203 (100.0%) | 3,723 (100.0%) |
Property Value to Household Income Ratio in Ferry Pass
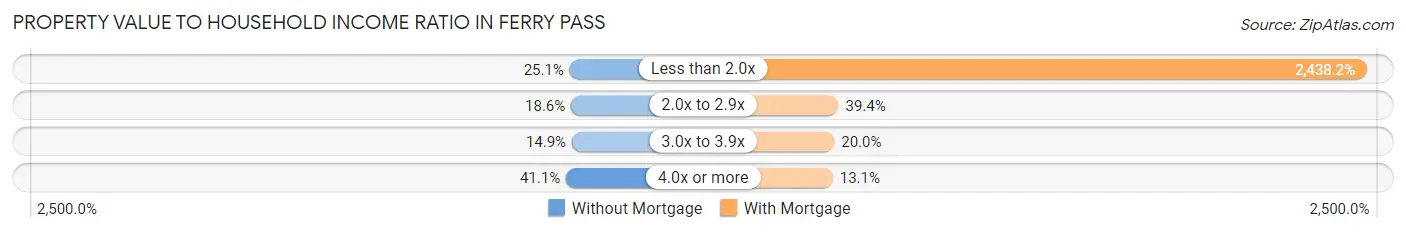
| Value-to-Income Ratio | Without Mortgage | With Mortgage |
| Less than 2.0x | 552 (25.1%) | 90,774 (2,438.2%) |
| 2.0x to 2.9x | 409 (18.6%) | 1,465 (39.4%) |
| 3.0x to 3.9x | 328 (14.9%) | 745 (20.0%) |
| 4.0x or more | 906 (41.1%) | 488 (13.1%) |
| Total | 2,203 (100.0%) | 3,723 (100.0%) |
Real Estate Taxes by Mortgage Status in Ferry Pass
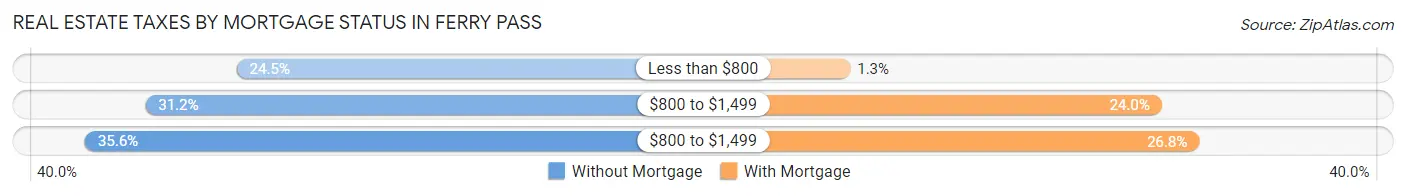
| Property Taxes | Without Mortgage | With Mortgage |
| Less than $800 | 540 (24.5%) | 47 (1.3%) |
| $800 to $1,499 | 687 (31.2%) | 894 (24.0%) |
| $800 to $1,499 | 784 (35.6%) | 996 (26.8%) |
| Total | 2,203 (100.0%) | 3,723 (100.0%) |
Health & Disability in Ferry Pass
Health Insurance Coverage by Age in Ferry Pass
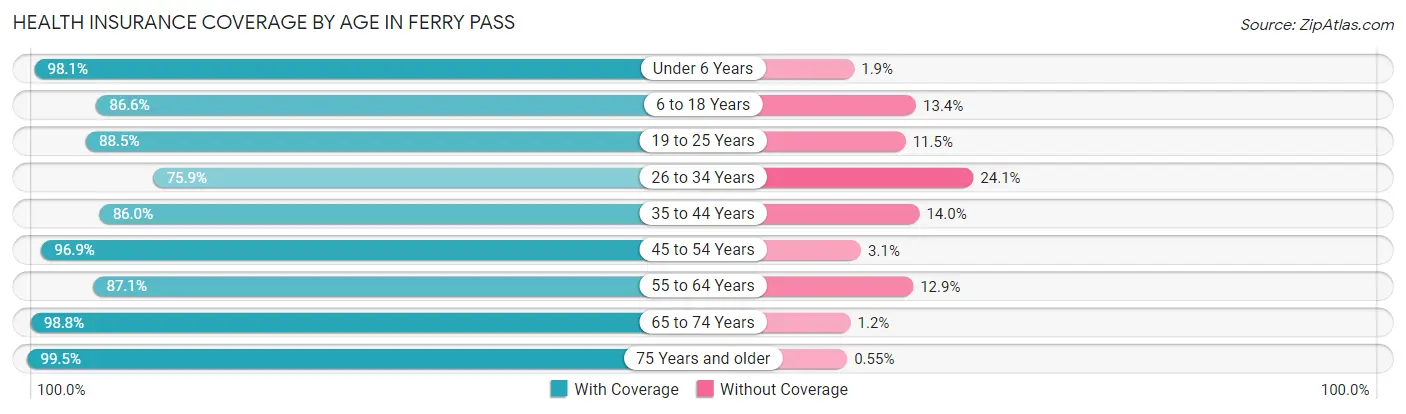
| Age Bracket | With Coverage | Without Coverage |
| Under 6 Years | 1,689 (98.1%) | 32 (1.9%) |
| 6 to 18 Years | 3,666 (86.6%) | 567 (13.4%) |
| 19 to 25 Years | 4,589 (88.5%) | 594 (11.5%) |
| 26 to 34 Years | 3,267 (75.9%) | 1,036 (24.1%) |
| 35 to 44 Years | 2,589 (86.0%) | 422 (14.0%) |
| 45 to 54 Years | 2,685 (96.9%) | 87 (3.1%) |
| 55 to 64 Years | 3,144 (87.1%) | 464 (12.9%) |
| 65 to 74 Years | 3,254 (98.8%) | 39 (1.2%) |
| 75 Years and older | 2,174 (99.5%) | 12 (0.5%) |
| Total | 27,057 (89.3%) | 3,253 (10.7%) |
Health Insurance Coverage by Citizenship Status in Ferry Pass
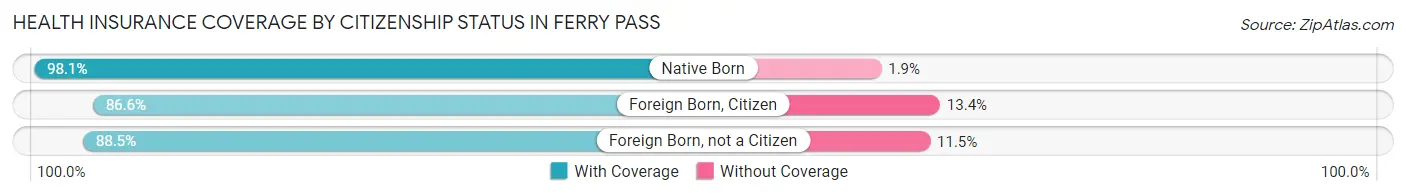
| Citizenship Status | With Coverage | Without Coverage |
| Native Born | 1,689 (98.1%) | 32 (1.9%) |
| Foreign Born, Citizen | 3,666 (86.6%) | 567 (13.4%) |
| Foreign Born, not a Citizen | 4,589 (88.5%) | 594 (11.5%) |
Health Insurance Coverage by Household Income in Ferry Pass
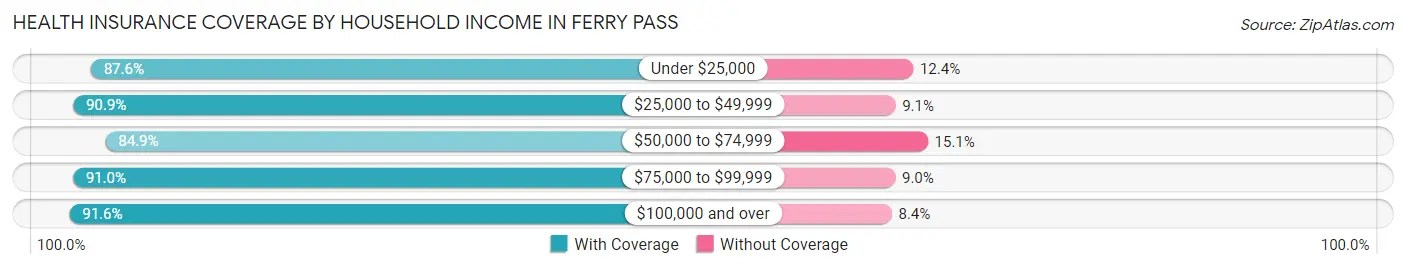
| Household Income | With Coverage | Without Coverage |
| Under $25,000 | 3,539 (87.6%) | 501 (12.4%) |
| $25,000 to $49,999 | 4,190 (90.9%) | 418 (9.1%) |
| $50,000 to $74,999 | 4,617 (84.9%) | 824 (15.1%) |
| $75,000 to $99,999 | 4,912 (91.0%) | 488 (9.0%) |
| $100,000 and over | 8,282 (91.6%) | 758 (8.4%) |
Public vs Private Health Insurance Coverage by Age in Ferry Pass
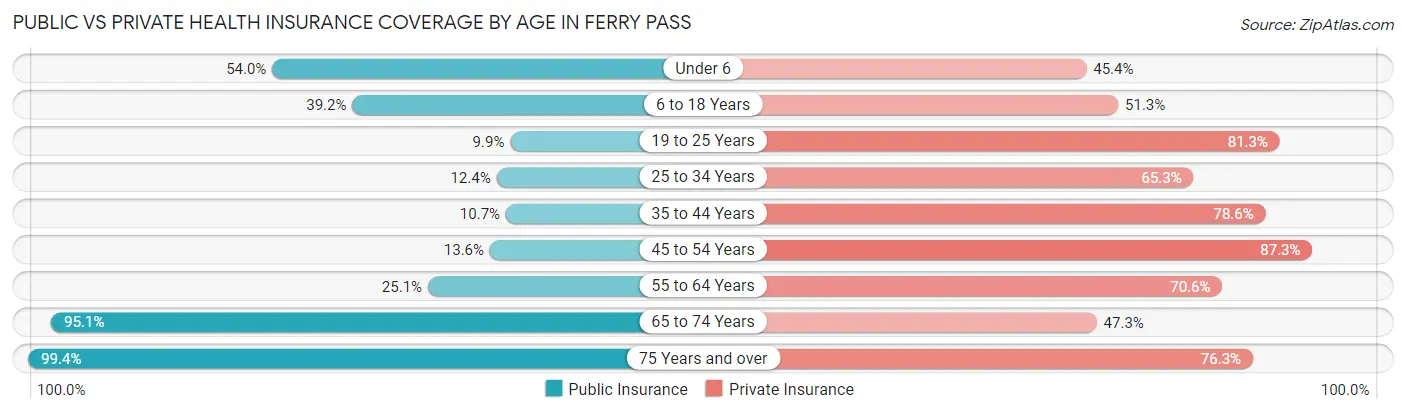
| Age Bracket | Public Insurance | Private Insurance |
| Under 6 | 930 (54.0%) | 781 (45.4%) |
| 6 to 18 Years | 1,658 (39.2%) | 2,171 (51.3%) |
| 19 to 25 Years | 511 (9.9%) | 4,214 (81.3%) |
| 25 to 34 Years | 534 (12.4%) | 2,809 (65.3%) |
| 35 to 44 Years | 321 (10.7%) | 2,368 (78.6%) |
| 45 to 54 Years | 378 (13.6%) | 2,421 (87.3%) |
| 55 to 64 Years | 907 (25.1%) | 2,548 (70.6%) |
| 65 to 74 Years | 3,131 (95.1%) | 1,558 (47.3%) |
| 75 Years and over | 2,172 (99.4%) | 1,668 (76.3%) |
| Total | 10,542 (34.8%) | 20,538 (67.8%) |
Disability Status by Sex by Age in Ferry Pass
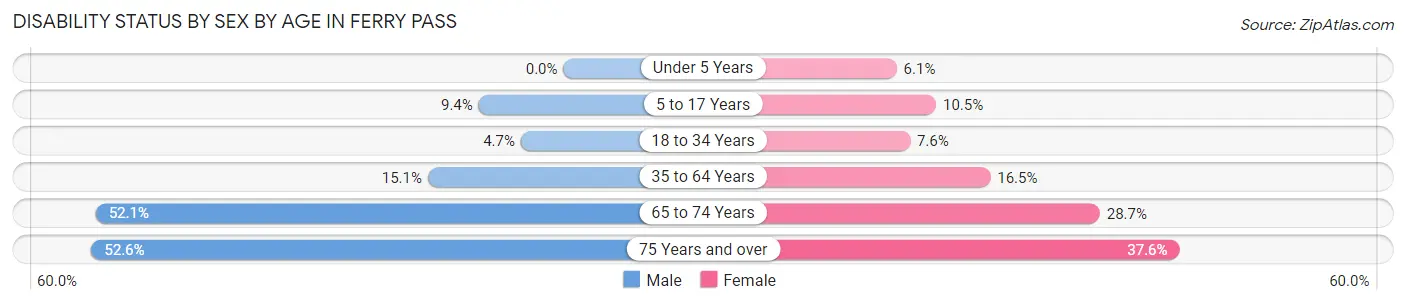
| Age Bracket | Male | Female |
| Under 5 Years | 0 (0.0%) | 45 (6.1%) |
| 5 to 17 Years | 166 (9.4%) | 224 (10.5%) |
| 18 to 34 Years | 202 (4.7%) | 439 (7.6%) |
| 35 to 64 Years | 670 (15.1%) | 819 (16.5%) |
| 65 to 74 Years | 738 (52.1%) | 539 (28.7%) |
| 75 Years and over | 503 (52.6%) | 462 (37.6%) |
Disability Class by Sex by Age in Ferry Pass
Disability Class: Hearing Difficulty
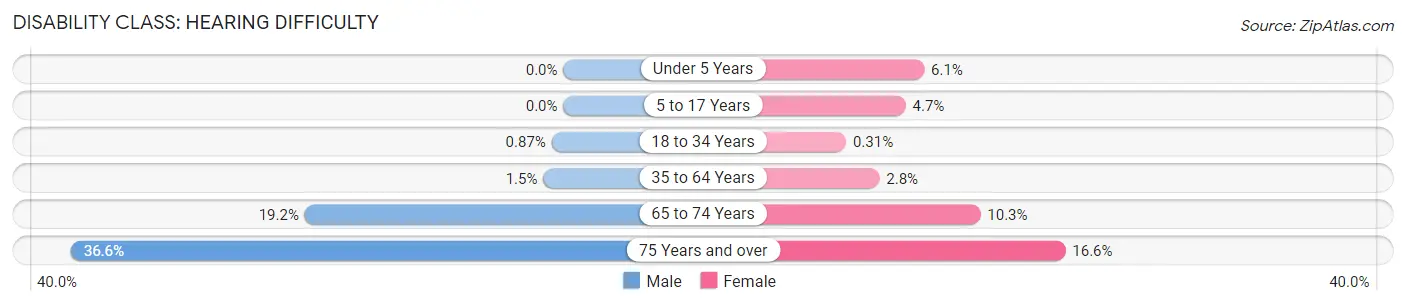
| Age Bracket | Male | Female |
| Under 5 Years | 0 (0.0%) | 45 (6.1%) |
| 5 to 17 Years | 0 (0.0%) | 101 (4.7%) |
| 18 to 34 Years | 37 (0.9%) | 18 (0.3%) |
| 35 to 64 Years | 66 (1.5%) | 138 (2.8%) |
| 65 to 74 Years | 272 (19.2%) | 193 (10.3%) |
| 75 Years and over | 350 (36.6%) | 204 (16.6%) |
Disability Class: Vision Difficulty
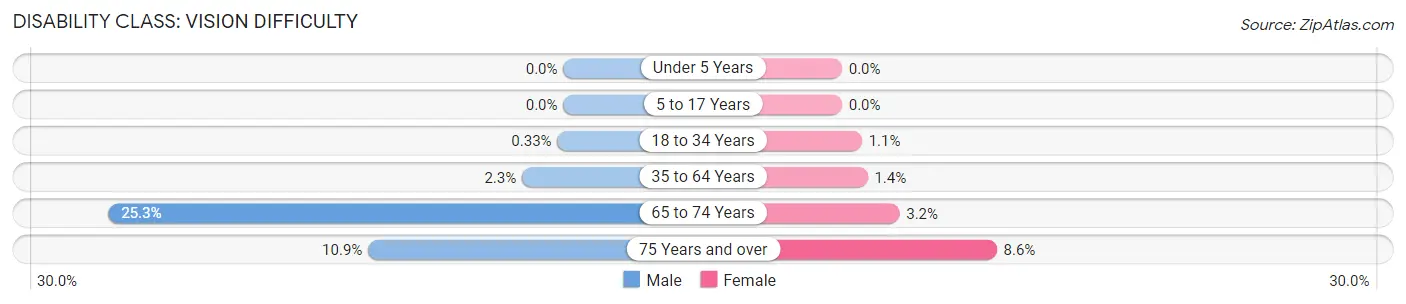
| Age Bracket | Male | Female |
| Under 5 Years | 0 (0.0%) | 0 (0.0%) |
| 5 to 17 Years | 0 (0.0%) | 0 (0.0%) |
| 18 to 34 Years | 14 (0.3%) | 64 (1.1%) |
| 35 to 64 Years | 102 (2.3%) | 71 (1.4%) |
| 65 to 74 Years | 359 (25.3%) | 60 (3.2%) |
| 75 Years and over | 104 (10.9%) | 106 (8.6%) |
Disability Class: Cognitive Difficulty
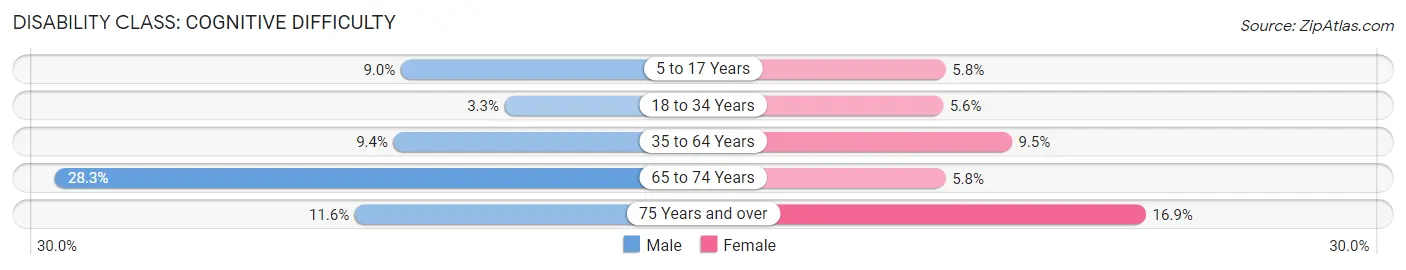
| Age Bracket | Male | Female |
| 5 to 17 Years | 159 (9.0%) | 123 (5.8%) |
| 18 to 34 Years | 139 (3.3%) | 325 (5.6%) |
| 35 to 64 Years | 419 (9.4%) | 468 (9.5%) |
| 65 to 74 Years | 401 (28.3%) | 108 (5.8%) |
| 75 Years and over | 111 (11.6%) | 208 (16.9%) |
Disability Class: Ambulatory Difficulty
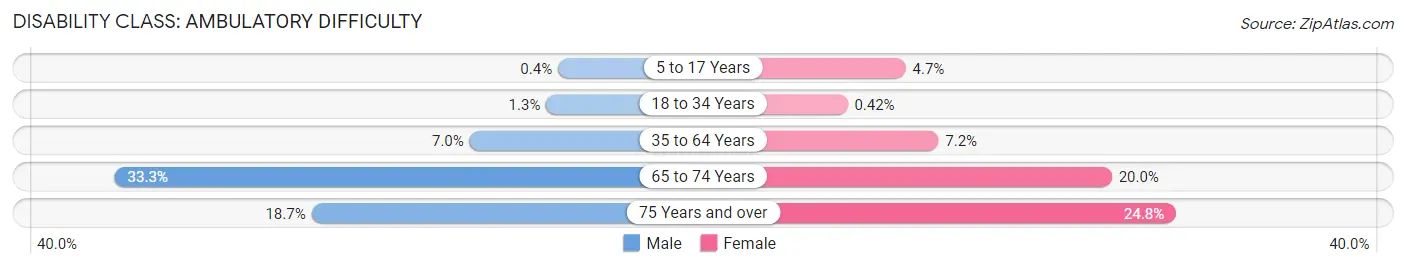
| Age Bracket | Male | Female |
| 5 to 17 Years | 7 (0.4%) | 101 (4.7%) |
| 18 to 34 Years | 54 (1.3%) | 24 (0.4%) |
| 35 to 64 Years | 309 (7.0%) | 355 (7.2%) |
| 65 to 74 Years | 472 (33.3%) | 376 (20.0%) |
| 75 Years and over | 179 (18.7%) | 305 (24.8%) |
Disability Class: Self-Care Difficulty
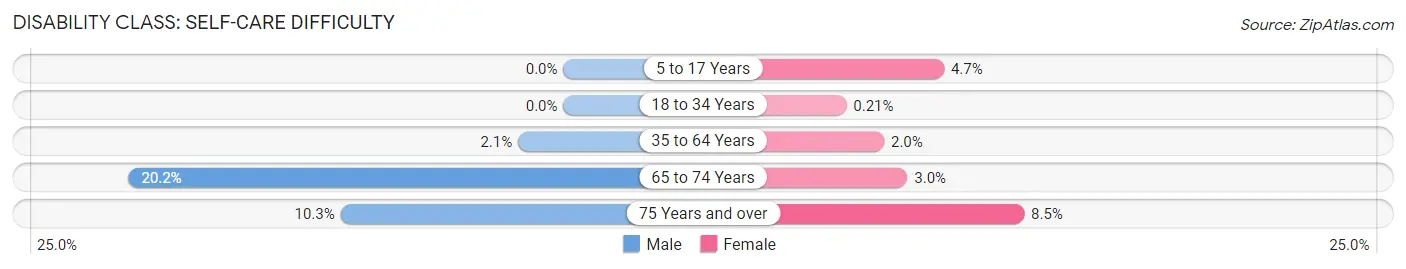
| Age Bracket | Male | Female |
| 5 to 17 Years | 0 (0.0%) | 101 (4.7%) |
| 18 to 34 Years | 0 (0.0%) | 12 (0.2%) |
| 35 to 64 Years | 93 (2.1%) | 97 (2.0%) |
| 65 to 74 Years | 286 (20.2%) | 57 (3.0%) |
| 75 Years and over | 99 (10.3%) | 104 (8.5%) |
Technology Access in Ferry Pass
Computing Device Access in Ferry Pass
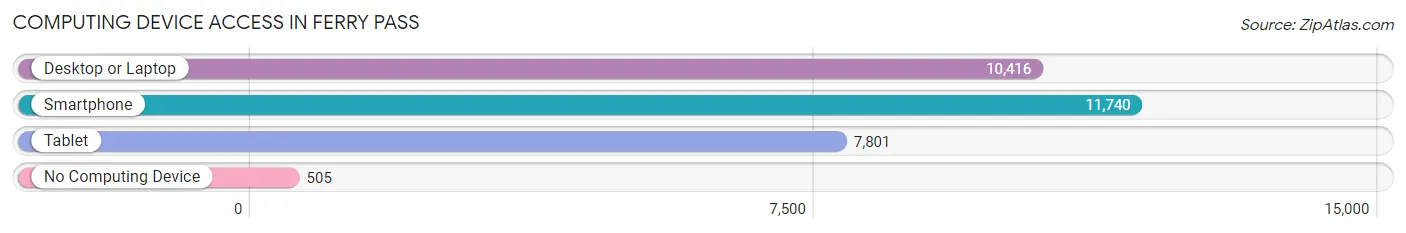
| Device Type | # Households | % Households |
| Desktop or Laptop | 10,416 | 78.8% |
| Smartphone | 11,740 | 88.8% |
| Tablet | 7,801 | 59.0% |
| No Computing Device | 505 | 3.8% |
| Total | 13,224 | 100.0% |
Internet Access in Ferry Pass
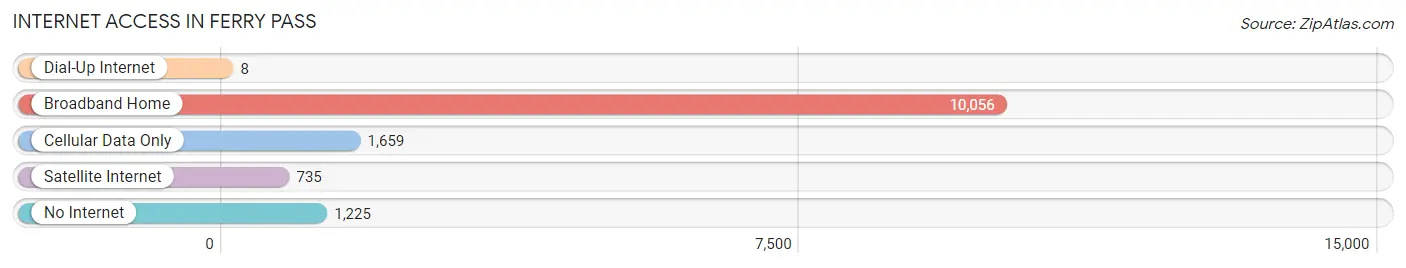
| Internet Type | # Households | % Households |
| Dial-Up Internet | 8 | 0.1% |
| Broadband Home | 10,056 | 76.0% |
| Cellular Data Only | 1,659 | 12.6% |
| Satellite Internet | 735 | 5.6% |
| No Internet | 1,225 | 9.3% |
| Total | 13,224 | 100.0% |
Ferry Pass Summary
Ferry Pass is an unincorporated community located in Escambia County, Florida, United States. It is part of the Pensacola–Ferry Pass–Brent Metropolitan Statistical Area. The population of Ferry Pass was estimated to be around 20,000 in 2019.
History
Ferry Pass was first settled in the early 1800s by settlers from the British Isles. The area was originally known as "Ferry's Pass" after the ferry that operated across the Escambia River. The ferry was used to transport goods and people between Pensacola and the mainland. The area was later renamed Ferry Pass.
In the late 1800s, the area was home to a large number of lumber mills and sawmills. The lumber industry was a major contributor to the local economy. The area was also home to a number of farms and ranches.
In the early 1900s, the area began to experience rapid growth due to the development of the Pensacola Naval Air Station. The base brought a large number of military personnel and their families to the area. This influx of people led to the development of new neighborhoods and businesses.
Geography
Ferry Pass is located in Escambia County, Florida. It is situated on the western side of the Escambia River, just north of Pensacola. The area is bordered by the city of Pensacola to the south, the city of Cantonment to the east, and the city of Warrington to the west.
The area is mostly flat and is located at an elevation of around 10 feet above sea level. The climate is humid subtropical, with hot, humid summers and mild winters.
Economy
Ferry Pass is home to a number of businesses and industries. The area is home to a number of retail stores, restaurants, and other businesses. The area is also home to a number of manufacturing and industrial businesses.
The area is also home to a number of military installations, including the Pensacola Naval Air Station and the Saufley Field Naval Outlying Landing Field. These installations provide a significant number of jobs to the local economy.
Demographics
As of the 2010 census, the population of Ferry Pass was 19,890. The racial makeup of the area was 79.3% White, 14.2% African American, 0.7% Native American, 1.3% Asian, 0.1% Pacific Islander, 2.2% from other races, and 2.4% from two or more races. Hispanic or Latino of any race were 6.3% of the population.
The median household income in Ferry Pass was $45,845, and the median family income was $51,845. The per capita income was $20,845. About 11.3% of families and 14.2% of the population were below the poverty line, including 19.2% of those under age 18 and 8.2% of those age 65 or over.
Common Questions
What is Per Capita Income in Ferry Pass?
Per Capita income in Ferry Pass is $33,999.
What is the Median Family Income in Ferry Pass?
Median Family Income in Ferry Pass is $75,402.
What is the Median Household income in Ferry Pass?
Median Household Income in Ferry Pass is $62,420.
What is Income or Wage Gap in Ferry Pass?
Income or Wage Gap in Ferry Pass is 30.9%.
Women in Ferry Pass earn 69.1 cents for every dollar earned by a man.
What is Family Income Deficit in Ferry Pass?
Family Income Deficit in Ferry Pass is $10,242.
Families that are below poverty line in Ferry Pass earn $10,242 less on average than the poverty threshold level.
What is Inequality or Gini Index in Ferry Pass?
Inequality or Gini Index in Ferry Pass is 0.44.
What is the Total Population of Ferry Pass?
Total Population of Ferry Pass is 32,447.
What is the Total Male Population of Ferry Pass?
Total Male Population of Ferry Pass is 14,625.
What is the Total Female Population of Ferry Pass?
Total Female Population of Ferry Pass is 17,822.
What is the Ratio of Males per 100 Females in Ferry Pass?
There are 82.06 Males per 100 Females in Ferry Pass.
What is the Ratio of Females per 100 Males in Ferry Pass?
There are 121.86 Females per 100 Males in Ferry Pass.
What is the Median Population Age in Ferry Pass?
Median Population Age in Ferry Pass is 35.9 Years.
What is the Average Family Size in Ferry Pass
Average Family Size in Ferry Pass is 2.8 People.
What is the Average Household Size in Ferry Pass
Average Household Size in Ferry Pass is 2.2 People.
How Large is the Labor Force in Ferry Pass?
There are 17,146 People in the Labor Forcein in Ferry Pass.
What is the Percentage of People in the Labor Force in Ferry Pass?
62.3% of People are in the Labor Force in Ferry Pass.
What is the Unemployment Rate in Ferry Pass?
Unemployment Rate in Ferry Pass is 8.0%.