Earnings by Sex by Educational Attainment in Pinion Pines
Educational Attainment
Male Income
Female Income
Less than High School
-
-
High School Diploma
-
-
College or Associate's Degree
-
-
Bachelor's Degree
-
-
Graduate Degree
-
-
Total
-
-
Family Income in Pinion Pines
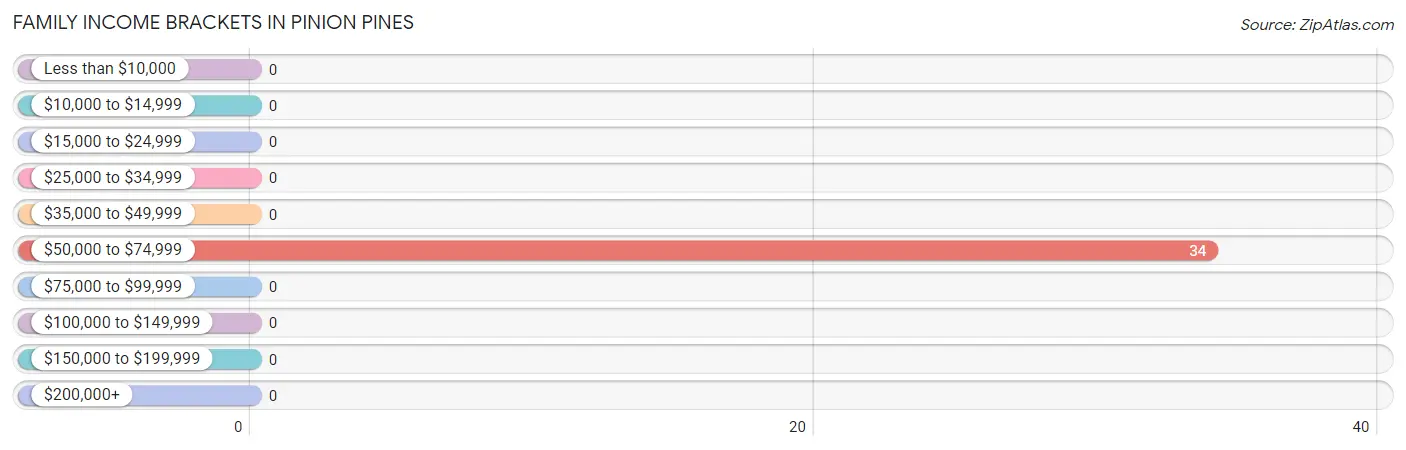
Family Income Brackets in Pinion Pines
According to the Pinion Pines family income data, there are 34 families falling into the $50,000 to $74,999 income range, which is the most common income bracket and makes up 100.0% of all families.
Income Bracket
# Families
% Families
Less than $10,000
0
0.0%
$10,000 to $14,999
0
0.0%
$15,000 to $24,999
0
0.0%
$25,000 to $34,999
0
0.0%
$35,000 to $49,999
0
0.0%
$50,000 to $74,999
34
100.0%
$75,000 to $99,999
0
0.0%
$100,000 to $149,999
0
0.0%
$150,000 to $199,999
0
0.0%
$200,000+
0
0.0%
Family Income by Famaliy Size in Pinion Pines
Income Bracket
# Families
Median Income
2-Person Families
34 (100.0%)
$0
3-Person Families
0 (0.0%)
$0
4-Person Families
0 (0.0%)
$0
5-Person Families
0 (0.0%)
$0
6-Person Families
0 (0.0%)
$0
7+ Person Families
0 (0.0%)
$0
Total
34 (100.0%)
$0
Family Income by Number of Earners in Pinion Pines
Number of Earners
# Families
Median Income
No Earners
34 (100.0%)
$0
1 Earner
0 (0.0%)
$0
2 Earners
0 (0.0%)
$0
3+ Earners
0 (0.0%)
$0
Total
34 (100.0%)
$0
Household Income in Pinion Pines
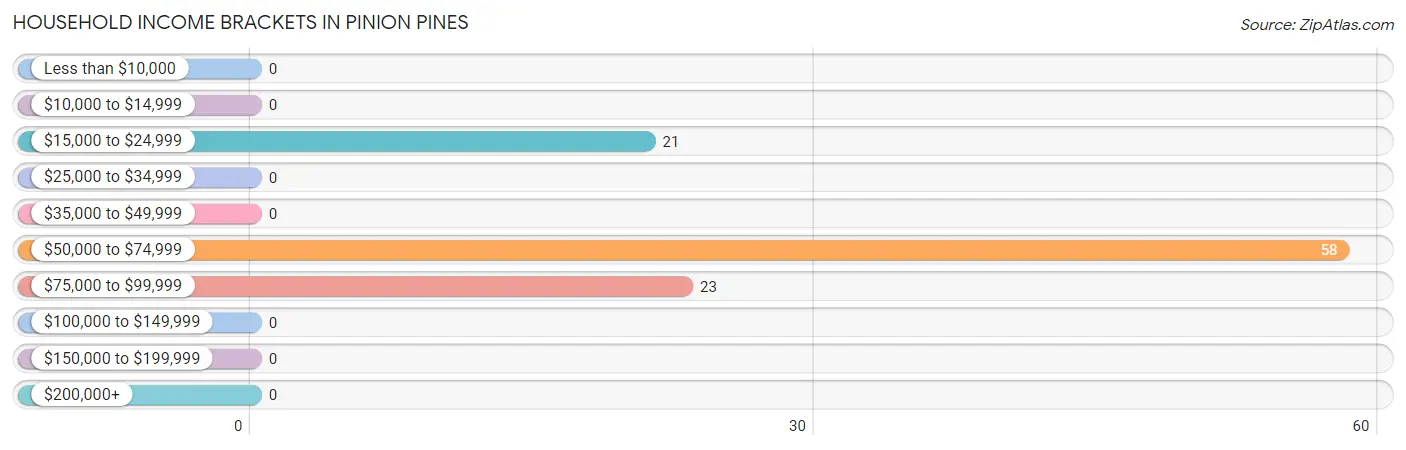
Household Income Brackets in Pinion Pines
With 58 households falling in the category, the $50,000 to $74,999 income range is the most frequent in Pinion Pines, accounting for 56.9% of all households.
Income Bracket
# Households
% Households
Less than $10,000
0
0.0%
$10,000 to $14,999
0
0.0%
$15,000 to $24,999
21
20.6%
$25,000 to $34,999
0
0.0%
$35,000 to $49,999
0
0.0%
$50,000 to $74,999
58
56.9%
$75,000 to $99,999
23
22.5%
$100,000 to $149,999
0
0.0%
$150,000 to $199,999
0
0.0%
$200,000+
0
0.0%
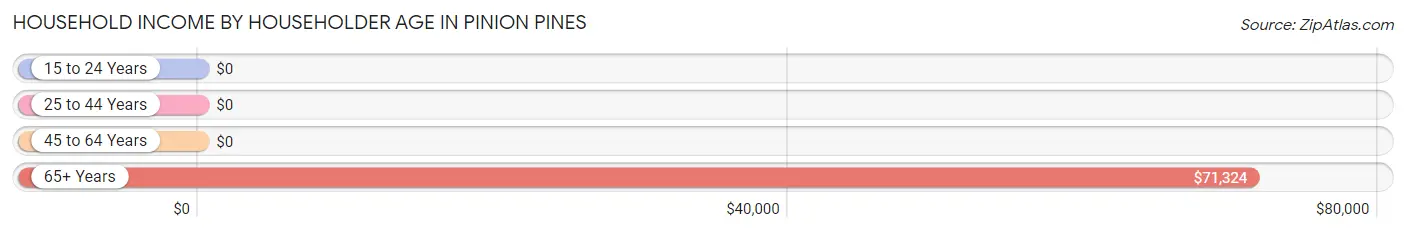
Household Income by Householder Age in Pinion Pines
The median household income in Pinion Pines is $70,441, with the highest median household income of $71,324 found in the 65+ years age bracket for the primary householder. A total of 78 households (76.5%) fall into this category.
Income Bracket
# Households
Median Income
15 to 24 Years
0 (0.0%)
$0
25 to 44 Years
0 (0.0%)
$0
45 to 64 Years
24 (23.5%)
$0
65+ Years
78 (76.5%)
$71,324
Total
102 (100.0%)
$70,441
Poverty in Pinion Pines
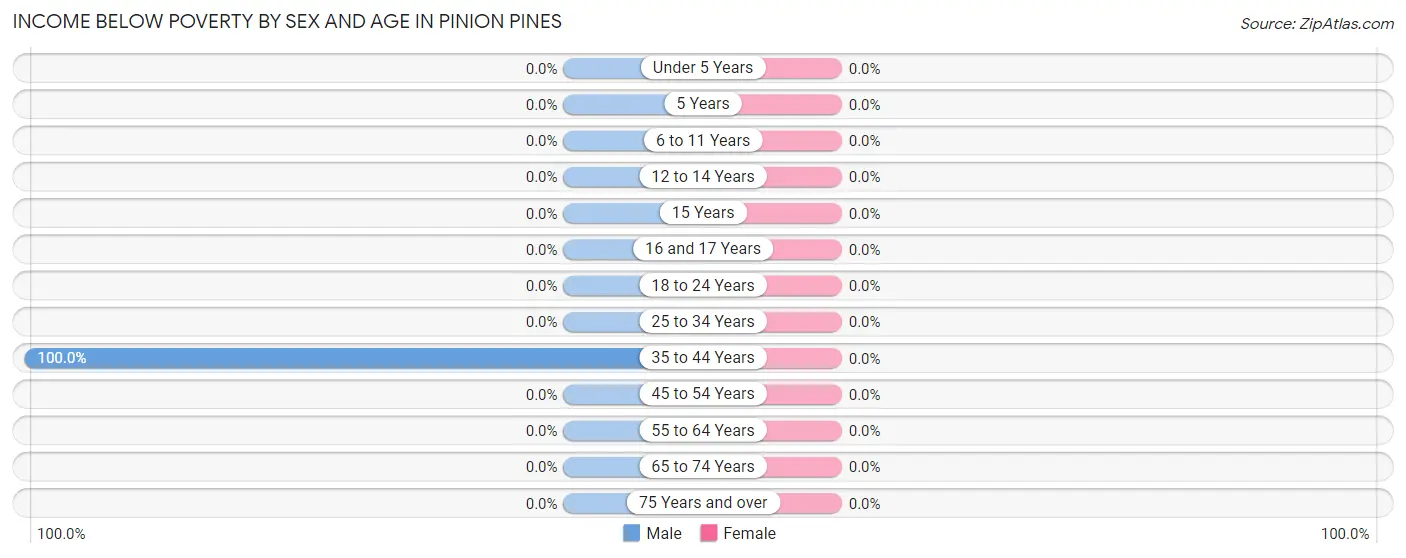
Income Below Poverty by Sex and Age in Pinion Pines
Age Bracket
Male
Female
Under 5 Years
0 (0.0%)
0 (0.0%)
5 Years
0 (0.0%)
0 (0.0%)
6 to 11 Years
0 (0.0%)
0 (0.0%)
12 to 14 Years
0 (0.0%)
0 (0.0%)
15 Years
0 (0.0%)
0 (0.0%)
16 and 17 Years
0 (0.0%)
0 (0.0%)
18 to 24 Years
0 (0.0%)
0 (0.0%)
25 to 34 Years
0 (0.0%)
0 (0.0%)
35 to 44 Years
22 (100.0%)
0 (0.0%)
45 to 54 Years
0 (0.0%)
0 (0.0%)
55 to 64 Years
0 (0.0%)
0 (0.0%)
65 to 74 Years
0 (0.0%)
0 (0.0%)
75 Years and over
0 (0.0%)
0 (0.0%)
Total
22 (21.6%)
0 (0.0%)
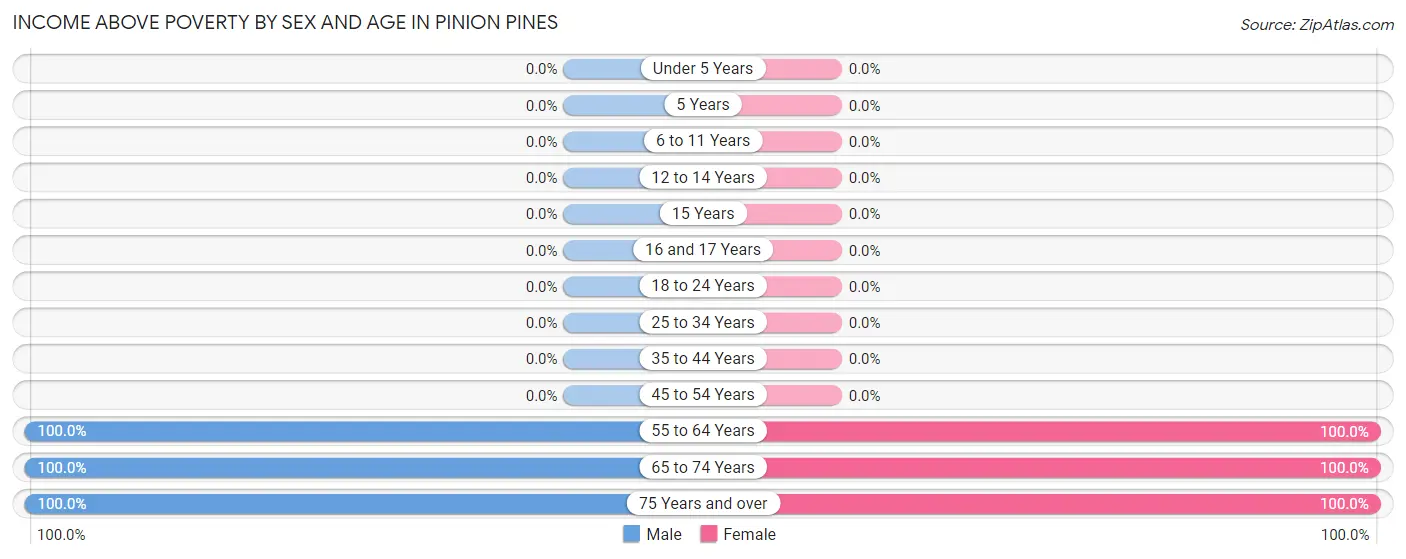
Income Above Poverty by Sex and Age in Pinion Pines
According to the poverty statistics in Pinion Pines, males aged 55 to 64 years and females aged 55 to 64 years are the age groups that are most secure financially, with 100.0% of males and 100.0% of females in these age groups living above the poverty line.
Age Bracket
Male
Female
Under 5 Years
0 (0.0%)
0 (0.0%)
5 Years
0 (0.0%)
0 (0.0%)
6 to 11 Years
0 (0.0%)
0 (0.0%)
12 to 14 Years
0 (0.0%)
0 (0.0%)
15 Years
0 (0.0%)
0 (0.0%)
16 and 17 Years
0 (0.0%)
0 (0.0%)
18 to 24 Years
0 (0.0%)
0 (0.0%)
25 to 34 Years
0 (0.0%)
0 (0.0%)
35 to 44 Years
0 (0.0%)
0 (0.0%)
45 to 54 Years
0 (0.0%)
0 (0.0%)
55 to 64 Years
17 (100.0%)
7 (100.0%)
65 to 74 Years
40 (100.0%)
19 (100.0%)
75 Years and over
23 (100.0%)
55 (100.0%)
Total
80 (78.4%)
81 (100.0%)
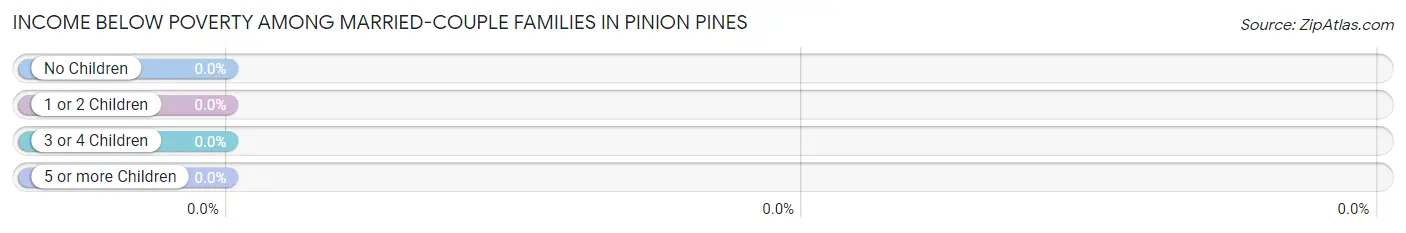
Income Below Poverty Among Married-Couple Families in Pinion Pines
Children
Above Poverty
Below Poverty
No Children
34 (100.0%)
0 (0.0%)
1 or 2 Children
0 (0.0%)
0 (0.0%)
3 or 4 Children
0 (0.0%)
0 (0.0%)
5 or more Children
0 (0.0%)
0 (0.0%)
Total
34 (100.0%)
0 (0.0%)
Income Below Poverty Among Single-Parent Households in Pinion Pines
Children
Single Father
Single Mother
No Children
0 (0.0%)
0 (0.0%)
1 or 2 Children
0 (0.0%)
0 (0.0%)
3 or 4 Children
0 (0.0%)
0 (0.0%)
5 or more Children
0 (0.0%)
0 (0.0%)
Total
0 (0.0%)
0 (0.0%)
Income Below Poverty Among Married-Couple vs Single-Parent Households in Pinion Pines
Children
Married-Couple Families
Single-Parent Households
No Children
0 (0.0%)
0 (0.0%)
1 or 2 Children
0 (0.0%)
0 (0.0%)
3 or 4 Children
0 (0.0%)
0 (0.0%)
5 or more Children
0 (0.0%)
0 (0.0%)
Total
0 (0.0%)
0 (0.0%)
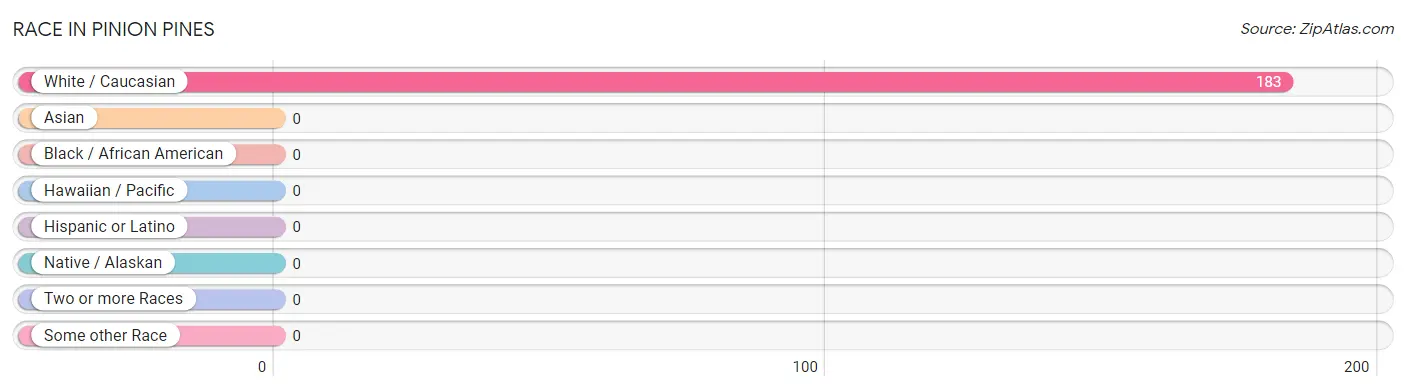
Race in Pinion Pines
The most populous races in Pinion Pines are , and White / Caucasian (183 | 100.0%).
Race
# Population
% Population
Asian
0
0.0%
Black / African American
0
0.0%
Hawaiian / Pacific
0
0.0%
Hispanic or Latino
0
0.0%
Native / Alaskan
0
0.0%
White / Caucasian
183
100.0%
Two or more Races
0
0.0%
Some other Race
0
0.0%
Total
183
100.0%
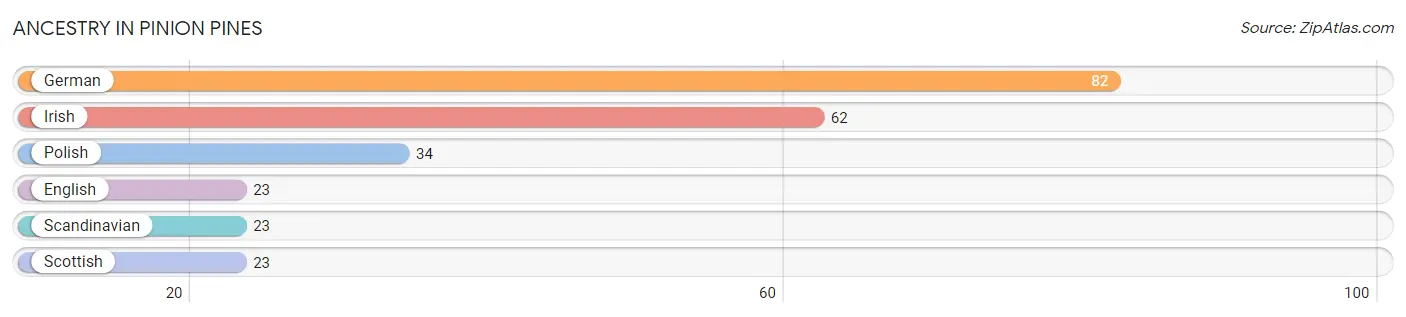
Ancestry in Pinion Pines
The most populous ancestries reported in Pinion Pines are German (82 | 44.8%), Irish (62 | 33.9%), Polish (34 | 18.6%), English (23 | 12.6%), and Scandinavian (23 | 12.6%), together accounting for 122.4% of all Pinion Pines residents.
Ancestry
# Population
% Population
English
23
12.6%
German
82
44.8%
Irish
62
33.9%
Polish
34
18.6%
Scandinavian
23
12.6%
Scottish
23
12.6%
View All 6 Rows
Immigrants in Pinion Pines
Immigration Origin
# Population
% Population
View All 0 Rows
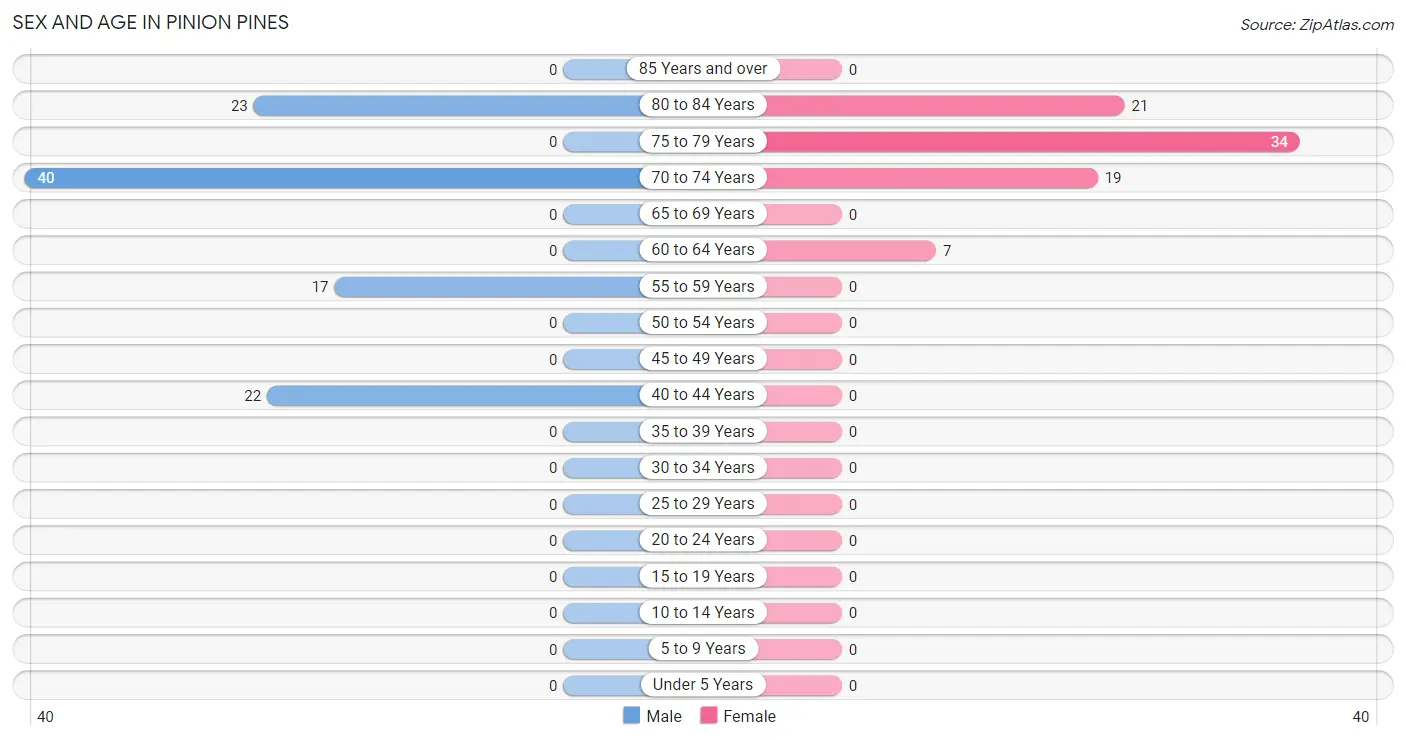
Sex and Age in Pinion Pines
Sex and Age in Pinion Pines
The most populous age groups in Pinion Pines are 70 to 74 Years (40 | 39.2%) for men and 75 to 79 Years (34 | 42.0%) for women.
Age Bracket
Male
Female
Under 5 Years
0 (0.0%)
0 (0.0%)
5 to 9 Years
0 (0.0%)
0 (0.0%)
10 to 14 Years
0 (0.0%)
0 (0.0%)
15 to 19 Years
0 (0.0%)
0 (0.0%)
20 to 24 Years
0 (0.0%)
0 (0.0%)
25 to 29 Years
0 (0.0%)
0 (0.0%)
30 to 34 Years
0 (0.0%)
0 (0.0%)
35 to 39 Years
0 (0.0%)
0 (0.0%)
40 to 44 Years
22 (21.6%)
0 (0.0%)
45 to 49 Years
0 (0.0%)
0 (0.0%)
50 to 54 Years
0 (0.0%)
0 (0.0%)
55 to 59 Years
17 (16.7%)
0 (0.0%)
60 to 64 Years
0 (0.0%)
7 (8.6%)
65 to 69 Years
0 (0.0%)
0 (0.0%)
70 to 74 Years
40 (39.2%)
19 (23.5%)
75 to 79 Years
0 (0.0%)
34 (42.0%)
80 to 84 Years
23 (22.6%)
21 (25.9%)
85 Years and over
0 (0.0%)
0 (0.0%)
Total
102 (100.0%)
81 (100.0%)
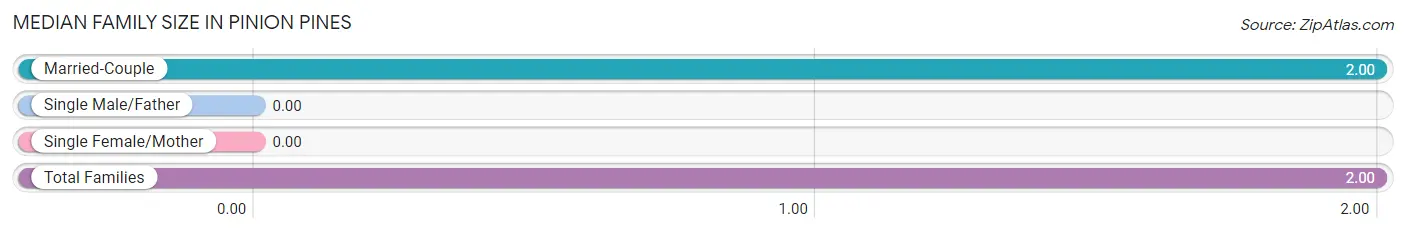
Families and Households in Pinion Pines
Median Family Size in Pinion Pines
Family Type
# Families
Family Size
Married-Couple
34 (100.0%)
2.00
Single Male/Father
0 (0.0%)
-
Single Female/Mother
0 (0.0%)
-
Total Families
34 (100.0%)
2.00
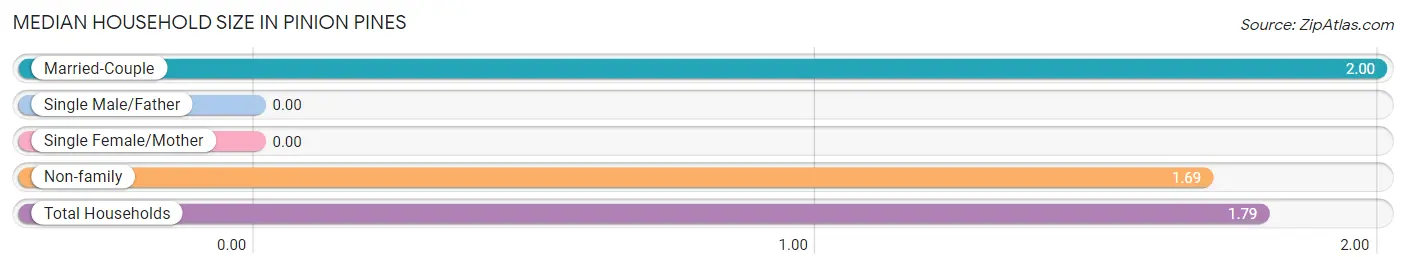
Median Household Size in Pinion Pines
Household Type
# Households
Household Size
Married-Couple
34 (33.3%)
2.00
Single Male/Father
0 (0.0%)
-
Single Female/Mother
0 (0.0%)
-
Non-family
68 (66.7%)
1.69
Total Households
102 (100.0%)
1.79
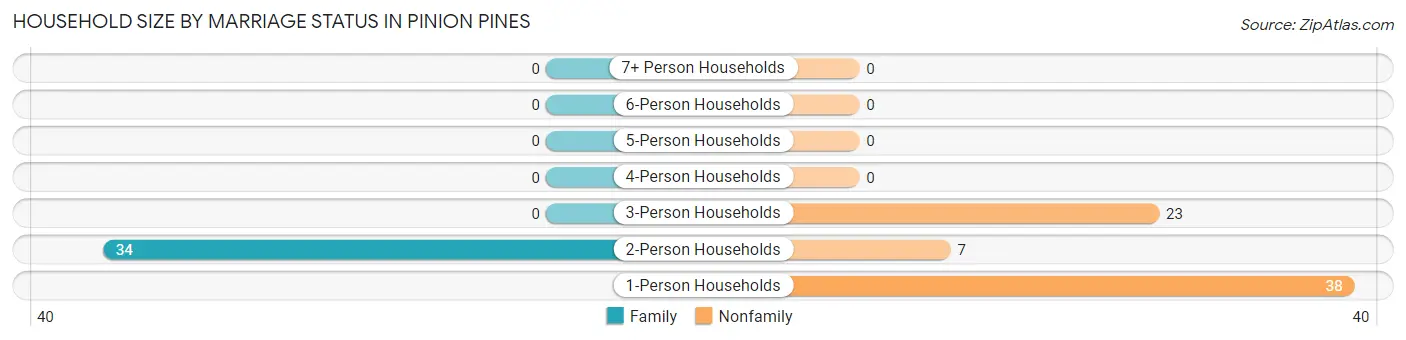
Household Size by Marriage Status in Pinion Pines
Out of a total of 102 households in Pinion Pines, 34 (33.3%) are family households, while 68 (66.7%) are nonfamily households. The most numerous type of family households are 2-person households, comprising 34, and the most common type of nonfamily households are 1-person households, comprising 38.
Household Size
Family Households
Nonfamily Households
1-Person Households
-
38 (37.2%)
2-Person Households
34 (33.3%)
7 (6.9%)
3-Person Households
0 (0.0%)
23 (22.6%)
4-Person Households
0 (0.0%)
0 (0.0%)
5-Person Households
0 (0.0%)
0 (0.0%)
6-Person Households
0 (0.0%)
0 (0.0%)
7+ Person Households
0 (0.0%)
0 (0.0%)
Total
34 (33.3%)
68 (66.7%)
Female Fertility in Pinion Pines
Fertility by Age in Pinion Pines
Age Bracket
Women with Births
Births / 1,000 Women
15 to 19 years
0 (0.0%)
0.0
20 to 34 years
0 (0.0%)
0.0
35 to 50 years
0 (0.0%)
0.0
Total
0 (0.0%)
0.0
Fertility by Age by Marriage Status in Pinion Pines
Age Bracket
Married
Unmarried
15 to 19 years
0 (0.0%)
0 (0.0%)
20 to 34 years
0 (0.0%)
0 (0.0%)
35 to 50 years
0 (0.0%)
0 (0.0%)
Total
0 (0.0%)
0 (0.0%)
Fertility by Education in Pinion Pines
Educational Attainment
Women with Births
Births / 1,000 Women
Less than High School
0 (0.0%)
0.0
High School Diploma
0 (0.0%)
0.0
College or Associate's Degree
0 (0.0%)
0.0
Bachelor's Degree
0 (0.0%)
0.0
Graduate Degree
0 (0.0%)
0.0
Total
0 (0.0%)
0.0
Fertility by Education by Marriage Status in Pinion Pines
Educational Attainment
Married
Unmarried
Less than High School
0 (0.0%)
0 (0.0%)
High School Diploma
0 (0.0%)
0 (0.0%)
College or Associate's Degree
0 (0.0%)
0 (0.0%)
Bachelor's Degree
0 (0.0%)
0 (0.0%)
Graduate Degree
0 (0.0%)
0 (0.0%)
Total
0 (0.0%)
0 (0.0%)
Employment Characteristics in Pinion Pines
Employment by Class of Employer in Pinion Pines
Employer Class
# Employees
% Employees
Private Company Employees
0
0.0%
Self-Employed (Incorporated)
0
0.0%
Self-Employed (Not Incorporated)
0
0.0%
Not-for-profit Organizations
0
0.0%
Local Government Employees
0
0.0%
State Government Employees
0
0.0%
Federal Government Employees
0
0.0%
Unpaid Family Workers
0
0.0%
Total
0
0.0%
Employment Status by Age in Pinion Pines
Age Bracket
In Labor Force
Unemployed
16 to 19 Years
0 (0.0%)
0 (0.0%)
20 to 24 Years
0 (0.0%)
0 (0.0%)
25 to 29 Years
0 (0.0%)
0 (0.0%)
30 to 34 Years
0 (0.0%)
0 (0.0%)
35 to 44 Years
0 (0.0%)
0 (0.0%)
45 to 54 Years
0 (0.0%)
0 (0.0%)
55 to 59 Years
0 (0.0%)
0 (0.0%)
60 to 64 Years
0 (0.0%)
0 (0.0%)
65 to 74 Years
0 (0.0%)
0 (0.0%)
75 Years and over
0 (0.0%)
0 (0.0%)
Total
0 (0.0%)
0 (0.0%)
Employment Status by Educational Attainment in Pinion Pines
Educational Attainment
In Labor Force
Unemployed
Less than High School
0 (0.0%)
0 (0.0%)
High School Diploma
0 (0.0%)
0 (0.0%)
College / Associate Degree
0 (0.0%)
0 (0.0%)
Bachelor's Degree or higher
0 (0.0%)
0 (0.0%)
Total
0 (0.0%)
0 (0.0%)
Employment Occupations by Sex in Pinion Pines
Management, Business, Science and Arts Occupations
Management, Business, Science and Arts Occupations by Sex
Occupation
Male
Female
Management
0 (0.0%)
0 (0.0%)
Business & Financial
0 (0.0%)
0 (0.0%)
Computers, Engineering & Science
0 (0.0%)
0 (0.0%)
Computers & Mathematics
0 (0.0%)
0 (0.0%)
Architecture & Engineering
0 (0.0%)
0 (0.0%)
Life, Physical & Social Science
0 (0.0%)
0 (0.0%)
Community & Social Service
0 (0.0%)
0 (0.0%)
Education, Arts & Media
0 (0.0%)
0 (0.0%)
Legal Services & Support
0 (0.0%)
0 (0.0%)
Education Instruction & Library
0 (0.0%)
0 (0.0%)
Arts, Media & Entertainment
0 (0.0%)
0 (0.0%)
Health Diagnosing & Treating
0 (0.0%)
0 (0.0%)
Health Technologists
0 (0.0%)
0 (0.0%)
Total (Category)
0 (0.0%)
0 (0.0%)
Total (Overall)
0 (0.0%)
0 (0.0%)
Services Occupations
Services Occupations by Sex
Occupation
Male
Female
Healthcare Support
0 (0.0%)
0 (0.0%)
Security & Protection
0 (0.0%)
0 (0.0%)
Firefighting & Prevention
0 (0.0%)
0 (0.0%)
Law Enforcement
0 (0.0%)
0 (0.0%)
Food Preparation & Serving
0 (0.0%)
0 (0.0%)
Cleaning & Maintenance
0 (0.0%)
0 (0.0%)
Personal Care & Service
0 (0.0%)
0 (0.0%)
Total (Category)
0 (0.0%)
0 (0.0%)
Total (Overall)
0 (0.0%)
0 (0.0%)
Sales and Office Occupations
Sales and Office Occupations by Sex
Occupation
Male
Female
Sales & Related
0 (0.0%)
0 (0.0%)
Office & Administration
0 (0.0%)
0 (0.0%)
Total (Category)
0 (0.0%)
0 (0.0%)
Total (Overall)
0 (0.0%)
0 (0.0%)
Natural Resources, Construction and Maintenance Occupations
Natural Resources, Construction and Maintenance Occupations by Sex
Occupation
Male
Female
Farming, Fishing & Forestry
0 (0.0%)
0 (0.0%)
Construction & Extraction
0 (0.0%)
0 (0.0%)
Installation, Maintenance & Repair
0 (0.0%)
0 (0.0%)
Total (Category)
0 (0.0%)
0 (0.0%)
Total (Overall)
0 (0.0%)
0 (0.0%)
Production, Transportation and Moving Occupations
Production, Transportation and Moving Occupations by Sex
Occupation
Male
Female
Production
0 (0.0%)
0 (0.0%)
Transportation
0 (0.0%)
0 (0.0%)
Material Moving
0 (0.0%)
0 (0.0%)
Total (Category)
0 (0.0%)
0 (0.0%)
Total (Overall)
0 (0.0%)
0 (0.0%)
Employment Industries by Sex in Pinion Pines
Employment Industries in Pinion Pines
Employment Industries by Sex in Pinion Pines
Industry
Male
Female
Agriculture, Fishing & Hunting
0 (0.0%)
0 (0.0%)
Mining, Quarrying, & Extraction
0 (0.0%)
0 (0.0%)
Construction
0 (0.0%)
0 (0.0%)
Manufacturing
0 (0.0%)
0 (0.0%)
Wholesale Trade
0 (0.0%)
0 (0.0%)
Retail Trade
0 (0.0%)
0 (0.0%)
Transportation & Warehousing
0 (0.0%)
0 (0.0%)
Utilities
0 (0.0%)
0 (0.0%)
Information
0 (0.0%)
0 (0.0%)
Finance & Insurance
0 (0.0%)
0 (0.0%)
Real Estate, Rental & Leasing
0 (0.0%)
0 (0.0%)
Professional & Scientific
0 (0.0%)
0 (0.0%)
Enterprise Management
0 (0.0%)
0 (0.0%)
Administrative & Support
0 (0.0%)
0 (0.0%)
Educational Services
0 (0.0%)
0 (0.0%)
Health Care & Social Assistance
0 (0.0%)
0 (0.0%)
Arts, Entertainment & Recreation
0 (0.0%)
0 (0.0%)
Accommodation & Food Services
0 (0.0%)
0 (0.0%)
Public Administration
0 (0.0%)
0 (0.0%)
Total
0 (0.0%)
0 (0.0%)
Education in Pinion Pines
School Enrollment in Pinion Pines
School Level
# Students
% Students
Nursery / Preschool
0
0.0%
Kindergarten
0
0.0%
Elementary School
0
0.0%
Middle School
0
0.0%
High School
0
0.0%
College / Undergraduate
0
0.0%
Graduate / Professional
0
0.0%
Total
0
0.0%
School Enrollment by Age by Funding Source in Pinion Pines
Age Bracket
Public School
Private School
3 to 4 Year Olds
0 (0.0%)
0 (0.0%)
5 to 9 Year Old
0 (0.0%)
0 (0.0%)
10 to 14 Year Olds
0 (0.0%)
0 (0.0%)
15 to 17 Year Olds
0 (0.0%)
0 (0.0%)
18 to 19 Year Olds
0 (0.0%)
0 (0.0%)
20 to 24 Year Olds
0 (0.0%)
0 (0.0%)
25 to 34 Year Olds
0 (0.0%)
0 (0.0%)
35 Years and over
0 (0.0%)
0 (0.0%)
Total
0 (0.0%)
0 (0.0%)
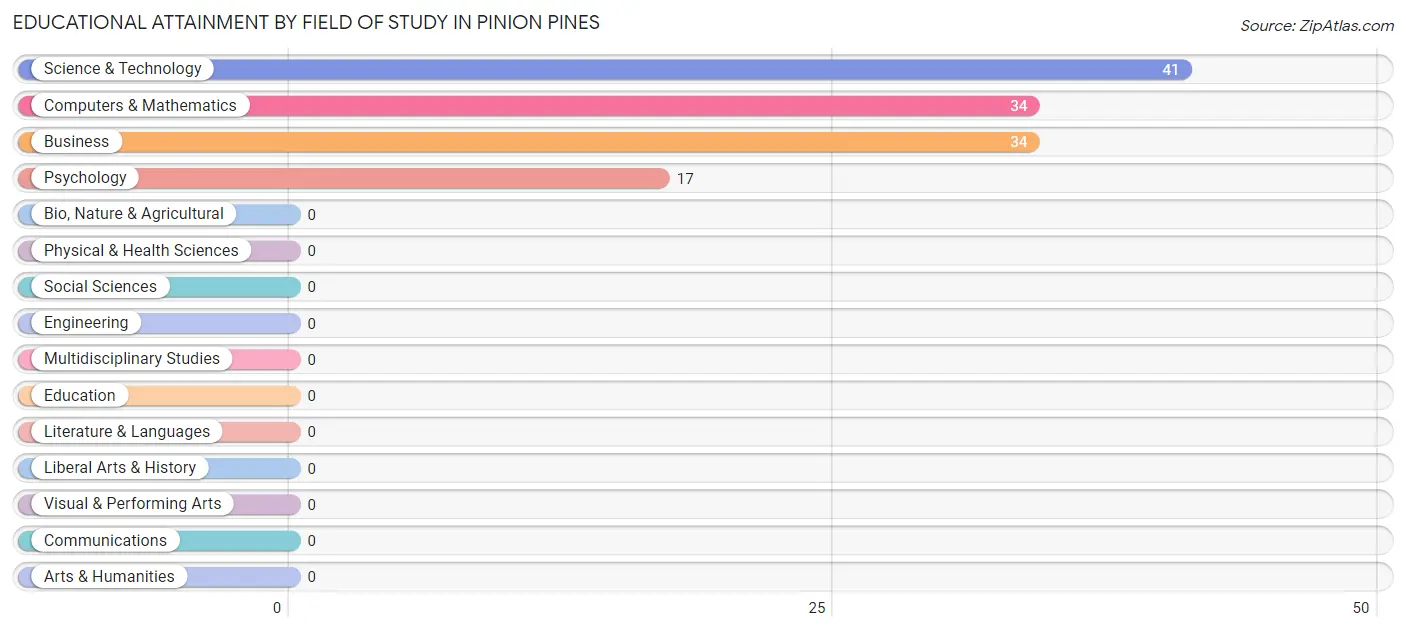
Educational Attainment by Field of Study in Pinion Pines
Science & technology (41 | 32.5%), computers & mathematics (34 | 27.0%), business (34 | 27.0%), and psychology (17 | 13.5%) are the most common fields of study among 126 individuals in Pinion Pines who have obtained a bachelor's degree or higher.
Field of Study
# Graduates
% Graduates
Computers & Mathematics
34
27.0%
Bio, Nature & Agricultural
0
0.0%
Physical & Health Sciences
0
0.0%
Psychology
17
13.5%
Social Sciences
0
0.0%
Engineering
0
0.0%
Multidisciplinary Studies
0
0.0%
Science & Technology
41
32.5%
Business
34
27.0%
Education
0
0.0%
Literature & Languages
0
0.0%
Liberal Arts & History
0
0.0%
Visual & Performing Arts
0
0.0%
Communications
0
0.0%
Arts & Humanities
0
0.0%
Total
126
100.0%
Transportation & Commute in Pinion Pines
Vehicle Availability by Sex in Pinion Pines
Vehicles Available
Male
Female
No Vehicle
0 (0.0%)
0 (0.0%)
1 Vehicle
0 (0.0%)
0 (0.0%)
2 Vehicles
0 (0.0%)
0 (0.0%)
3 Vehicles
0 (0.0%)
0 (0.0%)
4 Vehicles
0 (0.0%)
0 (0.0%)
5 or more Vehicles
0 (0.0%)
0 (0.0%)
Total
0 (0.0%)
0 (0.0%)
Commute Time in Pinion Pines
Commute Time
# Commuters
% Commuters
Less than 5 Minutes
0
0.0%
5 to 9 Minutes
0
0.0%
10 to 14 Minutes
0
0.0%
15 to 19 Minutes
0
0.0%
20 to 24 Minutes
0
0.0%
25 to 29 Minutes
0
0.0%
30 to 34 Minutes
0
0.0%
35 to 39 Minutes
0
0.0%
40 to 44 Minutes
0
0.0%
45 to 59 Minutes
0
0.0%
60 to 89 Minutes
0
0.0%
90 or more Minutes
0
0.0%
Commute Time by Sex in Pinion Pines
Commute Time
Male
Female
Less than 5 Minutes
0 (0.0%)
0 (0.0%)
5 to 9 Minutes
0 (0.0%)
0 (0.0%)
10 to 14 Minutes
0 (0.0%)
0 (0.0%)
15 to 19 Minutes
0 (0.0%)
0 (0.0%)
20 to 24 Minutes
0 (0.0%)
0 (0.0%)
25 to 29 Minutes
0 (0.0%)
0 (0.0%)
30 to 34 Minutes
0 (0.0%)
0 (0.0%)
35 to 39 Minutes
0 (0.0%)
0 (0.0%)
40 to 44 Minutes
0 (0.0%)
0 (0.0%)
45 to 59 Minutes
0 (0.0%)
0 (0.0%)
60 to 89 Minutes
0 (0.0%)
0 (0.0%)
90 or more Minutes
0 (0.0%)
0 (0.0%)
Time of Departure to Work by Sex in Pinion Pines
Time of Departure
Male
Female
12:00 AM to 4:59 AM
0 (0.0%)
0 (0.0%)
5:00 AM to 5:29 AM
0 (0.0%)
0 (0.0%)
5:30 AM to 5:59 AM
0 (0.0%)
0 (0.0%)
6:00 AM to 6:29 AM
0 (0.0%)
0 (0.0%)
6:30 AM to 6:59 AM
0 (0.0%)
0 (0.0%)
7:00 AM to 7:29 AM
0 (0.0%)
0 (0.0%)
7:30 AM to 7:59 AM
0 (0.0%)
0 (0.0%)
8:00 AM to 8:29 AM
0 (0.0%)
0 (0.0%)
8:30 AM to 8:59 AM
0 (0.0%)
0 (0.0%)
9:00 AM to 9:59 AM
0 (0.0%)
0 (0.0%)
10:00 AM to 10:59 AM
0 (0.0%)
0 (0.0%)
11:00 AM to 11:59 AM
0 (0.0%)
0 (0.0%)
12:00 PM to 3:59 PM
0 (0.0%)
0 (0.0%)
4:00 PM to 11:59 PM
0 (0.0%)
0 (0.0%)
Total
0 (0.0%)
0 (0.0%)
Housing Occupancy in Pinion Pines
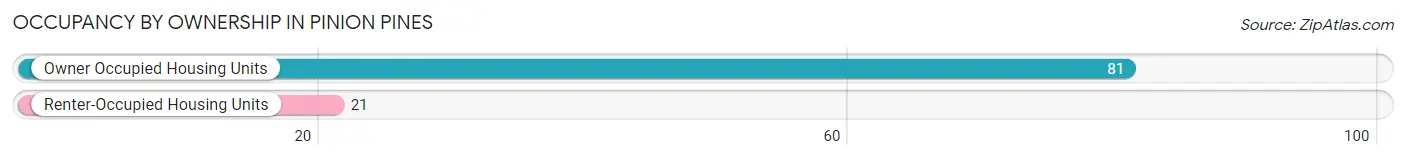
Occupancy by Ownership in Pinion Pines
Of the total 102 dwellings in Pinion Pines, owner-occupied units account for 81 (79.4%), while renter-occupied units make up 21 (20.6%).
Occupancy
# Housing Units
% Housing Units
Owner Occupied Housing Units
81
79.4%
Renter-Occupied Housing Units
21
20.6%
Total Occupied Housing Units
102
100.0%
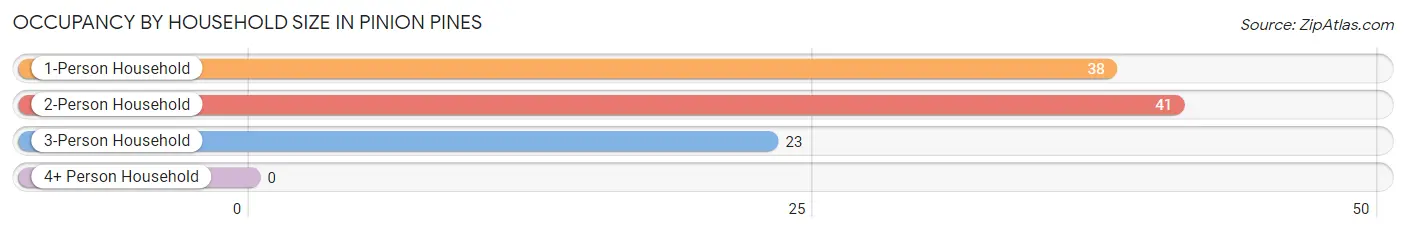
Occupancy by Household Size in Pinion Pines
Household Size
# Housing Units
% Housing Units
1-Person Household
38
37.2%
2-Person Household
41
40.2%
3-Person Household
23
22.6%
4+ Person Household
0
0.0%
Total Housing Units
102
100.0%
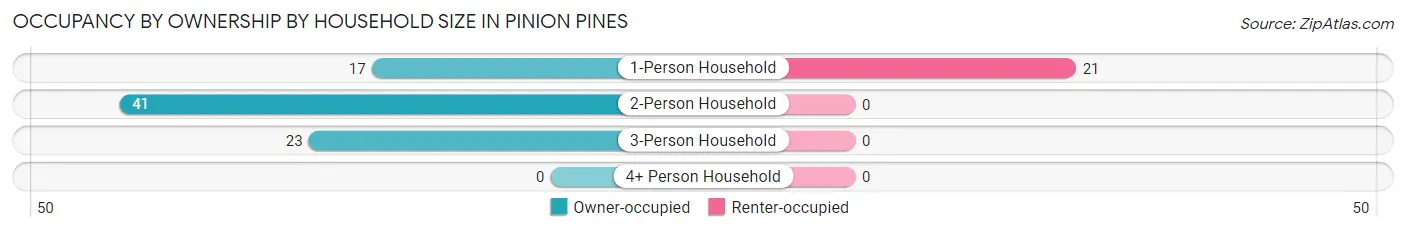
Occupancy by Ownership by Household Size in Pinion Pines
Household Size
Owner-occupied
Renter-occupied
1-Person Household
17 (44.7%)
21 (55.3%)
2-Person Household
41 (100.0%)
0 (0.0%)
3-Person Household
23 (100.0%)
0 (0.0%)
4+ Person Household
0 (0.0%)
0 (0.0%)
Total Housing Units
81 (79.4%)
21 (20.6%)
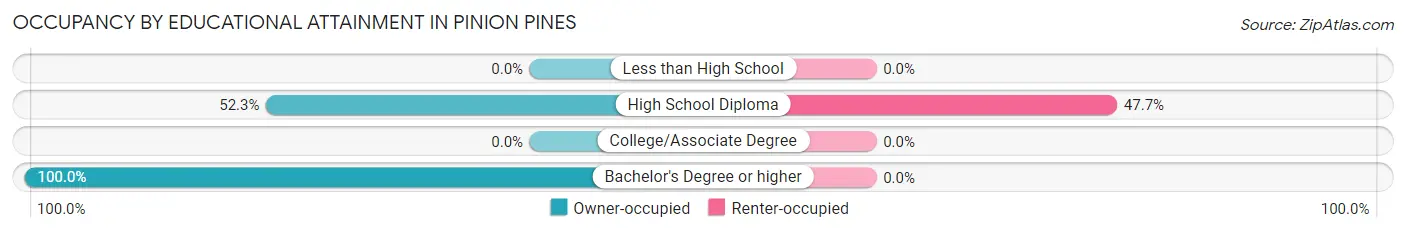
Occupancy by Educational Attainment in Pinion Pines
Household Size
Owner-occupied
Renter-occupied
Less than High School
0 (0.0%)
0 (0.0%)
High School Diploma
23 (52.3%)
21 (47.7%)
College/Associate Degree
0 (0.0%)
0 (0.0%)
Bachelor's Degree or higher
58 (100.0%)
0 (0.0%)
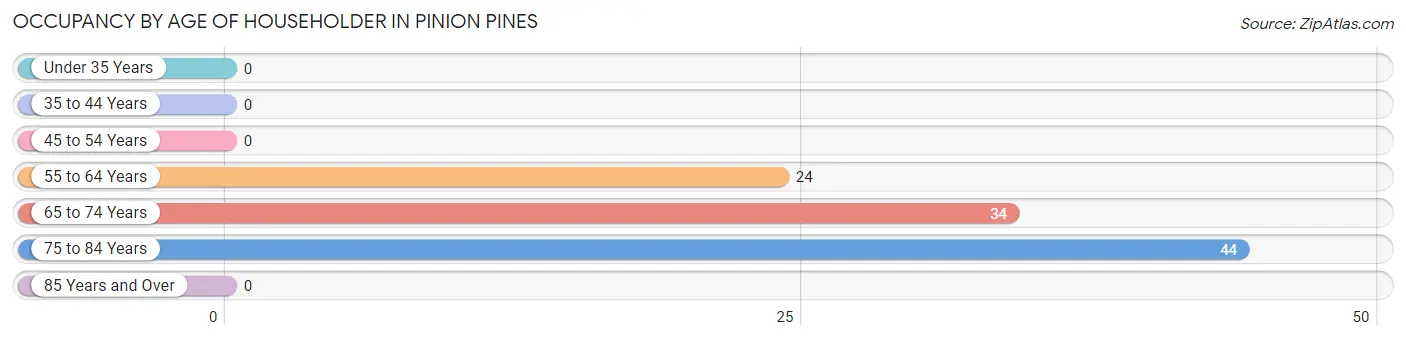
Occupancy by Age of Householder in Pinion Pines
Age Bracket
# Households
% Households
Under 35 Years
0
0.0%
35 to 44 Years
0
0.0%
45 to 54 Years
0
0.0%
55 to 64 Years
24
23.5%
65 to 74 Years
34
33.3%
75 to 84 Years
44
43.1%
85 Years and Over
0
0.0%
Total
102
100.0%
Housing Finances in Pinion Pines
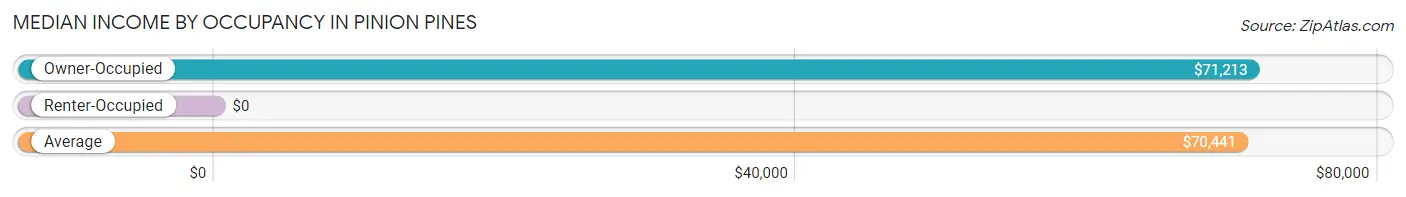
Median Income by Occupancy in Pinion Pines
Occupancy Type
# Households
Median Income
Owner-Occupied
81 (79.4%)
$71,213
Renter-Occupied
21 (20.6%)
$0
Average
102 (100.0%)
$70,441
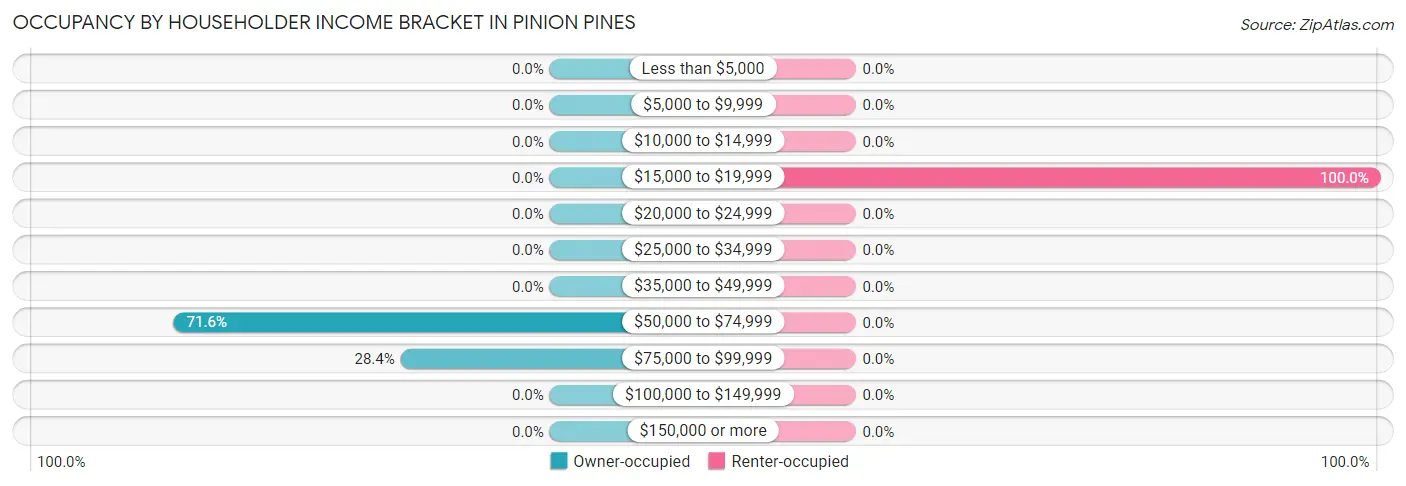
Occupancy by Householder Income Bracket in Pinion Pines
Income Bracket
Owner-occupied
Renter-occupied
Less than $5,000
0 (0.0%)
0 (0.0%)
$5,000 to $9,999
0 (0.0%)
0 (0.0%)
$10,000 to $14,999
0 (0.0%)
0 (0.0%)
$15,000 to $19,999
0 (0.0%)
21 (100.0%)
$20,000 to $24,999
0 (0.0%)
0 (0.0%)
$25,000 to $34,999
0 (0.0%)
0 (0.0%)
$35,000 to $49,999
0 (0.0%)
0 (0.0%)
$50,000 to $74,999
58 (71.6%)
0 (0.0%)
$75,000 to $99,999
23 (28.4%)
0 (0.0%)
$100,000 to $149,999
0 (0.0%)
0 (0.0%)
$150,000 or more
0 (0.0%)
0 (0.0%)
Total
81 (100.0%)
21 (100.0%)
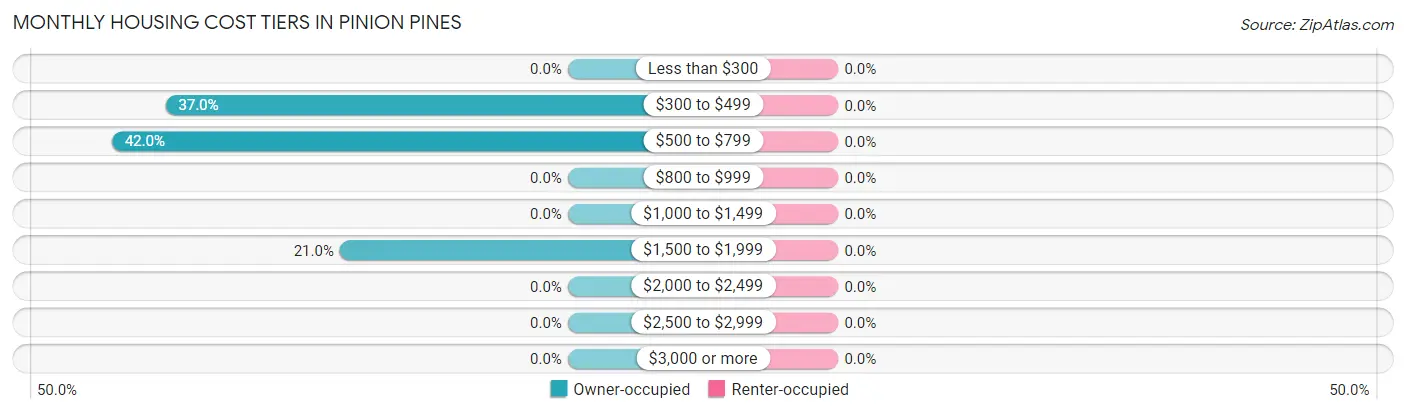
Monthly Housing Cost Tiers in Pinion Pines
Monthly Cost
Owner-occupied
Renter-occupied
Less than $300
0 (0.0%)
0 (0.0%)
$300 to $499
30 (37.0%)
0 (0.0%)
$500 to $799
34 (42.0%)
0 (0.0%)
$800 to $999
0 (0.0%)
0 (0.0%)
$1,000 to $1,499
0 (0.0%)
0 (0.0%)
$1,500 to $1,999
17 (21.0%)
0 (0.0%)
$2,000 to $2,499
0 (0.0%)
0 (0.0%)
$2,500 to $2,999
0 (0.0%)
0 (0.0%)
$3,000 or more
0 (0.0%)
0 (0.0%)
Total
81 (100.0%)
21 (100.0%)
Physical Housing Characteristics in Pinion Pines
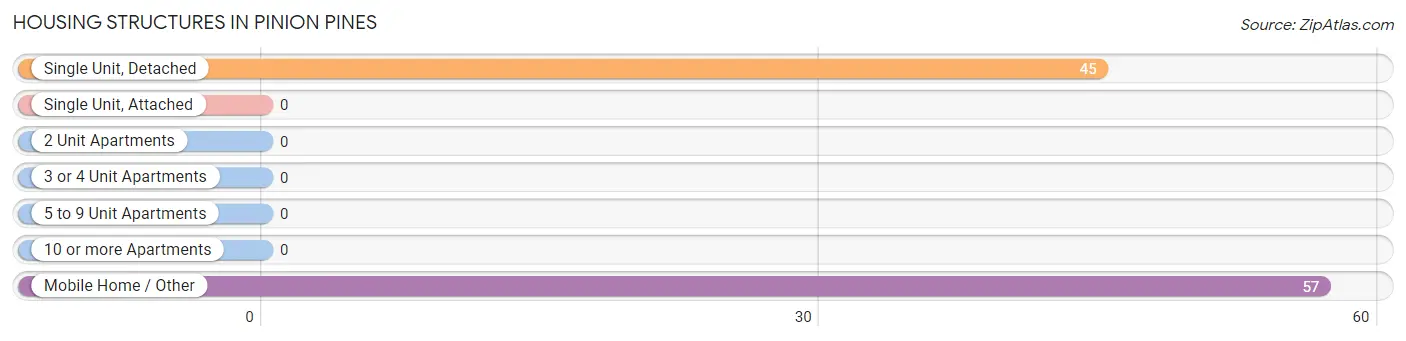
Housing Structures in Pinion Pines
Structure Type
# Housing Units
% Housing Units
Single Unit, Detached
45
44.1%
Single Unit, Attached
0
0.0%
2 Unit Apartments
0
0.0%
3 or 4 Unit Apartments
0
0.0%
5 to 9 Unit Apartments
0
0.0%
10 or more Apartments
0
0.0%
Mobile Home / Other
57
55.9%
Total
102
100.0%
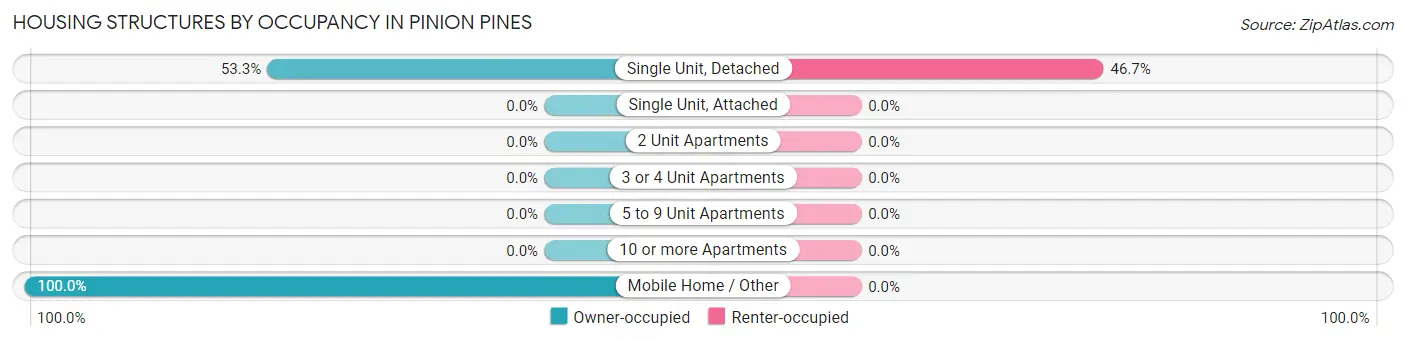
Housing Structures by Occupancy in Pinion Pines
Structure Type
Owner-occupied
Renter-occupied
Single Unit, Detached
24 (53.3%)
21 (46.7%)
Single Unit, Attached
0 (0.0%)
0 (0.0%)
2 Unit Apartments
0 (0.0%)
0 (0.0%)
3 or 4 Unit Apartments
0 (0.0%)
0 (0.0%)
5 to 9 Unit Apartments
0 (0.0%)
0 (0.0%)
10 or more Apartments
0 (0.0%)
0 (0.0%)
Mobile Home / Other
57 (100.0%)
0 (0.0%)
Total
81 (79.4%)
21 (20.6%)
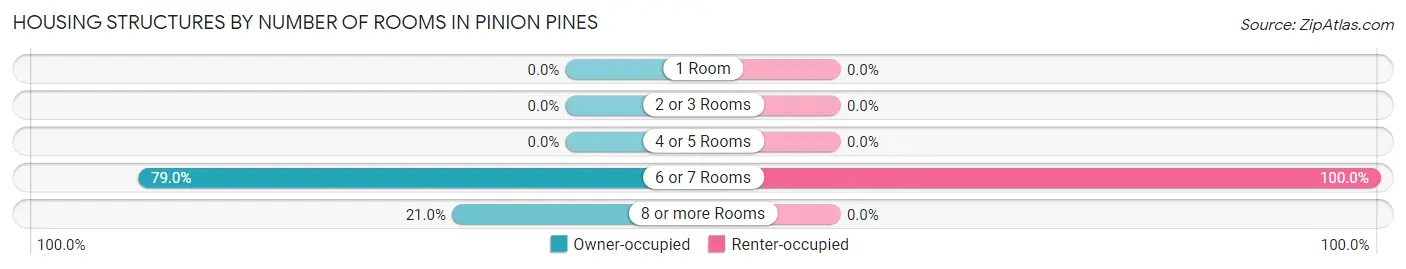
Housing Structures by Number of Rooms in Pinion Pines
Number of Rooms
Owner-occupied
Renter-occupied
1 Room
0 (0.0%)
0 (0.0%)
2 or 3 Rooms
0 (0.0%)
0 (0.0%)
4 or 5 Rooms
0 (0.0%)
0 (0.0%)
6 or 7 Rooms
64 (79.0%)
21 (100.0%)
8 or more Rooms
17 (21.0%)
0 (0.0%)
Total
81 (100.0%)
21 (100.0%)
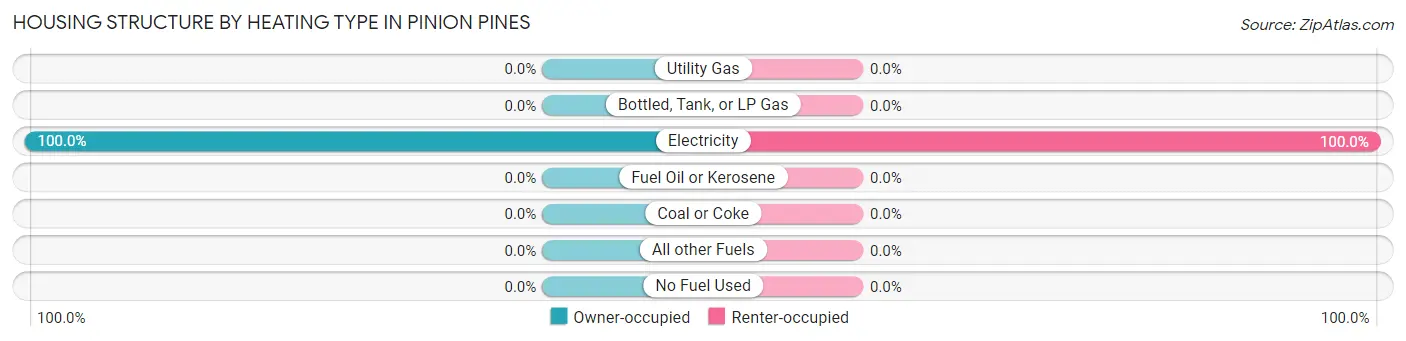
Housing Structure by Heating Type in Pinion Pines
Heating Type
Owner-occupied
Renter-occupied
Utility Gas
0 (0.0%)
0 (0.0%)
Bottled, Tank, or LP Gas
0 (0.0%)
0 (0.0%)
Electricity
81 (100.0%)
21 (100.0%)
Fuel Oil or Kerosene
0 (0.0%)
0 (0.0%)
Coal or Coke
0 (0.0%)
0 (0.0%)
All other Fuels
0 (0.0%)
0 (0.0%)
No Fuel Used
0 (0.0%)
0 (0.0%)
Total
81 (100.0%)
21 (100.0%)
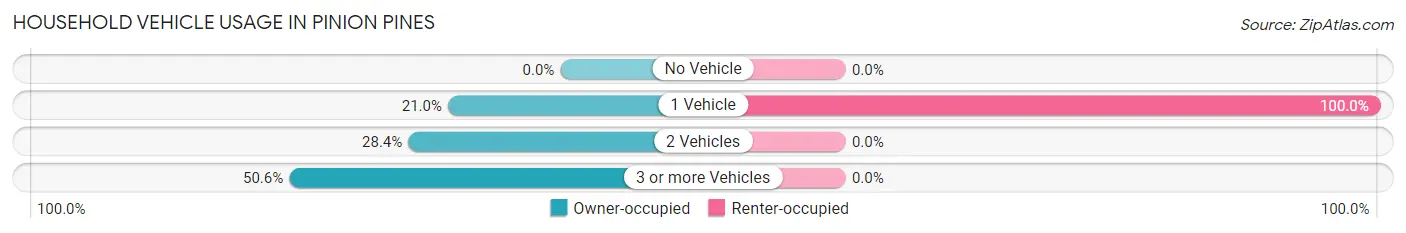
Household Vehicle Usage in Pinion Pines
Vehicles per Household
Owner-occupied
Renter-occupied
No Vehicle
0 (0.0%)
0 (0.0%)
1 Vehicle
17 (21.0%)
21 (100.0%)
2 Vehicles
23 (28.4%)
0 (0.0%)
3 or more Vehicles
41 (50.6%)
0 (0.0%)
Total
81 (100.0%)
21 (100.0%)
Real Estate & Mortgages in Pinion Pines
Real Estate and Mortgage Overview in Pinion Pines
Characteristic
Without Mortgage
With Mortgage
Housing Units
64
17
Median Property Value
$252,900
$0
Median Household Income
$71,838
$0
Monthly Housing Costs
$506
$0
Real Estate Taxes
-
-
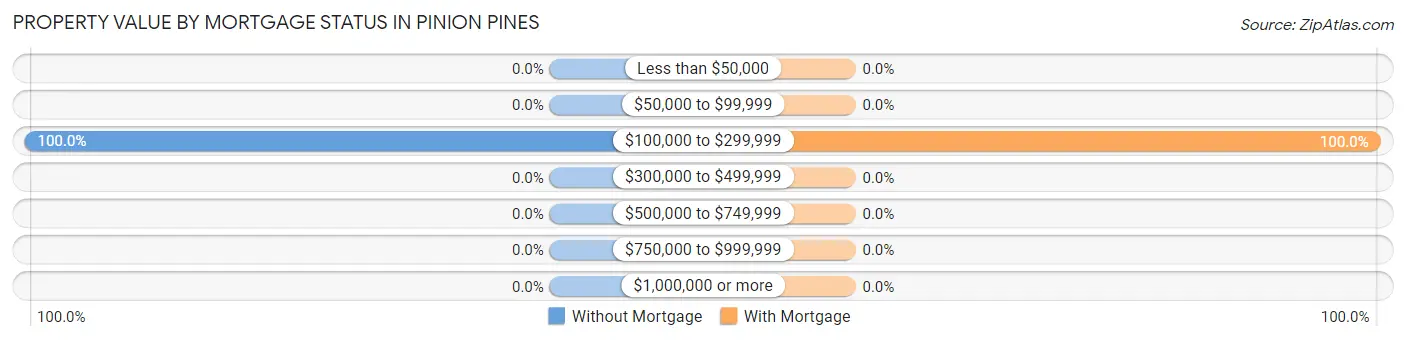
Property Value by Mortgage Status in Pinion Pines
Property Value
Without Mortgage
With Mortgage
Less than $50,000
0 (0.0%)
0 (0.0%)
$50,000 to $99,999
0 (0.0%)
0 (0.0%)
$100,000 to $299,999
64 (100.0%)
17 (100.0%)
$300,000 to $499,999
0 (0.0%)
0 (0.0%)
$500,000 to $749,999
0 (0.0%)
0 (0.0%)
$750,000 to $999,999
0 (0.0%)
0 (0.0%)
$1,000,000 or more
0 (0.0%)
0 (0.0%)
Total
64 (100.0%)
17 (100.0%)
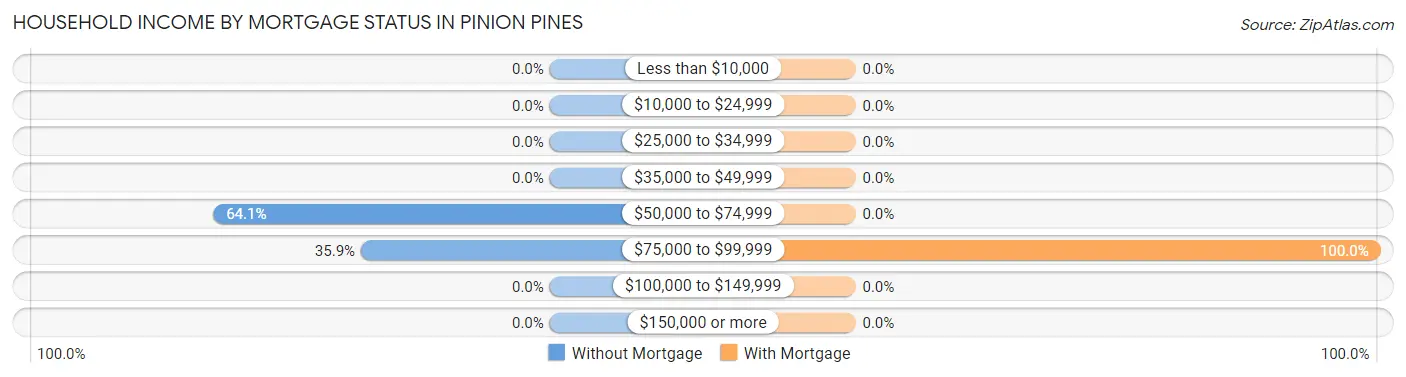
Household Income by Mortgage Status in Pinion Pines
Household Income
Without Mortgage
With Mortgage
Less than $10,000
0 (0.0%)
0 (0.0%)
$10,000 to $24,999
0 (0.0%)
0 (0.0%)
$25,000 to $34,999
0 (0.0%)
0 (0.0%)
$35,000 to $49,999
0 (0.0%)
0 (0.0%)
$50,000 to $74,999
41 (64.1%)
0 (0.0%)
$75,000 to $99,999
23 (35.9%)
17 (100.0%)
$100,000 to $149,999
0 (0.0%)
0 (0.0%)
$150,000 or more
0 (0.0%)
0 (0.0%)
Total
64 (100.0%)
17 (100.0%)
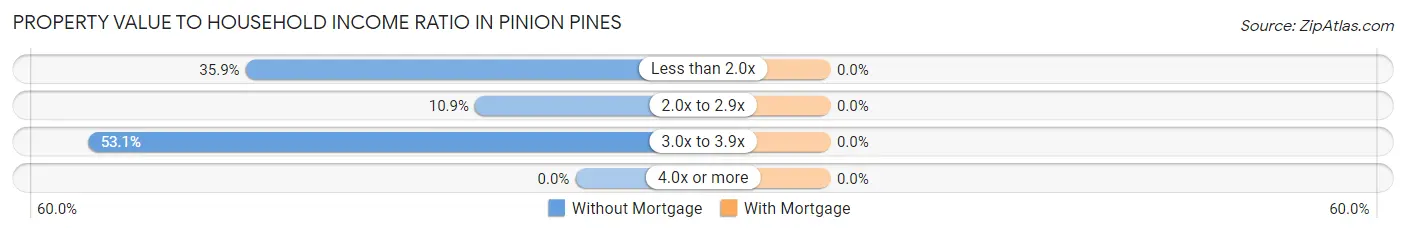
Property Value to Household Income Ratio in Pinion Pines
Value-to-Income Ratio
Without Mortgage
With Mortgage
Less than 2.0x
23 (35.9%)
0 (0.0%)
2.0x to 2.9x
7 (10.9%)
0 (0.0%)
3.0x to 3.9x
34 (53.1%)
0 (0.0%)
4.0x or more
0 (0.0%)
0 (0.0%)
Total
64 (100.0%)
17 (100.0%)
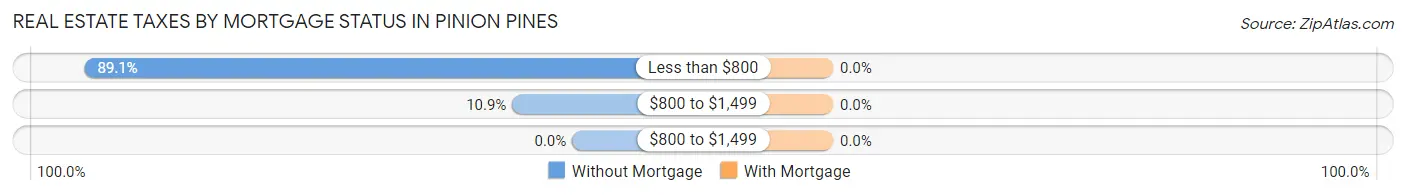
Real Estate Taxes by Mortgage Status in Pinion Pines
Property Taxes
Without Mortgage
With Mortgage
Less than $800
57 (89.1%)
0 (0.0%)
$800 to $1,499
7 (10.9%)
0 (0.0%)
$800 to $1,499
0 (0.0%)
0 (0.0%)
Total
64 (100.0%)
17 (100.0%)
Health & Disability in Pinion Pines
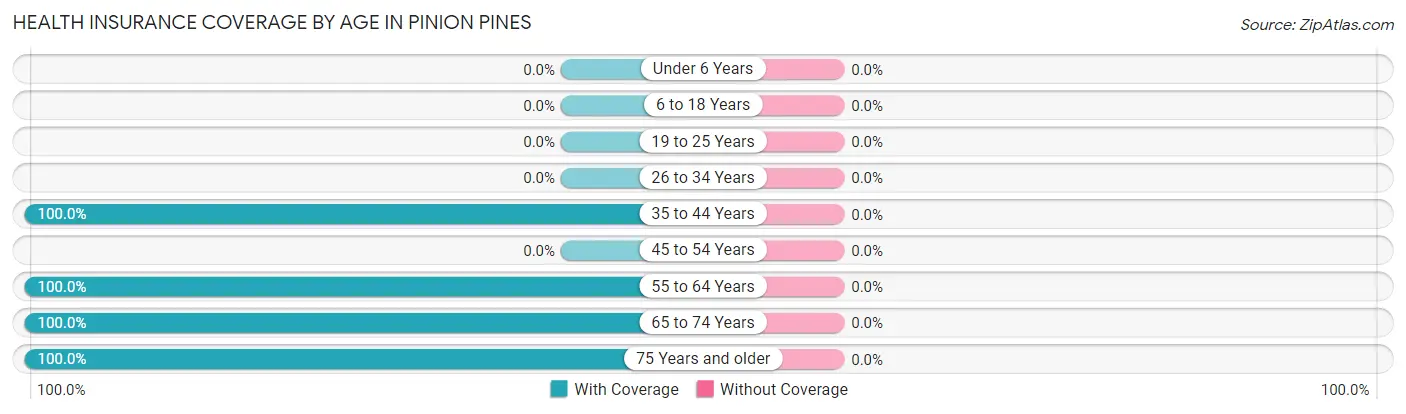
Health Insurance Coverage by Age in Pinion Pines
Age Bracket
With Coverage
Without Coverage
Under 6 Years
0 (0.0%)
0 (0.0%)
6 to 18 Years
0 (0.0%)
0 (0.0%)
19 to 25 Years
0 (0.0%)
0 (0.0%)
26 to 34 Years
0 (0.0%)
0 (0.0%)
35 to 44 Years
22 (100.0%)
0 (0.0%)
45 to 54 Years
0 (0.0%)
0 (0.0%)
55 to 64 Years
24 (100.0%)
0 (0.0%)
65 to 74 Years
59 (100.0%)
0 (0.0%)
75 Years and older
78 (100.0%)
0 (0.0%)
Total
183 (100.0%)
0 (0.0%)
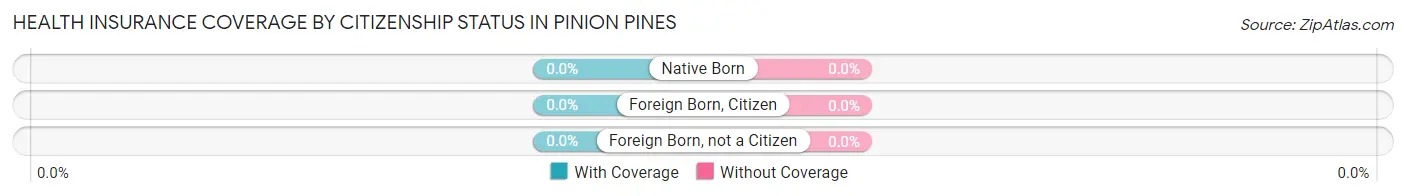
Health Insurance Coverage by Citizenship Status in Pinion Pines
Citizenship Status
With Coverage
Without Coverage
Native Born
0 (0.0%)
0 (0.0%)
Foreign Born, Citizen
0 (0.0%)
0 (0.0%)
Foreign Born, not a Citizen
0 (0.0%)
0 (0.0%)
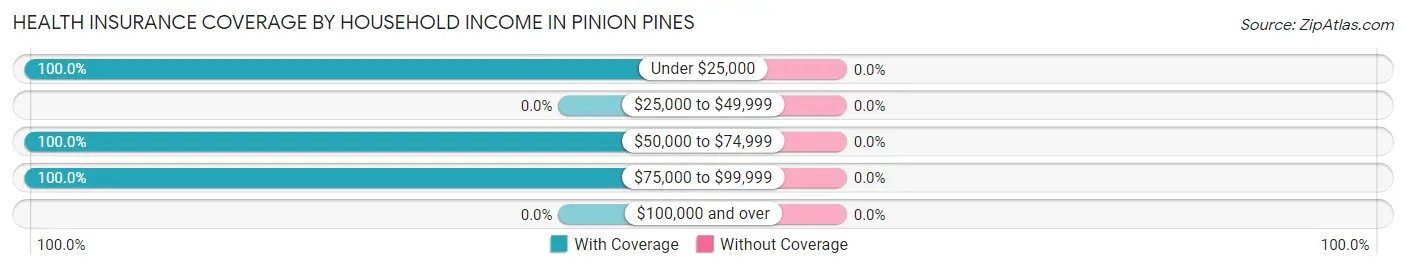
Health Insurance Coverage by Household Income in Pinion Pines
Household Income
With Coverage
Without Coverage
Under $25,000
21 (100.0%)
0 (0.0%)
$25,000 to $49,999
0 (0.0%)
0 (0.0%)
$50,000 to $74,999
98 (100.0%)
0 (0.0%)
$75,000 to $99,999
64 (100.0%)
0 (0.0%)
$100,000 and over
0 (0.0%)
0 (0.0%)
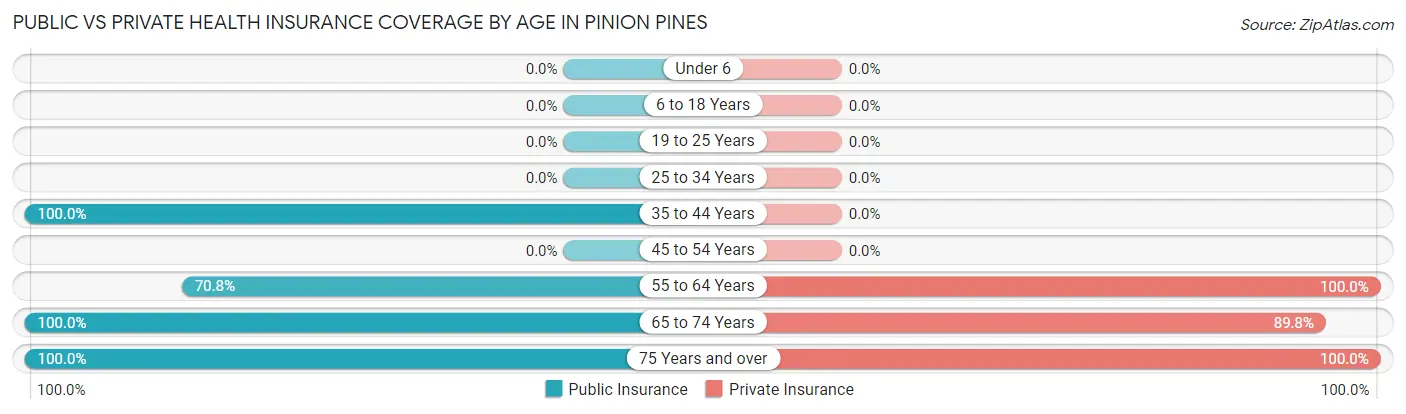
Public vs Private Health Insurance Coverage by Age in Pinion Pines
Age Bracket
Public Insurance
Private Insurance
Under 6
0 (0.0%)
0 (0.0%)
6 to 18 Years
0 (0.0%)
0 (0.0%)
19 to 25 Years
0 (0.0%)
0 (0.0%)
25 to 34 Years
0 (0.0%)
0 (0.0%)
35 to 44 Years
22 (100.0%)
0 (0.0%)
45 to 54 Years
0 (0.0%)
0 (0.0%)
55 to 64 Years
17 (70.8%)
24 (100.0%)
65 to 74 Years
59 (100.0%)
53 (89.8%)
75 Years and over
78 (100.0%)
78 (100.0%)
Total
176 (96.2%)
155 (84.7%)
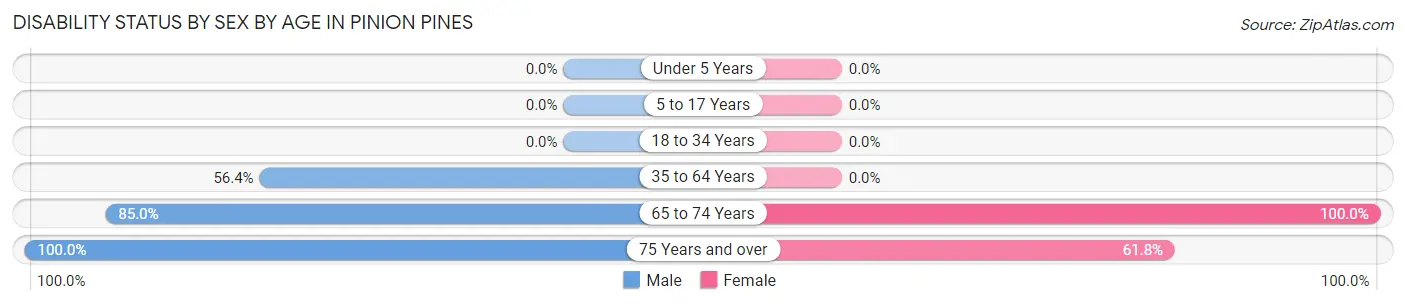
Disability Status by Sex by Age in Pinion Pines
Age Bracket
Male
Female
Under 5 Years
0 (0.0%)
0 (0.0%)
5 to 17 Years
0 (0.0%)
0 (0.0%)
18 to 34 Years
0 (0.0%)
0 (0.0%)
35 to 64 Years
22 (56.4%)
0 (0.0%)
65 to 74 Years
34 (85.0%)
19 (100.0%)
75 Years and over
23 (100.0%)
34 (61.8%)
Disability Class by Sex by Age in Pinion Pines
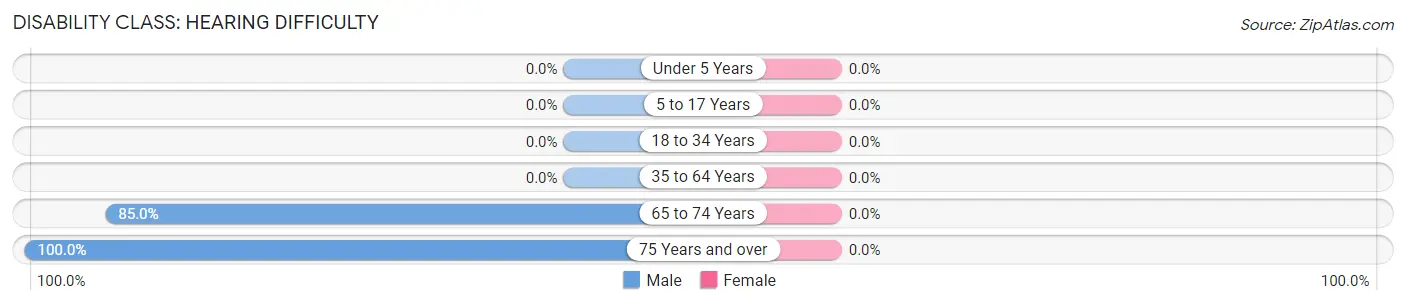
Disability Class: Hearing Difficulty
Age Bracket
Male
Female
Under 5 Years
0 (0.0%)
0 (0.0%)
5 to 17 Years
0 (0.0%)
0 (0.0%)
18 to 34 Years
0 (0.0%)
0 (0.0%)
35 to 64 Years
0 (0.0%)
0 (0.0%)
65 to 74 Years
34 (85.0%)
0 (0.0%)
75 Years and over
23 (100.0%)
0 (0.0%)
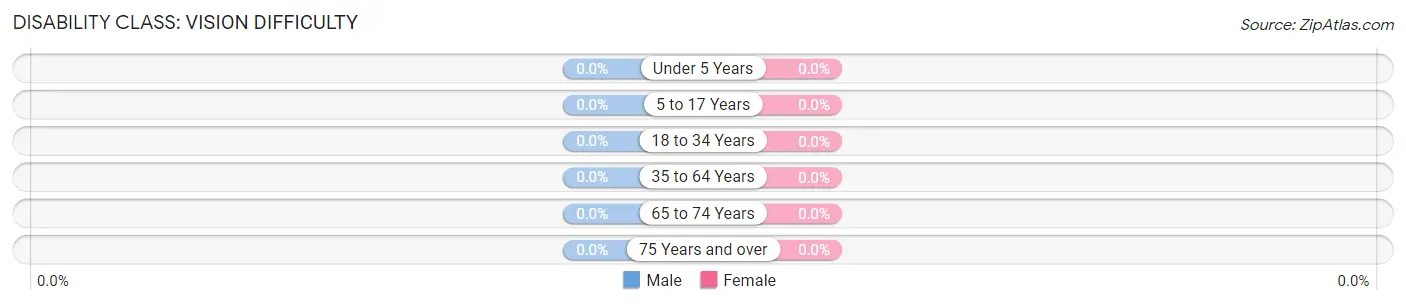
Disability Class: Vision Difficulty
Age Bracket
Male
Female
Under 5 Years
0 (0.0%)
0 (0.0%)
5 to 17 Years
0 (0.0%)
0 (0.0%)
18 to 34 Years
0 (0.0%)
0 (0.0%)
35 to 64 Years
0 (0.0%)
0 (0.0%)
65 to 74 Years
0 (0.0%)
0 (0.0%)
75 Years and over
0 (0.0%)
0 (0.0%)
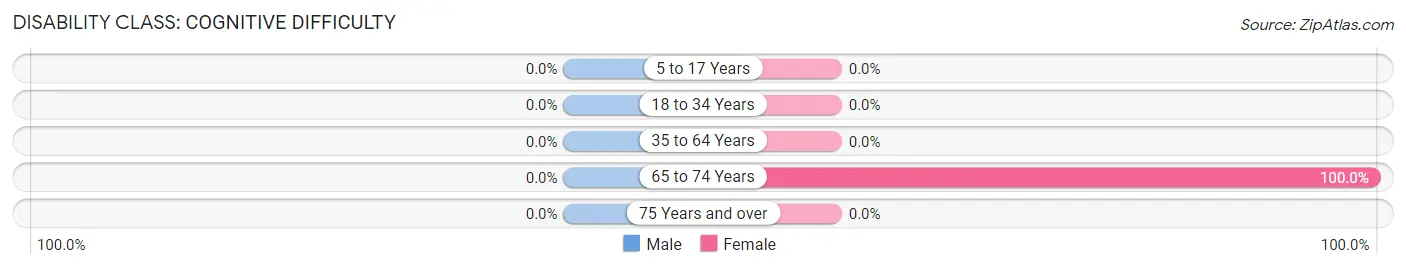
Disability Class: Cognitive Difficulty
Age Bracket
Male
Female
5 to 17 Years
0 (0.0%)
0 (0.0%)
18 to 34 Years
0 (0.0%)
0 (0.0%)
35 to 64 Years
0 (0.0%)
0 (0.0%)
65 to 74 Years
0 (0.0%)
19 (100.0%)
75 Years and over
0 (0.0%)
0 (0.0%)
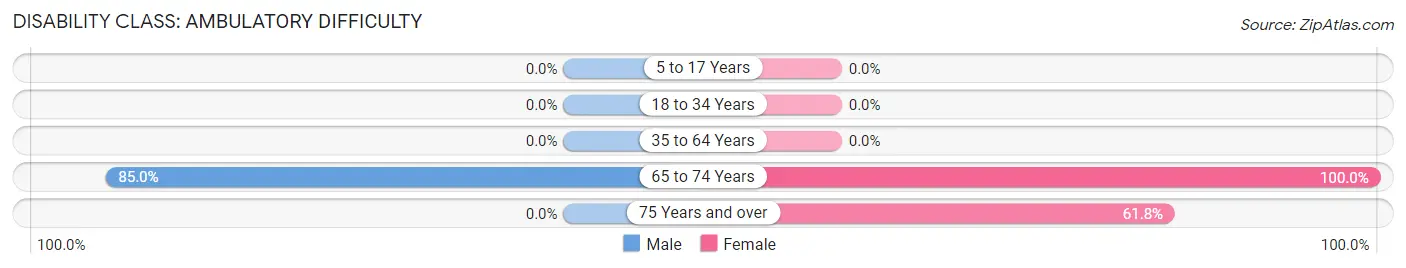
Disability Class: Ambulatory Difficulty
Age Bracket
Male
Female
5 to 17 Years
0 (0.0%)
0 (0.0%)
18 to 34 Years
0 (0.0%)
0 (0.0%)
35 to 64 Years
0 (0.0%)
0 (0.0%)
65 to 74 Years
34 (85.0%)
19 (100.0%)
75 Years and over
0 (0.0%)
34 (61.8%)
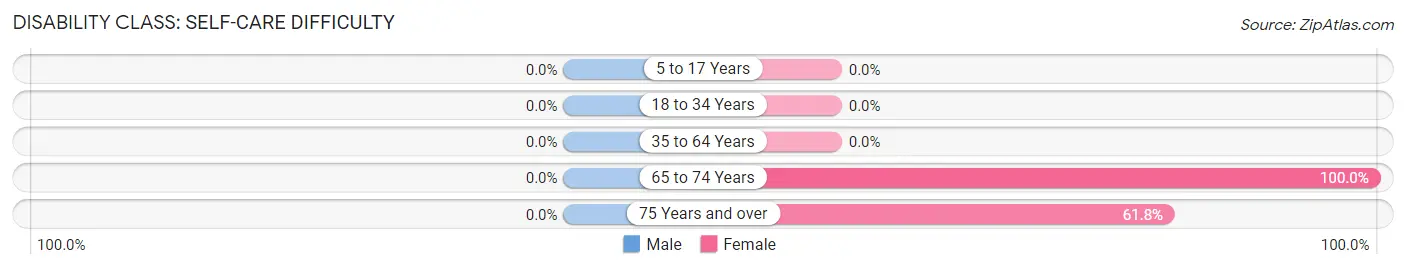
Disability Class: Self-Care Difficulty
Age Bracket
Male
Female
5 to 17 Years
0 (0.0%)
0 (0.0%)
18 to 34 Years
0 (0.0%)
0 (0.0%)
35 to 64 Years
0 (0.0%)
0 (0.0%)
65 to 74 Years
0 (0.0%)
19 (100.0%)
75 Years and over
0 (0.0%)
34 (61.8%)
Technology Access in Pinion Pines
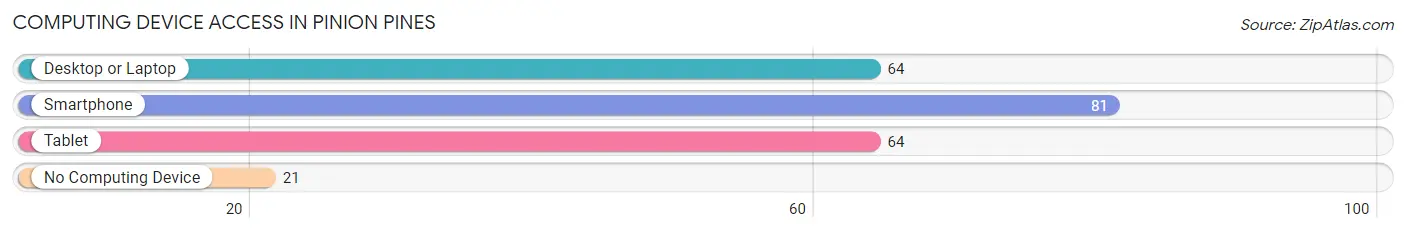
Computing Device Access in Pinion Pines
Device Type
# Households
% Households
Desktop or Laptop
64
62.7%
Smartphone
81
79.4%
Tablet
64
62.7%
No Computing Device
21
20.6%
Total
102
100.0%
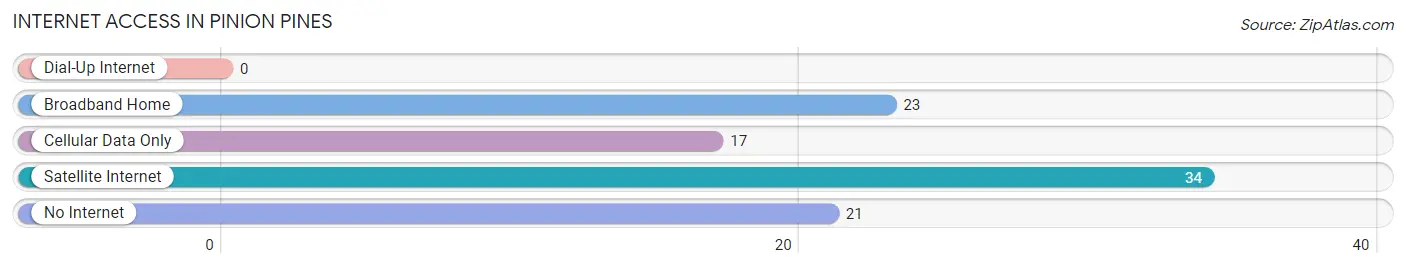
Internet Access in Pinion Pines
Internet Type
# Households
% Households
Dial-Up Internet
0
0.0%
Broadband Home
23
22.6%
Cellular Data Only
17
16.7%
Satellite Internet
34
33.3%
No Internet
21
20.6%
Total
102
100.0%
Pinion Pines Summary
Pinion Pines, Arizona is a small unincorporated community located in the White Mountains of Arizona. It is situated in Navajo County, approximately 20 miles east of Show Low and 30 miles west of Springerville. The community is located at an elevation of 6,400 feet and is surrounded by the Apache-Sitgreaves National Forest. Pinion Pines is a popular destination for outdoor recreation, including camping, fishing, hunting, and hiking.
History
Pinion Pines was first settled in the late 1800s by Mormon settlers who were looking for a place to homestead. The area was originally known as Pinion Valley, and the settlers named it after the pinion pine trees that grew in the area. The first post office was established in the area in 1891, and the community was officially incorporated in 1912.
In the early 1900s, the area was home to a number of small sawmills and logging operations. The timber industry was the primary source of income for the community until the 1950s, when the industry began to decline. In the 1960s, the area began to attract tourists and outdoor enthusiasts, and the community began to transition to a more tourism-based economy.
Geography
Pinion Pines is located in the White Mountains of Arizona, approximately 20 miles east of Show Low and 30 miles west of Springerville. The community is situated at an elevation of 6,400 feet and is surrounded by the Apache-Sitgreaves National Forest. The area is characterized by rolling hills, pine forests, and meadows. The climate is semi-arid, with hot summers and cold winters.
Economy
The economy of Pinion Pines is largely based on tourism and outdoor recreation. The area is a popular destination for camping, fishing, hunting, and hiking. The nearby Apache-Sitgreaves National Forest offers a variety of recreational activities, including camping, fishing, hunting, and hiking. The area is also home to a number of small businesses, including restaurants, stores, and lodges.
Demographics
As of the 2010 census, the population of Pinion Pines was 1,072. The racial makeup of the community was 95.3% White, 0.7% Native American, 0.3% Asian, 0.2% African American, and 3.5% from other races. The median household income was $37,500, and the median age was 44.5 years. The majority of the population (90.3%) was over the age of 18, and the median home value was $127,000.
Common Questions
What is Per Capita Income in Pinion Pines?
Per Capita income in Pinion Pines is $31,802.
What is the Median Household income in Pinion Pines?
Median Household Income in Pinion Pines is $70,441.
What is Inequality or Gini Index in Pinion Pines?
Inequality or Gini Index in Pinion Pines is 0.20.
What is the Total Population of Pinion Pines?
Total Population of Pinion Pines is 183.
What is the Total Male Population of Pinion Pines?
Total Male Population of Pinion Pines is 102.
What is the Total Female Population of Pinion Pines?
Total Female Population of Pinion Pines is 81.
What is the Ratio of Males per 100 Females in Pinion Pines?
There are 125.93 Males per 100 Females in Pinion Pines.
What is the Ratio of Females per 100 Males in Pinion Pines?
There are 79.41 Females per 100 Males in Pinion Pines.
What is the Median Population Age in Pinion Pines?
Median Population Age in Pinion Pines is 74.7 Years.
What is the Average Family Size in Pinion Pines
Average Family Size in Pinion Pines is 2.0 People.
What is the Average Household Size in Pinion Pines
Average Household Size in Pinion Pines is 1.8 People.
Report Title
Report Link
HTML Copy & Paste Link
Social Media
Copy and paste the folowing code into any webpage where you would like this interactive chart to display