Zip Codes with the Highest Percentage of Population with a Degree in Computers and Mathematics in Tucson, AZ

RELATED REPORTS & OPTIONS

Computers and Mathematics
Population
Families and Households
Female Fertility
Female Fertility (Unmarried)
Race (Community Size)
Race (Percentage)
Ancestry (Community Size)
AfghanAfricanAlaska NativeAlbanianAleutAlsatianAmericanApacheArabArgentineanArmenianAssyrian / Chaldean / SyriacAustralianAustrianBasqueBelgianBelizeanBhutaneseBlackfeetBolivianBrazilianBritishBulgarianBurmeseCajunCanadianCarpatho RusynCelticCentral AmericanCentral American IndianCherokeeCheyenneChickasawChileanChineseChippewaChoctawColombianComancheCosta RicanCreeCreekCroatianCubanCzechCzechoslovakianDanishDelawareDominicanDutchDutch West IndianEastern EuropeanEcuadorianEgyptianEnglishEstonianEthiopianEuropeanFilipinoFinnishFrenchFrench American IndianFrench CanadianGermanGerman RussianGhanaianGreekGuamanian / ChamorroGuatemalanGuyaneseHaitianHonduranHopiHungarianIcelanderIndian (Asian)IndonesianInupiatIranianIraqiIrishIroquoisIsraeliItalianJamaicanJapaneseJordanianKenyanKiowaKoreanLaotianLatvianLebaneseLithuanianLumbeeLuxembourgerMacedonianMalaysianMalteseMenomineeMexicanMexican American IndianMongolianMoroccanNative HawaiianNavajoNew ZealanderNicaraguanNigerianNorthern EuropeanNorwegianOsageOttawaPaiutePakistaniPalestinianPanamanianParaguayanPennsylvania GermanPeruvianPimaPolishPortuguesePotawatomiPuebloPuerto RicanPuget Sound SalishRomanianRussianSalvadoranSamoanScandinavianScotch-IrishScottishSeminoleSerbianShoshoneSiouxSlavicSlovakSloveneSomaliSouth AfricanSouth AmericanSouth American IndianSoviet UnionSpaniardSpanishSpanish AmericanSpanish American IndianSri LankanSubsaharan AfricanSudaneseSwedishSwissSyrianThaiTlingit-HaidaTohono O'OdhamTrinidadian and TobagonianTurkishU.S. Virgin IslanderUgandanUkrainianUteVenezuelanVietnameseWelshWest IndianYaquiYugoslavianYumanYup'ikZimbabwean
Ancestry (Percentage)
AfghanAfricanAlaska NativeAlbanianAleutAlsatianAmericanApacheArabArgentineanArmenianAssyrian / Chaldean / SyriacAustralianAustrianBasqueBelgianBelizeanBhutaneseBlackfeetBolivianBrazilianBritishBulgarianBurmeseCajunCanadianCarpatho RusynCelticCentral AmericanCentral American IndianCherokeeCheyenneChickasawChileanChineseChippewaChoctawColombianComancheCosta RicanCreeCreekCroatianCubanCzechCzechoslovakianDanishDelawareDominicanDutchDutch West IndianEastern EuropeanEcuadorianEgyptianEnglishEstonianEthiopianEuropeanFilipinoFinnishFrenchFrench American IndianFrench CanadianGermanGerman RussianGhanaianGreekGuamanian / ChamorroGuatemalanGuyaneseHaitianHonduranHopiHungarianIcelanderIndian (Asian)IndonesianInupiatIranianIraqiIrishIroquoisIsraeliItalianJamaicanJapaneseJordanianKenyanKiowaKoreanLaotianLatvianLebaneseLithuanianLumbeeLuxembourgerMacedonianMalaysianMalteseMenomineeMexicanMexican American IndianMongolianMoroccanNative HawaiianNavajoNew ZealanderNicaraguanNigerianNorthern EuropeanNorwegianOsageOttawaPaiutePakistaniPalestinianPanamanianParaguayanPennsylvania GermanPeruvianPimaPolishPortuguesePotawatomiPuebloPuerto RicanPuget Sound SalishRomanianRussianSalvadoranSamoanScandinavianScotch-IrishScottishSeminoleSerbianShoshoneSiouxSlavicSlovakSloveneSomaliSouth AfricanSouth AmericanSouth American IndianSoviet UnionSpaniardSpanishSpanish AmericanSpanish American IndianSri LankanSubsaharan AfricanSudaneseSwedishSwissSyrianThaiTlingit-HaidaTohono O'OdhamTrinidadian and TobagonianTurkishU.S. Virgin IslanderUgandanUkrainianUteVenezuelanVietnameseWelshWest IndianYaquiYugoslavianYumanYup'ikZimbabwean
Immigrant Origin (Total)
AfghanistanAfricaArgentinaArmeniaAsiaAustraliaAustriaBangladeshBelarusBelgiumBoliviaBosnia and HerzegovinaBrazilBulgariaBurma / MyanmarCameroonCanadaCaribbeanCentral AmericaChileChinaColombiaCongoCosta RicaCroatiaCubaCzechoslovakiaDenmarkDominican RepublicEastern AfricaEastern AsiaEastern EuropeEcuadorEgyptEl SalvadorEnglandEthiopiaEuropeFranceGermanyGhanaGreeceGrenadaGuatemalaGuyanaHaitiHondurasHong KongHungaryIndiaIndonesiaIranIraqIrelandIsraelItalyJamaicaJapanJordanKazakhstanKenyaKoreaKuwaitLaosLatin AmericaLebanonLiberiaLithuaniaMalaysiaMexicoMicronesiaMiddle AfricaMoldovaMoroccoNepalNetherlandsNicaraguaNigeriaNorth MacedoniaNorthern AfricaNorthern EuropeNorwayOceaniaPakistanPanamaPeruPhilippinesPolandPortugalRomaniaRussiaSaudi ArabiaScotlandSerbiaSingaporeSomaliaSouth AfricaSouth AmericaSouth Central AsiaSouth Eastern AsiaSouthern EuropeSpainSri LankaSudanSwedenSwitzerlandSyriaTaiwanThailandTrinidad and TobagoTurkeyUgandaUkraineUzbekistanVenezuelaVietnamWestern AfricaWestern AsiaWestern EuropeZaireZimbabwe
Immigrant Origin (Percentage)
AfghanistanAfricaArgentinaArmeniaAsiaAustraliaAustriaBangladeshBelarusBelgiumBoliviaBosnia and HerzegovinaBrazilBulgariaBurma / MyanmarCameroonCanadaCaribbeanCentral AmericaChileChinaColombiaCongoCosta RicaCroatiaCubaCzechoslovakiaDenmarkDominican RepublicEastern AfricaEastern AsiaEastern EuropeEcuadorEgyptEl SalvadorEnglandEthiopiaEuropeFranceGermanyGhanaGreeceGrenadaGuatemalaGuyanaHaitiHondurasHong KongHungaryIndiaIndonesiaIranIraqIrelandIsraelItalyJamaicaJapanJordanKazakhstanKenyaKoreaKuwaitLaosLatin AmericaLebanonLiberiaLithuaniaMalaysiaMexicoMicronesiaMiddle AfricaMoldovaMoroccoNepalNetherlandsNicaraguaNigeriaNorth MacedoniaNorthern AfricaNorthern EuropeNorwayOceaniaPakistanPanamaPeruPhilippinesPolandPortugalRomaniaRussiaSaudi ArabiaScotlandSerbiaSingaporeSomaliaSouth AfricaSouth AmericaSouth Central AsiaSouth Eastern AsiaSouthern EuropeSpainSri LankaSudanSwedenSwitzerlandSyriaTaiwanThailandTrinidad and TobagoTurkeyUgandaUkraineUzbekistanVenezuelaVietnamWestern AfricaWestern AsiaWestern EuropeZaireZimbabwe
Income
Income (Families)
Income (Households)
Poverty
Poverty (Families)
Unemployment
Employment Occupations
Employment Industries
Employer Class
Commute Time
Commute Means
School Enrollment
Education by Degree Field
Occupancy
Finances
Physical Characteristics
Tucson
Compare Zip Codes
Comparison Subject

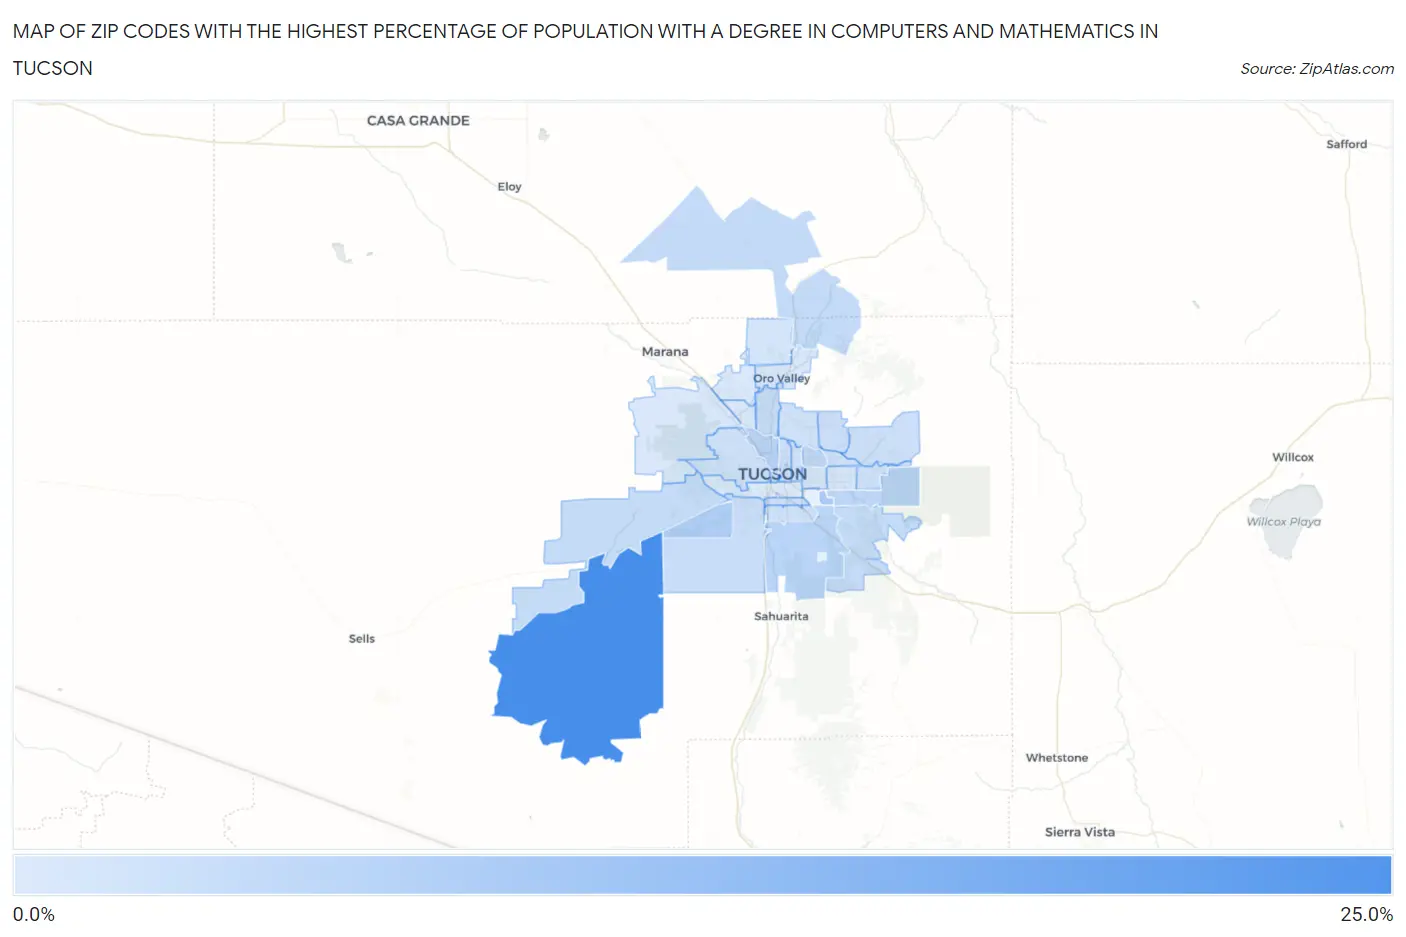
Map of Zip Codes with the Highest Percentage of Population with a Degree in Computers and Mathematics in Tucson

0.0%
25.0%
Zip Codes with the Highest Percentage of Population with a Degree in Computers and Mathematics in Tucson Map

Zip Codes with the Highest Percentage of Population with a Degree in Computers and Mathematics in Tucson, AZ

Zip Code % Graduates vs State vs National
1.8573623.0%4.5%(+18.5)#74.9%(+18.1)#364
2.857088.7%4.5%(+4.23)#364.9%(+3.82)#2,416
3.857578.0%4.5%(+3.56)#404.9%(+3.14)#2,876
4.857056.7%4.5%(+2.18)#544.9%(+1.76)#4,267
5.857566.4%4.5%(+1.95)#564.9%(+1.53)#4,559
6.857126.1%4.5%(+1.59)#644.9%(+1.18)#5,179
7.857305.8%4.5%(+1.35)#734.9%(+0.926)#5,640
8.857395.2%4.5%(+0.762)#934.9%(+0.343)#6,912
9.857045.1%4.5%(+0.614)#964.9%(+0.195)#7,236
10.857355.1%4.5%(+0.578)#984.9%(+0.159)#7,324
11.857474.9%4.5%(+0.383)#1054.9%(-0.036)#7,812
12.857014.9%4.5%(+0.376)#1084.9%(-0.043)#7,845
13.857464.6%4.5%(+0.114)#1184.9%(-0.305)#8,597
14.857144.3%4.5%(-0.174)#1294.9%(-0.593)#9,533
15.857504.3%4.5%(-0.183)#1314.9%(-0.602)#9,559
16.857064.2%4.5%(-0.289)#1394.9%(-0.708)#9,884
17.857154.2%4.5%(-0.307)#1424.9%(-0.726)#9,931
18.857494.2%4.5%(-0.325)#1444.9%(-0.744)#9,986
19.857484.1%4.5%(-0.390)#1464.9%(-0.809)#10,185
20.857193.9%4.5%(-0.539)#1574.9%(-0.958)#10,664
21.857453.8%4.5%(-0.659)#1684.9%(-1.08)#11,130
22.857163.8%4.5%(-0.668)#1704.9%(-1.09)#11,169
23.857183.7%4.5%(-0.774)#1764.9%(-1.19)#11,539
24.857103.2%4.5%(-1.31)#2044.9%(-1.72)#13,494
25.857113.1%4.5%(-1.33)#2074.9%(-1.75)#13,563
26.857553.0%4.5%(-1.43)#2114.9%(-1.85)#13,922
27.857412.5%4.5%(-1.97)#2284.9%(-2.39)#15,879
28.857372.5%4.5%(-2.00)#2314.9%(-2.41)#15,984
29.857422.4%4.5%(-2.06)#2344.9%(-2.48)#16,208
30.857432.2%4.5%(-2.25)#2414.9%(-2.67)#16,877
31.857132.0%4.5%(-2.51)#2534.9%(-2.93)#17,733

Common Questions

What are the Top 10 Zip Codes with the Highest Percentage of Population with a Degree in Computers and Mathematics in Tucson, AZ?
Top 10 Zip Codes with the Highest Percentage of Population with a Degree in Computers and Mathematics in Tucson, AZ are:
#1
23.0%
#2
8.7%
#3
8.0%
#4
6.7%
#5
6.4%
#6
6.1%
#7
5.8%
#8
5.2%
#9
5.1%
#10
5.1%
What zip code has the Highest Percentage of Population with a Degree in Computers and Mathematics in Tucson, AZ?
85736 has the Highest Percentage of Population with a Degree in Computers and Mathematics in Tucson, AZ with 23.0%.
What is the Percentage of Population with a Degree in Computers and Mathematics in Tucson, AZ?
Percentage of Population with a Degree in Computers and Mathematics in Tucson is 4.4%.
What is the Percentage of Population with a Degree in Computers and Mathematics in Arizona?
Percentage of Population with a Degree in Computers and Mathematics in Arizona is 4.5%.
What is the Percentage of Population with a Degree in Computers and Mathematics in the United States?
Percentage of Population with a Degree in Computers and Mathematics in the United States is 4.9%.