Autaugaville, AL Map & Demographics
Autaugaville Map
Autaugaville Overview
$26,259
PER CAPITA INCOME
$45,197
AVG FAMILY INCOME
$41,607
AVG HOUSEHOLD INCOME
24.8%
WAGE / INCOME GAP [ % ]
75.2¢/ $1
WAGE / INCOME GAP [ $ ]
0.55
INEQUALITY / GINI INDEX
1,047
TOTAL POPULATION
578
MALE POPULATION
469
FEMALE POPULATION
123.24
MALES / 100 FEMALES
81.14
FEMALES / 100 MALES
34.7
MEDIAN AGE
3.6
AVG FAMILY SIZE
2.5
AVG HOUSEHOLD SIZE
409
LABOR FORCE [ PEOPLE ]
54.4%
PERCENT IN LABOR FORCE
8.1%
UNEMPLOYMENT RATE
Autaugaville Zip Codes
Autaugaville Area Codes
Income in Autaugaville
Income Overview in Autaugaville
Per Capita Income in Autaugaville is $26,259, while median incomes of families and households are $45,197 and $41,607 respectively.
| Characteristic | Number | Measure |
| Per Capita Income | 1,047 | $26,259 |
| Median Family Income | 239 | $45,197 |
| Mean Family Income | 239 | $58,329 |
| Median Household Income | 421 | $41,607 |
| Mean Household Income | 421 | $61,227 |
| Income Deficit | 239 | $0 |
| Wage / Income Gap (%) | 1,047 | 24.78% |
| Wage / Income Gap ($) | 1,047 | 75.22¢ per $1 |
| Gini / Inequality Index | 1,047 | 0.55 |
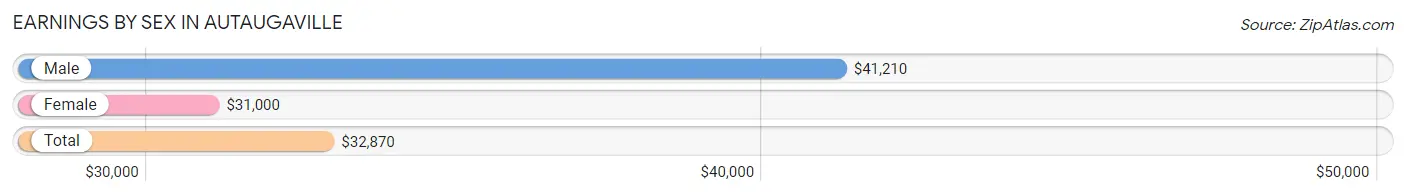
Earnings by Sex in Autaugaville
Average Earnings in Autaugaville are $32,870, $41,210 for men and $31,000 for women, a difference of 24.8%.
| Sex | Number | Average Earnings |
| Male | 190 (47.5%) | $41,210 |
| Female | 210 (52.5%) | $31,000 |
| Total | 400 (100.0%) | $32,870 |
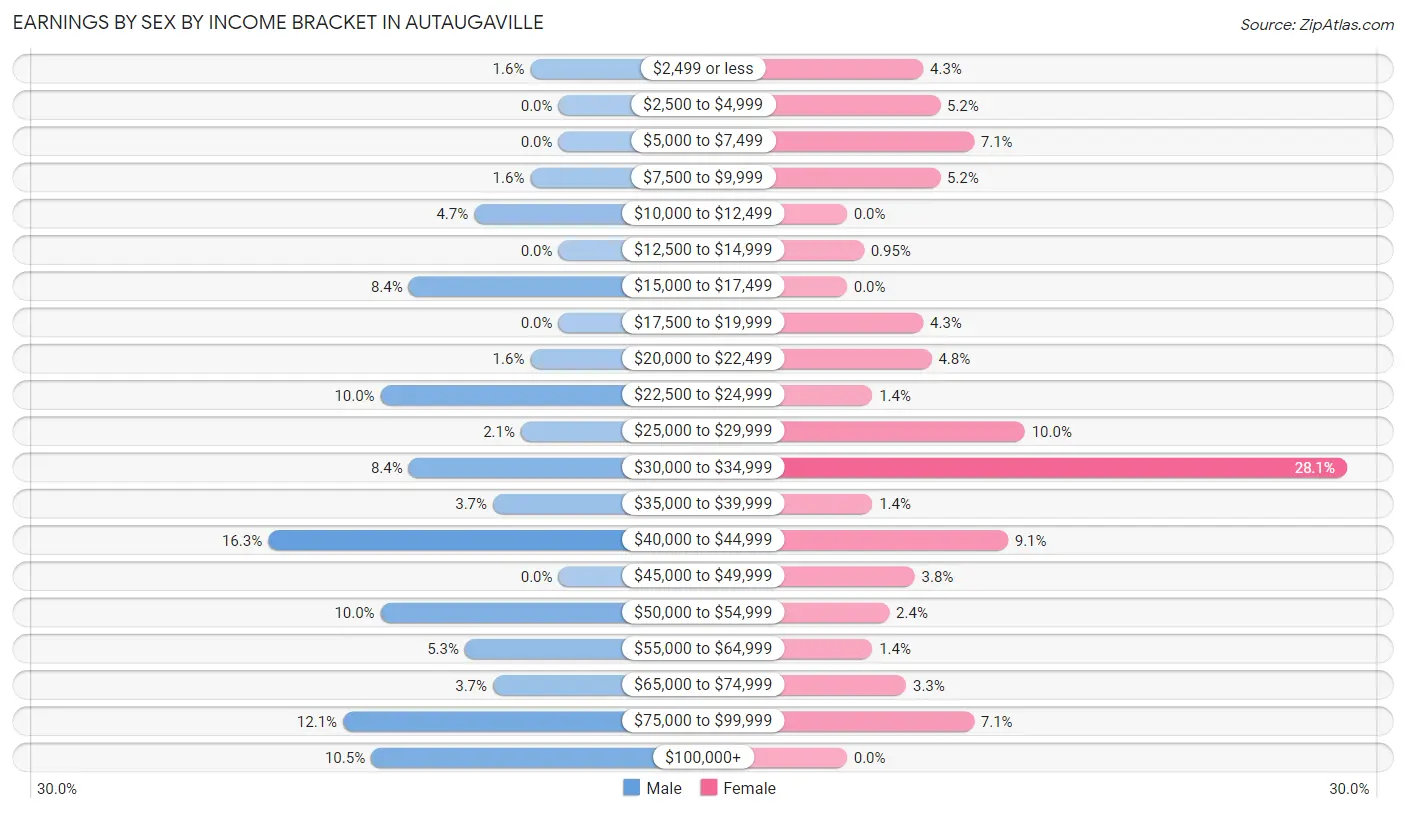
Earnings by Sex by Income Bracket in Autaugaville
The most common earnings brackets in Autaugaville are $40,000 to $44,999 for men (31 | 16.3%) and $30,000 to $34,999 for women (59 | 28.1%).
| Income | Male | Female |
| $2,499 or less | 3 (1.6%) | 9 (4.3%) |
| $2,500 to $4,999 | 0 (0.0%) | 11 (5.2%) |
| $5,000 to $7,499 | 0 (0.0%) | 15 (7.1%) |
| $7,500 to $9,999 | 3 (1.6%) | 11 (5.2%) |
| $10,000 to $12,499 | 9 (4.7%) | 0 (0.0%) |
| $12,500 to $14,999 | 0 (0.0%) | 2 (0.9%) |
| $15,000 to $17,499 | 16 (8.4%) | 0 (0.0%) |
| $17,500 to $19,999 | 0 (0.0%) | 9 (4.3%) |
| $20,000 to $22,499 | 3 (1.6%) | 10 (4.8%) |
| $22,500 to $24,999 | 19 (10.0%) | 3 (1.4%) |
| $25,000 to $29,999 | 4 (2.1%) | 21 (10.0%) |
| $30,000 to $34,999 | 16 (8.4%) | 59 (28.1%) |
| $35,000 to $39,999 | 7 (3.7%) | 3 (1.4%) |
| $40,000 to $44,999 | 31 (16.3%) | 19 (9.0%) |
| $45,000 to $49,999 | 0 (0.0%) | 8 (3.8%) |
| $50,000 to $54,999 | 19 (10.0%) | 5 (2.4%) |
| $55,000 to $64,999 | 10 (5.3%) | 3 (1.4%) |
| $65,000 to $74,999 | 7 (3.7%) | 7 (3.3%) |
| $75,000 to $99,999 | 23 (12.1%) | 15 (7.1%) |
| $100,000+ | 20 (10.5%) | 0 (0.0%) |
| Total | 190 (100.0%) | 210 (100.0%) |
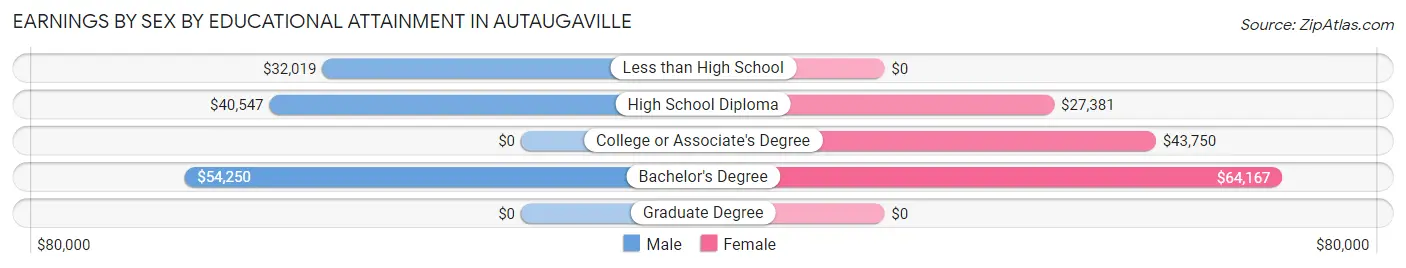
Earnings by Sex by Educational Attainment in Autaugaville
Average earnings in Autaugaville are $41,129 for men and $31,929 for women, a difference of 22.4%. Men with an educational attainment of bachelor's degree enjoy the highest average annual earnings of $54,250, while those with less than high school education earn the least with $32,019. Women with an educational attainment of bachelor's degree earn the most with the average annual earnings of $64,167, while those with high school diploma education have the smallest earnings of $27,381.
| Educational Attainment | Male Income | Female Income |
| Less than High School | $32,019 | $0 |
| High School Diploma | $40,547 | $27,381 |
| College or Associate's Degree | - | - |
| Bachelor's Degree | $54,250 | $64,167 |
| Graduate Degree | - | - |
| Total | $41,129 | $31,929 |
Family Income in Autaugaville
Family Income Brackets in Autaugaville
According to the Autaugaville family income data, there are 67 families falling into the $35,000 to $49,999 income range, which is the most common income bracket and makes up 28.0% of all families.
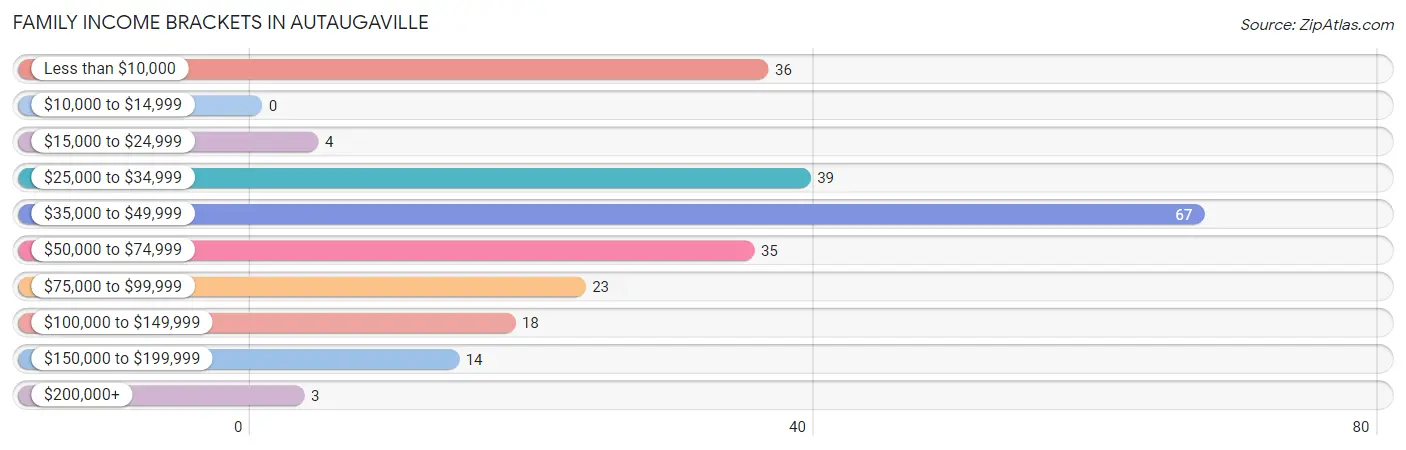
| Income Bracket | # Families | % Families |
| Less than $10,000 | 36 | 15.1% |
| $10,000 to $14,999 | 0 | 0.0% |
| $15,000 to $24,999 | 4 | 1.7% |
| $25,000 to $34,999 | 39 | 16.3% |
| $35,000 to $49,999 | 67 | 28.0% |
| $50,000 to $74,999 | 35 | 14.6% |
| $75,000 to $99,999 | 23 | 9.6% |
| $100,000 to $149,999 | 18 | 7.5% |
| $150,000 to $199,999 | 14 | 5.9% |
| $200,000+ | 3 | 1.3% |
Family Income by Famaliy Size in Autaugaville
3-person families (80 | 33.5%) account for the highest median family income in Autaugaville with $44,891 per family, while 2-person families (112 | 46.9%) have the highest median income of $21,072 per family member.
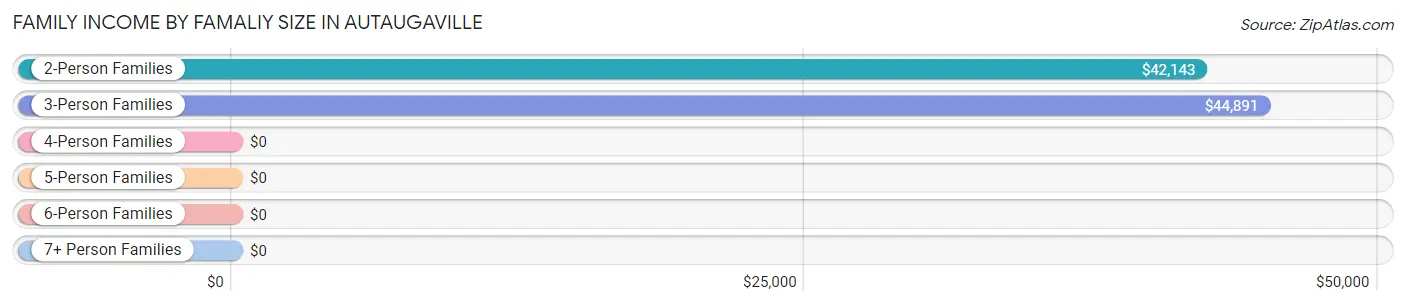
| Income Bracket | # Families | Median Income |
| 2-Person Families | 112 (46.9%) | $42,143 |
| 3-Person Families | 80 (33.5%) | $44,891 |
| 4-Person Families | 41 (17.2%) | $0 |
| 5-Person Families | 6 (2.5%) | $0 |
| 6-Person Families | 0 (0.0%) | $0 |
| 7+ Person Families | 0 (0.0%) | $0 |
| Total | 239 (100.0%) | $45,197 |
Family Income by Number of Earners in Autaugaville
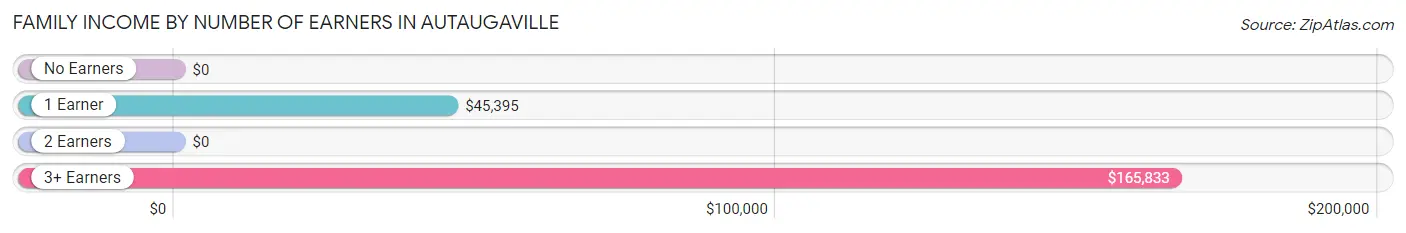
| Number of Earners | # Families | Median Income |
| No Earners | 37 (15.5%) | $0 |
| 1 Earner | 138 (57.7%) | $45,395 |
| 2 Earners | 54 (22.6%) | $0 |
| 3+ Earners | 10 (4.2%) | $165,833 |
| Total | 239 (100.0%) | $45,197 |
Household Income in Autaugaville
Household Income Brackets in Autaugaville
With 80 households falling in the category, the $35,000 to $49,999 income range is the most frequent in Autaugaville, accounting for 19.0% of all households. In contrast, only 7 households (1.7%) fall into the $200,000+ income bracket, making it the least populous group.
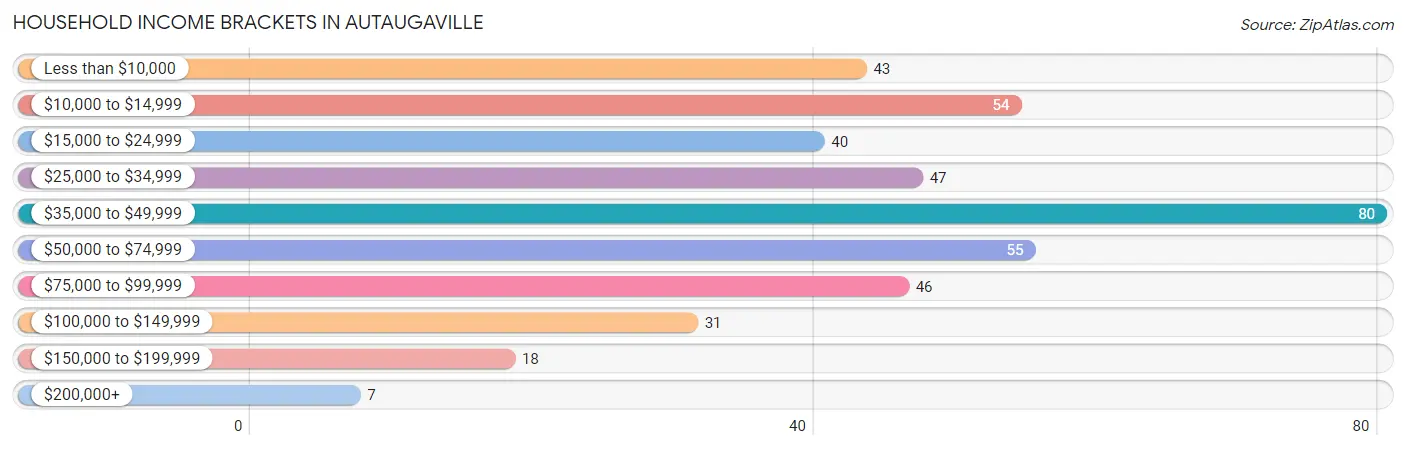
| Income Bracket | # Households | % Households |
| Less than $10,000 | 43 | 10.2% |
| $10,000 to $14,999 | 54 | 12.8% |
| $15,000 to $24,999 | 40 | 9.5% |
| $25,000 to $34,999 | 47 | 11.2% |
| $35,000 to $49,999 | 80 | 19.0% |
| $50,000 to $74,999 | 55 | 13.1% |
| $75,000 to $99,999 | 46 | 10.9% |
| $100,000 to $149,999 | 31 | 7.4% |
| $150,000 to $199,999 | 18 | 4.3% |
| $200,000+ | 7 | 1.7% |
Household Income by Householder Age in Autaugaville
The median household income in Autaugaville is $41,607, with the highest median household income of $59,750 found in the 45 to 64 years age bracket for the primary householder. A total of 135 households (32.1%) fall into this category.
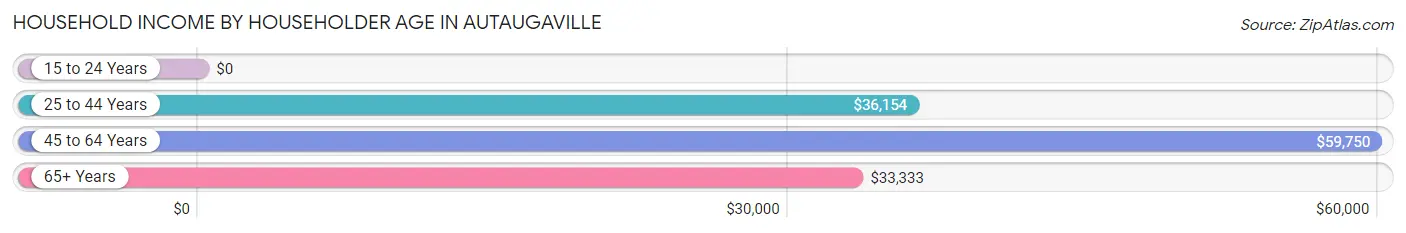
| Income Bracket | # Households | Median Income |
| 15 to 24 Years | 0 (0.0%) | $0 |
| 25 to 44 Years | 150 (35.6%) | $36,154 |
| 45 to 64 Years | 135 (32.1%) | $59,750 |
| 65+ Years | 136 (32.3%) | $33,333 |
| Total | 421 (100.0%) | $41,607 |
Poverty in Autaugaville
Income Below Poverty by Sex and Age in Autaugaville
With 23.5% poverty level for males and 24.5% for females among the residents of Autaugaville, under 5 year old males and under 5 year old females are the most vulnerable to poverty, with 81 males (52.9%) and 41 females (91.1%) in their respective age groups living below the poverty level.
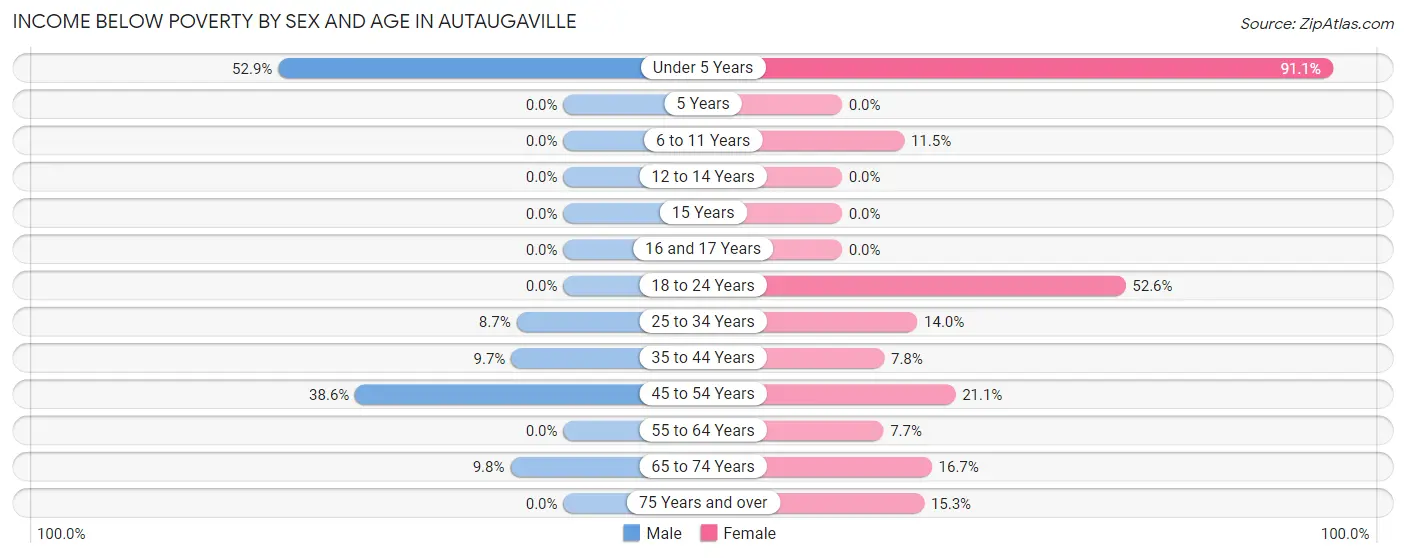
| Age Bracket | Male | Female |
| Under 5 Years | 81 (52.9%) | 41 (91.1%) |
| 5 Years | 0 (0.0%) | 0 (0.0%) |
| 6 to 11 Years | 0 (0.0%) | 3 (11.5%) |
| 12 to 14 Years | 0 (0.0%) | 0 (0.0%) |
| 15 Years | 0 (0.0%) | 0 (0.0%) |
| 16 and 17 Years | 0 (0.0%) | 0 (0.0%) |
| 18 to 24 Years | 0 (0.0%) | 30 (52.6%) |
| 25 to 34 Years | 6 (8.7%) | 13 (14.0%) |
| 35 to 44 Years | 9 (9.7%) | 4 (7.8%) |
| 45 to 54 Years | 34 (38.6%) | 8 (21.0%) |
| 55 to 64 Years | 0 (0.0%) | 3 (7.7%) |
| 65 to 74 Years | 6 (9.8%) | 4 (16.7%) |
| 75 Years and over | 0 (0.0%) | 9 (15.2%) |
| Total | 136 (23.5%) | 115 (24.5%) |
Income Above Poverty by Sex and Age in Autaugaville
According to the poverty statistics in Autaugaville, males aged 6 to 11 years and females aged 12 to 14 years are the age groups that are most secure financially, with 100.0% of males and 100.0% of females in these age groups living above the poverty line.
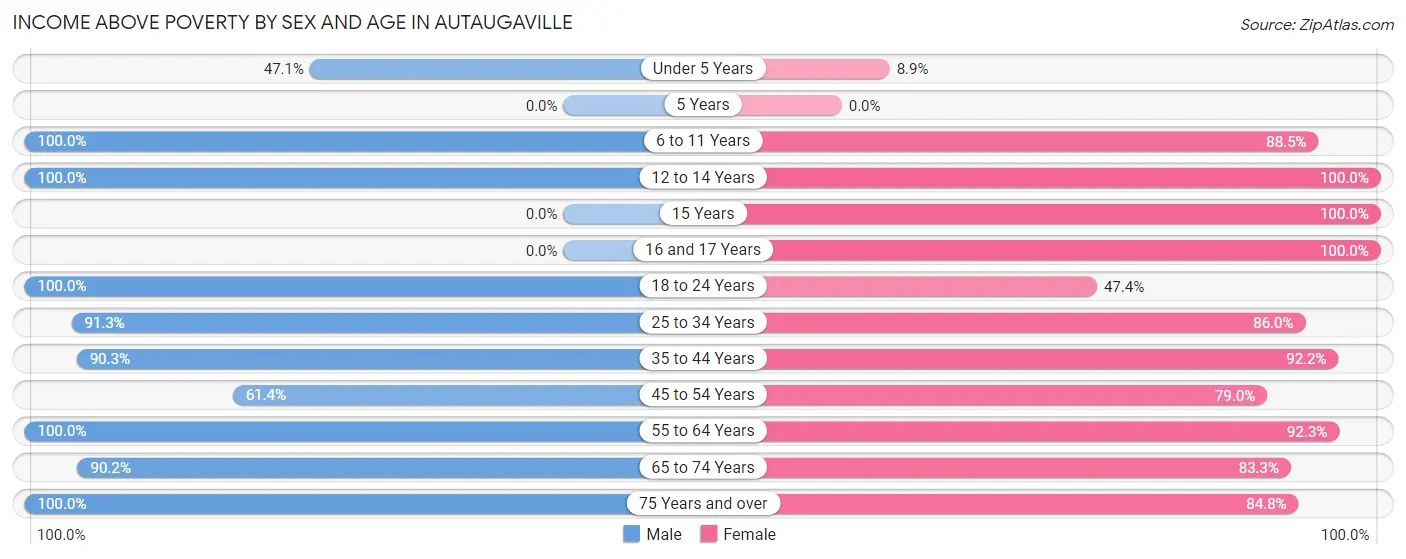
| Age Bracket | Male | Female |
| Under 5 Years | 72 (47.1%) | 4 (8.9%) |
| 5 Years | 0 (0.0%) | 0 (0.0%) |
| 6 to 11 Years | 40 (100.0%) | 23 (88.5%) |
| 12 to 14 Years | 3 (100.0%) | 25 (100.0%) |
| 15 Years | 0 (0.0%) | 3 (100.0%) |
| 16 and 17 Years | 0 (0.0%) | 9 (100.0%) |
| 18 to 24 Years | 8 (100.0%) | 27 (47.4%) |
| 25 to 34 Years | 63 (91.3%) | 80 (86.0%) |
| 35 to 44 Years | 84 (90.3%) | 47 (92.2%) |
| 45 to 54 Years | 54 (61.4%) | 30 (78.9%) |
| 55 to 64 Years | 36 (100.0%) | 36 (92.3%) |
| 65 to 74 Years | 55 (90.2%) | 20 (83.3%) |
| 75 Years and over | 27 (100.0%) | 50 (84.8%) |
| Total | 442 (76.5%) | 354 (75.5%) |
Income Below Poverty Among Married-Couple Families in Autaugaville
The poverty statistics for married-couple families in Autaugaville show that 23.3% or 21 of the total 90 families live below the poverty line. Families with no children have the highest poverty rate of 26.3%, comprising of 21 families. On the other hand, families with 1 or 2 children have the lowest poverty rate of 0.0%, which includes 0 families.
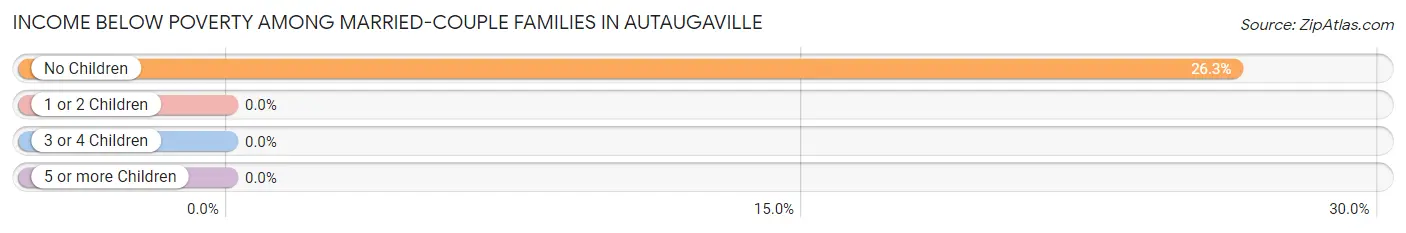
| Children | Above Poverty | Below Poverty |
| No Children | 59 (73.8%) | 21 (26.3%) |
| 1 or 2 Children | 10 (100.0%) | 0 (0.0%) |
| 3 or 4 Children | 0 (0.0%) | 0 (0.0%) |
| 5 or more Children | 0 (0.0%) | 0 (0.0%) |
| Total | 69 (76.7%) | 21 (23.3%) |
Income Below Poverty Among Single-Parent Households in Autaugaville
According to the poverty data in Autaugaville, 4.3% or 2 single-father households and 16.7% or 17 single-mother households are living below the poverty line. Among single-father households, those with no children have the highest poverty rate, with 2 households (11.1%) experiencing poverty. Likewise, among single-mother households, those with 3 or 4 children have the highest poverty rate, with 13 households (100.0%) falling below the poverty line.
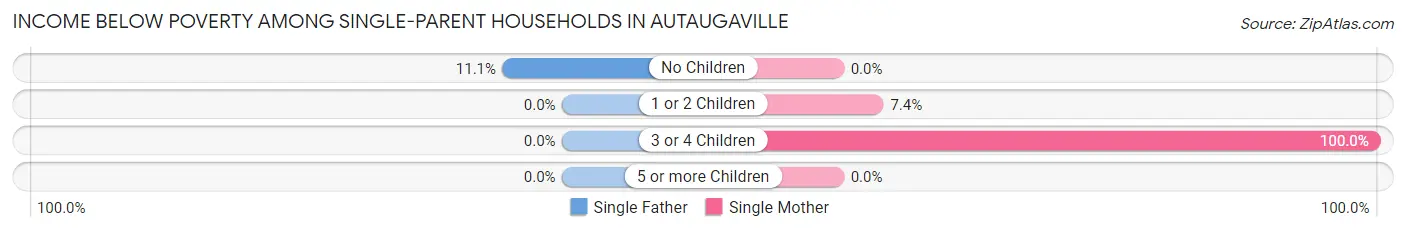
| Children | Single Father | Single Mother |
| No Children | 2 (11.1%) | 0 (0.0%) |
| 1 or 2 Children | 0 (0.0%) | 4 (7.4%) |
| 3 or 4 Children | 0 (0.0%) | 13 (100.0%) |
| 5 or more Children | 0 (0.0%) | 0 (0.0%) |
| Total | 2 (4.3%) | 17 (16.7%) |
Income Below Poverty Among Married-Couple vs Single-Parent Households in Autaugaville
The poverty data for Autaugaville shows that 21 of the married-couple family households (23.3%) and 19 of the single-parent households (12.8%) are living below the poverty level. Within the married-couple family households, those with no children have the highest poverty rate, with 21 households (26.3%) falling below the poverty line. Among the single-parent households, those with 3 or 4 children have the highest poverty rate, with 13 household (100.0%) living below poverty.
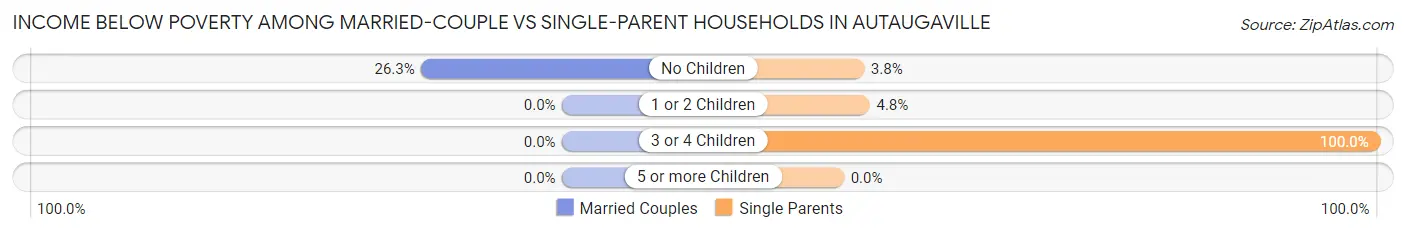
| Children | Married-Couple Families | Single-Parent Households |
| No Children | 21 (26.3%) | 2 (3.8%) |
| 1 or 2 Children | 0 (0.0%) | 4 (4.8%) |
| 3 or 4 Children | 0 (0.0%) | 13 (100.0%) |
| 5 or more Children | 0 (0.0%) | 0 (0.0%) |
| Total | 21 (23.3%) | 19 (12.8%) |
Race in Autaugaville
The most populous races in Autaugaville are Black / African American (829 | 79.2%), White / Caucasian (212 | 20.3%), and Two or more Races (6 | 0.6%).
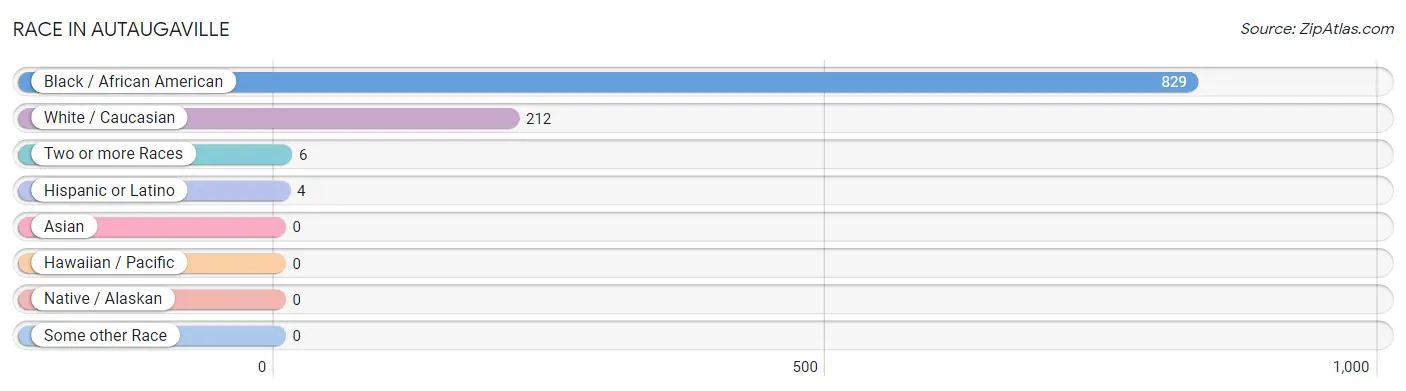
| Race | # Population | % Population |
| Asian | 0 | 0.0% |
| Black / African American | 829 | 79.2% |
| Hawaiian / Pacific | 0 | 0.0% |
| Hispanic or Latino | 4 | 0.4% |
| Native / Alaskan | 0 | 0.0% |
| White / Caucasian | 212 | 20.3% |
| Two or more Races | 6 | 0.6% |
| Some other Race | 0 | 0.0% |
| Total | 1,047 | 100.0% |
Ancestry in Autaugaville
The most populous ancestries reported in Autaugaville are American (134 | 12.8%), English (12 | 1.1%), German (10 | 1.0%), Irish (9 | 0.9%), and European (8 | 0.8%), together accounting for 16.5% of all Autaugaville residents.
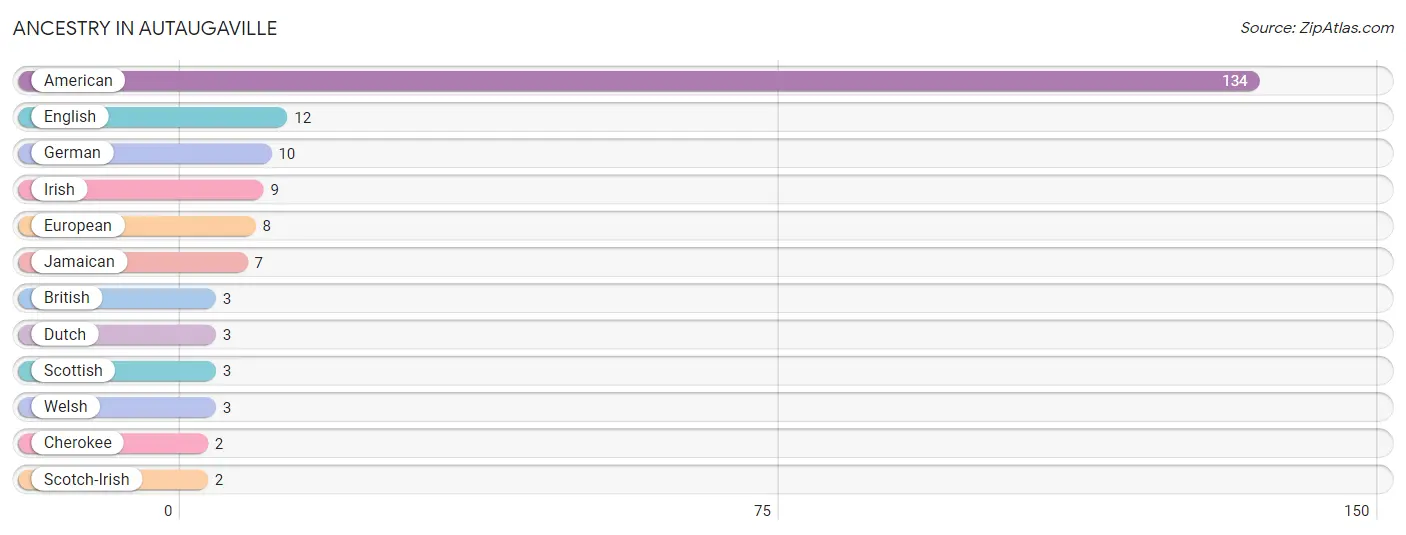
| Ancestry | # Population | % Population |
| American | 134 | 12.8% |
| British | 3 | 0.3% |
| Cherokee | 2 | 0.2% |
| Dutch | 3 | 0.3% |
| English | 12 | 1.1% |
| European | 8 | 0.8% |
| German | 10 | 1.0% |
| Irish | 9 | 0.9% |
| Jamaican | 7 | 0.7% |
| Scotch-Irish | 2 | 0.2% |
| Scottish | 3 | 0.3% |
| Welsh | 3 | 0.3% | View All 12 Rows |
Immigrants in Autaugaville
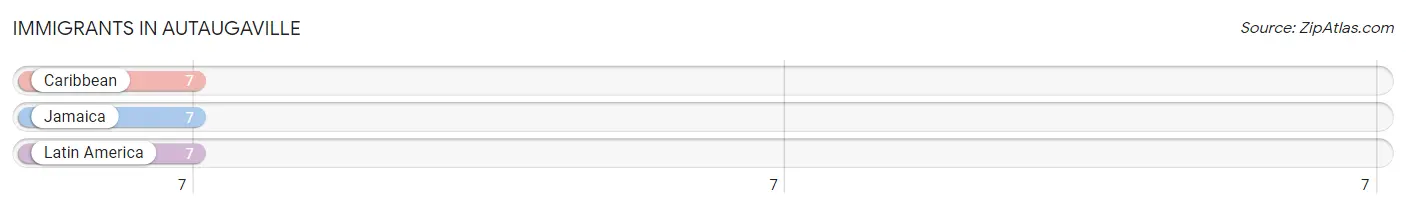
The most numerous immigrant groups reported in Autaugaville came from Caribbean (7 | 0.7%), Jamaica (7 | 0.7%), and Latin America (7 | 0.7%), together accounting for 2.0% of all Autaugaville residents.
| Immigration Origin | # Population | % Population |
| Caribbean | 7 | 0.7% |
| Jamaica | 7 | 0.7% |
| Latin America | 7 | 0.7% | View All 3 Rows |
Sex and Age in Autaugaville
Sex and Age in Autaugaville
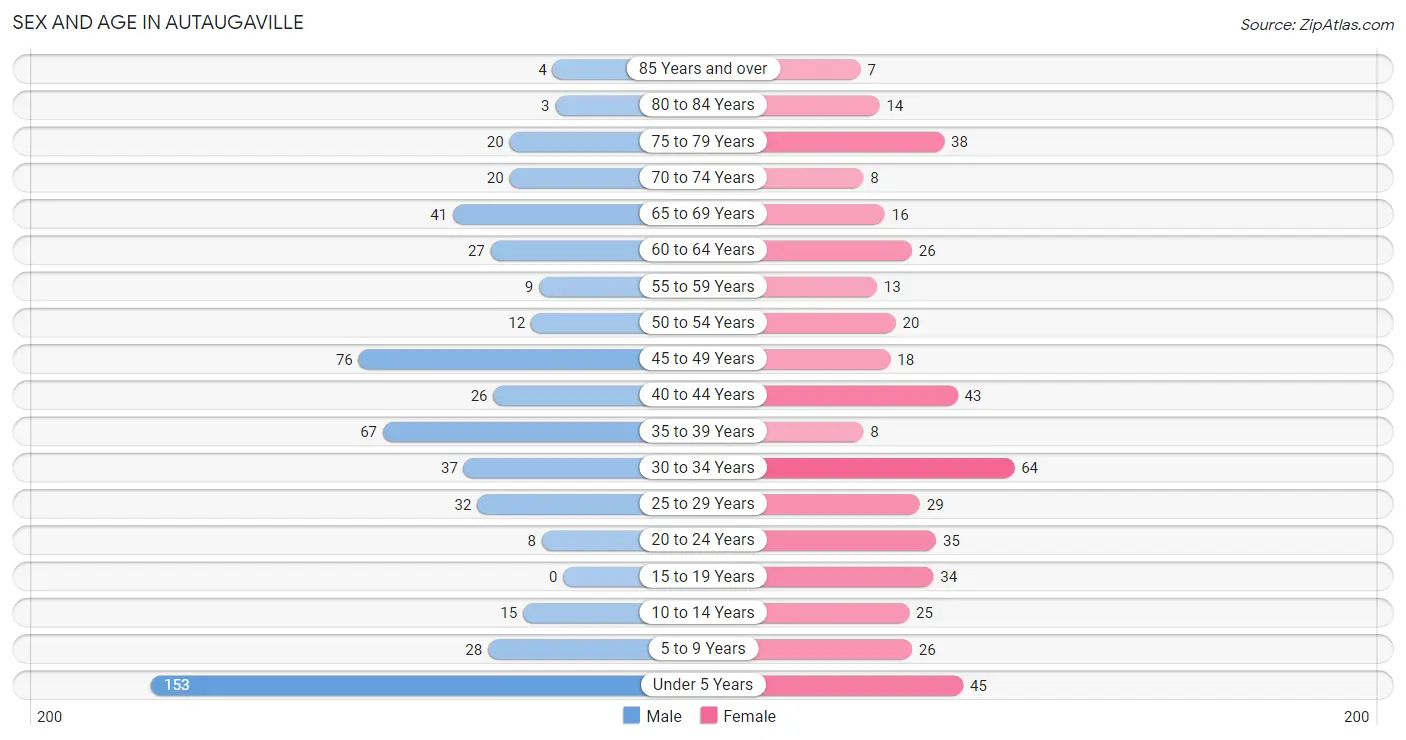
The most populous age groups in Autaugaville are Under 5 Years (153 | 26.5%) for men and 30 to 34 Years (64 | 13.7%) for women.
| Age Bracket | Male | Female |
| Under 5 Years | 153 (26.5%) | 45 (9.6%) |
| 5 to 9 Years | 28 (4.8%) | 26 (5.5%) |
| 10 to 14 Years | 15 (2.6%) | 25 (5.3%) |
| 15 to 19 Years | 0 (0.0%) | 34 (7.2%) |
| 20 to 24 Years | 8 (1.4%) | 35 (7.5%) |
| 25 to 29 Years | 32 (5.5%) | 29 (6.2%) |
| 30 to 34 Years | 37 (6.4%) | 64 (13.7%) |
| 35 to 39 Years | 67 (11.6%) | 8 (1.7%) |
| 40 to 44 Years | 26 (4.5%) | 43 (9.2%) |
| 45 to 49 Years | 76 (13.2%) | 18 (3.8%) |
| 50 to 54 Years | 12 (2.1%) | 20 (4.3%) |
| 55 to 59 Years | 9 (1.6%) | 13 (2.8%) |
| 60 to 64 Years | 27 (4.7%) | 26 (5.5%) |
| 65 to 69 Years | 41 (7.1%) | 16 (3.4%) |
| 70 to 74 Years | 20 (3.5%) | 8 (1.7%) |
| 75 to 79 Years | 20 (3.5%) | 38 (8.1%) |
| 80 to 84 Years | 3 (0.5%) | 14 (3.0%) |
| 85 Years and over | 4 (0.7%) | 7 (1.5%) |
| Total | 578 (100.0%) | 469 (100.0%) |
Families and Households in Autaugaville
Median Family Size in Autaugaville
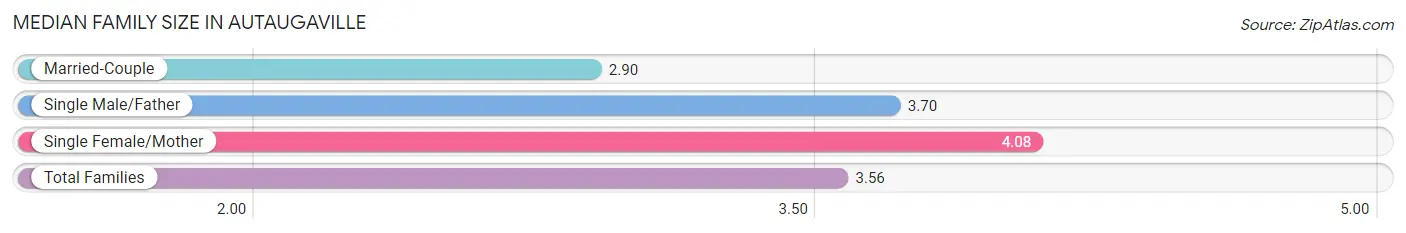
The median family size in Autaugaville is 3.56 persons per family, with single female/mother families (102 | 42.7%) accounting for the largest median family size of 4.08 persons per family. On the other hand, married-couple families (90 | 37.7%) represent the smallest median family size with 2.90 persons per family.
| Family Type | # Families | Family Size |
| Married-Couple | 90 (37.7%) | 2.90 |
| Single Male/Father | 47 (19.7%) | 3.70 |
| Single Female/Mother | 102 (42.7%) | 4.08 |
| Total Families | 239 (100.0%) | 3.56 |
Median Household Size in Autaugaville
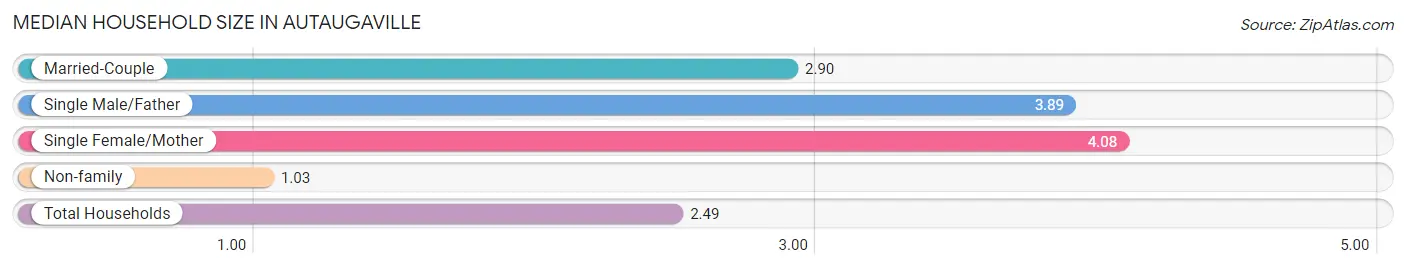
The median household size in Autaugaville is 2.49 persons per household, with single female/mother households (102 | 24.2%) accounting for the largest median household size of 4.08 persons per household. non-family households (182 | 43.2%) represent the smallest median household size with 1.03 persons per household.
| Household Type | # Households | Household Size |
| Married-Couple | 90 (21.4%) | 2.90 |
| Single Male/Father | 47 (11.2%) | 3.89 |
| Single Female/Mother | 102 (24.2%) | 4.08 |
| Non-family | 182 (43.2%) | 1.03 |
| Total Households | 421 (100.0%) | 2.49 |
Household Size by Marriage Status in Autaugaville
Out of a total of 421 households in Autaugaville, 239 (56.8%) are family households, while 182 (43.2%) are nonfamily households. The most numerous type of family households are 2-person households, comprising 99, and the most common type of nonfamily households are 1-person households, comprising 172.
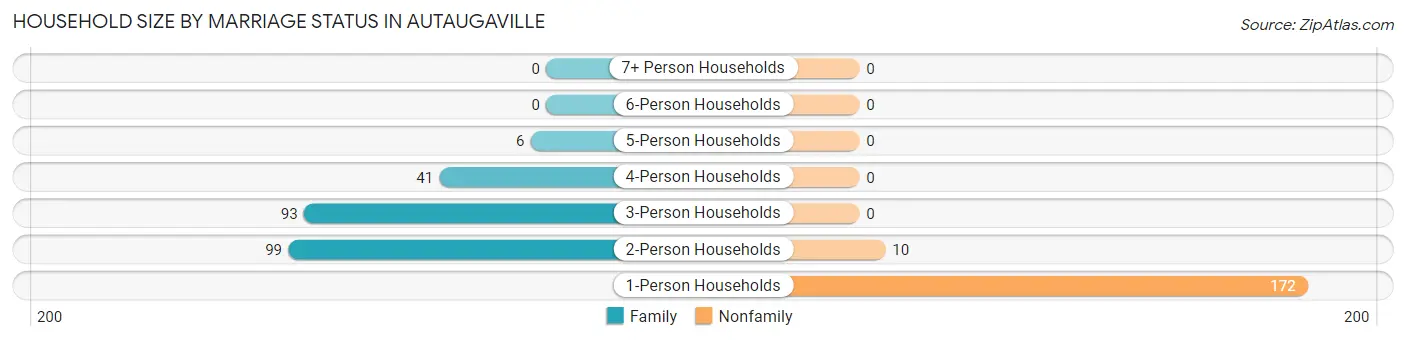
| Household Size | Family Households | Nonfamily Households |
| 1-Person Households | - | 172 (40.9%) |
| 2-Person Households | 99 (23.5%) | 10 (2.4%) |
| 3-Person Households | 93 (22.1%) | 0 (0.0%) |
| 4-Person Households | 41 (9.7%) | 0 (0.0%) |
| 5-Person Households | 6 (1.4%) | 0 (0.0%) |
| 6-Person Households | 0 (0.0%) | 0 (0.0%) |
| 7+ Person Households | 0 (0.0%) | 0 (0.0%) |
| Total | 239 (56.8%) | 182 (43.2%) |
Female Fertility in Autaugaville
Fertility by Age in Autaugaville
Average fertility rate in Autaugaville is 100.0 births per 1,000 women. Women in the age bracket of 20 to 34 years have the highest fertility rate with 172.0 births per 1,000 women. Women in the age bracket of 20 to 34 years acount for 91.7% of all women with births.
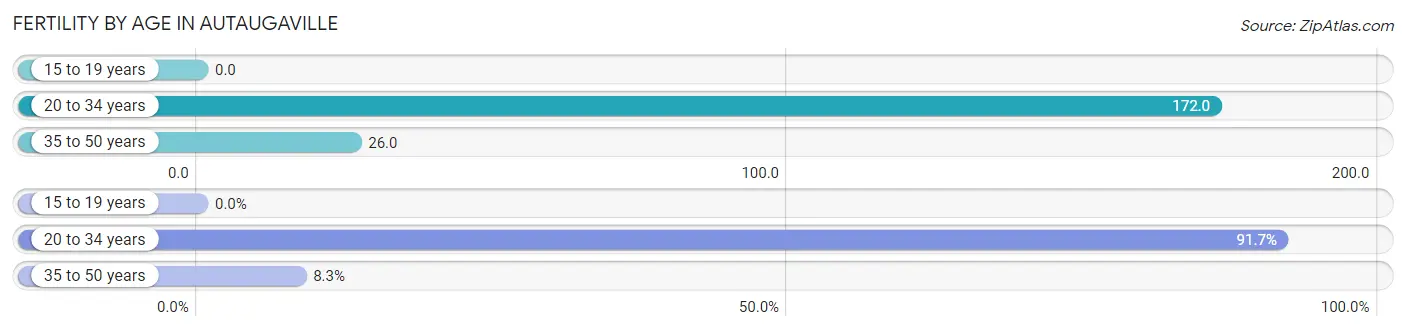
| Age Bracket | Women with Births | Births / 1,000 Women |
| 15 to 19 years | 0 (0.0%) | 0.0 |
| 20 to 34 years | 22 (91.7%) | 172.0 |
| 35 to 50 years | 2 (8.3%) | 26.0 |
| Total | 24 (100.0%) | 100.0 |
Fertility by Age by Marriage Status in Autaugaville
8.3% of women with births (24) in Autaugaville are married. The highest percentage of unmarried women with births falls into 20 to 34 years age bracket with 100.0% of them unmarried at the time of birth, while the lowest percentage of unmarried women with births belong to 35 to 50 years age bracket with 0.0% of them unmarried.
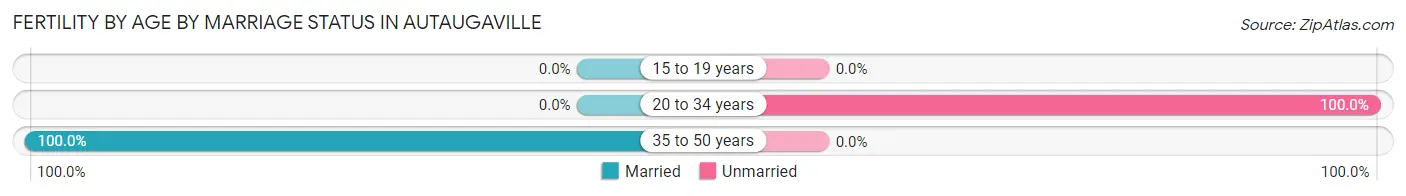
| Age Bracket | Married | Unmarried |
| 15 to 19 years | 0 (0.0%) | 0 (0.0%) |
| 20 to 34 years | 0 (0.0%) | 22 (100.0%) |
| 35 to 50 years | 2 (100.0%) | 0 (0.0%) |
| Total | 2 (8.3%) | 22 (91.7%) |
Fertility by Education in Autaugaville
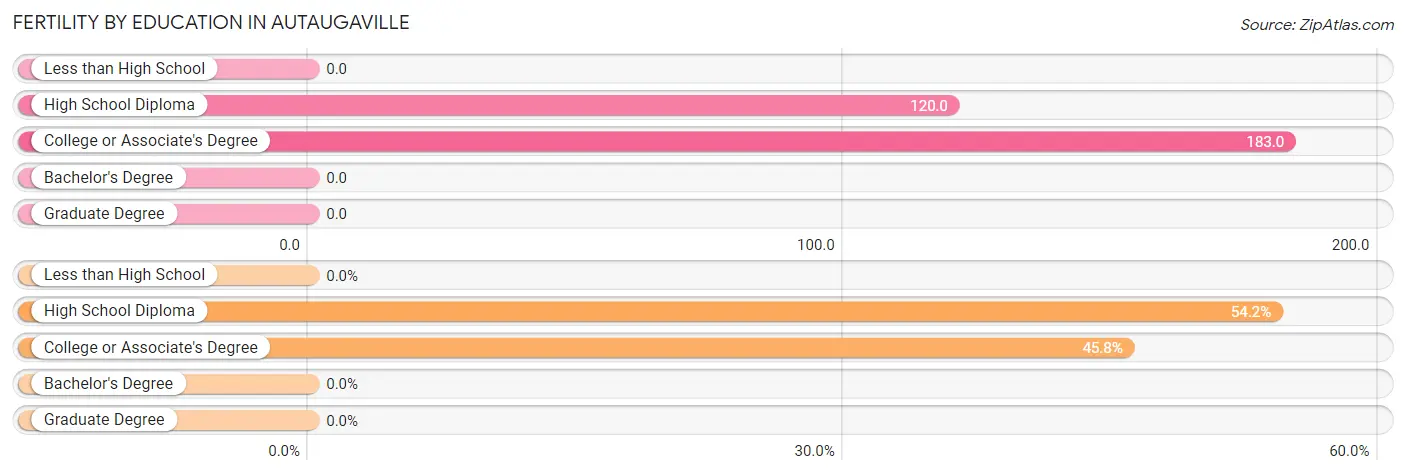
| Educational Attainment | Women with Births | Births / 1,000 Women |
| Less than High School | 0 (0.0%) | 0.0 |
| High School Diploma | 13 (54.2%) | 120.0 |
| College or Associate's Degree | 11 (45.8%) | 183.0 |
| Bachelor's Degree | 0 (0.0%) | 0.0 |
| Graduate Degree | 0 (0.0%) | 0.0 |
| Total | 24 (100.0%) | 100.0 |
Fertility by Education by Marriage Status in Autaugaville
91.7% of women with births in Autaugaville are unmarried. Women with the educational attainment of college or associate's degree are most likely to be married with 18.2% of them married at childbirth, while women with the educational attainment of high school diploma are least likely to be married with 100.0% of them unmarried at childbirth.
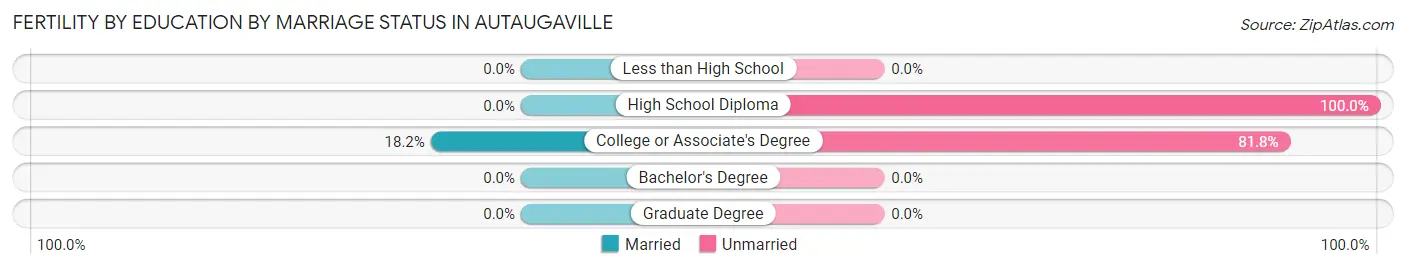
| Educational Attainment | Married | Unmarried |
| Less than High School | 0 (0.0%) | 0 (0.0%) |
| High School Diploma | 0 (0.0%) | 13 (100.0%) |
| College or Associate's Degree | 2 (18.2%) | 9 (81.8%) |
| Bachelor's Degree | 0 (0.0%) | 0 (0.0%) |
| Graduate Degree | 0 (0.0%) | 0 (0.0%) |
| Total | 2 (8.3%) | 22 (91.7%) |
Employment Characteristics in Autaugaville
Employment by Class of Employer in Autaugaville
Among the 348 employed individuals in Autaugaville, private company employees (267 | 76.7%), local government employees (26 | 7.5%), and not-for-profit organizations (16 | 4.6%) make up the most common classes of employment.
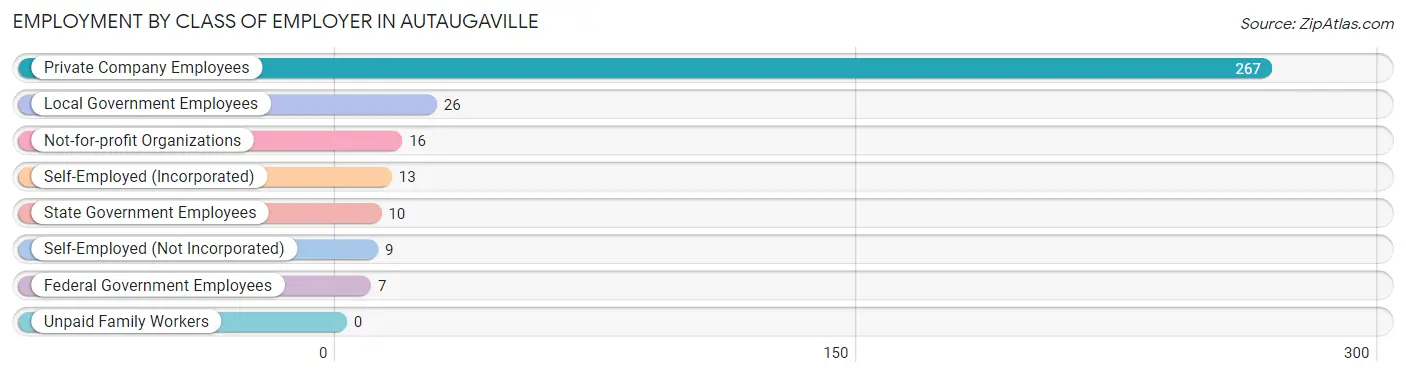
| Employer Class | # Employees | % Employees |
| Private Company Employees | 267 | 76.7% |
| Self-Employed (Incorporated) | 13 | 3.7% |
| Self-Employed (Not Incorporated) | 9 | 2.6% |
| Not-for-profit Organizations | 16 | 4.6% |
| Local Government Employees | 26 | 7.5% |
| State Government Employees | 10 | 2.9% |
| Federal Government Employees | 7 | 2.0% |
| Unpaid Family Workers | 0 | 0.0% |
| Total | 348 | 100.0% |
Employment Status by Age in Autaugaville
According to the labor force statistics for Autaugaville, out of the total population over 16 years of age (752), 54.4% or 409 individuals are in the labor force, with 8.1% or 33 of them unemployed. The age group with the highest labor force participation rate is 30 to 34 years, with 89.1% or 90 individuals in the labor force. Within the labor force, the 35 to 44 years age range has the highest percentage of unemployed individuals, with 18.9% or 18 of them being unemployed.
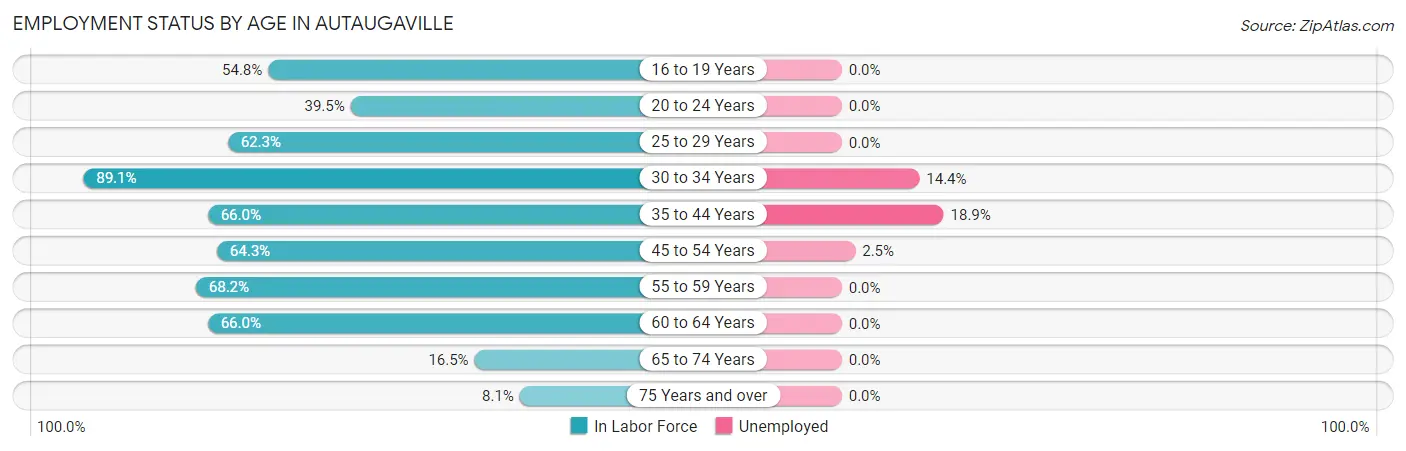
| Age Bracket | In Labor Force | Unemployed |
| 16 to 19 Years | 17 (54.8%) | 0 (0.0%) |
| 20 to 24 Years | 17 (39.5%) | 0 (0.0%) |
| 25 to 29 Years | 38 (62.3%) | 0 (0.0%) |
| 30 to 34 Years | 90 (89.1%) | 13 (14.4%) |
| 35 to 44 Years | 95 (66.0%) | 18 (18.9%) |
| 45 to 54 Years | 81 (64.3%) | 2 (2.5%) |
| 55 to 59 Years | 15 (68.2%) | 0 (0.0%) |
| 60 to 64 Years | 35 (66.0%) | 0 (0.0%) |
| 65 to 74 Years | 14 (16.5%) | 0 (0.0%) |
| 75 Years and over | 7 (8.1%) | 0 (0.0%) |
| Total | 409 (54.4%) | 33 (8.1%) |
Employment Status by Educational Attainment in Autaugaville
According to labor force statistics for Autaugaville, 69.8% of individuals (354) out of the total population between 25 and 64 years of age (507) are in the labor force, with 9.3% or 33 of them being unemployed. The group with the highest labor force participation rate are those with the educational attainment of bachelor's degree or higher, with 100.0% or 57 individuals in the labor force. Within the labor force, individuals with less than high school education have the highest percentage of unemployment, with 38.3% or 31 of them being unemployed.
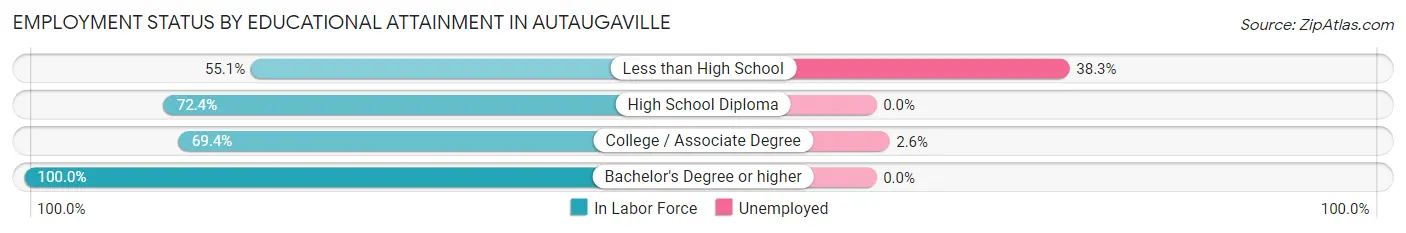
| Educational Attainment | In Labor Force | Unemployed |
| Less than High School | 81 (55.1%) | 56 (38.3%) |
| High School Diploma | 139 (72.4%) | 0 (0.0%) |
| College / Associate Degree | 77 (69.4%) | 3 (2.6%) |
| Bachelor's Degree or higher | 57 (100.0%) | 0 (0.0%) |
| Total | 354 (69.8%) | 47 (9.3%) |
Employment Occupations by Sex in Autaugaville
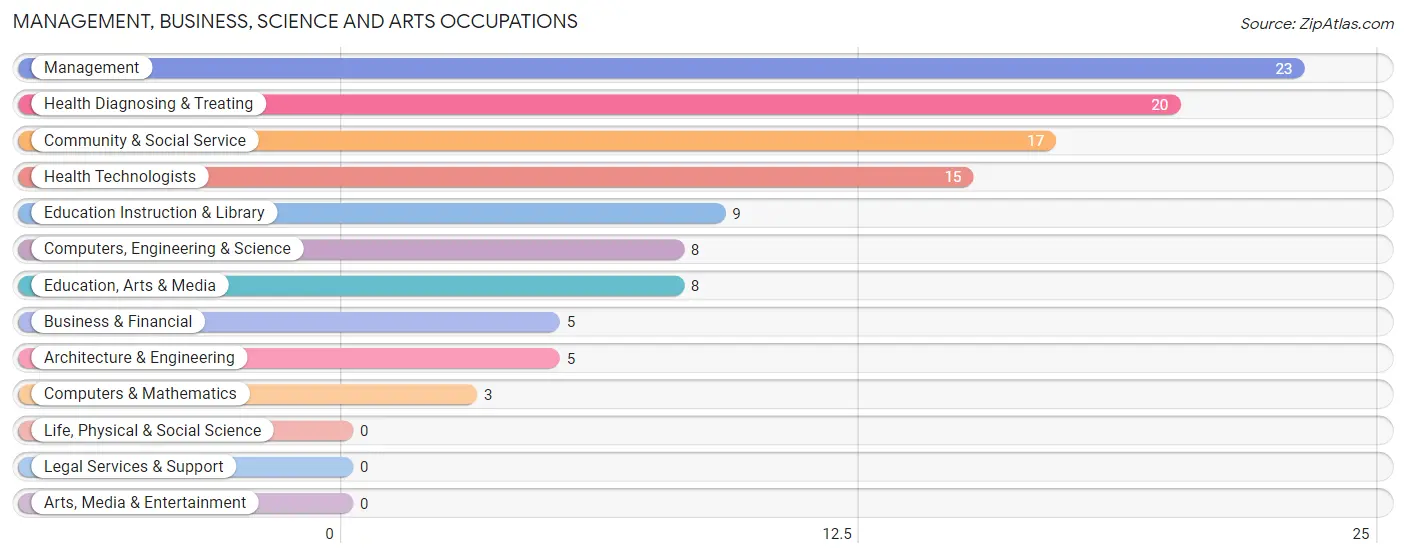
Management, Business, Science and Arts Occupations
The most common Management, Business, Science and Arts occupations in Autaugaville are Management (23 | 6.1%), Health Diagnosing & Treating (20 | 5.3%), Community & Social Service (17 | 4.5%), Health Technologists (15 | 4.0%), and Education Instruction & Library (9 | 2.4%).
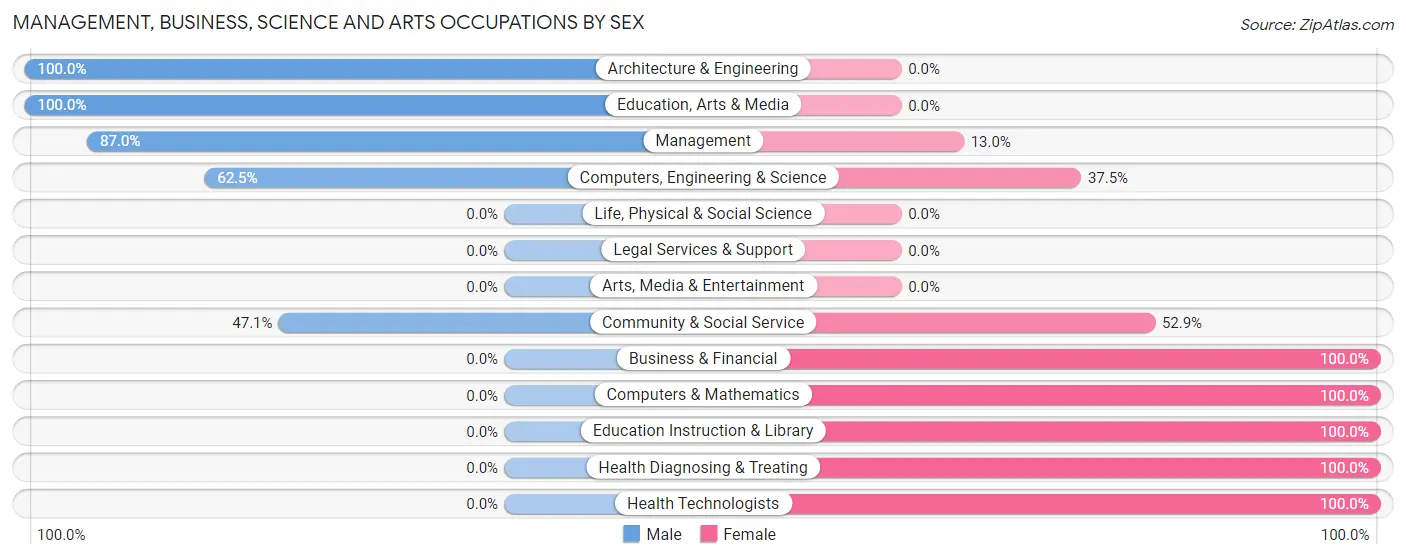
Management, Business, Science and Arts Occupations by Sex
Within the Management, Business, Science and Arts occupations in Autaugaville, the most male-oriented occupations are Architecture & Engineering (100.0%), Education, Arts & Media (100.0%), and Management (87.0%), while the most female-oriented occupations are Business & Financial (100.0%), Computers & Mathematics (100.0%), and Education Instruction & Library (100.0%).
| Occupation | Male | Female |
| Management | 20 (87.0%) | 3 (13.0%) |
| Business & Financial | 0 (0.0%) | 5 (100.0%) |
| Computers, Engineering & Science | 5 (62.5%) | 3 (37.5%) |
| Computers & Mathematics | 0 (0.0%) | 3 (100.0%) |
| Architecture & Engineering | 5 (100.0%) | 0 (0.0%) |
| Life, Physical & Social Science | 0 (0.0%) | 0 (0.0%) |
| Community & Social Service | 8 (47.1%) | 9 (52.9%) |
| Education, Arts & Media | 8 (100.0%) | 0 (0.0%) |
| Legal Services & Support | 0 (0.0%) | 0 (0.0%) |
| Education Instruction & Library | 0 (0.0%) | 9 (100.0%) |
| Arts, Media & Entertainment | 0 (0.0%) | 0 (0.0%) |
| Health Diagnosing & Treating | 0 (0.0%) | 20 (100.0%) |
| Health Technologists | 0 (0.0%) | 15 (100.0%) |
| Total (Category) | 33 (45.2%) | 40 (54.8%) |
| Total (Overall) | 171 (45.5%) | 205 (54.5%) |
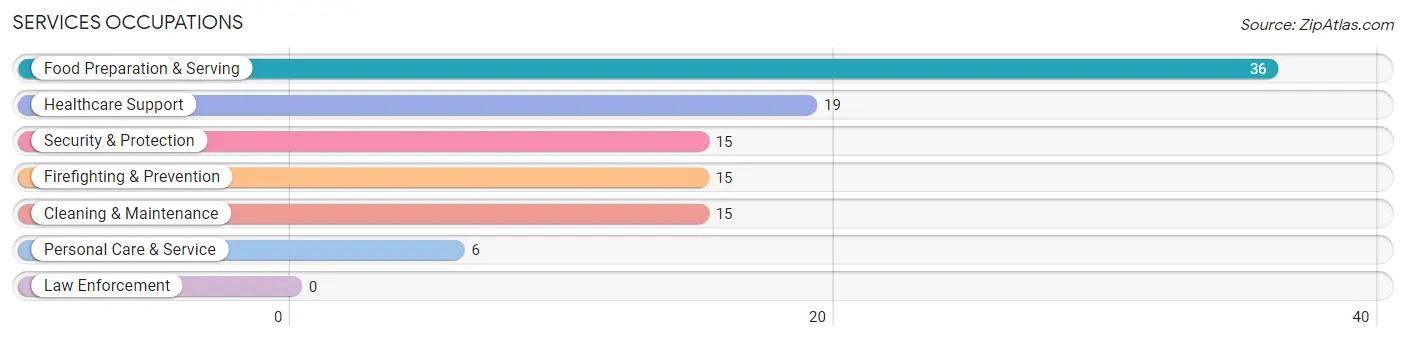
Services Occupations
The most common Services occupations in Autaugaville are Food Preparation & Serving (36 | 9.6%), Healthcare Support (19 | 5.1%), Security & Protection (15 | 4.0%), Firefighting & Prevention (15 | 4.0%), and Cleaning & Maintenance (15 | 4.0%).
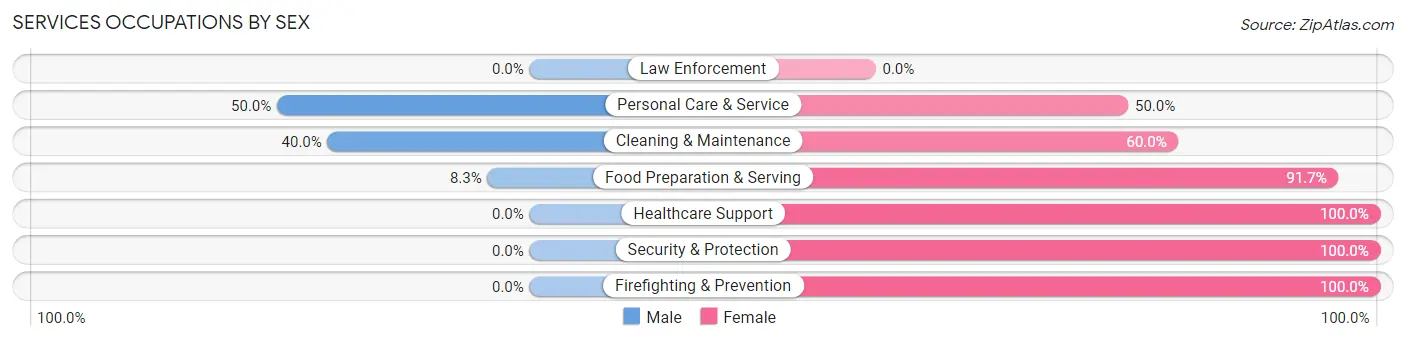
Services Occupations by Sex
Within the Services occupations in Autaugaville, the most male-oriented occupations are Personal Care & Service (50.0%), Cleaning & Maintenance (40.0%), and Food Preparation & Serving (8.3%), while the most female-oriented occupations are Healthcare Support (100.0%), Security & Protection (100.0%), and Firefighting & Prevention (100.0%).
| Occupation | Male | Female |
| Healthcare Support | 0 (0.0%) | 19 (100.0%) |
| Security & Protection | 0 (0.0%) | 15 (100.0%) |
| Firefighting & Prevention | 0 (0.0%) | 15 (100.0%) |
| Law Enforcement | 0 (0.0%) | 0 (0.0%) |
| Food Preparation & Serving | 3 (8.3%) | 33 (91.7%) |
| Cleaning & Maintenance | 6 (40.0%) | 9 (60.0%) |
| Personal Care & Service | 3 (50.0%) | 3 (50.0%) |
| Total (Category) | 12 (13.2%) | 79 (86.8%) |
| Total (Overall) | 171 (45.5%) | 205 (54.5%) |
Sales and Office Occupations
The most common Sales and Office occupations in Autaugaville are Sales & Related (16 | 4.3%), and Office & Administration (9 | 2.4%).
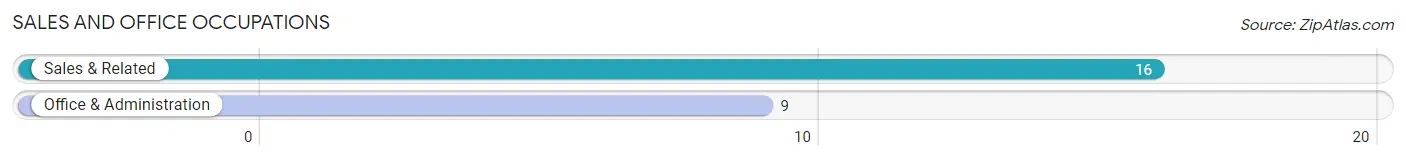
Sales and Office Occupations by Sex
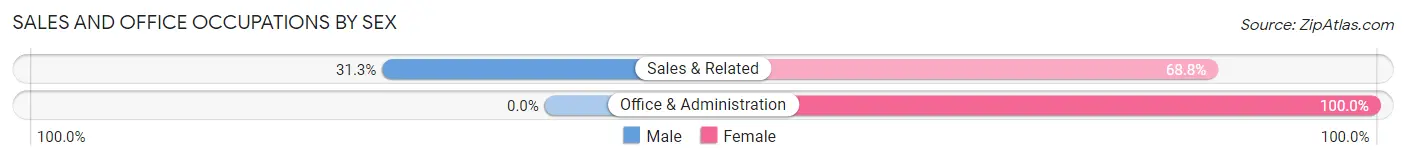
| Occupation | Male | Female |
| Sales & Related | 5 (31.2%) | 11 (68.8%) |
| Office & Administration | 0 (0.0%) | 9 (100.0%) |
| Total (Category) | 5 (20.0%) | 20 (80.0%) |
| Total (Overall) | 171 (45.5%) | 205 (54.5%) |
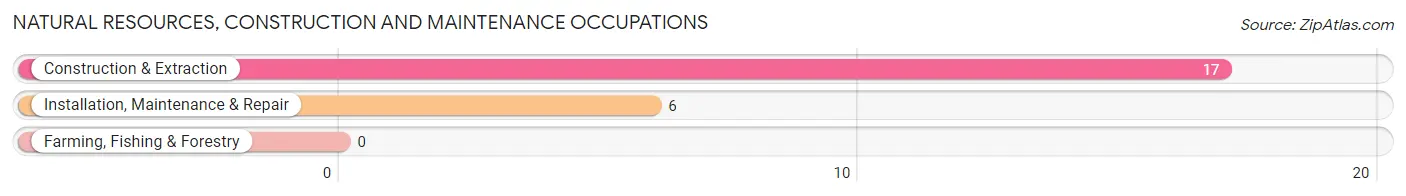
Natural Resources, Construction and Maintenance Occupations
The most common Natural Resources, Construction and Maintenance occupations in Autaugaville are Construction & Extraction (17 | 4.5%), and Installation, Maintenance & Repair (6 | 1.6%).
Natural Resources, Construction and Maintenance Occupations by Sex
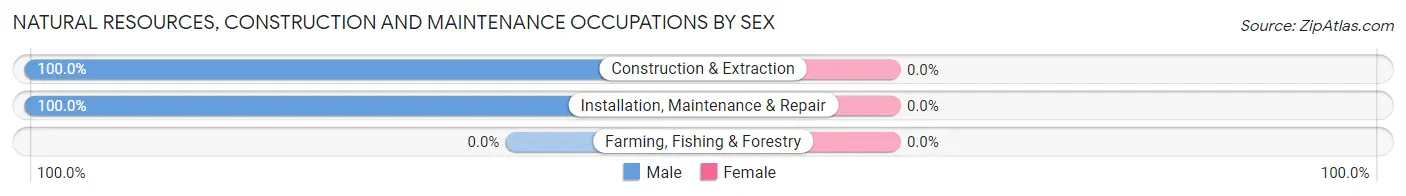
| Occupation | Male | Female |
| Farming, Fishing & Forestry | 0 (0.0%) | 0 (0.0%) |
| Construction & Extraction | 17 (100.0%) | 0 (0.0%) |
| Installation, Maintenance & Repair | 6 (100.0%) | 0 (0.0%) |
| Total (Category) | 23 (100.0%) | 0 (0.0%) |
| Total (Overall) | 171 (45.5%) | 205 (54.5%) |
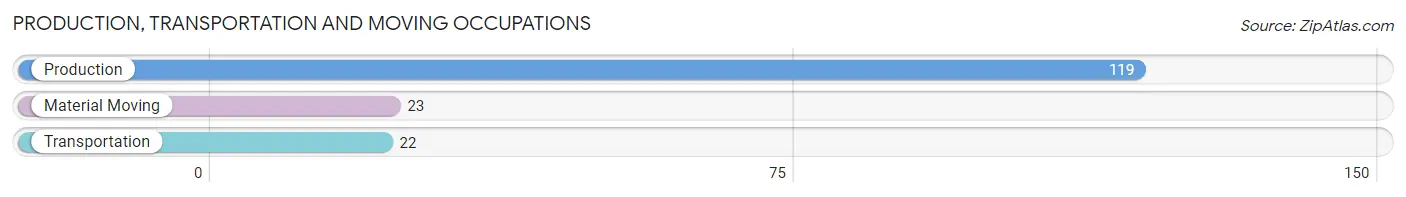
Production, Transportation and Moving Occupations
The most common Production, Transportation and Moving occupations in Autaugaville are Production (119 | 31.7%), Material Moving (23 | 6.1%), and Transportation (22 | 5.9%).
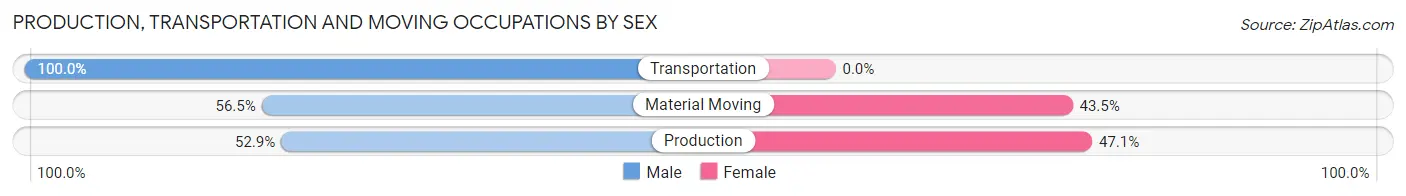
Production, Transportation and Moving Occupations by Sex
| Occupation | Male | Female |
| Production | 63 (52.9%) | 56 (47.1%) |
| Transportation | 22 (100.0%) | 0 (0.0%) |
| Material Moving | 13 (56.5%) | 10 (43.5%) |
| Total (Category) | 98 (59.8%) | 66 (40.2%) |
| Total (Overall) | 171 (45.5%) | 205 (54.5%) |
Employment Industries by Sex in Autaugaville
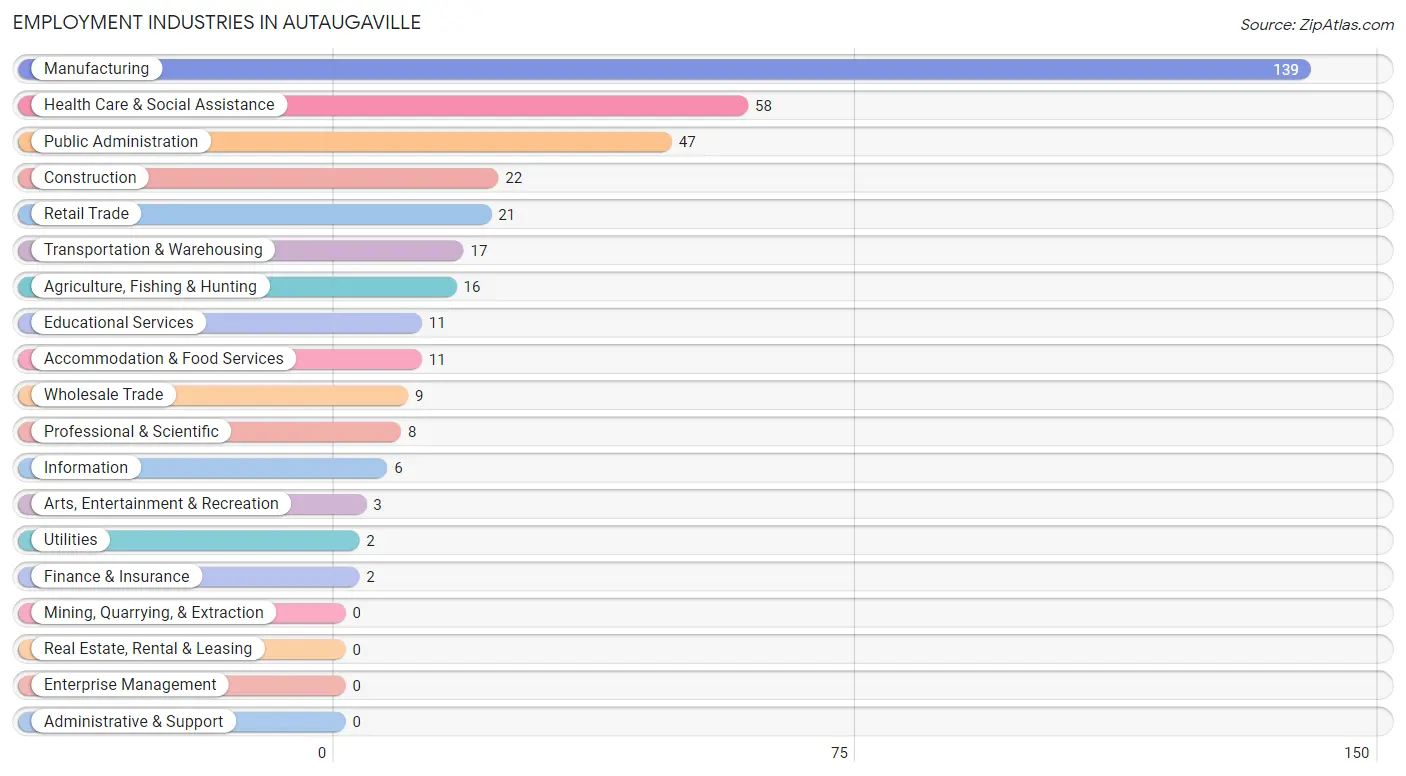
Employment Industries in Autaugaville
The major employment industries in Autaugaville include Manufacturing (139 | 37.0%), Health Care & Social Assistance (58 | 15.4%), Public Administration (47 | 12.5%), Construction (22 | 5.9%), and Retail Trade (21 | 5.6%).
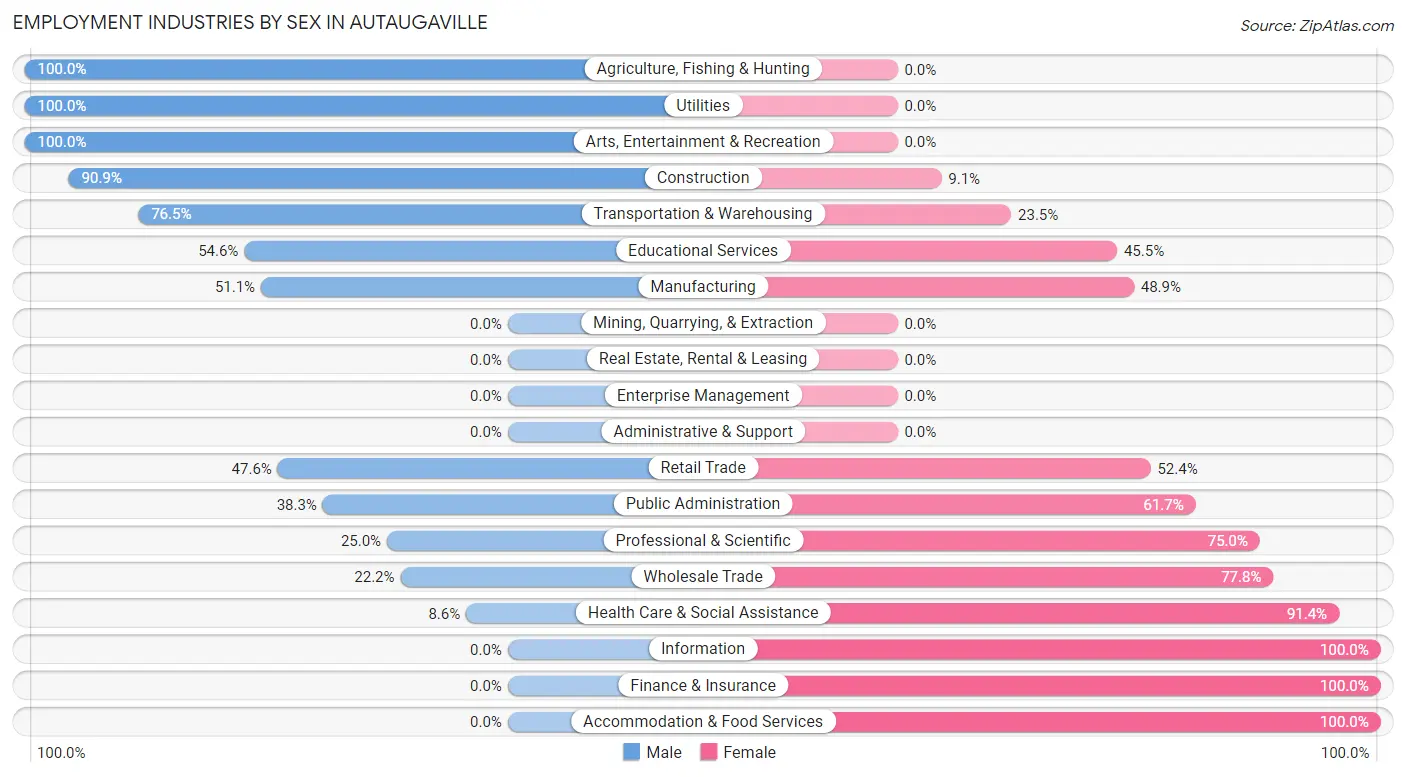
Employment Industries by Sex in Autaugaville
The Autaugaville industries that see more men than women are Agriculture, Fishing & Hunting (100.0%), Utilities (100.0%), and Arts, Entertainment & Recreation (100.0%), whereas the industries that tend to have a higher number of women are Information (100.0%), Finance & Insurance (100.0%), and Accommodation & Food Services (100.0%).
| Industry | Male | Female |
| Agriculture, Fishing & Hunting | 16 (100.0%) | 0 (0.0%) |
| Mining, Quarrying, & Extraction | 0 (0.0%) | 0 (0.0%) |
| Construction | 20 (90.9%) | 2 (9.1%) |
| Manufacturing | 71 (51.1%) | 68 (48.9%) |
| Wholesale Trade | 2 (22.2%) | 7 (77.8%) |
| Retail Trade | 10 (47.6%) | 11 (52.4%) |
| Transportation & Warehousing | 13 (76.5%) | 4 (23.5%) |
| Utilities | 2 (100.0%) | 0 (0.0%) |
| Information | 0 (0.0%) | 6 (100.0%) |
| Finance & Insurance | 0 (0.0%) | 2 (100.0%) |
| Real Estate, Rental & Leasing | 0 (0.0%) | 0 (0.0%) |
| Professional & Scientific | 2 (25.0%) | 6 (75.0%) |
| Enterprise Management | 0 (0.0%) | 0 (0.0%) |
| Administrative & Support | 0 (0.0%) | 0 (0.0%) |
| Educational Services | 6 (54.5%) | 5 (45.5%) |
| Health Care & Social Assistance | 5 (8.6%) | 53 (91.4%) |
| Arts, Entertainment & Recreation | 3 (100.0%) | 0 (0.0%) |
| Accommodation & Food Services | 0 (0.0%) | 11 (100.0%) |
| Public Administration | 18 (38.3%) | 29 (61.7%) |
| Total | 171 (45.5%) | 205 (54.5%) |
Education in Autaugaville
School Enrollment in Autaugaville
The most common levels of schooling among the 153 students in Autaugaville are elementary school (52 | 34.0%), middle school (40 | 26.1%), and college / undergraduate (32 | 20.9%).
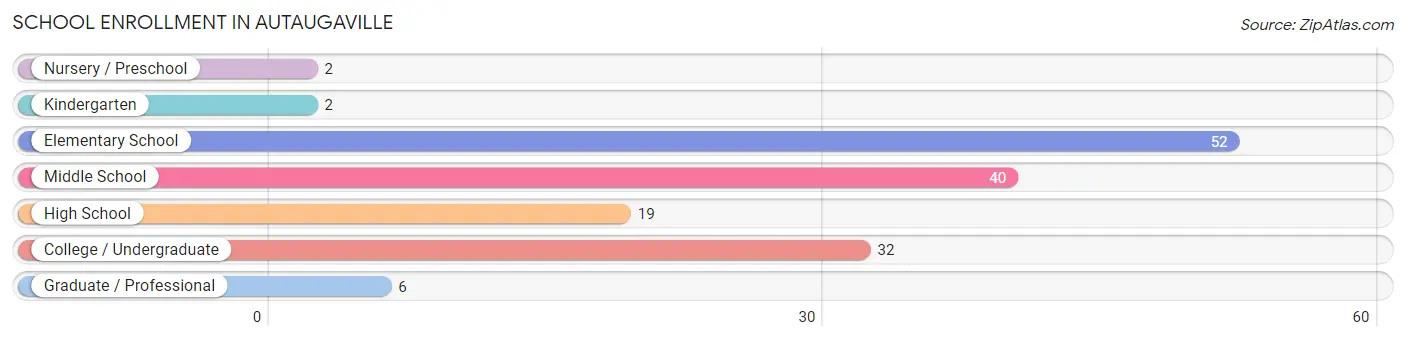
| School Level | # Students | % Students |
| Nursery / Preschool | 2 | 1.3% |
| Kindergarten | 2 | 1.3% |
| Elementary School | 52 | 34.0% |
| Middle School | 40 | 26.1% |
| High School | 19 | 12.4% |
| College / Undergraduate | 32 | 20.9% |
| Graduate / Professional | 6 | 3.9% |
| Total | 153 | 100.0% |
School Enrollment by Age by Funding Source in Autaugaville
Out of a total of 153 students who are enrolled in schools in Autaugaville, 4 (2.6%) attend a private institution, while the remaining 149 (97.4%) are enrolled in public schools. The age group of 3 to 4 year olds has the highest likelihood of being enrolled in private schools, with 2 (100.0% in the age bracket) enrolled. Conversely, the age group of 5 to 9 year old has the lowest likelihood of being enrolled in a private school, with 54 (100.0% in the age bracket) attending a public institution.
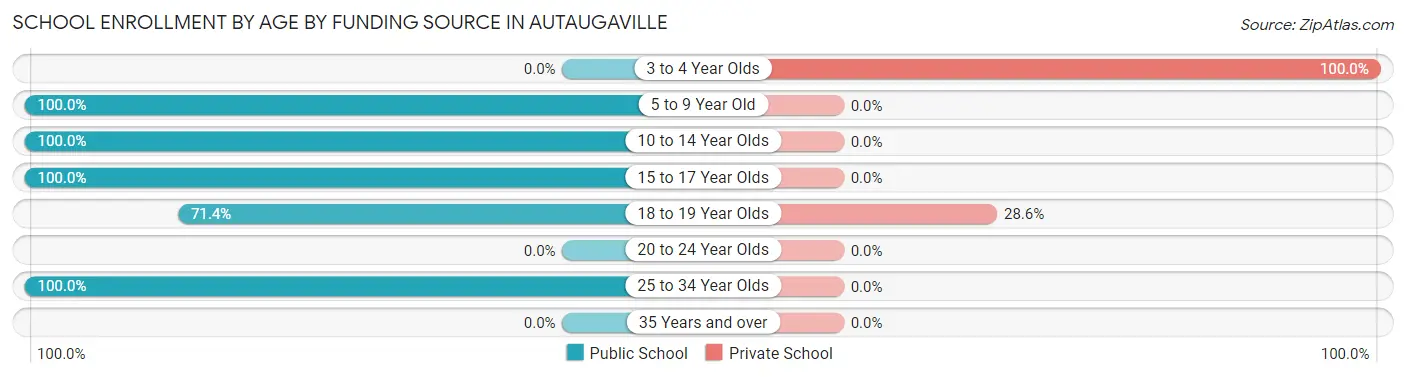
| Age Bracket | Public School | Private School |
| 3 to 4 Year Olds | 0 (0.0%) | 2 (100.0%) |
| 5 to 9 Year Old | 54 (100.0%) | 0 (0.0%) |
| 10 to 14 Year Olds | 40 (100.0%) | 0 (0.0%) |
| 15 to 17 Year Olds | 12 (100.0%) | 0 (0.0%) |
| 18 to 19 Year Olds | 5 (71.4%) | 2 (28.6%) |
| 20 to 24 Year Olds | 0 (0.0%) | 0 (0.0%) |
| 25 to 34 Year Olds | 38 (100.0%) | 0 (0.0%) |
| 35 Years and over | 0 (0.0%) | 0 (0.0%) |
| Total | 149 (97.4%) | 4 (2.6%) |
Educational Attainment by Field of Study in Autaugaville
Computers & mathematics (27 | 35.5%), business (11 | 14.5%), science & technology (9 | 11.8%), bio, nature & agricultural (7 | 9.2%), and communications (5 | 6.6%) are the most common fields of study among 76 individuals in Autaugaville who have obtained a bachelor's degree or higher.
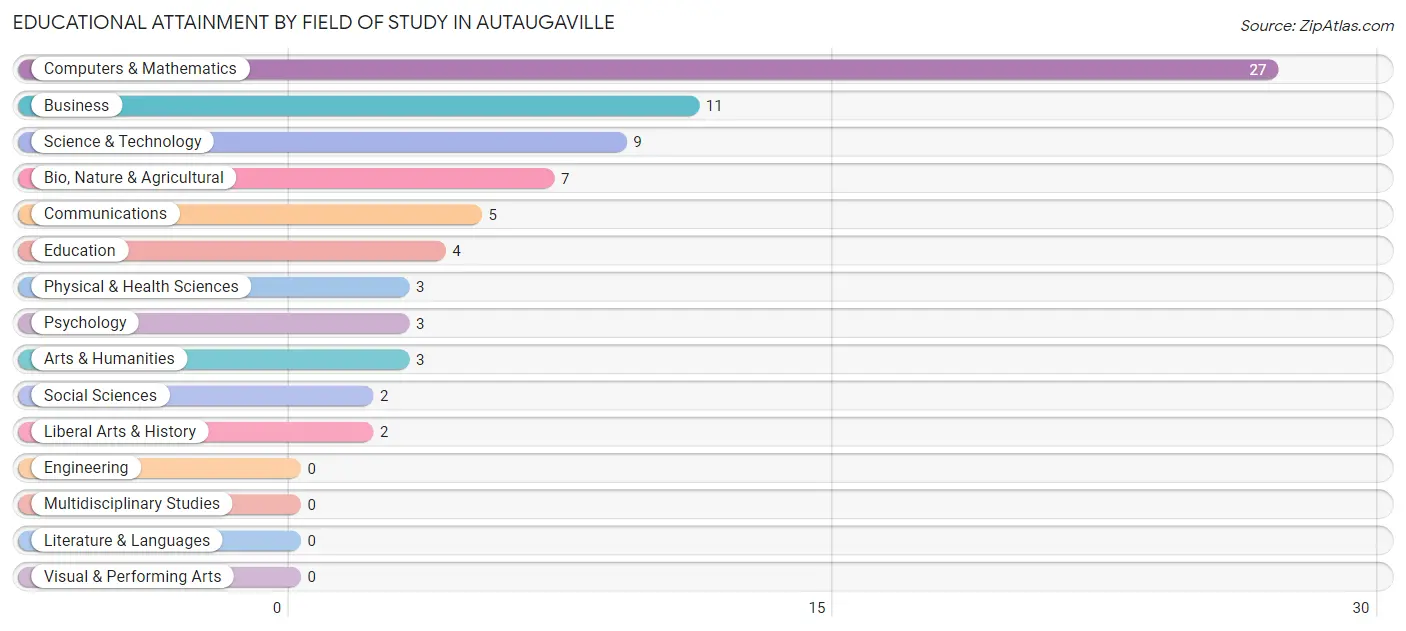
| Field of Study | # Graduates | % Graduates |
| Computers & Mathematics | 27 | 35.5% |
| Bio, Nature & Agricultural | 7 | 9.2% |
| Physical & Health Sciences | 3 | 4.0% |
| Psychology | 3 | 4.0% |
| Social Sciences | 2 | 2.6% |
| Engineering | 0 | 0.0% |
| Multidisciplinary Studies | 0 | 0.0% |
| Science & Technology | 9 | 11.8% |
| Business | 11 | 14.5% |
| Education | 4 | 5.3% |
| Literature & Languages | 0 | 0.0% |
| Liberal Arts & History | 2 | 2.6% |
| Visual & Performing Arts | 0 | 0.0% |
| Communications | 5 | 6.6% |
| Arts & Humanities | 3 | 4.0% |
| Total | 76 | 100.0% |
Transportation & Commute in Autaugaville
Vehicle Availability by Sex in Autaugaville
The most prevalent vehicle ownership categories in Autaugaville are males with 1 vehicle (60, accounting for 35.1%) and females with 1 vehicle (50, making up 33.9%).
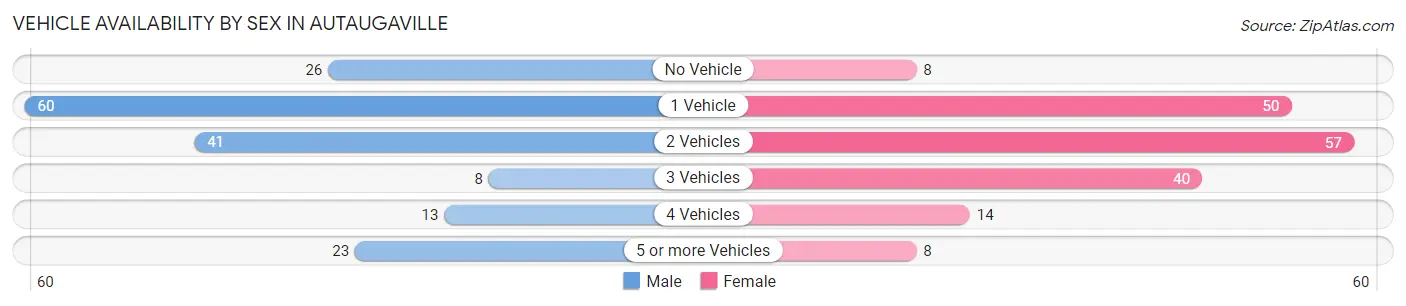
| Vehicles Available | Male | Female |
| No Vehicle | 26 (15.2%) | 8 (4.5%) |
| 1 Vehicle | 60 (35.1%) | 50 (28.2%) |
| 2 Vehicles | 41 (24.0%) | 57 (32.2%) |
| 3 Vehicles | 8 (4.7%) | 40 (22.6%) |
| 4 Vehicles | 13 (7.6%) | 14 (7.9%) |
| 5 or more Vehicles | 23 (13.5%) | 8 (4.5%) |
| Total | 171 (100.0%) | 177 (100.0%) |
Commute Time in Autaugaville
The most frequently occuring commute durations in Autaugaville are 30 to 34 minutes (112 commuters, 33.9%), 10 to 14 minutes (39 commuters, 11.8%), and 15 to 19 minutes (31 commuters, 9.4%).
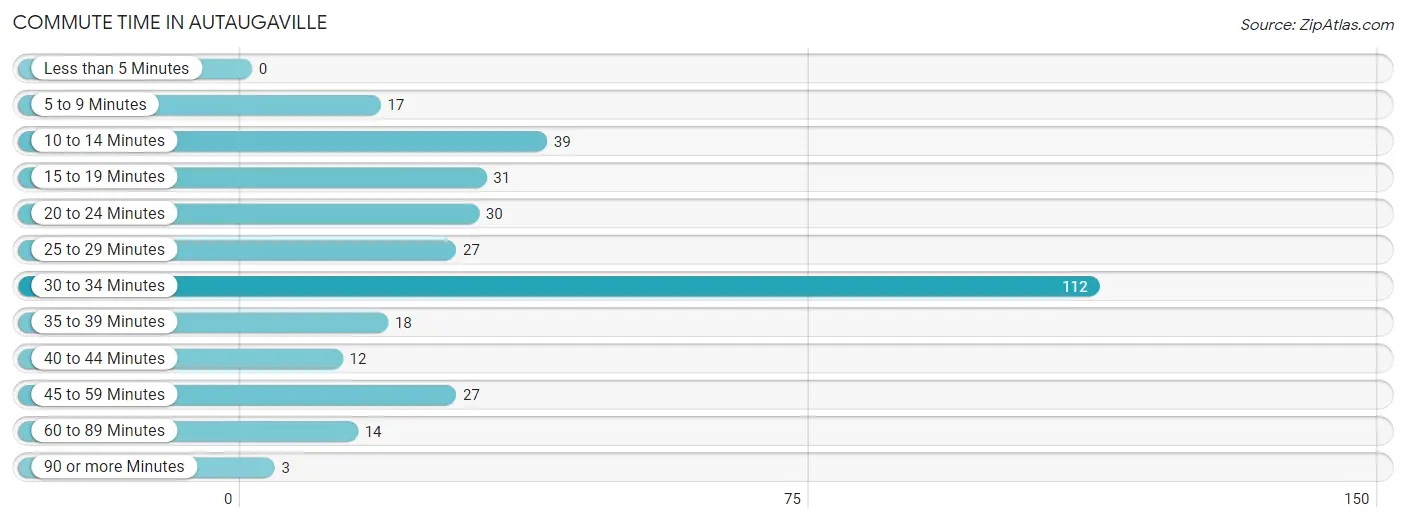
| Commute Time | # Commuters | % Commuters |
| Less than 5 Minutes | 0 | 0.0% |
| 5 to 9 Minutes | 17 | 5.1% |
| 10 to 14 Minutes | 39 | 11.8% |
| 15 to 19 Minutes | 31 | 9.4% |
| 20 to 24 Minutes | 30 | 9.1% |
| 25 to 29 Minutes | 27 | 8.2% |
| 30 to 34 Minutes | 112 | 33.9% |
| 35 to 39 Minutes | 18 | 5.4% |
| 40 to 44 Minutes | 12 | 3.6% |
| 45 to 59 Minutes | 27 | 8.2% |
| 60 to 89 Minutes | 14 | 4.2% |
| 90 or more Minutes | 3 | 0.9% |
Commute Time by Sex in Autaugaville
The most common commute times in Autaugaville are 30 to 34 minutes (41 commuters, 25.3%) for males and 30 to 34 minutes (71 commuters, 42.3%) for females.
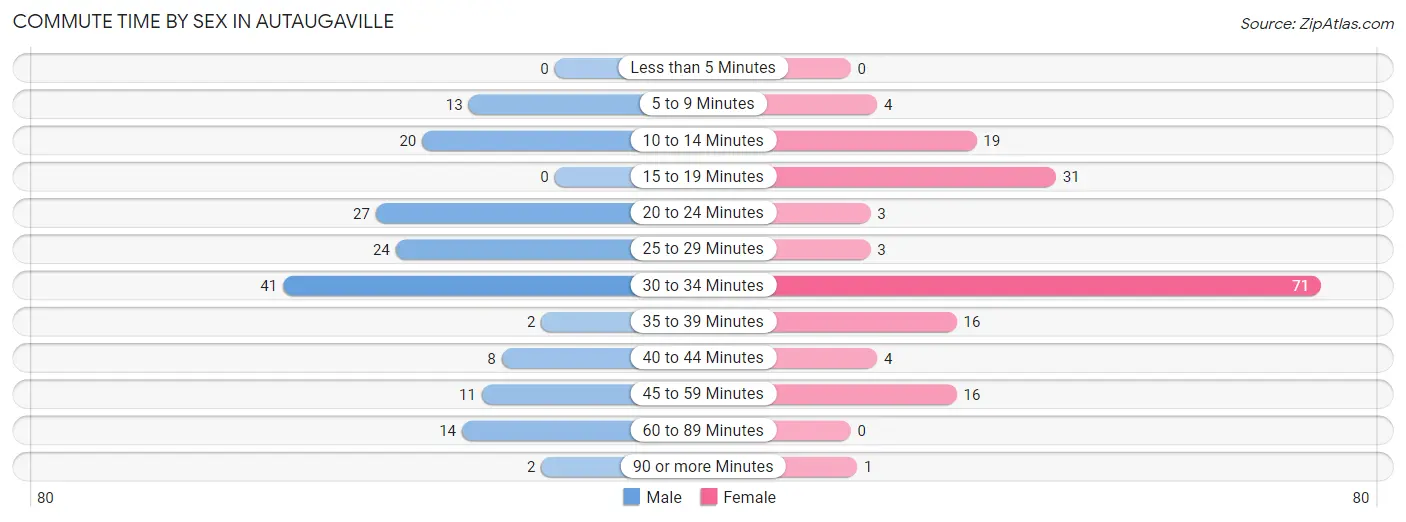
| Commute Time | Male | Female |
| Less than 5 Minutes | 0 (0.0%) | 0 (0.0%) |
| 5 to 9 Minutes | 13 (8.0%) | 4 (2.4%) |
| 10 to 14 Minutes | 20 (12.3%) | 19 (11.3%) |
| 15 to 19 Minutes | 0 (0.0%) | 31 (18.4%) |
| 20 to 24 Minutes | 27 (16.7%) | 3 (1.8%) |
| 25 to 29 Minutes | 24 (14.8%) | 3 (1.8%) |
| 30 to 34 Minutes | 41 (25.3%) | 71 (42.3%) |
| 35 to 39 Minutes | 2 (1.2%) | 16 (9.5%) |
| 40 to 44 Minutes | 8 (4.9%) | 4 (2.4%) |
| 45 to 59 Minutes | 11 (6.8%) | 16 (9.5%) |
| 60 to 89 Minutes | 14 (8.6%) | 0 (0.0%) |
| 90 or more Minutes | 2 (1.2%) | 1 (0.6%) |
Time of Departure to Work by Sex in Autaugaville
The most frequent times of departure to work in Autaugaville are 5:30 AM to 5:59 AM (39, 24.1%) for males and 7:30 AM to 7:59 AM (39, 23.2%) for females.
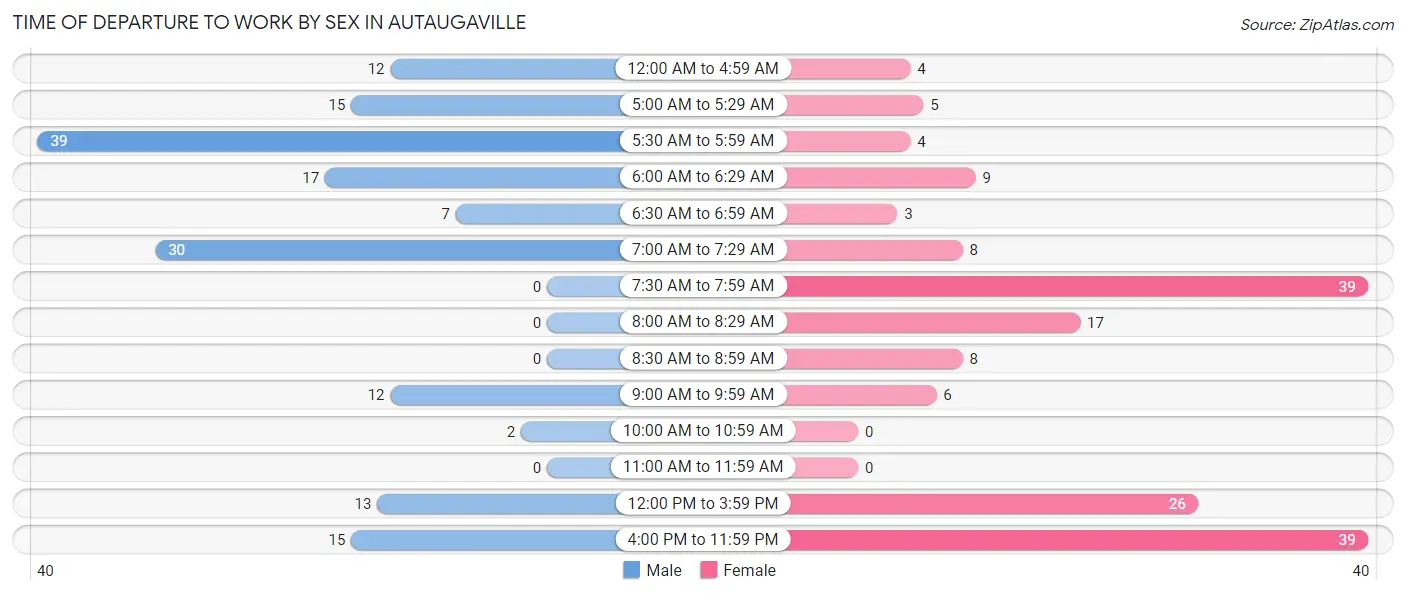
| Time of Departure | Male | Female |
| 12:00 AM to 4:59 AM | 12 (7.4%) | 4 (2.4%) |
| 5:00 AM to 5:29 AM | 15 (9.3%) | 5 (3.0%) |
| 5:30 AM to 5:59 AM | 39 (24.1%) | 4 (2.4%) |
| 6:00 AM to 6:29 AM | 17 (10.5%) | 9 (5.4%) |
| 6:30 AM to 6:59 AM | 7 (4.3%) | 3 (1.8%) |
| 7:00 AM to 7:29 AM | 30 (18.5%) | 8 (4.8%) |
| 7:30 AM to 7:59 AM | 0 (0.0%) | 39 (23.2%) |
| 8:00 AM to 8:29 AM | 0 (0.0%) | 17 (10.1%) |
| 8:30 AM to 8:59 AM | 0 (0.0%) | 8 (4.8%) |
| 9:00 AM to 9:59 AM | 12 (7.4%) | 6 (3.6%) |
| 10:00 AM to 10:59 AM | 2 (1.2%) | 0 (0.0%) |
| 11:00 AM to 11:59 AM | 0 (0.0%) | 0 (0.0%) |
| 12:00 PM to 3:59 PM | 13 (8.0%) | 26 (15.5%) |
| 4:00 PM to 11:59 PM | 15 (9.3%) | 39 (23.2%) |
| Total | 162 (100.0%) | 168 (100.0%) |
Housing Occupancy in Autaugaville
Occupancy by Ownership in Autaugaville
Of the total 421 dwellings in Autaugaville, owner-occupied units account for 271 (64.4%), while renter-occupied units make up 150 (35.6%).
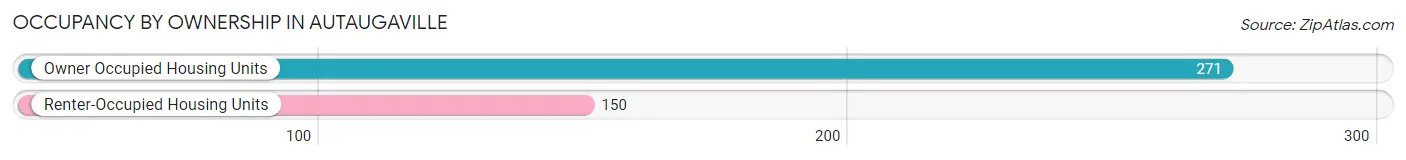
| Occupancy | # Housing Units | % Housing Units |
| Owner Occupied Housing Units | 271 | 64.4% |
| Renter-Occupied Housing Units | 150 | 35.6% |
| Total Occupied Housing Units | 421 | 100.0% |
Occupancy by Household Size in Autaugaville
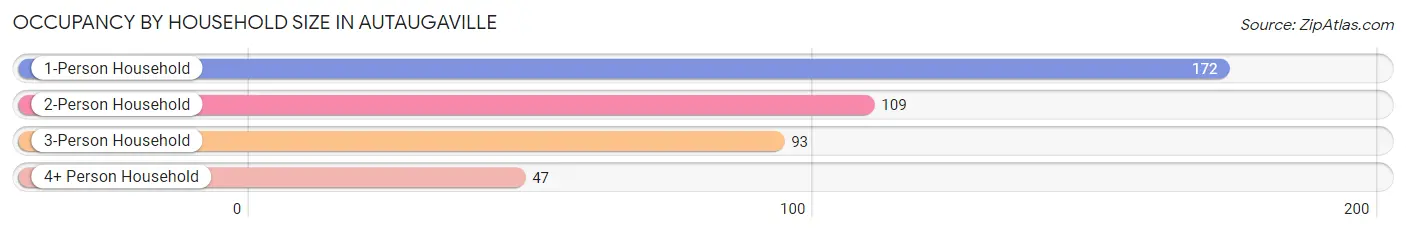
| Household Size | # Housing Units | % Housing Units |
| 1-Person Household | 172 | 40.9% |
| 2-Person Household | 109 | 25.9% |
| 3-Person Household | 93 | 22.1% |
| 4+ Person Household | 47 | 11.2% |
| Total Housing Units | 421 | 100.0% |
Occupancy by Ownership by Household Size in Autaugaville
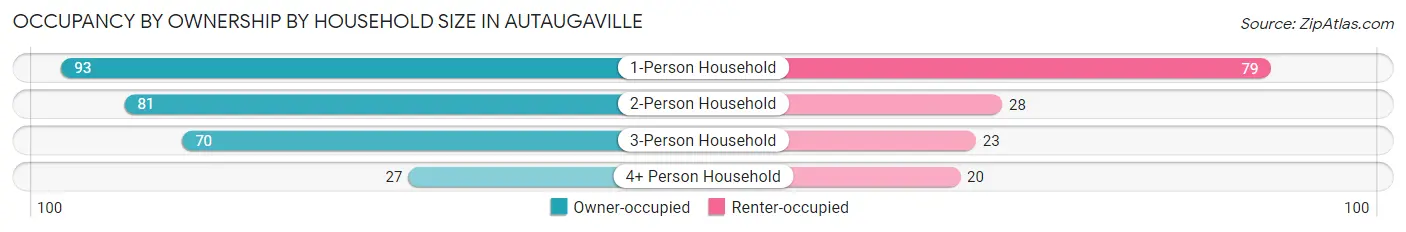
| Household Size | Owner-occupied | Renter-occupied |
| 1-Person Household | 93 (54.1%) | 79 (45.9%) |
| 2-Person Household | 81 (74.3%) | 28 (25.7%) |
| 3-Person Household | 70 (75.3%) | 23 (24.7%) |
| 4+ Person Household | 27 (57.5%) | 20 (42.5%) |
| Total Housing Units | 271 (64.4%) | 150 (35.6%) |
Occupancy by Educational Attainment in Autaugaville
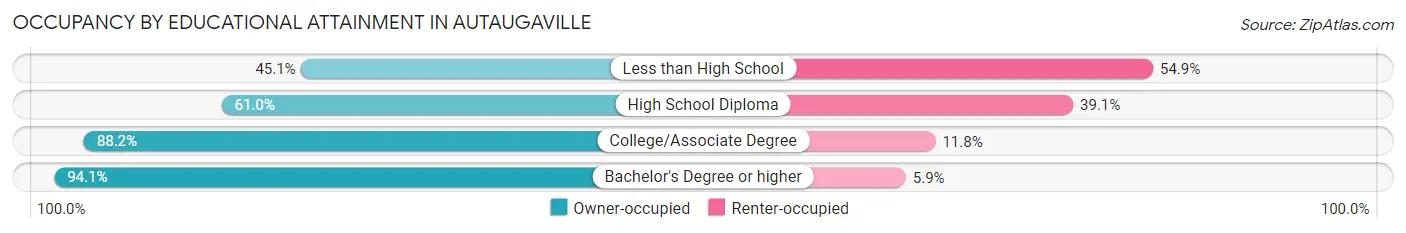
| Household Size | Owner-occupied | Renter-occupied |
| Less than High School | 60 (45.1%) | 73 (54.9%) |
| High School Diploma | 103 (61.0%) | 66 (39.1%) |
| College/Associate Degree | 60 (88.2%) | 8 (11.8%) |
| Bachelor's Degree or higher | 48 (94.1%) | 3 (5.9%) |
Occupancy by Age of Householder in Autaugaville
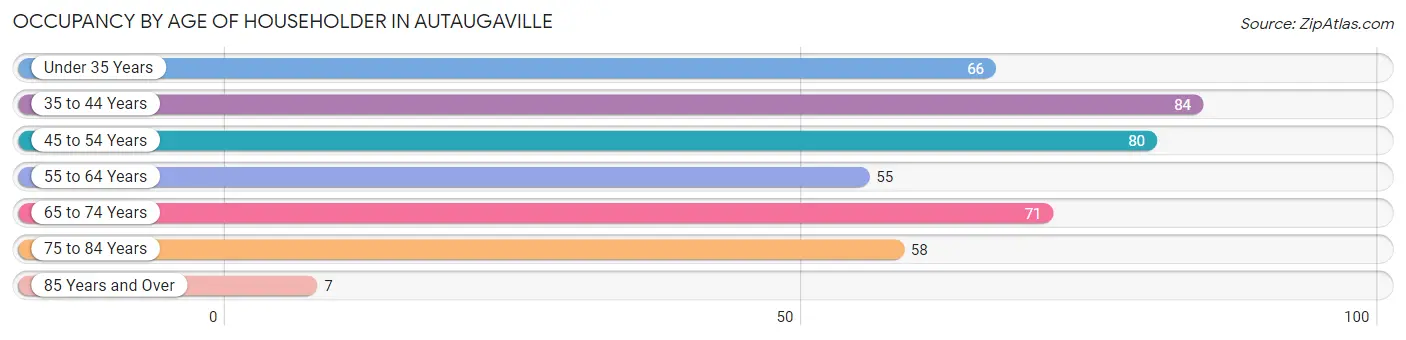
| Age Bracket | # Households | % Households |
| Under 35 Years | 66 | 15.7% |
| 35 to 44 Years | 84 | 20.0% |
| 45 to 54 Years | 80 | 19.0% |
| 55 to 64 Years | 55 | 13.1% |
| 65 to 74 Years | 71 | 16.9% |
| 75 to 84 Years | 58 | 13.8% |
| 85 Years and Over | 7 | 1.7% |
| Total | 421 | 100.0% |
Housing Finances in Autaugaville
Median Income by Occupancy in Autaugaville
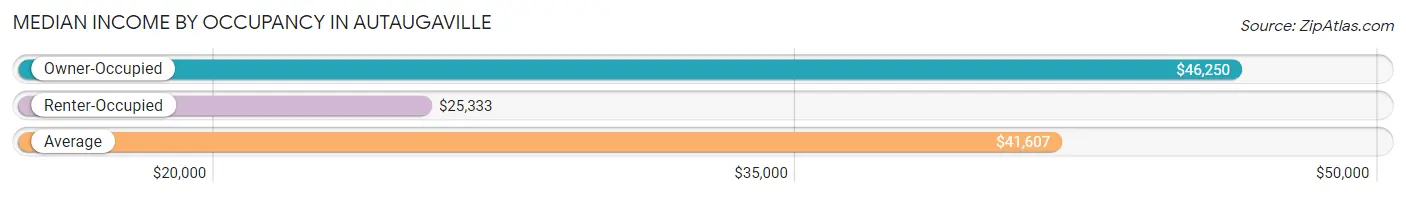
| Occupancy Type | # Households | Median Income |
| Owner-Occupied | 271 (64.4%) | $46,250 |
| Renter-Occupied | 150 (35.6%) | $25,333 |
| Average | 421 (100.0%) | $41,607 |
Occupancy by Householder Income Bracket in Autaugaville
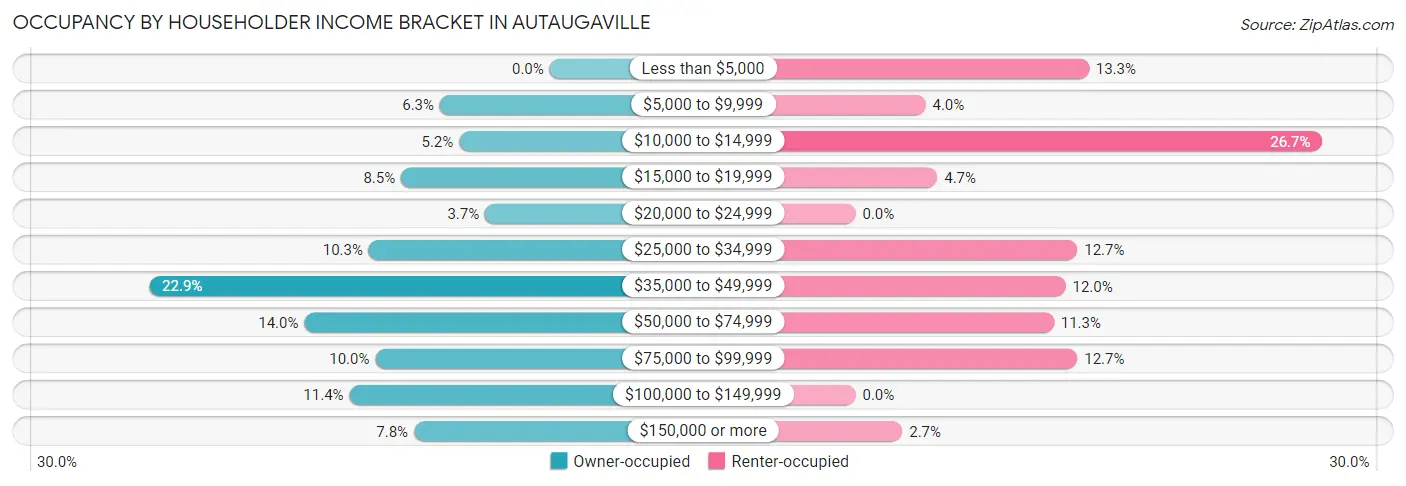
| Income Bracket | Owner-occupied | Renter-occupied |
| Less than $5,000 | 0 (0.0%) | 20 (13.3%) |
| $5,000 to $9,999 | 17 (6.3%) | 6 (4.0%) |
| $10,000 to $14,999 | 14 (5.2%) | 40 (26.7%) |
| $15,000 to $19,999 | 23 (8.5%) | 7 (4.7%) |
| $20,000 to $24,999 | 10 (3.7%) | 0 (0.0%) |
| $25,000 to $34,999 | 28 (10.3%) | 19 (12.7%) |
| $35,000 to $49,999 | 62 (22.9%) | 18 (12.0%) |
| $50,000 to $74,999 | 38 (14.0%) | 17 (11.3%) |
| $75,000 to $99,999 | 27 (10.0%) | 19 (12.7%) |
| $100,000 to $149,999 | 31 (11.4%) | 0 (0.0%) |
| $150,000 or more | 21 (7.7%) | 4 (2.7%) |
| Total | 271 (100.0%) | 150 (100.0%) |
Monthly Housing Cost Tiers in Autaugaville
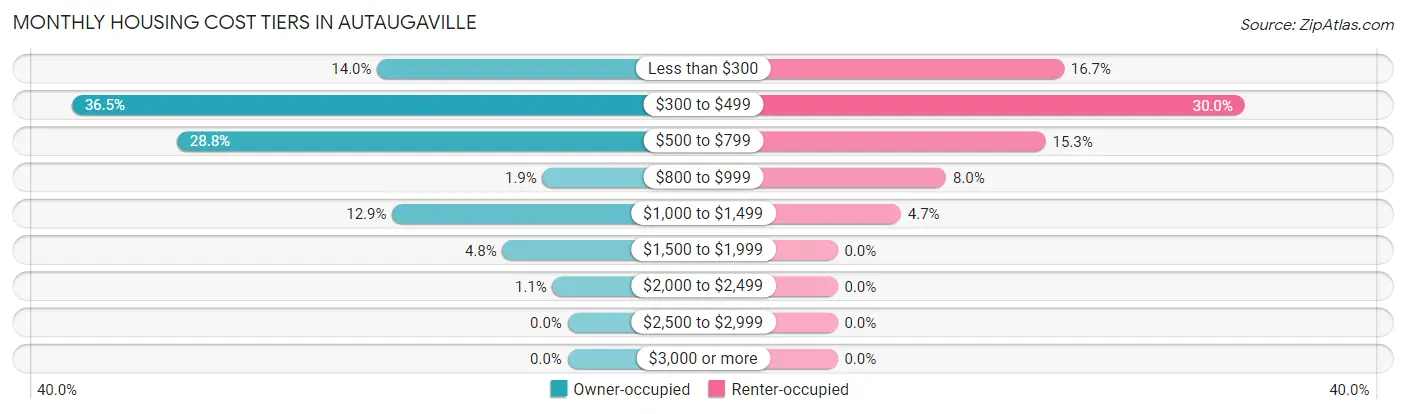
| Monthly Cost | Owner-occupied | Renter-occupied |
| Less than $300 | 38 (14.0%) | 25 (16.7%) |
| $300 to $499 | 99 (36.5%) | 45 (30.0%) |
| $500 to $799 | 78 (28.8%) | 23 (15.3%) |
| $800 to $999 | 5 (1.8%) | 12 (8.0%) |
| $1,000 to $1,499 | 35 (12.9%) | 7 (4.7%) |
| $1,500 to $1,999 | 13 (4.8%) | 0 (0.0%) |
| $2,000 to $2,499 | 3 (1.1%) | 0 (0.0%) |
| $2,500 to $2,999 | 0 (0.0%) | 0 (0.0%) |
| $3,000 or more | 0 (0.0%) | 0 (0.0%) |
| Total | 271 (100.0%) | 150 (100.0%) |
Physical Housing Characteristics in Autaugaville
Housing Structures in Autaugaville
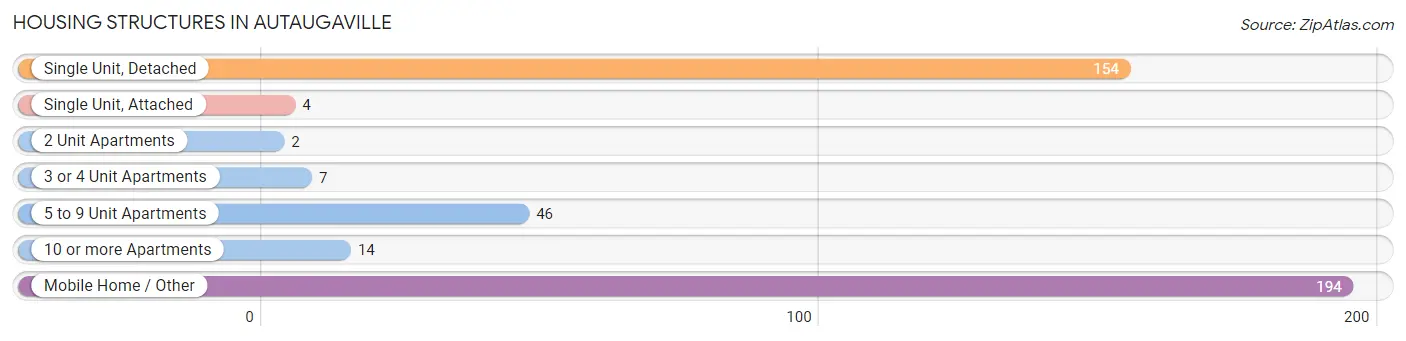
| Structure Type | # Housing Units | % Housing Units |
| Single Unit, Detached | 154 | 36.6% |
| Single Unit, Attached | 4 | 0.9% |
| 2 Unit Apartments | 2 | 0.5% |
| 3 or 4 Unit Apartments | 7 | 1.7% |
| 5 to 9 Unit Apartments | 46 | 10.9% |
| 10 or more Apartments | 14 | 3.3% |
| Mobile Home / Other | 194 | 46.1% |
| Total | 421 | 100.0% |
Housing Structures by Occupancy in Autaugaville
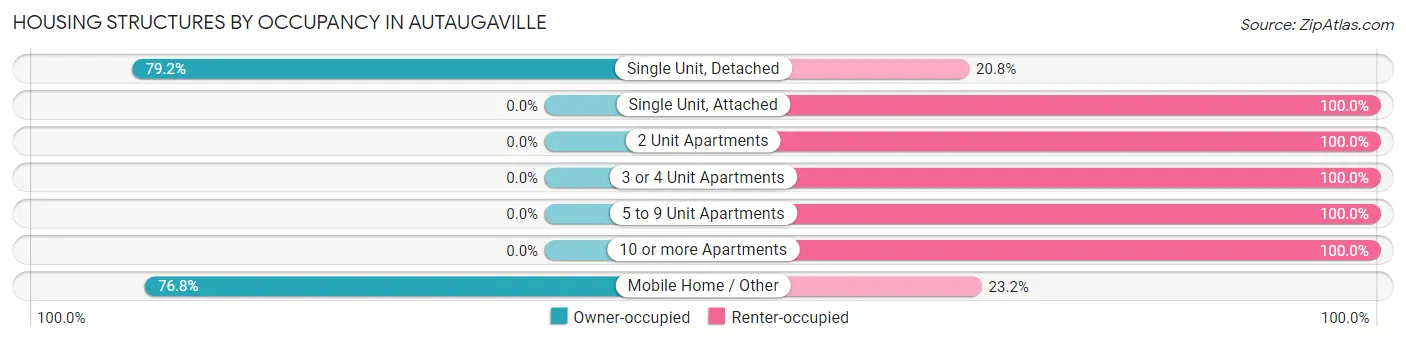
| Structure Type | Owner-occupied | Renter-occupied |
| Single Unit, Detached | 122 (79.2%) | 32 (20.8%) |
| Single Unit, Attached | 0 (0.0%) | 4 (100.0%) |
| 2 Unit Apartments | 0 (0.0%) | 2 (100.0%) |
| 3 or 4 Unit Apartments | 0 (0.0%) | 7 (100.0%) |
| 5 to 9 Unit Apartments | 0 (0.0%) | 46 (100.0%) |
| 10 or more Apartments | 0 (0.0%) | 14 (100.0%) |
| Mobile Home / Other | 149 (76.8%) | 45 (23.2%) |
| Total | 271 (64.4%) | 150 (35.6%) |
Housing Structures by Number of Rooms in Autaugaville
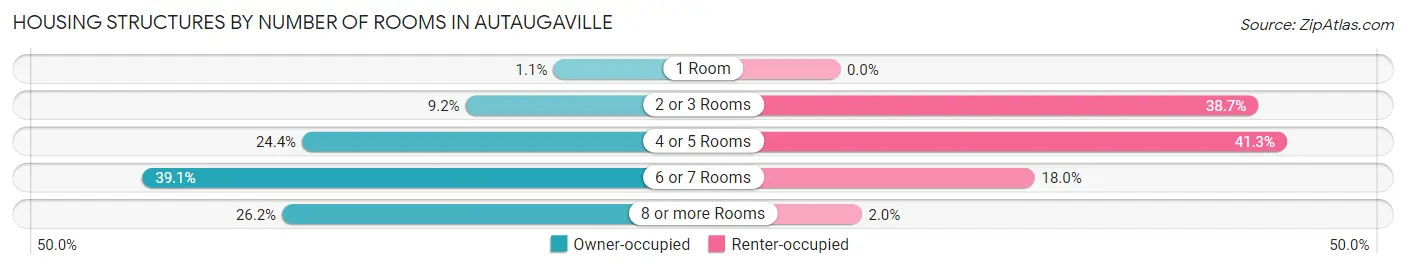
| Number of Rooms | Owner-occupied | Renter-occupied |
| 1 Room | 3 (1.1%) | 0 (0.0%) |
| 2 or 3 Rooms | 25 (9.2%) | 58 (38.7%) |
| 4 or 5 Rooms | 66 (24.3%) | 62 (41.3%) |
| 6 or 7 Rooms | 106 (39.1%) | 27 (18.0%) |
| 8 or more Rooms | 71 (26.2%) | 3 (2.0%) |
| Total | 271 (100.0%) | 150 (100.0%) |
Housing Structure by Heating Type in Autaugaville
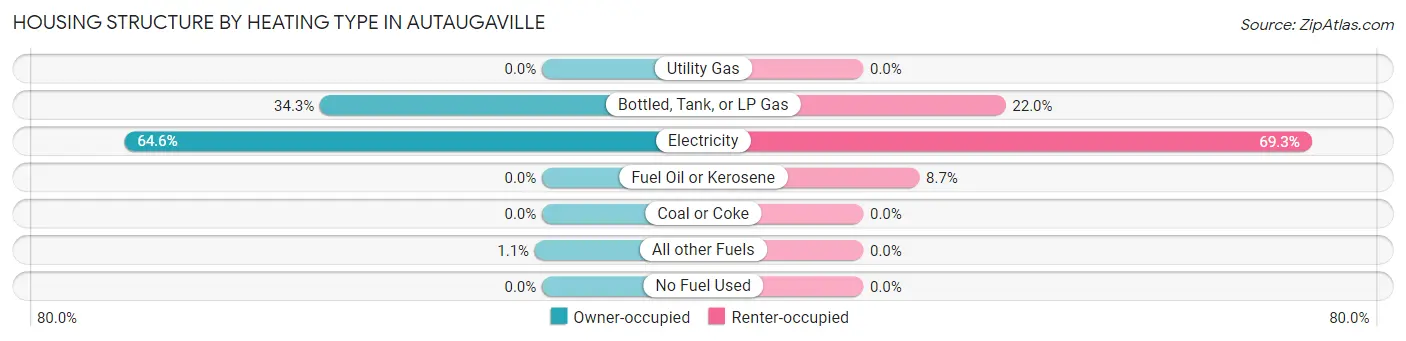
| Heating Type | Owner-occupied | Renter-occupied |
| Utility Gas | 0 (0.0%) | 0 (0.0%) |
| Bottled, Tank, or LP Gas | 93 (34.3%) | 33 (22.0%) |
| Electricity | 175 (64.6%) | 104 (69.3%) |
| Fuel Oil or Kerosene | 0 (0.0%) | 13 (8.7%) |
| Coal or Coke | 0 (0.0%) | 0 (0.0%) |
| All other Fuels | 3 (1.1%) | 0 (0.0%) |
| No Fuel Used | 0 (0.0%) | 0 (0.0%) |
| Total | 271 (100.0%) | 150 (100.0%) |
Household Vehicle Usage in Autaugaville
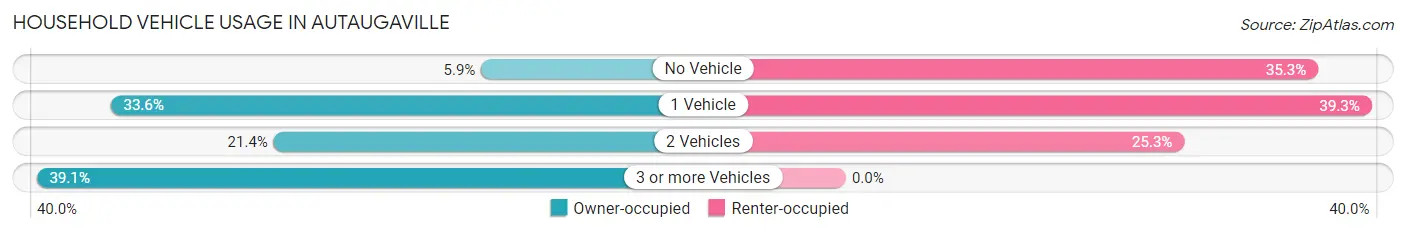
| Vehicles per Household | Owner-occupied | Renter-occupied |
| No Vehicle | 16 (5.9%) | 53 (35.3%) |
| 1 Vehicle | 91 (33.6%) | 59 (39.3%) |
| 2 Vehicles | 58 (21.4%) | 38 (25.3%) |
| 3 or more Vehicles | 106 (39.1%) | 0 (0.0%) |
| Total | 271 (100.0%) | 150 (100.0%) |
Real Estate & Mortgages in Autaugaville
Real Estate and Mortgage Overview in Autaugaville
| Characteristic | Without Mortgage | With Mortgage |
| Housing Units | 203 | 68 |
| Median Property Value | $73,700 | $153,800 |
| Median Household Income | $43,315 | $9 |
| Monthly Housing Costs | $463 | $0 |
| Real Estate Taxes | $199 | $3 |
Property Value by Mortgage Status in Autaugaville
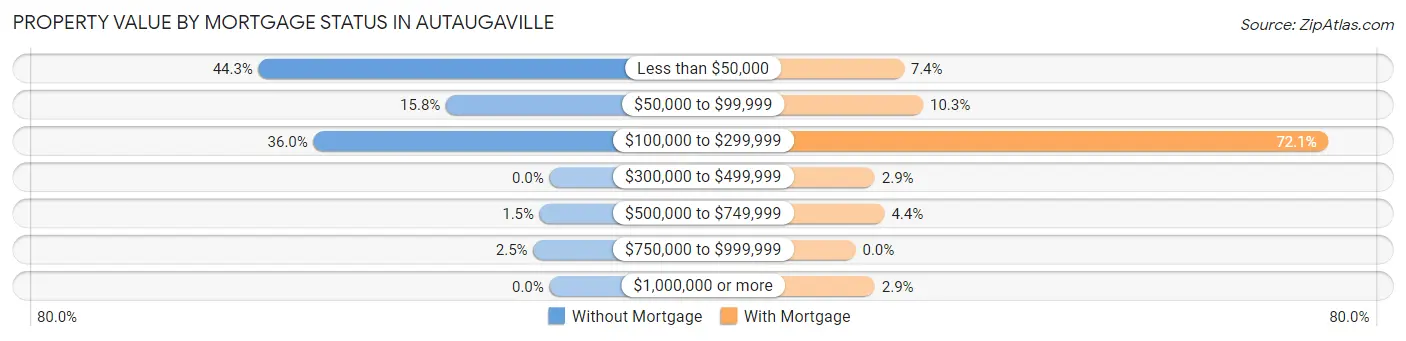
| Property Value | Without Mortgage | With Mortgage |
| Less than $50,000 | 90 (44.3%) | 5 (7.3%) |
| $50,000 to $99,999 | 32 (15.8%) | 7 (10.3%) |
| $100,000 to $299,999 | 73 (36.0%) | 49 (72.1%) |
| $300,000 to $499,999 | 0 (0.0%) | 2 (2.9%) |
| $500,000 to $749,999 | 3 (1.5%) | 3 (4.4%) |
| $750,000 to $999,999 | 5 (2.5%) | 0 (0.0%) |
| $1,000,000 or more | 0 (0.0%) | 2 (2.9%) |
| Total | 203 (100.0%) | 68 (100.0%) |
Household Income by Mortgage Status in Autaugaville
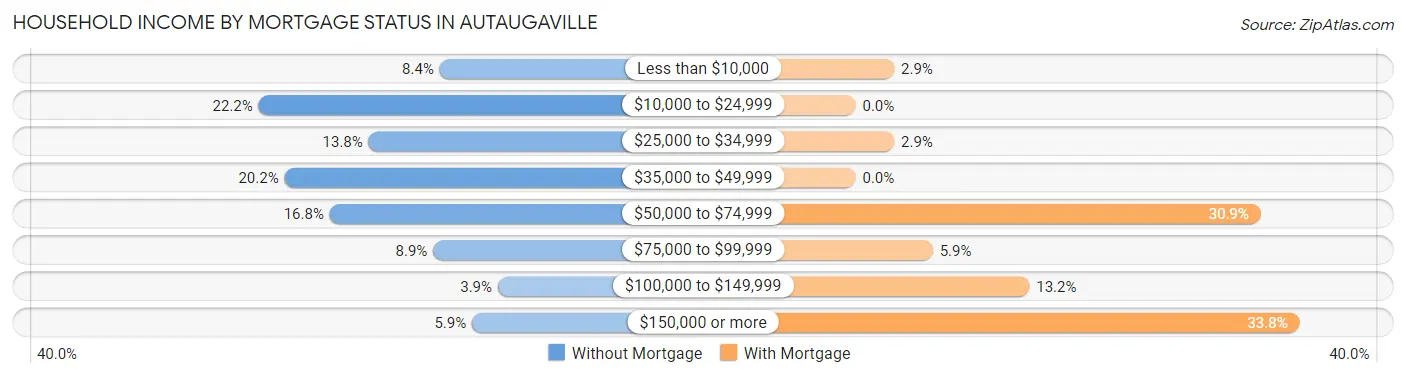
| Household Income | Without Mortgage | With Mortgage |
| Less than $10,000 | 17 (8.4%) | 2 (2.9%) |
| $10,000 to $24,999 | 45 (22.2%) | 0 (0.0%) |
| $25,000 to $34,999 | 28 (13.8%) | 2 (2.9%) |
| $35,000 to $49,999 | 41 (20.2%) | 0 (0.0%) |
| $50,000 to $74,999 | 34 (16.8%) | 21 (30.9%) |
| $75,000 to $99,999 | 18 (8.9%) | 4 (5.9%) |
| $100,000 to $149,999 | 8 (3.9%) | 9 (13.2%) |
| $150,000 or more | 12 (5.9%) | 23 (33.8%) |
| Total | 203 (100.0%) | 68 (100.0%) |
Property Value to Household Income Ratio in Autaugaville
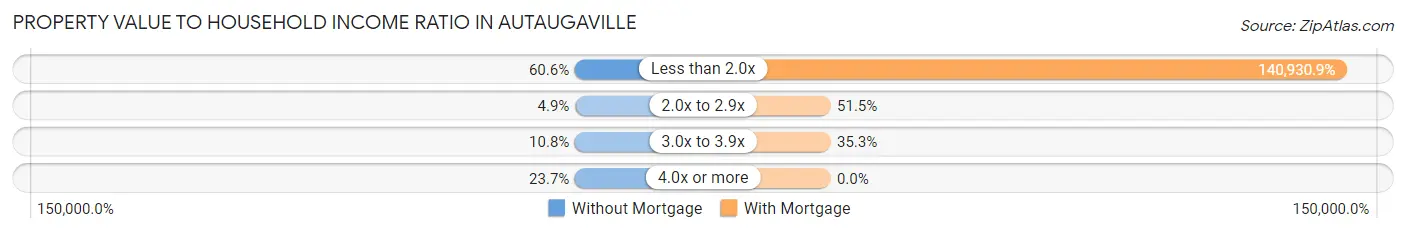
| Value-to-Income Ratio | Without Mortgage | With Mortgage |
| Less than 2.0x | 123 (60.6%) | 95,833 (140,930.9%) |
| 2.0x to 2.9x | 10 (4.9%) | 35 (51.5%) |
| 3.0x to 3.9x | 22 (10.8%) | 24 (35.3%) |
| 4.0x or more | 48 (23.6%) | 0 (0.0%) |
| Total | 203 (100.0%) | 68 (100.0%) |
Real Estate Taxes by Mortgage Status in Autaugaville
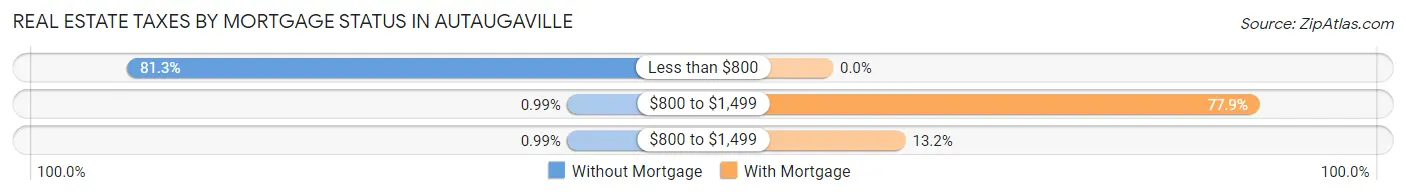
| Property Taxes | Without Mortgage | With Mortgage |
| Less than $800 | 165 (81.3%) | 0 (0.0%) |
| $800 to $1,499 | 2 (1.0%) | 53 (77.9%) |
| $800 to $1,499 | 2 (1.0%) | 9 (13.2%) |
| Total | 203 (100.0%) | 68 (100.0%) |
Health & Disability in Autaugaville
Health Insurance Coverage by Age in Autaugaville
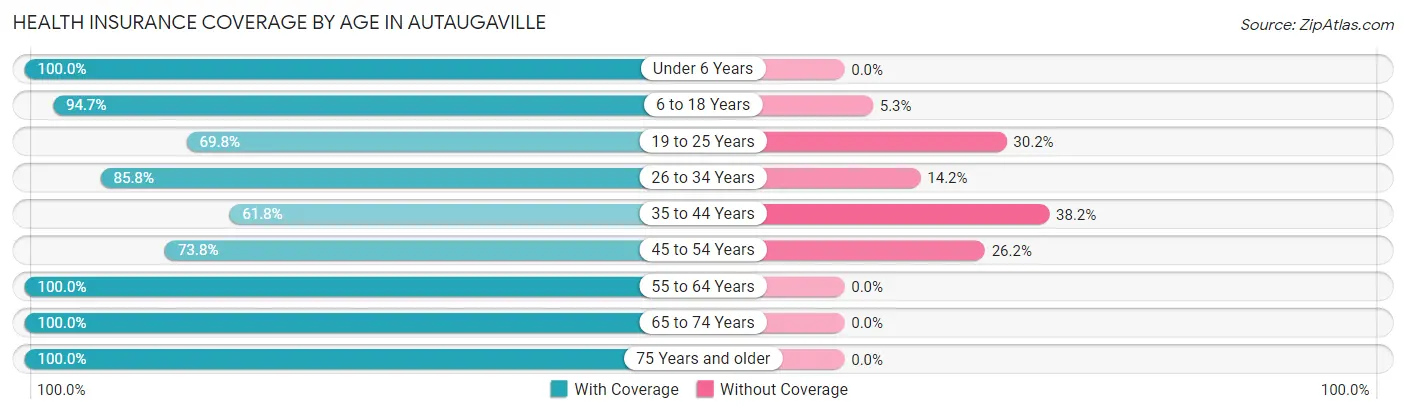
| Age Bracket | With Coverage | Without Coverage |
| Under 6 Years | 198 (100.0%) | 0 (0.0%) |
| 6 to 18 Years | 107 (94.7%) | 6 (5.3%) |
| 19 to 25 Years | 60 (69.8%) | 26 (30.2%) |
| 26 to 34 Years | 115 (85.8%) | 19 (14.2%) |
| 35 to 44 Years | 89 (61.8%) | 55 (38.2%) |
| 45 to 54 Years | 93 (73.8%) | 33 (26.2%) |
| 55 to 64 Years | 75 (100.0%) | 0 (0.0%) |
| 65 to 74 Years | 85 (100.0%) | 0 (0.0%) |
| 75 Years and older | 86 (100.0%) | 0 (0.0%) |
| Total | 908 (86.7%) | 139 (13.3%) |
Health Insurance Coverage by Citizenship Status in Autaugaville
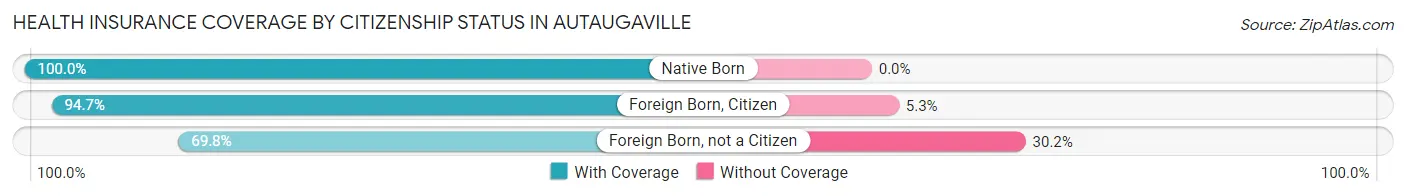
| Citizenship Status | With Coverage | Without Coverage |
| Native Born | 198 (100.0%) | 0 (0.0%) |
| Foreign Born, Citizen | 107 (94.7%) | 6 (5.3%) |
| Foreign Born, not a Citizen | 60 (69.8%) | 26 (30.2%) |
Health Insurance Coverage by Household Income in Autaugaville
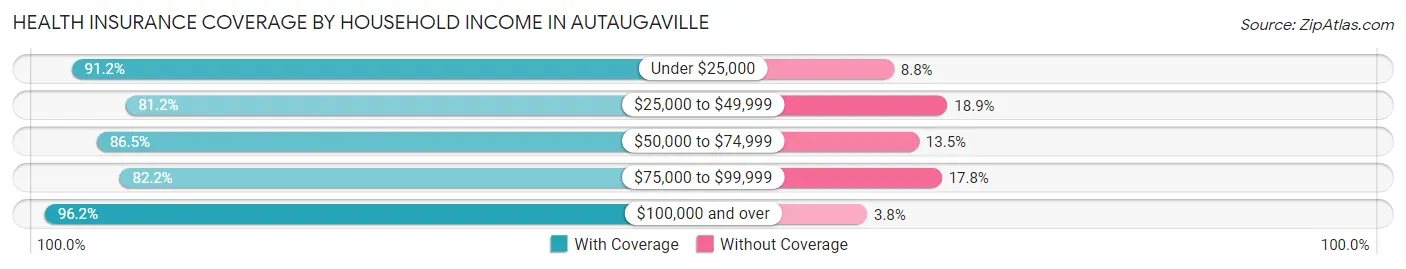
| Household Income | With Coverage | Without Coverage |
| Under $25,000 | 269 (91.2%) | 26 (8.8%) |
| $25,000 to $49,999 | 310 (81.1%) | 72 (18.9%) |
| $50,000 to $74,999 | 128 (86.5%) | 20 (13.5%) |
| $75,000 to $99,999 | 74 (82.2%) | 16 (17.8%) |
| $100,000 and over | 127 (96.2%) | 5 (3.8%) |
Public vs Private Health Insurance Coverage by Age in Autaugaville
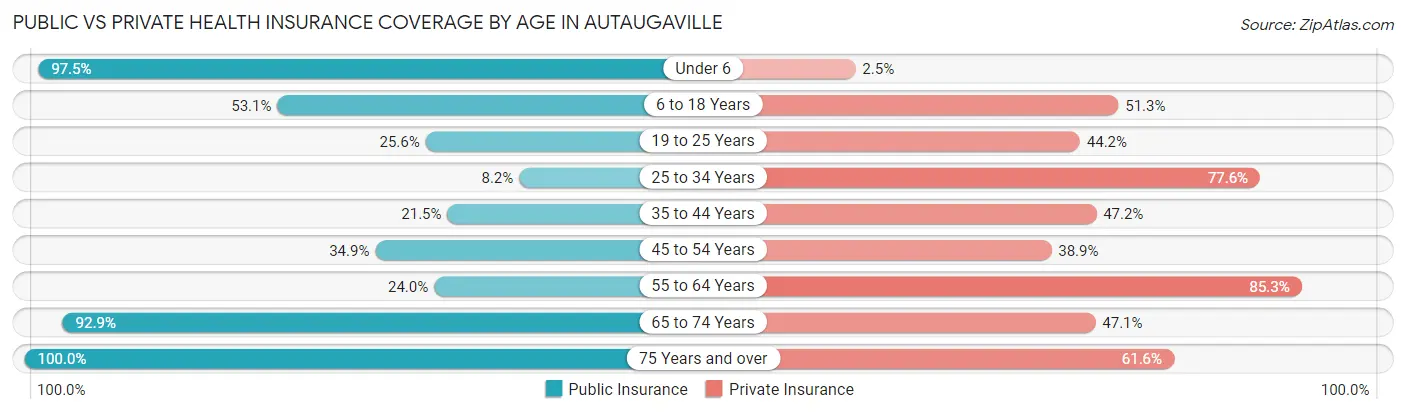
| Age Bracket | Public Insurance | Private Insurance |
| Under 6 | 193 (97.5%) | 5 (2.5%) |
| 6 to 18 Years | 60 (53.1%) | 58 (51.3%) |
| 19 to 25 Years | 22 (25.6%) | 38 (44.2%) |
| 25 to 34 Years | 11 (8.2%) | 104 (77.6%) |
| 35 to 44 Years | 31 (21.5%) | 68 (47.2%) |
| 45 to 54 Years | 44 (34.9%) | 49 (38.9%) |
| 55 to 64 Years | 18 (24.0%) | 64 (85.3%) |
| 65 to 74 Years | 79 (92.9%) | 40 (47.1%) |
| 75 Years and over | 86 (100.0%) | 53 (61.6%) |
| Total | 544 (52.0%) | 479 (45.8%) |
Disability Status by Sex by Age in Autaugaville
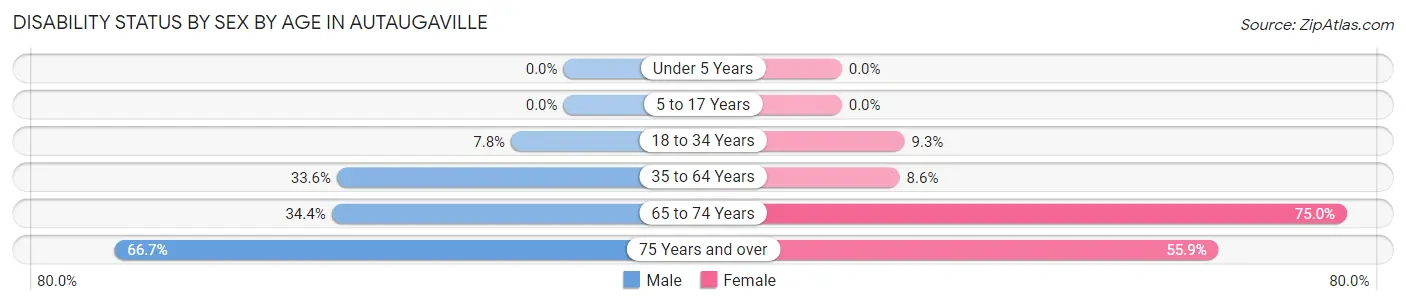
| Age Bracket | Male | Female |
| Under 5 Years | 0 (0.0%) | 0 (0.0%) |
| 5 to 17 Years | 0 (0.0%) | 0 (0.0%) |
| 18 to 34 Years | 6 (7.8%) | 14 (9.3%) |
| 35 to 64 Years | 73 (33.6%) | 11 (8.6%) |
| 65 to 74 Years | 21 (34.4%) | 18 (75.0%) |
| 75 Years and over | 18 (66.7%) | 33 (55.9%) |
Disability Class by Sex by Age in Autaugaville
Disability Class: Hearing Difficulty
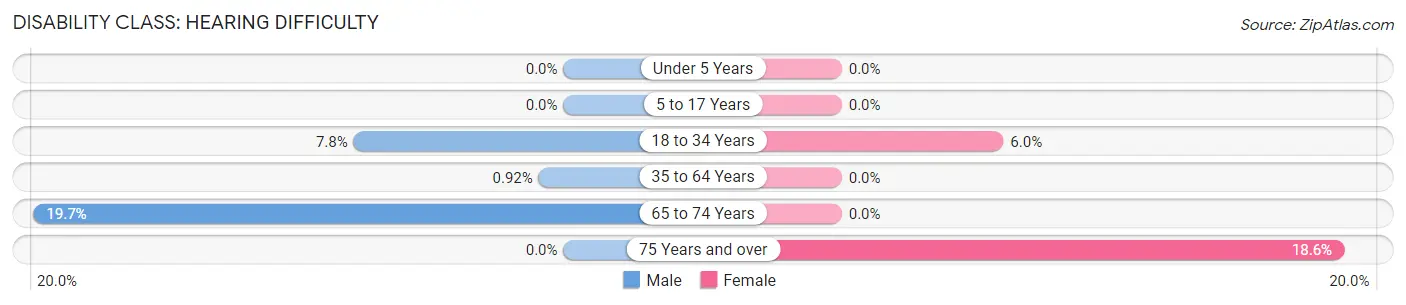
| Age Bracket | Male | Female |
| Under 5 Years | 0 (0.0%) | 0 (0.0%) |
| 5 to 17 Years | 0 (0.0%) | 0 (0.0%) |
| 18 to 34 Years | 6 (7.8%) | 9 (6.0%) |
| 35 to 64 Years | 2 (0.9%) | 0 (0.0%) |
| 65 to 74 Years | 12 (19.7%) | 0 (0.0%) |
| 75 Years and over | 0 (0.0%) | 11 (18.6%) |
Disability Class: Vision Difficulty
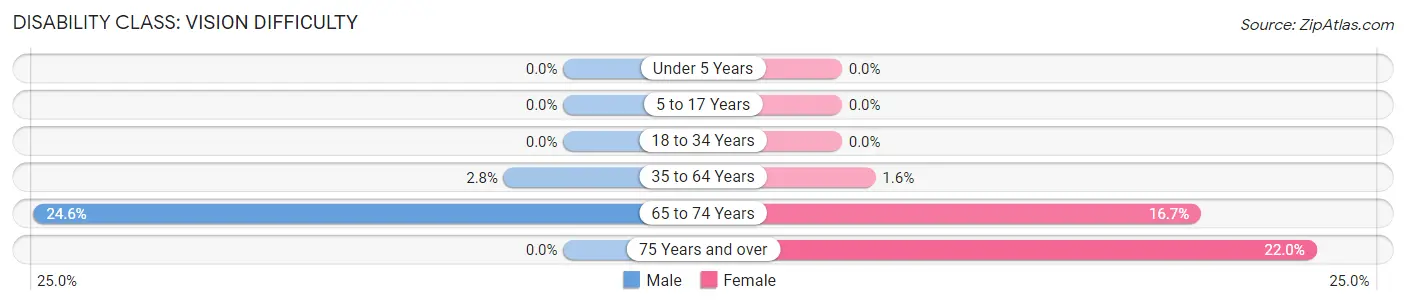
| Age Bracket | Male | Female |
| Under 5 Years | 0 (0.0%) | 0 (0.0%) |
| 5 to 17 Years | 0 (0.0%) | 0 (0.0%) |
| 18 to 34 Years | 0 (0.0%) | 0 (0.0%) |
| 35 to 64 Years | 6 (2.8%) | 2 (1.6%) |
| 65 to 74 Years | 15 (24.6%) | 4 (16.7%) |
| 75 Years and over | 0 (0.0%) | 13 (22.0%) |
Disability Class: Cognitive Difficulty
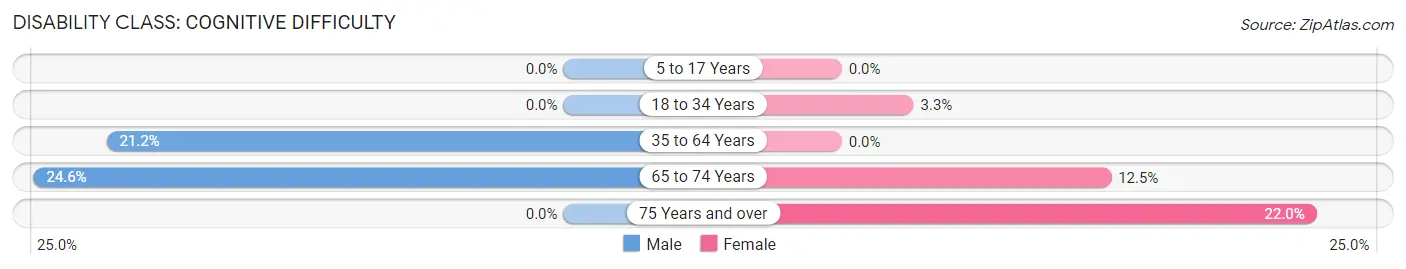
| Age Bracket | Male | Female |
| 5 to 17 Years | 0 (0.0%) | 0 (0.0%) |
| 18 to 34 Years | 0 (0.0%) | 5 (3.3%) |
| 35 to 64 Years | 46 (21.2%) | 0 (0.0%) |
| 65 to 74 Years | 15 (24.6%) | 3 (12.5%) |
| 75 Years and over | 0 (0.0%) | 13 (22.0%) |
Disability Class: Ambulatory Difficulty
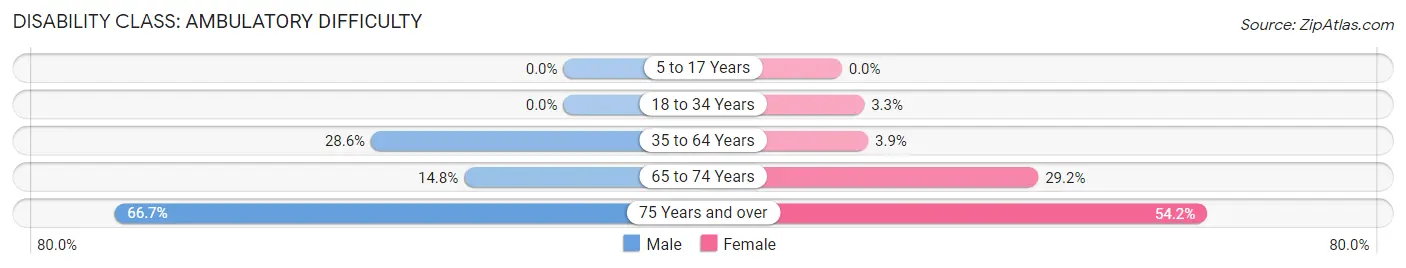
| Age Bracket | Male | Female |
| 5 to 17 Years | 0 (0.0%) | 0 (0.0%) |
| 18 to 34 Years | 0 (0.0%) | 5 (3.3%) |
| 35 to 64 Years | 62 (28.6%) | 5 (3.9%) |
| 65 to 74 Years | 9 (14.7%) | 7 (29.2%) |
| 75 Years and over | 18 (66.7%) | 32 (54.2%) |
Disability Class: Self-Care Difficulty
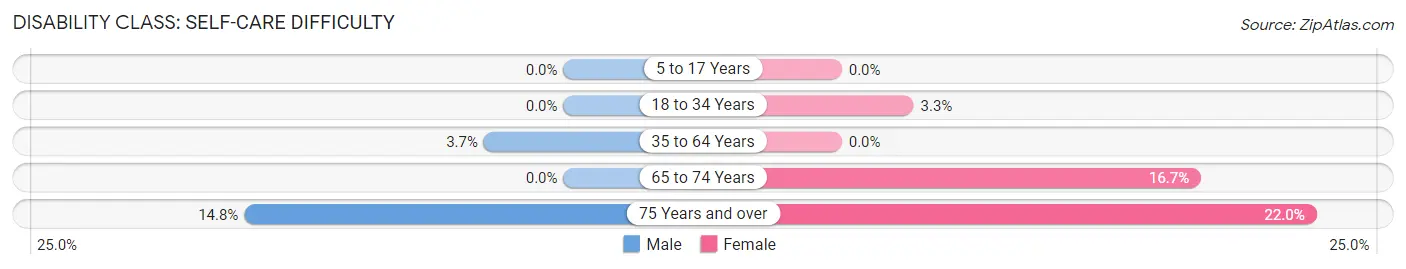
| Age Bracket | Male | Female |
| 5 to 17 Years | 0 (0.0%) | 0 (0.0%) |
| 18 to 34 Years | 0 (0.0%) | 5 (3.3%) |
| 35 to 64 Years | 8 (3.7%) | 0 (0.0%) |
| 65 to 74 Years | 0 (0.0%) | 4 (16.7%) |
| 75 Years and over | 4 (14.8%) | 13 (22.0%) |
Technology Access in Autaugaville
Computing Device Access in Autaugaville
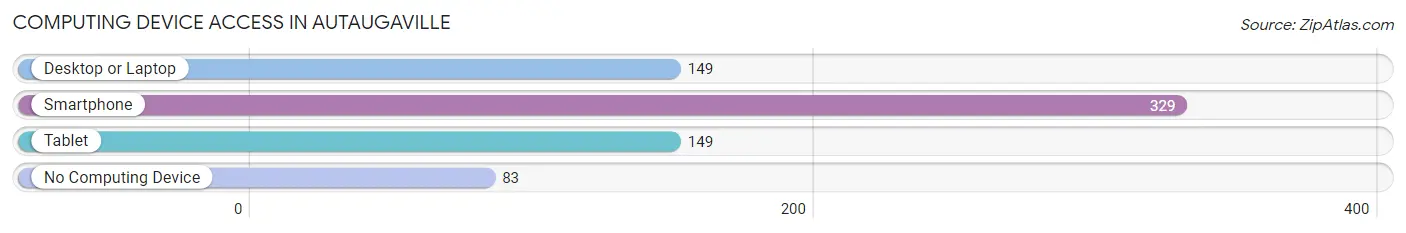
| Device Type | # Households | % Households |
| Desktop or Laptop | 149 | 35.4% |
| Smartphone | 329 | 78.1% |
| Tablet | 149 | 35.4% |
| No Computing Device | 83 | 19.7% |
| Total | 421 | 100.0% |
Internet Access in Autaugaville
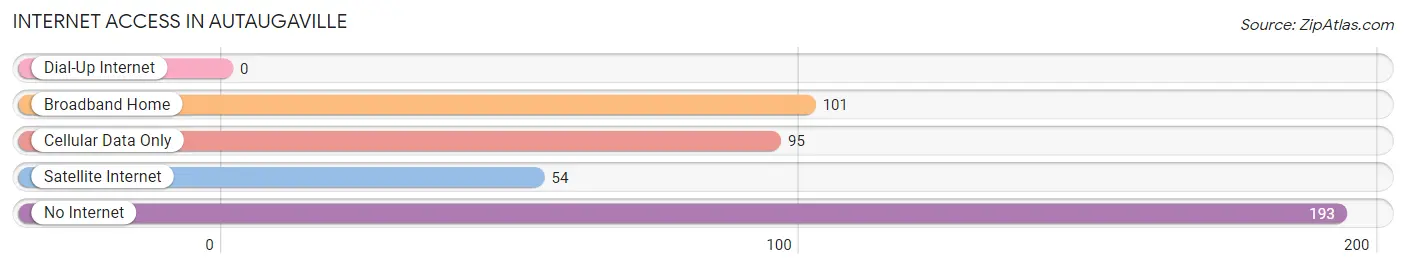
| Internet Type | # Households | % Households |
| Dial-Up Internet | 0 | 0.0% |
| Broadband Home | 101 | 24.0% |
| Cellular Data Only | 95 | 22.6% |
| Satellite Internet | 54 | 12.8% |
| No Internet | 193 | 45.8% |
| Total | 421 | 100.0% |
Autaugaville Summary
Autaugaville, Alabama is a small town located in Autauga County, Alabama. It is situated on the banks of the Alabama River, about 20 miles north of Montgomery. The town was founded in 1818 and is named after the Autauga Indians, who were the original inhabitants of the area. The population of Autaugaville was 1,845 in the 2010 census.
Geography
Autaugaville is located in the central part of Autauga County, Alabama. It is situated on the banks of the Alabama River, about 20 miles north of Montgomery. The town is located in the Black Belt region of Alabama, which is characterized by its rich, fertile soil. The town is surrounded by rolling hills and forests, and is home to several small lakes and streams. The climate in Autaugaville is humid subtropical, with hot, humid summers and mild winters.
History
Autaugaville was founded in 1818 by settlers from Georgia and South Carolina. The town was named after the Autauga Indians, who were the original inhabitants of the area. The town was an important trading center during the 19th century, and was home to several cotton plantations. During the Civil War, Autaugaville was the site of several battles between Union and Confederate forces. After the war, the town experienced a period of economic decline, but began to recover in the late 19th century.
Economy
The economy of Autaugaville is largely based on agriculture. The town is home to several farms, which produce cotton, corn, soybeans, and other crops. The town is also home to several small businesses, including restaurants, retail stores, and service providers. The town is also home to several manufacturing companies, which produce a variety of products, including furniture, clothing, and automotive parts.
Demographics
As of the 2010 census, the population of Autaugaville was 1,845. The racial makeup of the town was 79.3% White, 18.2% African American, 0.3% Native American, 0.2% Asian, 0.1% Pacific Islander, 0.7% from other races, and 1.4% from two or more races. Hispanic or Latino of any race were 1.7% of the population.
The median income for a household in Autaugaville was $31,250, and the median income for a family was $37,500. The per capita income for the town was $15,945. About 17.2% of families and 20.2% of the population were below the poverty line, including 28.3% of those under age 18 and 15.2% of those age 65 or over.
Conclusion
Autaugaville, Alabama is a small town located in Autauga County, Alabama. It is situated on the banks of the Alabama River, about 20 miles north of Montgomery. The town was founded in 1818 and is named after the Autauga Indians, who were the original inhabitants of the area. The population of Autaugaville was 1,845 in the 2010 census. The economy of Autaugaville is largely based on agriculture, and the town is home to several small businesses. The racial makeup of the town was 79.3% White, 18.2% African American, 0.3% Native American, 0.2% Asian, 0.1% Pacific Islander, 0.7% from other races, and 1.4% from two or more races. The median income for a household in Autaugaville was $31,250, and the median income for a family was $37,500. Autaugaville is a small town with a rich history and a diverse population.
Common Questions
What is Per Capita Income in Autaugaville?
Per Capita income in Autaugaville is $26,259.
What is the Median Family Income in Autaugaville?
Median Family Income in Autaugaville is $45,197.
What is the Median Household income in Autaugaville?
Median Household Income in Autaugaville is $41,607.
What is Income or Wage Gap in Autaugaville?
Income or Wage Gap in Autaugaville is 24.8%.
Women in Autaugaville earn 75.2 cents for every dollar earned by a man.
What is Inequality or Gini Index in Autaugaville?
Inequality or Gini Index in Autaugaville is 0.55.
What is the Total Population of Autaugaville?
Total Population of Autaugaville is 1,047.
What is the Total Male Population of Autaugaville?
Total Male Population of Autaugaville is 578.
What is the Total Female Population of Autaugaville?
Total Female Population of Autaugaville is 469.
What is the Ratio of Males per 100 Females in Autaugaville?
There are 123.24 Males per 100 Females in Autaugaville.
What is the Ratio of Females per 100 Males in Autaugaville?
There are 81.14 Females per 100 Males in Autaugaville.
What is the Median Population Age in Autaugaville?
Median Population Age in Autaugaville is 34.7 Years.
What is the Average Family Size in Autaugaville
Average Family Size in Autaugaville is 3.6 People.
What is the Average Household Size in Autaugaville
Average Household Size in Autaugaville is 2.5 People.
How Large is the Labor Force in Autaugaville?
There are 409 People in the Labor Forcein in Autaugaville.
What is the Percentage of People in the Labor Force in Autaugaville?
54.4% of People are in the Labor Force in Autaugaville.
What is the Unemployment Rate in Autaugaville?
Unemployment Rate in Autaugaville is 8.1%.