Zip Codes with the Highest Percentage of Population with a Degree in Computers and Mathematics in Alabama
RELATED REPORTS & OPTIONS
Computers and Mathematics
Alabama
Compare Zip Codes
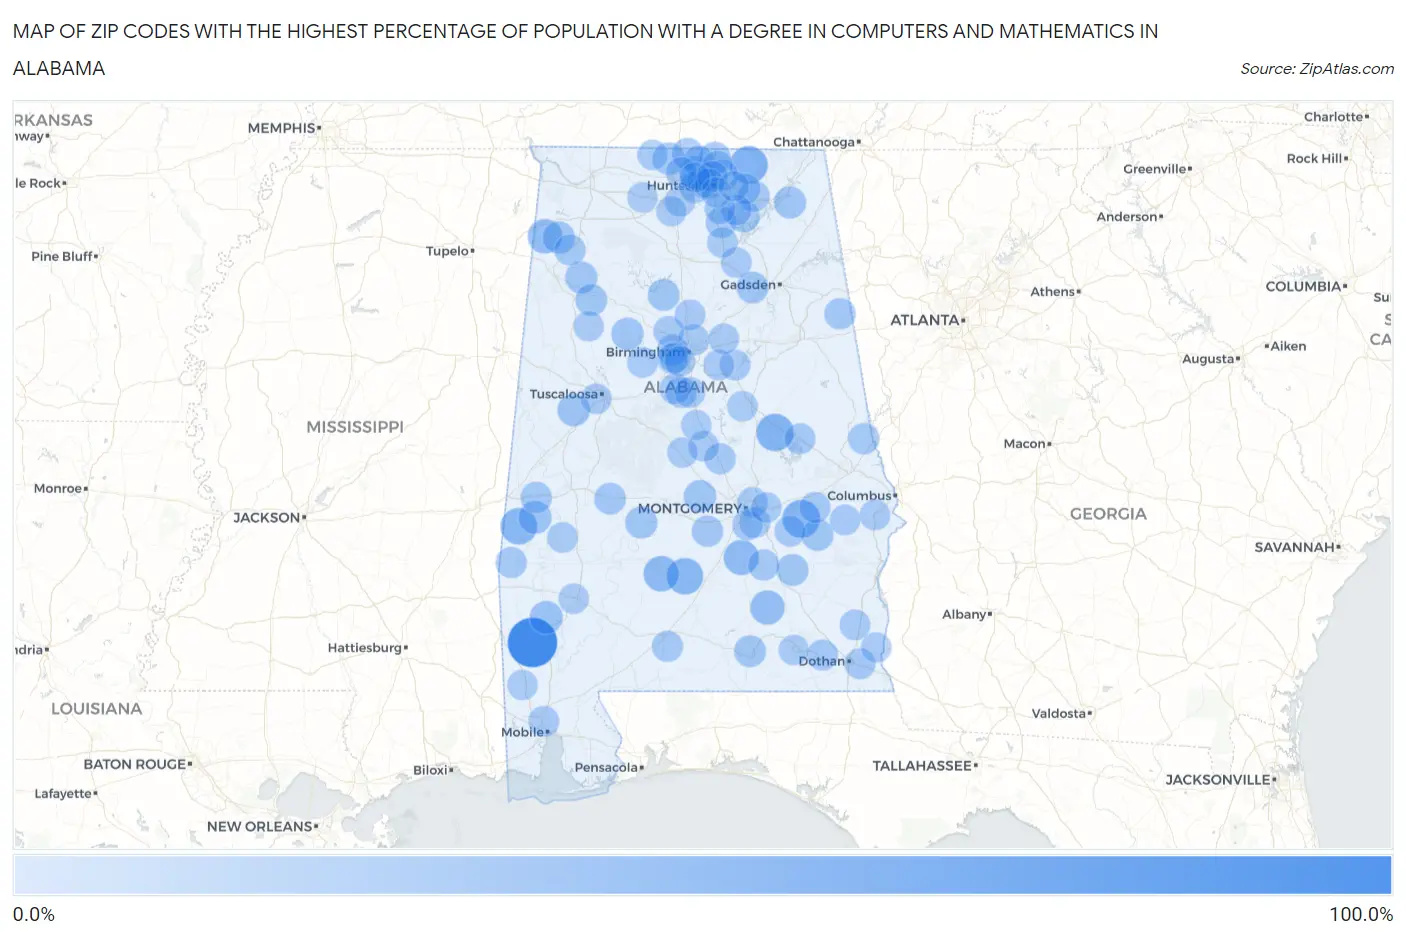
Map of Zip Codes with the Highest Percentage of Population with a Degree in Computers and Mathematics in Alabama
0.0%
100.0%
Zip Codes with the Highest Percentage of Population with a Degree in Computers and Mathematics in Alabama
| Zip Code | % Graduates | vs State | vs National | |
| 1. | 36583 | 100.0% | 4.4%(+95.6)#1 | 4.9%(+95.1)#7 |
| 2. | 36039 | 42.1% | 4.4%(+37.7)#2 | 4.9%(+37.2)#121 |
| 3. | 35766 | 42.1% | 4.4%(+37.7)#3 | 4.9%(+37.2)#122 |
| 4. | 35089 | 39.6% | 4.4%(+35.2)#4 | 4.9%(+34.7)#137 |
| 5. | 36912 | 35.7% | 4.4%(+31.3)#5 | 4.9%(+30.8)#166 |
| 6. | 36030 | 35.3% | 4.4%(+30.9)#6 | 4.9%(+30.4)#167 |
| 7. | 36768 | 30.8% | 4.4%(+26.4)#7 | 4.9%(+25.9)#214 |
| 8. | 36046 | 29.1% | 4.4%(+24.7)#8 | 4.9%(+24.2)#237 |
| 9. | 35593 | 26.0% | 4.4%(+21.6)#9 | 4.9%(+21.1)#284 |
| 10. | 36034 | 24.6% | 4.4%(+20.2)#10 | 4.9%(+19.7)#311 |
| 11. | 36569 | 19.1% | 4.4%(+14.7)#11 | 4.9%(+14.2)#499 |
| 12. | 36922 | 18.8% | 4.4%(+14.4)#12 | 4.9%(+13.9)#521 |
| 13. | 35480 | 17.2% | 4.4%(+12.8)#13 | 4.9%(+12.3)#616 |
| 14. | 35620 | 16.4% | 4.4%(+12.1)#14 | 4.9%(+11.5)#661 |
| 15. | 36003 | 15.8% | 4.4%(+11.4)#15 | 4.9%(+10.9)#720 |
| 16. | 35579 | 15.2% | 4.4%(+10.8)#16 | 4.9%(+10.3)#766 |
| 17. | 35571 | 15.2% | 4.4%(+10.8)#17 | 4.9%(+10.3)#769 |
| 18. | 35744 | 14.9% | 4.4%(+10.5)#18 | 4.9%(+10.0)#794 |
| 19. | 35548 | 14.7% | 4.4%(+10.3)#19 | 4.9%(+9.81)#817 |
| 20. | 36767 | 14.5% | 4.4%(+10.1)#20 | 4.9%(+9.62)#842 |
| 21. | 36089 | 13.8% | 4.4%(+9.38)#21 | 4.9%(+8.86)#937 |
| 22. | 36081 | 13.7% | 4.4%(+9.36)#22 | 4.9%(+8.84)#940 |
| 23. | 35747 | 13.7% | 4.4%(+9.33)#23 | 4.9%(+8.82)#943 |
| 24. | 36467 | 13.5% | 4.4%(+9.12)#24 | 4.9%(+8.60)#982 |
| 25. | 35033 | 13.4% | 4.4%(+8.97)#25 | 4.9%(+8.46)#1,000 |
| 26. | 35554 | 13.3% | 4.4%(+8.88)#26 | 4.9%(+8.36)#1,013 |
| 27. | 35972 | 13.0% | 4.4%(+8.61)#27 | 4.9%(+8.09)#1,057 |
| 28. | 36786 | 12.6% | 4.4%(+8.18)#28 | 4.9%(+7.66)#1,116 |
| 29. | 35749 | 12.3% | 4.4%(+7.92)#29 | 4.9%(+7.40)#1,169 |
| 30. | 35750 | 12.0% | 4.4%(+7.58)#30 | 4.9%(+7.06)#1,219 |
| 31. | 35739 | 11.7% | 4.4%(+7.30)#31 | 4.9%(+6.78)#1,286 |
| 32. | 35776 | 11.3% | 4.4%(+6.95)#32 | 4.9%(+6.43)#1,369 |
| 33. | 36040 | 11.3% | 4.4%(+6.89)#33 | 4.9%(+6.37)#1,390 |
| 34. | 36262 | 11.2% | 4.4%(+6.81)#34 | 4.9%(+6.29)#1,403 |
| 35. | 36925 | 10.9% | 4.4%(+6.51)#35 | 4.9%(+5.99)#1,485 |
| 36. | 35773 | 10.7% | 4.4%(+6.36)#36 | 4.9%(+5.85)#1,516 |
| 37. | 36863 | 10.7% | 4.4%(+6.31)#37 | 4.9%(+5.79)#1,531 |
| 38. | 36915 | 10.0% | 4.4%(+5.62)#38 | 4.9%(+5.11)#1,755 |
| 39. | 36036 | 10.0% | 4.4%(+5.57)#39 | 4.9%(+5.06)#1,773 |
| 40. | 35811 | 9.9% | 4.4%(+5.50)#40 | 4.9%(+4.99)#1,801 |
| 41. | 36091 | 9.8% | 4.4%(+5.38)#41 | 4.9%(+4.86)#1,852 |
| 42. | 36432 | 9.7% | 4.4%(+5.33)#42 | 4.9%(+4.81)#1,883 |
| 43. | 36352 | 9.5% | 4.4%(+5.15)#43 | 4.9%(+4.64)#1,945 |
| 44. | 35114 | 9.5% | 4.4%(+5.09)#44 | 4.9%(+4.58)#1,982 |
| 45. | 35175 | 9.4% | 4.4%(+5.06)#45 | 4.9%(+4.55)#1,999 |
| 46. | 35758 | 9.4% | 4.4%(+5.01)#46 | 4.9%(+4.49)#2,021 |
| 47. | 36861 | 9.3% | 4.4%(+4.97)#47 | 4.9%(+4.45)#2,038 |
| 48. | 36321 | 9.3% | 4.4%(+4.95)#48 | 4.9%(+4.43)#2,050 |
| 49. | 35564 | 9.3% | 4.4%(+4.94)#49 | 4.9%(+4.43)#2,053 |
| 50. | 35224 | 9.1% | 4.4%(+4.76)#50 | 4.9%(+4.25)#2,156 |
| 51. | 36083 | 9.0% | 4.4%(+4.64)#51 | 4.9%(+4.13)#2,243 |
| 52. | 35217 | 9.0% | 4.4%(+4.64)#52 | 4.9%(+4.12)#2,244 |
| 53. | 36029 | 8.9% | 4.4%(+4.48)#53 | 4.9%(+3.97)#2,329 |
| 54. | 35759 | 8.8% | 4.4%(+4.42)#54 | 4.9%(+3.91)#2,371 |
| 55. | 35080 | 8.6% | 4.4%(+4.22)#55 | 4.9%(+3.70)#2,482 |
| 56. | 36611 | 8.6% | 4.4%(+4.17)#56 | 4.9%(+3.66)#2,509 |
| 57. | 35178 | 8.5% | 4.4%(+4.11)#57 | 4.9%(+3.59)#2,546 |
| 58. | 35806 | 8.4% | 4.4%(+4.05)#58 | 4.9%(+3.53)#2,582 |
| 59. | 35764 | 8.3% | 4.4%(+3.96)#59 | 4.9%(+3.44)#2,639 |
| 60. | 35091 | 8.3% | 4.4%(+3.92)#60 | 4.9%(+3.41)#2,674 |
| 61. | 35613 | 8.3% | 4.4%(+3.88)#61 | 4.9%(+3.36)#2,704 |
| 62. | 35007 | 8.2% | 4.4%(+3.87)#62 | 4.9%(+3.35)#2,709 |
| 63. | 36116 | 8.2% | 4.4%(+3.84)#63 | 4.9%(+3.33)#2,733 |
| 64. | 35980 | 8.2% | 4.4%(+3.81)#64 | 4.9%(+3.30)#2,751 |
| 65. | 35147 | 8.1% | 4.4%(+3.70)#65 | 4.9%(+3.18)#2,839 |
| 66. | 35760 | 8.0% | 4.4%(+3.60)#66 | 4.9%(+3.09)#2,918 |
| 67. | 35073 | 8.0% | 4.4%(+3.59)#67 | 4.9%(+3.08)#2,927 |
| 68. | 36115 | 7.9% | 4.4%(+3.49)#68 | 4.9%(+2.97)#3,009 |
| 69. | 35401 | 7.8% | 4.4%(+3.42)#69 | 4.9%(+2.91)#3,064 |
| 70. | 35064 | 7.8% | 4.4%(+3.42)#70 | 4.9%(+2.90)#3,071 |
| 71. | 35045 | 7.8% | 4.4%(+3.39)#71 | 4.9%(+2.87)#3,093 |
| 72. | 35803 | 7.7% | 4.4%(+3.36)#72 | 4.9%(+2.85)#3,108 |
| 73. | 36353 | 7.7% | 4.4%(+3.36)#73 | 4.9%(+2.84)#3,109 |
| 74. | 35810 | 7.7% | 4.4%(+3.29)#74 | 4.9%(+2.78)#3,180 |
| 75. | 35004 | 7.7% | 4.4%(+3.28)#75 | 4.9%(+2.76)#3,189 |
| 76. | 36860 | 7.7% | 4.4%(+3.27)#76 | 4.9%(+2.76)#3,198 |
| 77. | 36782 | 7.6% | 4.4%(+3.21)#77 | 4.9%(+2.69)#3,257 |
| 78. | 36875 | 7.5% | 4.4%(+3.15)#78 | 4.9%(+2.63)#3,311 |
| 79. | 35016 | 7.5% | 4.4%(+3.11)#79 | 4.9%(+2.59)#3,352 |
| 80. | 36105 | 7.5% | 4.4%(+3.10)#80 | 4.9%(+2.58)#3,361 |
| 81. | 36750 | 7.4% | 4.4%(+3.03)#81 | 4.9%(+2.51)#3,420 |
| 82. | 35061 | 7.3% | 4.4%(+2.96)#82 | 4.9%(+2.44)#3,486 |
| 83. | 35006 | 7.3% | 4.4%(+2.94)#83 | 4.9%(+2.42)#3,509 |
| 84. | 35816 | 7.3% | 4.4%(+2.92)#84 | 4.9%(+2.40)#3,531 |
| 85. | 35649 | 7.3% | 4.4%(+2.89)#85 | 4.9%(+2.38)#3,554 |
| 86. | 35151 | 7.2% | 4.4%(+2.81)#86 | 4.9%(+2.29)#3,641 |
| 87. | 36117 | 7.2% | 4.4%(+2.78)#87 | 4.9%(+2.26)#3,676 |
| 88. | 35211 | 7.1% | 4.4%(+2.69)#88 | 4.9%(+2.18)#3,751 |
| 89. | 35802 | 7.0% | 4.4%(+2.65)#89 | 4.9%(+2.13)#3,796 |
| 90. | 36451 | 7.0% | 4.4%(+2.59)#90 | 4.9%(+2.08)#3,872 |
| 91. | 35748 | 6.9% | 4.4%(+2.56)#91 | 4.9%(+2.04)#3,901 |
| 92. | 35647 | 6.8% | 4.4%(+2.43)#92 | 4.9%(+1.91)#4,058 |
| 93. | 36319 | 6.6% | 4.4%(+2.23)#93 | 4.9%(+1.71)#4,325 |
| 94. | 35542 | 6.5% | 4.4%(+2.14)#94 | 4.9%(+1.63)#4,432 |
| 95. | 35085 | 6.4% | 4.4%(+2.01)#95 | 4.9%(+1.50)#4,623 |
| 96. | 35757 | 6.3% | 4.4%(+1.94)#96 | 4.9%(+1.42)#4,737 |
| 97. | 35603 | 6.3% | 4.4%(+1.89)#97 | 4.9%(+1.38)#4,817 |
| 98. | 36522 | 6.2% | 4.4%(+1.87)#98 | 4.9%(+1.36)#4,845 |
| 99. | 36330 | 6.2% | 4.4%(+1.83)#99 | 4.9%(+1.32)#4,922 |
| 100. | 35643 | 6.2% | 4.4%(+1.80)#100 | 4.9%(+1.28)#4,983 |
Common Questions
What are the Top 10 Zip Codes with the Highest Percentage of Population with a Degree in Computers and Mathematics in Alabama?
Top 10 Zip Codes with the Highest Percentage of Population with a Degree in Computers and Mathematics in Alabama are:
What zip code has the Highest Percentage of Population with a Degree in Computers and Mathematics in Alabama?
36583 has the Highest Percentage of Population with a Degree in Computers and Mathematics in Alabama with 100.0%.
What is the Percentage of Population with a Degree in Computers and Mathematics in the State of Alabama?
Percentage of Population with a Degree in Computers and Mathematics in Alabama is 4.4%.
What is the Percentage of Population with a Degree in Computers and Mathematics in the United States?
Percentage of Population with a Degree in Computers and Mathematics in the United States is 4.9%.