Elmore, AL Map & Demographics
Elmore Map
Elmore Overview
$18,766
PER CAPITA INCOME
$38,611
AVG FAMILY INCOME
$29,946
AVG HOUSEHOLD INCOME
54.6%
WAGE / INCOME GAP [ % ]
45.4¢/ $1
WAGE / INCOME GAP [ $ ]
0.46
INEQUALITY / GINI INDEX
1,573
TOTAL POPULATION
626
MALE POPULATION
947
FEMALE POPULATION
66.10
MALES / 100 FEMALES
151.28
FEMALES / 100 MALES
29.6
MEDIAN AGE
3.5
AVG FAMILY SIZE
2.6
AVG HOUSEHOLD SIZE
802
LABOR FORCE [ PEOPLE ]
66.3%
PERCENT IN LABOR FORCE
11.9%
UNEMPLOYMENT RATE
Elmore Zip Codes
Elmore Area Codes
Income in Elmore
Income Overview in Elmore
Per Capita Income in Elmore is $18,766, while median incomes of families and households are $38,611 and $29,946 respectively.
| Characteristic | Number | Measure |
| Per Capita Income | 1,573 | $18,766 |
| Median Family Income | 352 | $38,611 |
| Mean Family Income | 352 | $55,821 |
| Median Household Income | 593 | $29,946 |
| Mean Household Income | 593 | $47,159 |
| Income Deficit | 352 | $0 |
| Wage / Income Gap (%) | 1,573 | 54.61% |
| Wage / Income Gap ($) | 1,573 | 45.39¢ per $1 |
| Gini / Inequality Index | 1,573 | 0.46 |
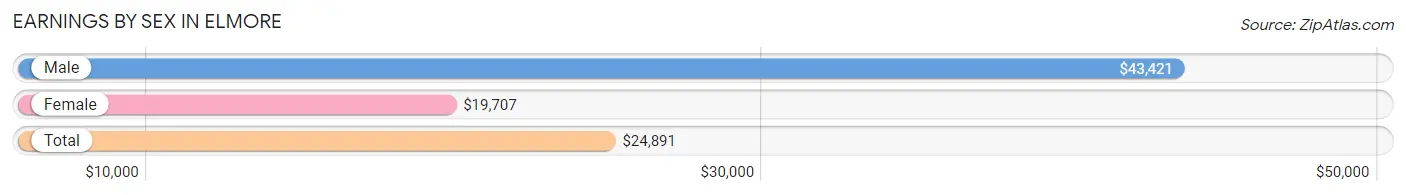
Earnings by Sex in Elmore
Average Earnings in Elmore are $24,891, $43,421 for men and $19,707 for women, a difference of 54.6%.
| Sex | Number | Average Earnings |
| Male | 354 (48.5%) | $43,421 |
| Female | 376 (51.5%) | $19,707 |
| Total | 730 (100.0%) | $24,891 |
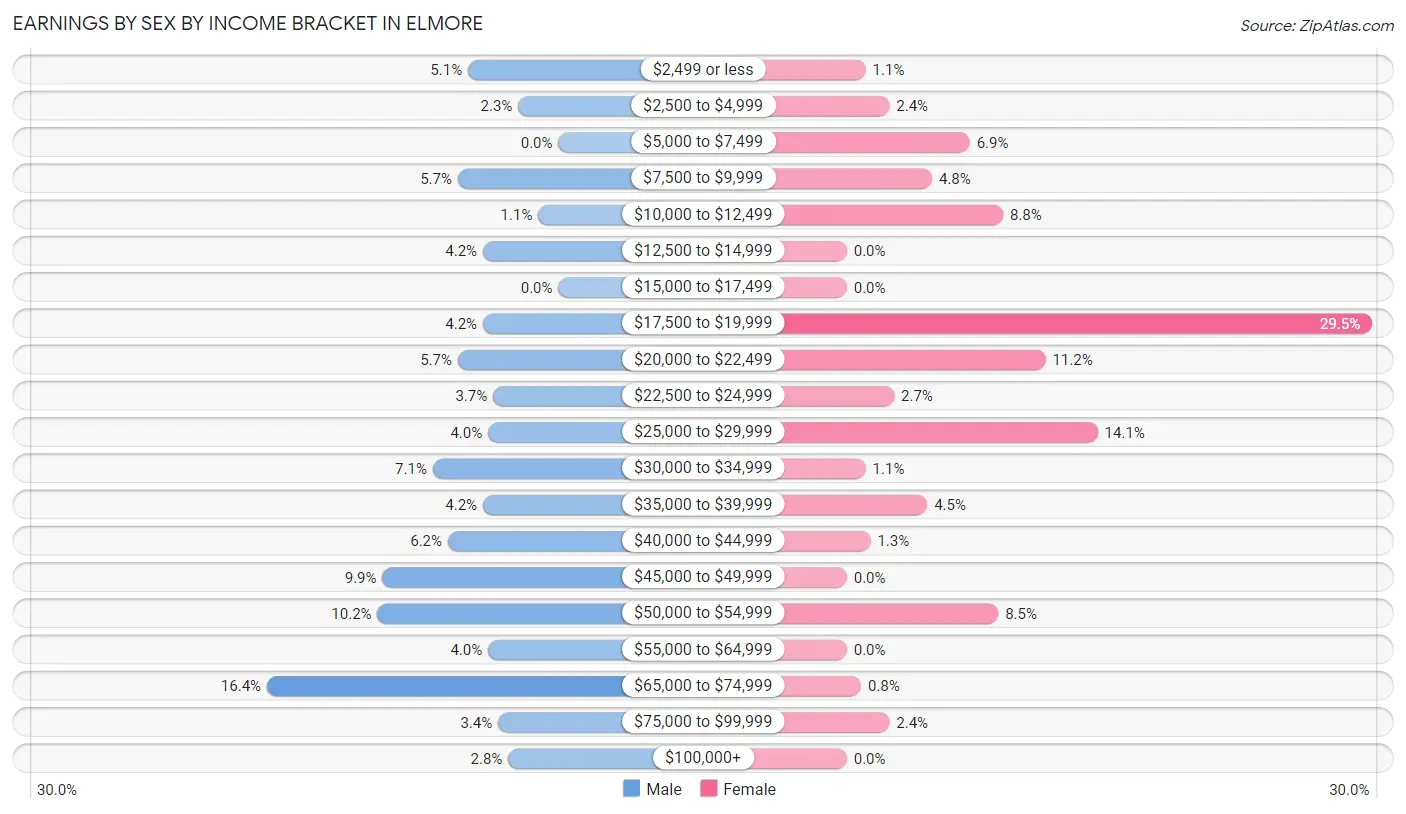
Earnings by Sex by Income Bracket in Elmore
The most common earnings brackets in Elmore are $65,000 to $74,999 for men (58 | 16.4%) and $17,500 to $19,999 for women (111 | 29.5%).
| Income | Male | Female |
| $2,499 or less | 18 (5.1%) | 4 (1.1%) |
| $2,500 to $4,999 | 8 (2.3%) | 9 (2.4%) |
| $5,000 to $7,499 | 0 (0.0%) | 26 (6.9%) |
| $7,500 to $9,999 | 20 (5.7%) | 18 (4.8%) |
| $10,000 to $12,499 | 4 (1.1%) | 33 (8.8%) |
| $12,500 to $14,999 | 15 (4.2%) | 0 (0.0%) |
| $15,000 to $17,499 | 0 (0.0%) | 0 (0.0%) |
| $17,500 to $19,999 | 15 (4.2%) | 111 (29.5%) |
| $20,000 to $22,499 | 20 (5.7%) | 42 (11.2%) |
| $22,500 to $24,999 | 13 (3.7%) | 10 (2.7%) |
| $25,000 to $29,999 | 14 (4.0%) | 53 (14.1%) |
| $30,000 to $34,999 | 25 (7.1%) | 4 (1.1%) |
| $35,000 to $39,999 | 15 (4.2%) | 17 (4.5%) |
| $40,000 to $44,999 | 22 (6.2%) | 5 (1.3%) |
| $45,000 to $49,999 | 35 (9.9%) | 0 (0.0%) |
| $50,000 to $54,999 | 36 (10.2%) | 32 (8.5%) |
| $55,000 to $64,999 | 14 (4.0%) | 0 (0.0%) |
| $65,000 to $74,999 | 58 (16.4%) | 3 (0.8%) |
| $75,000 to $99,999 | 12 (3.4%) | 9 (2.4%) |
| $100,000+ | 10 (2.8%) | 0 (0.0%) |
| Total | 354 (100.0%) | 376 (100.0%) |
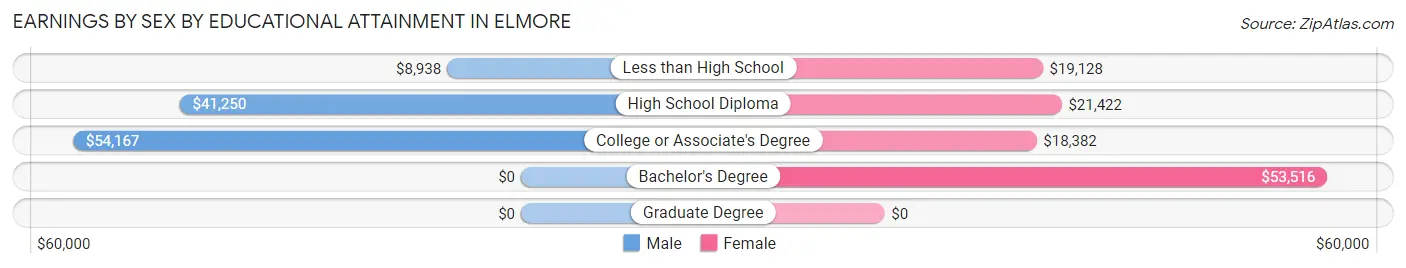
Earnings by Sex by Educational Attainment in Elmore
Average earnings in Elmore are $43,816 for men and $20,060 for women, a difference of 54.2%. Men with an educational attainment of college or associate's degree enjoy the highest average annual earnings of $54,167, while those with less than high school education earn the least with $8,938. Women with an educational attainment of bachelor's degree earn the most with the average annual earnings of $53,516, while those with college or associate's degree education have the smallest earnings of $18,382.
| Educational Attainment | Male Income | Female Income |
| Less than High School | $8,938 | $19,128 |
| High School Diploma | $41,250 | $21,422 |
| College or Associate's Degree | $54,167 | $18,382 |
| Bachelor's Degree | - | - |
| Graduate Degree | - | - |
| Total | $43,816 | $20,060 |
Family Income in Elmore
Family Income Brackets in Elmore
According to the Elmore family income data, there are 71 families falling into the $15,000 to $24,999 income range, which is the most common income bracket and makes up 20.2% of all families.
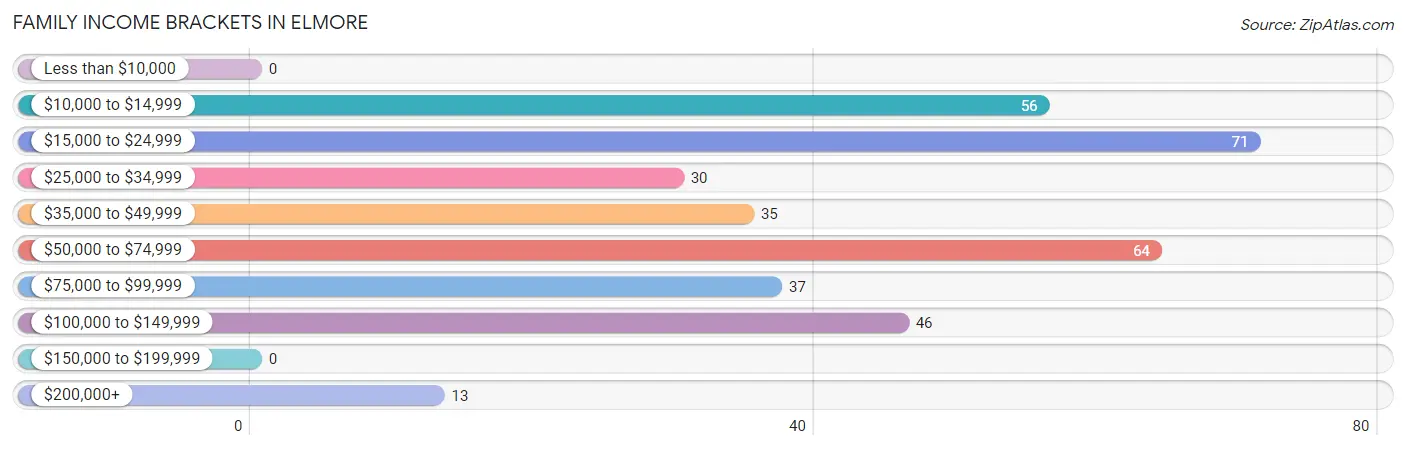
| Income Bracket | # Families | % Families |
| Less than $10,000 | 0 | 0.0% |
| $10,000 to $14,999 | 56 | 15.9% |
| $15,000 to $24,999 | 71 | 20.2% |
| $25,000 to $34,999 | 30 | 8.5% |
| $35,000 to $49,999 | 35 | 9.9% |
| $50,000 to $74,999 | 64 | 18.2% |
| $75,000 to $99,999 | 37 | 10.5% |
| $100,000 to $149,999 | 46 | 13.1% |
| $150,000 to $199,999 | 0 | 0.0% |
| $200,000+ | 13 | 3.7% |
Family Income by Famaliy Size in Elmore
4-person families (87 | 24.7%) account for the highest median family income in Elmore with $98,958 per family, while 4-person families (87 | 24.7%) have the highest median income of $24,740 per family member.
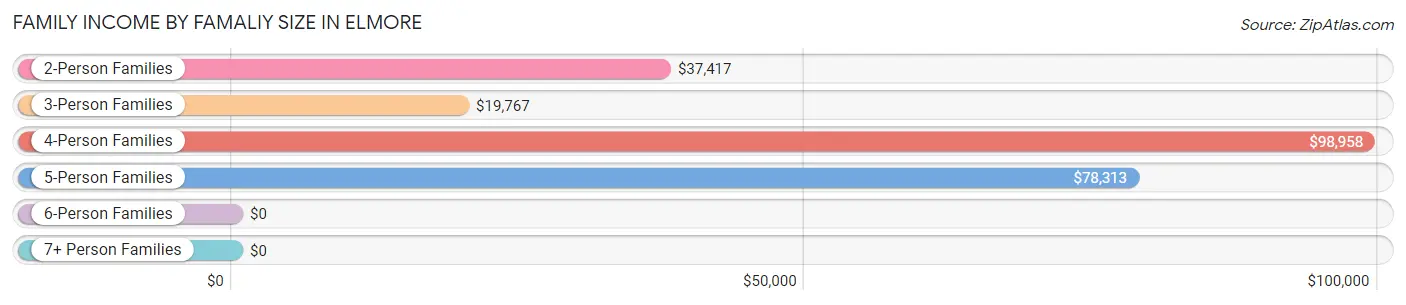
| Income Bracket | # Families | Median Income |
| 2-Person Families | 65 (18.5%) | $37,417 |
| 3-Person Families | 149 (42.3%) | $19,767 |
| 4-Person Families | 87 (24.7%) | $98,958 |
| 5-Person Families | 47 (13.4%) | $78,313 |
| 6-Person Families | 4 (1.1%) | $0 |
| 7+ Person Families | 0 (0.0%) | $0 |
| Total | 352 (100.0%) | $38,611 |
Family Income by Number of Earners in Elmore
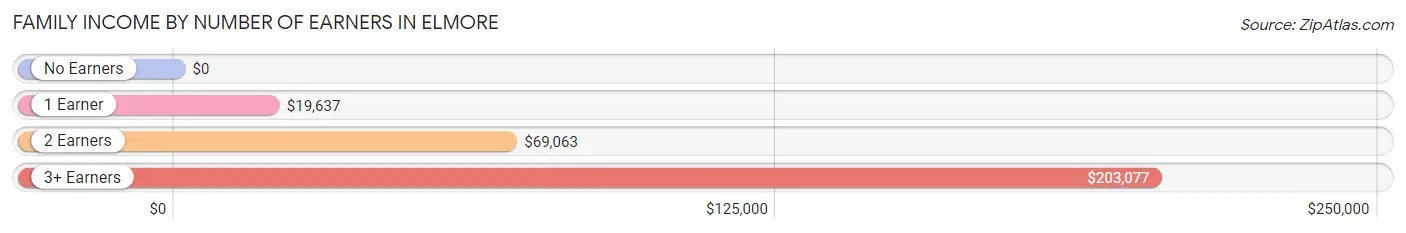
| Number of Earners | # Families | Median Income |
| No Earners | 49 (13.9%) | $0 |
| 1 Earner | 166 (47.2%) | $19,637 |
| 2 Earners | 117 (33.2%) | $69,063 |
| 3+ Earners | 20 (5.7%) | $203,077 |
| Total | 352 (100.0%) | $38,611 |
Household Income in Elmore
Household Income Brackets in Elmore
With 125 households falling in the category, the $10,000 to $14,999 income range is the most frequent in Elmore, accounting for 21.1% of all households.
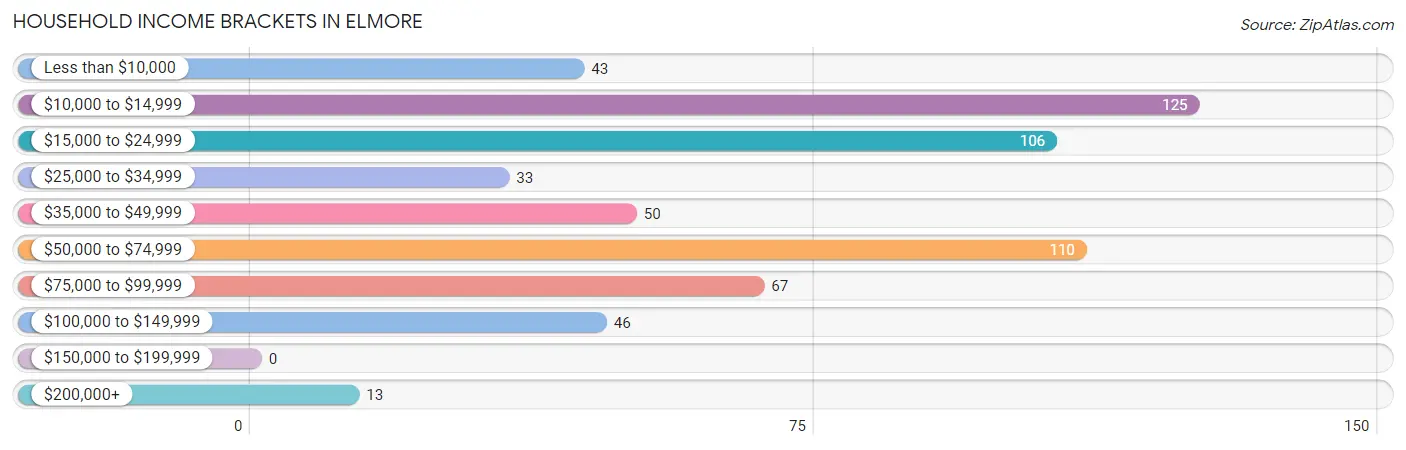
| Income Bracket | # Households | % Households |
| Less than $10,000 | 43 | 7.3% |
| $10,000 to $14,999 | 125 | 21.1% |
| $15,000 to $24,999 | 106 | 17.9% |
| $25,000 to $34,999 | 33 | 5.6% |
| $35,000 to $49,999 | 50 | 8.4% |
| $50,000 to $74,999 | 110 | 18.5% |
| $75,000 to $99,999 | 67 | 11.3% |
| $100,000 to $149,999 | 46 | 7.8% |
| $150,000 to $199,999 | 0 | 0.0% |
| $200,000+ | 13 | 2.2% |
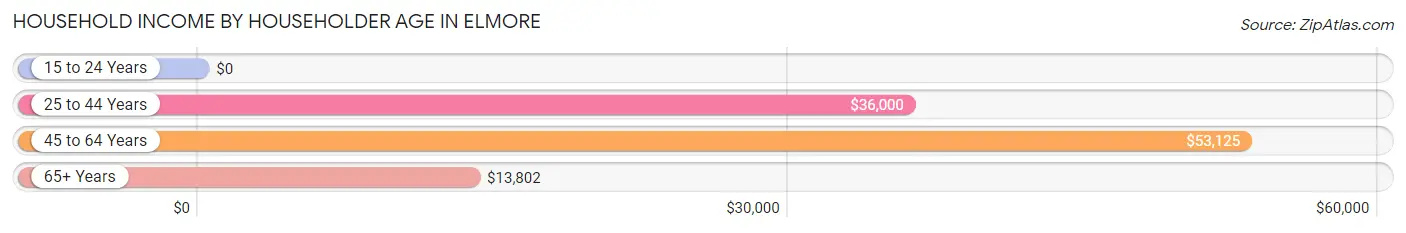
Household Income by Householder Age in Elmore
The median household income in Elmore is $29,946, with the highest median household income of $53,125 found in the 45 to 64 years age bracket for the primary householder. A total of 150 households (25.3%) fall into this category. Meanwhile, the 15 to 24 years age bracket for the primary householder has the lowest median household income of $0, with 66 households (11.1%) in this group.
| Income Bracket | # Households | Median Income |
| 15 to 24 Years | 66 (11.1%) | $0 |
| 25 to 44 Years | 224 (37.8%) | $36,000 |
| 45 to 64 Years | 150 (25.3%) | $53,125 |
| 65+ Years | 153 (25.8%) | $13,802 |
| Total | 593 (100.0%) | $29,946 |
Poverty in Elmore
Income Below Poverty by Sex and Age in Elmore
With 30.7% poverty level for males and 38.9% for females among the residents of Elmore, 6 to 11 year old males and 75 year old and over females are the most vulnerable to poverty, with 53 males (67.1%) and 84 females (71.2%) in their respective age groups living below the poverty level.
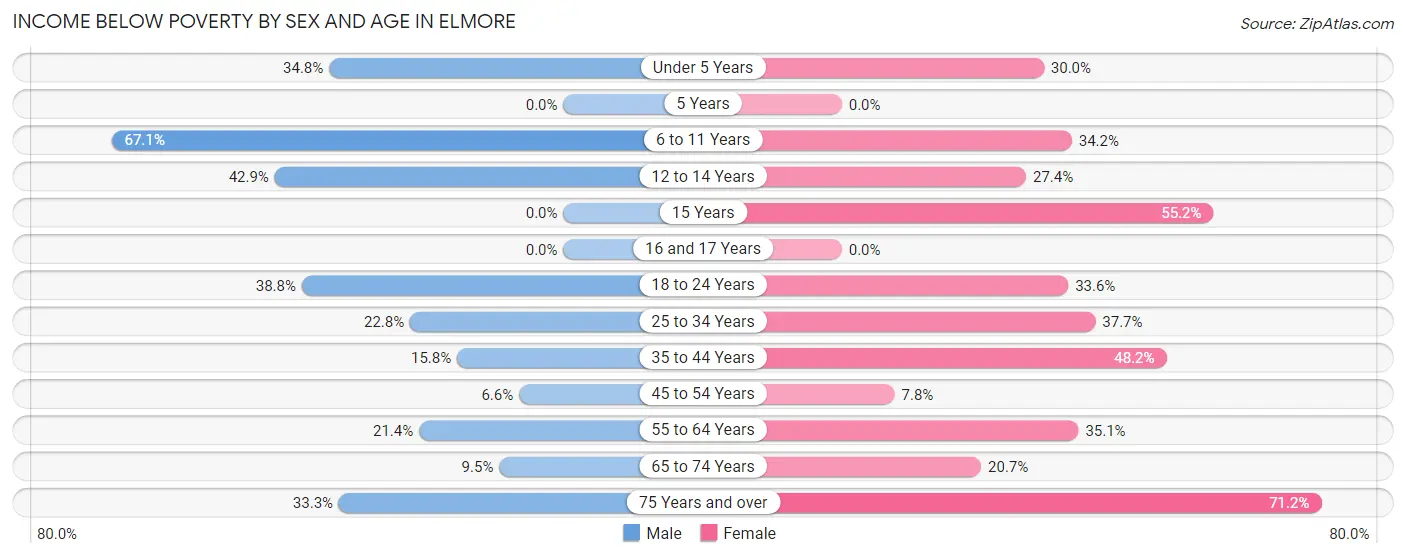
| Age Bracket | Male | Female |
| Under 5 Years | 8 (34.8%) | 9 (30.0%) |
| 5 Years | 0 (0.0%) | 0 (0.0%) |
| 6 to 11 Years | 53 (67.1%) | 14 (34.2%) |
| 12 to 14 Years | 24 (42.9%) | 29 (27.4%) |
| 15 Years | 0 (0.0%) | 16 (55.2%) |
| 16 and 17 Years | 0 (0.0%) | 0 (0.0%) |
| 18 to 24 Years | 47 (38.8%) | 39 (33.6%) |
| 25 to 34 Years | 33 (22.8%) | 61 (37.7%) |
| 35 to 44 Years | 9 (15.8%) | 80 (48.2%) |
| 45 to 54 Years | 5 (6.6%) | 4 (7.8%) |
| 55 to 64 Years | 6 (21.4%) | 26 (35.1%) |
| 65 to 74 Years | 2 (9.5%) | 6 (20.7%) |
| 75 Years and over | 5 (33.3%) | 84 (71.2%) |
| Total | 192 (30.7%) | 368 (38.9%) |
Income Above Poverty by Sex and Age in Elmore
According to the poverty statistics in Elmore, males aged 16 and 17 years and females aged 16 and 17 years are the age groups that are most secure financially, with 100.0% of males and 100.0% of females in these age groups living above the poverty line.
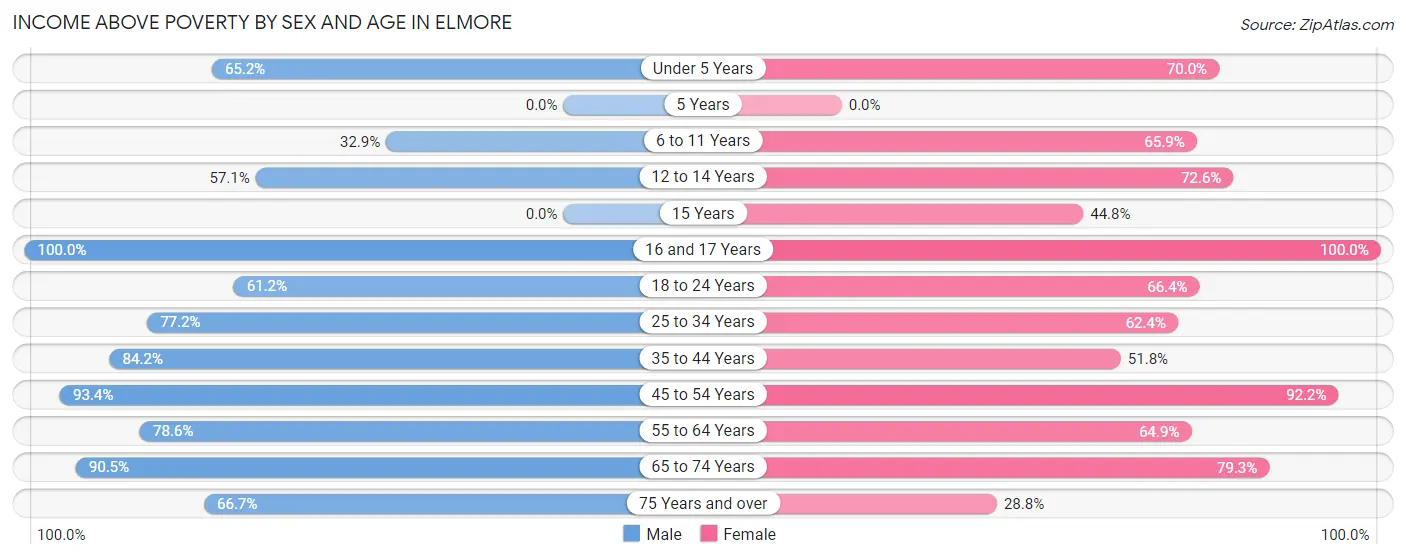
| Age Bracket | Male | Female |
| Under 5 Years | 15 (65.2%) | 21 (70.0%) |
| 5 Years | 0 (0.0%) | 0 (0.0%) |
| 6 to 11 Years | 26 (32.9%) | 27 (65.8%) |
| 12 to 14 Years | 32 (57.1%) | 77 (72.6%) |
| 15 Years | 0 (0.0%) | 13 (44.8%) |
| 16 and 17 Years | 5 (100.0%) | 25 (100.0%) |
| 18 to 24 Years | 74 (61.2%) | 77 (66.4%) |
| 25 to 34 Years | 112 (77.2%) | 101 (62.4%) |
| 35 to 44 Years | 48 (84.2%) | 86 (51.8%) |
| 45 to 54 Years | 71 (93.4%) | 47 (92.2%) |
| 55 to 64 Years | 22 (78.6%) | 48 (64.9%) |
| 65 to 74 Years | 19 (90.5%) | 23 (79.3%) |
| 75 Years and over | 10 (66.7%) | 34 (28.8%) |
| Total | 434 (69.3%) | 579 (61.1%) |
Income Below Poverty Among Married-Couple Families in Elmore
The poverty statistics for married-couple families in Elmore show that 9.1% or 15 of the total 165 families live below the poverty line. Families with 3 or 4 children have the highest poverty rate of 41.2%, comprising of 7 families. On the other hand, families with no children have the lowest poverty rate of 4.4%, which includes 3 families.
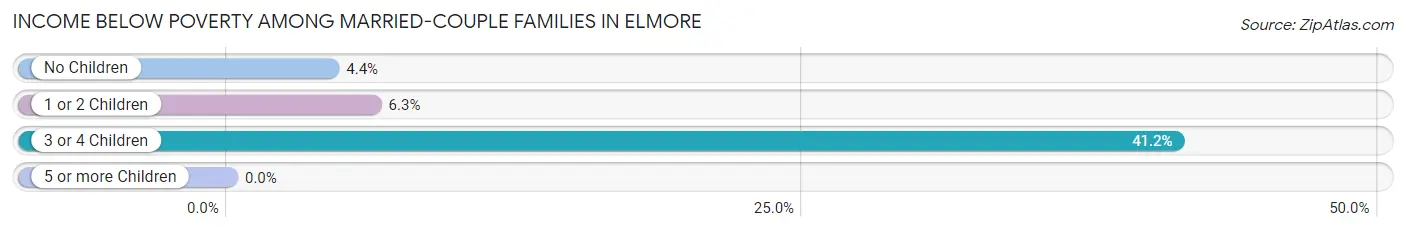
| Children | Above Poverty | Below Poverty |
| No Children | 65 (95.6%) | 3 (4.4%) |
| 1 or 2 Children | 75 (93.8%) | 5 (6.2%) |
| 3 or 4 Children | 10 (58.8%) | 7 (41.2%) |
| 5 or more Children | 0 (0.0%) | 0 (0.0%) |
| Total | 150 (90.9%) | 15 (9.1%) |
Income Below Poverty Among Single-Parent Households in Elmore
According to the poverty data in Elmore, 100.0% or 8 single-father households and 62.0% or 111 single-mother households are living below the poverty line. Among single-father households, those with no children have the highest poverty rate, with 5 households (100.0%) experiencing poverty. Likewise, among single-mother households, those with 1 or 2 children have the highest poverty rate, with 96 households (70.6%) falling below the poverty line.
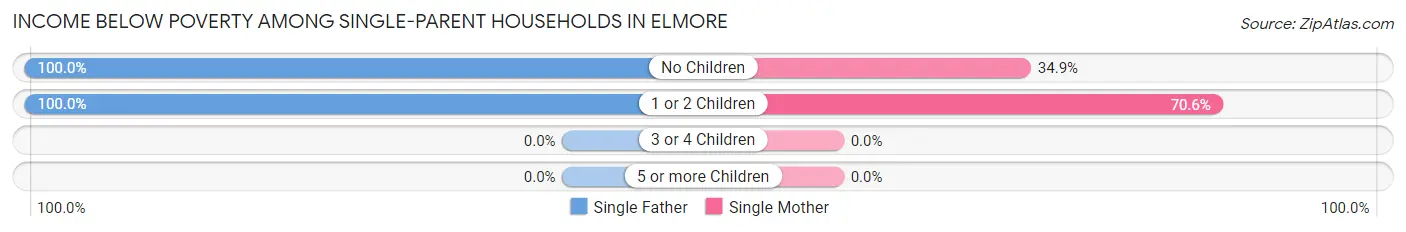
| Children | Single Father | Single Mother |
| No Children | 5 (100.0%) | 15 (34.9%) |
| 1 or 2 Children | 3 (100.0%) | 96 (70.6%) |
| 3 or 4 Children | 0 (0.0%) | 0 (0.0%) |
| 5 or more Children | 0 (0.0%) | 0 (0.0%) |
| Total | 8 (100.0%) | 111 (62.0%) |
Income Below Poverty Among Married-Couple vs Single-Parent Households in Elmore
The poverty data for Elmore shows that 15 of the married-couple family households (9.1%) and 119 of the single-parent households (63.6%) are living below the poverty level. Within the married-couple family households, those with 3 or 4 children have the highest poverty rate, with 7 households (41.2%) falling below the poverty line. Among the single-parent households, those with 1 or 2 children have the highest poverty rate, with 99 household (71.2%) living below poverty.
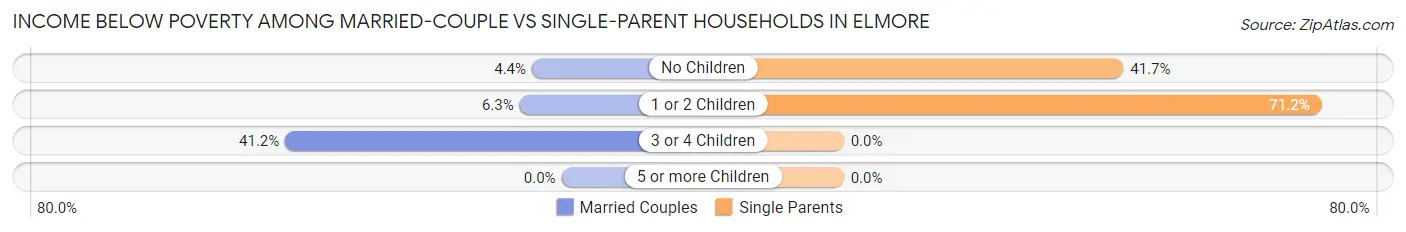
| Children | Married-Couple Families | Single-Parent Households |
| No Children | 3 (4.4%) | 20 (41.7%) |
| 1 or 2 Children | 5 (6.2%) | 99 (71.2%) |
| 3 or 4 Children | 7 (41.2%) | 0 (0.0%) |
| 5 or more Children | 0 (0.0%) | 0 (0.0%) |
| Total | 15 (9.1%) | 119 (63.6%) |
Race in Elmore
The most populous races in Elmore are White / Caucasian (1,069 | 68.0%), Black / African American (387 | 24.6%), and Two or more Races (110 | 7.0%).
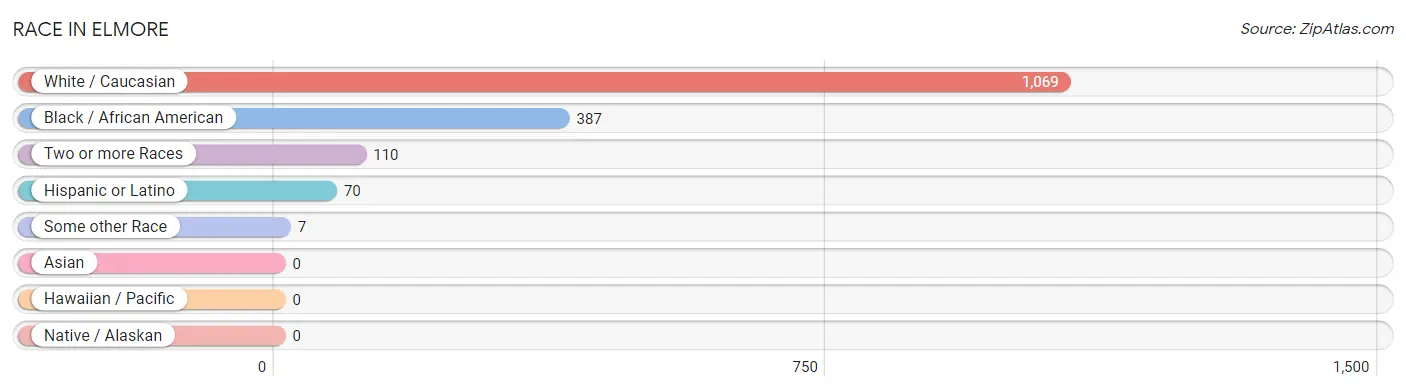
| Race | # Population | % Population |
| Asian | 0 | 0.0% |
| Black / African American | 387 | 24.6% |
| Hawaiian / Pacific | 0 | 0.0% |
| Hispanic or Latino | 70 | 4.4% |
| Native / Alaskan | 0 | 0.0% |
| White / Caucasian | 1,069 | 68.0% |
| Two or more Races | 110 | 7.0% |
| Some other Race | 7 | 0.4% |
| Total | 1,573 | 100.0% |
Ancestry in Elmore
The most populous ancestries reported in Elmore are English (155 | 9.9%), American (146 | 9.3%), Mexican (70 | 4.4%), African (62 | 3.9%), and Subsaharan African (62 | 3.9%), together accounting for 31.5% of all Elmore residents.
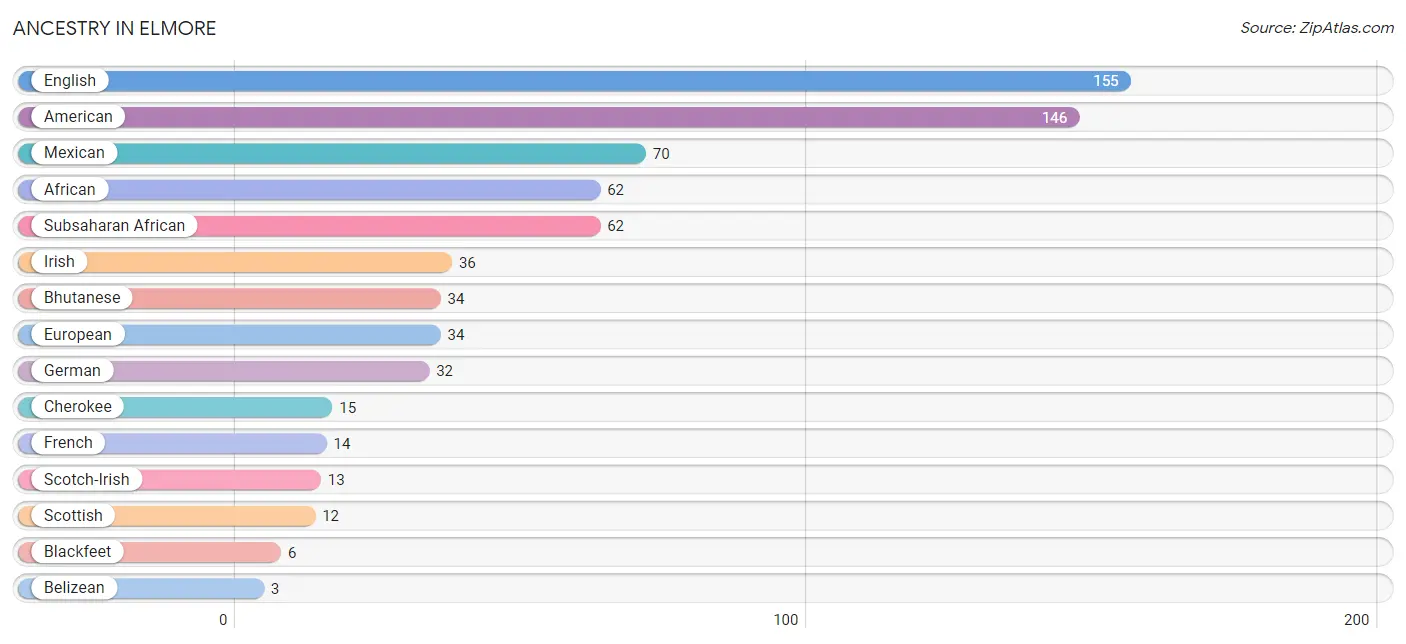
| Ancestry | # Population | % Population |
| African | 62 | 3.9% |
| American | 146 | 9.3% |
| Belizean | 3 | 0.2% |
| Bhutanese | 34 | 2.2% |
| Blackfeet | 6 | 0.4% |
| Cherokee | 15 | 0.9% |
| English | 155 | 9.9% |
| European | 34 | 2.2% |
| French | 14 | 0.9% |
| German | 32 | 2.0% |
| Irish | 36 | 2.3% |
| Italian | 2 | 0.1% |
| Mexican | 70 | 4.4% |
| Polish | 3 | 0.2% |
| Scotch-Irish | 13 | 0.8% |
| Scottish | 12 | 0.8% |
| Subsaharan African | 62 | 3.9% |
| Swedish | 3 | 0.2% | View All 18 Rows |
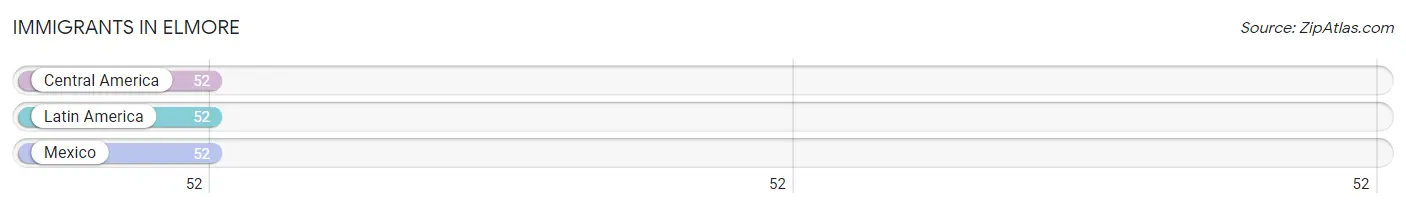
Immigrants in Elmore
The most numerous immigrant groups reported in Elmore came from Central America (52 | 3.3%), Latin America (52 | 3.3%), and Mexico (52 | 3.3%), together accounting for 9.9% of all Elmore residents.
| Immigration Origin | # Population | % Population |
| Central America | 52 | 3.3% |
| Latin America | 52 | 3.3% |
| Mexico | 52 | 3.3% | View All 3 Rows |
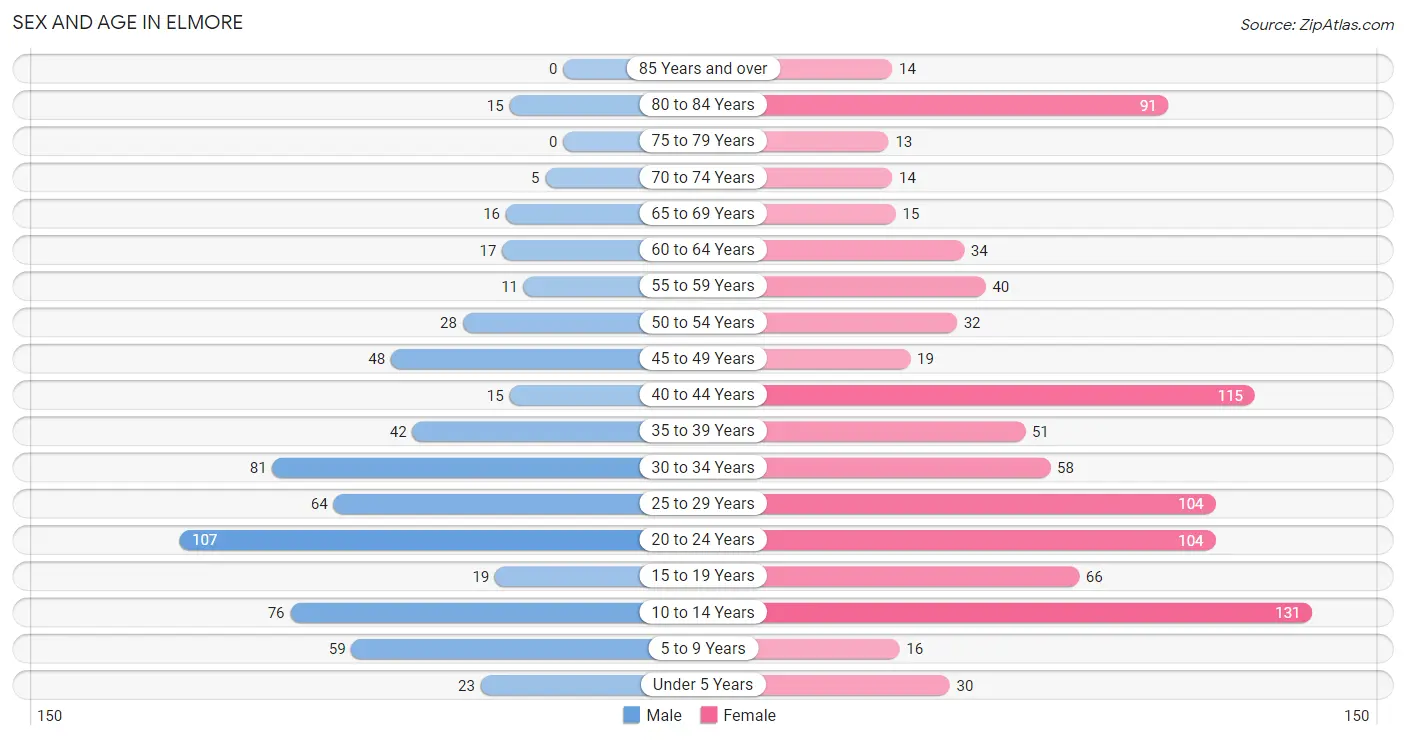
Sex and Age in Elmore
Sex and Age in Elmore
The most populous age groups in Elmore are 20 to 24 Years (107 | 17.1%) for men and 10 to 14 Years (131 | 13.8%) for women.
| Age Bracket | Male | Female |
| Under 5 Years | 23 (3.7%) | 30 (3.2%) |
| 5 to 9 Years | 59 (9.4%) | 16 (1.7%) |
| 10 to 14 Years | 76 (12.1%) | 131 (13.8%) |
| 15 to 19 Years | 19 (3.0%) | 66 (7.0%) |
| 20 to 24 Years | 107 (17.1%) | 104 (11.0%) |
| 25 to 29 Years | 64 (10.2%) | 104 (11.0%) |
| 30 to 34 Years | 81 (12.9%) | 58 (6.1%) |
| 35 to 39 Years | 42 (6.7%) | 51 (5.4%) |
| 40 to 44 Years | 15 (2.4%) | 115 (12.1%) |
| 45 to 49 Years | 48 (7.7%) | 19 (2.0%) |
| 50 to 54 Years | 28 (4.5%) | 32 (3.4%) |
| 55 to 59 Years | 11 (1.8%) | 40 (4.2%) |
| 60 to 64 Years | 17 (2.7%) | 34 (3.6%) |
| 65 to 69 Years | 16 (2.6%) | 15 (1.6%) |
| 70 to 74 Years | 5 (0.8%) | 14 (1.5%) |
| 75 to 79 Years | 0 (0.0%) | 13 (1.4%) |
| 80 to 84 Years | 15 (2.4%) | 91 (9.6%) |
| 85 Years and over | 0 (0.0%) | 14 (1.5%) |
| Total | 626 (100.0%) | 947 (100.0%) |
Families and Households in Elmore
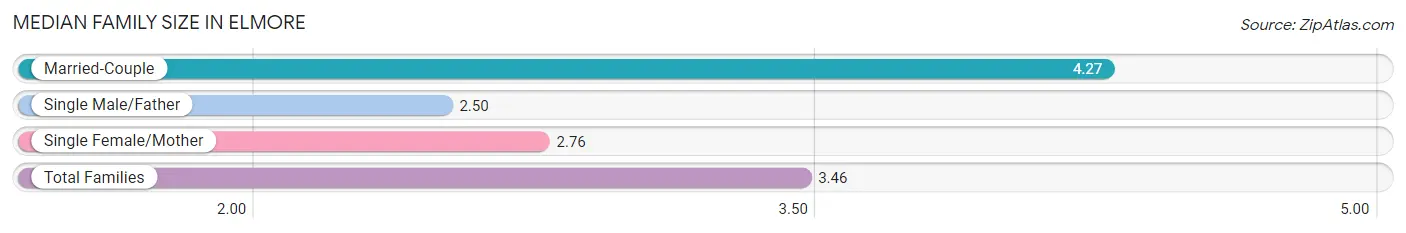
Median Family Size in Elmore
The median family size in Elmore is 3.46 persons per family, with married-couple families (165 | 46.9%) accounting for the largest median family size of 4.27 persons per family. On the other hand, single male/father families (8 | 2.3%) represent the smallest median family size with 2.50 persons per family.
| Family Type | # Families | Family Size |
| Married-Couple | 165 (46.9%) | 4.27 |
| Single Male/Father | 8 (2.3%) | 2.50 |
| Single Female/Mother | 179 (50.8%) | 2.76 |
| Total Families | 352 (100.0%) | 3.46 |
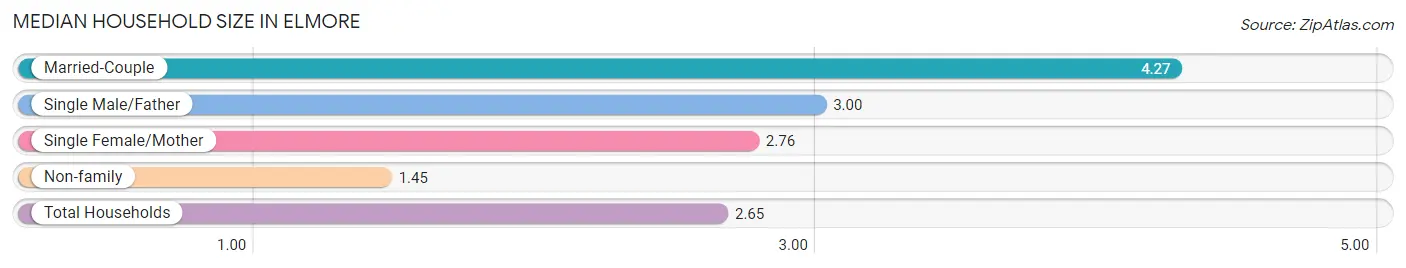
Median Household Size in Elmore
The median household size in Elmore is 2.65 persons per household, with married-couple households (165 | 27.8%) accounting for the largest median household size of 4.27 persons per household. non-family households (241 | 40.6%) represent the smallest median household size with 1.45 persons per household.
| Household Type | # Households | Household Size |
| Married-Couple | 165 (27.8%) | 4.27 |
| Single Male/Father | 8 (1.3%) | 3.00 |
| Single Female/Mother | 179 (30.2%) | 2.76 |
| Non-family | 241 (40.6%) | 1.45 |
| Total Households | 593 (100.0%) | 2.65 |
Household Size by Marriage Status in Elmore
Out of a total of 593 households in Elmore, 352 (59.4%) are family households, while 241 (40.6%) are nonfamily households. The most numerous type of family households are 3-person households, comprising 146, and the most common type of nonfamily households are 1-person households, comprising 153.
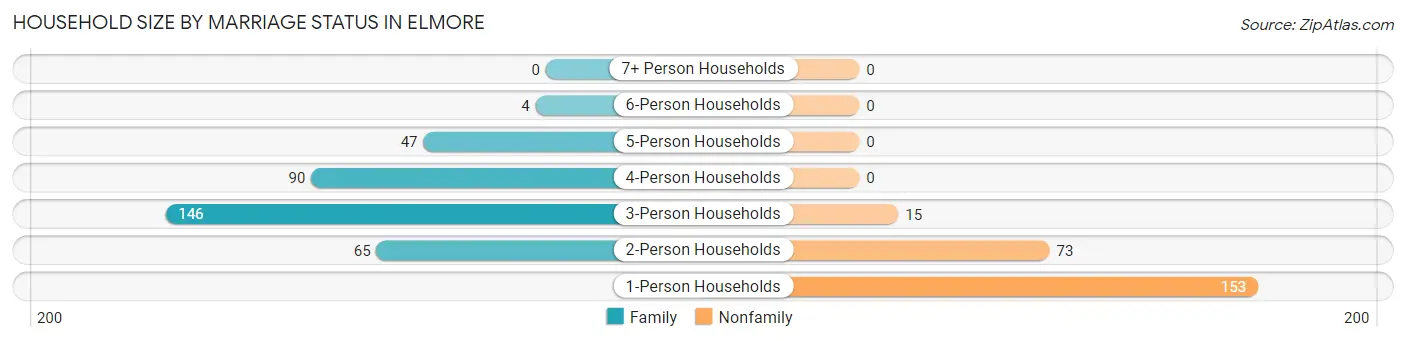
| Household Size | Family Households | Nonfamily Households |
| 1-Person Households | - | 153 (25.8%) |
| 2-Person Households | 65 (11.0%) | 73 (12.3%) |
| 3-Person Households | 146 (24.6%) | 15 (2.5%) |
| 4-Person Households | 90 (15.2%) | 0 (0.0%) |
| 5-Person Households | 47 (7.9%) | 0 (0.0%) |
| 6-Person Households | 4 (0.7%) | 0 (0.0%) |
| 7+ Person Households | 0 (0.0%) | 0 (0.0%) |
| Total | 352 (59.4%) | 241 (40.6%) |
Female Fertility in Elmore
Fertility by Age in Elmore
Average fertility rate in Elmore is 6.0 births per 1,000 women. Women in the age bracket of 20 to 34 years have the highest fertility rate with 11.0 births per 1,000 women. Women in the age bracket of 20 to 34 years acount for 100.0% of all women with births.
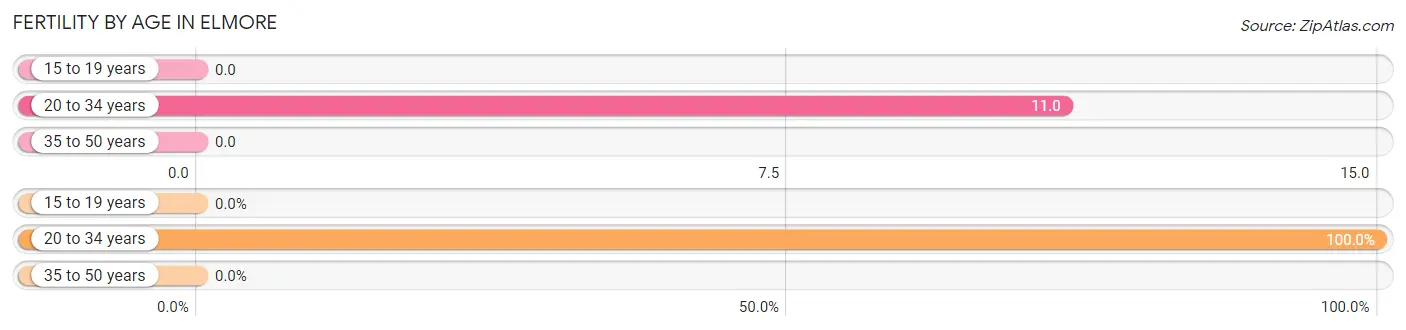
| Age Bracket | Women with Births | Births / 1,000 Women |
| 15 to 19 years | 0 (0.0%) | 0.0 |
| 20 to 34 years | 3 (100.0%) | 11.0 |
| 35 to 50 years | 0 (0.0%) | 0.0 |
| Total | 3 (100.0%) | 6.0 |
Fertility by Age by Marriage Status in Elmore
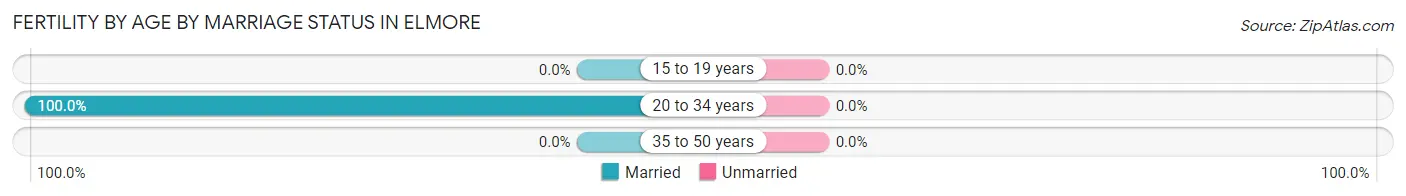
| Age Bracket | Married | Unmarried |
| 15 to 19 years | 0 (0.0%) | 0 (0.0%) |
| 20 to 34 years | 3 (100.0%) | 0 (0.0%) |
| 35 to 50 years | 0 (0.0%) | 0 (0.0%) |
| Total | 3 (100.0%) | 0 (0.0%) |
Fertility by Education in Elmore
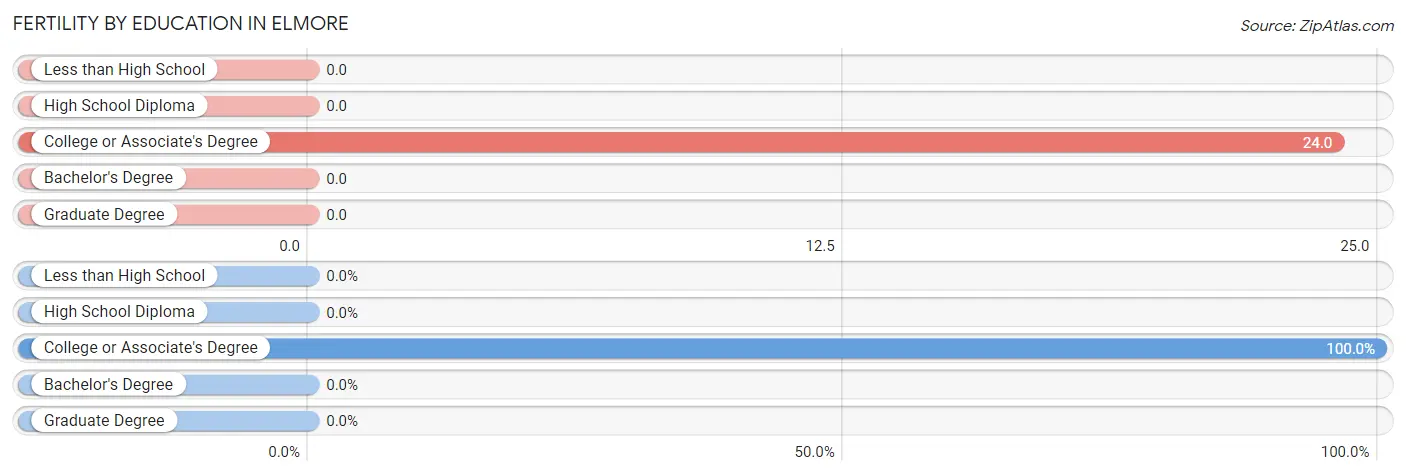
| Educational Attainment | Women with Births | Births / 1,000 Women |
| Less than High School | 0 (0.0%) | 0.0 |
| High School Diploma | 0 (0.0%) | 0.0 |
| College or Associate's Degree | 3 (100.0%) | 24.0 |
| Bachelor's Degree | 0 (0.0%) | 0.0 |
| Graduate Degree | 0 (0.0%) | 0.0 |
| Total | 3 (100.0%) | 6.0 |
Fertility by Education by Marriage Status in Elmore
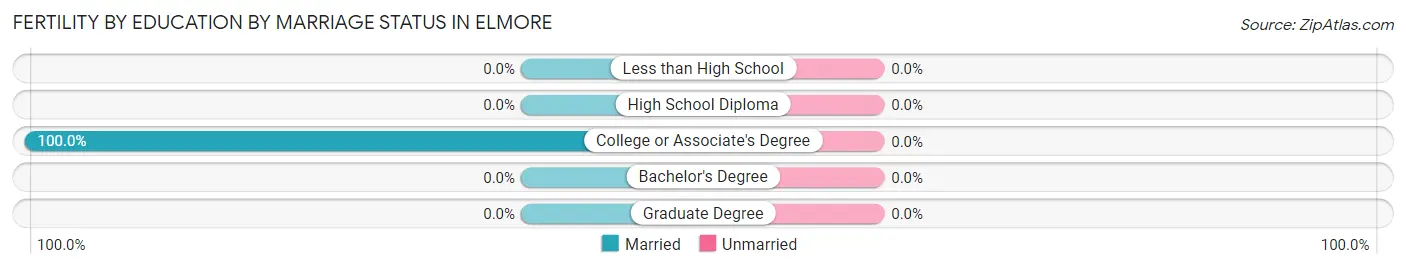
| Educational Attainment | Married | Unmarried |
| Less than High School | 0 (0.0%) | 0 (0.0%) |
| High School Diploma | 0 (0.0%) | 0 (0.0%) |
| College or Associate's Degree | 3 (100.0%) | 0 (0.0%) |
| Bachelor's Degree | 0 (0.0%) | 0 (0.0%) |
| Graduate Degree | 0 (0.0%) | 0 (0.0%) |
| Total | 3 (100.0%) | 0 (0.0%) |
Employment Characteristics in Elmore
Employment by Class of Employer in Elmore
Among the 706 employed individuals in Elmore, private company employees (548 | 77.6%), local government employees (71 | 10.1%), and self-employed (not incorporated) (36 | 5.1%) make up the most common classes of employment.
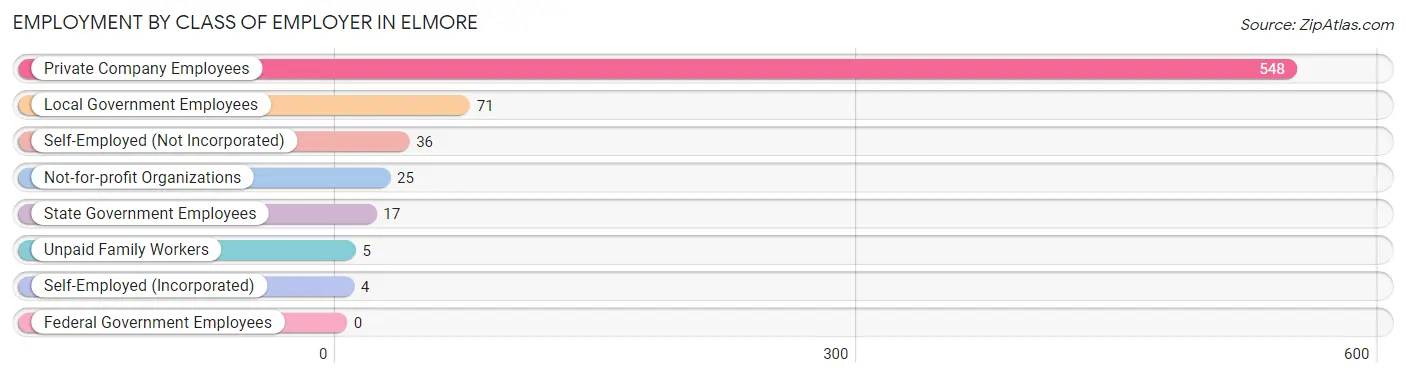
| Employer Class | # Employees | % Employees |
| Private Company Employees | 548 | 77.6% |
| Self-Employed (Incorporated) | 4 | 0.6% |
| Self-Employed (Not Incorporated) | 36 | 5.1% |
| Not-for-profit Organizations | 25 | 3.5% |
| Local Government Employees | 71 | 10.1% |
| State Government Employees | 17 | 2.4% |
| Federal Government Employees | 0 | 0.0% |
| Unpaid Family Workers | 5 | 0.7% |
| Total | 706 | 100.0% |
Employment Status by Age in Elmore
According to the labor force statistics for Elmore, out of the total population over 16 years of age (1,209), 66.3% or 802 individuals are in the labor force, with 11.9% or 95 of them unemployed. The age group with the highest labor force participation rate is 30 to 34 years, with 97.8% or 136 individuals in the labor force. Within the labor force, the 20 to 24 years age range has the highest percentage of unemployed individuals, with 19.8% or 33 of them being unemployed.
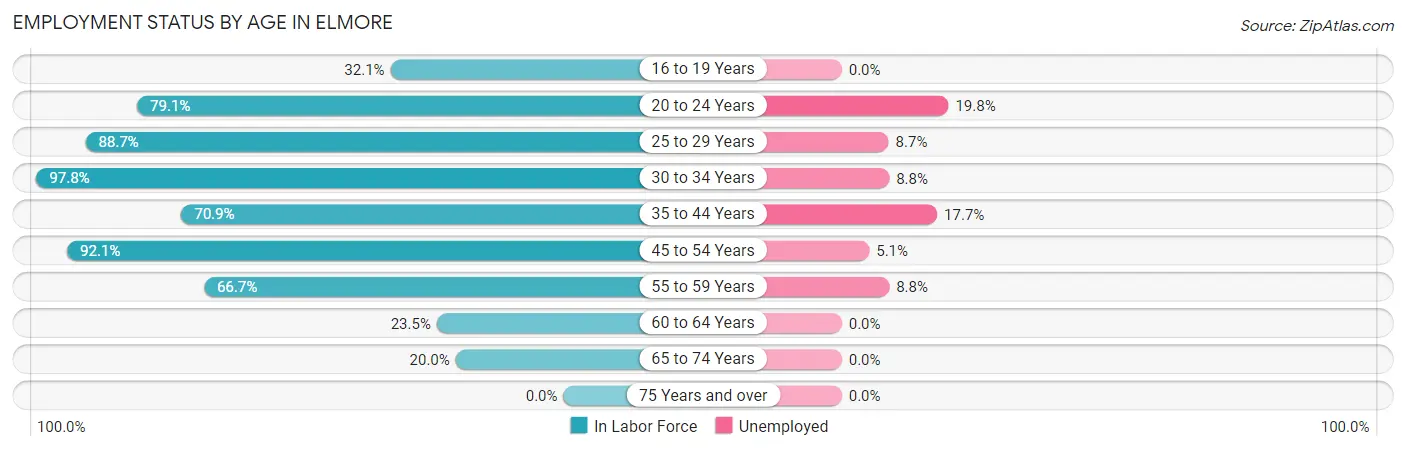
| Age Bracket | In Labor Force | Unemployed |
| 16 to 19 Years | 18 (32.1%) | 0 (0.0%) |
| 20 to 24 Years | 167 (79.1%) | 33 (19.8%) |
| 25 to 29 Years | 149 (88.7%) | 13 (8.7%) |
| 30 to 34 Years | 136 (97.8%) | 12 (8.8%) |
| 35 to 44 Years | 158 (70.9%) | 28 (17.7%) |
| 45 to 54 Years | 117 (92.1%) | 6 (5.1%) |
| 55 to 59 Years | 34 (66.7%) | 3 (8.8%) |
| 60 to 64 Years | 12 (23.5%) | 0 (0.0%) |
| 65 to 74 Years | 10 (20.0%) | 0 (0.0%) |
| 75 Years and over | 0 (0.0%) | 0 (0.0%) |
| Total | 802 (66.3%) | 95 (11.9%) |
Employment Status by Educational Attainment in Elmore
According to labor force statistics for Elmore, 79.8% of individuals (606) out of the total population between 25 and 64 years of age (759) are in the labor force, with 10.2% or 62 of them being unemployed. The group with the highest labor force participation rate are those with the educational attainment of bachelor's degree or higher, with 96.2% or 75 individuals in the labor force. Within the labor force, individuals with high school diploma education have the highest percentage of unemployment, with 14.4% or 41 of them being unemployed.
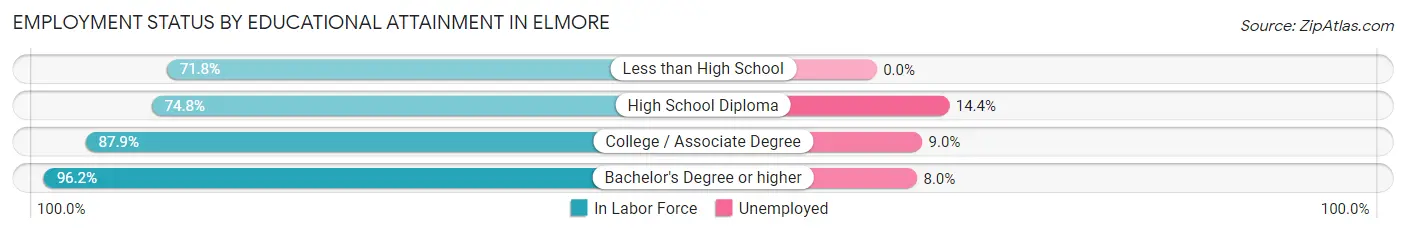
| Educational Attainment | In Labor Force | Unemployed |
| Less than High School | 79 (71.8%) | 0 (0.0%) |
| High School Diploma | 285 (74.8%) | 55 (14.4%) |
| College / Associate Degree | 167 (87.9%) | 17 (9.0%) |
| Bachelor's Degree or higher | 75 (96.2%) | 6 (8.0%) |
| Total | 606 (79.8%) | 77 (10.2%) |
Employment Occupations by Sex in Elmore
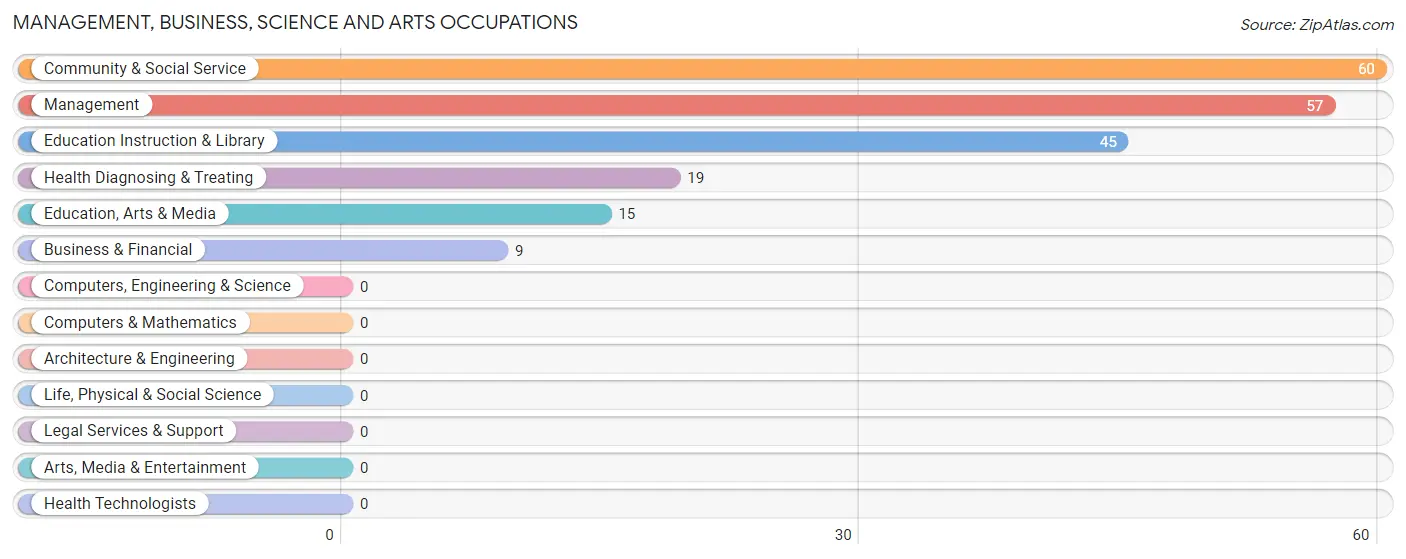
Management, Business, Science and Arts Occupations
The most common Management, Business, Science and Arts occupations in Elmore are Community & Social Service (60 | 8.5%), Management (57 | 8.1%), Education Instruction & Library (45 | 6.4%), Health Diagnosing & Treating (19 | 2.7%), and Education, Arts & Media (15 | 2.1%).
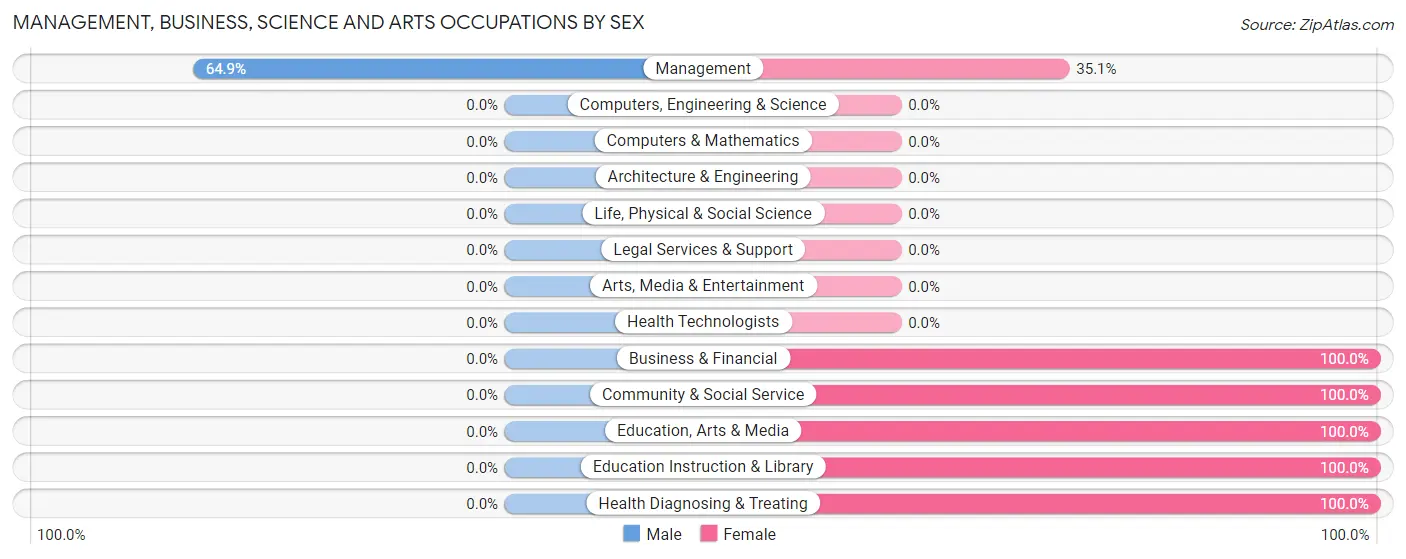
Management, Business, Science and Arts Occupations by Sex
| Occupation | Male | Female |
| Management | 37 (64.9%) | 20 (35.1%) |
| Business & Financial | 0 (0.0%) | 9 (100.0%) |
| Computers, Engineering & Science | 0 (0.0%) | 0 (0.0%) |
| Computers & Mathematics | 0 (0.0%) | 0 (0.0%) |
| Architecture & Engineering | 0 (0.0%) | 0 (0.0%) |
| Life, Physical & Social Science | 0 (0.0%) | 0 (0.0%) |
| Community & Social Service | 0 (0.0%) | 60 (100.0%) |
| Education, Arts & Media | 0 (0.0%) | 15 (100.0%) |
| Legal Services & Support | 0 (0.0%) | 0 (0.0%) |
| Education Instruction & Library | 0 (0.0%) | 45 (100.0%) |
| Arts, Media & Entertainment | 0 (0.0%) | 0 (0.0%) |
| Health Diagnosing & Treating | 0 (0.0%) | 19 (100.0%) |
| Health Technologists | 0 (0.0%) | 0 (0.0%) |
| Total (Category) | 37 (25.5%) | 108 (74.5%) |
| Total (Overall) | 351 (49.7%) | 355 (50.3%) |
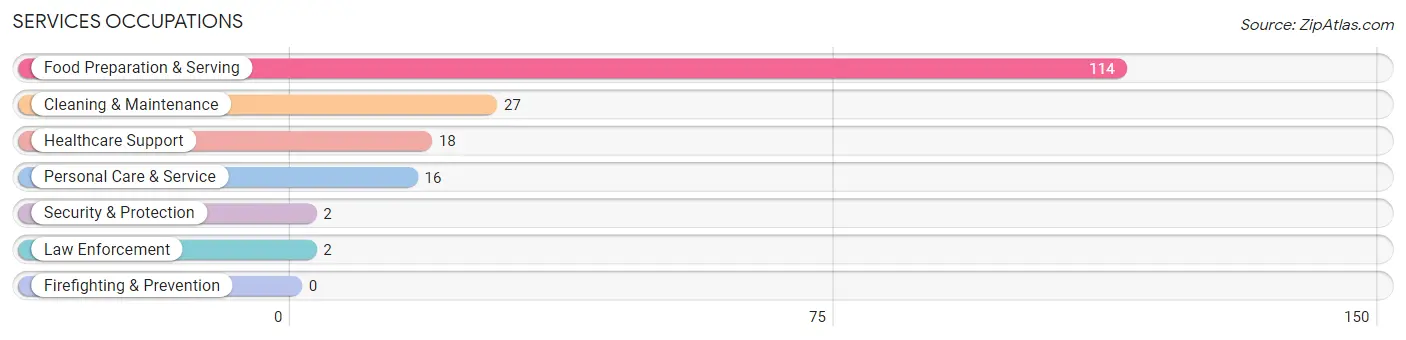
Services Occupations
The most common Services occupations in Elmore are Food Preparation & Serving (114 | 16.2%), Cleaning & Maintenance (27 | 3.8%), Healthcare Support (18 | 2.5%), Personal Care & Service (16 | 2.3%), and Security & Protection (2 | 0.3%).
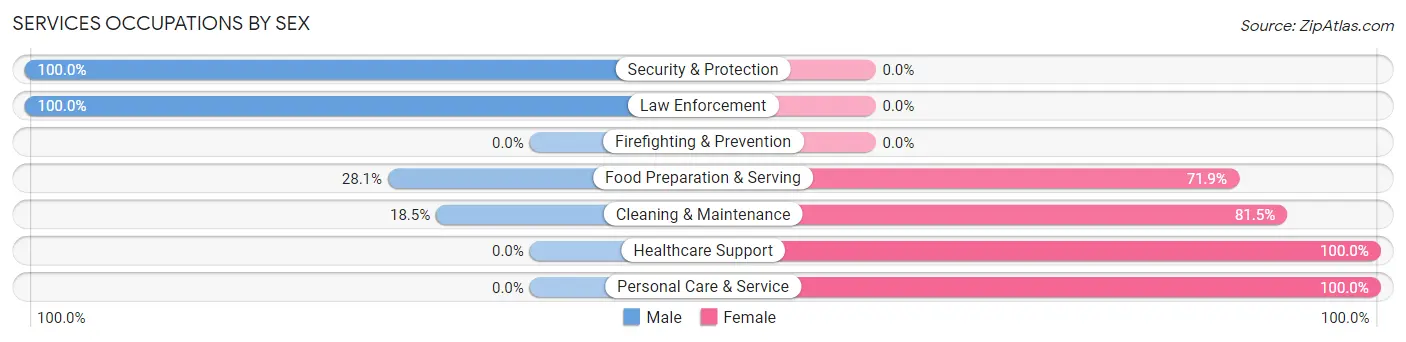
Services Occupations by Sex
Within the Services occupations in Elmore, the most male-oriented occupations are Security & Protection (100.0%), Law Enforcement (100.0%), and Food Preparation & Serving (28.1%), while the most female-oriented occupations are Healthcare Support (100.0%), Personal Care & Service (100.0%), and Cleaning & Maintenance (81.5%).
| Occupation | Male | Female |
| Healthcare Support | 0 (0.0%) | 18 (100.0%) |
| Security & Protection | 2 (100.0%) | 0 (0.0%) |
| Firefighting & Prevention | 0 (0.0%) | 0 (0.0%) |
| Law Enforcement | 2 (100.0%) | 0 (0.0%) |
| Food Preparation & Serving | 32 (28.1%) | 82 (71.9%) |
| Cleaning & Maintenance | 5 (18.5%) | 22 (81.5%) |
| Personal Care & Service | 0 (0.0%) | 16 (100.0%) |
| Total (Category) | 39 (22.0%) | 138 (78.0%) |
| Total (Overall) | 351 (49.7%) | 355 (50.3%) |
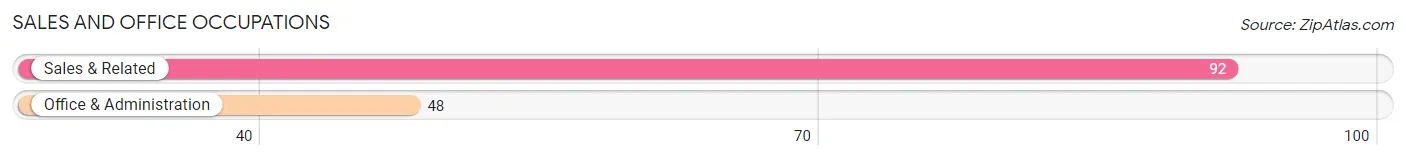
Sales and Office Occupations
The most common Sales and Office occupations in Elmore are Sales & Related (92 | 13.0%), and Office & Administration (48 | 6.8%).
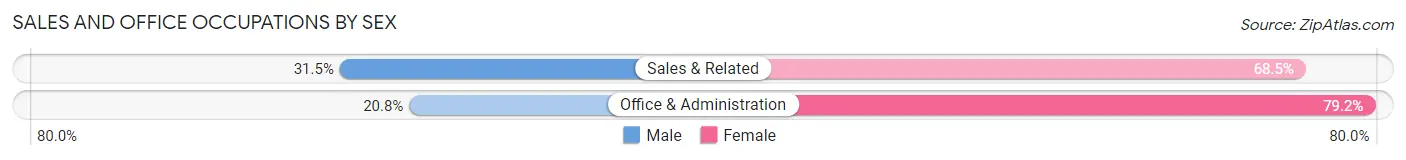
Sales and Office Occupations by Sex
| Occupation | Male | Female |
| Sales & Related | 29 (31.5%) | 63 (68.5%) |
| Office & Administration | 10 (20.8%) | 38 (79.2%) |
| Total (Category) | 39 (27.9%) | 101 (72.1%) |
| Total (Overall) | 351 (49.7%) | 355 (50.3%) |
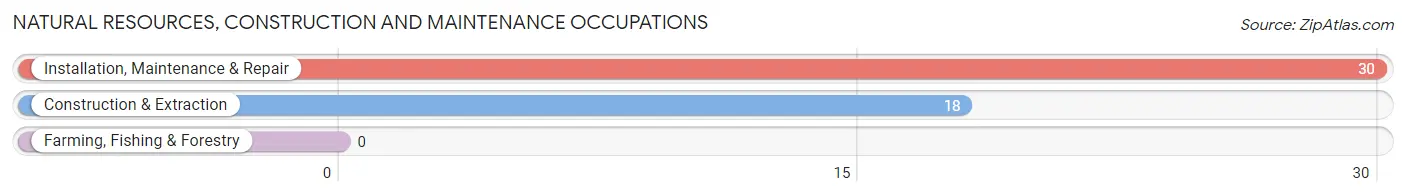
Natural Resources, Construction and Maintenance Occupations
The most common Natural Resources, Construction and Maintenance occupations in Elmore are Installation, Maintenance & Repair (30 | 4.3%), and Construction & Extraction (18 | 2.5%).
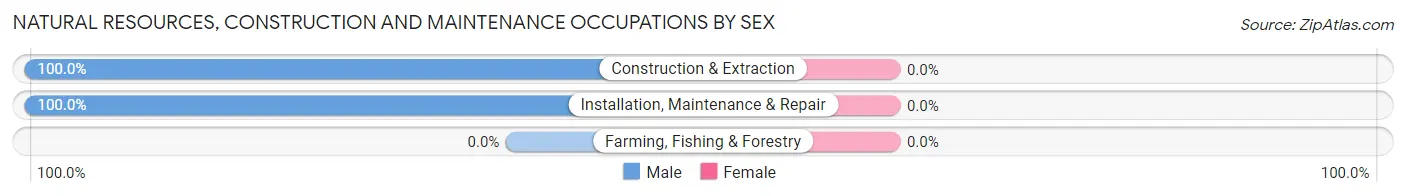
Natural Resources, Construction and Maintenance Occupations by Sex
| Occupation | Male | Female |
| Farming, Fishing & Forestry | 0 (0.0%) | 0 (0.0%) |
| Construction & Extraction | 18 (100.0%) | 0 (0.0%) |
| Installation, Maintenance & Repair | 30 (100.0%) | 0 (0.0%) |
| Total (Category) | 48 (100.0%) | 0 (0.0%) |
| Total (Overall) | 351 (49.7%) | 355 (50.3%) |
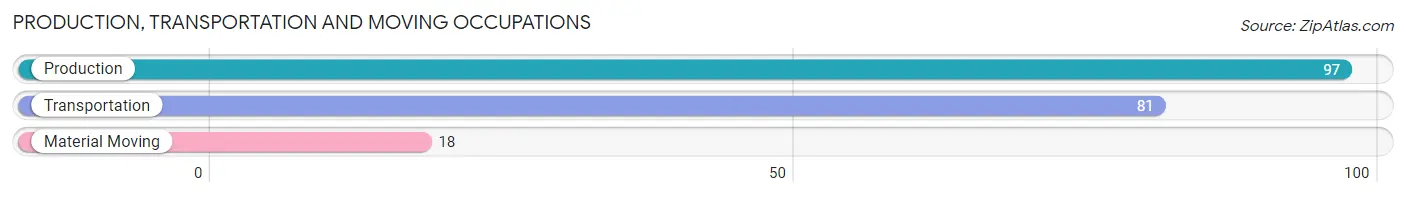
Production, Transportation and Moving Occupations
The most common Production, Transportation and Moving occupations in Elmore are Production (97 | 13.7%), Transportation (81 | 11.5%), and Material Moving (18 | 2.5%).
Production, Transportation and Moving Occupations by Sex
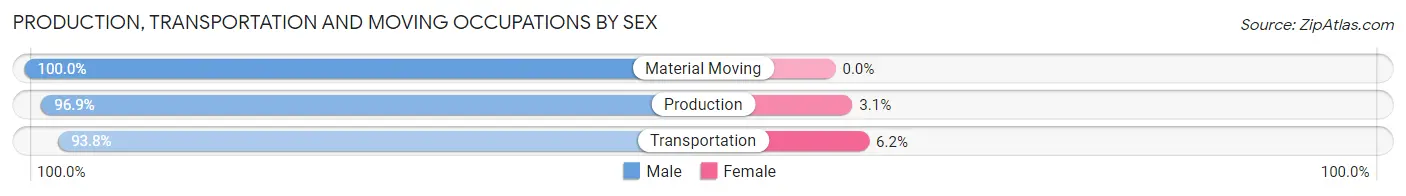
| Occupation | Male | Female |
| Production | 94 (96.9%) | 3 (3.1%) |
| Transportation | 76 (93.8%) | 5 (6.2%) |
| Material Moving | 18 (100.0%) | 0 (0.0%) |
| Total (Category) | 188 (95.9%) | 8 (4.1%) |
| Total (Overall) | 351 (49.7%) | 355 (50.3%) |
Employment Industries by Sex in Elmore
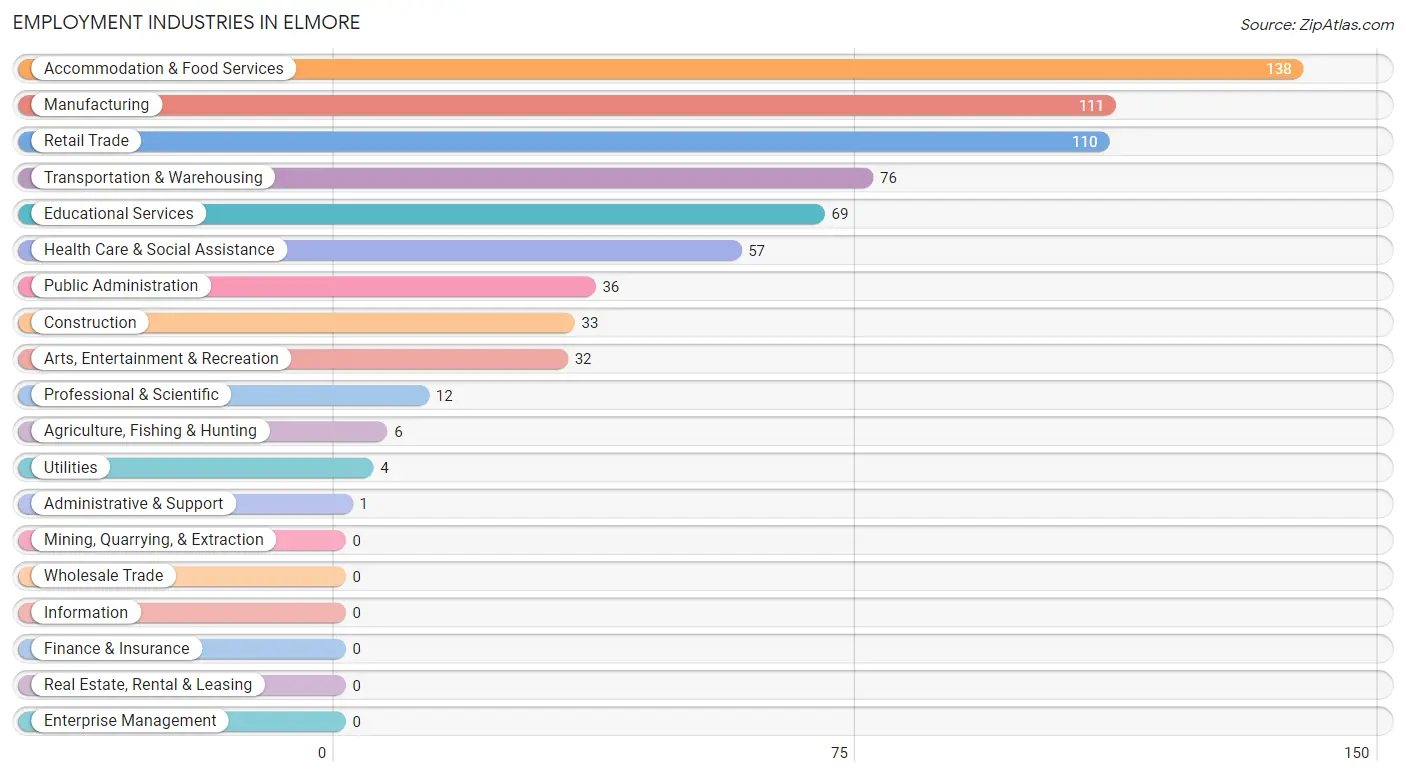
Employment Industries in Elmore
The major employment industries in Elmore include Accommodation & Food Services (138 | 19.6%), Manufacturing (111 | 15.7%), Retail Trade (110 | 15.6%), Transportation & Warehousing (76 | 10.8%), and Educational Services (69 | 9.8%).
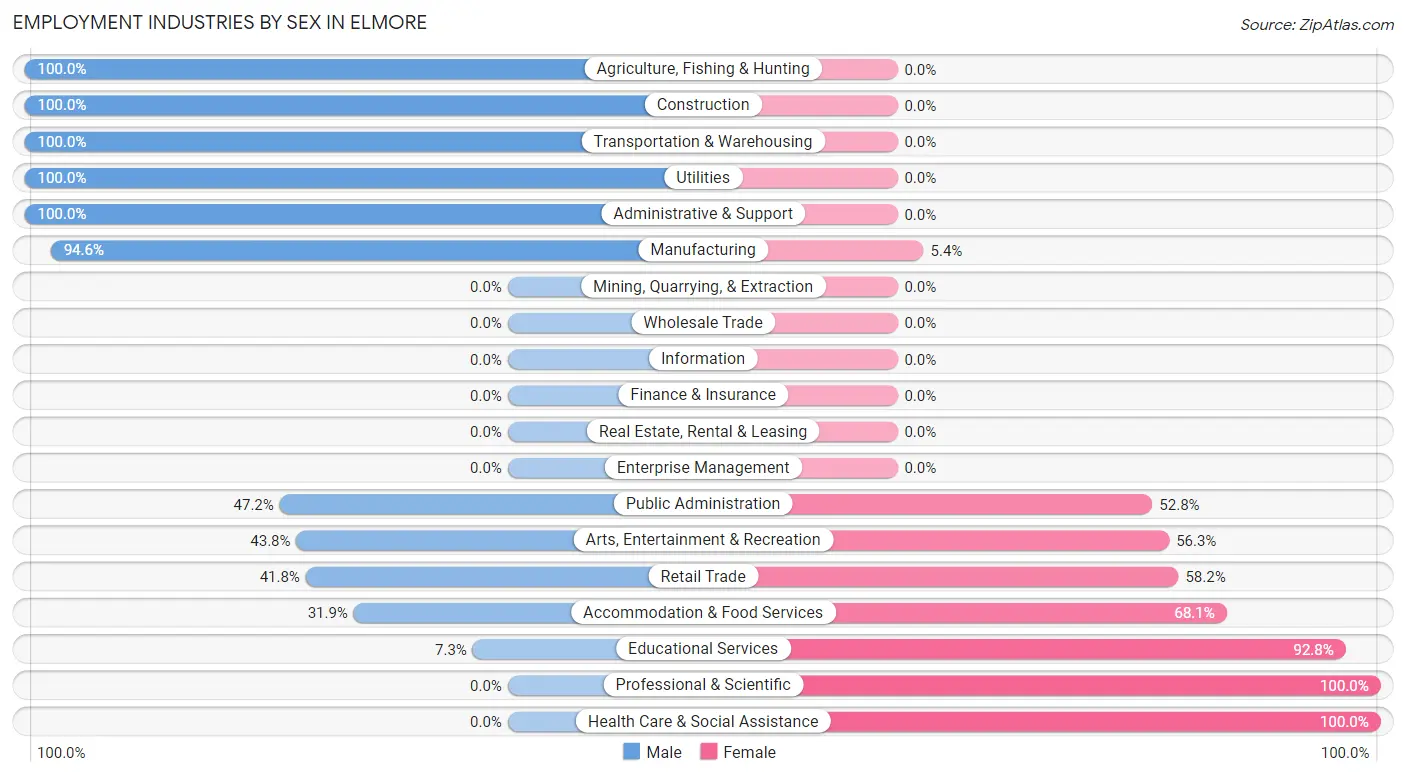
Employment Industries by Sex in Elmore
The Elmore industries that see more men than women are Agriculture, Fishing & Hunting (100.0%), Construction (100.0%), and Transportation & Warehousing (100.0%), whereas the industries that tend to have a higher number of women are Professional & Scientific (100.0%), Health Care & Social Assistance (100.0%), and Educational Services (92.7%).
| Industry | Male | Female |
| Agriculture, Fishing & Hunting | 6 (100.0%) | 0 (0.0%) |
| Mining, Quarrying, & Extraction | 0 (0.0%) | 0 (0.0%) |
| Construction | 33 (100.0%) | 0 (0.0%) |
| Manufacturing | 105 (94.6%) | 6 (5.4%) |
| Wholesale Trade | 0 (0.0%) | 0 (0.0%) |
| Retail Trade | 46 (41.8%) | 64 (58.2%) |
| Transportation & Warehousing | 76 (100.0%) | 0 (0.0%) |
| Utilities | 4 (100.0%) | 0 (0.0%) |
| Information | 0 (0.0%) | 0 (0.0%) |
| Finance & Insurance | 0 (0.0%) | 0 (0.0%) |
| Real Estate, Rental & Leasing | 0 (0.0%) | 0 (0.0%) |
| Professional & Scientific | 0 (0.0%) | 12 (100.0%) |
| Enterprise Management | 0 (0.0%) | 0 (0.0%) |
| Administrative & Support | 1 (100.0%) | 0 (0.0%) |
| Educational Services | 5 (7.2%) | 64 (92.7%) |
| Health Care & Social Assistance | 0 (0.0%) | 57 (100.0%) |
| Arts, Entertainment & Recreation | 14 (43.8%) | 18 (56.2%) |
| Accommodation & Food Services | 44 (31.9%) | 94 (68.1%) |
| Public Administration | 17 (47.2%) | 19 (52.8%) |
| Total | 351 (49.7%) | 355 (50.3%) |
Education in Elmore
School Enrollment in Elmore
The most common levels of schooling among the 414 students in Elmore are middle school (187 | 45.2%), elementary school (78 | 18.8%), and college / undergraduate (69 | 16.7%).
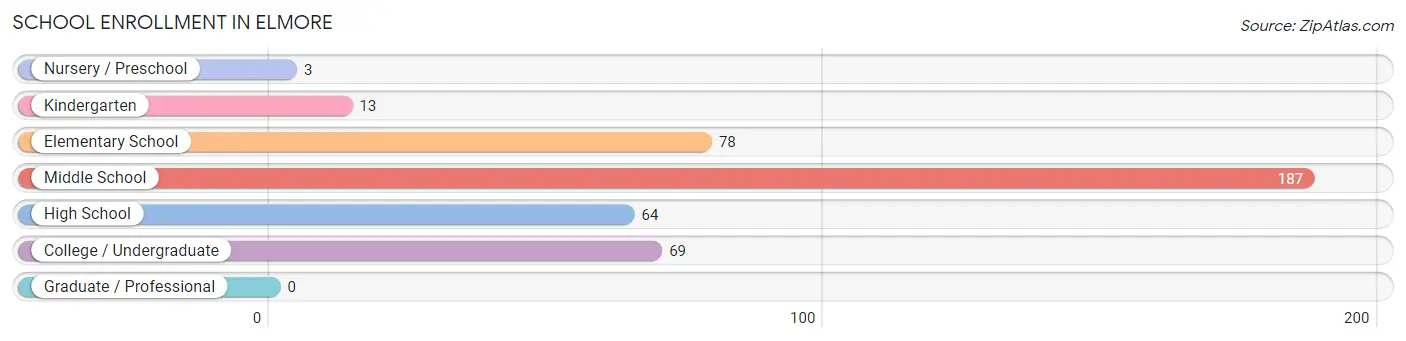
| School Level | # Students | % Students |
| Nursery / Preschool | 3 | 0.7% |
| Kindergarten | 13 | 3.1% |
| Elementary School | 78 | 18.8% |
| Middle School | 187 | 45.2% |
| High School | 64 | 15.5% |
| College / Undergraduate | 69 | 16.7% |
| Graduate / Professional | 0 | 0.0% |
| Total | 414 | 100.0% |
School Enrollment by Age by Funding Source in Elmore
Out of a total of 414 students who are enrolled in schools in Elmore, 87 (21.0%) attend a private institution, while the remaining 327 (79.0%) are enrolled in public schools. The age group of 10 to 14 year olds has the highest likelihood of being enrolled in private schools, with 63 (30.4% in the age bracket) enrolled. Conversely, the age group of 3 to 4 year olds has the lowest likelihood of being enrolled in a private school, with 3 (100.0% in the age bracket) attending a public institution.
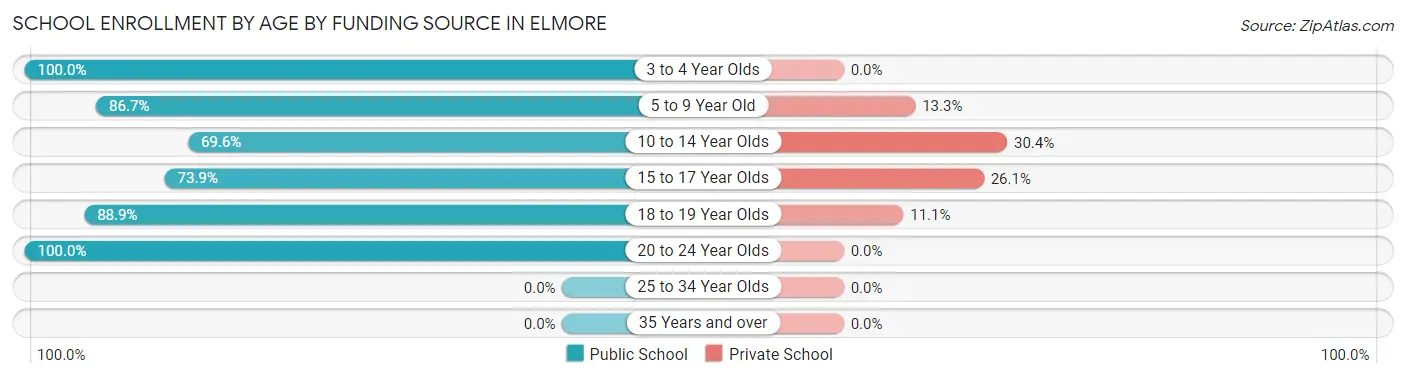
| Age Bracket | Public School | Private School |
| 3 to 4 Year Olds | 3 (100.0%) | 0 (0.0%) |
| 5 to 9 Year Old | 65 (86.7%) | 10 (13.3%) |
| 10 to 14 Year Olds | 144 (69.6%) | 63 (30.4%) |
| 15 to 17 Year Olds | 34 (73.9%) | 12 (26.1%) |
| 18 to 19 Year Olds | 16 (88.9%) | 2 (11.1%) |
| 20 to 24 Year Olds | 65 (100.0%) | 0 (0.0%) |
| 25 to 34 Year Olds | 0 (0.0%) | 0 (0.0%) |
| 35 Years and over | 0 (0.0%) | 0 (0.0%) |
| Total | 327 (79.0%) | 87 (21.0%) |
Educational Attainment by Field of Study in Elmore
Arts & humanities (30 | 37.0%), education (18 | 22.2%), computers & mathematics (15 | 18.5%), communications (6 | 7.4%), and psychology (4 | 4.9%) are the most common fields of study among 81 individuals in Elmore who have obtained a bachelor's degree or higher.
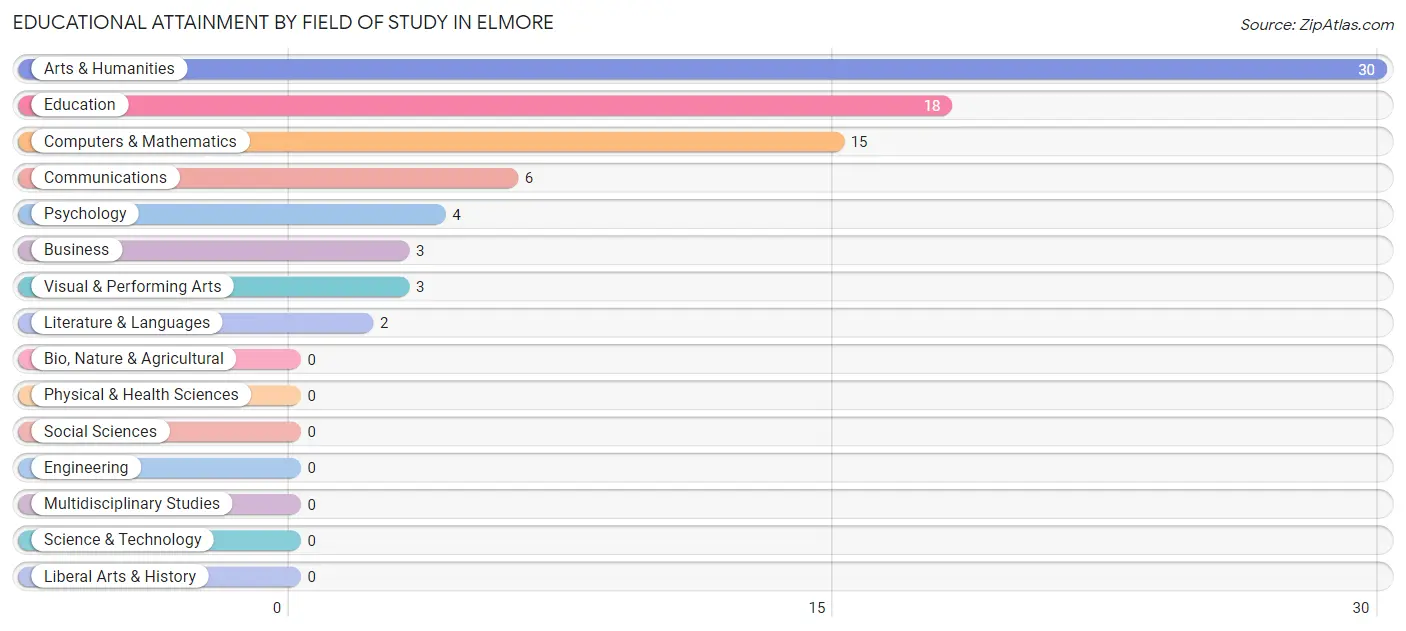
| Field of Study | # Graduates | % Graduates |
| Computers & Mathematics | 15 | 18.5% |
| Bio, Nature & Agricultural | 0 | 0.0% |
| Physical & Health Sciences | 0 | 0.0% |
| Psychology | 4 | 4.9% |
| Social Sciences | 0 | 0.0% |
| Engineering | 0 | 0.0% |
| Multidisciplinary Studies | 0 | 0.0% |
| Science & Technology | 0 | 0.0% |
| Business | 3 | 3.7% |
| Education | 18 | 22.2% |
| Literature & Languages | 2 | 2.5% |
| Liberal Arts & History | 0 | 0.0% |
| Visual & Performing Arts | 3 | 3.7% |
| Communications | 6 | 7.4% |
| Arts & Humanities | 30 | 37.0% |
| Total | 81 | 100.0% |
Transportation & Commute in Elmore
Vehicle Availability by Sex in Elmore
The most prevalent vehicle ownership categories in Elmore are males with 4 vehicles (110, accounting for 31.3%) and females with 4 vehicles (66, making up 31.0%).
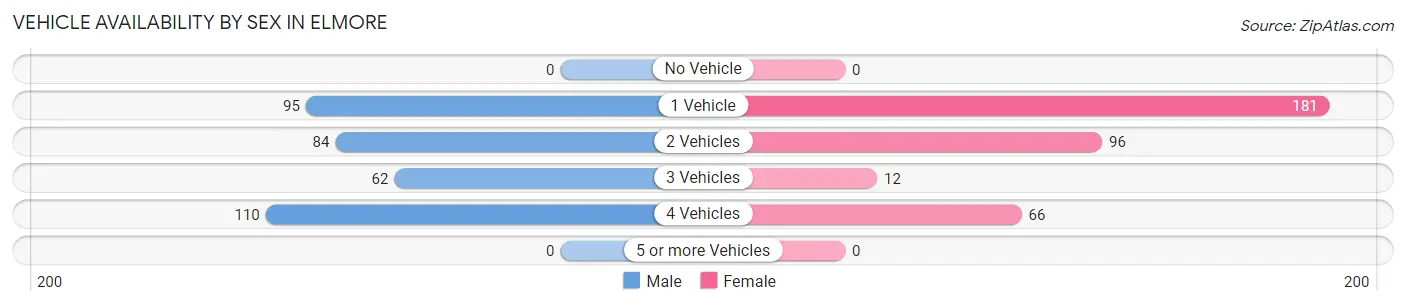
| Vehicles Available | Male | Female |
| No Vehicle | 0 (0.0%) | 0 (0.0%) |
| 1 Vehicle | 95 (27.1%) | 181 (51.0%) |
| 2 Vehicles | 84 (23.9%) | 96 (27.0%) |
| 3 Vehicles | 62 (17.7%) | 12 (3.4%) |
| 4 Vehicles | 110 (31.3%) | 66 (18.6%) |
| 5 or more Vehicles | 0 (0.0%) | 0 (0.0%) |
| Total | 351 (100.0%) | 355 (100.0%) |
Commute Time in Elmore
The most frequently occuring commute durations in Elmore are 20 to 24 minutes (159 commuters, 23.4%), 30 to 34 minutes (109 commuters, 16.1%), and 15 to 19 minutes (97 commuters, 14.3%).
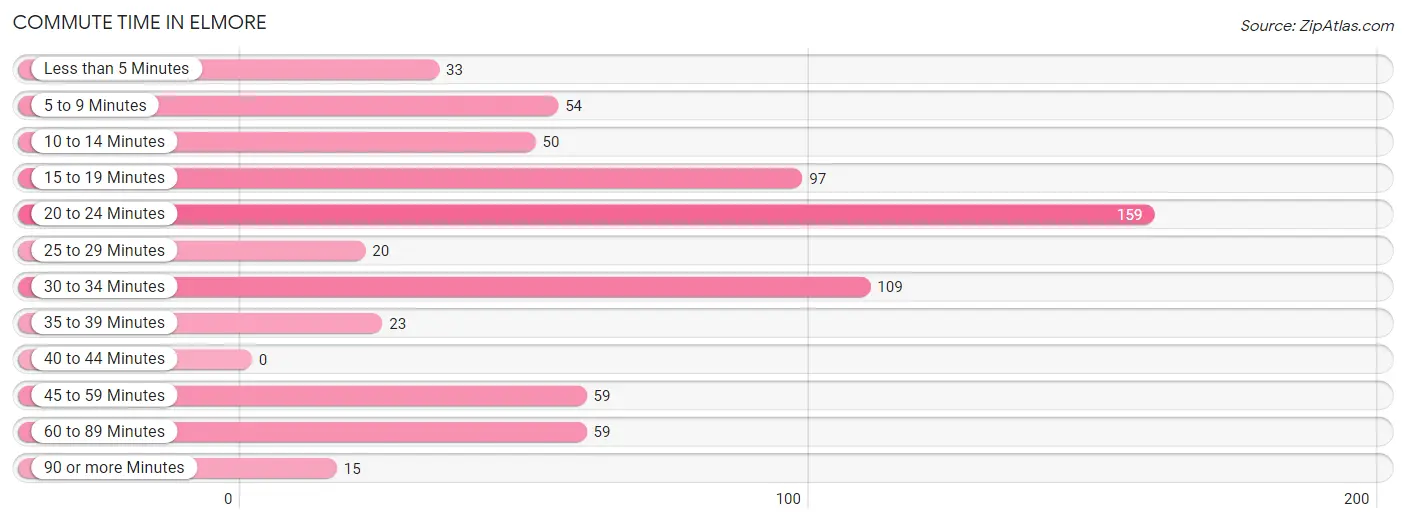
| Commute Time | # Commuters | % Commuters |
| Less than 5 Minutes | 33 | 4.9% |
| 5 to 9 Minutes | 54 | 8.0% |
| 10 to 14 Minutes | 50 | 7.4% |
| 15 to 19 Minutes | 97 | 14.3% |
| 20 to 24 Minutes | 159 | 23.4% |
| 25 to 29 Minutes | 20 | 2.9% |
| 30 to 34 Minutes | 109 | 16.1% |
| 35 to 39 Minutes | 23 | 3.4% |
| 40 to 44 Minutes | 0 | 0.0% |
| 45 to 59 Minutes | 59 | 8.7% |
| 60 to 89 Minutes | 59 | 8.7% |
| 90 or more Minutes | 15 | 2.2% |
Commute Time by Sex in Elmore
The most common commute times in Elmore are 20 to 24 minutes (79 commuters, 22.5%) for males and 20 to 24 minutes (80 commuters, 24.5%) for females.
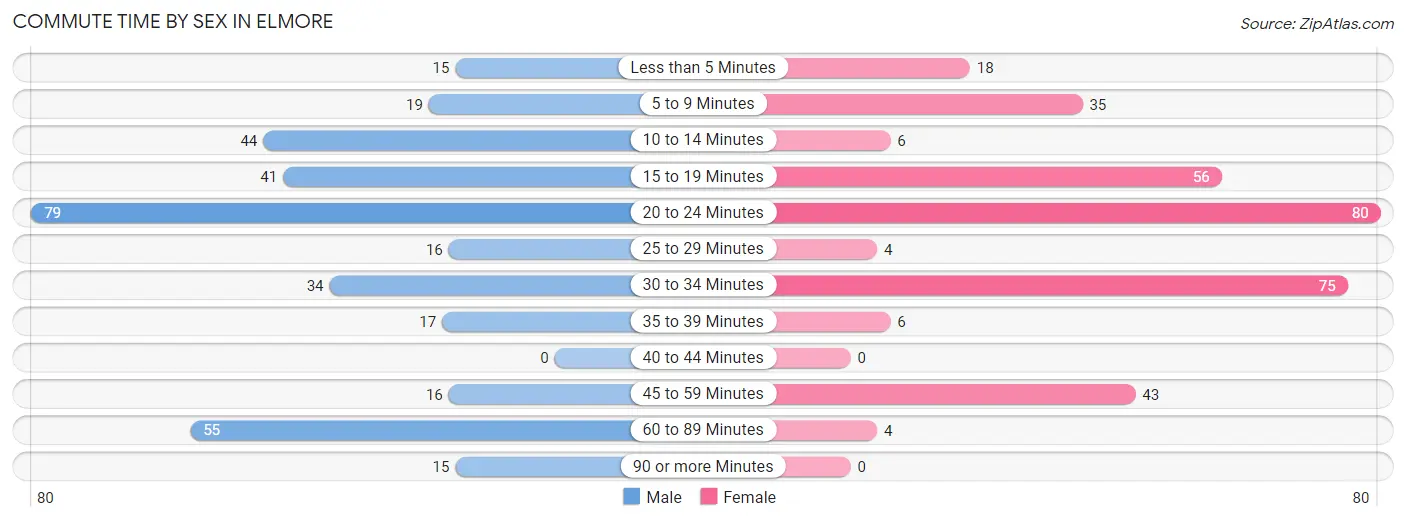
| Commute Time | Male | Female |
| Less than 5 Minutes | 15 (4.3%) | 18 (5.5%) |
| 5 to 9 Minutes | 19 (5.4%) | 35 (10.7%) |
| 10 to 14 Minutes | 44 (12.5%) | 6 (1.8%) |
| 15 to 19 Minutes | 41 (11.7%) | 56 (17.1%) |
| 20 to 24 Minutes | 79 (22.5%) | 80 (24.5%) |
| 25 to 29 Minutes | 16 (4.6%) | 4 (1.2%) |
| 30 to 34 Minutes | 34 (9.7%) | 75 (22.9%) |
| 35 to 39 Minutes | 17 (4.8%) | 6 (1.8%) |
| 40 to 44 Minutes | 0 (0.0%) | 0 (0.0%) |
| 45 to 59 Minutes | 16 (4.6%) | 43 (13.2%) |
| 60 to 89 Minutes | 55 (15.7%) | 4 (1.2%) |
| 90 or more Minutes | 15 (4.3%) | 0 (0.0%) |
Time of Departure to Work by Sex in Elmore
The most frequent times of departure to work in Elmore are 7:00 AM to 7:29 AM (53, 15.1%) for males and 7:00 AM to 7:29 AM (103, 31.5%) for females.
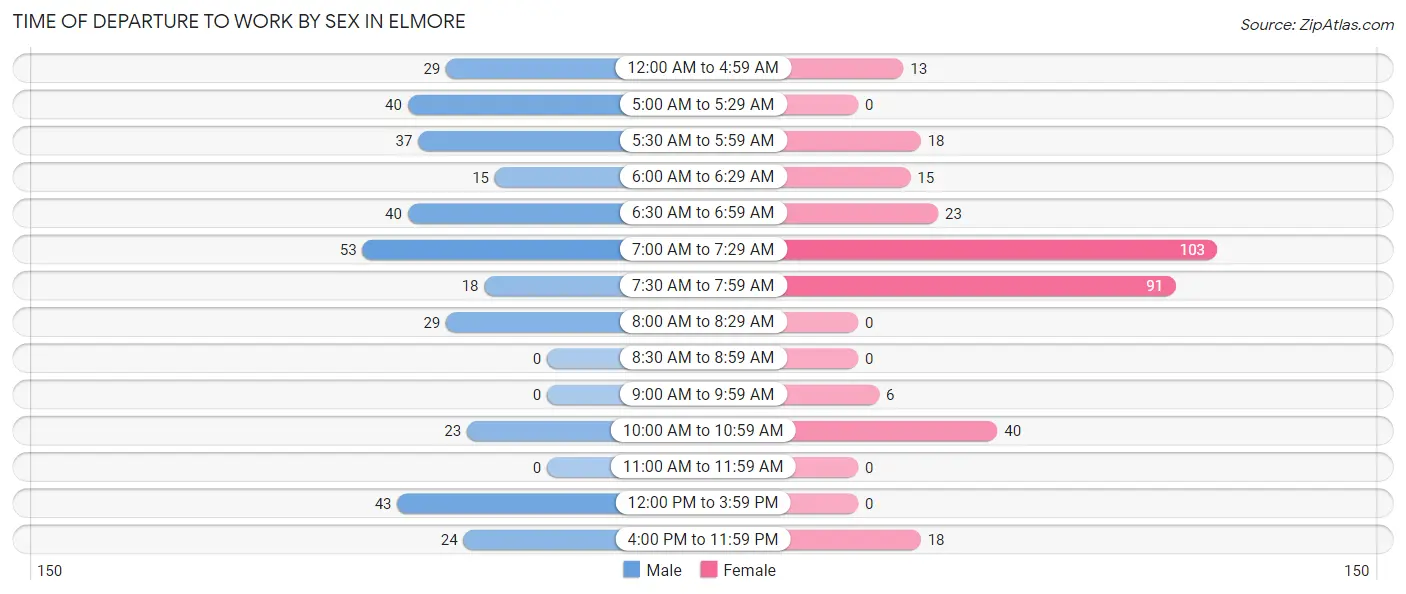
| Time of Departure | Male | Female |
| 12:00 AM to 4:59 AM | 29 (8.3%) | 13 (4.0%) |
| 5:00 AM to 5:29 AM | 40 (11.4%) | 0 (0.0%) |
| 5:30 AM to 5:59 AM | 37 (10.5%) | 18 (5.5%) |
| 6:00 AM to 6:29 AM | 15 (4.3%) | 15 (4.6%) |
| 6:30 AM to 6:59 AM | 40 (11.4%) | 23 (7.0%) |
| 7:00 AM to 7:29 AM | 53 (15.1%) | 103 (31.5%) |
| 7:30 AM to 7:59 AM | 18 (5.1%) | 91 (27.8%) |
| 8:00 AM to 8:29 AM | 29 (8.3%) | 0 (0.0%) |
| 8:30 AM to 8:59 AM | 0 (0.0%) | 0 (0.0%) |
| 9:00 AM to 9:59 AM | 0 (0.0%) | 6 (1.8%) |
| 10:00 AM to 10:59 AM | 23 (6.6%) | 40 (12.2%) |
| 11:00 AM to 11:59 AM | 0 (0.0%) | 0 (0.0%) |
| 12:00 PM to 3:59 PM | 43 (12.2%) | 0 (0.0%) |
| 4:00 PM to 11:59 PM | 24 (6.8%) | 18 (5.5%) |
| Total | 351 (100.0%) | 327 (100.0%) |
Housing Occupancy in Elmore
Occupancy by Ownership in Elmore
Of the total 593 dwellings in Elmore, owner-occupied units account for 316 (53.3%), while renter-occupied units make up 277 (46.7%).
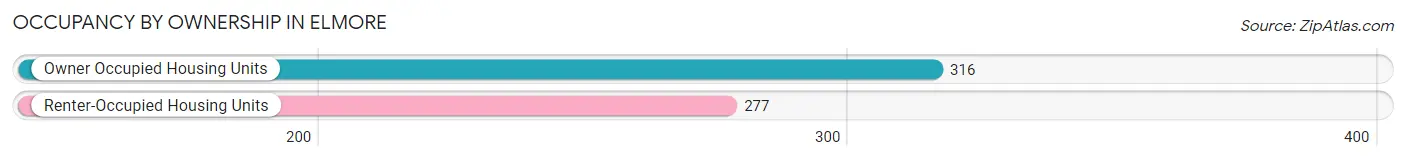
| Occupancy | # Housing Units | % Housing Units |
| Owner Occupied Housing Units | 316 | 53.3% |
| Renter-Occupied Housing Units | 277 | 46.7% |
| Total Occupied Housing Units | 593 | 100.0% |
Occupancy by Household Size in Elmore
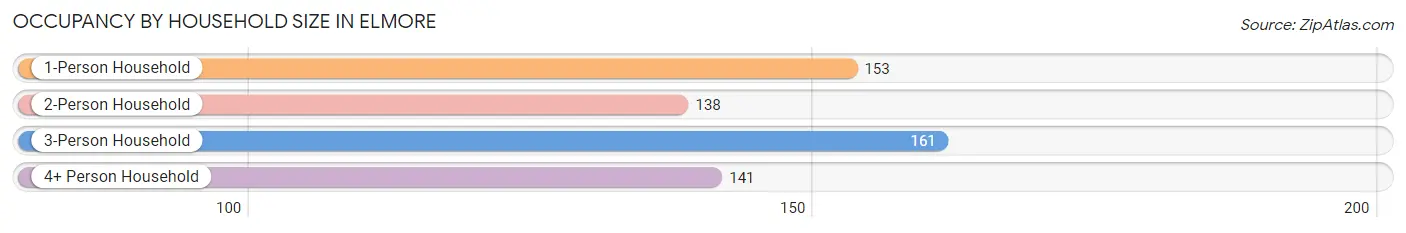
| Household Size | # Housing Units | % Housing Units |
| 1-Person Household | 153 | 25.8% |
| 2-Person Household | 138 | 23.3% |
| 3-Person Household | 161 | 27.2% |
| 4+ Person Household | 141 | 23.8% |
| Total Housing Units | 593 | 100.0% |
Occupancy by Ownership by Household Size in Elmore
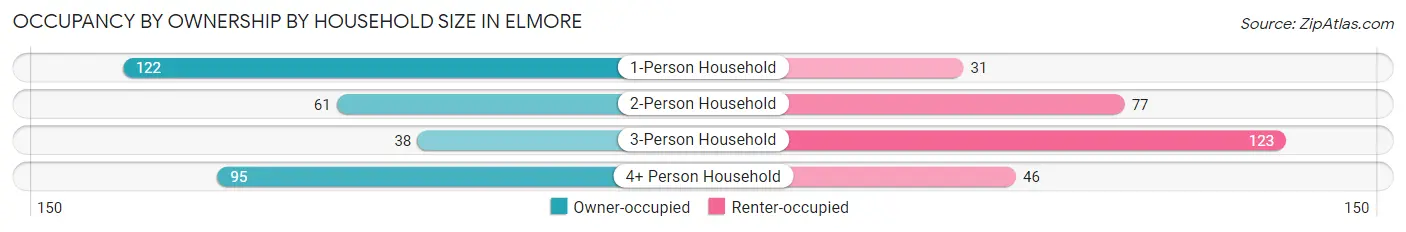
| Household Size | Owner-occupied | Renter-occupied |
| 1-Person Household | 122 (79.7%) | 31 (20.3%) |
| 2-Person Household | 61 (44.2%) | 77 (55.8%) |
| 3-Person Household | 38 (23.6%) | 123 (76.4%) |
| 4+ Person Household | 95 (67.4%) | 46 (32.6%) |
| Total Housing Units | 316 (53.3%) | 277 (46.7%) |
Occupancy by Educational Attainment in Elmore
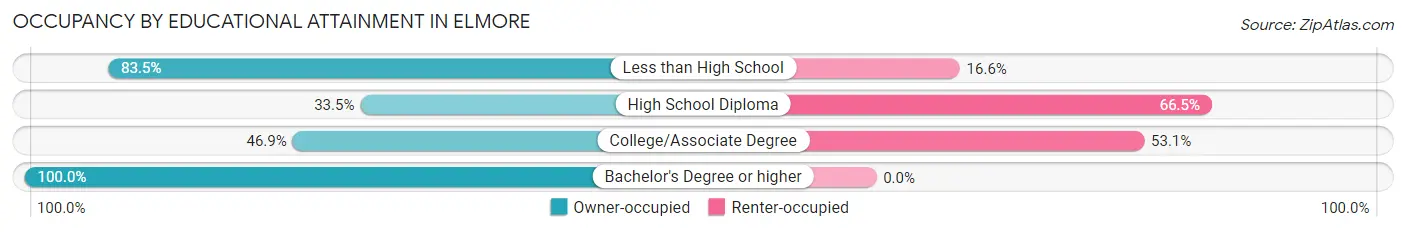
| Household Size | Owner-occupied | Renter-occupied |
| Less than High School | 116 (83.5%) | 23 (16.6%) |
| High School Diploma | 85 (33.5%) | 169 (66.5%) |
| College/Associate Degree | 75 (46.9%) | 85 (53.1%) |
| Bachelor's Degree or higher | 40 (100.0%) | 0 (0.0%) |
Occupancy by Age of Householder in Elmore
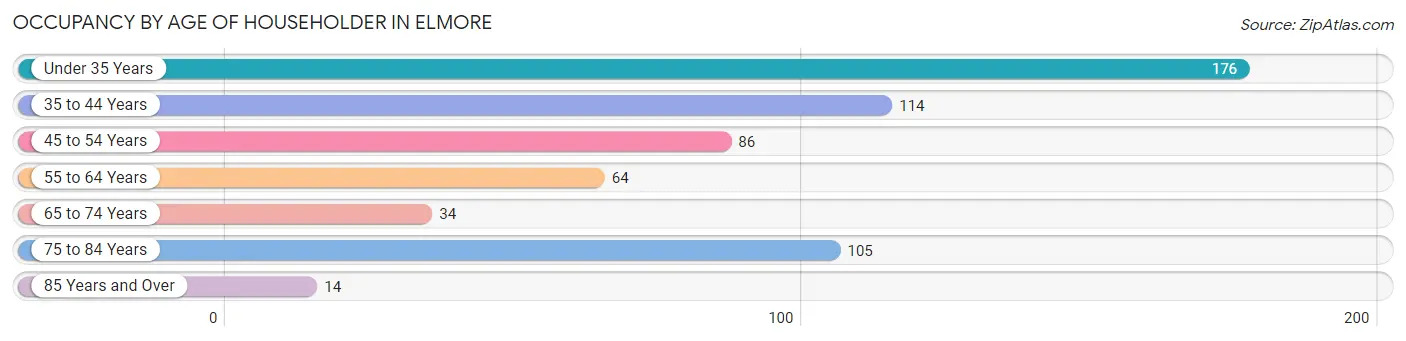
| Age Bracket | # Households | % Households |
| Under 35 Years | 176 | 29.7% |
| 35 to 44 Years | 114 | 19.2% |
| 45 to 54 Years | 86 | 14.5% |
| 55 to 64 Years | 64 | 10.8% |
| 65 to 74 Years | 34 | 5.7% |
| 75 to 84 Years | 105 | 17.7% |
| 85 Years and Over | 14 | 2.4% |
| Total | 593 | 100.0% |
Housing Finances in Elmore
Median Income by Occupancy in Elmore
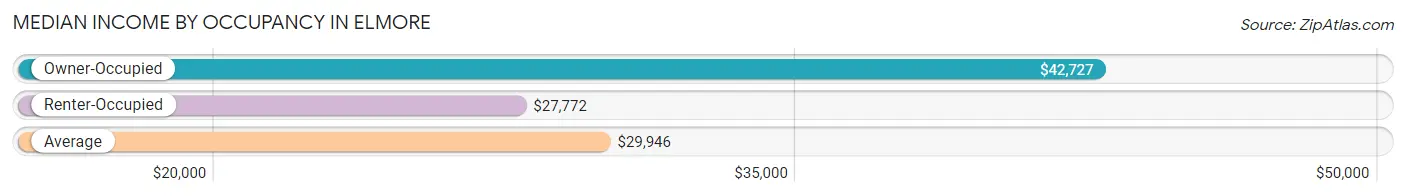
| Occupancy Type | # Households | Median Income |
| Owner-Occupied | 316 (53.3%) | $42,727 |
| Renter-Occupied | 277 (46.7%) | $27,772 |
| Average | 593 (100.0%) | $29,946 |
Occupancy by Householder Income Bracket in Elmore
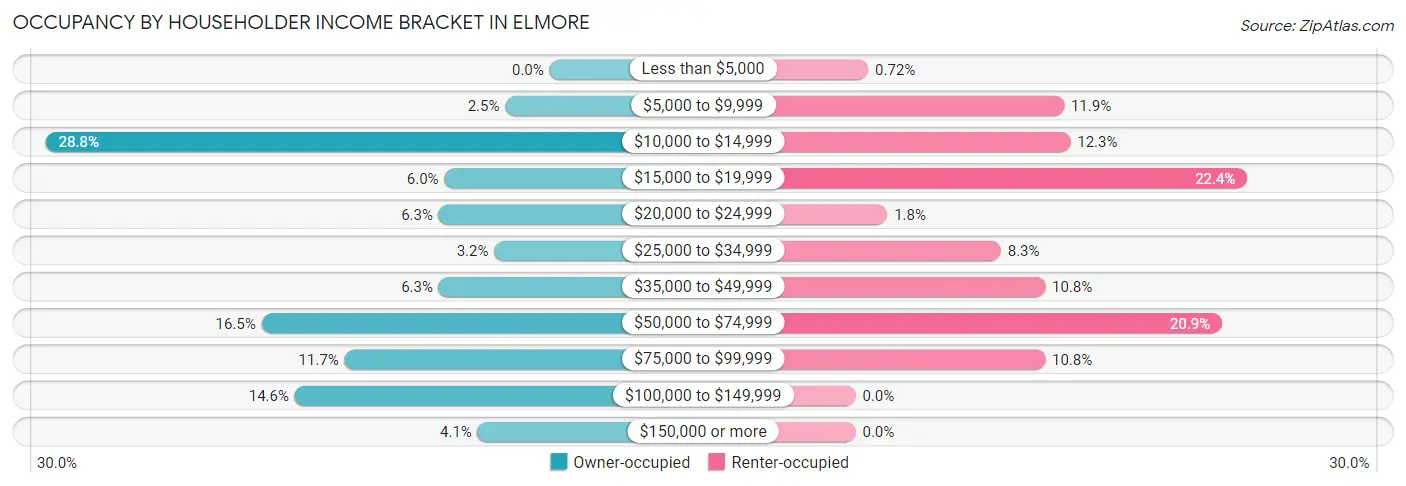
| Income Bracket | Owner-occupied | Renter-occupied |
| Less than $5,000 | 0 (0.0%) | 2 (0.7%) |
| $5,000 to $9,999 | 8 (2.5%) | 33 (11.9%) |
| $10,000 to $14,999 | 91 (28.8%) | 34 (12.3%) |
| $15,000 to $19,999 | 19 (6.0%) | 62 (22.4%) |
| $20,000 to $24,999 | 20 (6.3%) | 5 (1.8%) |
| $25,000 to $34,999 | 10 (3.2%) | 23 (8.3%) |
| $35,000 to $49,999 | 20 (6.3%) | 30 (10.8%) |
| $50,000 to $74,999 | 52 (16.5%) | 58 (20.9%) |
| $75,000 to $99,999 | 37 (11.7%) | 30 (10.8%) |
| $100,000 to $149,999 | 46 (14.6%) | 0 (0.0%) |
| $150,000 or more | 13 (4.1%) | 0 (0.0%) |
| Total | 316 (100.0%) | 277 (100.0%) |
Monthly Housing Cost Tiers in Elmore
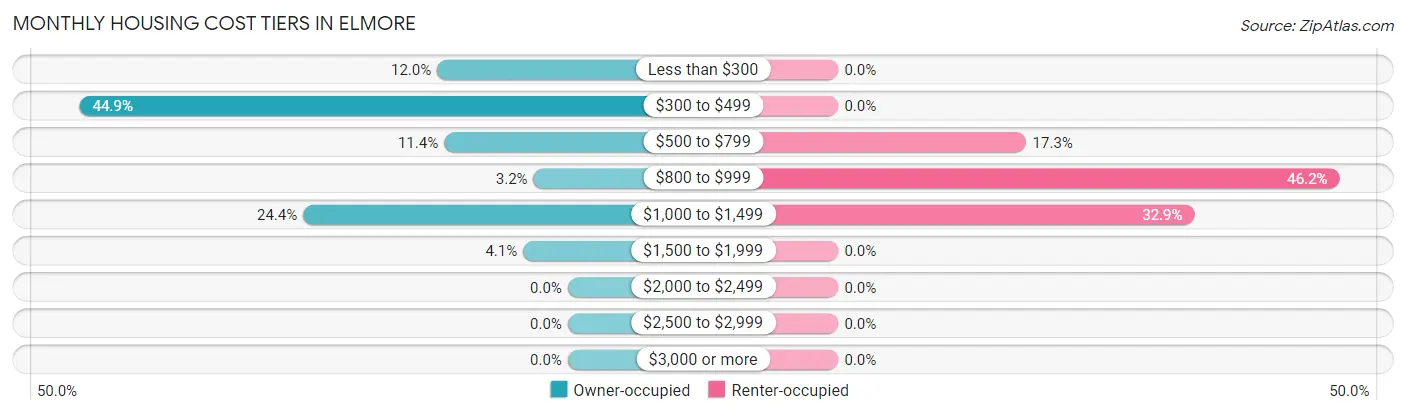
| Monthly Cost | Owner-occupied | Renter-occupied |
| Less than $300 | 38 (12.0%) | 0 (0.0%) |
| $300 to $499 | 142 (44.9%) | 0 (0.0%) |
| $500 to $799 | 36 (11.4%) | 48 (17.3%) |
| $800 to $999 | 10 (3.2%) | 128 (46.2%) |
| $1,000 to $1,499 | 77 (24.4%) | 91 (32.9%) |
| $1,500 to $1,999 | 13 (4.1%) | 0 (0.0%) |
| $2,000 to $2,499 | 0 (0.0%) | 0 (0.0%) |
| $2,500 to $2,999 | 0 (0.0%) | 0 (0.0%) |
| $3,000 or more | 0 (0.0%) | 0 (0.0%) |
| Total | 316 (100.0%) | 277 (100.0%) |
Physical Housing Characteristics in Elmore
Housing Structures in Elmore
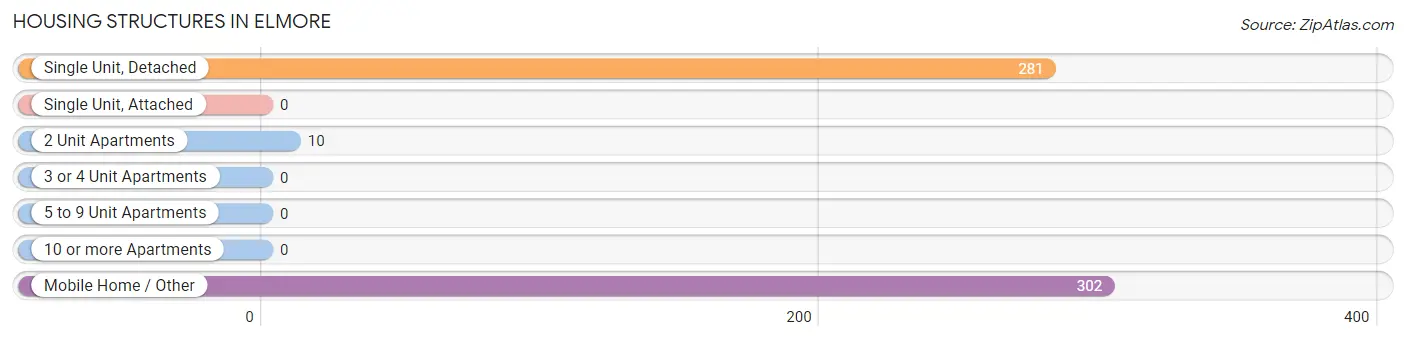
| Structure Type | # Housing Units | % Housing Units |
| Single Unit, Detached | 281 | 47.4% |
| Single Unit, Attached | 0 | 0.0% |
| 2 Unit Apartments | 10 | 1.7% |
| 3 or 4 Unit Apartments | 0 | 0.0% |
| 5 to 9 Unit Apartments | 0 | 0.0% |
| 10 or more Apartments | 0 | 0.0% |
| Mobile Home / Other | 302 | 50.9% |
| Total | 593 | 100.0% |
Housing Structures by Occupancy in Elmore
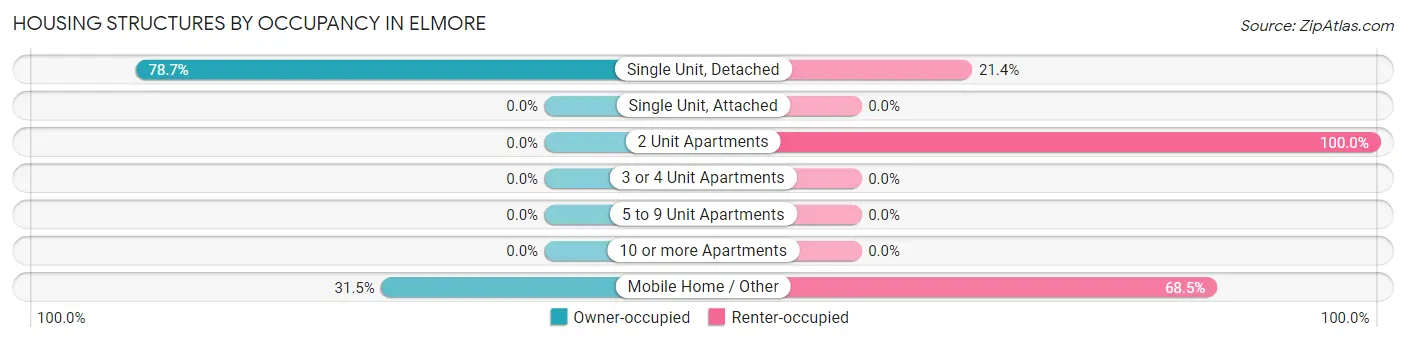
| Structure Type | Owner-occupied | Renter-occupied |
| Single Unit, Detached | 221 (78.6%) | 60 (21.3%) |
| Single Unit, Attached | 0 (0.0%) | 0 (0.0%) |
| 2 Unit Apartments | 0 (0.0%) | 10 (100.0%) |
| 3 or 4 Unit Apartments | 0 (0.0%) | 0 (0.0%) |
| 5 to 9 Unit Apartments | 0 (0.0%) | 0 (0.0%) |
| 10 or more Apartments | 0 (0.0%) | 0 (0.0%) |
| Mobile Home / Other | 95 (31.5%) | 207 (68.5%) |
| Total | 316 (53.3%) | 277 (46.7%) |
Housing Structures by Number of Rooms in Elmore
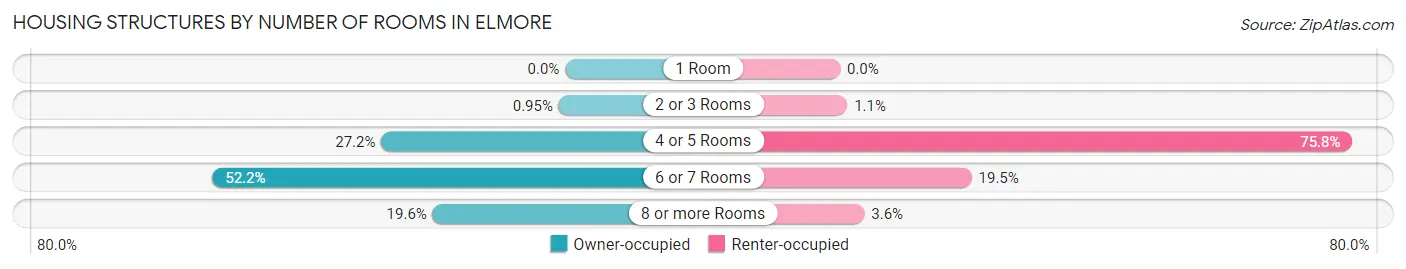
| Number of Rooms | Owner-occupied | Renter-occupied |
| 1 Room | 0 (0.0%) | 0 (0.0%) |
| 2 or 3 Rooms | 3 (0.9%) | 3 (1.1%) |
| 4 or 5 Rooms | 86 (27.2%) | 210 (75.8%) |
| 6 or 7 Rooms | 165 (52.2%) | 54 (19.5%) |
| 8 or more Rooms | 62 (19.6%) | 10 (3.6%) |
| Total | 316 (100.0%) | 277 (100.0%) |
Housing Structure by Heating Type in Elmore
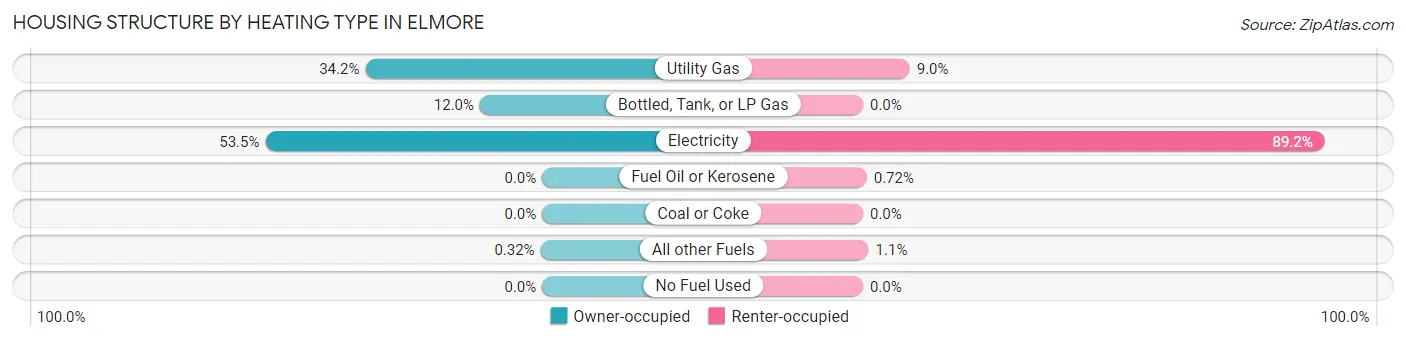
| Heating Type | Owner-occupied | Renter-occupied |
| Utility Gas | 108 (34.2%) | 25 (9.0%) |
| Bottled, Tank, or LP Gas | 38 (12.0%) | 0 (0.0%) |
| Electricity | 169 (53.5%) | 247 (89.2%) |
| Fuel Oil or Kerosene | 0 (0.0%) | 2 (0.7%) |
| Coal or Coke | 0 (0.0%) | 0 (0.0%) |
| All other Fuels | 1 (0.3%) | 3 (1.1%) |
| No Fuel Used | 0 (0.0%) | 0 (0.0%) |
| Total | 316 (100.0%) | 277 (100.0%) |
Household Vehicle Usage in Elmore
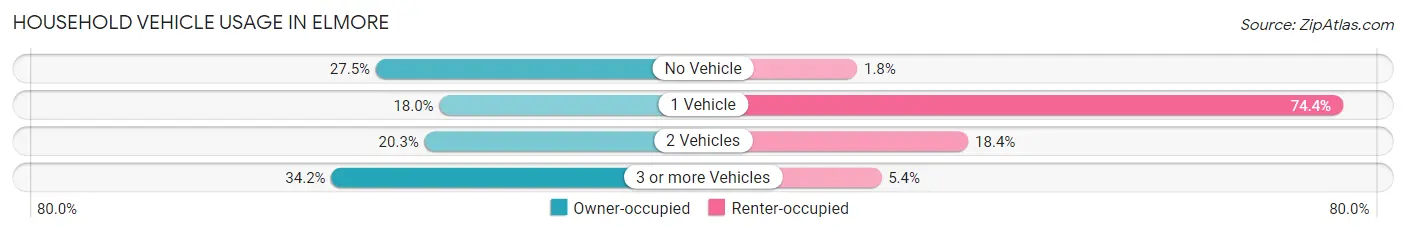
| Vehicles per Household | Owner-occupied | Renter-occupied |
| No Vehicle | 87 (27.5%) | 5 (1.8%) |
| 1 Vehicle | 57 (18.0%) | 206 (74.4%) |
| 2 Vehicles | 64 (20.3%) | 51 (18.4%) |
| 3 or more Vehicles | 108 (34.2%) | 15 (5.4%) |
| Total | 316 (100.0%) | 277 (100.0%) |
Real Estate & Mortgages in Elmore
Real Estate and Mortgage Overview in Elmore
| Characteristic | Without Mortgage | With Mortgage |
| Housing Units | 201 | 115 |
| Median Property Value | - | - |
| Median Household Income | - | - |
| Monthly Housing Costs | $341 | $0 |
| Real Estate Taxes | $229 | $13 |
Property Value by Mortgage Status in Elmore
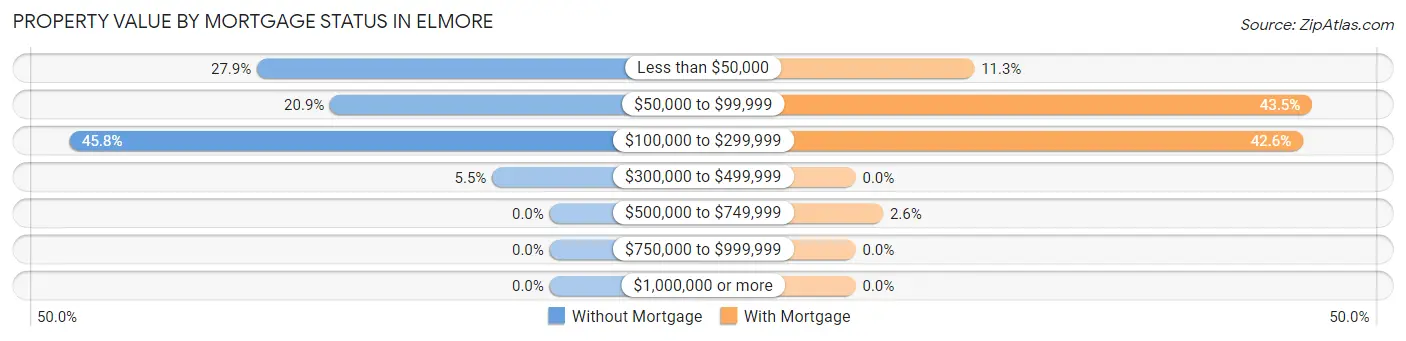
| Property Value | Without Mortgage | With Mortgage |
| Less than $50,000 | 56 (27.9%) | 13 (11.3%) |
| $50,000 to $99,999 | 42 (20.9%) | 50 (43.5%) |
| $100,000 to $299,999 | 92 (45.8%) | 49 (42.6%) |
| $300,000 to $499,999 | 11 (5.5%) | 0 (0.0%) |
| $500,000 to $749,999 | 0 (0.0%) | 3 (2.6%) |
| $750,000 to $999,999 | 0 (0.0%) | 0 (0.0%) |
| $1,000,000 or more | 0 (0.0%) | 0 (0.0%) |
| Total | 201 (100.0%) | 115 (100.0%) |
Household Income by Mortgage Status in Elmore
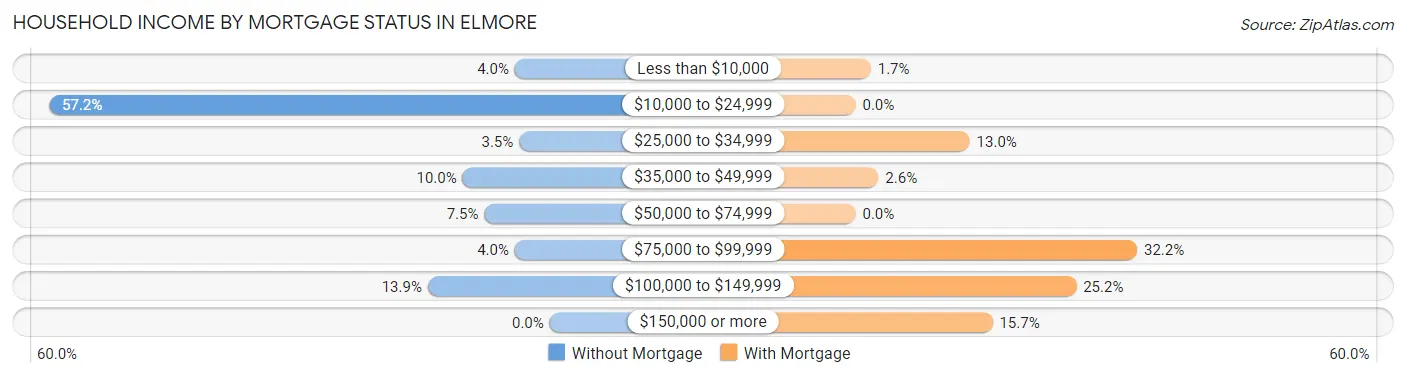
| Household Income | Without Mortgage | With Mortgage |
| Less than $10,000 | 8 (4.0%) | 2 (1.7%) |
| $10,000 to $24,999 | 115 (57.2%) | 0 (0.0%) |
| $25,000 to $34,999 | 7 (3.5%) | 15 (13.0%) |
| $35,000 to $49,999 | 20 (10.0%) | 3 (2.6%) |
| $50,000 to $74,999 | 15 (7.5%) | 0 (0.0%) |
| $75,000 to $99,999 | 8 (4.0%) | 37 (32.2%) |
| $100,000 to $149,999 | 28 (13.9%) | 29 (25.2%) |
| $150,000 or more | 0 (0.0%) | 18 (15.7%) |
| Total | 201 (100.0%) | 115 (100.0%) |
Property Value to Household Income Ratio in Elmore
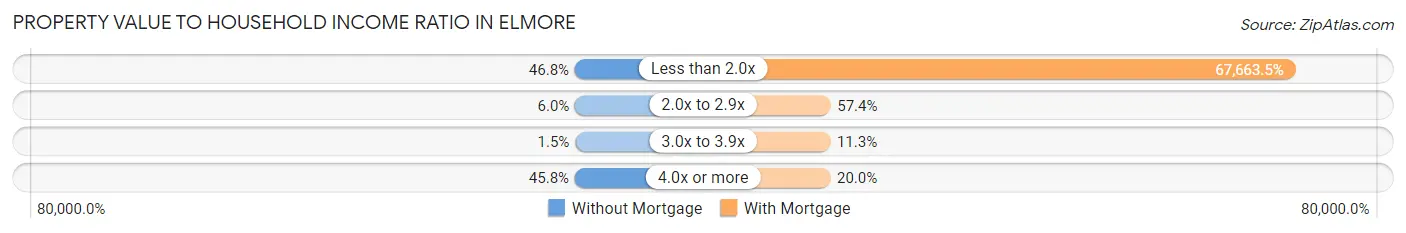
| Value-to-Income Ratio | Without Mortgage | With Mortgage |
| Less than 2.0x | 94 (46.8%) | 77,813 (67,663.5%) |
| 2.0x to 2.9x | 12 (6.0%) | 66 (57.4%) |
| 3.0x to 3.9x | 3 (1.5%) | 13 (11.3%) |
| 4.0x or more | 92 (45.8%) | 23 (20.0%) |
| Total | 201 (100.0%) | 115 (100.0%) |
Real Estate Taxes by Mortgage Status in Elmore
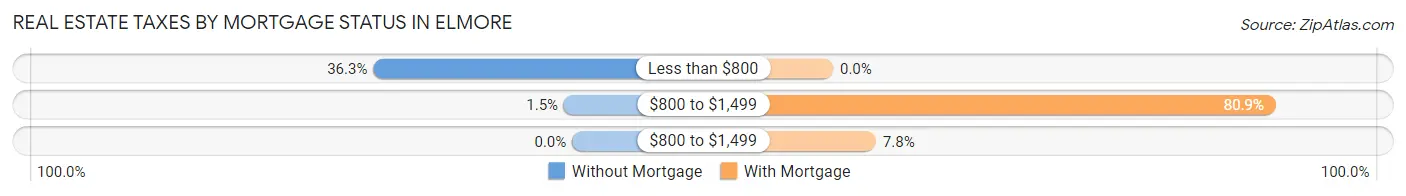
| Property Taxes | Without Mortgage | With Mortgage |
| Less than $800 | 73 (36.3%) | 0 (0.0%) |
| $800 to $1,499 | 3 (1.5%) | 93 (80.9%) |
| $800 to $1,499 | 0 (0.0%) | 9 (7.8%) |
| Total | 201 (100.0%) | 115 (100.0%) |
Health & Disability in Elmore
Health Insurance Coverage by Age in Elmore
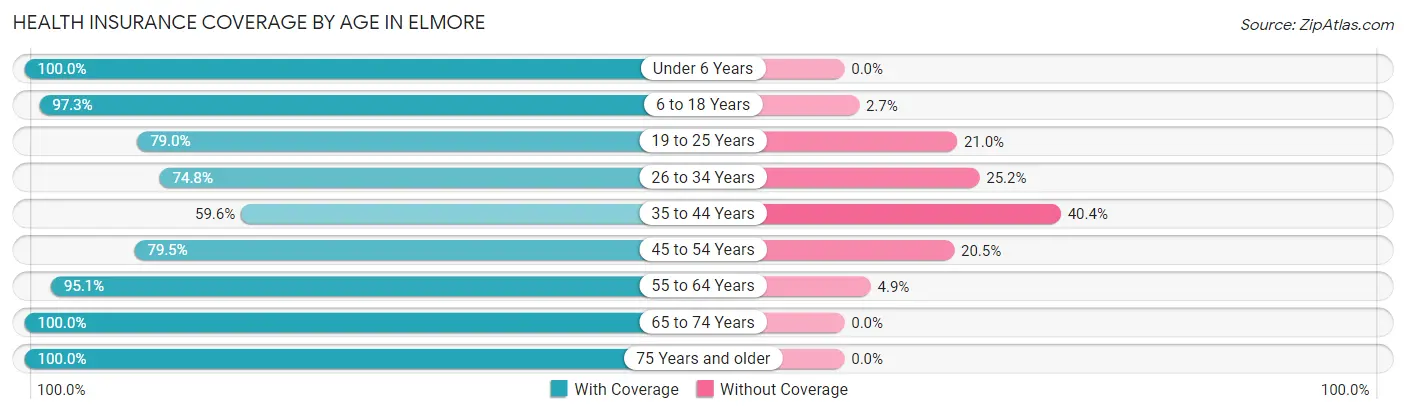
| Age Bracket | With Coverage | Without Coverage |
| Under 6 Years | 53 (100.0%) | 0 (0.0%) |
| 6 to 18 Years | 355 (97.3%) | 10 (2.7%) |
| 19 to 25 Years | 188 (79.0%) | 50 (21.0%) |
| 26 to 34 Years | 211 (74.8%) | 71 (25.2%) |
| 35 to 44 Years | 133 (59.6%) | 90 (40.4%) |
| 45 to 54 Years | 101 (79.5%) | 26 (20.5%) |
| 55 to 64 Years | 97 (95.1%) | 5 (4.9%) |
| 65 to 74 Years | 50 (100.0%) | 0 (0.0%) |
| 75 Years and older | 133 (100.0%) | 0 (0.0%) |
| Total | 1,321 (84.0%) | 252 (16.0%) |
Health Insurance Coverage by Citizenship Status in Elmore
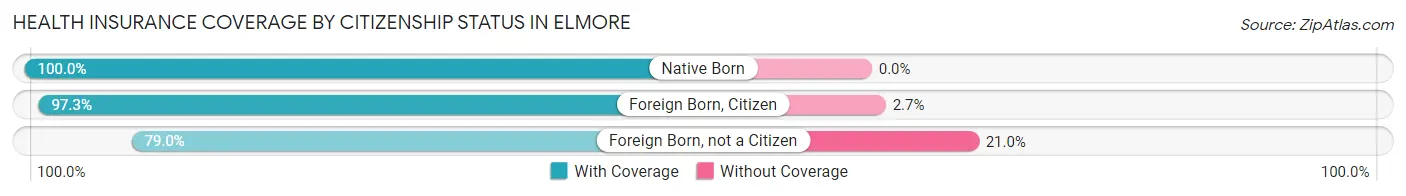
| Citizenship Status | With Coverage | Without Coverage |
| Native Born | 53 (100.0%) | 0 (0.0%) |
| Foreign Born, Citizen | 355 (97.3%) | 10 (2.7%) |
| Foreign Born, not a Citizen | 188 (79.0%) | 50 (21.0%) |
Health Insurance Coverage by Household Income in Elmore
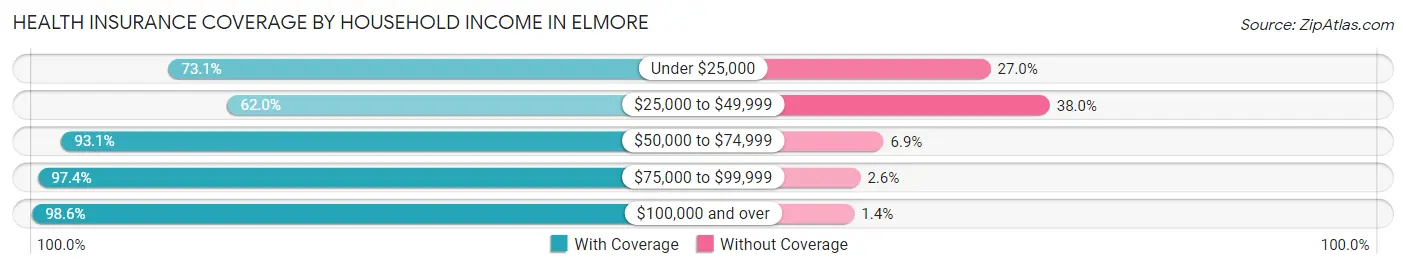
| Household Income | With Coverage | Without Coverage |
| Under $25,000 | 374 (73.1%) | 138 (27.0%) |
| $25,000 to $49,999 | 132 (62.0%) | 81 (38.0%) |
| $50,000 to $74,999 | 311 (93.1%) | 23 (6.9%) |
| $75,000 to $99,999 | 228 (97.4%) | 6 (2.6%) |
| $100,000 and over | 276 (98.6%) | 4 (1.4%) |
Public vs Private Health Insurance Coverage by Age in Elmore
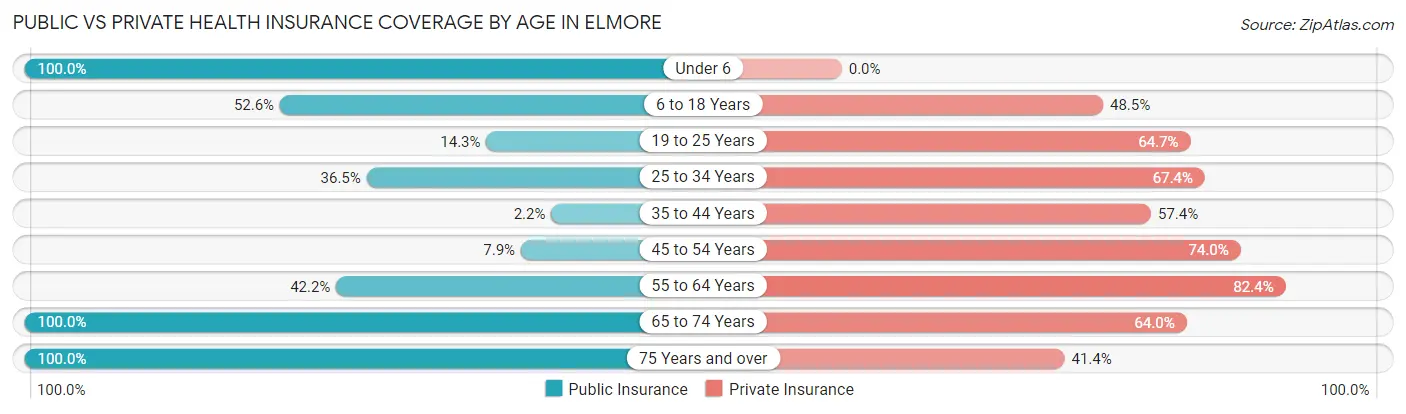
| Age Bracket | Public Insurance | Private Insurance |
| Under 6 | 53 (100.0%) | 0 (0.0%) |
| 6 to 18 Years | 192 (52.6%) | 177 (48.5%) |
| 19 to 25 Years | 34 (14.3%) | 154 (64.7%) |
| 25 to 34 Years | 103 (36.5%) | 190 (67.4%) |
| 35 to 44 Years | 5 (2.2%) | 128 (57.4%) |
| 45 to 54 Years | 10 (7.9%) | 94 (74.0%) |
| 55 to 64 Years | 43 (42.2%) | 84 (82.4%) |
| 65 to 74 Years | 50 (100.0%) | 32 (64.0%) |
| 75 Years and over | 133 (100.0%) | 55 (41.3%) |
| Total | 623 (39.6%) | 914 (58.1%) |
Disability Status by Sex by Age in Elmore
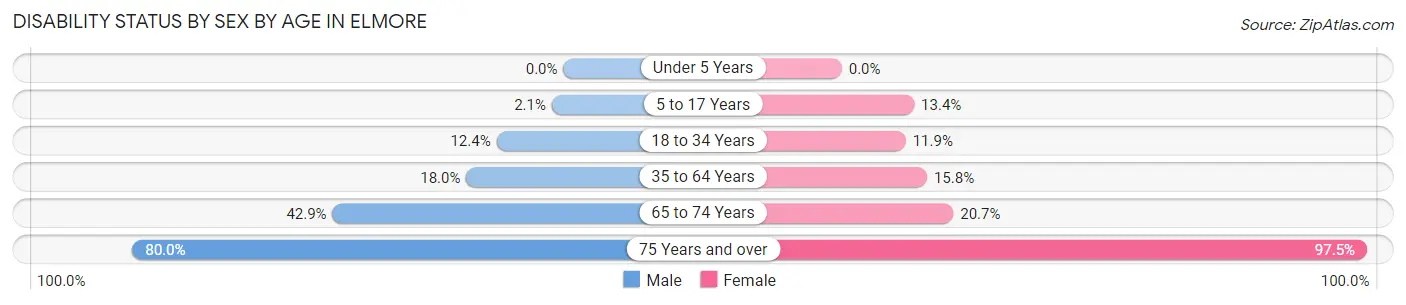
| Age Bracket | Male | Female |
| Under 5 Years | 0 (0.0%) | 0 (0.0%) |
| 5 to 17 Years | 3 (2.1%) | 27 (13.4%) |
| 18 to 34 Years | 33 (12.4%) | 33 (11.9%) |
| 35 to 64 Years | 29 (18.0%) | 46 (15.8%) |
| 65 to 74 Years | 9 (42.9%) | 6 (20.7%) |
| 75 Years and over | 12 (80.0%) | 115 (97.5%) |
Disability Class by Sex by Age in Elmore
Disability Class: Hearing Difficulty
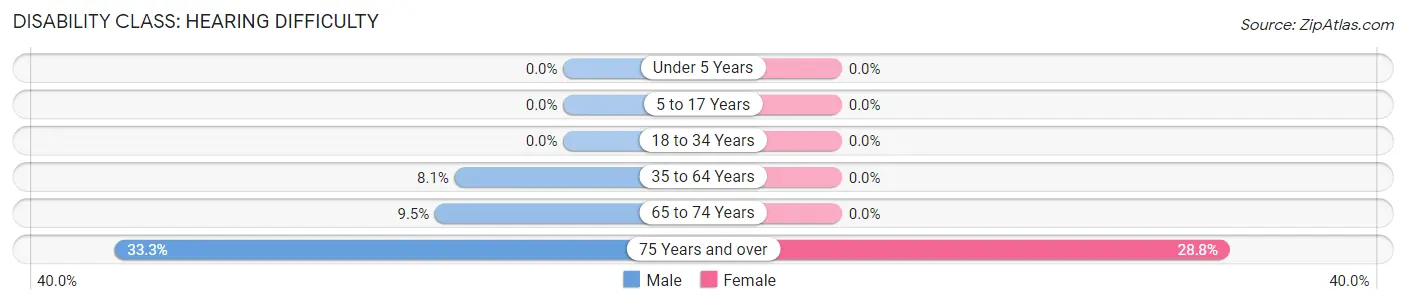
| Age Bracket | Male | Female |
| Under 5 Years | 0 (0.0%) | 0 (0.0%) |
| 5 to 17 Years | 0 (0.0%) | 0 (0.0%) |
| 18 to 34 Years | 0 (0.0%) | 0 (0.0%) |
| 35 to 64 Years | 13 (8.1%) | 0 (0.0%) |
| 65 to 74 Years | 2 (9.5%) | 0 (0.0%) |
| 75 Years and over | 5 (33.3%) | 34 (28.8%) |
Disability Class: Vision Difficulty
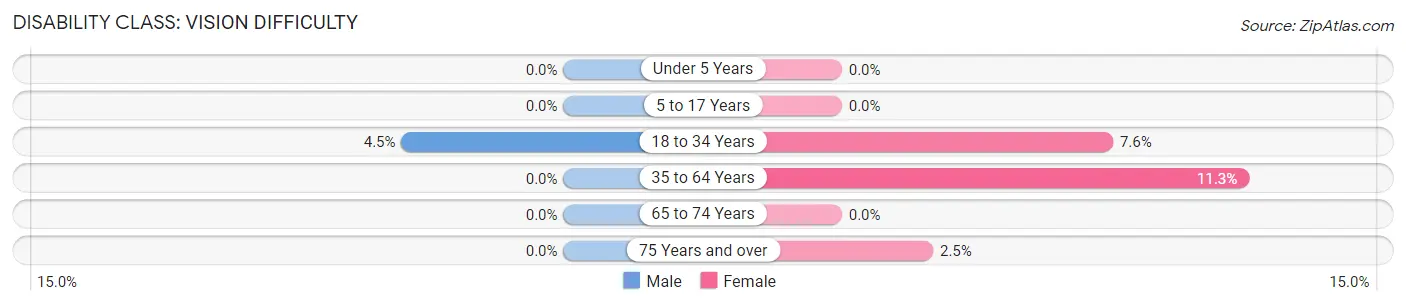
| Age Bracket | Male | Female |
| Under 5 Years | 0 (0.0%) | 0 (0.0%) |
| 5 to 17 Years | 0 (0.0%) | 0 (0.0%) |
| 18 to 34 Years | 12 (4.5%) | 21 (7.5%) |
| 35 to 64 Years | 0 (0.0%) | 33 (11.3%) |
| 65 to 74 Years | 0 (0.0%) | 0 (0.0%) |
| 75 Years and over | 0 (0.0%) | 3 (2.5%) |
Disability Class: Cognitive Difficulty
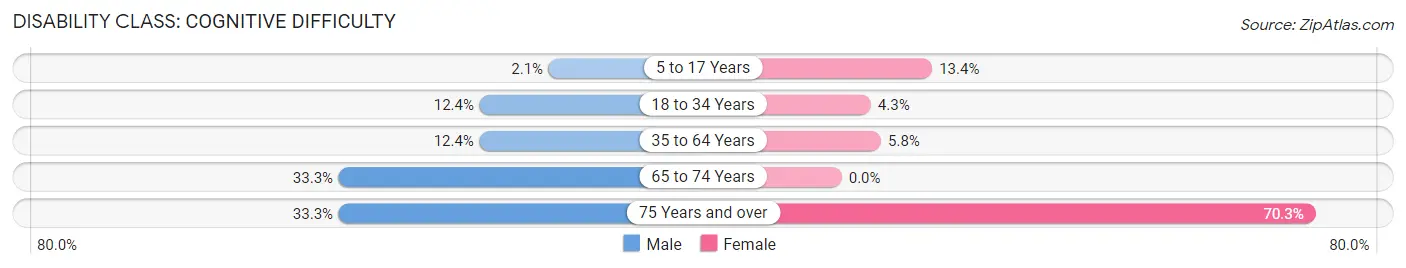
| Age Bracket | Male | Female |
| 5 to 17 Years | 3 (2.1%) | 27 (13.4%) |
| 18 to 34 Years | 33 (12.4%) | 12 (4.3%) |
| 35 to 64 Years | 20 (12.4%) | 17 (5.8%) |
| 65 to 74 Years | 7 (33.3%) | 0 (0.0%) |
| 75 Years and over | 5 (33.3%) | 83 (70.3%) |
Disability Class: Ambulatory Difficulty
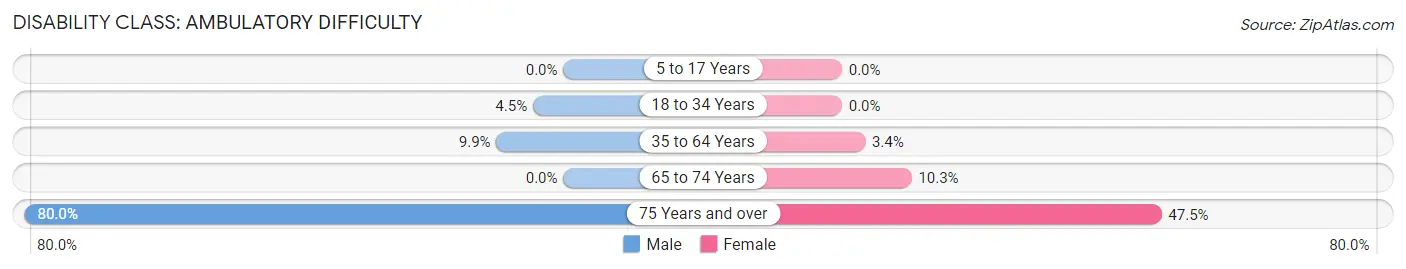
| Age Bracket | Male | Female |
| 5 to 17 Years | 0 (0.0%) | 0 (0.0%) |
| 18 to 34 Years | 12 (4.5%) | 0 (0.0%) |
| 35 to 64 Years | 16 (9.9%) | 10 (3.4%) |
| 65 to 74 Years | 0 (0.0%) | 3 (10.3%) |
| 75 Years and over | 12 (80.0%) | 56 (47.5%) |
Disability Class: Self-Care Difficulty
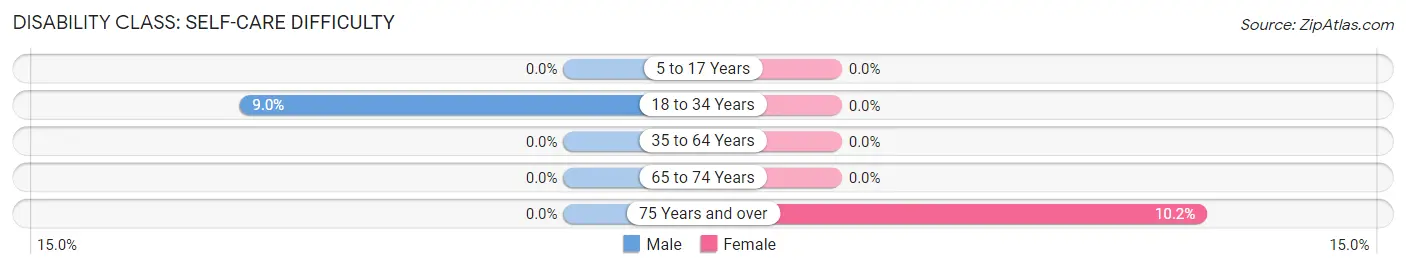
| Age Bracket | Male | Female |
| 5 to 17 Years | 0 (0.0%) | 0 (0.0%) |
| 18 to 34 Years | 24 (9.0%) | 0 (0.0%) |
| 35 to 64 Years | 0 (0.0%) | 0 (0.0%) |
| 65 to 74 Years | 0 (0.0%) | 0 (0.0%) |
| 75 Years and over | 0 (0.0%) | 12 (10.2%) |
Technology Access in Elmore
Computing Device Access in Elmore
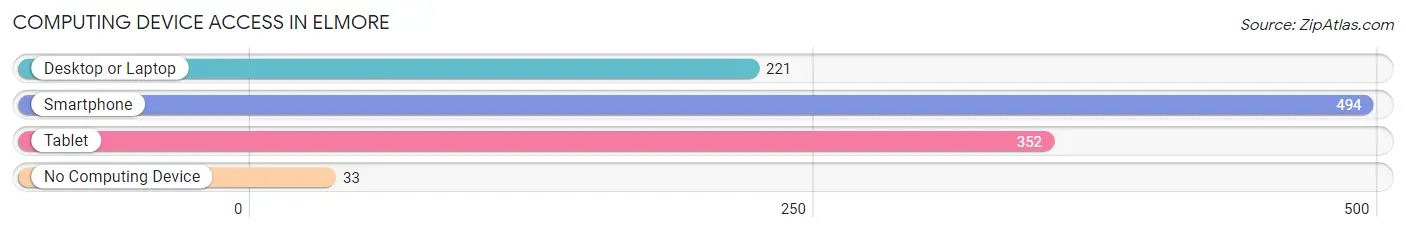
| Device Type | # Households | % Households |
| Desktop or Laptop | 221 | 37.3% |
| Smartphone | 494 | 83.3% |
| Tablet | 352 | 59.4% |
| No Computing Device | 33 | 5.6% |
| Total | 593 | 100.0% |
Internet Access in Elmore
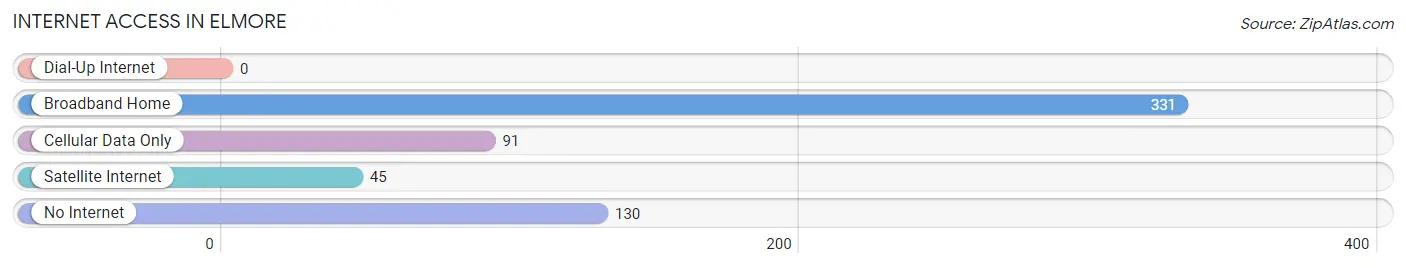
| Internet Type | # Households | % Households |
| Dial-Up Internet | 0 | 0.0% |
| Broadband Home | 331 | 55.8% |
| Cellular Data Only | 91 | 15.3% |
| Satellite Internet | 45 | 7.6% |
| No Internet | 130 | 21.9% |
| Total | 593 | 100.0% |
Elmore Summary
Elmore, Alabama is a small town located in Elmore County, Alabama. It is situated on the banks of the Coosa River, about 20 miles northeast of Montgomery. The town was founded in 1832 and was named after a prominent local family. The population of Elmore was 2,541 in the 2010 census.
Geography
Elmore is located at 32°30'25" North, 86°14'45" West (32.506944, -86.245833). It is situated on the banks of the Coosa River, about 20 miles northeast of Montgomery. The town is located in the Central Alabama region, and is part of the Montgomery Metropolitan Statistical Area.
The town has a total area of 4.2 square miles, all of which is land. The terrain is mostly flat, with some rolling hills. The climate is humid subtropical, with hot, humid summers and mild winters.
Economy
The economy of Elmore is largely based on agriculture and manufacturing. The town is home to several large farms, which produce cotton, corn, soybeans, and other crops. There are also several manufacturing plants in the area, which produce a variety of products, including automotive parts, furniture, and textiles.
The town is also home to several small businesses, including restaurants, retail stores, and service providers. The town is also home to a branch of the Alabama Department of Corrections, which employs a large number of people.
Demographics
As of the 2010 census, there were 2,541 people, 1,039 households, and 690 families residing in Elmore. The population density was 609.2 people per square mile. The racial makeup of the town was 79.2% White, 17.7% African American, 0.2% Native American, 0.4% Asian, 0.1% Pacific Islander, 1.2% from other races, and 1.2% from two or more races. Hispanic or Latino of any race were 2.3% of the population.
The median income for a household in Elmore was $37,917, and the median income for a family was $45,938. The per capita income for the town was $18,945. About 11.2% of families and 14.2% of the population were below the poverty line, including 19.2% of those under age 18 and 8.2% of those age 65 or over.
Elmore is a small town with a rich history and a diverse economy. It is home to a variety of businesses, farms, and manufacturing plants, and is a great place to live and work. The town is also home to a branch of the Alabama Department of Corrections, which provides employment opportunities for many of the town's residents.
Common Questions
What is Per Capita Income in Elmore?
Per Capita income in Elmore is $18,766.
What is the Median Family Income in Elmore?
Median Family Income in Elmore is $38,611.
What is the Median Household income in Elmore?
Median Household Income in Elmore is $29,946.
What is Income or Wage Gap in Elmore?
Income or Wage Gap in Elmore is 54.6%.
Women in Elmore earn 45.4 cents for every dollar earned by a man.
What is Inequality or Gini Index in Elmore?
Inequality or Gini Index in Elmore is 0.46.
What is the Total Population of Elmore?
Total Population of Elmore is 1,573.
What is the Total Male Population of Elmore?
Total Male Population of Elmore is 626.
What is the Total Female Population of Elmore?
Total Female Population of Elmore is 947.
What is the Ratio of Males per 100 Females in Elmore?
There are 66.10 Males per 100 Females in Elmore.
What is the Ratio of Females per 100 Males in Elmore?
There are 151.28 Females per 100 Males in Elmore.
What is the Median Population Age in Elmore?
Median Population Age in Elmore is 29.6 Years.
What is the Average Family Size in Elmore
Average Family Size in Elmore is 3.5 People.
What is the Average Household Size in Elmore
Average Household Size in Elmore is 2.6 People.
How Large is the Labor Force in Elmore?
There are 802 People in the Labor Forcein in Elmore.
What is the Percentage of People in the Labor Force in Elmore?
66.3% of People are in the Labor Force in Elmore.
What is the Unemployment Rate in Elmore?
Unemployment Rate in Elmore is 11.9%.