Bon Air, AL Map & Demographics
Bon Air Map
Bon Air Overview
$19,436
PER CAPITA INCOME
$42,500
AVG FAMILY INCOME
0.48
INEQUALITY / GINI INDEX
58
TOTAL POPULATION
25
MALE POPULATION
33
FEMALE POPULATION
75.76
MALES / 100 FEMALES
132.00
FEMALES / 100 MALES
52.3
MEDIAN AGE
3.5
AVG FAMILY SIZE
1.8
AVG HOUSEHOLD SIZE
13
LABOR FORCE [ PEOPLE ]
25.5%
PERCENT IN LABOR FORCE
Bon Air Zip Codes
Income in Bon Air
Income Overview in Bon Air
| Characteristic | Number | Measure |
| Per Capita Income | 58 | $19,436 |
| Median Family Income | 6 | $42,500 |
| Mean Family Income | 6 | $53,200 |
| Median Household Income | 33 | $0 |
| Mean Household Income | 33 | $34,061 |
| Income Deficit | 6 | $0 |
| Wage / Income Gap (%) | 58 | 0.00% |
| Wage / Income Gap ($) | 58 | 100.00¢ per $1 |
| Gini / Inequality Index | 58 | 0.48 |
Earnings by Sex in Bon Air
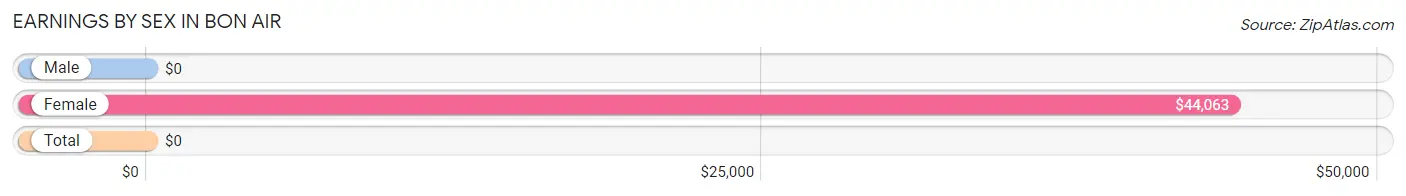
| Sex | Number | Average Earnings |
| Male | 5 (27.8%) | $0 |
| Female | 13 (72.2%) | $44,063 |
| Total | 18 (100.0%) | $0 |
Earnings by Sex by Income Bracket in Bon Air
The most common earnings brackets in Bon Air are $2,500 to $4,999 for men (3 | 60.0%) and $40,000 to $44,999 for women (4 | 30.8%).
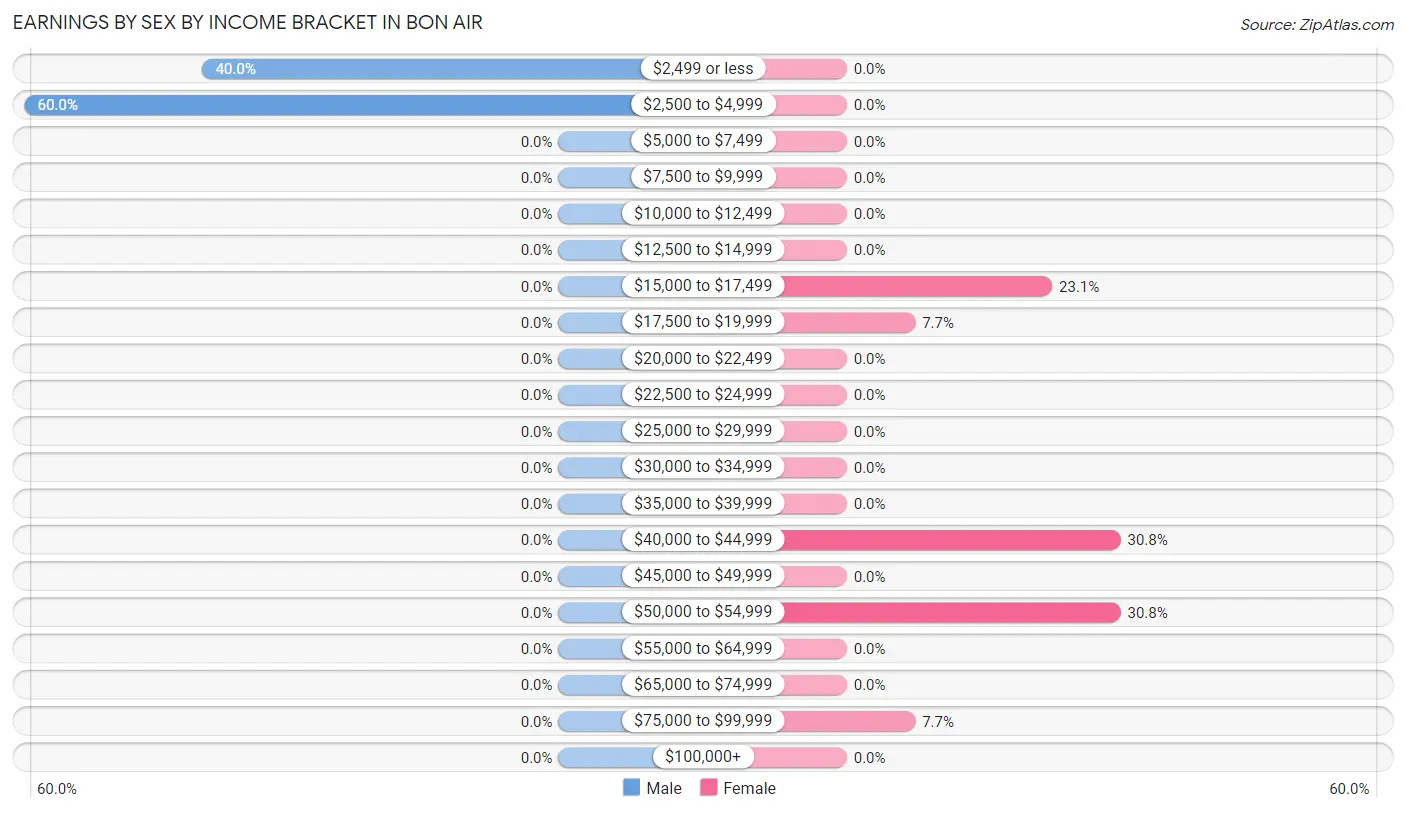
| Income | Male | Female |
| $2,499 or less | 2 (40.0%) | 0 (0.0%) |
| $2,500 to $4,999 | 3 (60.0%) | 0 (0.0%) |
| $5,000 to $7,499 | 0 (0.0%) | 0 (0.0%) |
| $7,500 to $9,999 | 0 (0.0%) | 0 (0.0%) |
| $10,000 to $12,499 | 0 (0.0%) | 0 (0.0%) |
| $12,500 to $14,999 | 0 (0.0%) | 0 (0.0%) |
| $15,000 to $17,499 | 0 (0.0%) | 3 (23.1%) |
| $17,500 to $19,999 | 0 (0.0%) | 1 (7.7%) |
| $20,000 to $22,499 | 0 (0.0%) | 0 (0.0%) |
| $22,500 to $24,999 | 0 (0.0%) | 0 (0.0%) |
| $25,000 to $29,999 | 0 (0.0%) | 0 (0.0%) |
| $30,000 to $34,999 | 0 (0.0%) | 0 (0.0%) |
| $35,000 to $39,999 | 0 (0.0%) | 0 (0.0%) |
| $40,000 to $44,999 | 0 (0.0%) | 4 (30.8%) |
| $45,000 to $49,999 | 0 (0.0%) | 0 (0.0%) |
| $50,000 to $54,999 | 0 (0.0%) | 4 (30.8%) |
| $55,000 to $64,999 | 0 (0.0%) | 0 (0.0%) |
| $65,000 to $74,999 | 0 (0.0%) | 0 (0.0%) |
| $75,000 to $99,999 | 0 (0.0%) | 1 (7.7%) |
| $100,000+ | 0 (0.0%) | 0 (0.0%) |
| Total | 5 (100.0%) | 13 (100.0%) |
Earnings by Sex by Educational Attainment in Bon Air
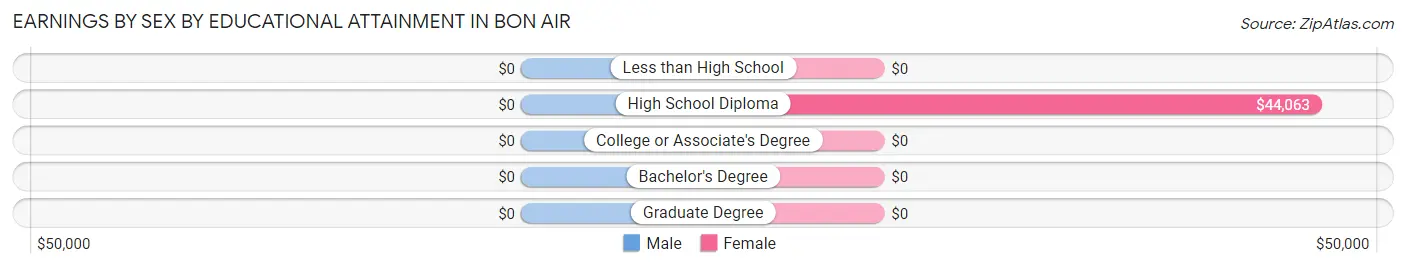
| Educational Attainment | Male Income | Female Income |
| Less than High School | - | - |
| High School Diploma | - | - |
| College or Associate's Degree | - | - |
| Bachelor's Degree | - | - |
| Graduate Degree | - | - |
| Total | - | - |
Family Income in Bon Air
Family Income Brackets in Bon Air
According to the Bon Air family income data, there are 3 families falling into the $35,000 to $49,999 income range, which is the most common income bracket and makes up 50.0% of all families.
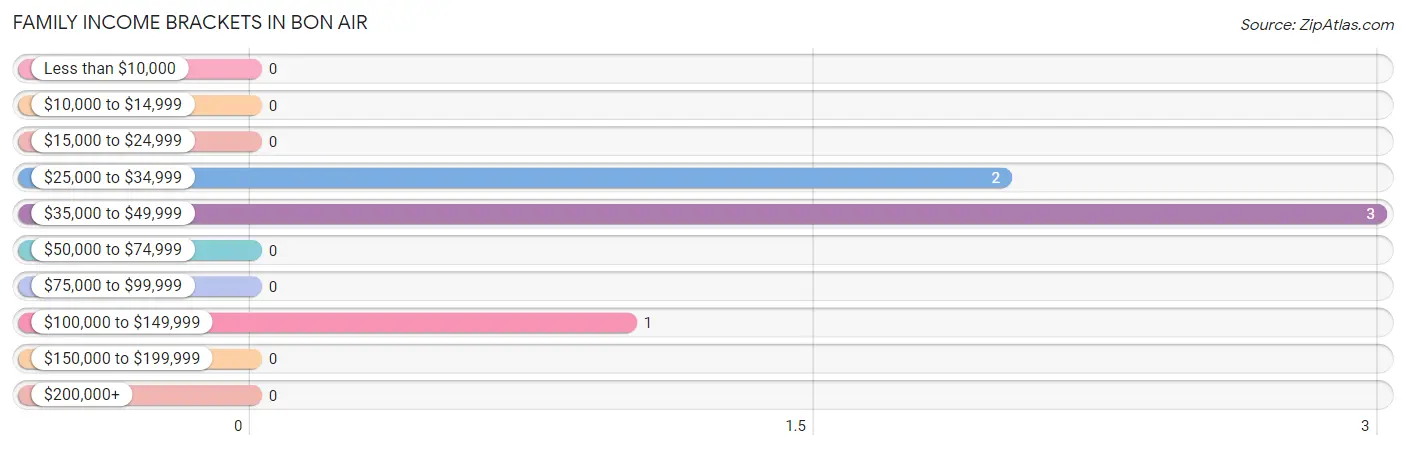
| Income Bracket | # Families | % Families |
| Less than $10,000 | 0 | 0.0% |
| $10,000 to $14,999 | 0 | 0.0% |
| $15,000 to $24,999 | 0 | 0.0% |
| $25,000 to $34,999 | 2 | 33.3% |
| $35,000 to $49,999 | 3 | 50.0% |
| $50,000 to $74,999 | 0 | 0.0% |
| $75,000 to $99,999 | 0 | 0.0% |
| $100,000 to $149,999 | 1 | 16.7% |
| $150,000 to $199,999 | 0 | 0.0% |
| $200,000+ | 0 | 0.0% |
Family Income by Famaliy Size in Bon Air
| Income Bracket | # Families | Median Income |
| 2-Person Families | 4 (66.7%) | $0 |
| 3-Person Families | 0 (0.0%) | $0 |
| 4-Person Families | 0 (0.0%) | $0 |
| 5-Person Families | 2 (33.3%) | $0 |
| 6-Person Families | 0 (0.0%) | $0 |
| 7+ Person Families | 0 (0.0%) | $0 |
| Total | 6 (100.0%) | $42,500 |
Family Income by Number of Earners in Bon Air
| Number of Earners | # Families | Median Income |
| No Earners | 2 (33.3%) | $0 |
| 1 Earner | 4 (66.7%) | $0 |
| 2 Earners | 0 (0.0%) | $0 |
| 3+ Earners | 0 (0.0%) | $0 |
| Total | 6 (100.0%) | $42,500 |
Household Income in Bon Air
Household Income Brackets in Bon Air
With 10 households falling in the category, the $10,000 to $14,999 income range is the most frequent in Bon Air, accounting for 30.3% of all households.
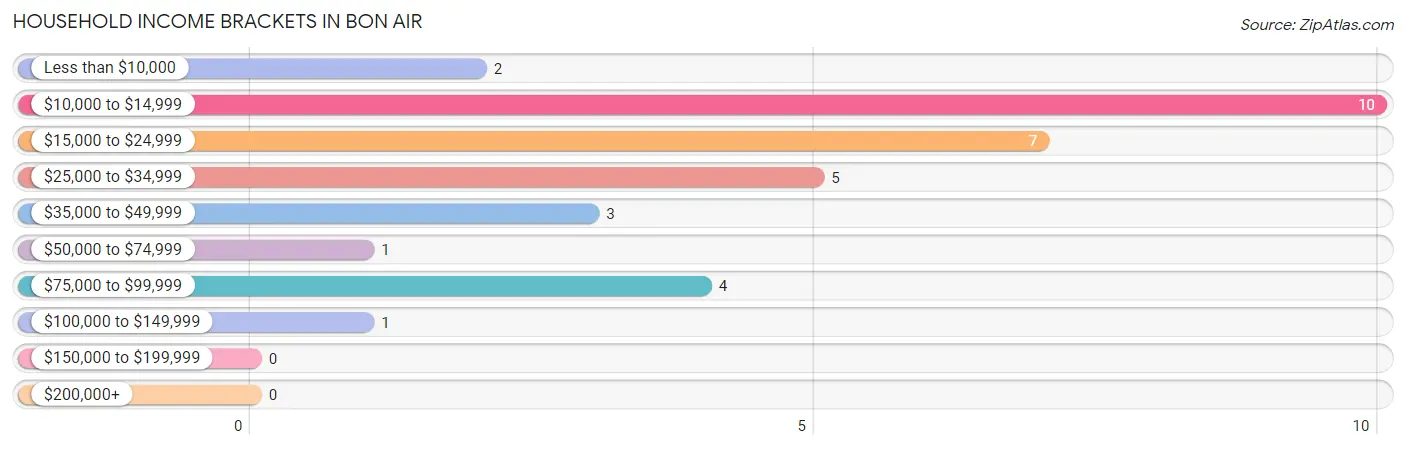
| Income Bracket | # Households | % Households |
| Less than $10,000 | 2 | 6.1% |
| $10,000 to $14,999 | 10 | 30.3% |
| $15,000 to $24,999 | 7 | 21.2% |
| $25,000 to $34,999 | 5 | 15.2% |
| $35,000 to $49,999 | 3 | 9.1% |
| $50,000 to $74,999 | 1 | 3.0% |
| $75,000 to $99,999 | 4 | 12.1% |
| $100,000 to $149,999 | 1 | 3.0% |
| $150,000 to $199,999 | 0 | 0.0% |
| $200,000+ | 0 | 0.0% |
Household Income by Householder Age in Bon Air
The median household income in Bon Air is $0, with the highest median household income of $25,000 found in the 65+ years age bracket for the primary householder. A total of 18 households (54.5%) fall into this category.
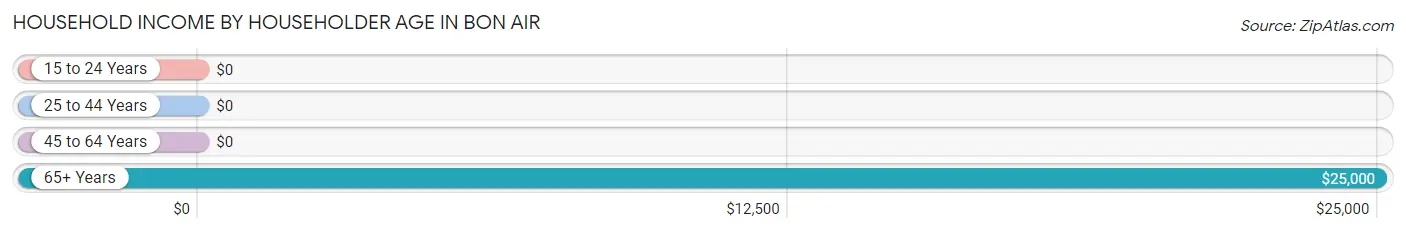
| Income Bracket | # Households | Median Income |
| 15 to 24 Years | 0 (0.0%) | $0 |
| 25 to 44 Years | 7 (21.2%) | $0 |
| 45 to 64 Years | 8 (24.2%) | $0 |
| 65+ Years | 18 (54.5%) | $25,000 |
| Total | 33 (100.0%) | $0 |
Poverty in Bon Air
Income Below Poverty by Sex and Age in Bon Air
With 76.0% poverty level for males and 30.0% for females among the residents of Bon Air, under 5 year old males and 65 to 74 year old females are the most vulnerable to poverty, with 4 males (100.0%) and 5 females (71.4%) in their respective age groups living below the poverty level.
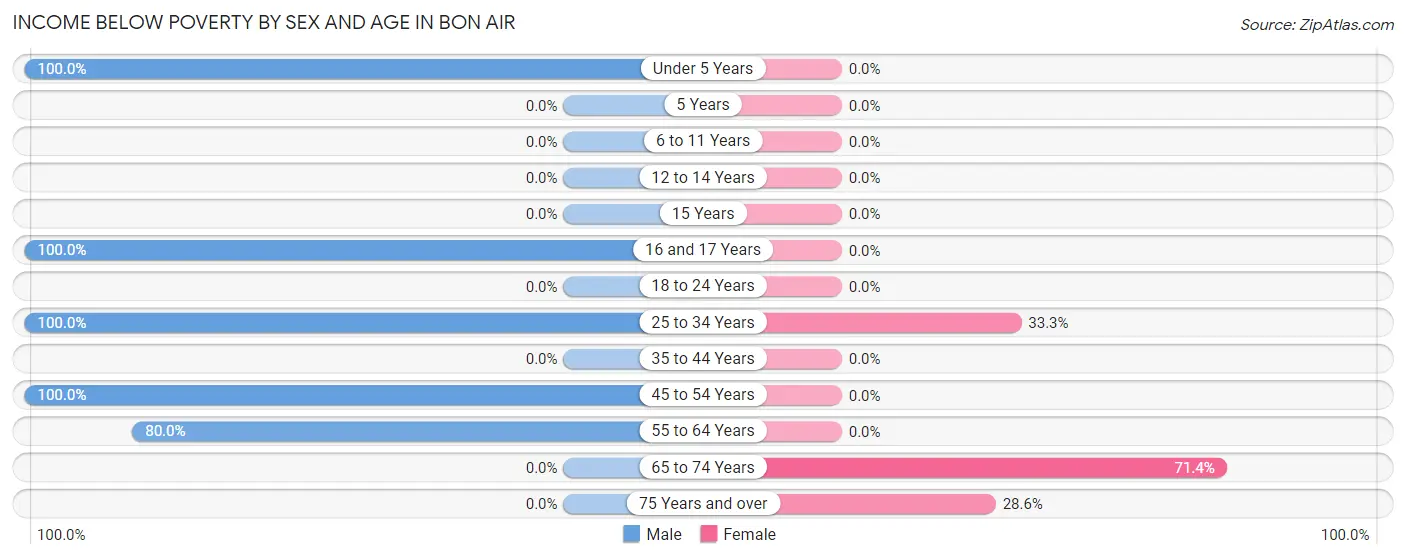
| Age Bracket | Male | Female |
| Under 5 Years | 4 (100.0%) | 0 (0.0%) |
| 5 Years | 0 (0.0%) | 0 (0.0%) |
| 6 to 11 Years | 0 (0.0%) | 0 (0.0%) |
| 12 to 14 Years | 0 (0.0%) | 0 (0.0%) |
| 15 Years | 0 (0.0%) | 0 (0.0%) |
| 16 and 17 Years | 6 (100.0%) | 0 (0.0%) |
| 18 to 24 Years | 0 (0.0%) | 0 (0.0%) |
| 25 to 34 Years | 2 (100.0%) | 2 (33.3%) |
| 35 to 44 Years | 0 (0.0%) | 0 (0.0%) |
| 45 to 54 Years | 3 (100.0%) | 0 (0.0%) |
| 55 to 64 Years | 4 (80.0%) | 0 (0.0%) |
| 65 to 74 Years | 0 (0.0%) | 5 (71.4%) |
| 75 Years and over | 0 (0.0%) | 2 (28.6%) |
| Total | 19 (76.0%) | 9 (30.0%) |
Income Above Poverty by Sex and Age in Bon Air
According to the poverty statistics in Bon Air, males aged 65 to 74 years and females aged 35 to 44 years are the age groups that are most secure financially, with 100.0% of males and 100.0% of females in these age groups living above the poverty line.
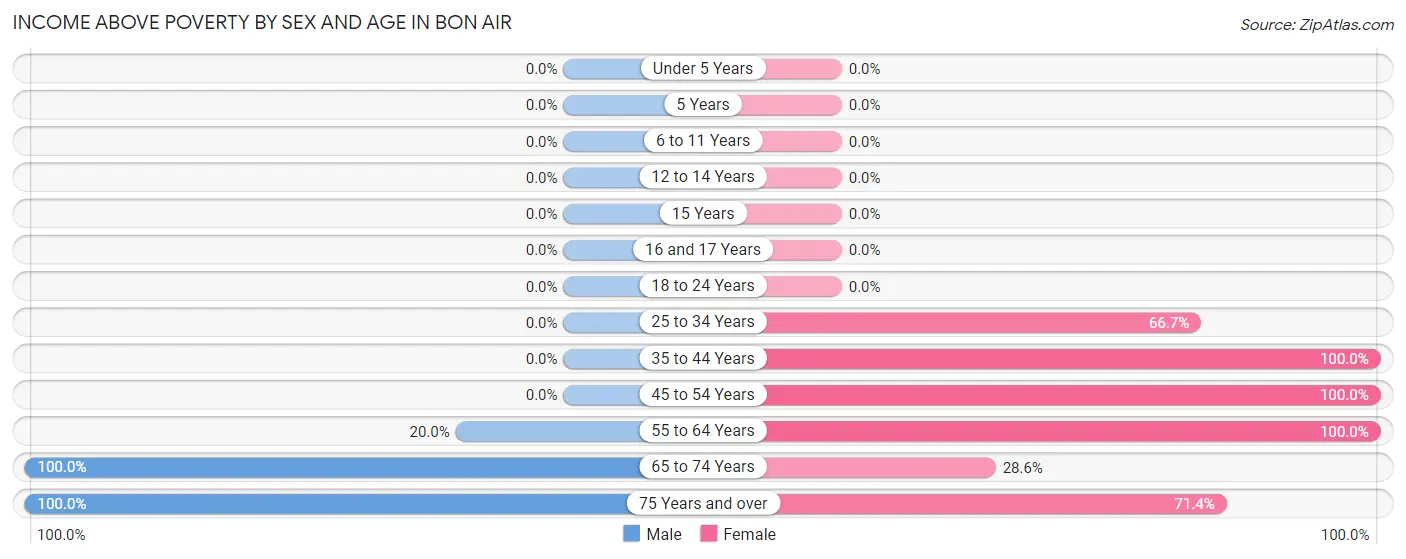
| Age Bracket | Male | Female |
| Under 5 Years | 0 (0.0%) | 0 (0.0%) |
| 5 Years | 0 (0.0%) | 0 (0.0%) |
| 6 to 11 Years | 0 (0.0%) | 0 (0.0%) |
| 12 to 14 Years | 0 (0.0%) | 0 (0.0%) |
| 15 Years | 0 (0.0%) | 0 (0.0%) |
| 16 and 17 Years | 0 (0.0%) | 0 (0.0%) |
| 18 to 24 Years | 0 (0.0%) | 0 (0.0%) |
| 25 to 34 Years | 0 (0.0%) | 4 (66.7%) |
| 35 to 44 Years | 0 (0.0%) | 7 (100.0%) |
| 45 to 54 Years | 0 (0.0%) | 2 (100.0%) |
| 55 to 64 Years | 1 (20.0%) | 1 (100.0%) |
| 65 to 74 Years | 3 (100.0%) | 2 (28.6%) |
| 75 Years and over | 2 (100.0%) | 5 (71.4%) |
| Total | 6 (24.0%) | 21 (70.0%) |
Income Below Poverty Among Married-Couple Families in Bon Air
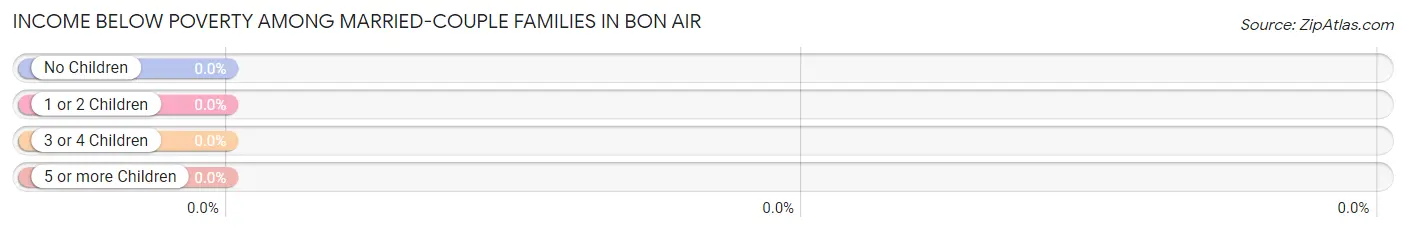
| Children | Above Poverty | Below Poverty |
| No Children | 1 (100.0%) | 0 (0.0%) |
| 1 or 2 Children | 0 (0.0%) | 0 (0.0%) |
| 3 or 4 Children | 0 (0.0%) | 0 (0.0%) |
| 5 or more Children | 0 (0.0%) | 0 (0.0%) |
| Total | 1 (100.0%) | 0 (0.0%) |
Income Below Poverty Among Single-Parent Households in Bon Air
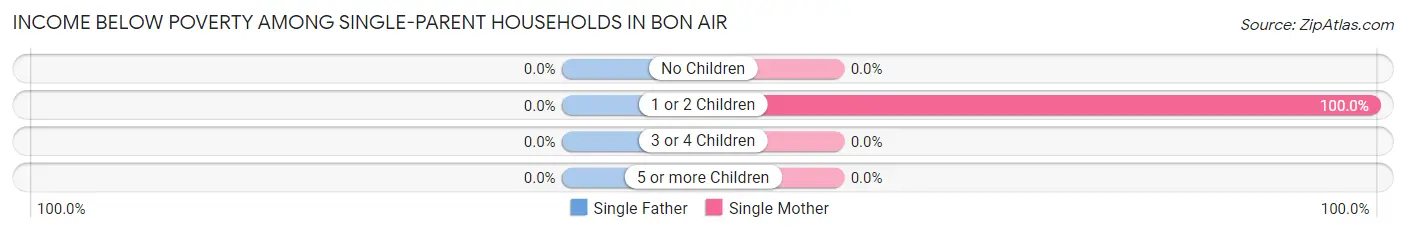
| Children | Single Father | Single Mother |
| No Children | 0 (0.0%) | 0 (0.0%) |
| 1 or 2 Children | 0 (0.0%) | 2 (100.0%) |
| 3 or 4 Children | 0 (0.0%) | 0 (0.0%) |
| 5 or more Children | 0 (0.0%) | 0 (0.0%) |
| Total | 0 (0.0%) | 2 (50.0%) |
Income Below Poverty Among Married-Couple vs Single-Parent Households in Bon Air
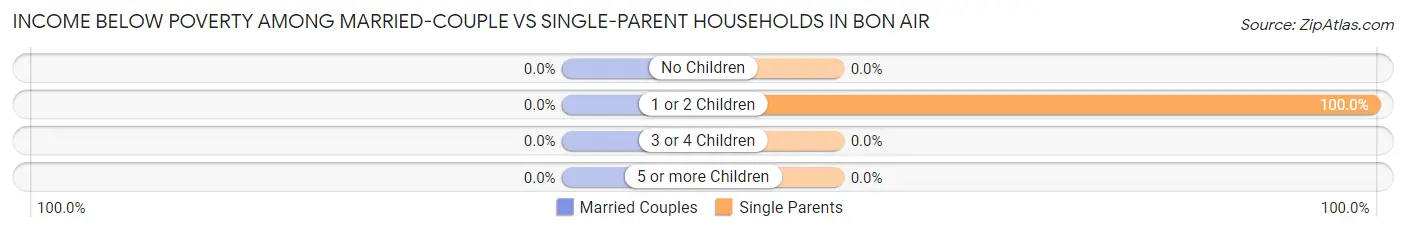
| Children | Married-Couple Families | Single-Parent Households |
| No Children | 0 (0.0%) | 0 (0.0%) |
| 1 or 2 Children | 0 (0.0%) | 2 (100.0%) |
| 3 or 4 Children | 0 (0.0%) | 0 (0.0%) |
| 5 or more Children | 0 (0.0%) | 0 (0.0%) |
| Total | 0 (0.0%) | 2 (40.0%) |
Race in Bon Air
The most populous races in Bon Air are White / Caucasian (43 | 74.1%), Hispanic or Latino (13 | 22.4%), and Two or more Races (10 | 17.2%).
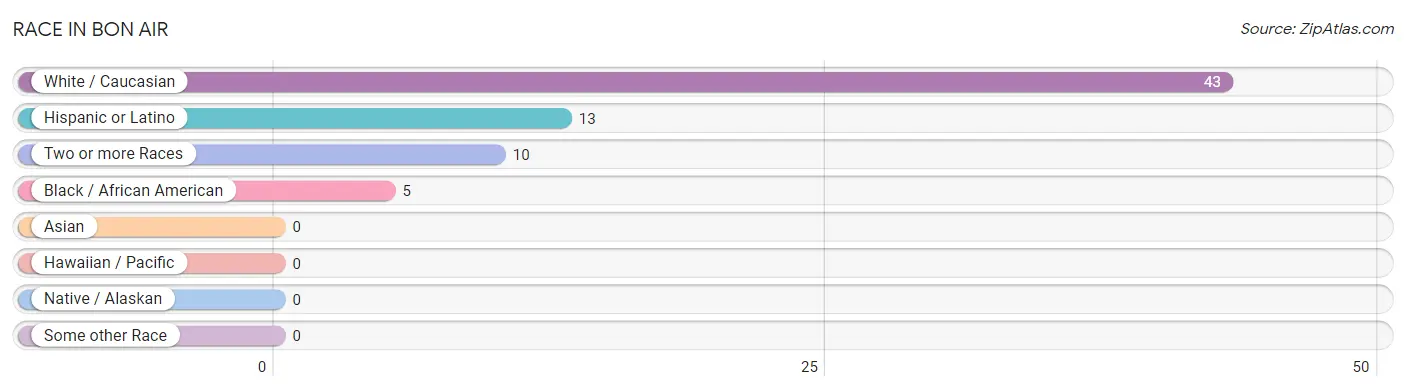
| Race | # Population | % Population |
| Asian | 0 | 0.0% |
| Black / African American | 5 | 8.6% |
| Hawaiian / Pacific | 0 | 0.0% |
| Hispanic or Latino | 13 | 22.4% |
| Native / Alaskan | 0 | 0.0% |
| White / Caucasian | 43 | 74.1% |
| Two or more Races | 10 | 17.2% |
| Some other Race | 0 | 0.0% |
| Total | 58 | 100.0% |
Ancestry in Bon Air
The most populous ancestries reported in Bon Air are Mexican (13 | 22.4%), Irish (11 | 19.0%), American (4 | 6.9%), Scottish (4 | 6.9%), and English (2 | 3.5%), together accounting for 58.6% of all Bon Air residents.
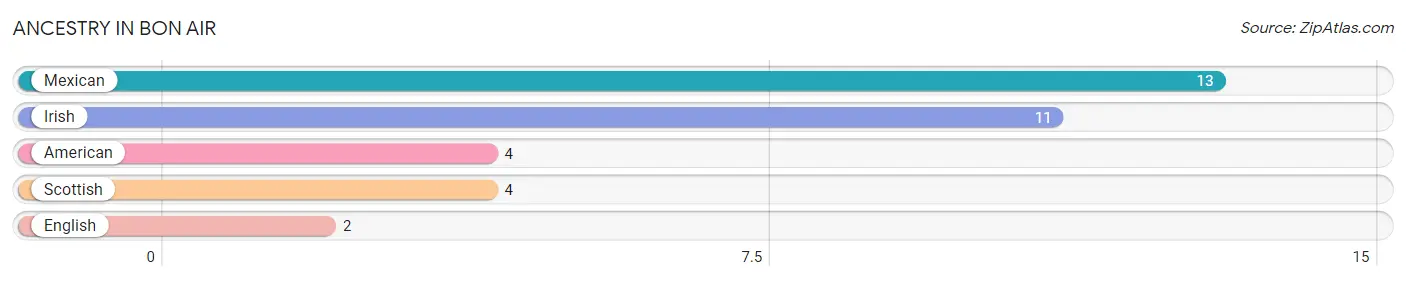
| Ancestry | # Population | % Population |
| American | 4 | 6.9% |
| English | 2 | 3.5% |
| Irish | 11 | 19.0% |
| Mexican | 13 | 22.4% |
| Scottish | 4 | 6.9% | View All 5 Rows |
Immigrants in Bon Air

| Immigration Origin | # Population | % Population | View All 0 Rows |
Sex and Age in Bon Air
Sex and Age in Bon Air
The most populous age groups in Bon Air are 15 to 19 Years (6 | 24.0%) for men and 75 to 79 Years (6 | 18.2%) for women.
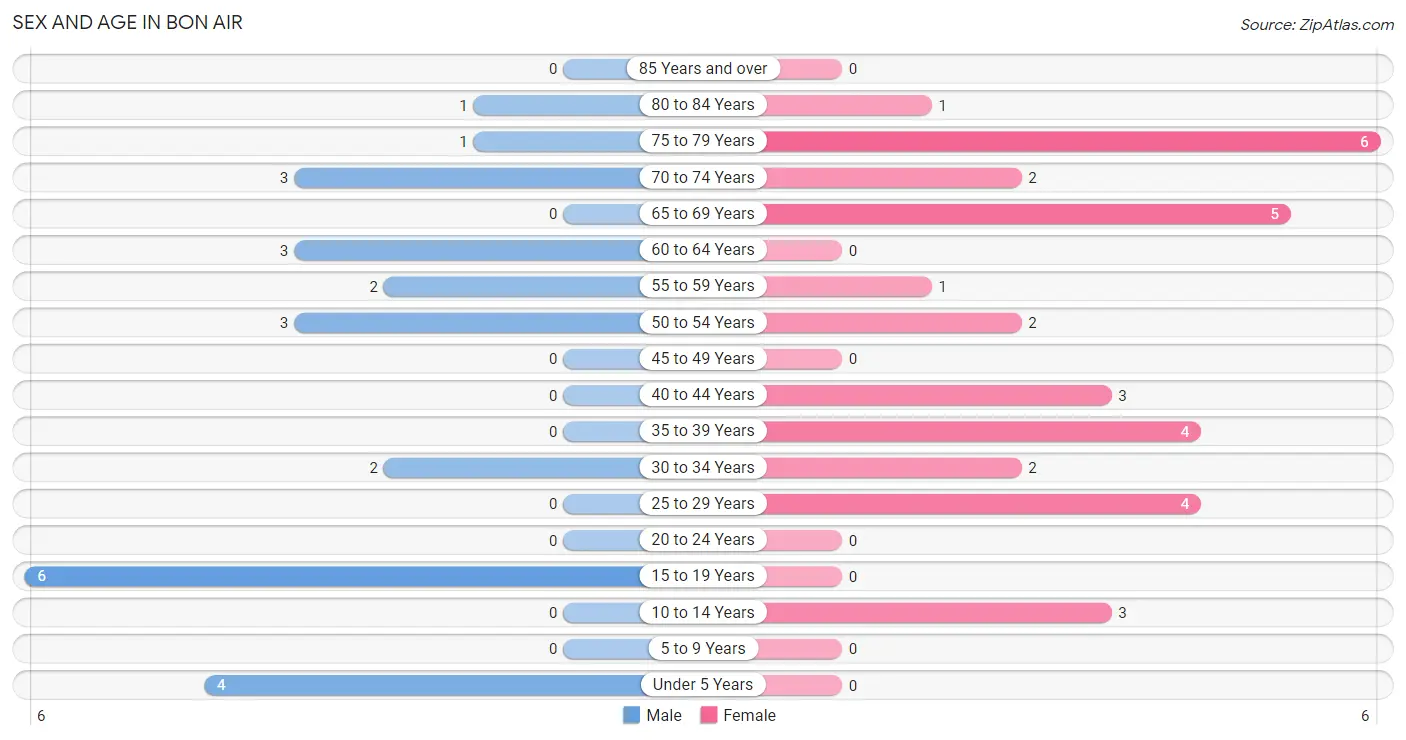
| Age Bracket | Male | Female |
| Under 5 Years | 4 (16.0%) | 0 (0.0%) |
| 5 to 9 Years | 0 (0.0%) | 0 (0.0%) |
| 10 to 14 Years | 0 (0.0%) | 3 (9.1%) |
| 15 to 19 Years | 6 (24.0%) | 0 (0.0%) |
| 20 to 24 Years | 0 (0.0%) | 0 (0.0%) |
| 25 to 29 Years | 0 (0.0%) | 4 (12.1%) |
| 30 to 34 Years | 2 (8.0%) | 2 (6.1%) |
| 35 to 39 Years | 0 (0.0%) | 4 (12.1%) |
| 40 to 44 Years | 0 (0.0%) | 3 (9.1%) |
| 45 to 49 Years | 0 (0.0%) | 0 (0.0%) |
| 50 to 54 Years | 3 (12.0%) | 2 (6.1%) |
| 55 to 59 Years | 2 (8.0%) | 1 (3.0%) |
| 60 to 64 Years | 3 (12.0%) | 0 (0.0%) |
| 65 to 69 Years | 0 (0.0%) | 5 (15.1%) |
| 70 to 74 Years | 3 (12.0%) | 2 (6.1%) |
| 75 to 79 Years | 1 (4.0%) | 6 (18.2%) |
| 80 to 84 Years | 1 (4.0%) | 1 (3.0%) |
| 85 Years and over | 0 (0.0%) | 0 (0.0%) |
| Total | 25 (100.0%) | 33 (100.0%) |
Families and Households in Bon Air
Median Family Size in Bon Air
The median family size in Bon Air is 3.50 persons per family, with single female/mother families (4 | 66.7%) accounting for the largest median family size of 4.25 persons per family. On the other hand, married-couple families (1 | 16.7%) represent the smallest median family size with 2.00 persons per family.
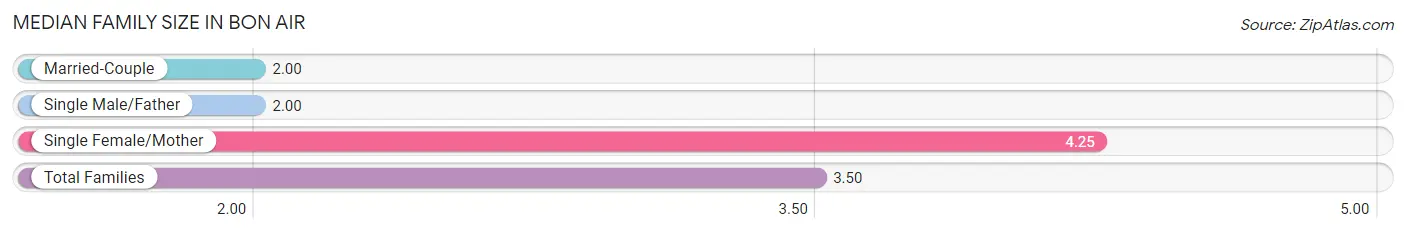
| Family Type | # Families | Family Size |
| Married-Couple | 1 (16.7%) | 2.00 |
| Single Male/Father | 1 (16.7%) | 2.00 |
| Single Female/Mother | 4 (66.7%) | 4.25 |
| Total Families | 6 (100.0%) | 3.50 |
Median Household Size in Bon Air
The median household size in Bon Air is 1.76 persons per household, with single female/mother households (4 | 12.1%) accounting for the largest median household size of 4.25 persons per household. non-family households (27 | 81.8%) represent the smallest median household size with 1.37 persons per household.
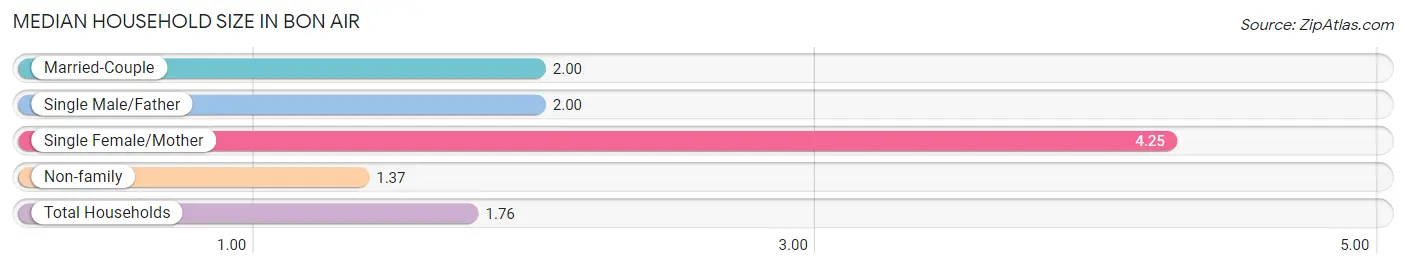
| Household Type | # Households | Household Size |
| Married-Couple | 1 (3.0%) | 2.00 |
| Single Male/Father | 1 (3.0%) | 2.00 |
| Single Female/Mother | 4 (12.1%) | 4.25 |
| Non-family | 27 (81.8%) | 1.37 |
| Total Households | 33 (100.0%) | 1.76 |
Household Size by Marriage Status in Bon Air
Out of a total of 33 households in Bon Air, 6 (18.2%) are family households, while 27 (81.8%) are nonfamily households. The most numerous type of family households are 2-person households, comprising 4, and the most common type of nonfamily households are 1-person households, comprising 23.
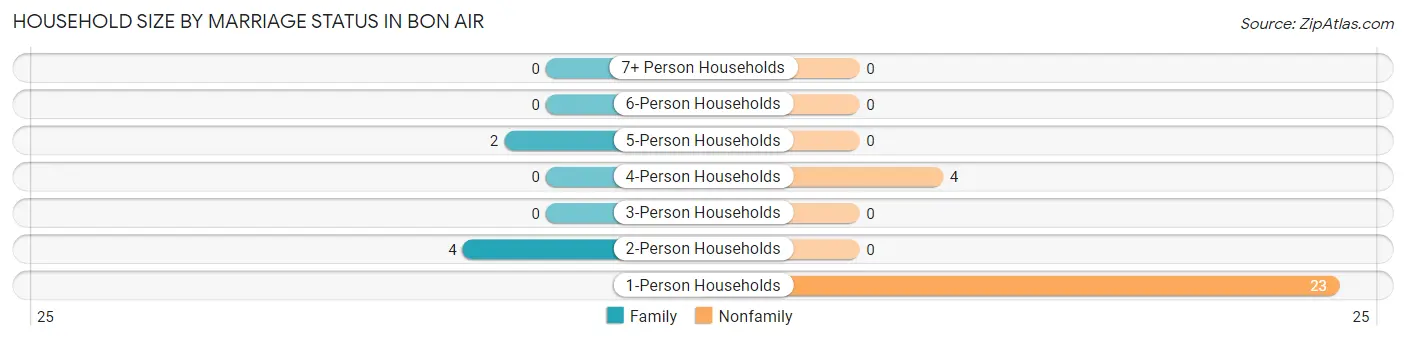
| Household Size | Family Households | Nonfamily Households |
| 1-Person Households | - | 23 (69.7%) |
| 2-Person Households | 4 (12.1%) | 0 (0.0%) |
| 3-Person Households | 0 (0.0%) | 0 (0.0%) |
| 4-Person Households | 0 (0.0%) | 4 (12.1%) |
| 5-Person Households | 2 (6.1%) | 0 (0.0%) |
| 6-Person Households | 0 (0.0%) | 0 (0.0%) |
| 7+ Person Households | 0 (0.0%) | 0 (0.0%) |
| Total | 6 (18.2%) | 27 (81.8%) |
Female Fertility in Bon Air
Fertility by Age in Bon Air
Average fertility rate in Bon Air is 154.0 births per 1,000 women. Women in the age bracket of 20 to 34 years have the highest fertility rate with 333.0 births per 1,000 women. Women in the age bracket of 20 to 34 years acount for 100.0% of all women with births.
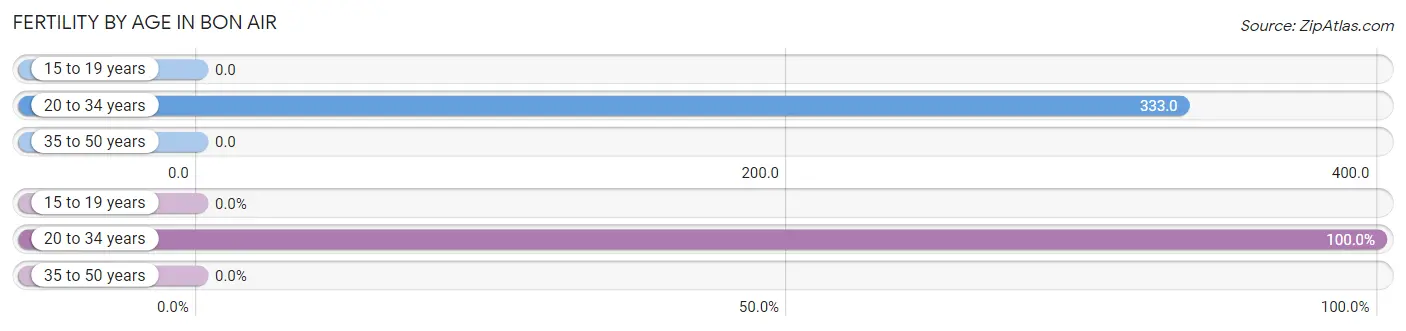
| Age Bracket | Women with Births | Births / 1,000 Women |
| 15 to 19 years | 0 (0.0%) | 0.0 |
| 20 to 34 years | 2 (100.0%) | 333.0 |
| 35 to 50 years | 0 (0.0%) | 0.0 |
| Total | 2 (100.0%) | 154.0 |
Fertility by Age by Marriage Status in Bon Air
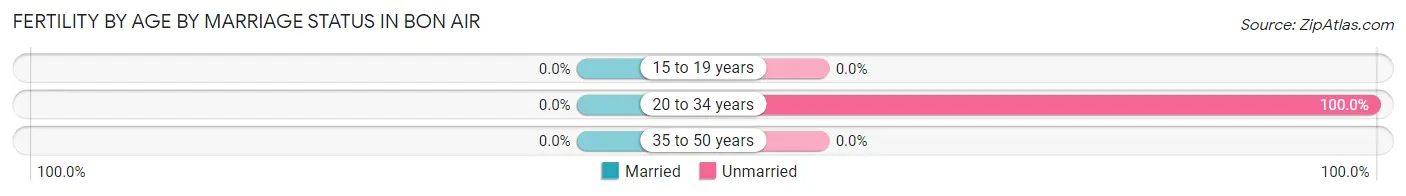
| Age Bracket | Married | Unmarried |
| 15 to 19 years | 0 (0.0%) | 0 (0.0%) |
| 20 to 34 years | 0 (0.0%) | 2 (100.0%) |
| 35 to 50 years | 0 (0.0%) | 0 (0.0%) |
| Total | 0 (0.0%) | 2 (100.0%) |
Fertility by Education in Bon Air
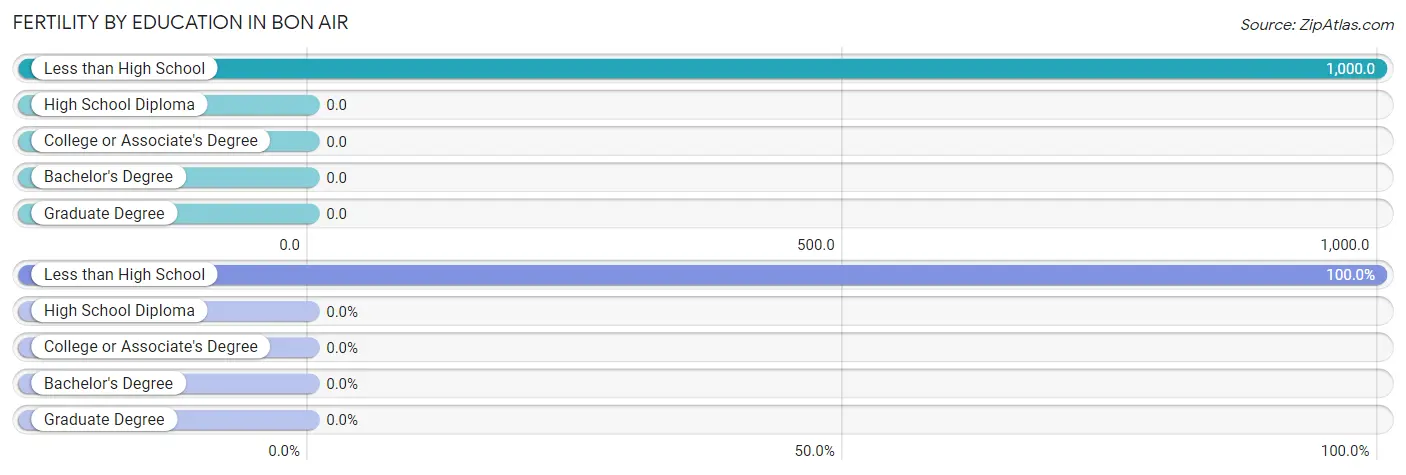
| Educational Attainment | Women with Births | Births / 1,000 Women |
| Less than High School | 2 (100.0%) | 1,000.0 |
| High School Diploma | 0 (0.0%) | 0.0 |
| College or Associate's Degree | 0 (0.0%) | 0.0 |
| Bachelor's Degree | 0 (0.0%) | 0.0 |
| Graduate Degree | 0 (0.0%) | 0.0 |
| Total | 2 (100.0%) | 154.0 |
Fertility by Education by Marriage Status in Bon Air
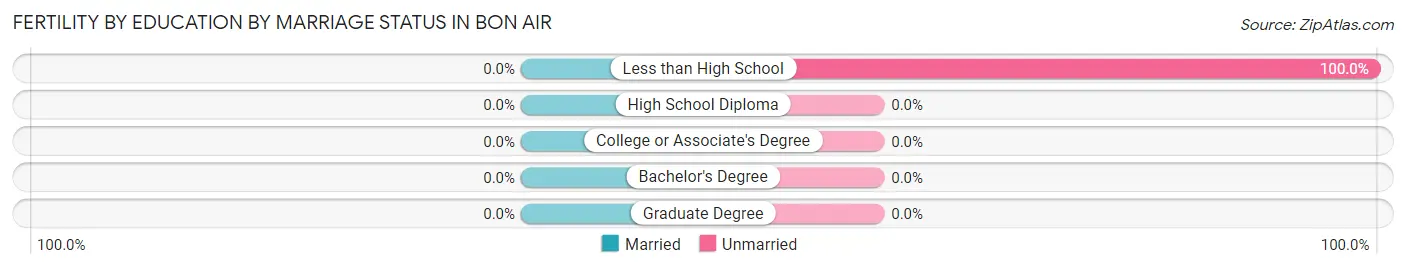
| Educational Attainment | Married | Unmarried |
| Less than High School | 0 (0.0%) | 2 (100.0%) |
| High School Diploma | 0 (0.0%) | 0 (0.0%) |
| College or Associate's Degree | 0 (0.0%) | 0 (0.0%) |
| Bachelor's Degree | 0 (0.0%) | 0 (0.0%) |
| Graduate Degree | 0 (0.0%) | 0 (0.0%) |
| Total | 0 (0.0%) | 2 (100.0%) |
Employment Characteristics in Bon Air
Employment by Class of Employer in Bon Air
Among the 10 employed individuals in Bon Air, , and private company employees (10 | 100.0%) make up the most common classes of employment.
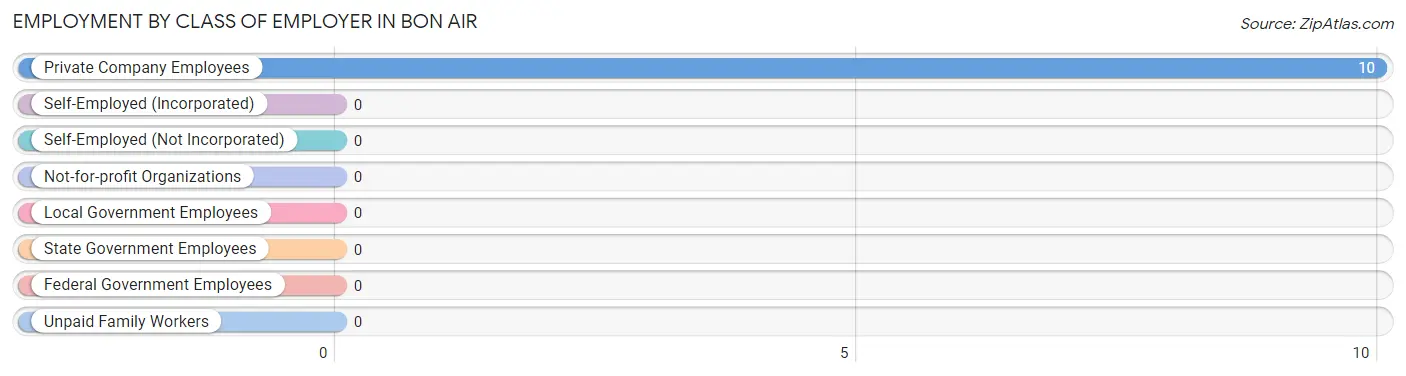
| Employer Class | # Employees | % Employees |
| Private Company Employees | 10 | 100.0% |
| Self-Employed (Incorporated) | 0 | 0.0% |
| Self-Employed (Not Incorporated) | 0 | 0.0% |
| Not-for-profit Organizations | 0 | 0.0% |
| Local Government Employees | 0 | 0.0% |
| State Government Employees | 0 | 0.0% |
| Federal Government Employees | 0 | 0.0% |
| Unpaid Family Workers | 0 | 0.0% |
| Total | 10 | 100.0% |
Employment Status by Age in Bon Air
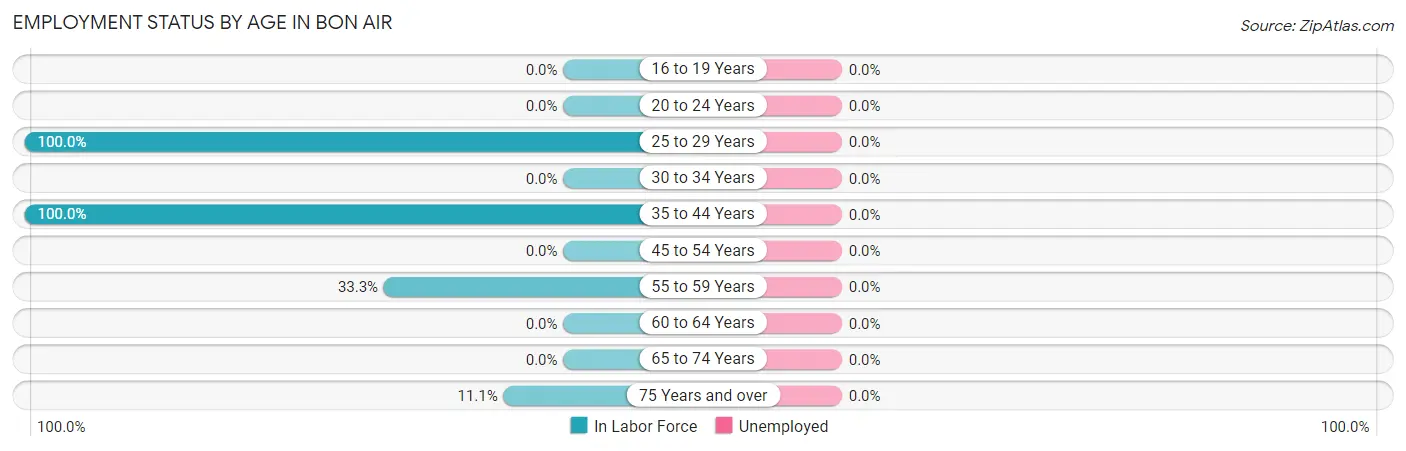
| Age Bracket | In Labor Force | Unemployed |
| 16 to 19 Years | 0 (0.0%) | 0 (0.0%) |
| 20 to 24 Years | 0 (0.0%) | 0 (0.0%) |
| 25 to 29 Years | 4 (100.0%) | 0 (0.0%) |
| 30 to 34 Years | 0 (0.0%) | 0 (0.0%) |
| 35 to 44 Years | 7 (100.0%) | 0 (0.0%) |
| 45 to 54 Years | 0 (0.0%) | 0 (0.0%) |
| 55 to 59 Years | 1 (33.3%) | 0 (0.0%) |
| 60 to 64 Years | 0 (0.0%) | 0 (0.0%) |
| 65 to 74 Years | 0 (0.0%) | 0 (0.0%) |
| 75 Years and over | 1 (11.1%) | 0 (0.0%) |
| Total | 13 (25.5%) | 0 (0.0%) |
Employment Status by Educational Attainment in Bon Air
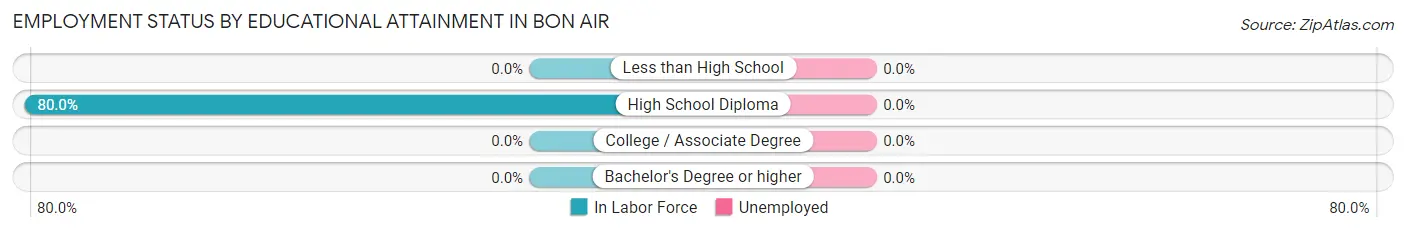
| Educational Attainment | In Labor Force | Unemployed |
| Less than High School | 0 (0.0%) | 0 (0.0%) |
| High School Diploma | 12 (80.0%) | 0 (0.0%) |
| College / Associate Degree | 0 (0.0%) | 0 (0.0%) |
| Bachelor's Degree or higher | 0 (0.0%) | 0 (0.0%) |
| Total | 12 (46.2%) | 0 (0.0%) |
Employment Occupations by Sex in Bon Air
Management, Business, Science and Arts Occupations
The most common Management, Business, Science and Arts occupations in Bon Air are , and Management (1 | 7.7%).
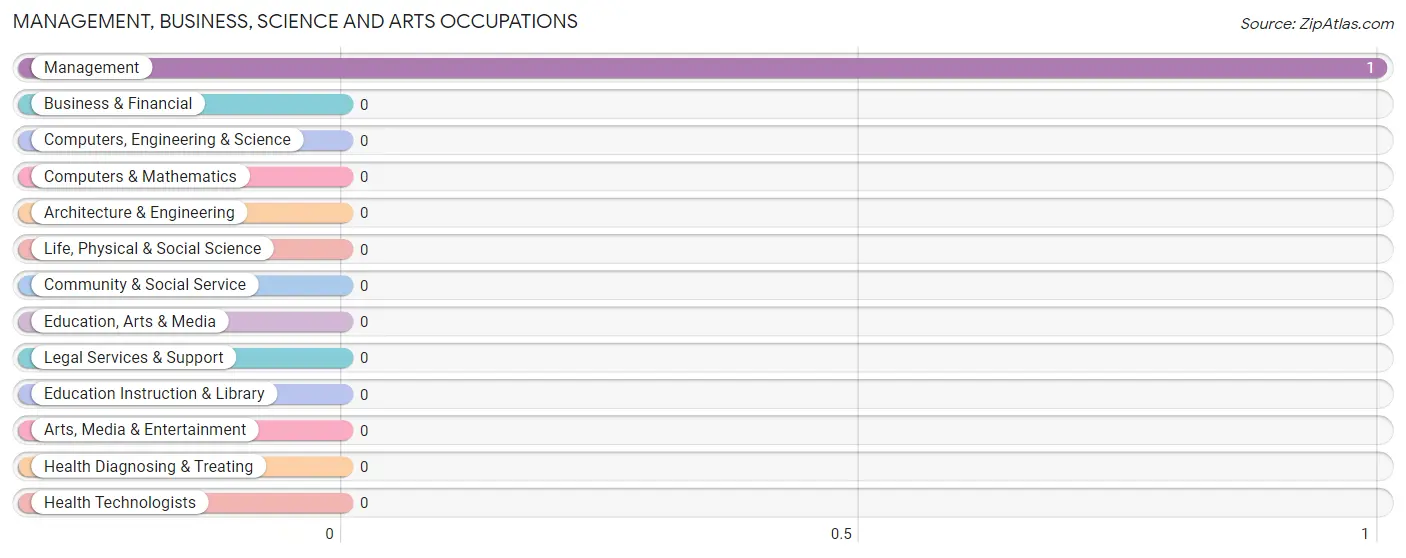
Management, Business, Science and Arts Occupations by Sex
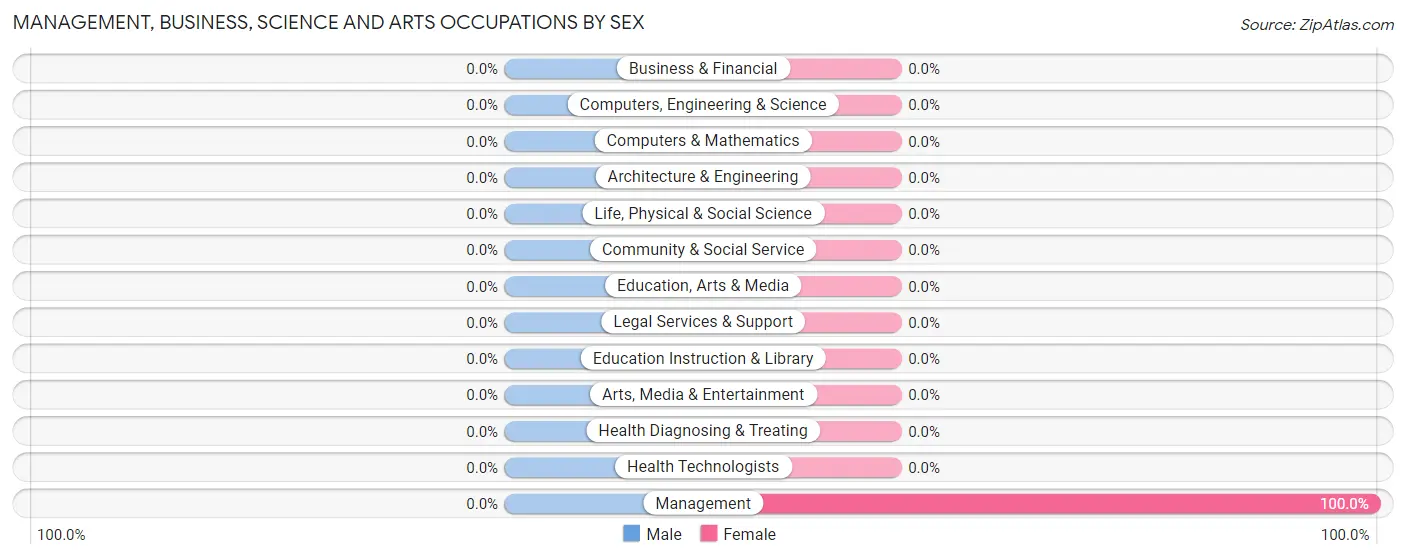
| Occupation | Male | Female |
| Management | 0 (0.0%) | 1 (100.0%) |
| Business & Financial | 0 (0.0%) | 0 (0.0%) |
| Computers, Engineering & Science | 0 (0.0%) | 0 (0.0%) |
| Computers & Mathematics | 0 (0.0%) | 0 (0.0%) |
| Architecture & Engineering | 0 (0.0%) | 0 (0.0%) |
| Life, Physical & Social Science | 0 (0.0%) | 0 (0.0%) |
| Community & Social Service | 0 (0.0%) | 0 (0.0%) |
| Education, Arts & Media | 0 (0.0%) | 0 (0.0%) |
| Legal Services & Support | 0 (0.0%) | 0 (0.0%) |
| Education Instruction & Library | 0 (0.0%) | 0 (0.0%) |
| Arts, Media & Entertainment | 0 (0.0%) | 0 (0.0%) |
| Health Diagnosing & Treating | 0 (0.0%) | 0 (0.0%) |
| Health Technologists | 0 (0.0%) | 0 (0.0%) |
| Total (Category) | 0 (0.0%) | 1 (100.0%) |
| Total (Overall) | 0 (0.0%) | 13 (100.0%) |
Services Occupations
The most common Services occupations in Bon Air are , and Food Preparation & Serving (4 | 30.8%).
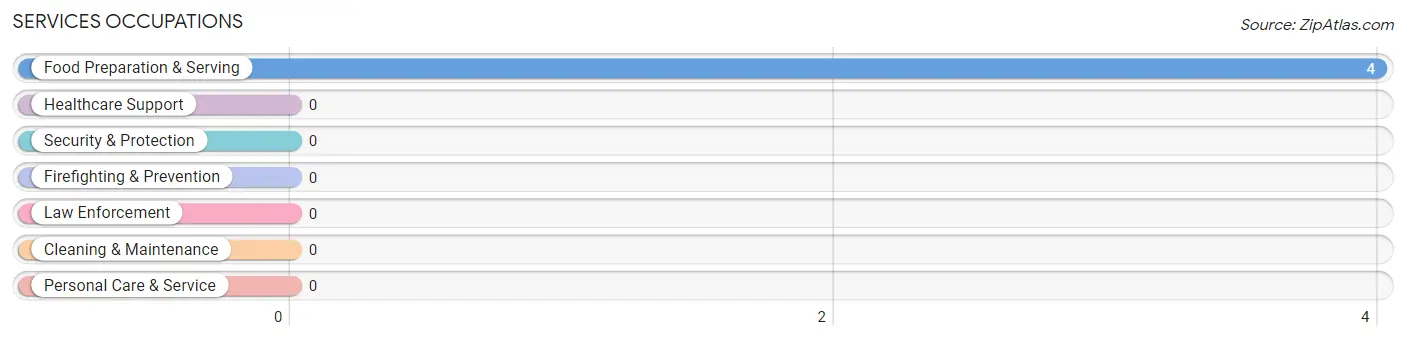
Services Occupations by Sex
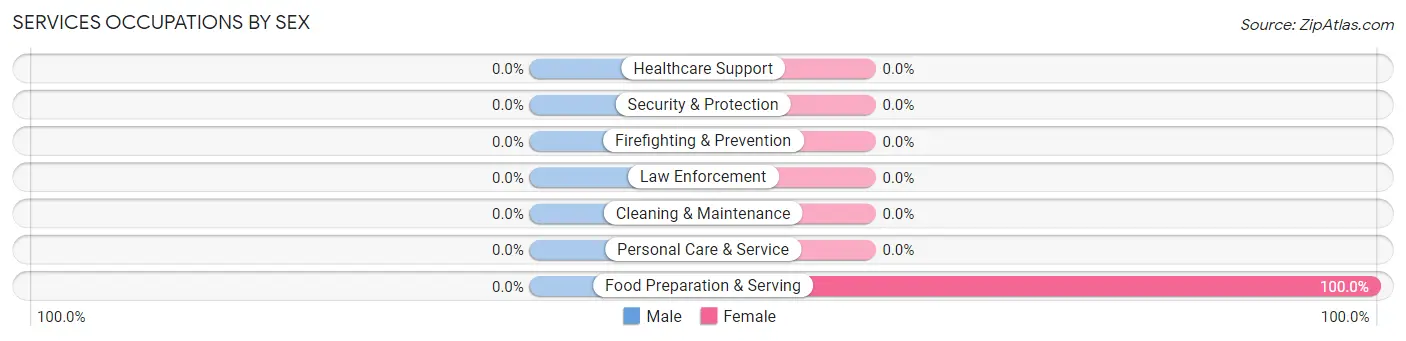
| Occupation | Male | Female |
| Healthcare Support | 0 (0.0%) | 0 (0.0%) |
| Security & Protection | 0 (0.0%) | 0 (0.0%) |
| Firefighting & Prevention | 0 (0.0%) | 0 (0.0%) |
| Law Enforcement | 0 (0.0%) | 0 (0.0%) |
| Food Preparation & Serving | 0 (0.0%) | 4 (100.0%) |
| Cleaning & Maintenance | 0 (0.0%) | 0 (0.0%) |
| Personal Care & Service | 0 (0.0%) | 0 (0.0%) |
| Total (Category) | 0 (0.0%) | 4 (100.0%) |
| Total (Overall) | 0 (0.0%) | 13 (100.0%) |
Sales and Office Occupations
The most common Sales and Office occupations in Bon Air are , and Sales & Related (4 | 30.8%).
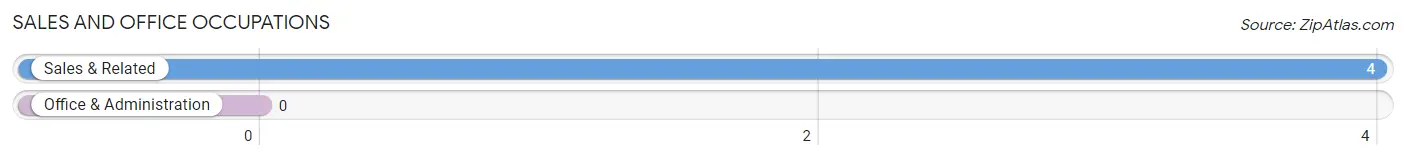
Sales and Office Occupations by Sex
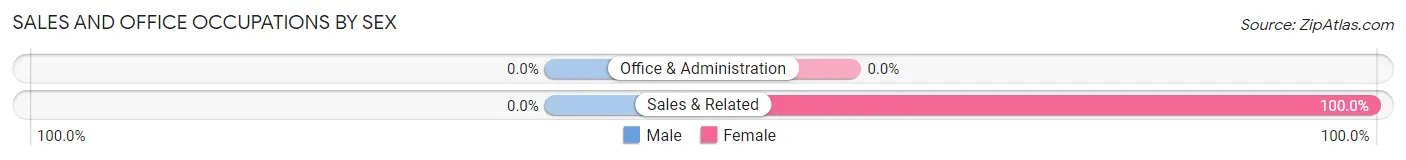
| Occupation | Male | Female |
| Sales & Related | 0 (0.0%) | 4 (100.0%) |
| Office & Administration | 0 (0.0%) | 0 (0.0%) |
| Total (Category) | 0 (0.0%) | 4 (100.0%) |
| Total (Overall) | 0 (0.0%) | 13 (100.0%) |
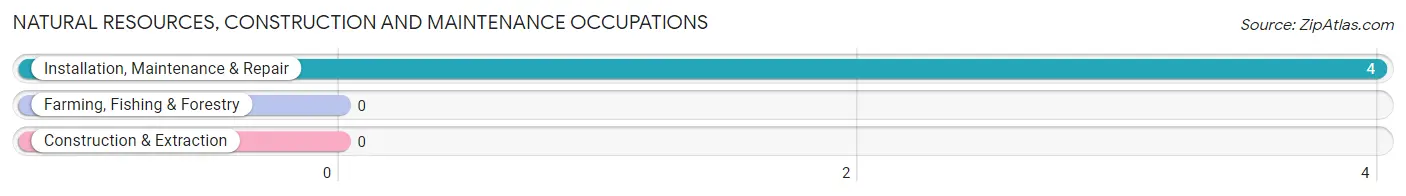
Natural Resources, Construction and Maintenance Occupations
The most common Natural Resources, Construction and Maintenance occupations in Bon Air are , and Installation, Maintenance & Repair (4 | 30.8%).
Natural Resources, Construction and Maintenance Occupations by Sex
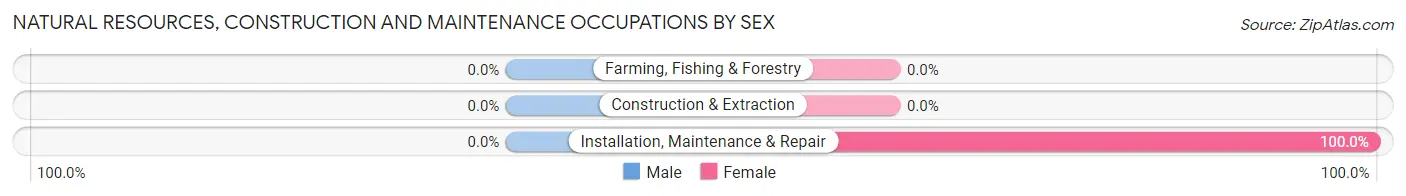
| Occupation | Male | Female |
| Farming, Fishing & Forestry | 0 (0.0%) | 0 (0.0%) |
| Construction & Extraction | 0 (0.0%) | 0 (0.0%) |
| Installation, Maintenance & Repair | 0 (0.0%) | 4 (100.0%) |
| Total (Category) | 0 (0.0%) | 4 (100.0%) |
| Total (Overall) | 0 (0.0%) | 13 (100.0%) |
Production, Transportation and Moving Occupations
Production, Transportation and Moving Occupations by Sex
| Occupation | Male | Female |
| Production | 0 (0.0%) | 0 (0.0%) |
| Transportation | 0 (0.0%) | 0 (0.0%) |
| Material Moving | 0 (0.0%) | 0 (0.0%) |
| Total (Category) | 0 (0.0%) | 0 (0.0%) |
| Total (Overall) | 0 (0.0%) | 13 (100.0%) |
Employment Industries by Sex in Bon Air
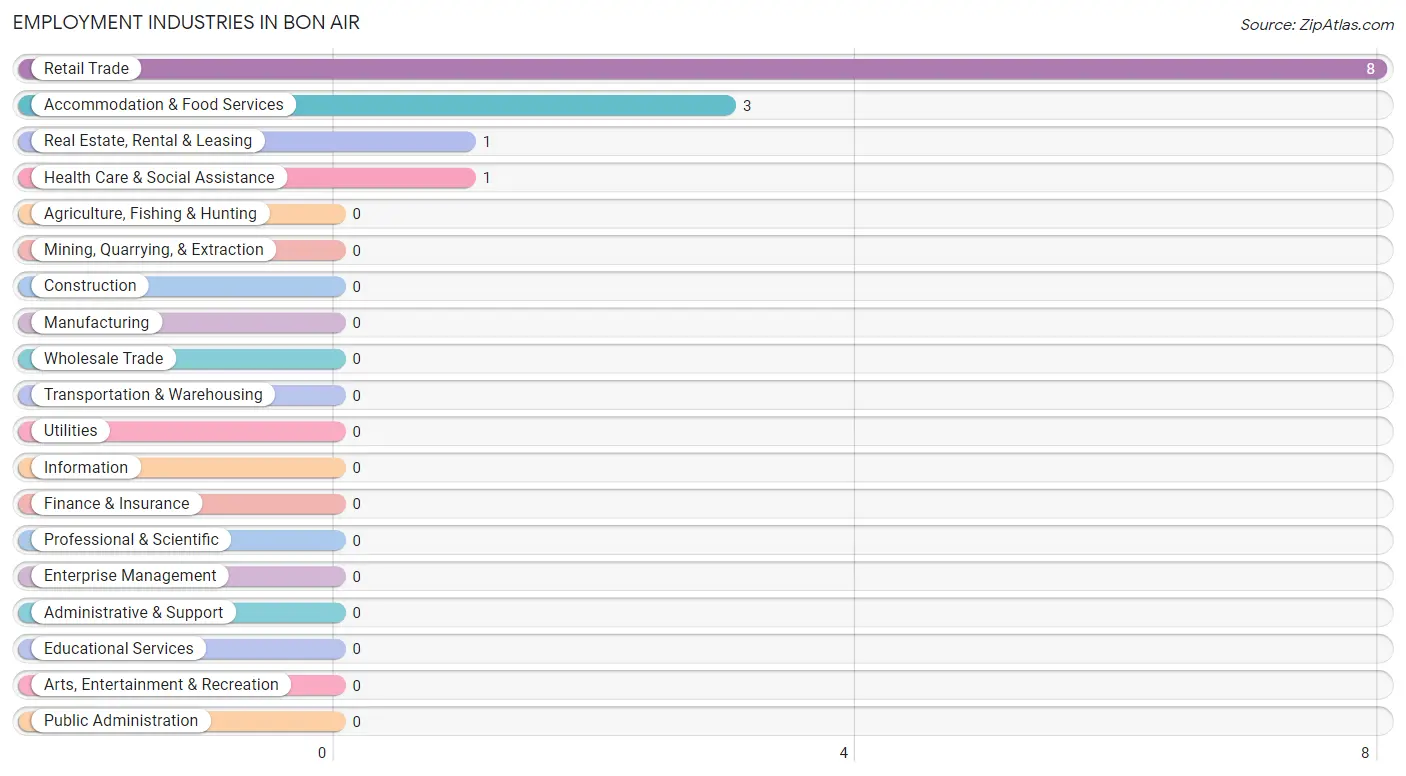
Employment Industries in Bon Air
The major employment industries in Bon Air include Retail Trade (8 | 61.5%), Accommodation & Food Services (3 | 23.1%), Real Estate, Rental & Leasing (1 | 7.7%), and Health Care & Social Assistance (1 | 7.7%).
Employment Industries by Sex in Bon Air
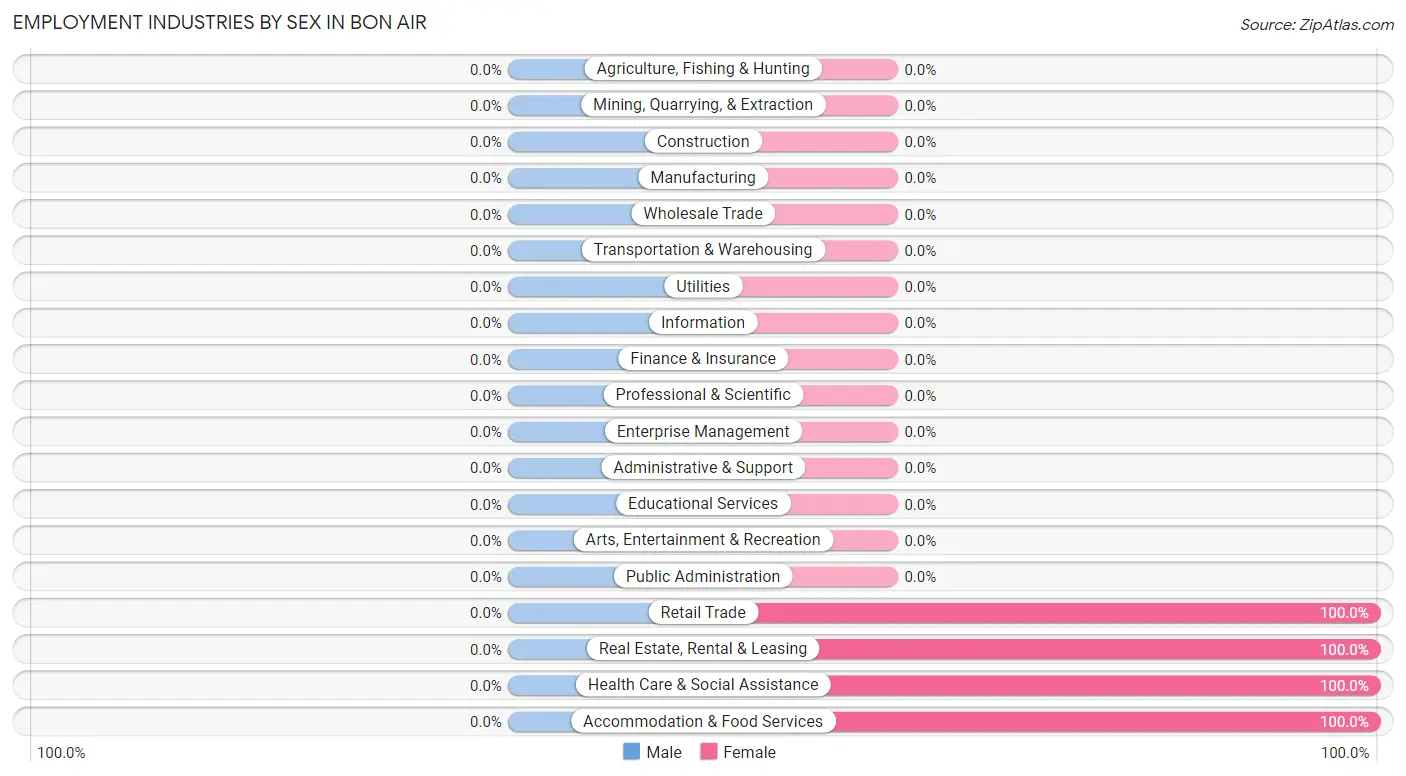
| Industry | Male | Female |
| Agriculture, Fishing & Hunting | 0 (0.0%) | 0 (0.0%) |
| Mining, Quarrying, & Extraction | 0 (0.0%) | 0 (0.0%) |
| Construction | 0 (0.0%) | 0 (0.0%) |
| Manufacturing | 0 (0.0%) | 0 (0.0%) |
| Wholesale Trade | 0 (0.0%) | 0 (0.0%) |
| Retail Trade | 0 (0.0%) | 8 (100.0%) |
| Transportation & Warehousing | 0 (0.0%) | 0 (0.0%) |
| Utilities | 0 (0.0%) | 0 (0.0%) |
| Information | 0 (0.0%) | 0 (0.0%) |
| Finance & Insurance | 0 (0.0%) | 0 (0.0%) |
| Real Estate, Rental & Leasing | 0 (0.0%) | 1 (100.0%) |
| Professional & Scientific | 0 (0.0%) | 0 (0.0%) |
| Enterprise Management | 0 (0.0%) | 0 (0.0%) |
| Administrative & Support | 0 (0.0%) | 0 (0.0%) |
| Educational Services | 0 (0.0%) | 0 (0.0%) |
| Health Care & Social Assistance | 0 (0.0%) | 1 (100.0%) |
| Arts, Entertainment & Recreation | 0 (0.0%) | 0 (0.0%) |
| Accommodation & Food Services | 0 (0.0%) | 3 (100.0%) |
| Public Administration | 0 (0.0%) | 0 (0.0%) |
| Total | 0 (0.0%) | 13 (100.0%) |
Education in Bon Air
School Enrollment in Bon Air
The most common levels of schooling among the 6 students in Bon Air are middle school (3 | 50.0%), and high school (3 | 50.0%).
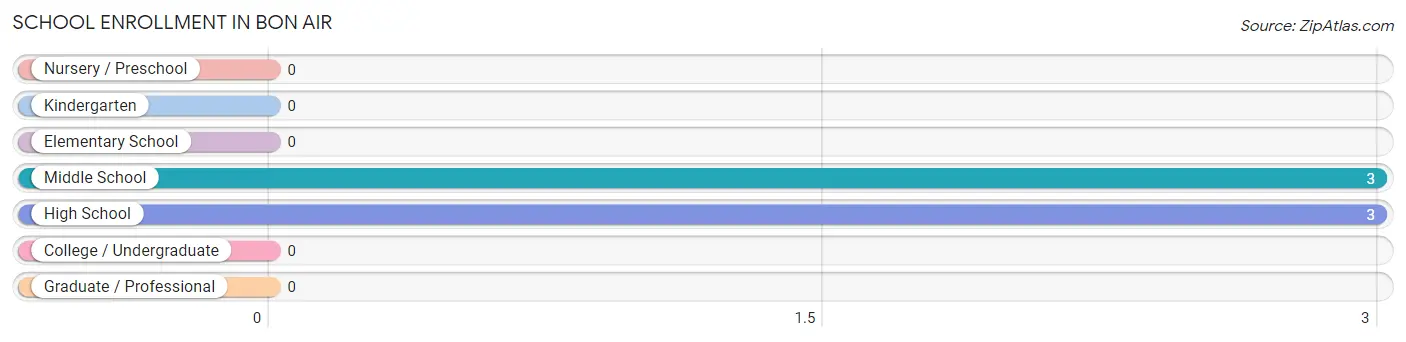
| School Level | # Students | % Students |
| Nursery / Preschool | 0 | 0.0% |
| Kindergarten | 0 | 0.0% |
| Elementary School | 0 | 0.0% |
| Middle School | 3 | 50.0% |
| High School | 3 | 50.0% |
| College / Undergraduate | 0 | 0.0% |
| Graduate / Professional | 0 | 0.0% |
| Total | 6 | 100.0% |
School Enrollment by Age by Funding Source in Bon Air
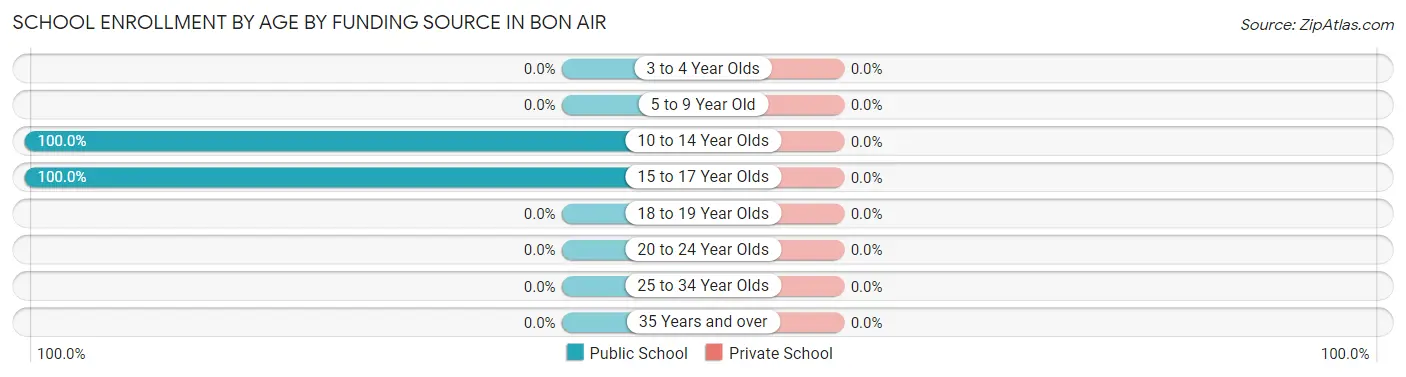
| Age Bracket | Public School | Private School |
| 3 to 4 Year Olds | 0 (0.0%) | 0 (0.0%) |
| 5 to 9 Year Old | 0 (0.0%) | 0 (0.0%) |
| 10 to 14 Year Olds | 3 (100.0%) | 0 (0.0%) |
| 15 to 17 Year Olds | 3 (100.0%) | 0 (0.0%) |
| 18 to 19 Year Olds | 0 (0.0%) | 0 (0.0%) |
| 20 to 24 Year Olds | 0 (0.0%) | 0 (0.0%) |
| 25 to 34 Year Olds | 0 (0.0%) | 0 (0.0%) |
| 35 Years and over | 0 (0.0%) | 0 (0.0%) |
| Total | 6 (100.0%) | 0 (0.0%) |
Educational Attainment by Field of Study in Bon Air
| Field of Study | # Graduates | % Graduates |
| Computers & Mathematics | 0 | 0.0% |
| Bio, Nature & Agricultural | 0 | 0.0% |
| Physical & Health Sciences | 0 | 0.0% |
| Psychology | 0 | 0.0% |
| Social Sciences | 0 | 0.0% |
| Engineering | 0 | 0.0% |
| Multidisciplinary Studies | 0 | 0.0% |
| Science & Technology | 0 | 0.0% |
| Business | 0 | 0.0% |
| Education | 0 | 0.0% |
| Literature & Languages | 0 | 0.0% |
| Liberal Arts & History | 0 | 0.0% |
| Visual & Performing Arts | 0 | 0.0% |
| Communications | 0 | 0.0% |
| Arts & Humanities | 0 | 0.0% |
| Total | 0 | 0.0% |
Transportation & Commute in Bon Air
Vehicle Availability by Sex in Bon Air
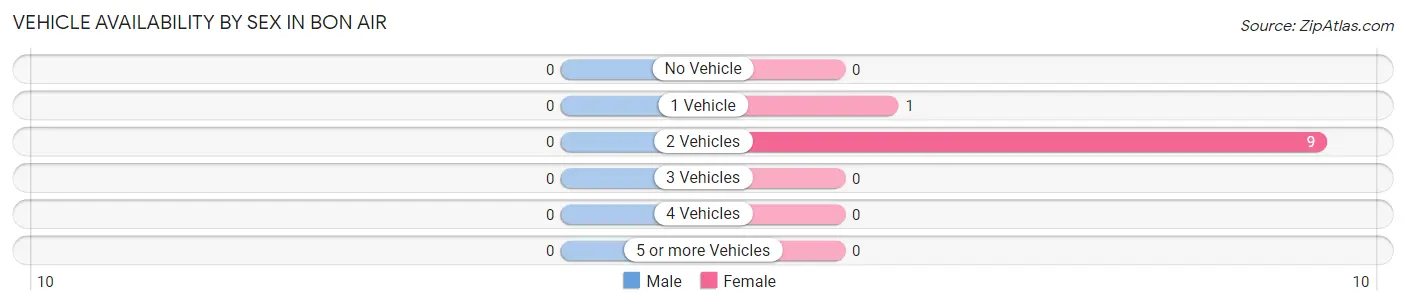
| Vehicles Available | Male | Female |
| No Vehicle | 0 (0.0%) | 0 (0.0%) |
| 1 Vehicle | 0 (0.0%) | 1 (10.0%) |
| 2 Vehicles | 0 (0.0%) | 9 (90.0%) |
| 3 Vehicles | 0 (0.0%) | 0 (0.0%) |
| 4 Vehicles | 0 (0.0%) | 0 (0.0%) |
| 5 or more Vehicles | 0 (0.0%) | 0 (0.0%) |
| Total | 0 (0.0%) | 10 (100.0%) |
Commute Time in Bon Air
The most frequently occuring commute durations in Bon Air are 60 to 89 minutes (8 commuters, 80.0%), 5 to 9 minutes (1 commuters, 10.0%), and 30 to 34 minutes (1 commuters, 10.0%).
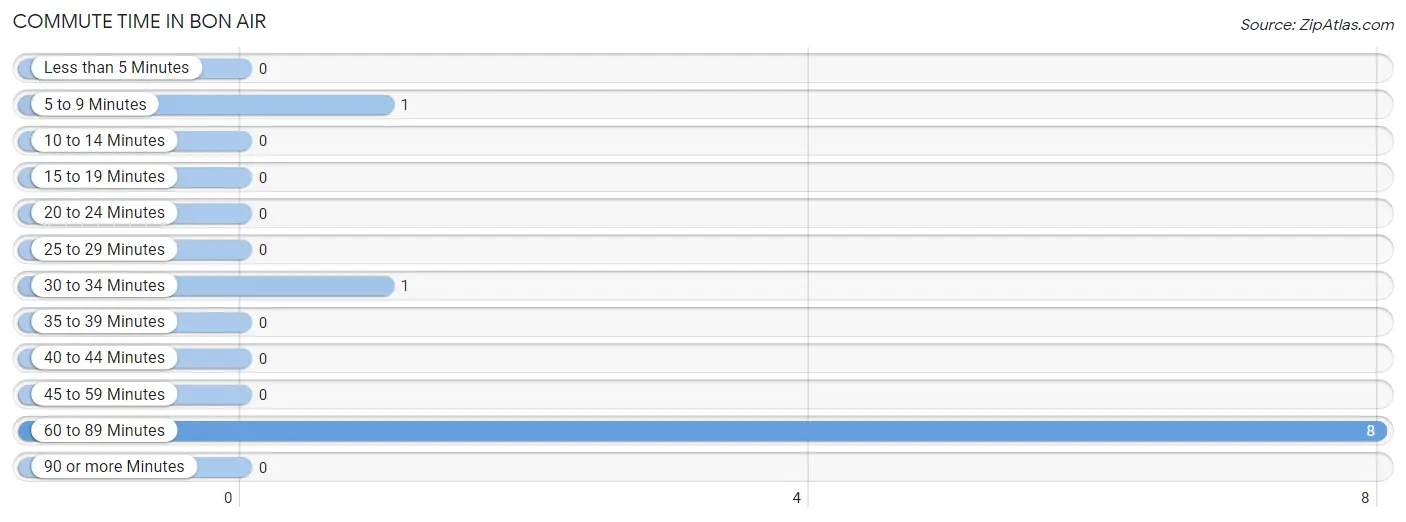
| Commute Time | # Commuters | % Commuters |
| Less than 5 Minutes | 0 | 0.0% |
| 5 to 9 Minutes | 1 | 10.0% |
| 10 to 14 Minutes | 0 | 0.0% |
| 15 to 19 Minutes | 0 | 0.0% |
| 20 to 24 Minutes | 0 | 0.0% |
| 25 to 29 Minutes | 0 | 0.0% |
| 30 to 34 Minutes | 1 | 10.0% |
| 35 to 39 Minutes | 0 | 0.0% |
| 40 to 44 Minutes | 0 | 0.0% |
| 45 to 59 Minutes | 0 | 0.0% |
| 60 to 89 Minutes | 8 | 80.0% |
| 90 or more Minutes | 0 | 0.0% |
Commute Time by Sex in Bon Air
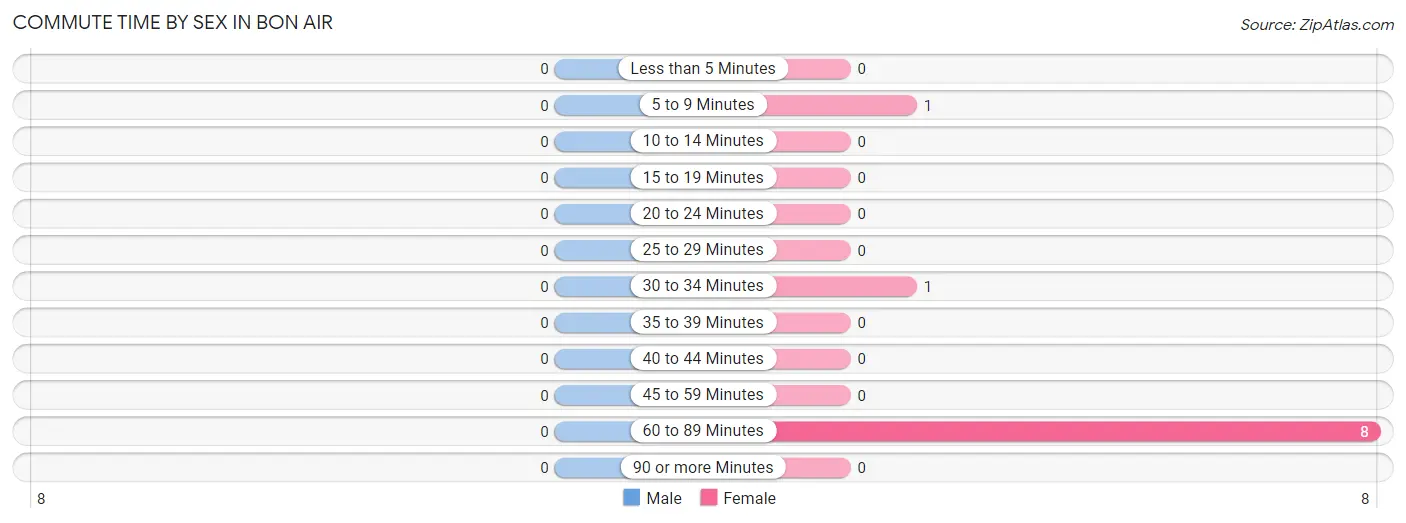
| Commute Time | Male | Female |
| Less than 5 Minutes | 0 (0.0%) | 0 (0.0%) |
| 5 to 9 Minutes | 0 (0.0%) | 1 (10.0%) |
| 10 to 14 Minutes | 0 (0.0%) | 0 (0.0%) |
| 15 to 19 Minutes | 0 (0.0%) | 0 (0.0%) |
| 20 to 24 Minutes | 0 (0.0%) | 0 (0.0%) |
| 25 to 29 Minutes | 0 (0.0%) | 0 (0.0%) |
| 30 to 34 Minutes | 0 (0.0%) | 1 (10.0%) |
| 35 to 39 Minutes | 0 (0.0%) | 0 (0.0%) |
| 40 to 44 Minutes | 0 (0.0%) | 0 (0.0%) |
| 45 to 59 Minutes | 0 (0.0%) | 0 (0.0%) |
| 60 to 89 Minutes | 0 (0.0%) | 8 (80.0%) |
| 90 or more Minutes | 0 (0.0%) | 0 (0.0%) |
Time of Departure to Work by Sex in Bon Air
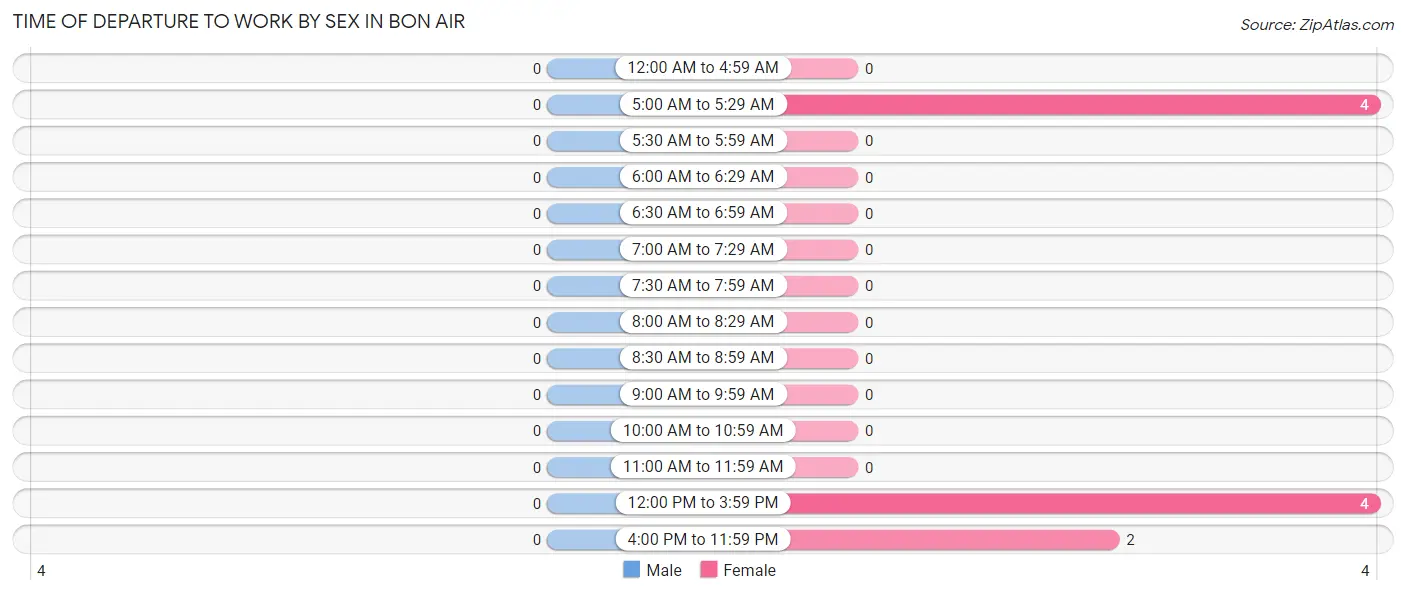
| Time of Departure | Male | Female |
| 12:00 AM to 4:59 AM | 0 (0.0%) | 0 (0.0%) |
| 5:00 AM to 5:29 AM | 0 (0.0%) | 4 (40.0%) |
| 5:30 AM to 5:59 AM | 0 (0.0%) | 0 (0.0%) |
| 6:00 AM to 6:29 AM | 0 (0.0%) | 0 (0.0%) |
| 6:30 AM to 6:59 AM | 0 (0.0%) | 0 (0.0%) |
| 7:00 AM to 7:29 AM | 0 (0.0%) | 0 (0.0%) |
| 7:30 AM to 7:59 AM | 0 (0.0%) | 0 (0.0%) |
| 8:00 AM to 8:29 AM | 0 (0.0%) | 0 (0.0%) |
| 8:30 AM to 8:59 AM | 0 (0.0%) | 0 (0.0%) |
| 9:00 AM to 9:59 AM | 0 (0.0%) | 0 (0.0%) |
| 10:00 AM to 10:59 AM | 0 (0.0%) | 0 (0.0%) |
| 11:00 AM to 11:59 AM | 0 (0.0%) | 0 (0.0%) |
| 12:00 PM to 3:59 PM | 0 (0.0%) | 4 (40.0%) |
| 4:00 PM to 11:59 PM | 0 (0.0%) | 2 (20.0%) |
| Total | 0 (0.0%) | 10 (100.0%) |
Housing Occupancy in Bon Air
Occupancy by Ownership in Bon Air
Of the total 33 dwellings in Bon Air, owner-occupied units account for 24 (72.7%), while renter-occupied units make up 9 (27.3%).
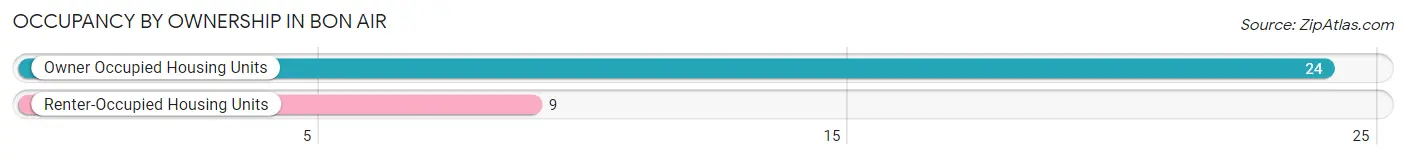
| Occupancy | # Housing Units | % Housing Units |
| Owner Occupied Housing Units | 24 | 72.7% |
| Renter-Occupied Housing Units | 9 | 27.3% |
| Total Occupied Housing Units | 33 | 100.0% |
Occupancy by Household Size in Bon Air
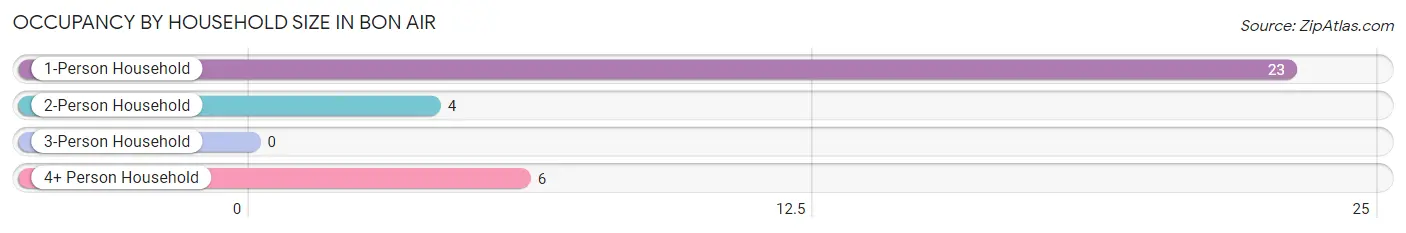
| Household Size | # Housing Units | % Housing Units |
| 1-Person Household | 23 | 69.7% |
| 2-Person Household | 4 | 12.1% |
| 3-Person Household | 0 | 0.0% |
| 4+ Person Household | 6 | 18.2% |
| Total Housing Units | 33 | 100.0% |
Occupancy by Ownership by Household Size in Bon Air
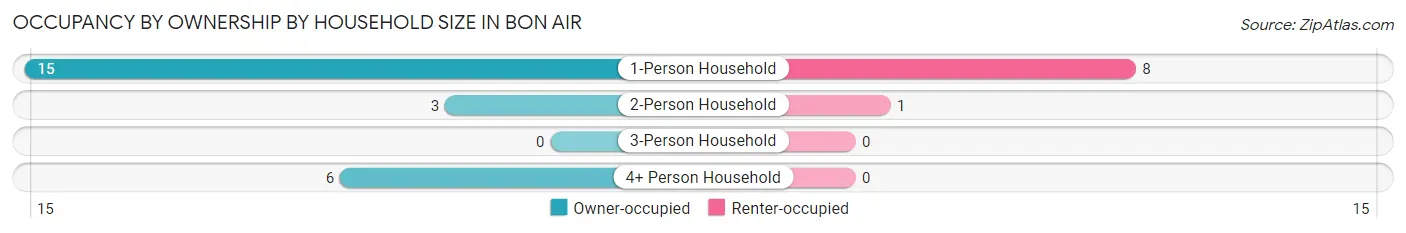
| Household Size | Owner-occupied | Renter-occupied |
| 1-Person Household | 15 (65.2%) | 8 (34.8%) |
| 2-Person Household | 3 (75.0%) | 1 (25.0%) |
| 3-Person Household | 0 (0.0%) | 0 (0.0%) |
| 4+ Person Household | 6 (100.0%) | 0 (0.0%) |
| Total Housing Units | 24 (72.7%) | 9 (27.3%) |
Occupancy by Educational Attainment in Bon Air
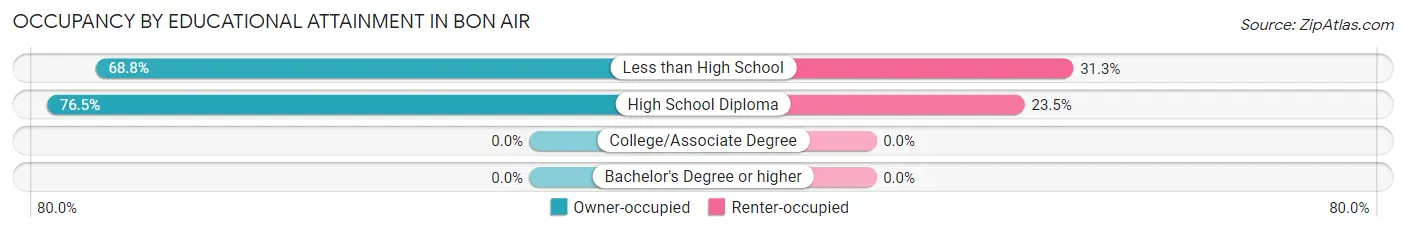
| Household Size | Owner-occupied | Renter-occupied |
| Less than High School | 11 (68.8%) | 5 (31.2%) |
| High School Diploma | 13 (76.5%) | 4 (23.5%) |
| College/Associate Degree | 0 (0.0%) | 0 (0.0%) |
| Bachelor's Degree or higher | 0 (0.0%) | 0 (0.0%) |
Occupancy by Age of Householder in Bon Air
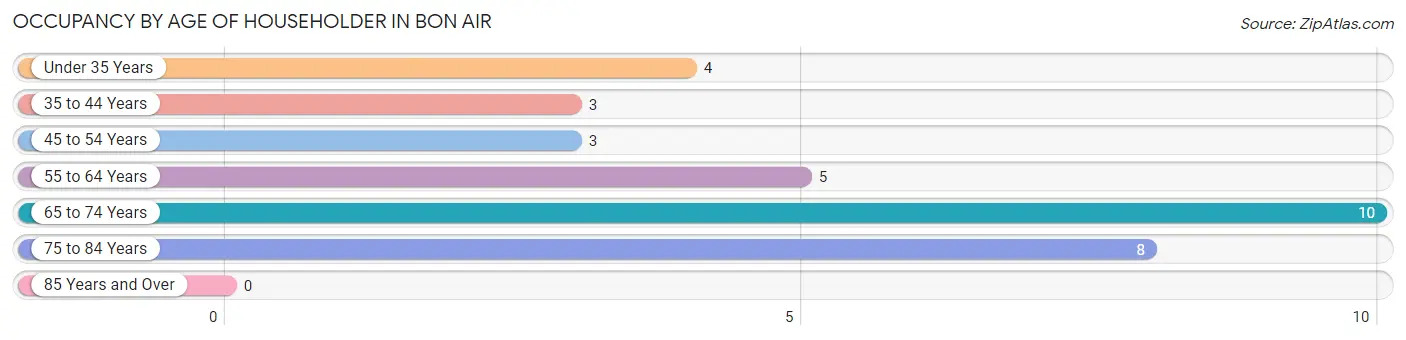
| Age Bracket | # Households | % Households |
| Under 35 Years | 4 | 12.1% |
| 35 to 44 Years | 3 | 9.1% |
| 45 to 54 Years | 3 | 9.1% |
| 55 to 64 Years | 5 | 15.1% |
| 65 to 74 Years | 10 | 30.3% |
| 75 to 84 Years | 8 | 24.2% |
| 85 Years and Over | 0 | 0.0% |
| Total | 33 | 100.0% |
Housing Finances in Bon Air
Median Income by Occupancy in Bon Air
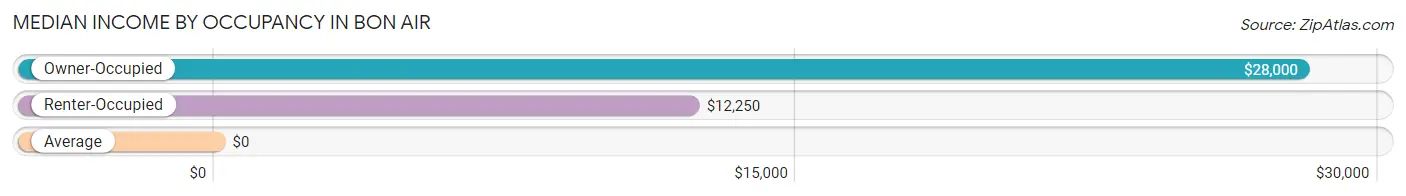
| Occupancy Type | # Households | Median Income |
| Owner-Occupied | 24 (72.7%) | $28,000 |
| Renter-Occupied | 9 (27.3%) | $12,250 |
| Average | 33 (100.0%) | $0 |
Occupancy by Householder Income Bracket in Bon Air
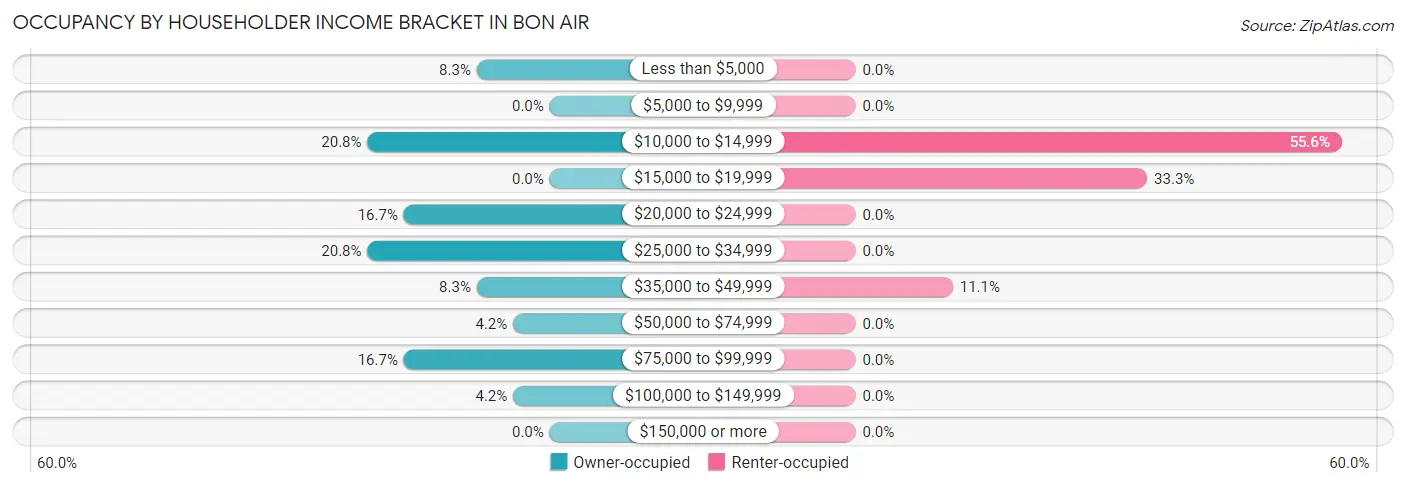
| Income Bracket | Owner-occupied | Renter-occupied |
| Less than $5,000 | 2 (8.3%) | 0 (0.0%) |
| $5,000 to $9,999 | 0 (0.0%) | 0 (0.0%) |
| $10,000 to $14,999 | 5 (20.8%) | 5 (55.6%) |
| $15,000 to $19,999 | 0 (0.0%) | 3 (33.3%) |
| $20,000 to $24,999 | 4 (16.7%) | 0 (0.0%) |
| $25,000 to $34,999 | 5 (20.8%) | 0 (0.0%) |
| $35,000 to $49,999 | 2 (8.3%) | 1 (11.1%) |
| $50,000 to $74,999 | 1 (4.2%) | 0 (0.0%) |
| $75,000 to $99,999 | 4 (16.7%) | 0 (0.0%) |
| $100,000 to $149,999 | 1 (4.2%) | 0 (0.0%) |
| $150,000 or more | 0 (0.0%) | 0 (0.0%) |
| Total | 24 (100.0%) | 9 (100.0%) |
Monthly Housing Cost Tiers in Bon Air
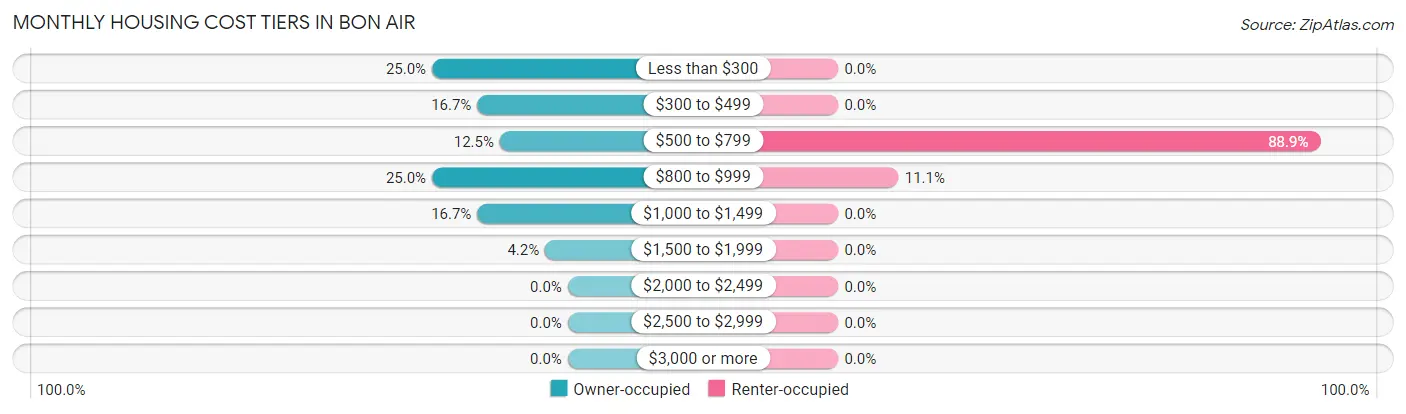
| Monthly Cost | Owner-occupied | Renter-occupied |
| Less than $300 | 6 (25.0%) | 0 (0.0%) |
| $300 to $499 | 4 (16.7%) | 0 (0.0%) |
| $500 to $799 | 3 (12.5%) | 8 (88.9%) |
| $800 to $999 | 6 (25.0%) | 1 (11.1%) |
| $1,000 to $1,499 | 4 (16.7%) | 0 (0.0%) |
| $1,500 to $1,999 | 1 (4.2%) | 0 (0.0%) |
| $2,000 to $2,499 | 0 (0.0%) | 0 (0.0%) |
| $2,500 to $2,999 | 0 (0.0%) | 0 (0.0%) |
| $3,000 or more | 0 (0.0%) | 0 (0.0%) |
| Total | 24 (100.0%) | 9 (100.0%) |
Physical Housing Characteristics in Bon Air
Housing Structures in Bon Air
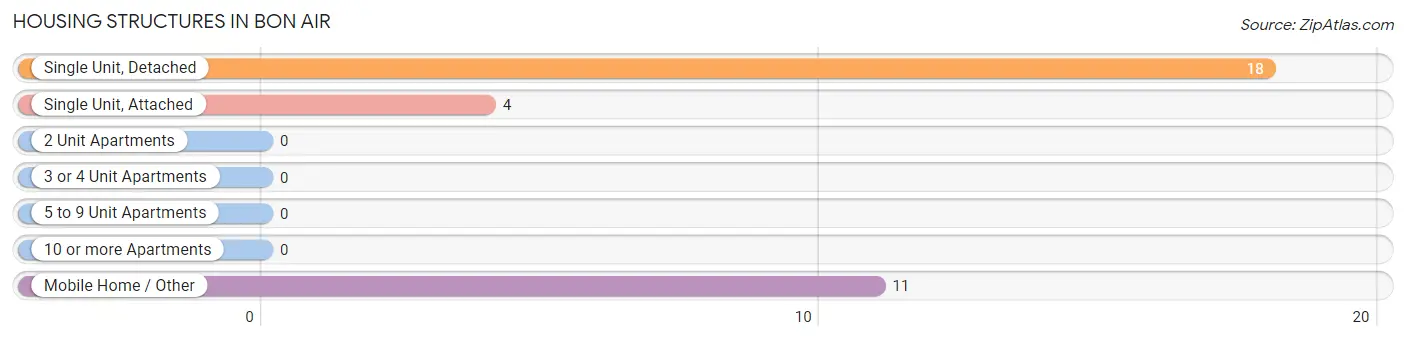
| Structure Type | # Housing Units | % Housing Units |
| Single Unit, Detached | 18 | 54.5% |
| Single Unit, Attached | 4 | 12.1% |
| 2 Unit Apartments | 0 | 0.0% |
| 3 or 4 Unit Apartments | 0 | 0.0% |
| 5 to 9 Unit Apartments | 0 | 0.0% |
| 10 or more Apartments | 0 | 0.0% |
| Mobile Home / Other | 11 | 33.3% |
| Total | 33 | 100.0% |
Housing Structures by Occupancy in Bon Air
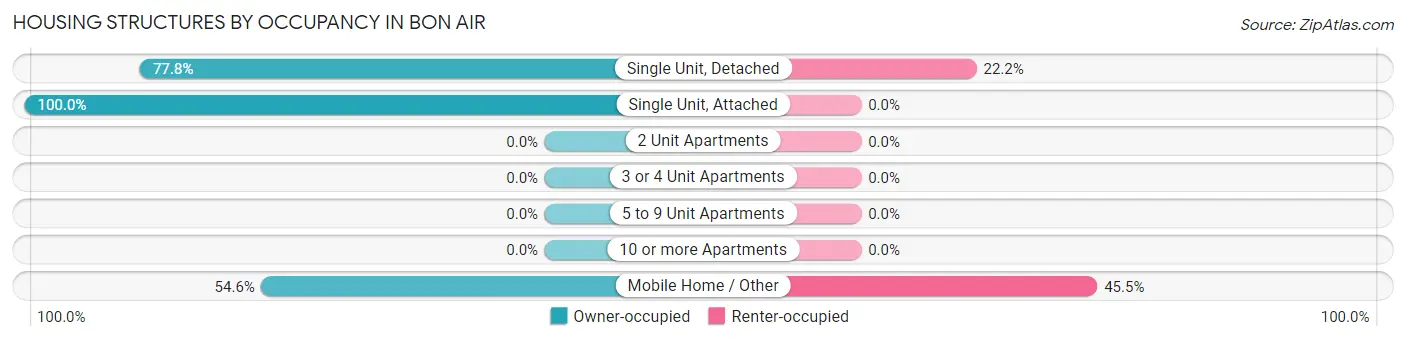
| Structure Type | Owner-occupied | Renter-occupied |
| Single Unit, Detached | 14 (77.8%) | 4 (22.2%) |
| Single Unit, Attached | 4 (100.0%) | 0 (0.0%) |
| 2 Unit Apartments | 0 (0.0%) | 0 (0.0%) |
| 3 or 4 Unit Apartments | 0 (0.0%) | 0 (0.0%) |
| 5 to 9 Unit Apartments | 0 (0.0%) | 0 (0.0%) |
| 10 or more Apartments | 0 (0.0%) | 0 (0.0%) |
| Mobile Home / Other | 6 (54.5%) | 5 (45.5%) |
| Total | 24 (72.7%) | 9 (27.3%) |
Housing Structures by Number of Rooms in Bon Air
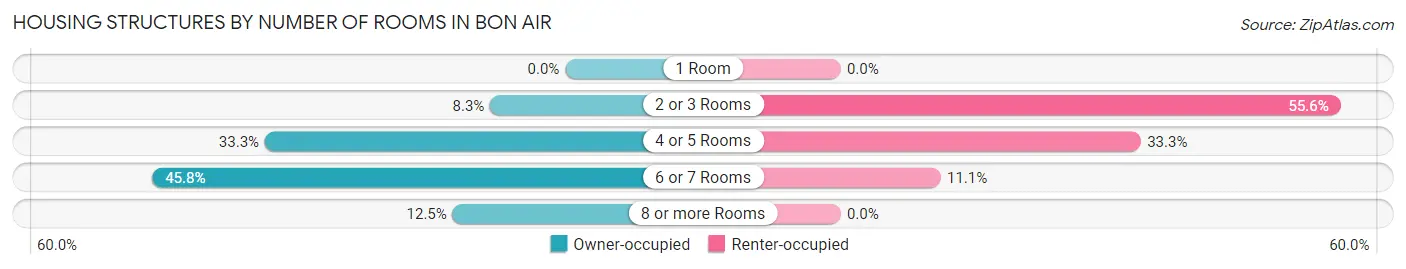
| Number of Rooms | Owner-occupied | Renter-occupied |
| 1 Room | 0 (0.0%) | 0 (0.0%) |
| 2 or 3 Rooms | 2 (8.3%) | 5 (55.6%) |
| 4 or 5 Rooms | 8 (33.3%) | 3 (33.3%) |
| 6 or 7 Rooms | 11 (45.8%) | 1 (11.1%) |
| 8 or more Rooms | 3 (12.5%) | 0 (0.0%) |
| Total | 24 (100.0%) | 9 (100.0%) |
Housing Structure by Heating Type in Bon Air
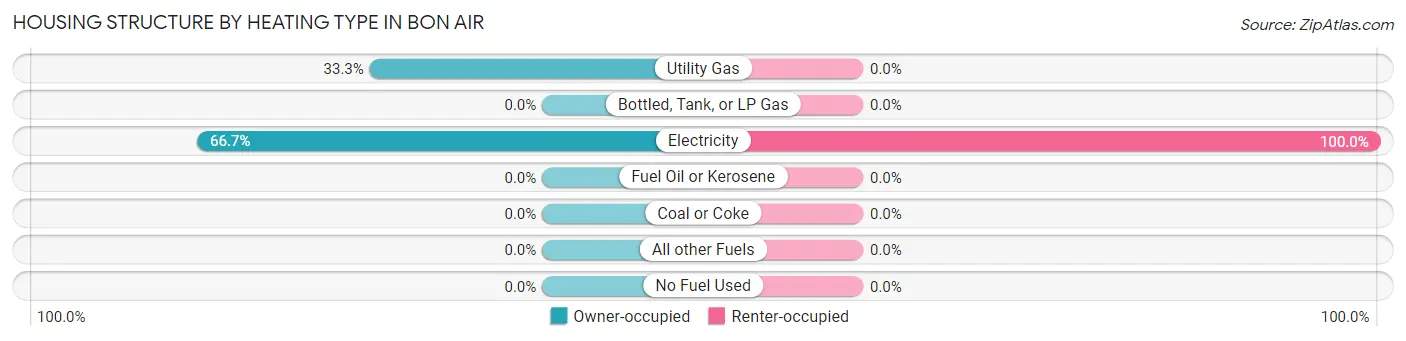
| Heating Type | Owner-occupied | Renter-occupied |
| Utility Gas | 8 (33.3%) | 0 (0.0%) |
| Bottled, Tank, or LP Gas | 0 (0.0%) | 0 (0.0%) |
| Electricity | 16 (66.7%) | 9 (100.0%) |
| Fuel Oil or Kerosene | 0 (0.0%) | 0 (0.0%) |
| Coal or Coke | 0 (0.0%) | 0 (0.0%) |
| All other Fuels | 0 (0.0%) | 0 (0.0%) |
| No Fuel Used | 0 (0.0%) | 0 (0.0%) |
| Total | 24 (100.0%) | 9 (100.0%) |
Household Vehicle Usage in Bon Air
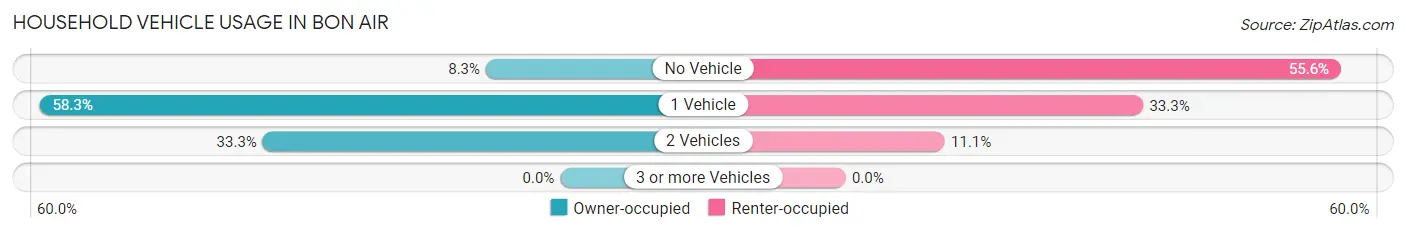
| Vehicles per Household | Owner-occupied | Renter-occupied |
| No Vehicle | 2 (8.3%) | 5 (55.6%) |
| 1 Vehicle | 14 (58.3%) | 3 (33.3%) |
| 2 Vehicles | 8 (33.3%) | 1 (11.1%) |
| 3 or more Vehicles | 0 (0.0%) | 0 (0.0%) |
| Total | 24 (100.0%) | 9 (100.0%) |
Real Estate & Mortgages in Bon Air
Real Estate and Mortgage Overview in Bon Air
| Characteristic | Without Mortgage | With Mortgage |
| Housing Units | 13 | 11 |
| Median Property Value | $74,200 | $0 |
| Median Household Income | $27,813 | $0 |
| Monthly Housing Costs | $306 | $0 |
| Real Estate Taxes | $199 | $1 |
Property Value by Mortgage Status in Bon Air
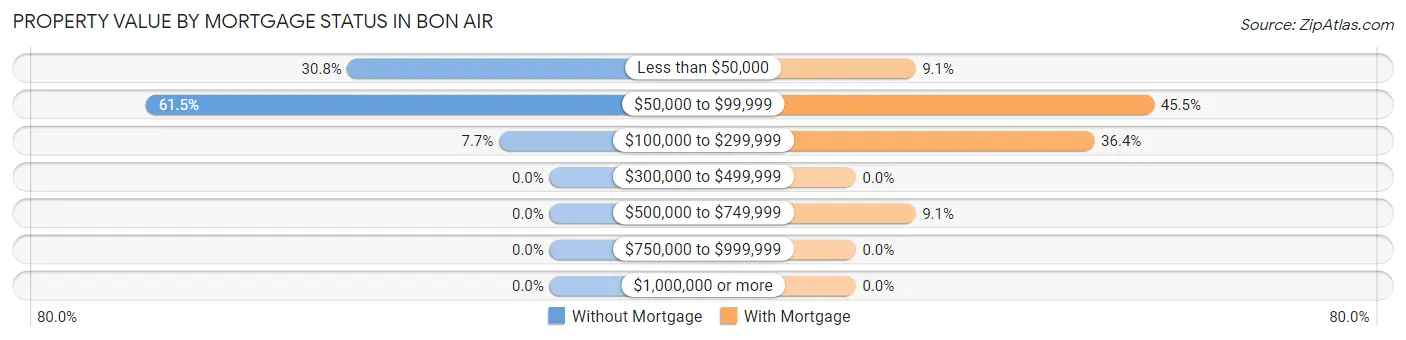
| Property Value | Without Mortgage | With Mortgage |
| Less than $50,000 | 4 (30.8%) | 1 (9.1%) |
| $50,000 to $99,999 | 8 (61.5%) | 5 (45.5%) |
| $100,000 to $299,999 | 1 (7.7%) | 4 (36.4%) |
| $300,000 to $499,999 | 0 (0.0%) | 0 (0.0%) |
| $500,000 to $749,999 | 0 (0.0%) | 1 (9.1%) |
| $750,000 to $999,999 | 0 (0.0%) | 0 (0.0%) |
| $1,000,000 or more | 0 (0.0%) | 0 (0.0%) |
| Total | 13 (100.0%) | 11 (100.0%) |
Household Income by Mortgage Status in Bon Air
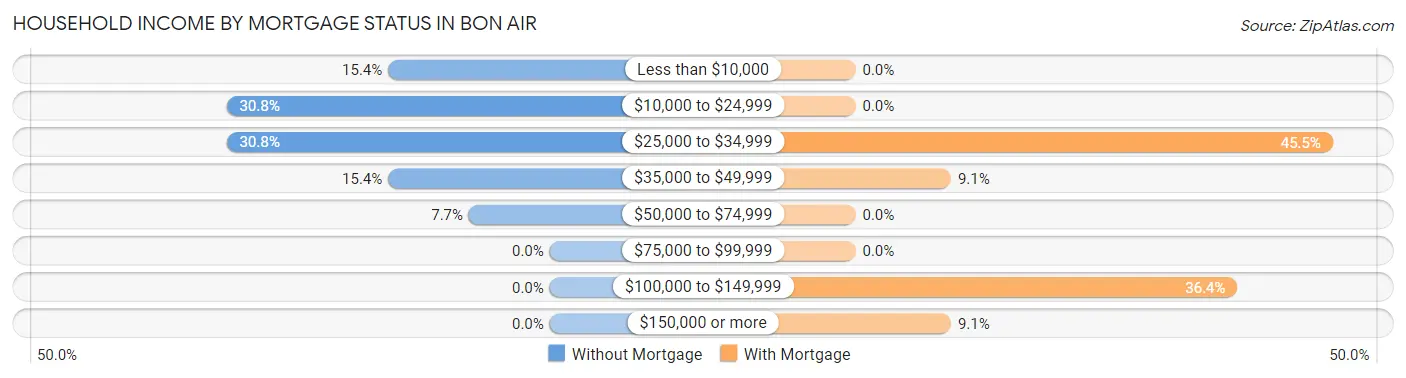
| Household Income | Without Mortgage | With Mortgage |
| Less than $10,000 | 2 (15.4%) | 0 (0.0%) |
| $10,000 to $24,999 | 4 (30.8%) | 0 (0.0%) |
| $25,000 to $34,999 | 4 (30.8%) | 5 (45.5%) |
| $35,000 to $49,999 | 2 (15.4%) | 1 (9.1%) |
| $50,000 to $74,999 | 1 (7.7%) | 0 (0.0%) |
| $75,000 to $99,999 | 0 (0.0%) | 0 (0.0%) |
| $100,000 to $149,999 | 0 (0.0%) | 4 (36.4%) |
| $150,000 or more | 0 (0.0%) | 1 (9.1%) |
| Total | 13 (100.0%) | 11 (100.0%) |
Property Value to Household Income Ratio in Bon Air
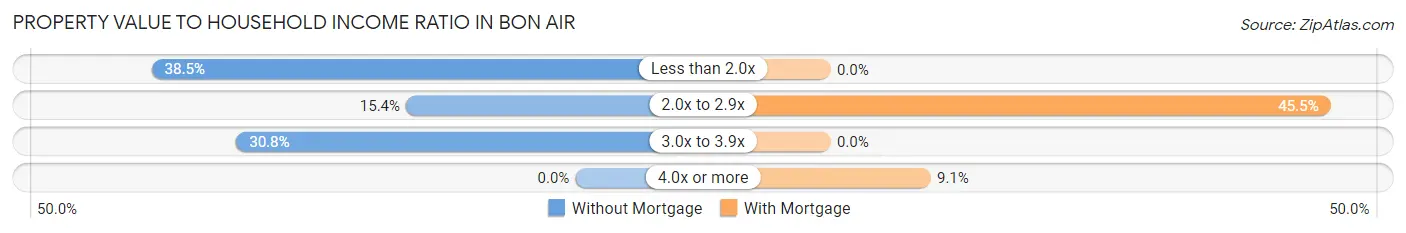
| Value-to-Income Ratio | Without Mortgage | With Mortgage |
| Less than 2.0x | 5 (38.5%) | 0 (0.0%) |
| 2.0x to 2.9x | 2 (15.4%) | 5 (45.5%) |
| 3.0x to 3.9x | 4 (30.8%) | 0 (0.0%) |
| 4.0x or more | 0 (0.0%) | 1 (9.1%) |
| Total | 13 (100.0%) | 11 (100.0%) |
Real Estate Taxes by Mortgage Status in Bon Air
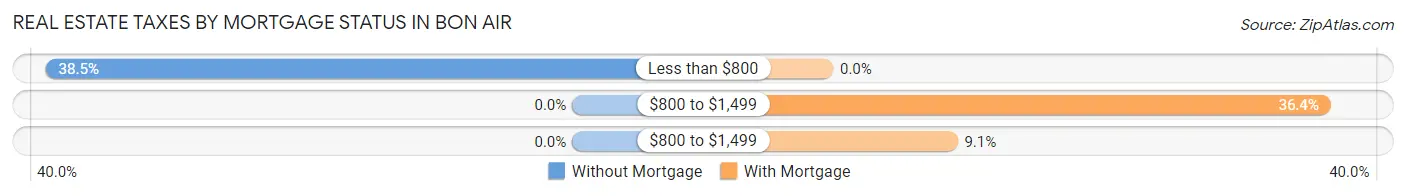
| Property Taxes | Without Mortgage | With Mortgage |
| Less than $800 | 5 (38.5%) | 0 (0.0%) |
| $800 to $1,499 | 0 (0.0%) | 4 (36.4%) |
| $800 to $1,499 | 0 (0.0%) | 1 (9.1%) |
| Total | 13 (100.0%) | 11 (100.0%) |
Health & Disability in Bon Air
Health Insurance Coverage by Age in Bon Air
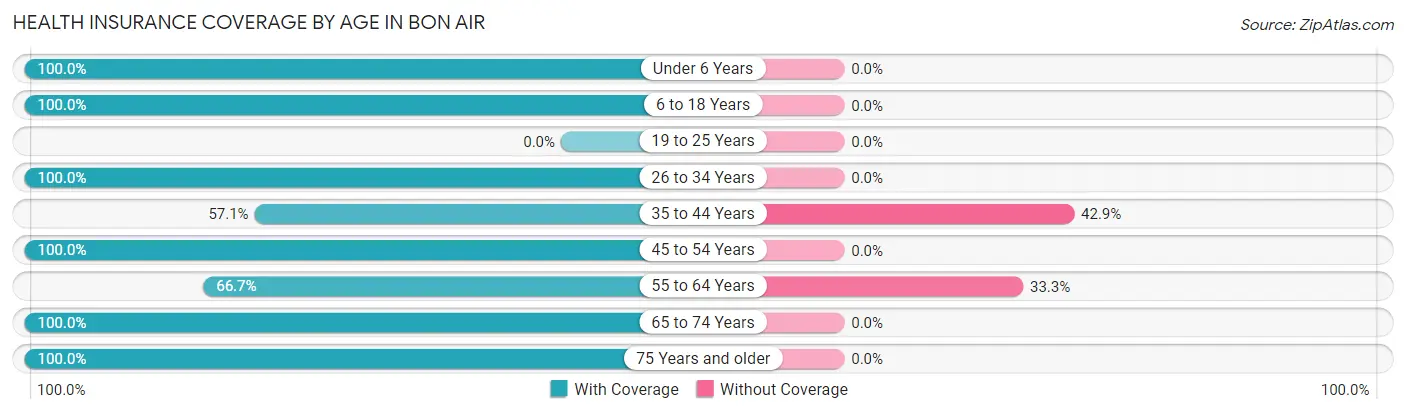
| Age Bracket | With Coverage | Without Coverage |
| Under 6 Years | 4 (100.0%) | 0 (0.0%) |
| 6 to 18 Years | 9 (100.0%) | 0 (0.0%) |
| 19 to 25 Years | 0 (0.0%) | 0 (0.0%) |
| 26 to 34 Years | 8 (100.0%) | 0 (0.0%) |
| 35 to 44 Years | 4 (57.1%) | 3 (42.9%) |
| 45 to 54 Years | 5 (100.0%) | 0 (0.0%) |
| 55 to 64 Years | 4 (66.7%) | 2 (33.3%) |
| 65 to 74 Years | 10 (100.0%) | 0 (0.0%) |
| 75 Years and older | 9 (100.0%) | 0 (0.0%) |
| Total | 53 (91.4%) | 5 (8.6%) |
Health Insurance Coverage by Citizenship Status in Bon Air
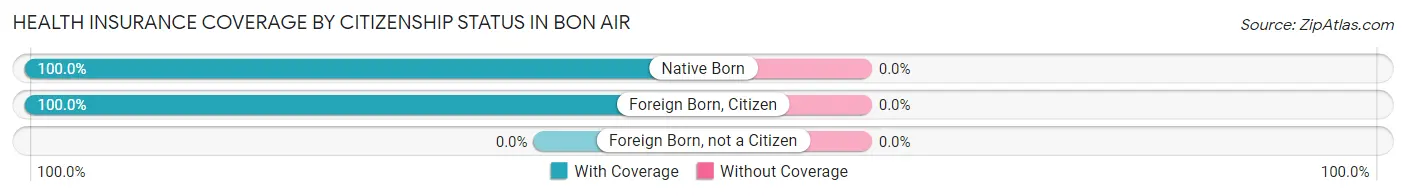
| Citizenship Status | With Coverage | Without Coverage |
| Native Born | 4 (100.0%) | 0 (0.0%) |
| Foreign Born, Citizen | 9 (100.0%) | 0 (0.0%) |
| Foreign Born, not a Citizen | 0 (0.0%) | 0 (0.0%) |
Health Insurance Coverage by Household Income in Bon Air
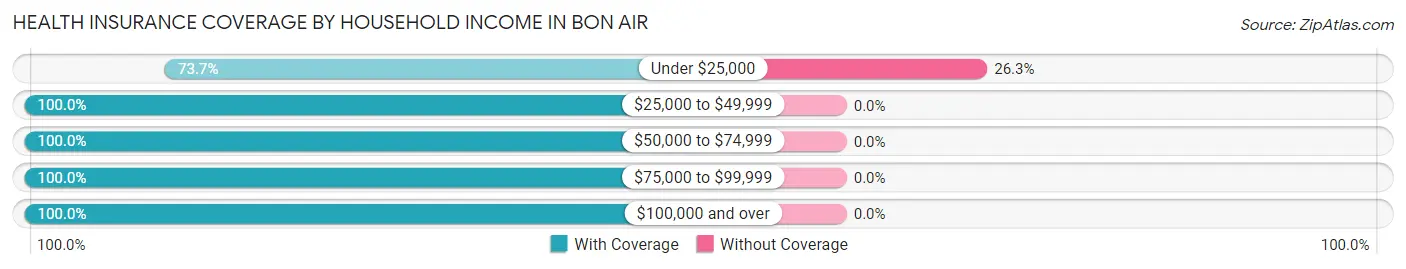
| Household Income | With Coverage | Without Coverage |
| Under $25,000 | 14 (73.7%) | 5 (26.3%) |
| $25,000 to $49,999 | 22 (100.0%) | 0 (0.0%) |
| $50,000 to $74,999 | 1 (100.0%) | 0 (0.0%) |
| $75,000 to $99,999 | 14 (100.0%) | 0 (0.0%) |
| $100,000 and over | 2 (100.0%) | 0 (0.0%) |
Public vs Private Health Insurance Coverage by Age in Bon Air
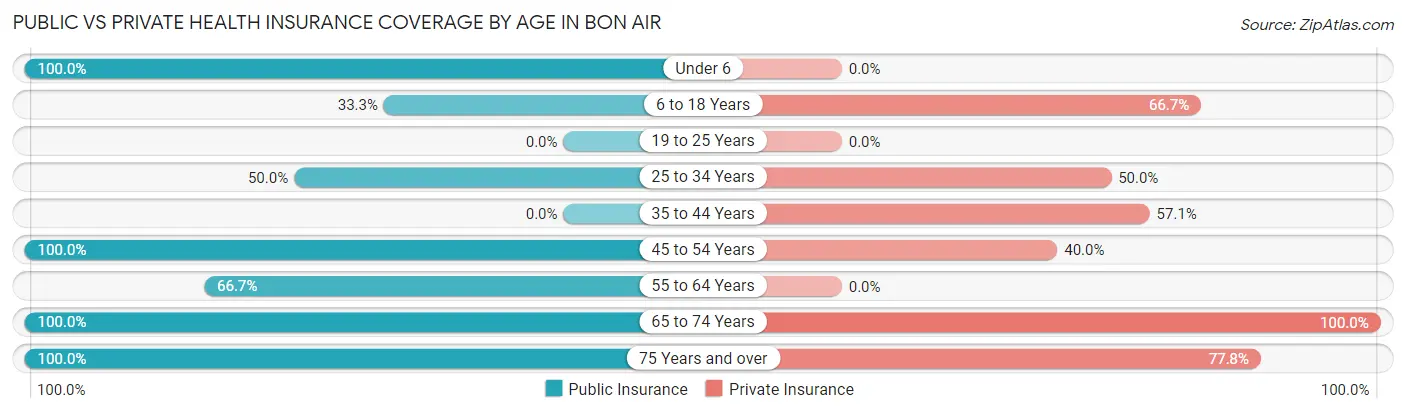
| Age Bracket | Public Insurance | Private Insurance |
| Under 6 | 4 (100.0%) | 0 (0.0%) |
| 6 to 18 Years | 3 (33.3%) | 6 (66.7%) |
| 19 to 25 Years | 0 (0.0%) | 0 (0.0%) |
| 25 to 34 Years | 4 (50.0%) | 4 (50.0%) |
| 35 to 44 Years | 0 (0.0%) | 4 (57.1%) |
| 45 to 54 Years | 5 (100.0%) | 2 (40.0%) |
| 55 to 64 Years | 4 (66.7%) | 0 (0.0%) |
| 65 to 74 Years | 10 (100.0%) | 10 (100.0%) |
| 75 Years and over | 9 (100.0%) | 7 (77.8%) |
| Total | 39 (67.2%) | 33 (56.9%) |
Disability Status by Sex by Age in Bon Air
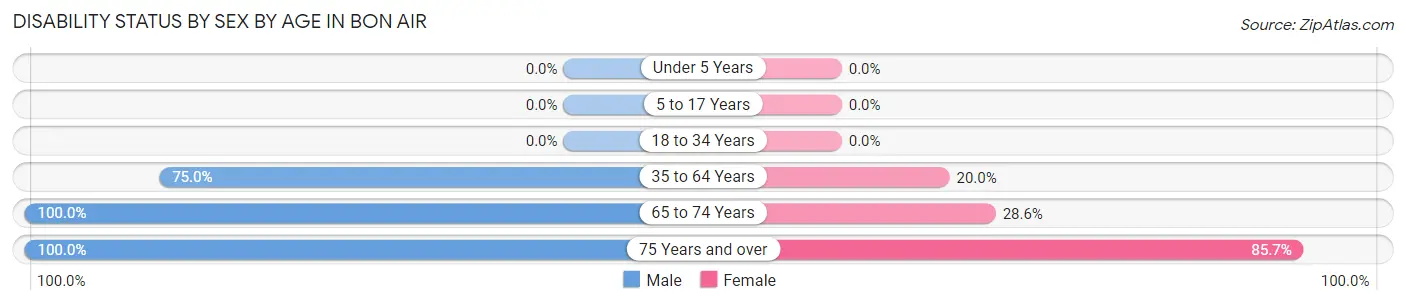
| Age Bracket | Male | Female |
| Under 5 Years | 0 (0.0%) | 0 (0.0%) |
| 5 to 17 Years | 0 (0.0%) | 0 (0.0%) |
| 18 to 34 Years | 0 (0.0%) | 0 (0.0%) |
| 35 to 64 Years | 6 (75.0%) | 2 (20.0%) |
| 65 to 74 Years | 3 (100.0%) | 2 (28.6%) |
| 75 Years and over | 2 (100.0%) | 6 (85.7%) |
Disability Class by Sex by Age in Bon Air
Disability Class: Hearing Difficulty
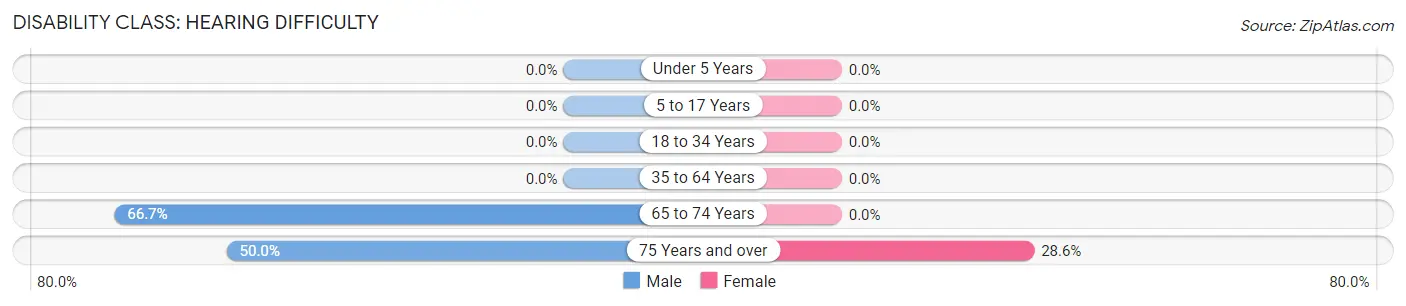
| Age Bracket | Male | Female |
| Under 5 Years | 0 (0.0%) | 0 (0.0%) |
| 5 to 17 Years | 0 (0.0%) | 0 (0.0%) |
| 18 to 34 Years | 0 (0.0%) | 0 (0.0%) |
| 35 to 64 Years | 0 (0.0%) | 0 (0.0%) |
| 65 to 74 Years | 2 (66.7%) | 0 (0.0%) |
| 75 Years and over | 1 (50.0%) | 2 (28.6%) |
Disability Class: Vision Difficulty
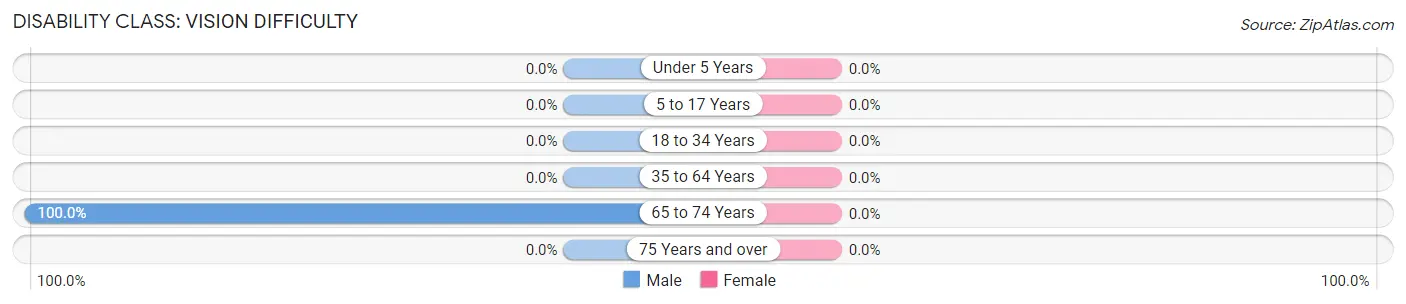
| Age Bracket | Male | Female |
| Under 5 Years | 0 (0.0%) | 0 (0.0%) |
| 5 to 17 Years | 0 (0.0%) | 0 (0.0%) |
| 18 to 34 Years | 0 (0.0%) | 0 (0.0%) |
| 35 to 64 Years | 0 (0.0%) | 0 (0.0%) |
| 65 to 74 Years | 3 (100.0%) | 0 (0.0%) |
| 75 Years and over | 0 (0.0%) | 0 (0.0%) |
Disability Class: Cognitive Difficulty
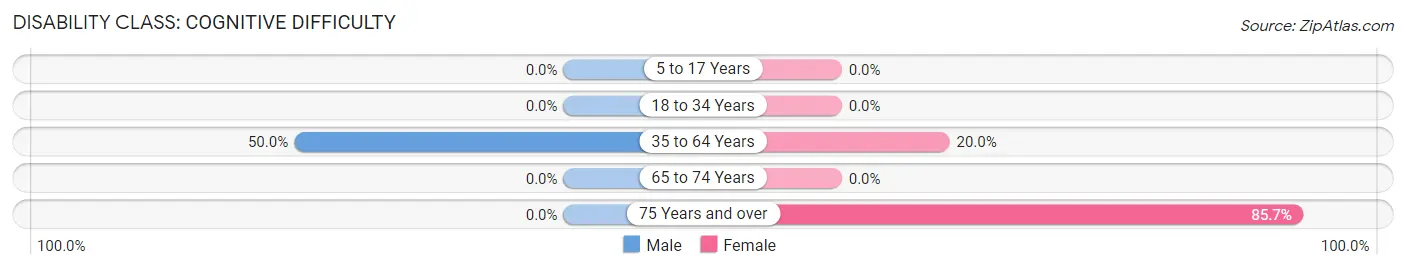
| Age Bracket | Male | Female |
| 5 to 17 Years | 0 (0.0%) | 0 (0.0%) |
| 18 to 34 Years | 0 (0.0%) | 0 (0.0%) |
| 35 to 64 Years | 4 (50.0%) | 2 (20.0%) |
| 65 to 74 Years | 0 (0.0%) | 0 (0.0%) |
| 75 Years and over | 0 (0.0%) | 6 (85.7%) |
Disability Class: Ambulatory Difficulty
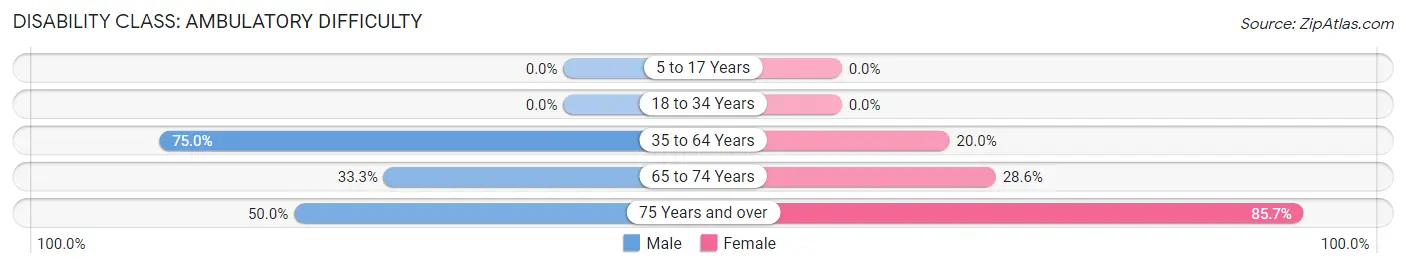
| Age Bracket | Male | Female |
| 5 to 17 Years | 0 (0.0%) | 0 (0.0%) |
| 18 to 34 Years | 0 (0.0%) | 0 (0.0%) |
| 35 to 64 Years | 6 (75.0%) | 2 (20.0%) |
| 65 to 74 Years | 1 (33.3%) | 2 (28.6%) |
| 75 Years and over | 1 (50.0%) | 6 (85.7%) |
Disability Class: Self-Care Difficulty
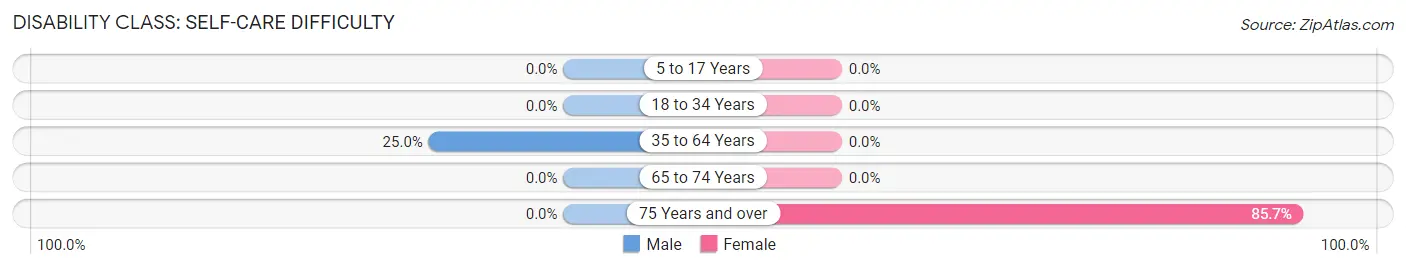
| Age Bracket | Male | Female |
| 5 to 17 Years | 0 (0.0%) | 0 (0.0%) |
| 18 to 34 Years | 0 (0.0%) | 0 (0.0%) |
| 35 to 64 Years | 2 (25.0%) | 0 (0.0%) |
| 65 to 74 Years | 0 (0.0%) | 0 (0.0%) |
| 75 Years and over | 0 (0.0%) | 6 (85.7%) |
Technology Access in Bon Air
Computing Device Access in Bon Air
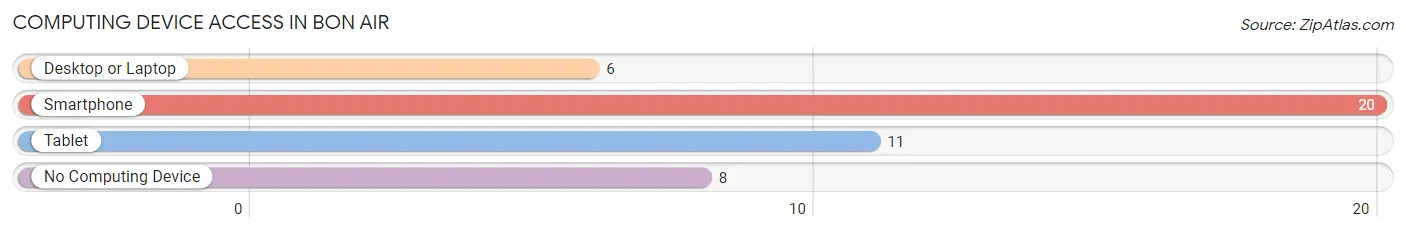
| Device Type | # Households | % Households |
| Desktop or Laptop | 6 | 18.2% |
| Smartphone | 20 | 60.6% |
| Tablet | 11 | 33.3% |
| No Computing Device | 8 | 24.2% |
| Total | 33 | 100.0% |
Internet Access in Bon Air
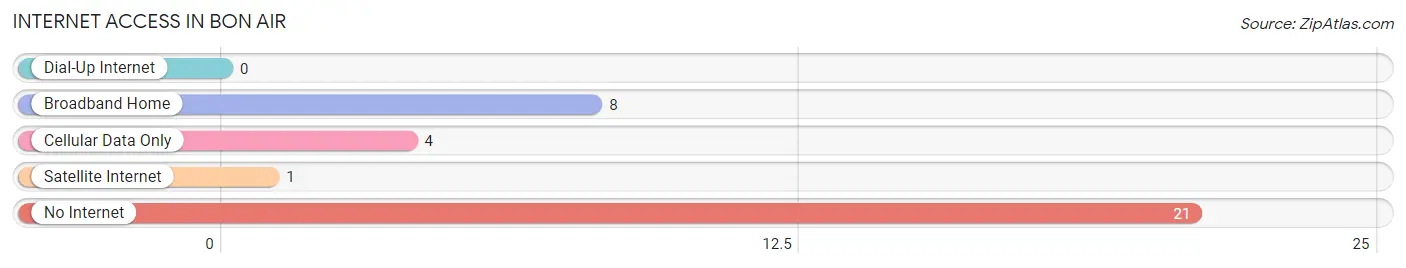
| Internet Type | # Households | % Households |
| Dial-Up Internet | 0 | 0.0% |
| Broadband Home | 8 | 24.2% |
| Cellular Data Only | 4 | 12.1% |
| Satellite Internet | 1 | 3.0% |
| No Internet | 21 | 63.6% |
| Total | 33 | 100.0% |
Bon Air Summary
History
The town of Bon Air, Alabama is located in the northwest corner of the state, in the foothills of the Appalachian Mountains. It was founded in 1820 by a group of settlers from North Carolina, who were looking for a place to settle and start a new life. The town was named after the French phrase “bon air”, which means “good air”. The settlers were attracted to the area because of its natural beauty and the abundance of natural resources.
The town quickly grew and prospered, becoming a center of commerce and industry. The town was home to several mills, including a cotton mill, a sawmill, and a gristmill. The town also had a blacksmith shop, a general store, and a post office.
In the late 1800s, the town was home to a thriving coal mining industry. The coal mines provided jobs for many of the town’s residents, and the town’s economy flourished.
In the early 1900s, the town was home to a thriving lumber industry. The lumber industry provided jobs for many of the town’s residents, and the town’s economy continued to grow.
In the mid-1900s, the town was home to a thriving textile industry. The textile industry provided jobs for many of the town’s residents, and the town’s economy continued to grow.
In the late 1900s, the town was home to a thriving tourism industry. The tourism industry provided jobs for many of the town’s residents, and the town’s economy continued to grow.
Today, the town of Bon Air is a thriving community with a population of approximately 1,500 people. The town is home to several businesses, including a grocery store, a hardware store, a pharmacy, and a bank. The town also has several churches, a library, and a museum.
Geography
Bon Air is located in the northwest corner of Alabama, in the foothills of the Appalachian Mountains. The town is situated on the banks of the Coosa River, which flows through the town. The town is surrounded by rolling hills and lush forests.
The town has a total area of 4.2 square miles, with a population density of approximately 350 people per square mile. The town is located at an elevation of approximately 1,000 feet above sea level.
Economy
The economy of Bon Air is largely based on tourism and agriculture. The town is home to several tourist attractions, including a historic downtown area, a museum, and a nature preserve. The town also has several farms, which produce a variety of crops, including corn, soybeans, and cotton.
The town is also home to several businesses, including a grocery store, a hardware store, a pharmacy, and a bank. The town also has several churches, a library, and a museum.
Demographics
As of the 2010 census, the population of Bon Air was 1,500 people. The racial makeup of the town was 97.3% White, 0.7% African American, 0.3% Native American, 0.3% Asian, and 1.3% from other races. The median household income was $37,500, and the median family income was $45,000.
The town has a high school, a middle school, and an elementary school. The town also has several churches, a library, and a museum. The town is served by several major highways, including Interstate 65 and US Highway 431.
Common Questions
What is Per Capita Income in Bon Air?
Per Capita income in Bon Air is $19,436.
What is the Median Family Income in Bon Air?
Median Family Income in Bon Air is $42,500.
What is Inequality or Gini Index in Bon Air?
Inequality or Gini Index in Bon Air is 0.48.
What is the Total Population of Bon Air?
Total Population of Bon Air is 58.
What is the Total Male Population of Bon Air?
Total Male Population of Bon Air is 25.
What is the Total Female Population of Bon Air?
Total Female Population of Bon Air is 33.
What is the Ratio of Males per 100 Females in Bon Air?
There are 75.76 Males per 100 Females in Bon Air.
What is the Ratio of Females per 100 Males in Bon Air?
There are 132.00 Females per 100 Males in Bon Air.
What is the Median Population Age in Bon Air?
Median Population Age in Bon Air is 52.3 Years.
What is the Average Family Size in Bon Air
Average Family Size in Bon Air is 3.5 People.
What is the Average Household Size in Bon Air
Average Household Size in Bon Air is 1.8 People.
How Large is the Labor Force in Bon Air?
There are 13 People in the Labor Forcein in Bon Air.
What is the Percentage of People in the Labor Force in Bon Air?
25.5% of People are in the Labor Force in Bon Air.