Morrison Crossroads, AL Map & Demographics
Morrison Crossroads Map
Morrison Crossroads Overview
$22,376
PER CAPITA INCOME
$83,056
AVG FAMILY INCOME
0.31
INEQUALITY / GINI INDEX
169
TOTAL POPULATION
89
MALE POPULATION
80
FEMALE POPULATION
111.25
MALES / 100 FEMALES
89.89
FEMALES / 100 MALES
53.5
MEDIAN AGE
3.2
AVG FAMILY SIZE
2.4
AVG HOUSEHOLD SIZE
95
LABOR FORCE [ PEOPLE ]
61.3%
PERCENT IN LABOR FORCE
Income in Morrison Crossroads
Income Overview in Morrison Crossroads
| Characteristic | Number | Measure |
| Per Capita Income | 169 | $22,376 |
| Median Family Income | 36 | $83,056 |
| Mean Family Income | 36 | $75,181 |
| Median Household Income | 72 | $0 |
| Mean Household Income | 72 | $49,147 |
| Income Deficit | 36 | $0 |
| Wage / Income Gap (%) | 169 | 0.00% |
| Wage / Income Gap ($) | 169 | 100.00¢ per $1 |
| Gini / Inequality Index | 169 | 0.31 |
Earnings by Sex in Morrison Crossroads
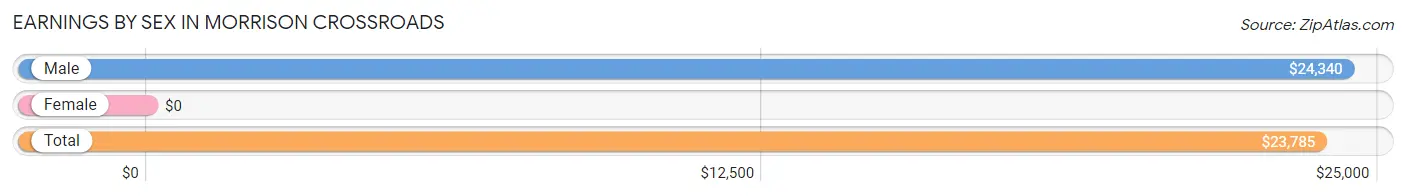
| Sex | Number | Average Earnings |
| Male | 73 (67.0%) | $24,340 |
| Female | 36 (33.0%) | $0 |
| Total | 109 (100.0%) | $23,785 |
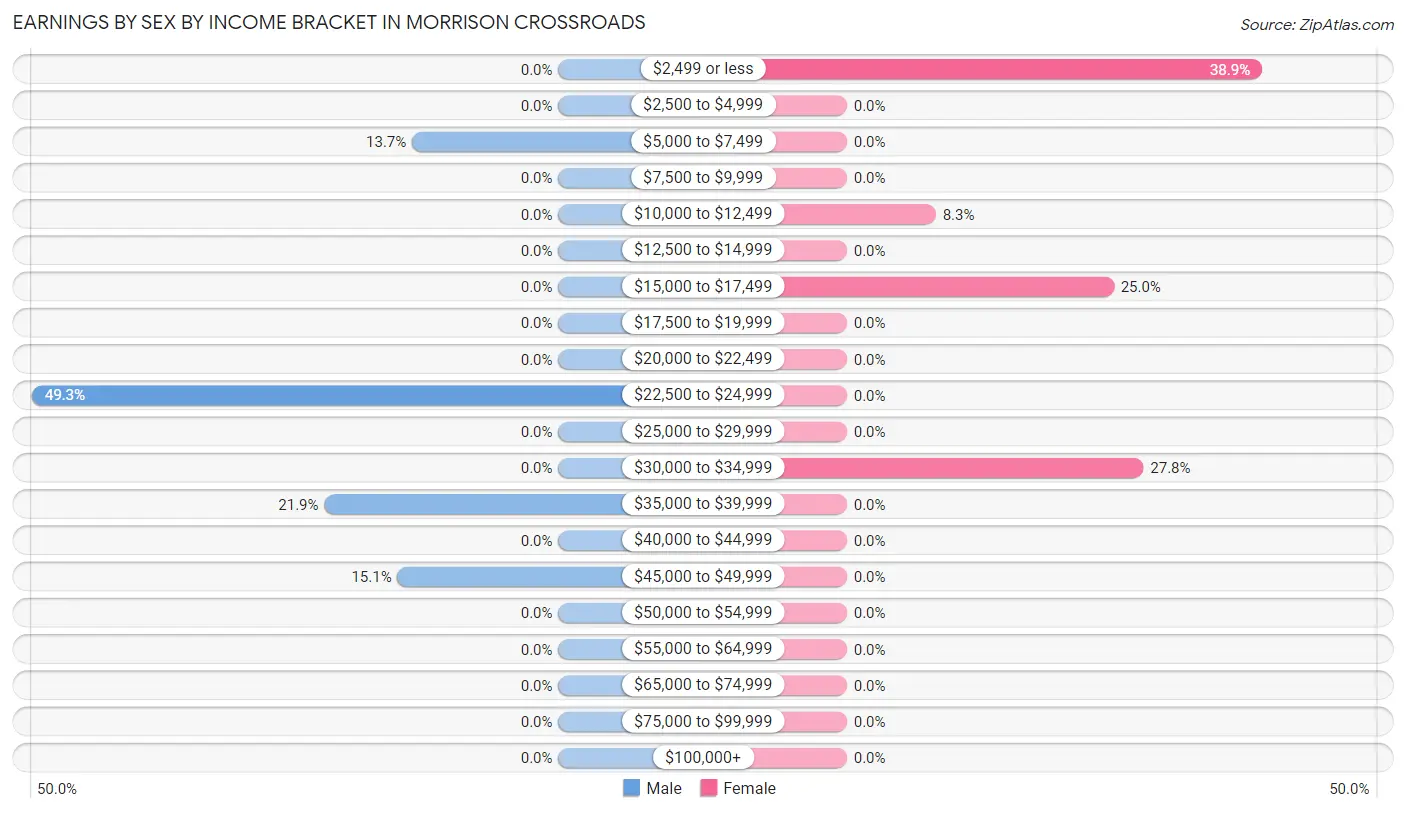
Earnings by Sex by Income Bracket in Morrison Crossroads
The most common earnings brackets in Morrison Crossroads are $22,500 to $24,999 for men (36 | 49.3%) and $2,499 or less for women (14 | 38.9%).
| Income | Male | Female |
| $2,499 or less | 0 (0.0%) | 14 (38.9%) |
| $2,500 to $4,999 | 0 (0.0%) | 0 (0.0%) |
| $5,000 to $7,499 | 10 (13.7%) | 0 (0.0%) |
| $7,500 to $9,999 | 0 (0.0%) | 0 (0.0%) |
| $10,000 to $12,499 | 0 (0.0%) | 3 (8.3%) |
| $12,500 to $14,999 | 0 (0.0%) | 0 (0.0%) |
| $15,000 to $17,499 | 0 (0.0%) | 9 (25.0%) |
| $17,500 to $19,999 | 0 (0.0%) | 0 (0.0%) |
| $20,000 to $22,499 | 0 (0.0%) | 0 (0.0%) |
| $22,500 to $24,999 | 36 (49.3%) | 0 (0.0%) |
| $25,000 to $29,999 | 0 (0.0%) | 0 (0.0%) |
| $30,000 to $34,999 | 0 (0.0%) | 10 (27.8%) |
| $35,000 to $39,999 | 16 (21.9%) | 0 (0.0%) |
| $40,000 to $44,999 | 0 (0.0%) | 0 (0.0%) |
| $45,000 to $49,999 | 11 (15.1%) | 0 (0.0%) |
| $50,000 to $54,999 | 0 (0.0%) | 0 (0.0%) |
| $55,000 to $64,999 | 0 (0.0%) | 0 (0.0%) |
| $65,000 to $74,999 | 0 (0.0%) | 0 (0.0%) |
| $75,000 to $99,999 | 0 (0.0%) | 0 (0.0%) |
| $100,000+ | 0 (0.0%) | 0 (0.0%) |
| Total | 73 (100.0%) | 36 (100.0%) |
Earnings by Sex by Educational Attainment in Morrison Crossroads
| Educational Attainment | Male Income | Female Income |
| Less than High School | - | - |
| High School Diploma | - | - |
| College or Associate's Degree | - | - |
| Bachelor's Degree | - | - |
| Graduate Degree | - | - |
| Total | $24,340 | $0 |
Family Income in Morrison Crossroads
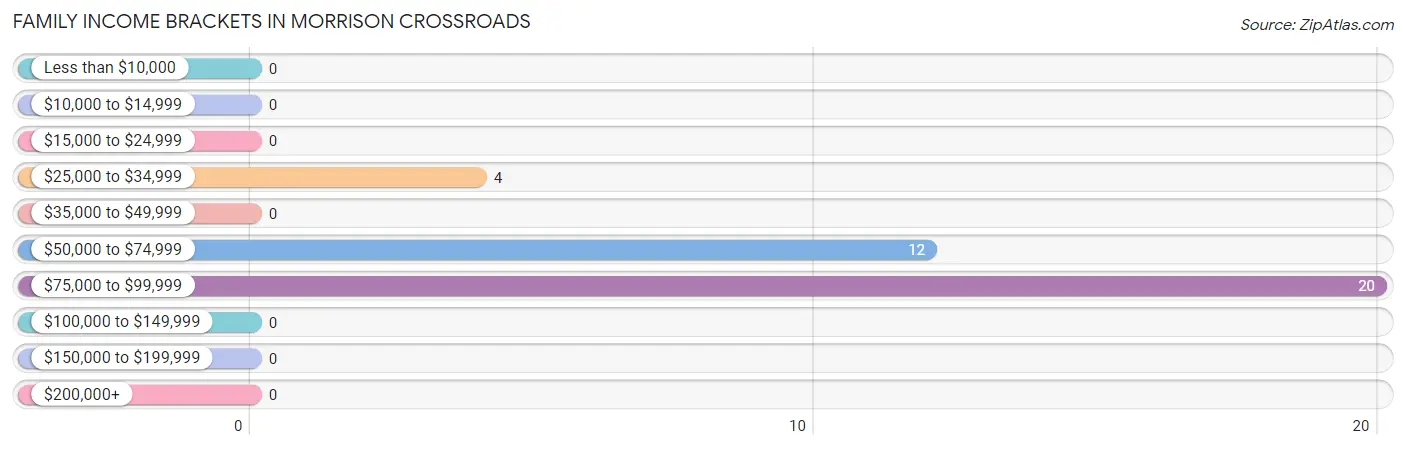
Family Income Brackets in Morrison Crossroads
According to the Morrison Crossroads family income data, there are 20 families falling into the $75,000 to $99,999 income range, which is the most common income bracket and makes up 55.6% of all families.
| Income Bracket | # Families | % Families |
| Less than $10,000 | 0 | 0.0% |
| $10,000 to $14,999 | 0 | 0.0% |
| $15,000 to $24,999 | 0 | 0.0% |
| $25,000 to $34,999 | 4 | 11.1% |
| $35,000 to $49,999 | 0 | 0.0% |
| $50,000 to $74,999 | 12 | 33.3% |
| $75,000 to $99,999 | 20 | 55.6% |
| $100,000 to $149,999 | 0 | 0.0% |
| $150,000 to $199,999 | 0 | 0.0% |
| $200,000+ | 0 | 0.0% |
Family Income by Famaliy Size in Morrison Crossroads
| Income Bracket | # Families | Median Income |
| 2-Person Families | 16 (44.4%) | $0 |
| 3-Person Families | 0 (0.0%) | $0 |
| 4-Person Families | 20 (55.6%) | $0 |
| 5-Person Families | 0 (0.0%) | $0 |
| 6-Person Families | 0 (0.0%) | $0 |
| 7+ Person Families | 0 (0.0%) | $0 |
| Total | 36 (100.0%) | $83,056 |
Family Income by Number of Earners in Morrison Crossroads
| Number of Earners | # Families | Median Income |
| No Earners | 12 (33.3%) | $0 |
| 1 Earner | 4 (11.1%) | $0 |
| 2 Earners | 11 (30.6%) | $0 |
| 3+ Earners | 9 (25.0%) | $0 |
| Total | 36 (100.0%) | $83,056 |
Household Income in Morrison Crossroads
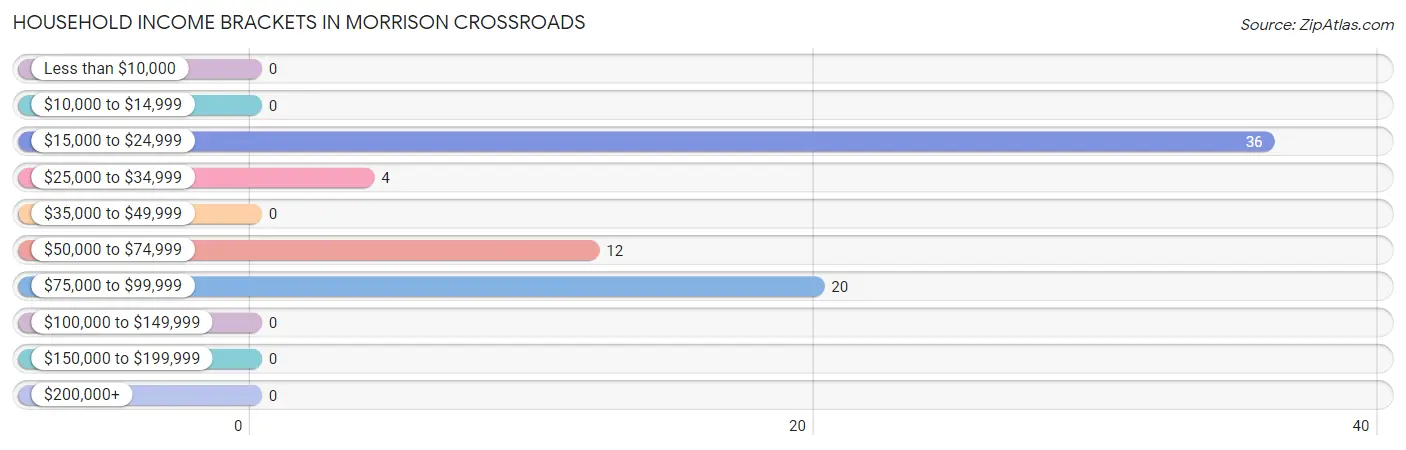
Household Income Brackets in Morrison Crossroads
With 36 households falling in the category, the $15,000 to $24,999 income range is the most frequent in Morrison Crossroads, accounting for 50.0% of all households.
| Income Bracket | # Households | % Households |
| Less than $10,000 | 0 | 0.0% |
| $10,000 to $14,999 | 0 | 0.0% |
| $15,000 to $24,999 | 36 | 50.0% |
| $25,000 to $34,999 | 4 | 5.6% |
| $35,000 to $49,999 | 0 | 0.0% |
| $50,000 to $74,999 | 12 | 16.7% |
| $75,000 to $99,999 | 20 | 27.8% |
| $100,000 to $149,999 | 0 | 0.0% |
| $150,000 to $199,999 | 0 | 0.0% |
| $200,000+ | 0 | 0.0% |
Household Income by Householder Age in Morrison Crossroads
| Income Bracket | # Households | Median Income |
| 15 to 24 Years | 0 (0.0%) | $0 |
| 25 to 44 Years | 11 (15.3%) | $0 |
| 45 to 64 Years | 45 (62.5%) | $0 |
| 65+ Years | 16 (22.2%) | $0 |
| Total | 72 (100.0%) | $0 |
Poverty in Morrison Crossroads
Income Below Poverty by Sex and Age in Morrison Crossroads
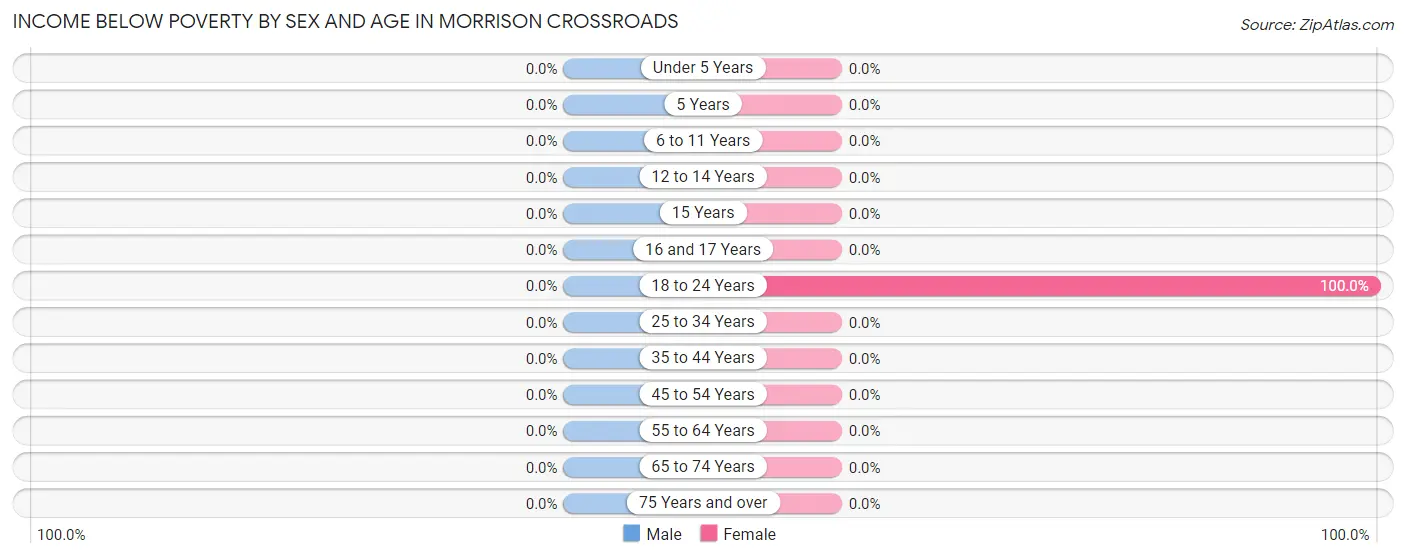
| Age Bracket | Male | Female |
| Under 5 Years | 0 (0.0%) | 0 (0.0%) |
| 5 Years | 0 (0.0%) | 0 (0.0%) |
| 6 to 11 Years | 0 (0.0%) | 0 (0.0%) |
| 12 to 14 Years | 0 (0.0%) | 0 (0.0%) |
| 15 Years | 0 (0.0%) | 0 (0.0%) |
| 16 and 17 Years | 0 (0.0%) | 0 (0.0%) |
| 18 to 24 Years | 0 (0.0%) | 18 (100.0%) |
| 25 to 34 Years | 0 (0.0%) | 0 (0.0%) |
| 35 to 44 Years | 0 (0.0%) | 0 (0.0%) |
| 45 to 54 Years | 0 (0.0%) | 0 (0.0%) |
| 55 to 64 Years | 0 (0.0%) | 0 (0.0%) |
| 65 to 74 Years | 0 (0.0%) | 0 (0.0%) |
| 75 Years and over | 0 (0.0%) | 0 (0.0%) |
| Total | 0 (0.0%) | 18 (22.5%) |
Income Above Poverty by Sex and Age in Morrison Crossroads
According to the poverty statistics in Morrison Crossroads, males aged 25 to 34 years and females aged 6 to 11 years are the age groups that are most secure financially, with 100.0% of males and 100.0% of females in these age groups living above the poverty line.
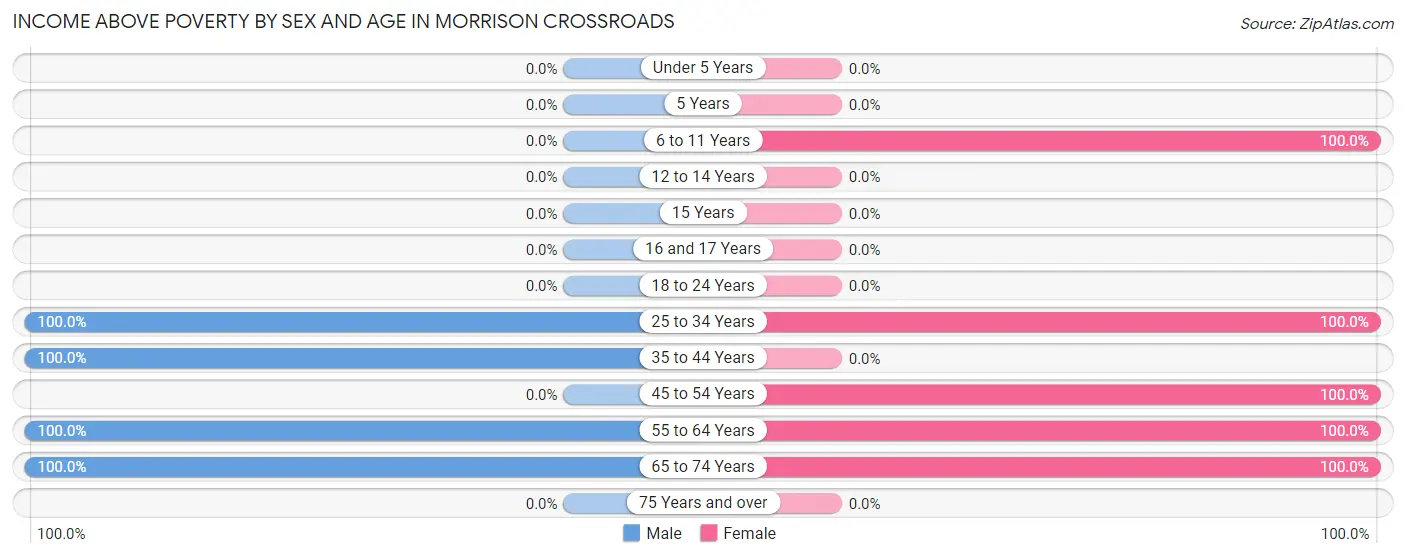
| Age Bracket | Male | Female |
| Under 5 Years | 0 (0.0%) | 0 (0.0%) |
| 5 Years | 0 (0.0%) | 0 (0.0%) |
| 6 to 11 Years | 0 (0.0%) | 14 (100.0%) |
| 12 to 14 Years | 0 (0.0%) | 0 (0.0%) |
| 15 Years | 0 (0.0%) | 0 (0.0%) |
| 16 and 17 Years | 0 (0.0%) | 0 (0.0%) |
| 18 to 24 Years | 0 (0.0%) | 0 (0.0%) |
| 25 to 34 Years | 11 (100.0%) | 24 (100.0%) |
| 35 to 44 Years | 16 (100.0%) | 0 (0.0%) |
| 45 to 54 Years | 0 (0.0%) | 3 (100.0%) |
| 55 to 64 Years | 46 (100.0%) | 9 (100.0%) |
| 65 to 74 Years | 16 (100.0%) | 12 (100.0%) |
| 75 Years and over | 0 (0.0%) | 0 (0.0%) |
| Total | 89 (100.0%) | 62 (77.5%) |
Income Below Poverty Among Married-Couple Families in Morrison Crossroads
| Children | Above Poverty | Below Poverty |
| No Children | 25 (100.0%) | 0 (0.0%) |
| 1 or 2 Children | 11 (100.0%) | 0 (0.0%) |
| 3 or 4 Children | 0 (0.0%) | 0 (0.0%) |
| 5 or more Children | 0 (0.0%) | 0 (0.0%) |
| Total | 36 (100.0%) | 0 (0.0%) |
Income Below Poverty Among Single-Parent Households in Morrison Crossroads
| Children | Single Father | Single Mother |
| No Children | 0 (0.0%) | 0 (0.0%) |
| 1 or 2 Children | 0 (0.0%) | 0 (0.0%) |
| 3 or 4 Children | 0 (0.0%) | 0 (0.0%) |
| 5 or more Children | 0 (0.0%) | 0 (0.0%) |
| Total | 0 (0.0%) | 0 (0.0%) |
Income Below Poverty Among Married-Couple vs Single-Parent Households in Morrison Crossroads

| Children | Married-Couple Families | Single-Parent Households |
| No Children | 0 (0.0%) | 0 (0.0%) |
| 1 or 2 Children | 0 (0.0%) | 0 (0.0%) |
| 3 or 4 Children | 0 (0.0%) | 0 (0.0%) |
| 5 or more Children | 0 (0.0%) | 0 (0.0%) |
| Total | 0 (0.0%) | 0 (0.0%) |
Race in Morrison Crossroads
The most populous races in Morrison Crossroads are White / Caucasian (151 | 89.3%), Hispanic or Latino (18 | 10.6%), and Some other Race (18 | 10.6%).
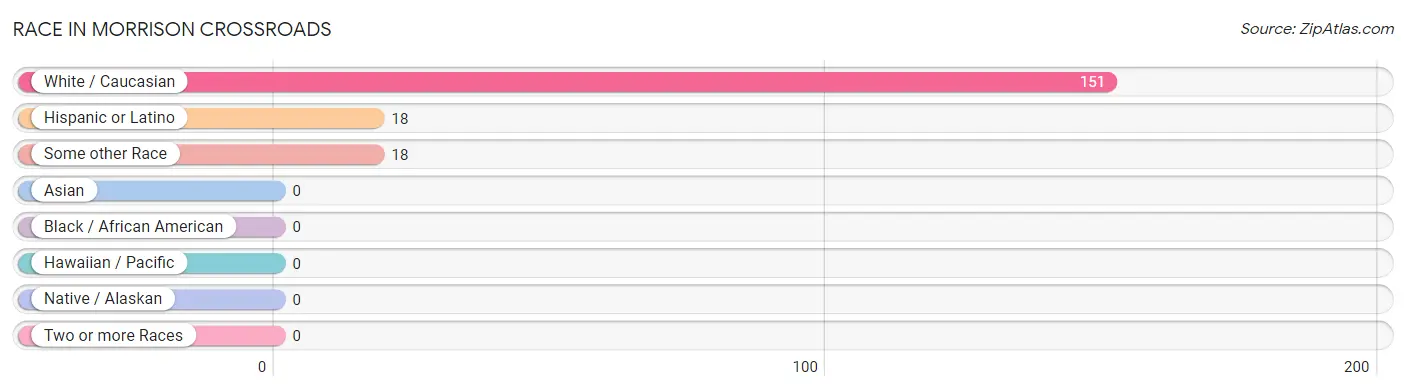
| Race | # Population | % Population |
| Asian | 0 | 0.0% |
| Black / African American | 0 | 0.0% |
| Hawaiian / Pacific | 0 | 0.0% |
| Hispanic or Latino | 18 | 10.6% |
| Native / Alaskan | 0 | 0.0% |
| White / Caucasian | 151 | 89.3% |
| Two or more Races | 0 | 0.0% |
| Some other Race | 18 | 10.6% |
| Total | 169 | 100.0% |
Ancestry in Morrison Crossroads
The most populous ancestries reported in Morrison Crossroads are American (61 | 36.1%), French (19 | 11.2%), Mexican (18 | 10.6%), German (10 | 5.9%), and Italian (10 | 5.9%), together accounting for 69.8% of all Morrison Crossroads residents.
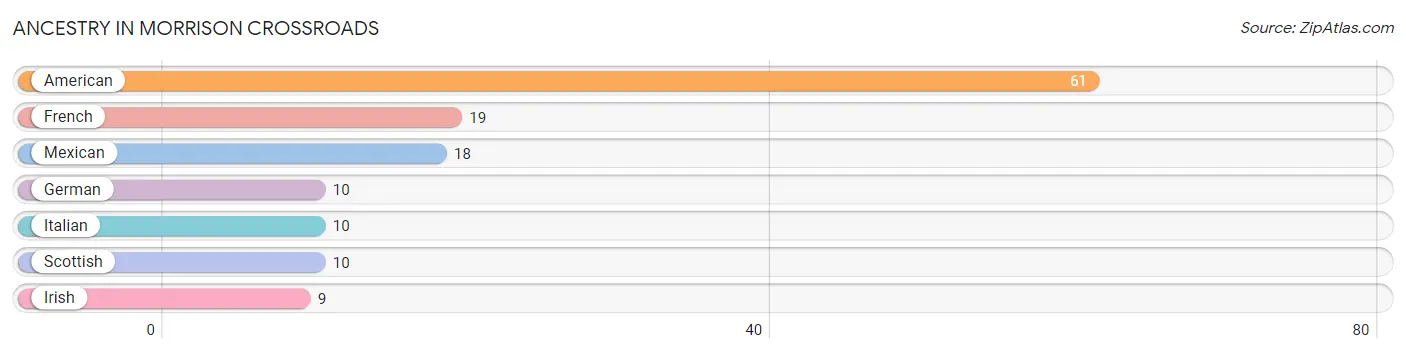
| Ancestry | # Population | % Population |
| American | 61 | 36.1% |
| French | 19 | 11.2% |
| German | 10 | 5.9% |
| Irish | 9 | 5.3% |
| Italian | 10 | 5.9% |
| Mexican | 18 | 10.6% |
| Scottish | 10 | 5.9% | View All 7 Rows |
Immigrants in Morrison Crossroads

| Immigration Origin | # Population | % Population | View All 0 Rows |
Sex and Age in Morrison Crossroads
Sex and Age in Morrison Crossroads
The most populous age groups in Morrison Crossroads are 55 to 59 Years (36 | 40.5%) for men and 30 to 34 Years (24 | 30.0%) for women.
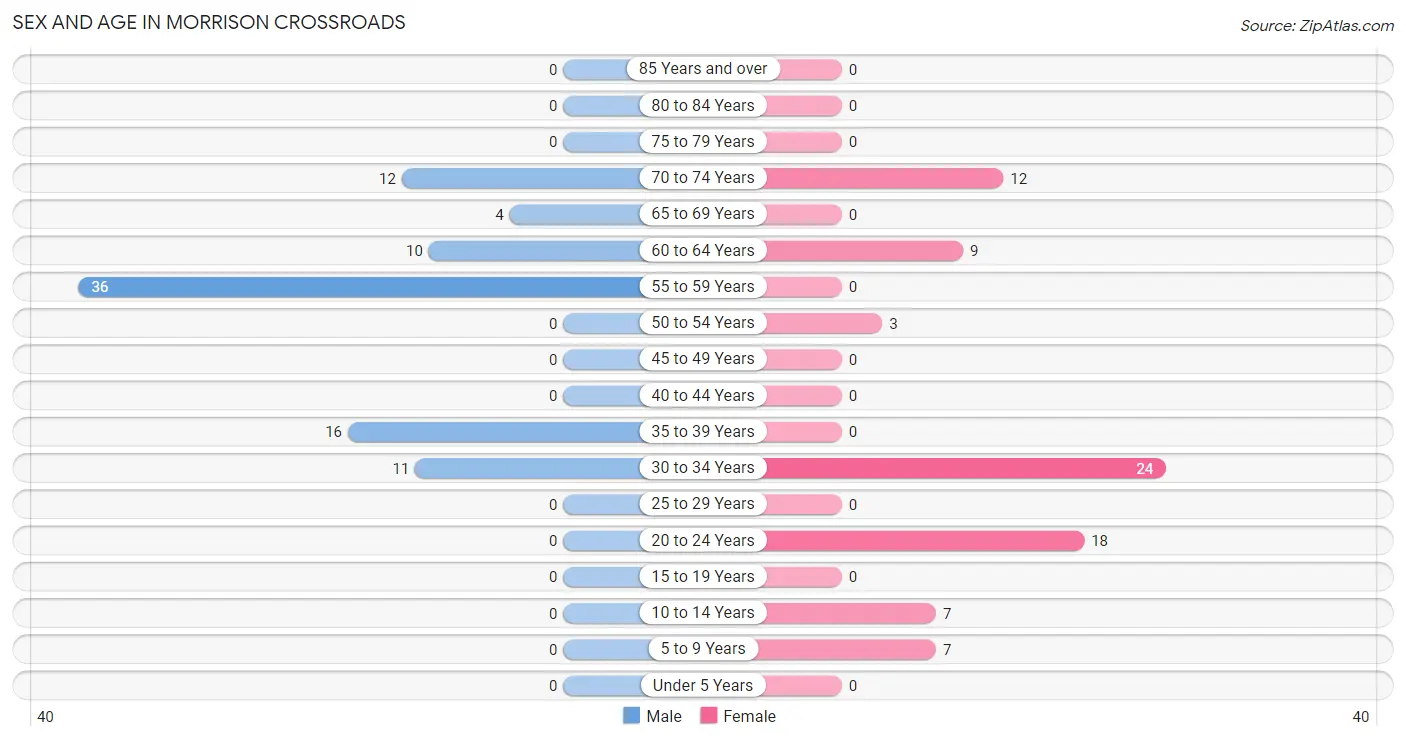
| Age Bracket | Male | Female |
| Under 5 Years | 0 (0.0%) | 0 (0.0%) |
| 5 to 9 Years | 0 (0.0%) | 7 (8.7%) |
| 10 to 14 Years | 0 (0.0%) | 7 (8.7%) |
| 15 to 19 Years | 0 (0.0%) | 0 (0.0%) |
| 20 to 24 Years | 0 (0.0%) | 18 (22.5%) |
| 25 to 29 Years | 0 (0.0%) | 0 (0.0%) |
| 30 to 34 Years | 11 (12.4%) | 24 (30.0%) |
| 35 to 39 Years | 16 (18.0%) | 0 (0.0%) |
| 40 to 44 Years | 0 (0.0%) | 0 (0.0%) |
| 45 to 49 Years | 0 (0.0%) | 0 (0.0%) |
| 50 to 54 Years | 0 (0.0%) | 3 (3.7%) |
| 55 to 59 Years | 36 (40.5%) | 0 (0.0%) |
| 60 to 64 Years | 10 (11.2%) | 9 (11.3%) |
| 65 to 69 Years | 4 (4.5%) | 0 (0.0%) |
| 70 to 74 Years | 12 (13.5%) | 12 (15.0%) |
| 75 to 79 Years | 0 (0.0%) | 0 (0.0%) |
| 80 to 84 Years | 0 (0.0%) | 0 (0.0%) |
| 85 Years and over | 0 (0.0%) | 0 (0.0%) |
| Total | 89 (100.0%) | 80 (100.0%) |
Families and Households in Morrison Crossroads
Median Family Size in Morrison Crossroads
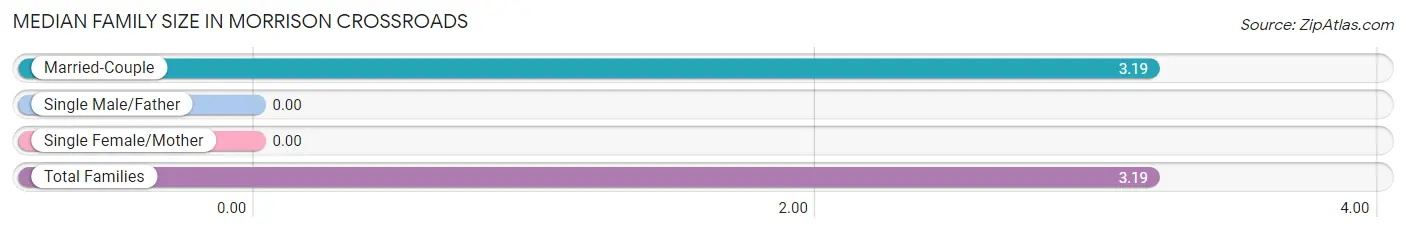
| Family Type | # Families | Family Size |
| Married-Couple | 36 (100.0%) | 3.19 |
| Single Male/Father | 0 (0.0%) | - |
| Single Female/Mother | 0 (0.0%) | - |
| Total Families | 36 (100.0%) | 3.19 |
Median Household Size in Morrison Crossroads
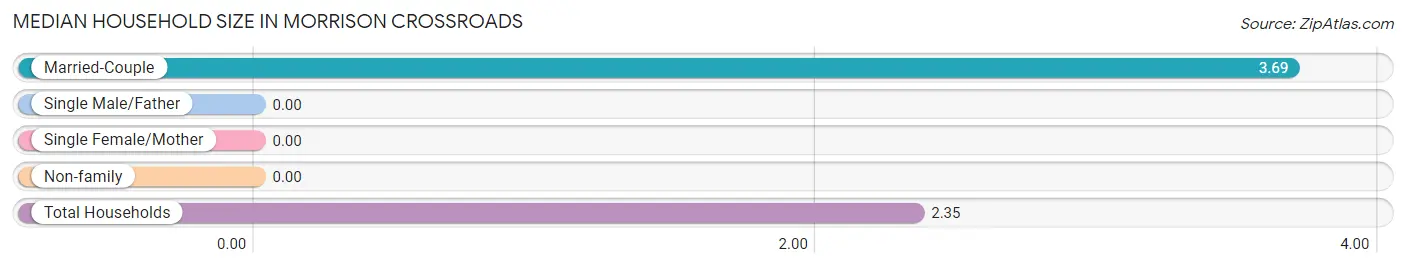
| Household Type | # Households | Household Size |
| Married-Couple | 36 (50.0%) | 3.69 |
| Single Male/Father | 0 (0.0%) | - |
| Single Female/Mother | 0 (0.0%) | - |
| Non-family | 36 (50.0%) | - |
| Total Households | 72 (100.0%) | 2.35 |
Household Size by Marriage Status in Morrison Crossroads
Out of a total of 72 households in Morrison Crossroads, 36 (50.0%) are family households, while 36 (50.0%) are nonfamily households. The most numerous type of family households are 2-person households, comprising 16, and the most common type of nonfamily households are 1-person households, comprising 36.
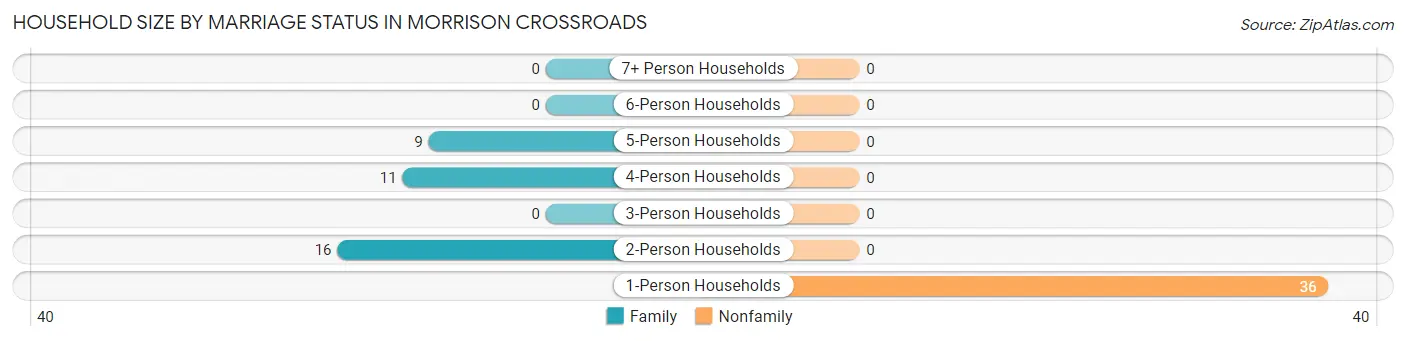
| Household Size | Family Households | Nonfamily Households |
| 1-Person Households | - | 36 (50.0%) |
| 2-Person Households | 16 (22.2%) | 0 (0.0%) |
| 3-Person Households | 0 (0.0%) | 0 (0.0%) |
| 4-Person Households | 11 (15.3%) | 0 (0.0%) |
| 5-Person Households | 9 (12.5%) | 0 (0.0%) |
| 6-Person Households | 0 (0.0%) | 0 (0.0%) |
| 7+ Person Households | 0 (0.0%) | 0 (0.0%) |
| Total | 36 (50.0%) | 36 (50.0%) |
Female Fertility in Morrison Crossroads
Fertility by Age in Morrison Crossroads
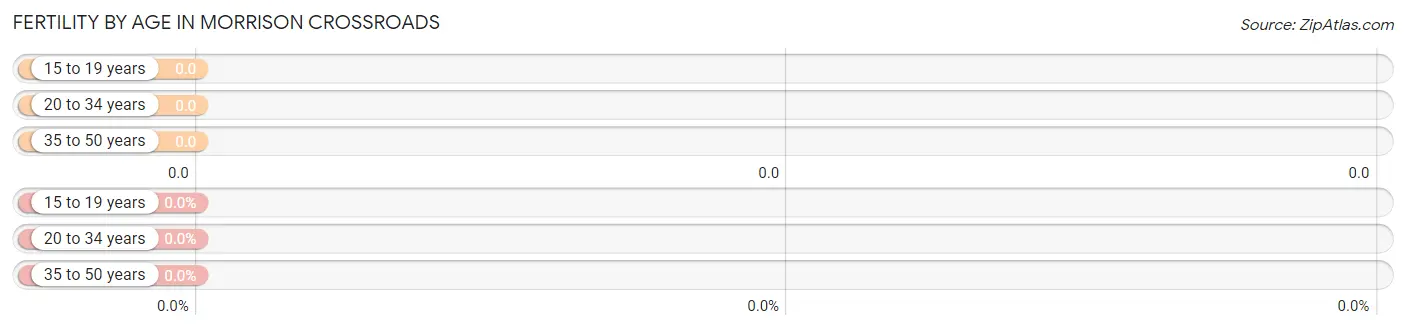
| Age Bracket | Women with Births | Births / 1,000 Women |
| 15 to 19 years | 0 (0.0%) | 0.0 |
| 20 to 34 years | 0 (0.0%) | 0.0 |
| 35 to 50 years | 0 (0.0%) | 0.0 |
| Total | 0 (0.0%) | 0.0 |
Fertility by Age by Marriage Status in Morrison Crossroads
| Age Bracket | Married | Unmarried |
| 15 to 19 years | 0 (0.0%) | 0 (0.0%) |
| 20 to 34 years | 0 (0.0%) | 0 (0.0%) |
| 35 to 50 years | 0 (0.0%) | 0 (0.0%) |
| Total | 0 (0.0%) | 0 (0.0%) |
Fertility by Education in Morrison Crossroads
| Educational Attainment | Women with Births | Births / 1,000 Women |
| Less than High School | 0 (0.0%) | 0.0 |
| High School Diploma | 0 (0.0%) | 0.0 |
| College or Associate's Degree | 0 (0.0%) | 0.0 |
| Bachelor's Degree | 0 (0.0%) | 0.0 |
| Graduate Degree | 0 (0.0%) | 0.0 |
| Total | 0 (0.0%) | 0.0 |
Fertility by Education by Marriage Status in Morrison Crossroads
| Educational Attainment | Married | Unmarried |
| Less than High School | 0 (0.0%) | 0 (0.0%) |
| High School Diploma | 0 (0.0%) | 0 (0.0%) |
| College or Associate's Degree | 0 (0.0%) | 0 (0.0%) |
| Bachelor's Degree | 0 (0.0%) | 0 (0.0%) |
| Graduate Degree | 0 (0.0%) | 0 (0.0%) |
| Total | 0 (0.0%) | 0 (0.0%) |
Employment Characteristics in Morrison Crossroads
Employment by Class of Employer in Morrison Crossroads
Among the 95 employed individuals in Morrison Crossroads, private company employees (86 | 90.5%), and local government employees (9 | 9.5%) make up the most common classes of employment.
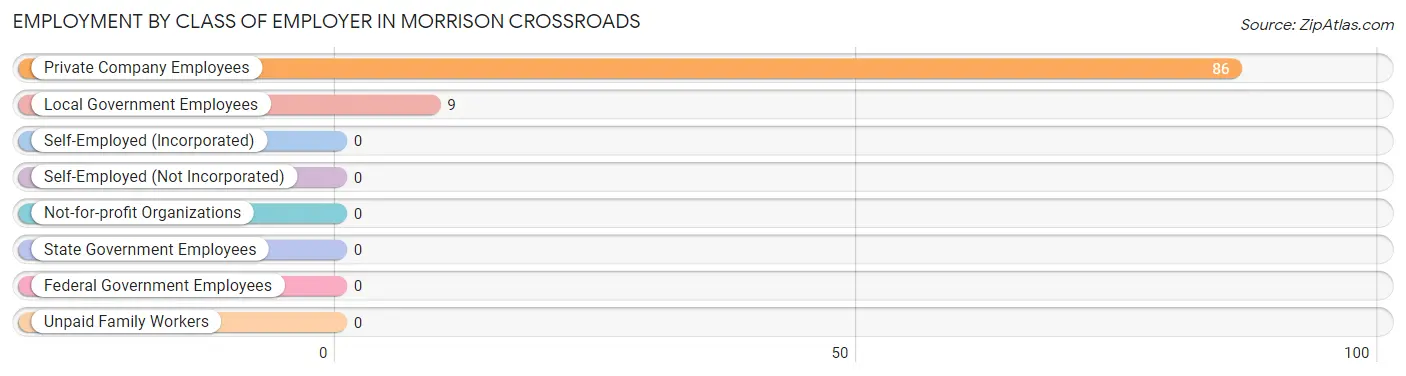
| Employer Class | # Employees | % Employees |
| Private Company Employees | 86 | 90.5% |
| Self-Employed (Incorporated) | 0 | 0.0% |
| Self-Employed (Not Incorporated) | 0 | 0.0% |
| Not-for-profit Organizations | 0 | 0.0% |
| Local Government Employees | 9 | 9.5% |
| State Government Employees | 0 | 0.0% |
| Federal Government Employees | 0 | 0.0% |
| Unpaid Family Workers | 0 | 0.0% |
| Total | 95 | 100.0% |
Employment Status by Age in Morrison Crossroads
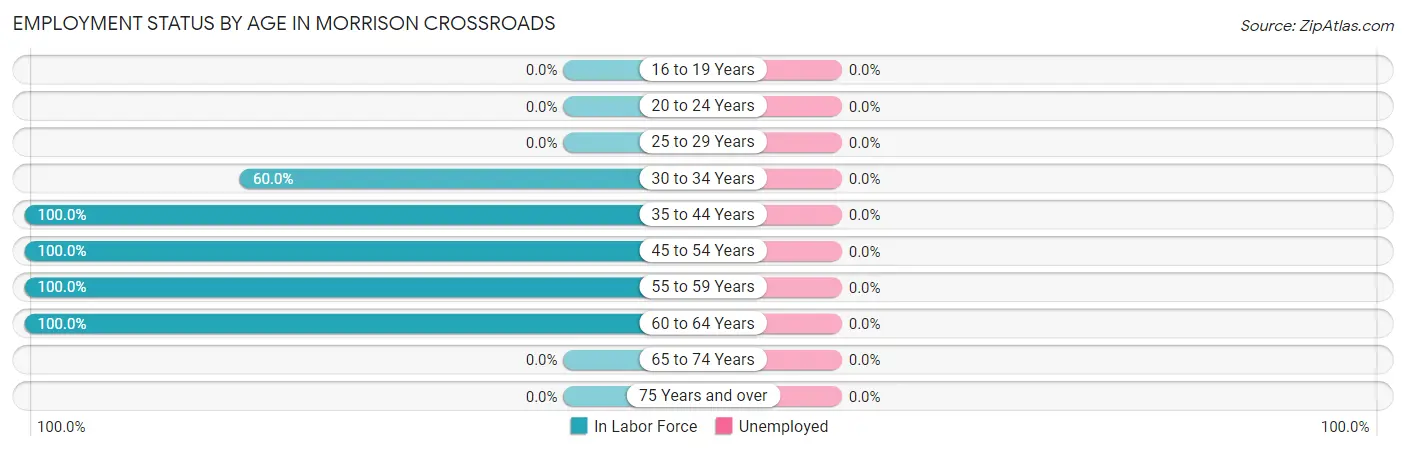
| Age Bracket | In Labor Force | Unemployed |
| 16 to 19 Years | 0 (0.0%) | 0 (0.0%) |
| 20 to 24 Years | 0 (0.0%) | 0 (0.0%) |
| 25 to 29 Years | 0 (0.0%) | 0 (0.0%) |
| 30 to 34 Years | 21 (60.0%) | 0 (0.0%) |
| 35 to 44 Years | 16 (100.0%) | 0 (0.0%) |
| 45 to 54 Years | 3 (100.0%) | 0 (0.0%) |
| 55 to 59 Years | 36 (100.0%) | 0 (0.0%) |
| 60 to 64 Years | 19 (100.0%) | 0 (0.0%) |
| 65 to 74 Years | 0 (0.0%) | 0 (0.0%) |
| 75 Years and over | 0 (0.0%) | 0 (0.0%) |
| Total | 95 (61.3%) | 0 (0.0%) |
Employment Status by Educational Attainment in Morrison Crossroads
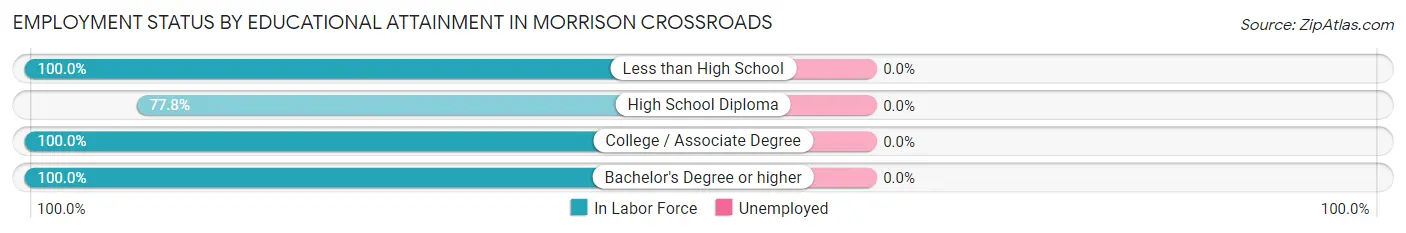
| Educational Attainment | In Labor Force | Unemployed |
| Less than High School | 16 (100.0%) | 0 (0.0%) |
| High School Diploma | 49 (77.8%) | 0 (0.0%) |
| College / Associate Degree | 20 (100.0%) | 0 (0.0%) |
| Bachelor's Degree or higher | 10 (100.0%) | 0 (0.0%) |
| Total | 95 (87.2%) | 0 (0.0%) |
Employment Occupations by Sex in Morrison Crossroads
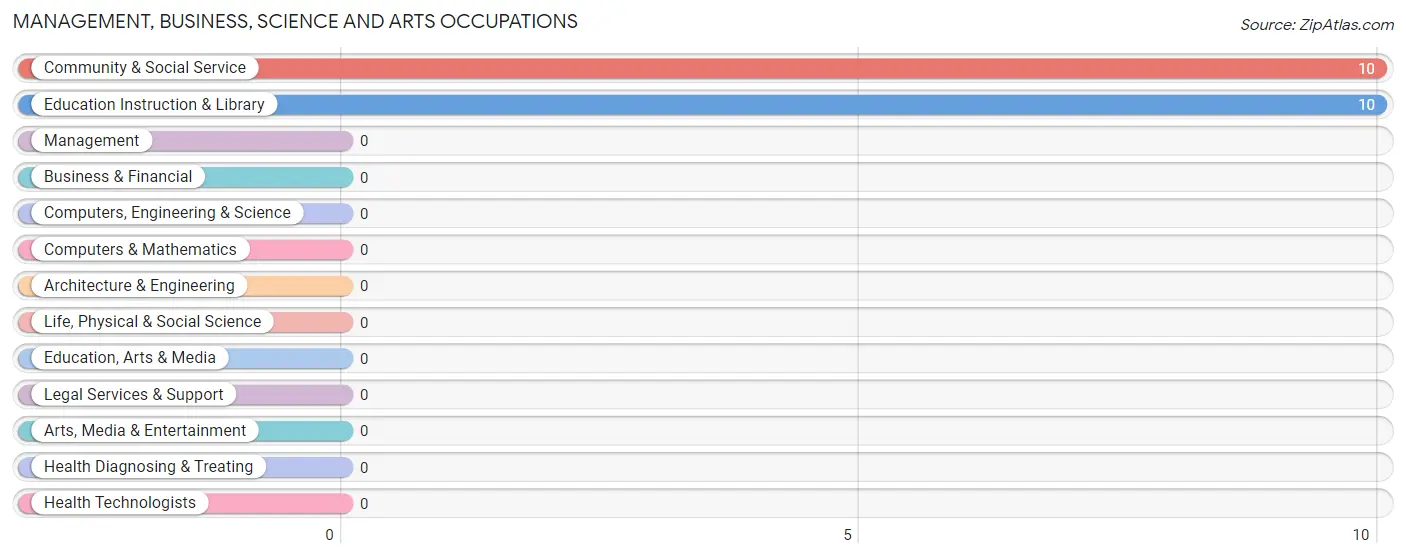
Management, Business, Science and Arts Occupations
The most common Management, Business, Science and Arts occupations in Morrison Crossroads are Community & Social Service (10 | 10.5%), and Education Instruction & Library (10 | 10.5%).
Management, Business, Science and Arts Occupations by Sex
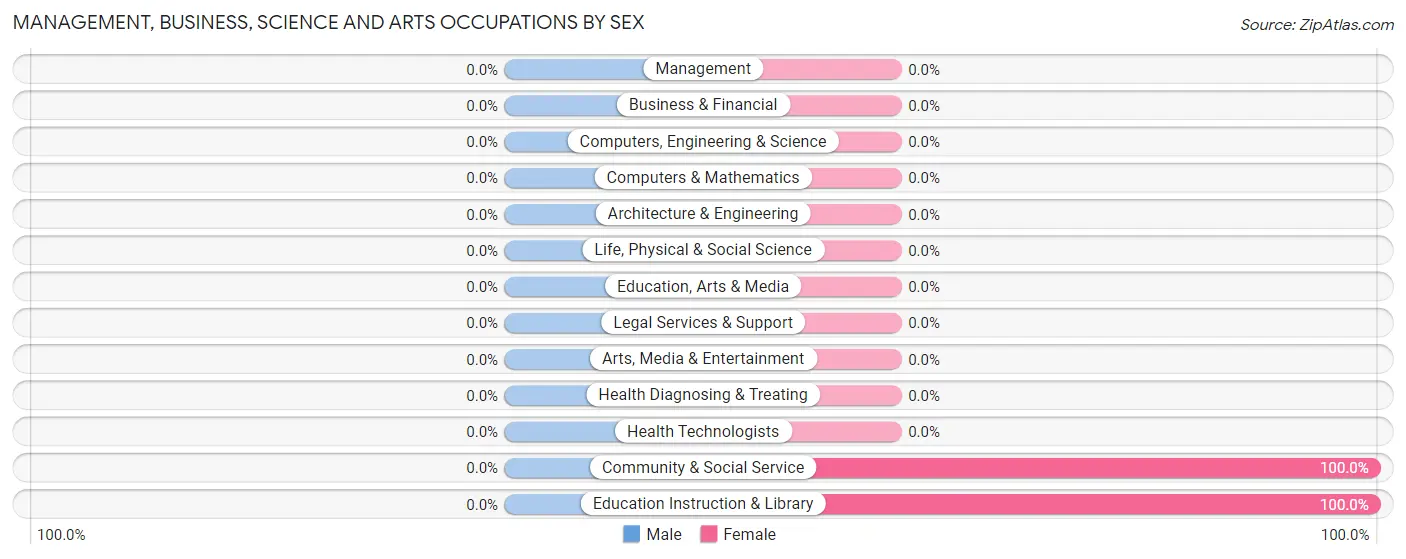
| Occupation | Male | Female |
| Management | 0 (0.0%) | 0 (0.0%) |
| Business & Financial | 0 (0.0%) | 0 (0.0%) |
| Computers, Engineering & Science | 0 (0.0%) | 0 (0.0%) |
| Computers & Mathematics | 0 (0.0%) | 0 (0.0%) |
| Architecture & Engineering | 0 (0.0%) | 0 (0.0%) |
| Life, Physical & Social Science | 0 (0.0%) | 0 (0.0%) |
| Community & Social Service | 0 (0.0%) | 10 (100.0%) |
| Education, Arts & Media | 0 (0.0%) | 0 (0.0%) |
| Legal Services & Support | 0 (0.0%) | 0 (0.0%) |
| Education Instruction & Library | 0 (0.0%) | 10 (100.0%) |
| Arts, Media & Entertainment | 0 (0.0%) | 0 (0.0%) |
| Health Diagnosing & Treating | 0 (0.0%) | 0 (0.0%) |
| Health Technologists | 0 (0.0%) | 0 (0.0%) |
| Total (Category) | 0 (0.0%) | 10 (100.0%) |
| Total (Overall) | 73 (76.8%) | 22 (23.2%) |
Services Occupations
The most common Services occupations in Morrison Crossroads are Cleaning & Maintenance (9 | 9.5%), and Food Preparation & Serving (3 | 3.2%).
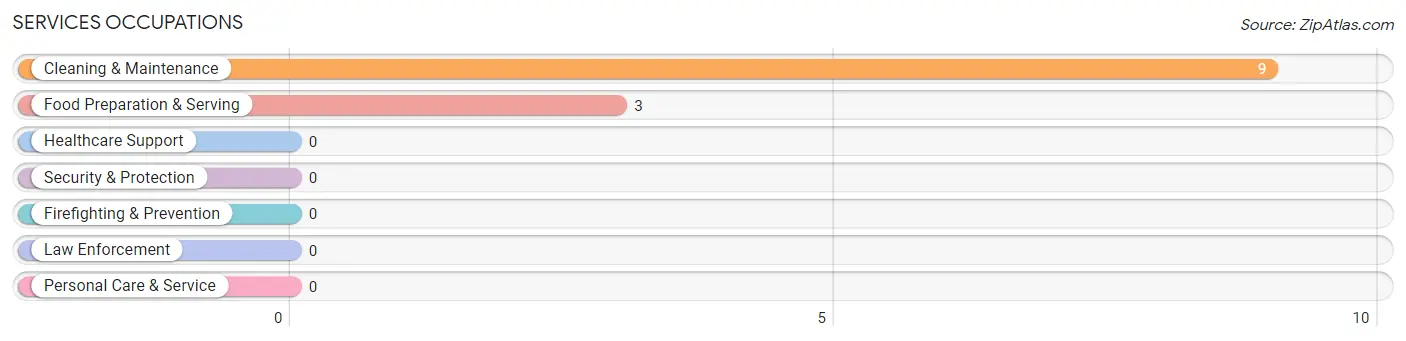
Services Occupations by Sex
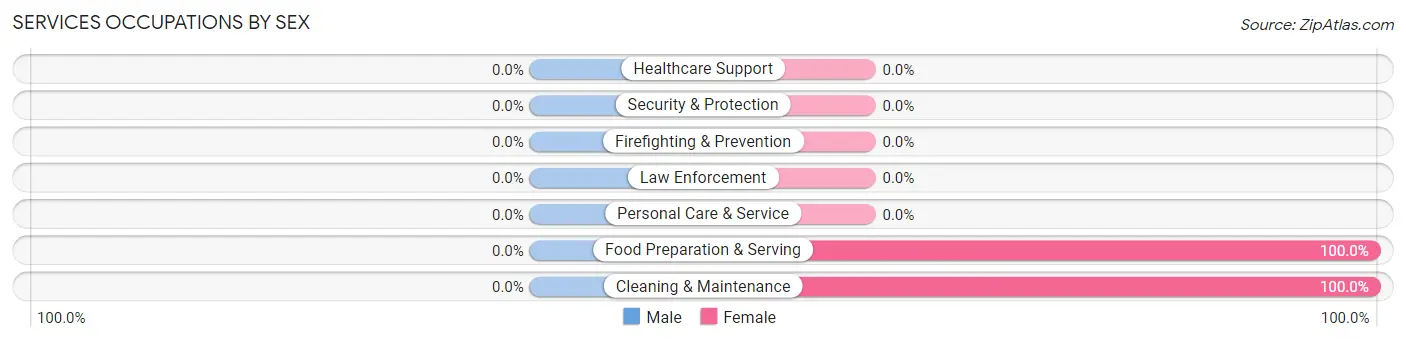
| Occupation | Male | Female |
| Healthcare Support | 0 (0.0%) | 0 (0.0%) |
| Security & Protection | 0 (0.0%) | 0 (0.0%) |
| Firefighting & Prevention | 0 (0.0%) | 0 (0.0%) |
| Law Enforcement | 0 (0.0%) | 0 (0.0%) |
| Food Preparation & Serving | 0 (0.0%) | 3 (100.0%) |
| Cleaning & Maintenance | 0 (0.0%) | 9 (100.0%) |
| Personal Care & Service | 0 (0.0%) | 0 (0.0%) |
| Total (Category) | 0 (0.0%) | 12 (100.0%) |
| Total (Overall) | 73 (76.8%) | 22 (23.2%) |
Sales and Office Occupations
The most common Sales and Office occupations in Morrison Crossroads are Office & Administration (16 | 16.8%), and Sales & Related (10 | 10.5%).
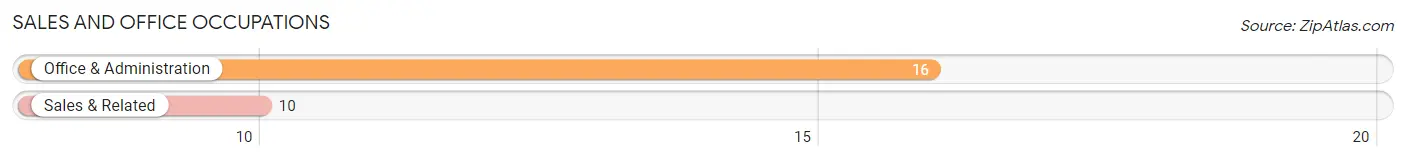
Sales and Office Occupations by Sex
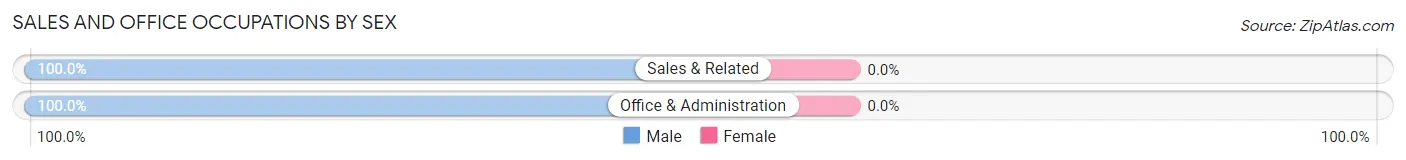
| Occupation | Male | Female |
| Sales & Related | 10 (100.0%) | 0 (0.0%) |
| Office & Administration | 16 (100.0%) | 0 (0.0%) |
| Total (Category) | 26 (100.0%) | 0 (0.0%) |
| Total (Overall) | 73 (76.8%) | 22 (23.2%) |
Natural Resources, Construction and Maintenance Occupations
Natural Resources, Construction and Maintenance Occupations by Sex
| Occupation | Male | Female |
| Farming, Fishing & Forestry | 0 (0.0%) | 0 (0.0%) |
| Construction & Extraction | 0 (0.0%) | 0 (0.0%) |
| Installation, Maintenance & Repair | 0 (0.0%) | 0 (0.0%) |
| Total (Category) | 0 (0.0%) | 0 (0.0%) |
| Total (Overall) | 73 (76.8%) | 22 (23.2%) |
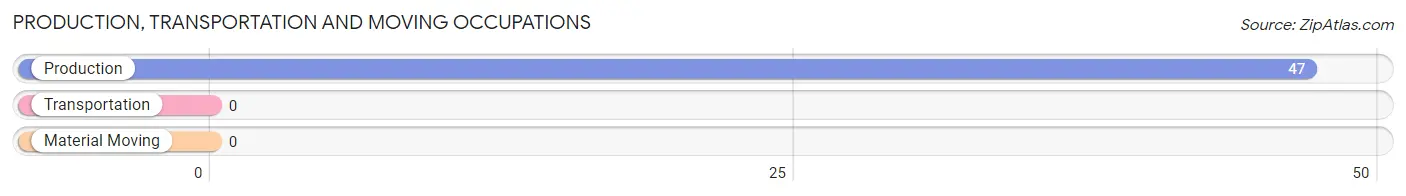
Production, Transportation and Moving Occupations
The most common Production, Transportation and Moving occupations in Morrison Crossroads are , and Production (47 | 49.5%).
Production, Transportation and Moving Occupations by Sex
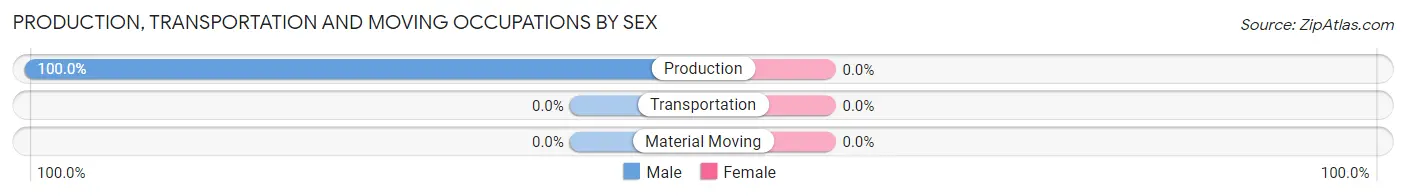
| Occupation | Male | Female |
| Production | 47 (100.0%) | 0 (0.0%) |
| Transportation | 0 (0.0%) | 0 (0.0%) |
| Material Moving | 0 (0.0%) | 0 (0.0%) |
| Total (Category) | 47 (100.0%) | 0 (0.0%) |
| Total (Overall) | 73 (76.8%) | 22 (23.2%) |
Employment Industries by Sex in Morrison Crossroads
Employment Industries in Morrison Crossroads
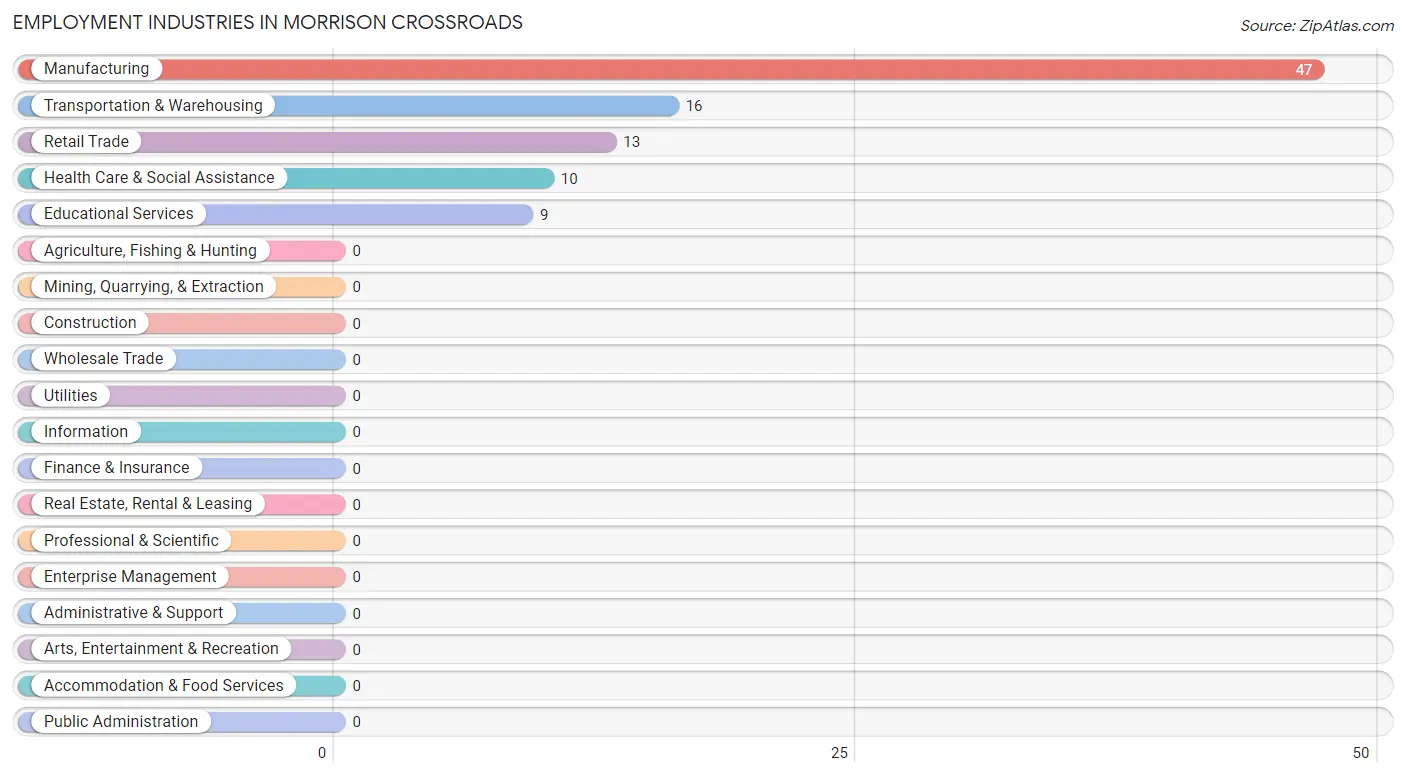
The major employment industries in Morrison Crossroads include Manufacturing (47 | 49.5%), Transportation & Warehousing (16 | 16.8%), Retail Trade (13 | 13.7%), Health Care & Social Assistance (10 | 10.5%), and Educational Services (9 | 9.5%).
Employment Industries by Sex in Morrison Crossroads
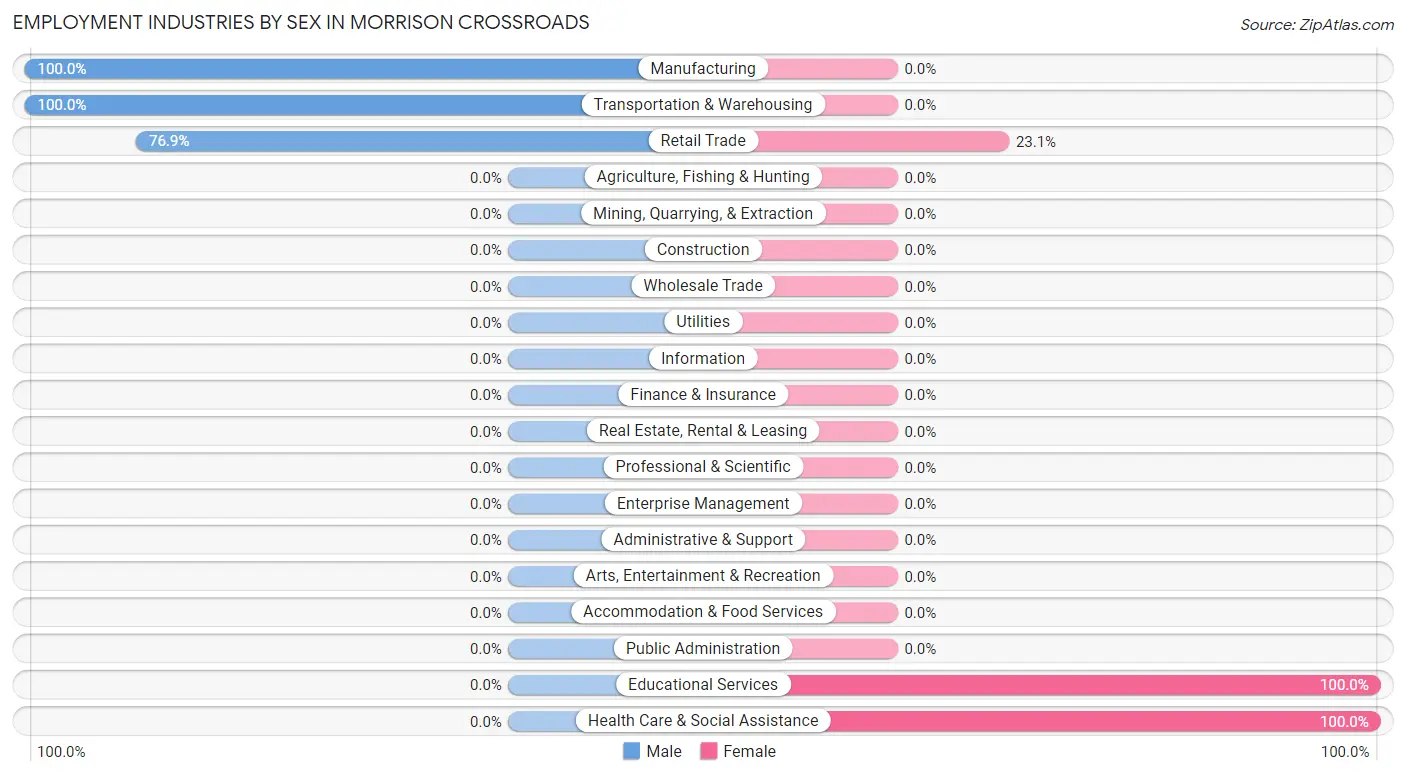
The Morrison Crossroads industries that see more men than women are Manufacturing (100.0%), Transportation & Warehousing (100.0%), and Retail Trade (76.9%), whereas the industries that tend to have a higher number of women are Educational Services (100.0%), Health Care & Social Assistance (100.0%), and Retail Trade (23.1%).
| Industry | Male | Female |
| Agriculture, Fishing & Hunting | 0 (0.0%) | 0 (0.0%) |
| Mining, Quarrying, & Extraction | 0 (0.0%) | 0 (0.0%) |
| Construction | 0 (0.0%) | 0 (0.0%) |
| Manufacturing | 47 (100.0%) | 0 (0.0%) |
| Wholesale Trade | 0 (0.0%) | 0 (0.0%) |
| Retail Trade | 10 (76.9%) | 3 (23.1%) |
| Transportation & Warehousing | 16 (100.0%) | 0 (0.0%) |
| Utilities | 0 (0.0%) | 0 (0.0%) |
| Information | 0 (0.0%) | 0 (0.0%) |
| Finance & Insurance | 0 (0.0%) | 0 (0.0%) |
| Real Estate, Rental & Leasing | 0 (0.0%) | 0 (0.0%) |
| Professional & Scientific | 0 (0.0%) | 0 (0.0%) |
| Enterprise Management | 0 (0.0%) | 0 (0.0%) |
| Administrative & Support | 0 (0.0%) | 0 (0.0%) |
| Educational Services | 0 (0.0%) | 9 (100.0%) |
| Health Care & Social Assistance | 0 (0.0%) | 10 (100.0%) |
| Arts, Entertainment & Recreation | 0 (0.0%) | 0 (0.0%) |
| Accommodation & Food Services | 0 (0.0%) | 0 (0.0%) |
| Public Administration | 0 (0.0%) | 0 (0.0%) |
| Total | 73 (76.8%) | 22 (23.2%) |
Education in Morrison Crossroads
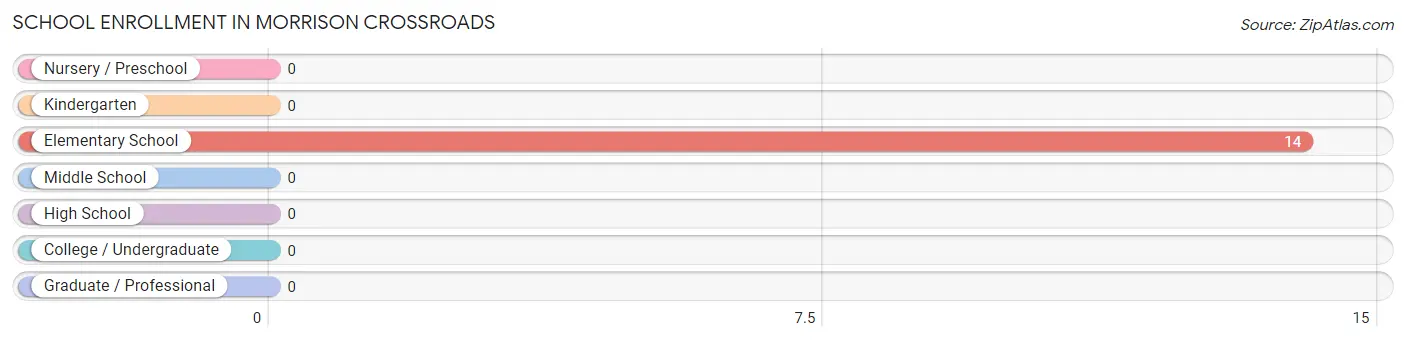
School Enrollment in Morrison Crossroads
| School Level | # Students | % Students |
| Nursery / Preschool | 0 | 0.0% |
| Kindergarten | 0 | 0.0% |
| Elementary School | 14 | 100.0% |
| Middle School | 0 | 0.0% |
| High School | 0 | 0.0% |
| College / Undergraduate | 0 | 0.0% |
| Graduate / Professional | 0 | 0.0% |
| Total | 14 | 100.0% |
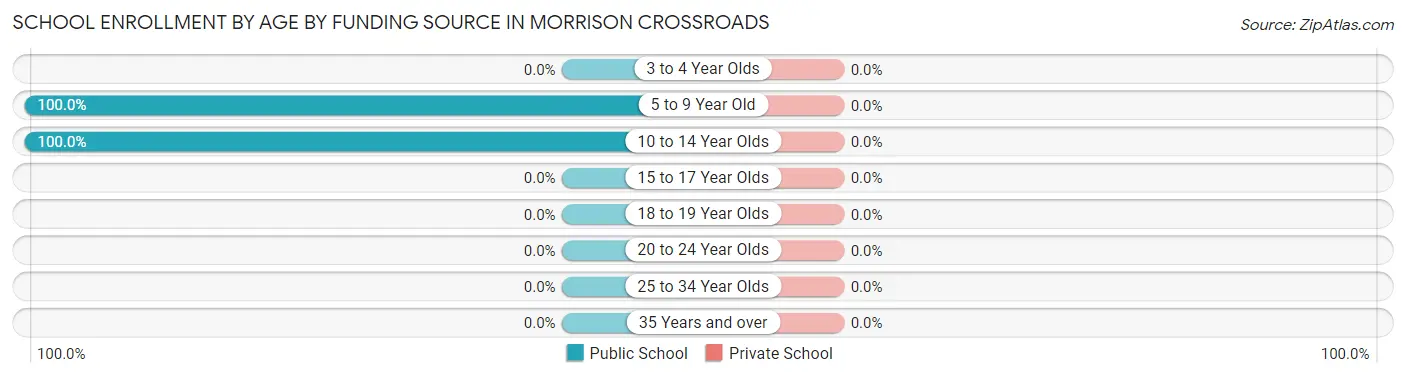
School Enrollment by Age by Funding Source in Morrison Crossroads
| Age Bracket | Public School | Private School |
| 3 to 4 Year Olds | 0 (0.0%) | 0 (0.0%) |
| 5 to 9 Year Old | 7 (100.0%) | 0 (0.0%) |
| 10 to 14 Year Olds | 7 (100.0%) | 0 (0.0%) |
| 15 to 17 Year Olds | 0 (0.0%) | 0 (0.0%) |
| 18 to 19 Year Olds | 0 (0.0%) | 0 (0.0%) |
| 20 to 24 Year Olds | 0 (0.0%) | 0 (0.0%) |
| 25 to 34 Year Olds | 0 (0.0%) | 0 (0.0%) |
| 35 Years and over | 0 (0.0%) | 0 (0.0%) |
| Total | 14 (100.0%) | 0 (0.0%) |
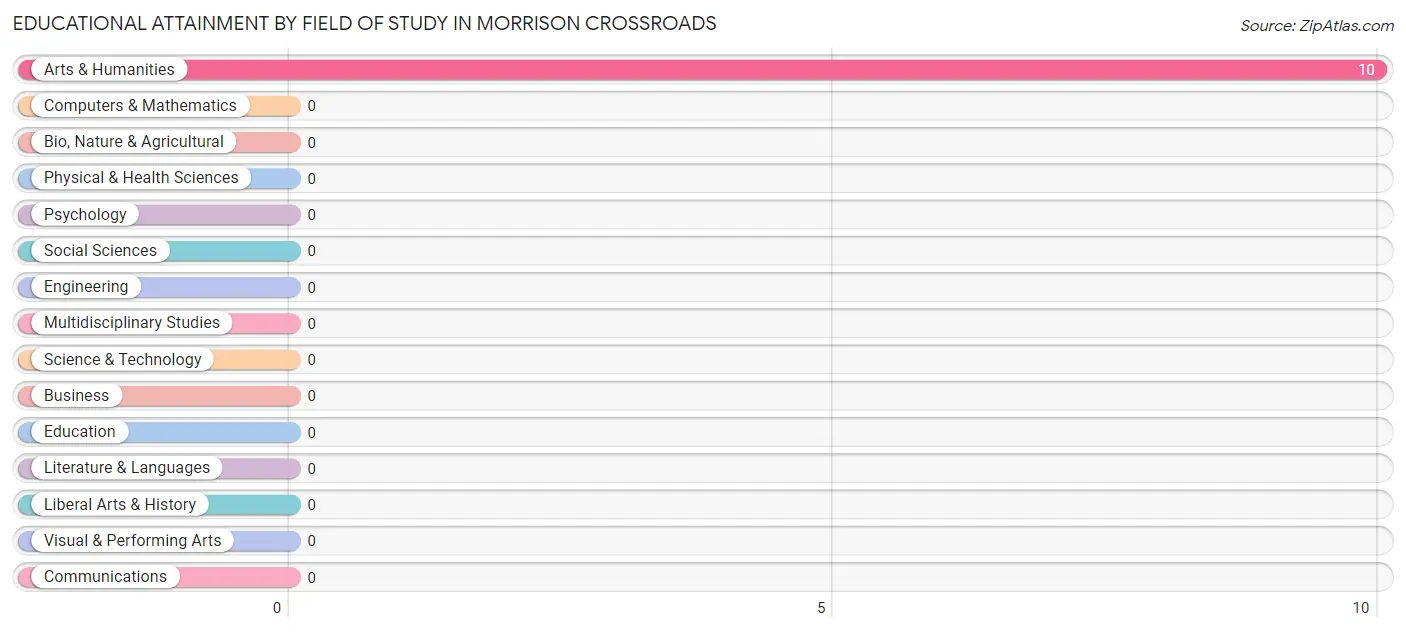
Educational Attainment by Field of Study in Morrison Crossroads
, and arts & humanities (10 | 100.0%) are the most common fields of study among 10 individuals in Morrison Crossroads who have obtained a bachelor's degree or higher.
| Field of Study | # Graduates | % Graduates |
| Computers & Mathematics | 0 | 0.0% |
| Bio, Nature & Agricultural | 0 | 0.0% |
| Physical & Health Sciences | 0 | 0.0% |
| Psychology | 0 | 0.0% |
| Social Sciences | 0 | 0.0% |
| Engineering | 0 | 0.0% |
| Multidisciplinary Studies | 0 | 0.0% |
| Science & Technology | 0 | 0.0% |
| Business | 0 | 0.0% |
| Education | 0 | 0.0% |
| Literature & Languages | 0 | 0.0% |
| Liberal Arts & History | 0 | 0.0% |
| Visual & Performing Arts | 0 | 0.0% |
| Communications | 0 | 0.0% |
| Arts & Humanities | 10 | 100.0% |
| Total | 10 | 100.0% |
Transportation & Commute in Morrison Crossroads
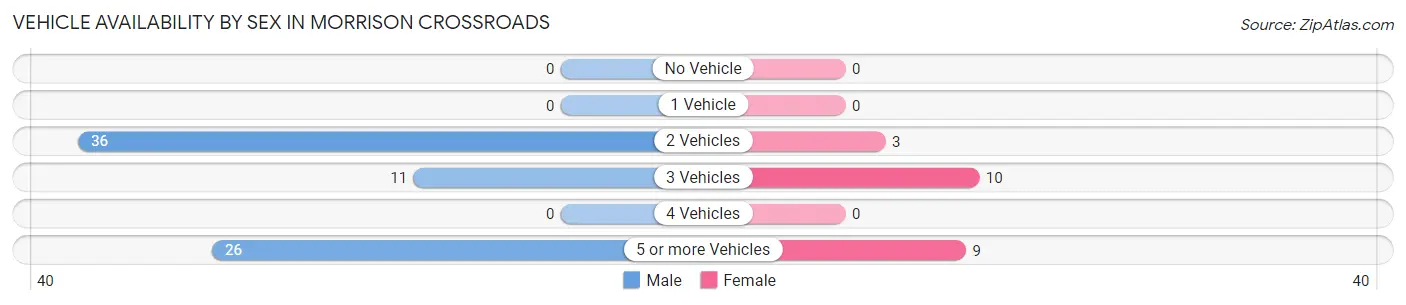
Vehicle Availability by Sex in Morrison Crossroads
The most prevalent vehicle ownership categories in Morrison Crossroads are males with 2 vehicles (36, accounting for 49.3%) and females with 2 vehicles (3, making up 163.6%).
| Vehicles Available | Male | Female |
| No Vehicle | 0 (0.0%) | 0 (0.0%) |
| 1 Vehicle | 0 (0.0%) | 0 (0.0%) |
| 2 Vehicles | 36 (49.3%) | 3 (13.6%) |
| 3 Vehicles | 11 (15.1%) | 10 (45.5%) |
| 4 Vehicles | 0 (0.0%) | 0 (0.0%) |
| 5 or more Vehicles | 26 (35.6%) | 9 (40.9%) |
| Total | 73 (100.0%) | 22 (100.0%) |
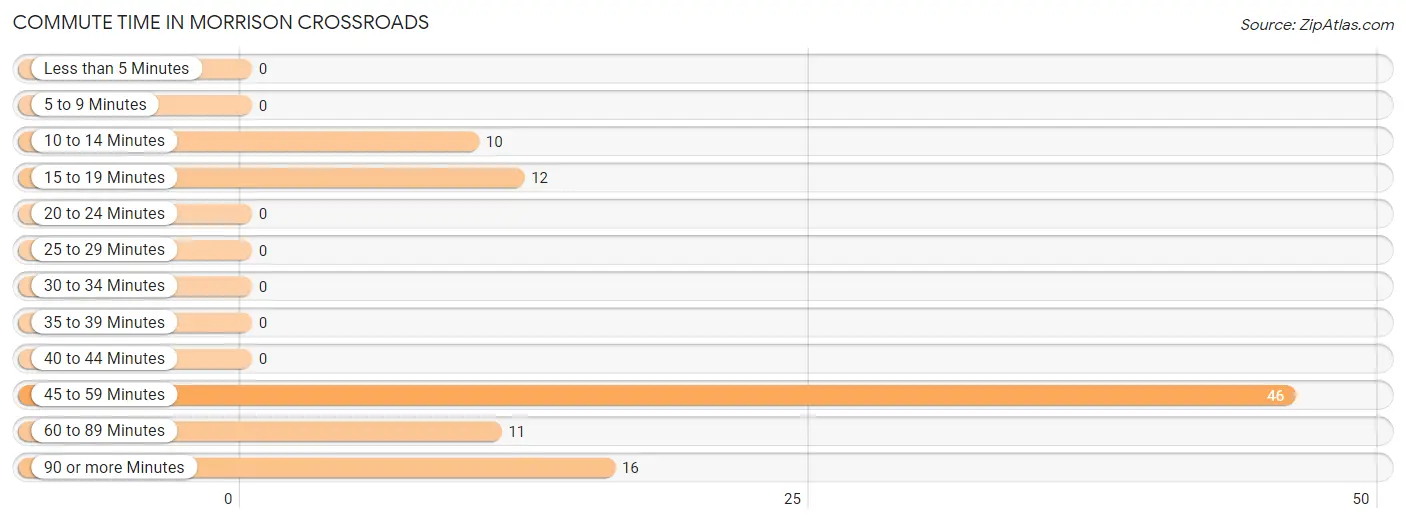
Commute Time in Morrison Crossroads
The most frequently occuring commute durations in Morrison Crossroads are 45 to 59 minutes (46 commuters, 48.4%), 90 or more minutes (16 commuters, 16.8%), and 15 to 19 minutes (12 commuters, 12.6%).
| Commute Time | # Commuters | % Commuters |
| Less than 5 Minutes | 0 | 0.0% |
| 5 to 9 Minutes | 0 | 0.0% |
| 10 to 14 Minutes | 10 | 10.5% |
| 15 to 19 Minutes | 12 | 12.6% |
| 20 to 24 Minutes | 0 | 0.0% |
| 25 to 29 Minutes | 0 | 0.0% |
| 30 to 34 Minutes | 0 | 0.0% |
| 35 to 39 Minutes | 0 | 0.0% |
| 40 to 44 Minutes | 0 | 0.0% |
| 45 to 59 Minutes | 46 | 48.4% |
| 60 to 89 Minutes | 11 | 11.6% |
| 90 or more Minutes | 16 | 16.8% |
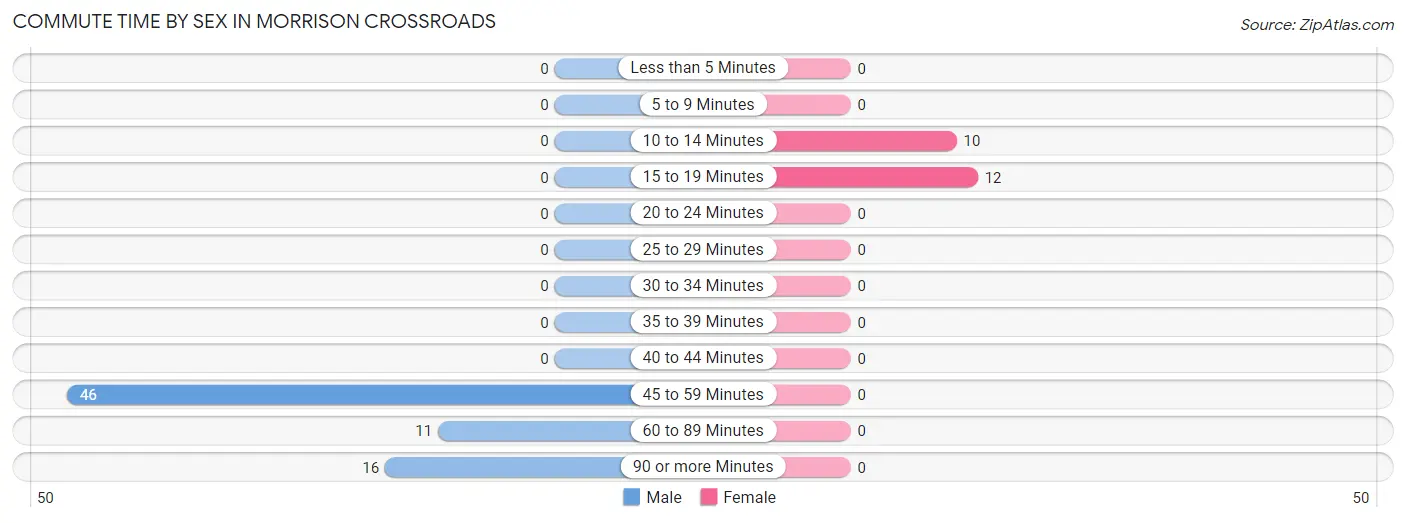
Commute Time by Sex in Morrison Crossroads
The most common commute times in Morrison Crossroads are 45 to 59 minutes (46 commuters, 63.0%) for males and 15 to 19 minutes (12 commuters, 54.5%) for females.
| Commute Time | Male | Female |
| Less than 5 Minutes | 0 (0.0%) | 0 (0.0%) |
| 5 to 9 Minutes | 0 (0.0%) | 0 (0.0%) |
| 10 to 14 Minutes | 0 (0.0%) | 10 (45.5%) |
| 15 to 19 Minutes | 0 (0.0%) | 12 (54.5%) |
| 20 to 24 Minutes | 0 (0.0%) | 0 (0.0%) |
| 25 to 29 Minutes | 0 (0.0%) | 0 (0.0%) |
| 30 to 34 Minutes | 0 (0.0%) | 0 (0.0%) |
| 35 to 39 Minutes | 0 (0.0%) | 0 (0.0%) |
| 40 to 44 Minutes | 0 (0.0%) | 0 (0.0%) |
| 45 to 59 Minutes | 46 (63.0%) | 0 (0.0%) |
| 60 to 89 Minutes | 11 (15.1%) | 0 (0.0%) |
| 90 or more Minutes | 16 (21.9%) | 0 (0.0%) |
Time of Departure to Work by Sex in Morrison Crossroads
The most frequent times of departure to work in Morrison Crossroads are 12:00 AM to 4:59 AM (46, 63.0%) for males and 7:00 AM to 7:29 AM (10, 45.5%) for females.
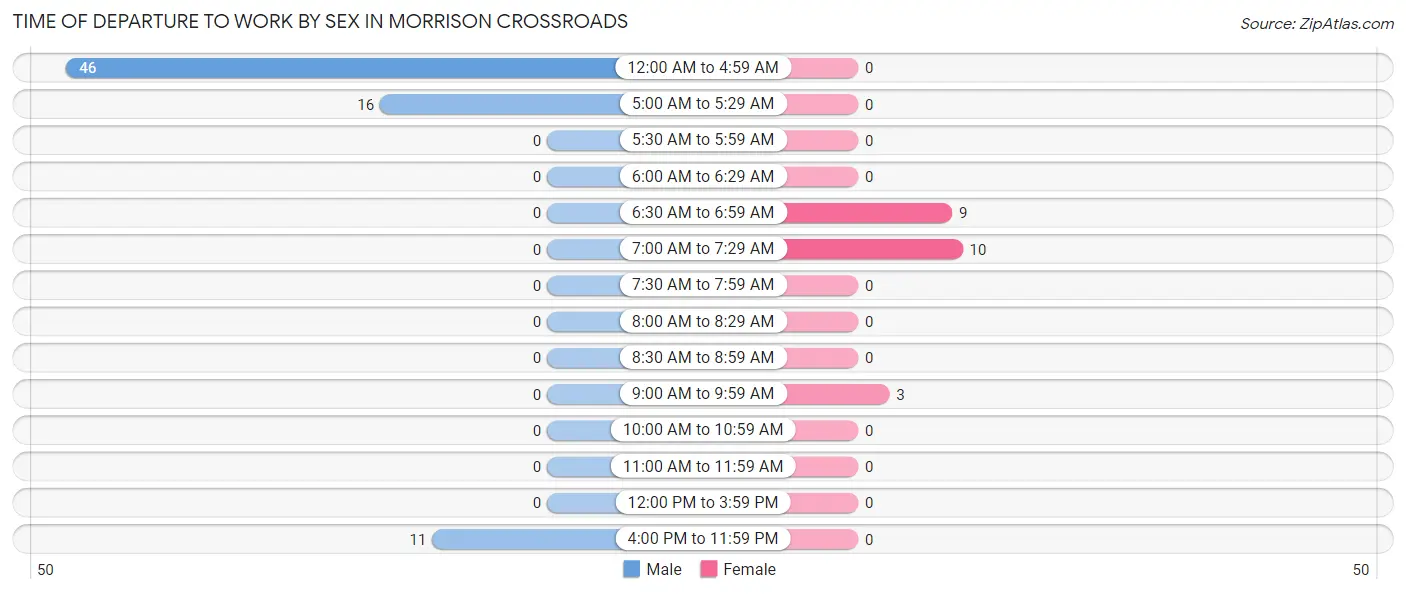
| Time of Departure | Male | Female |
| 12:00 AM to 4:59 AM | 46 (63.0%) | 0 (0.0%) |
| 5:00 AM to 5:29 AM | 16 (21.9%) | 0 (0.0%) |
| 5:30 AM to 5:59 AM | 0 (0.0%) | 0 (0.0%) |
| 6:00 AM to 6:29 AM | 0 (0.0%) | 0 (0.0%) |
| 6:30 AM to 6:59 AM | 0 (0.0%) | 9 (40.9%) |
| 7:00 AM to 7:29 AM | 0 (0.0%) | 10 (45.5%) |
| 7:30 AM to 7:59 AM | 0 (0.0%) | 0 (0.0%) |
| 8:00 AM to 8:29 AM | 0 (0.0%) | 0 (0.0%) |
| 8:30 AM to 8:59 AM | 0 (0.0%) | 0 (0.0%) |
| 9:00 AM to 9:59 AM | 0 (0.0%) | 3 (13.6%) |
| 10:00 AM to 10:59 AM | 0 (0.0%) | 0 (0.0%) |
| 11:00 AM to 11:59 AM | 0 (0.0%) | 0 (0.0%) |
| 12:00 PM to 3:59 PM | 0 (0.0%) | 0 (0.0%) |
| 4:00 PM to 11:59 PM | 11 (15.1%) | 0 (0.0%) |
| Total | 73 (100.0%) | 22 (100.0%) |
Housing Occupancy in Morrison Crossroads
Occupancy by Ownership in Morrison Crossroads
Of the total 72 dwellings in Morrison Crossroads, owner-occupied units account for 61 (84.7%), while renter-occupied units make up 11 (15.3%).
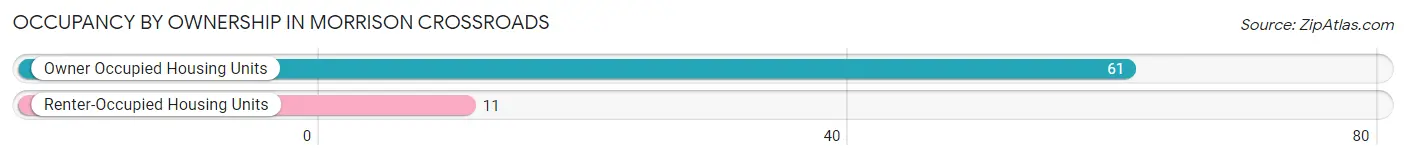
| Occupancy | # Housing Units | % Housing Units |
| Owner Occupied Housing Units | 61 | 84.7% |
| Renter-Occupied Housing Units | 11 | 15.3% |
| Total Occupied Housing Units | 72 | 100.0% |
Occupancy by Household Size in Morrison Crossroads
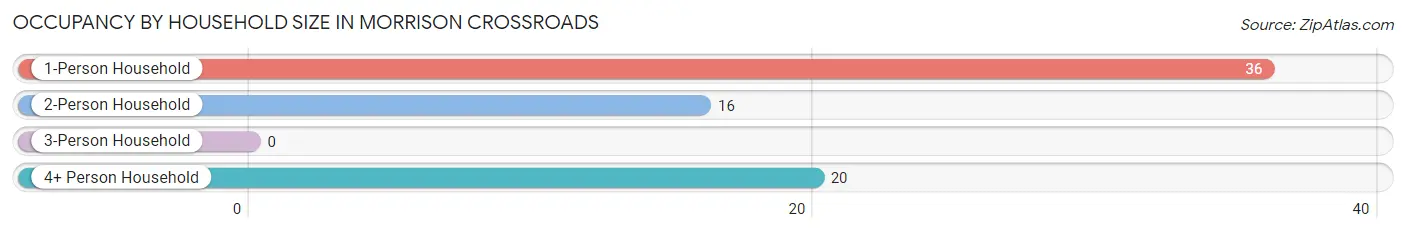
| Household Size | # Housing Units | % Housing Units |
| 1-Person Household | 36 | 50.0% |
| 2-Person Household | 16 | 22.2% |
| 3-Person Household | 0 | 0.0% |
| 4+ Person Household | 20 | 27.8% |
| Total Housing Units | 72 | 100.0% |
Occupancy by Ownership by Household Size in Morrison Crossroads
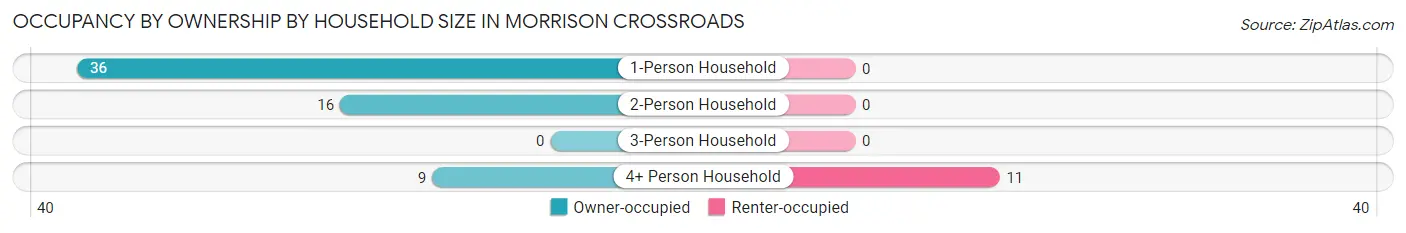
| Household Size | Owner-occupied | Renter-occupied |
| 1-Person Household | 36 (100.0%) | 0 (0.0%) |
| 2-Person Household | 16 (100.0%) | 0 (0.0%) |
| 3-Person Household | 0 (0.0%) | 0 (0.0%) |
| 4+ Person Household | 9 (45.0%) | 11 (55.0%) |
| Total Housing Units | 61 (84.7%) | 11 (15.3%) |
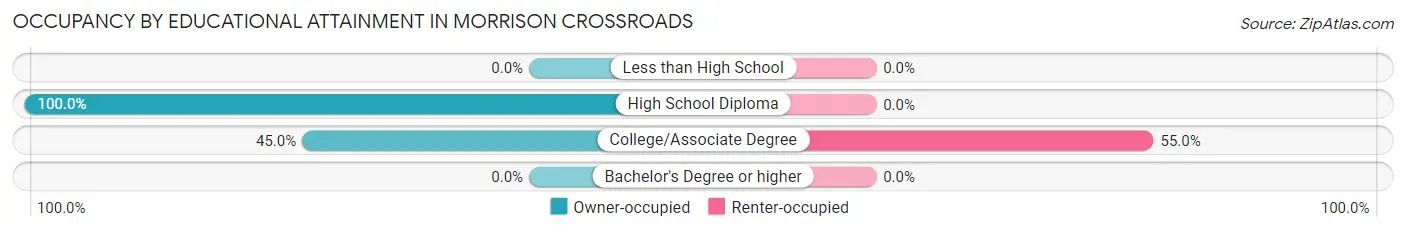
Occupancy by Educational Attainment in Morrison Crossroads
| Household Size | Owner-occupied | Renter-occupied |
| Less than High School | 0 (0.0%) | 0 (0.0%) |
| High School Diploma | 52 (100.0%) | 0 (0.0%) |
| College/Associate Degree | 9 (45.0%) | 11 (55.0%) |
| Bachelor's Degree or higher | 0 (0.0%) | 0 (0.0%) |
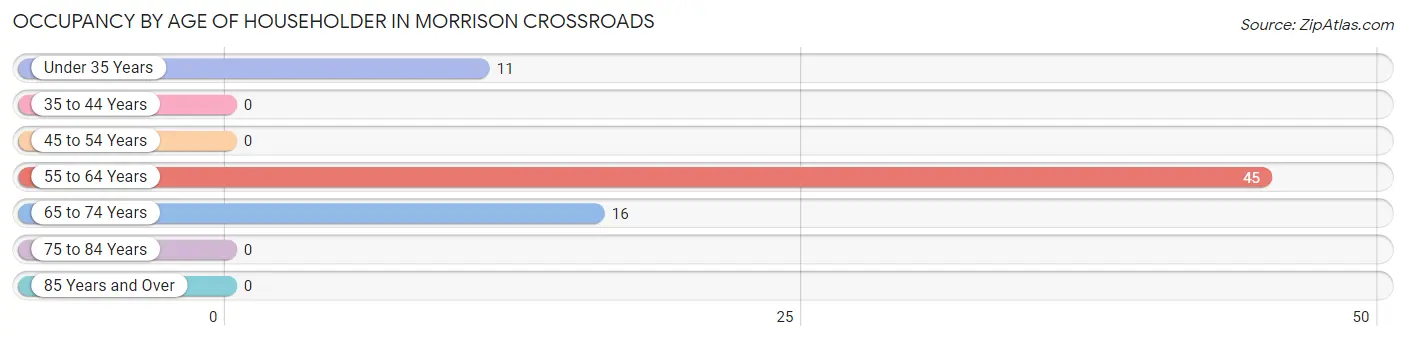
Occupancy by Age of Householder in Morrison Crossroads
| Age Bracket | # Households | % Households |
| Under 35 Years | 11 | 15.3% |
| 35 to 44 Years | 0 | 0.0% |
| 45 to 54 Years | 0 | 0.0% |
| 55 to 64 Years | 45 | 62.5% |
| 65 to 74 Years | 16 | 22.2% |
| 75 to 84 Years | 0 | 0.0% |
| 85 Years and Over | 0 | 0.0% |
| Total | 72 | 100.0% |
Housing Finances in Morrison Crossroads
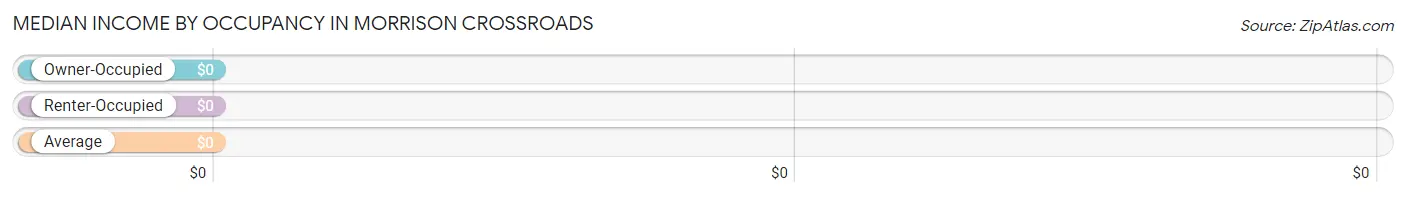
Median Income by Occupancy in Morrison Crossroads
| Occupancy Type | # Households | Median Income |
| Owner-Occupied | 61 (84.7%) | $0 |
| Renter-Occupied | 11 (15.3%) | $0 |
| Average | 72 (100.0%) | $0 |
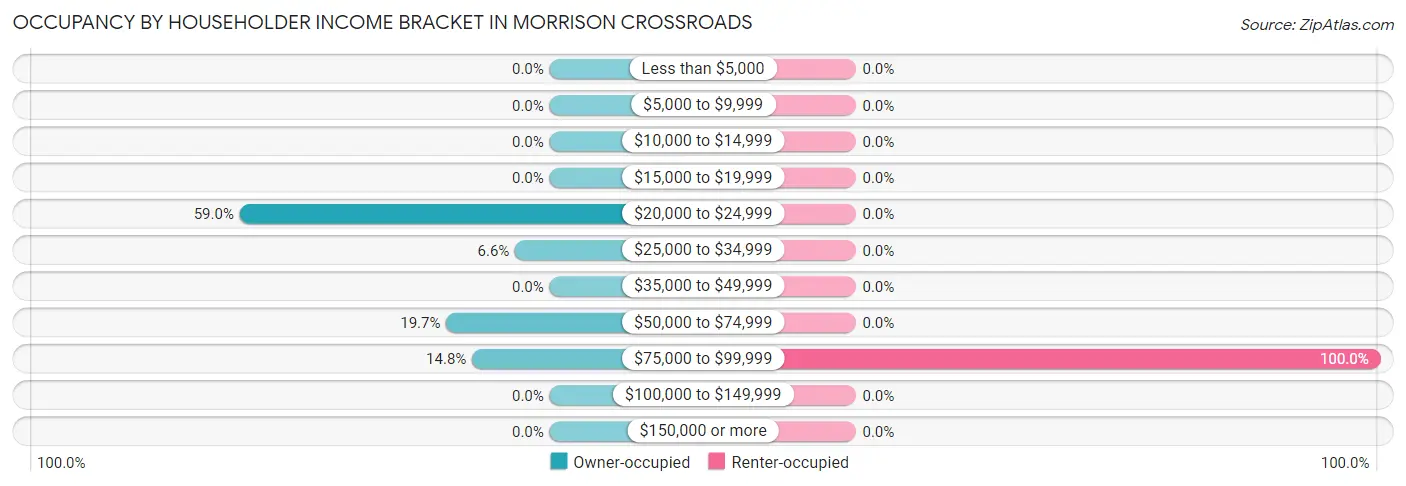
Occupancy by Householder Income Bracket in Morrison Crossroads
| Income Bracket | Owner-occupied | Renter-occupied |
| Less than $5,000 | 0 (0.0%) | 0 (0.0%) |
| $5,000 to $9,999 | 0 (0.0%) | 0 (0.0%) |
| $10,000 to $14,999 | 0 (0.0%) | 0 (0.0%) |
| $15,000 to $19,999 | 0 (0.0%) | 0 (0.0%) |
| $20,000 to $24,999 | 36 (59.0%) | 0 (0.0%) |
| $25,000 to $34,999 | 4 (6.6%) | 0 (0.0%) |
| $35,000 to $49,999 | 0 (0.0%) | 0 (0.0%) |
| $50,000 to $74,999 | 12 (19.7%) | 0 (0.0%) |
| $75,000 to $99,999 | 9 (14.7%) | 11 (100.0%) |
| $100,000 to $149,999 | 0 (0.0%) | 0 (0.0%) |
| $150,000 or more | 0 (0.0%) | 0 (0.0%) |
| Total | 61 (100.0%) | 11 (100.0%) |
Monthly Housing Cost Tiers in Morrison Crossroads
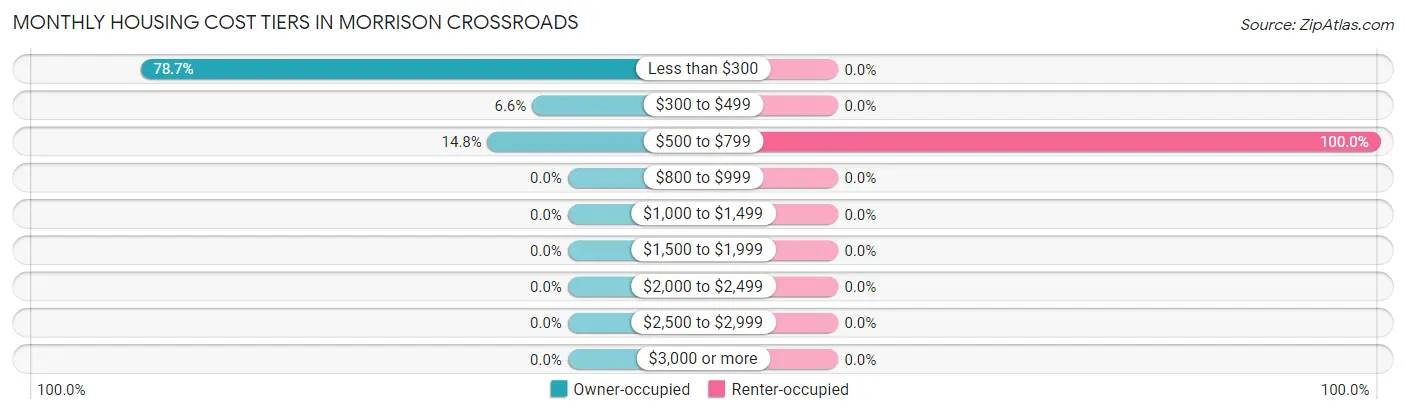
| Monthly Cost | Owner-occupied | Renter-occupied |
| Less than $300 | 48 (78.7%) | 0 (0.0%) |
| $300 to $499 | 4 (6.6%) | 0 (0.0%) |
| $500 to $799 | 9 (14.7%) | 11 (100.0%) |
| $800 to $999 | 0 (0.0%) | 0 (0.0%) |
| $1,000 to $1,499 | 0 (0.0%) | 0 (0.0%) |
| $1,500 to $1,999 | 0 (0.0%) | 0 (0.0%) |
| $2,000 to $2,499 | 0 (0.0%) | 0 (0.0%) |
| $2,500 to $2,999 | 0 (0.0%) | 0 (0.0%) |
| $3,000 or more | 0 (0.0%) | 0 (0.0%) |
| Total | 61 (100.0%) | 11 (100.0%) |
Physical Housing Characteristics in Morrison Crossroads
Housing Structures in Morrison Crossroads
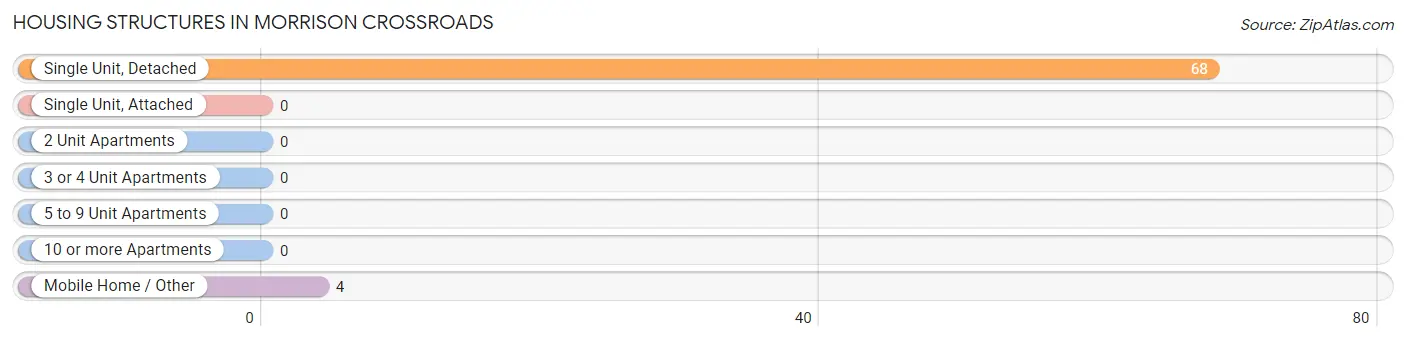
| Structure Type | # Housing Units | % Housing Units |
| Single Unit, Detached | 68 | 94.4% |
| Single Unit, Attached | 0 | 0.0% |
| 2 Unit Apartments | 0 | 0.0% |
| 3 or 4 Unit Apartments | 0 | 0.0% |
| 5 to 9 Unit Apartments | 0 | 0.0% |
| 10 or more Apartments | 0 | 0.0% |
| Mobile Home / Other | 4 | 5.6% |
| Total | 72 | 100.0% |
Housing Structures by Occupancy in Morrison Crossroads
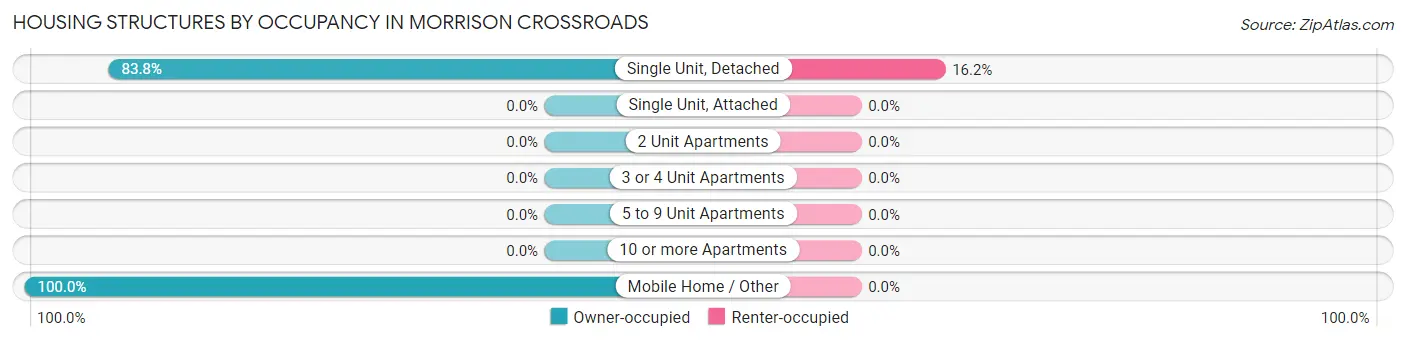
| Structure Type | Owner-occupied | Renter-occupied |
| Single Unit, Detached | 57 (83.8%) | 11 (16.2%) |
| Single Unit, Attached | 0 (0.0%) | 0 (0.0%) |
| 2 Unit Apartments | 0 (0.0%) | 0 (0.0%) |
| 3 or 4 Unit Apartments | 0 (0.0%) | 0 (0.0%) |
| 5 to 9 Unit Apartments | 0 (0.0%) | 0 (0.0%) |
| 10 or more Apartments | 0 (0.0%) | 0 (0.0%) |
| Mobile Home / Other | 4 (100.0%) | 0 (0.0%) |
| Total | 61 (84.7%) | 11 (15.3%) |
Housing Structures by Number of Rooms in Morrison Crossroads
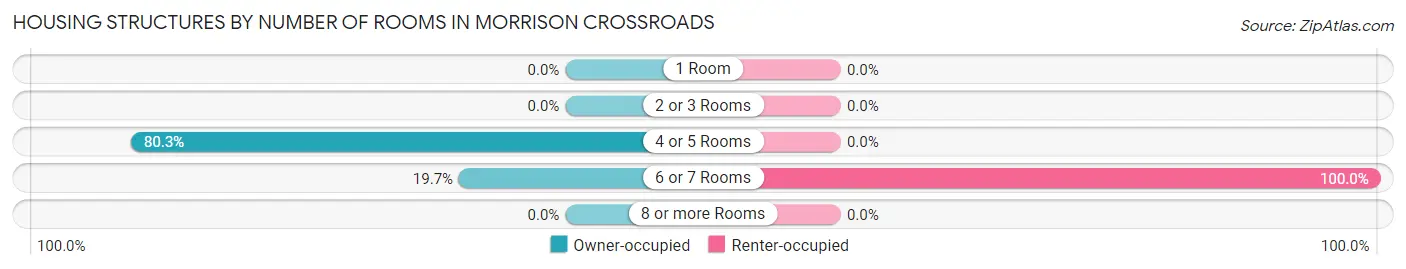
| Number of Rooms | Owner-occupied | Renter-occupied |
| 1 Room | 0 (0.0%) | 0 (0.0%) |
| 2 or 3 Rooms | 0 (0.0%) | 0 (0.0%) |
| 4 or 5 Rooms | 49 (80.3%) | 0 (0.0%) |
| 6 or 7 Rooms | 12 (19.7%) | 11 (100.0%) |
| 8 or more Rooms | 0 (0.0%) | 0 (0.0%) |
| Total | 61 (100.0%) | 11 (100.0%) |
Housing Structure by Heating Type in Morrison Crossroads
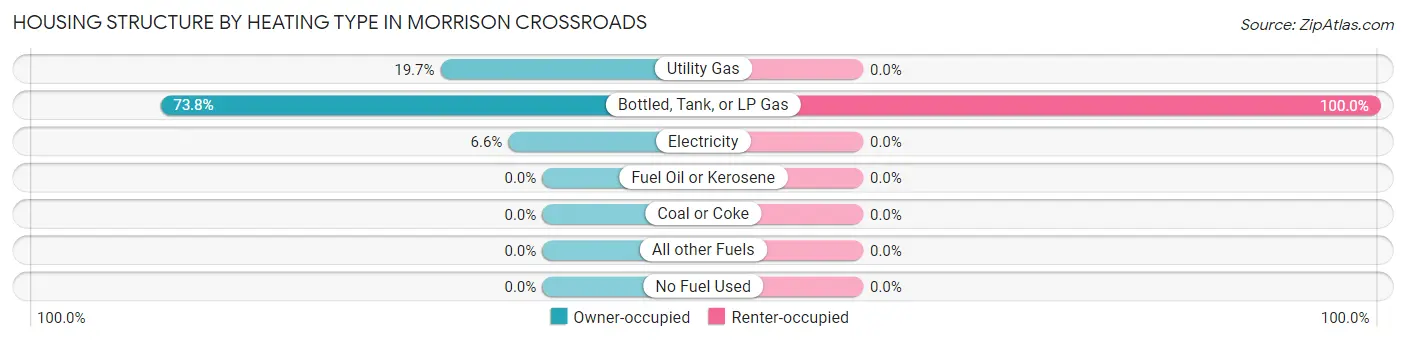
| Heating Type | Owner-occupied | Renter-occupied |
| Utility Gas | 12 (19.7%) | 0 (0.0%) |
| Bottled, Tank, or LP Gas | 45 (73.8%) | 11 (100.0%) |
| Electricity | 4 (6.6%) | 0 (0.0%) |
| Fuel Oil or Kerosene | 0 (0.0%) | 0 (0.0%) |
| Coal or Coke | 0 (0.0%) | 0 (0.0%) |
| All other Fuels | 0 (0.0%) | 0 (0.0%) |
| No Fuel Used | 0 (0.0%) | 0 (0.0%) |
| Total | 61 (100.0%) | 11 (100.0%) |
Household Vehicle Usage in Morrison Crossroads
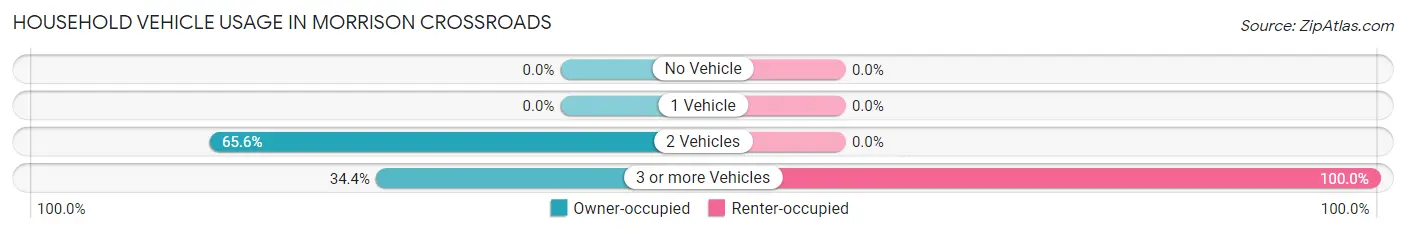
| Vehicles per Household | Owner-occupied | Renter-occupied |
| No Vehicle | 0 (0.0%) | 0 (0.0%) |
| 1 Vehicle | 0 (0.0%) | 0 (0.0%) |
| 2 Vehicles | 40 (65.6%) | 0 (0.0%) |
| 3 or more Vehicles | 21 (34.4%) | 11 (100.0%) |
| Total | 61 (100.0%) | 11 (100.0%) |
Real Estate & Mortgages in Morrison Crossroads
Real Estate and Mortgage Overview in Morrison Crossroads
| Characteristic | Without Mortgage | With Mortgage |
| Housing Units | 61 | 0 |
| Median Property Value | $218,200 | $0 |
| Median Household Income | - | - |
| Monthly Housing Costs | $242 | $0 |
| Real Estate Taxes | - | - |
Property Value by Mortgage Status in Morrison Crossroads
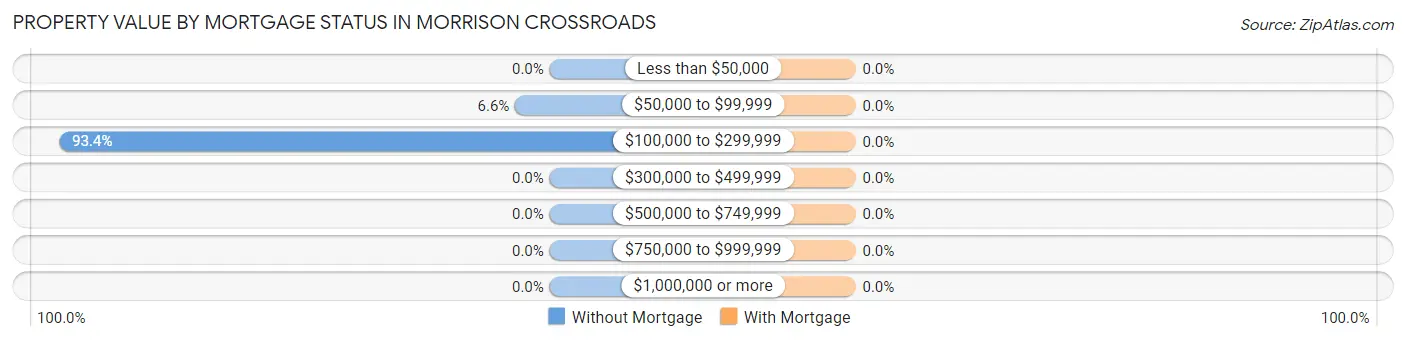
| Property Value | Without Mortgage | With Mortgage |
| Less than $50,000 | 0 (0.0%) | 0 (0.0%) |
| $50,000 to $99,999 | 4 (6.6%) | 0 (0.0%) |
| $100,000 to $299,999 | 57 (93.4%) | 0 (0.0%) |
| $300,000 to $499,999 | 0 (0.0%) | 0 (0.0%) |
| $500,000 to $749,999 | 0 (0.0%) | 0 (0.0%) |
| $750,000 to $999,999 | 0 (0.0%) | 0 (0.0%) |
| $1,000,000 or more | 0 (0.0%) | 0 (0.0%) |
| Total | 61 (100.0%) | 0 (0.0%) |
Household Income by Mortgage Status in Morrison Crossroads
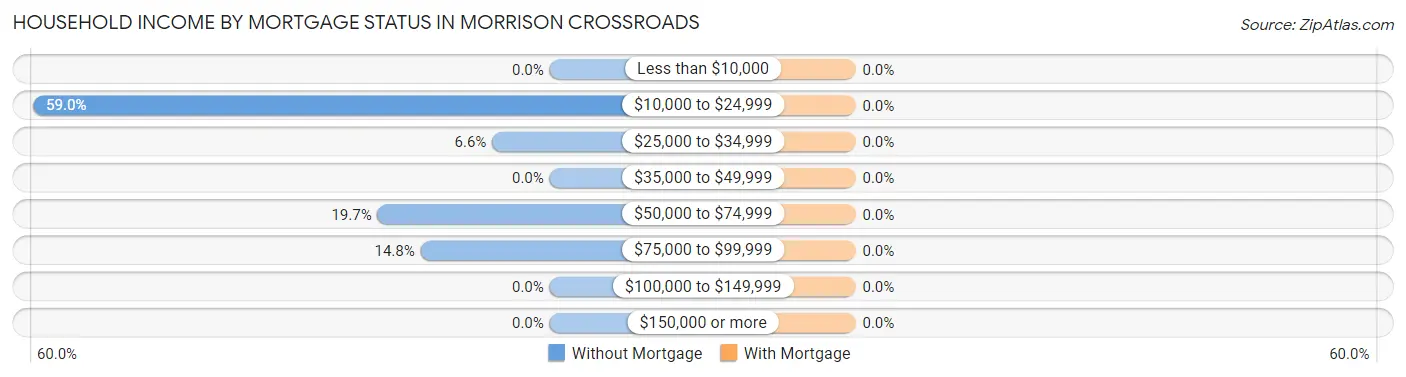
| Household Income | Without Mortgage | With Mortgage |
| Less than $10,000 | 0 (0.0%) | 0 (0.0%) |
| $10,000 to $24,999 | 36 (59.0%) | 0 (0.0%) |
| $25,000 to $34,999 | 4 (6.6%) | 0 (0.0%) |
| $35,000 to $49,999 | 0 (0.0%) | 0 (0.0%) |
| $50,000 to $74,999 | 12 (19.7%) | 0 (0.0%) |
| $75,000 to $99,999 | 9 (14.7%) | 0 (0.0%) |
| $100,000 to $149,999 | 0 (0.0%) | 0 (0.0%) |
| $150,000 or more | 0 (0.0%) | 0 (0.0%) |
| Total | 61 (100.0%) | 0 (0.0%) |
Property Value to Household Income Ratio in Morrison Crossroads
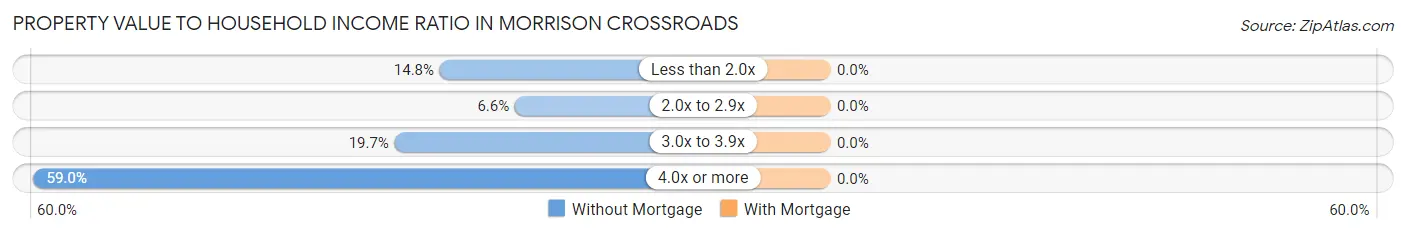
| Value-to-Income Ratio | Without Mortgage | With Mortgage |
| Less than 2.0x | 9 (14.7%) | 0 (0.0%) |
| 2.0x to 2.9x | 4 (6.6%) | 0 (0.0%) |
| 3.0x to 3.9x | 12 (19.7%) | 0 (0.0%) |
| 4.0x or more | 36 (59.0%) | 0 (0.0%) |
| Total | 61 (100.0%) | 0 (0.0%) |
Real Estate Taxes by Mortgage Status in Morrison Crossroads
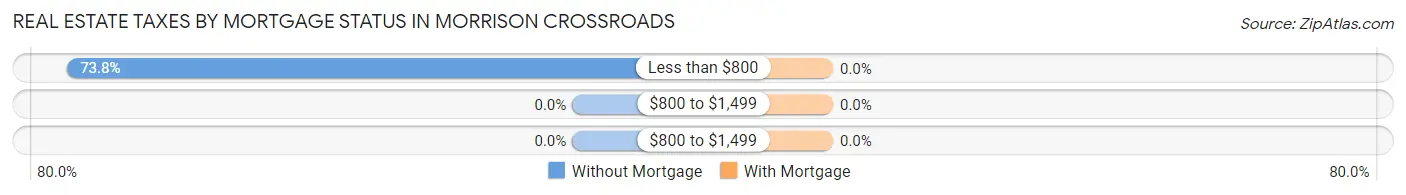
| Property Taxes | Without Mortgage | With Mortgage |
| Less than $800 | 45 (73.8%) | 0 (0.0%) |
| $800 to $1,499 | 0 (0.0%) | 0 (0.0%) |
| $800 to $1,499 | 0 (0.0%) | 0 (0.0%) |
| Total | 61 (100.0%) | 0 (0.0%) |
Health & Disability in Morrison Crossroads
Health Insurance Coverage by Age in Morrison Crossroads
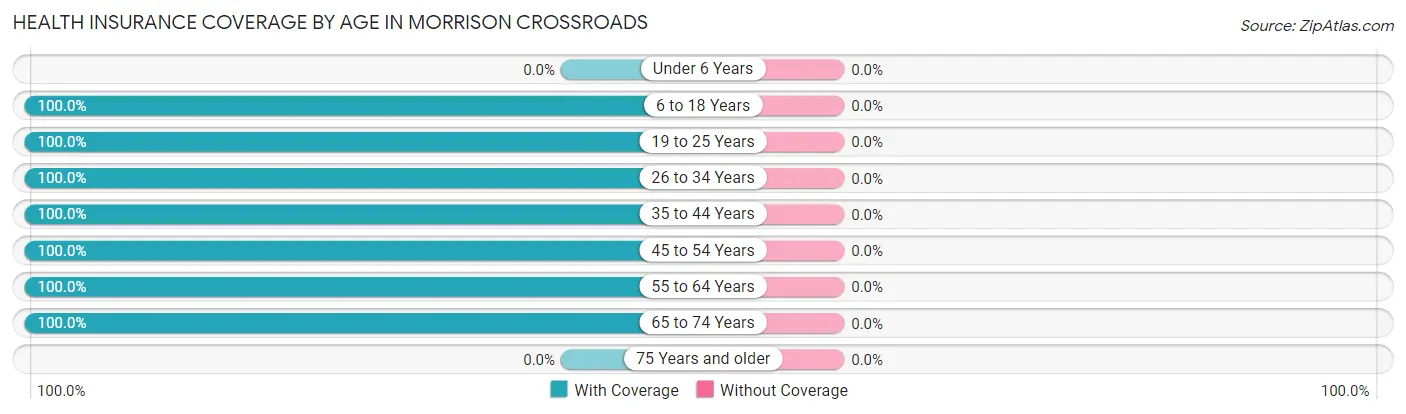
| Age Bracket | With Coverage | Without Coverage |
| Under 6 Years | 0 (0.0%) | 0 (0.0%) |
| 6 to 18 Years | 14 (100.0%) | 0 (0.0%) |
| 19 to 25 Years | 18 (100.0%) | 0 (0.0%) |
| 26 to 34 Years | 35 (100.0%) | 0 (0.0%) |
| 35 to 44 Years | 16 (100.0%) | 0 (0.0%) |
| 45 to 54 Years | 3 (100.0%) | 0 (0.0%) |
| 55 to 64 Years | 55 (100.0%) | 0 (0.0%) |
| 65 to 74 Years | 28 (100.0%) | 0 (0.0%) |
| 75 Years and older | 0 (0.0%) | 0 (0.0%) |
| Total | 169 (100.0%) | 0 (0.0%) |
Health Insurance Coverage by Citizenship Status in Morrison Crossroads
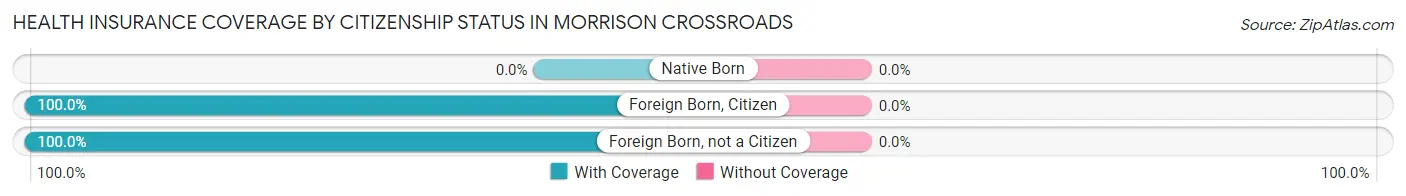
| Citizenship Status | With Coverage | Without Coverage |
| Native Born | 0 (0.0%) | 0 (0.0%) |
| Foreign Born, Citizen | 14 (100.0%) | 0 (0.0%) |
| Foreign Born, not a Citizen | 18 (100.0%) | 0 (0.0%) |
Health Insurance Coverage by Household Income in Morrison Crossroads
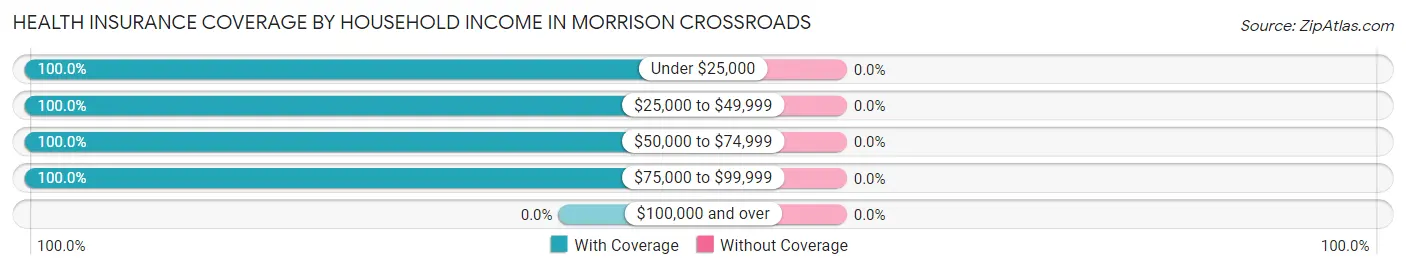
| Household Income | With Coverage | Without Coverage |
| Under $25,000 | 36 (100.0%) | 0 (0.0%) |
| $25,000 to $49,999 | 7 (100.0%) | 0 (0.0%) |
| $50,000 to $74,999 | 24 (100.0%) | 0 (0.0%) |
| $75,000 to $99,999 | 102 (100.0%) | 0 (0.0%) |
| $100,000 and over | 0 (0.0%) | 0 (0.0%) |
Public vs Private Health Insurance Coverage by Age in Morrison Crossroads
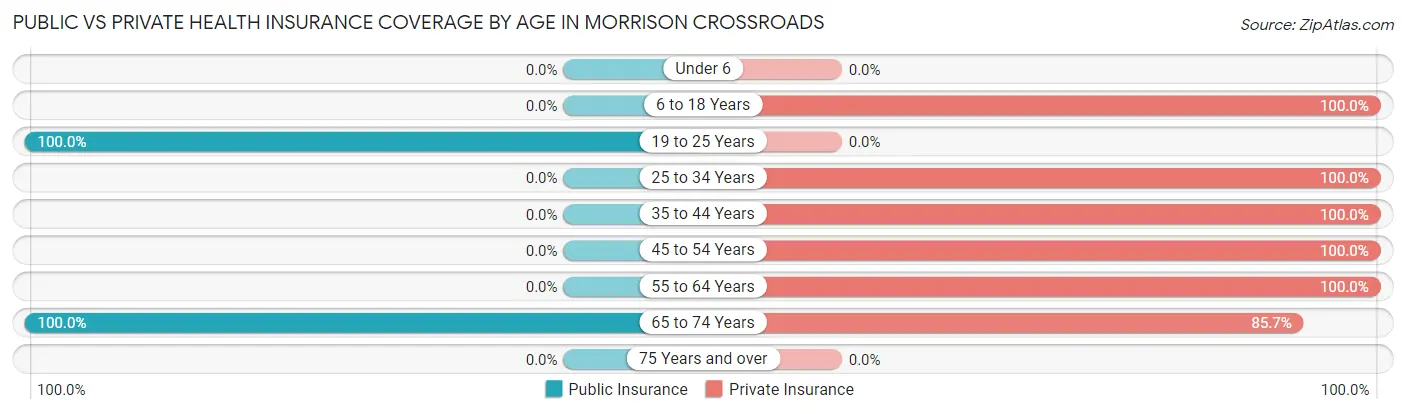
| Age Bracket | Public Insurance | Private Insurance |
| Under 6 | 0 (0.0%) | 0 (0.0%) |
| 6 to 18 Years | 0 (0.0%) | 14 (100.0%) |
| 19 to 25 Years | 18 (100.0%) | 0 (0.0%) |
| 25 to 34 Years | 0 (0.0%) | 35 (100.0%) |
| 35 to 44 Years | 0 (0.0%) | 16 (100.0%) |
| 45 to 54 Years | 0 (0.0%) | 3 (100.0%) |
| 55 to 64 Years | 0 (0.0%) | 55 (100.0%) |
| 65 to 74 Years | 28 (100.0%) | 24 (85.7%) |
| 75 Years and over | 0 (0.0%) | 0 (0.0%) |
| Total | 46 (27.2%) | 147 (87.0%) |
Disability Status by Sex by Age in Morrison Crossroads
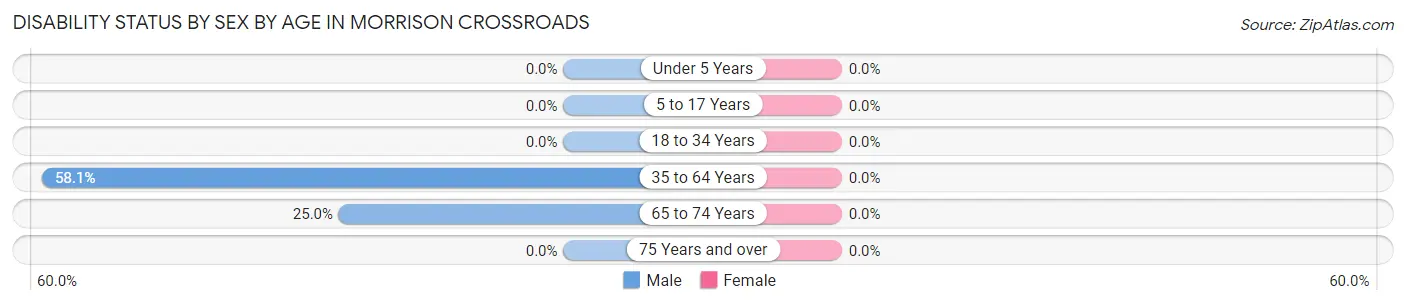
| Age Bracket | Male | Female |
| Under 5 Years | 0 (0.0%) | 0 (0.0%) |
| 5 to 17 Years | 0 (0.0%) | 0 (0.0%) |
| 18 to 34 Years | 0 (0.0%) | 0 (0.0%) |
| 35 to 64 Years | 36 (58.1%) | 0 (0.0%) |
| 65 to 74 Years | 4 (25.0%) | 0 (0.0%) |
| 75 Years and over | 0 (0.0%) | 0 (0.0%) |
Disability Class by Sex by Age in Morrison Crossroads
Disability Class: Hearing Difficulty

| Age Bracket | Male | Female |
| Under 5 Years | 0 (0.0%) | 0 (0.0%) |
| 5 to 17 Years | 0 (0.0%) | 0 (0.0%) |
| 18 to 34 Years | 0 (0.0%) | 0 (0.0%) |
| 35 to 64 Years | 36 (58.1%) | 0 (0.0%) |
| 65 to 74 Years | 0 (0.0%) | 0 (0.0%) |
| 75 Years and over | 0 (0.0%) | 0 (0.0%) |
Disability Class: Vision Difficulty
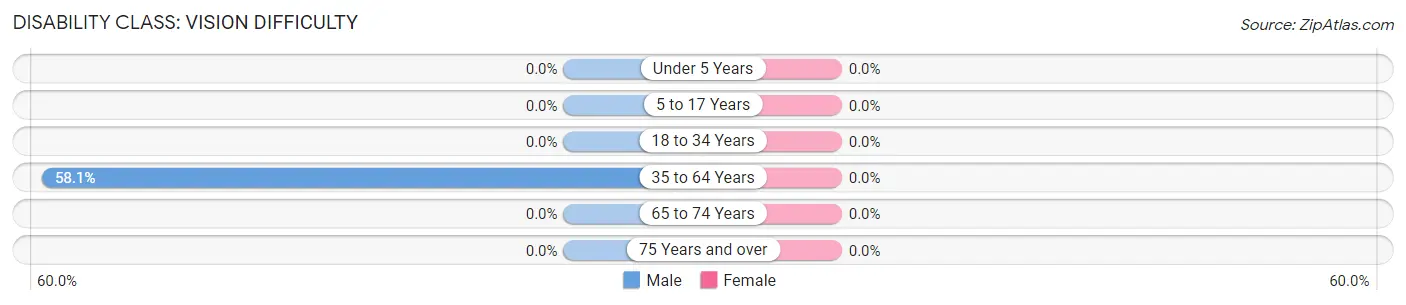
| Age Bracket | Male | Female |
| Under 5 Years | 0 (0.0%) | 0 (0.0%) |
| 5 to 17 Years | 0 (0.0%) | 0 (0.0%) |
| 18 to 34 Years | 0 (0.0%) | 0 (0.0%) |
| 35 to 64 Years | 36 (58.1%) | 0 (0.0%) |
| 65 to 74 Years | 0 (0.0%) | 0 (0.0%) |
| 75 Years and over | 0 (0.0%) | 0 (0.0%) |
Disability Class: Cognitive Difficulty
| Age Bracket | Male | Female |
| 5 to 17 Years | 0 (0.0%) | 0 (0.0%) |
| 18 to 34 Years | 0 (0.0%) | 0 (0.0%) |
| 35 to 64 Years | 0 (0.0%) | 0 (0.0%) |
| 65 to 74 Years | 0 (0.0%) | 0 (0.0%) |
| 75 Years and over | 0 (0.0%) | 0 (0.0%) |
Disability Class: Ambulatory Difficulty
| Age Bracket | Male | Female |
| 5 to 17 Years | 0 (0.0%) | 0 (0.0%) |
| 18 to 34 Years | 0 (0.0%) | 0 (0.0%) |
| 35 to 64 Years | 0 (0.0%) | 0 (0.0%) |
| 65 to 74 Years | 4 (25.0%) | 0 (0.0%) |
| 75 Years and over | 0 (0.0%) | 0 (0.0%) |
Disability Class: Self-Care Difficulty
| Age Bracket | Male | Female |
| 5 to 17 Years | 0 (0.0%) | 0 (0.0%) |
| 18 to 34 Years | 0 (0.0%) | 0 (0.0%) |
| 35 to 64 Years | 0 (0.0%) | 0 (0.0%) |
| 65 to 74 Years | 0 (0.0%) | 0 (0.0%) |
| 75 Years and over | 0 (0.0%) | 0 (0.0%) |
Technology Access in Morrison Crossroads
Computing Device Access in Morrison Crossroads
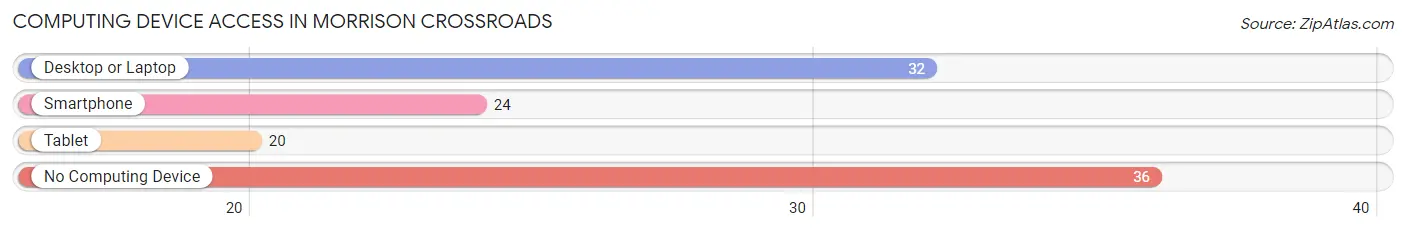
| Device Type | # Households | % Households |
| Desktop or Laptop | 32 | 44.4% |
| Smartphone | 24 | 33.3% |
| Tablet | 20 | 27.8% |
| No Computing Device | 36 | 50.0% |
| Total | 72 | 100.0% |
Internet Access in Morrison Crossroads

| Internet Type | # Households | % Households |
| Dial-Up Internet | 0 | 0.0% |
| Broadband Home | 32 | 44.4% |
| Cellular Data Only | 0 | 0.0% |
| Satellite Internet | 0 | 0.0% |
| No Internet | 40 | 55.6% |
| Total | 72 | 100.0% |
Morrison Crossroads Summary
Morrison Crossroads is an unincorporated community located in the southeastern corner of Crenshaw County, Alabama. It is situated at the intersection of U.S. Route 29 and Alabama State Route 134, approximately 10 miles south of Luverne, the county seat. The community is named for the Morrison family, who settled in the area in the early 19th century.
History
The area that is now Morrison Crossroads was first settled by the Morrison family in the early 19th century. The family had migrated from North Carolina and established a homestead in the area. The community was officially established in 1845 when the first post office was opened. The post office was named after the Morrison family and the crossroads at which it was located.
The community grew slowly over the years, but remained largely rural and agricultural. In the late 19th century, the area was home to several small farms and a few stores. The community also had a school, which was attended by local children.
In the early 20th century, the community began to grow more rapidly. The construction of U.S. Route 29 in the 1920s brought more people and businesses to the area. The community also benefited from the construction of the nearby Crenshaw County Airport in the 1940s.
Geography
Morrison Crossroads is located in the southeastern corner of Crenshaw County, Alabama. It is situated at the intersection of U.S. Route 29 and Alabama State Route 134, approximately 10 miles south of Luverne, the county seat. The community is located in the Coastal Plain region of the state, and is characterized by flat terrain and sandy soils.
The climate of the area is humid subtropical, with hot, humid summers and mild winters. The average annual temperature is around 68°F, and the average annual precipitation is around 50 inches.
Economy
The economy of Morrison Crossroads is largely based on agriculture. The area is home to several small farms, which produce a variety of crops, including cotton, corn, soybeans, and peanuts. The community also has several small businesses, including convenience stores, gas stations, and restaurants.
Demographics
As of the 2010 census, the population of Morrison Crossroads was 1,093. The racial makeup of the community was 79.3% White, 18.2% African American, 0.7% Native American, 0.3% Asian, and 1.5% from other races. The median household income was $30,938, and the median family income was $37,813.
The population of Morrison Crossroads is largely rural and spread out over a large area. The community is served by the Crenshaw County School District, which operates several elementary, middle, and high schools in the area. The community also has several churches, including Baptist, Methodist, and Pentecostal congregations.
Common Questions
What is Per Capita Income in Morrison Crossroads?
Per Capita income in Morrison Crossroads is $22,376.
What is the Median Family Income in Morrison Crossroads?
Median Family Income in Morrison Crossroads is $83,056.
What is Inequality or Gini Index in Morrison Crossroads?
Inequality or Gini Index in Morrison Crossroads is 0.31.
What is the Total Population of Morrison Crossroads?
Total Population of Morrison Crossroads is 169.
What is the Total Male Population of Morrison Crossroads?
Total Male Population of Morrison Crossroads is 89.
What is the Total Female Population of Morrison Crossroads?
Total Female Population of Morrison Crossroads is 80.
What is the Ratio of Males per 100 Females in Morrison Crossroads?
There are 111.25 Males per 100 Females in Morrison Crossroads.
What is the Ratio of Females per 100 Males in Morrison Crossroads?
There are 89.89 Females per 100 Males in Morrison Crossroads.
What is the Median Population Age in Morrison Crossroads?
Median Population Age in Morrison Crossroads is 53.5 Years.
What is the Average Family Size in Morrison Crossroads
Average Family Size in Morrison Crossroads is 3.2 People.
What is the Average Household Size in Morrison Crossroads
Average Household Size in Morrison Crossroads is 2.4 People.
How Large is the Labor Force in Morrison Crossroads?
There are 95 People in the Labor Forcein in Morrison Crossroads.
What is the Percentage of People in the Labor Force in Morrison Crossroads?
61.3% of People are in the Labor Force in Morrison Crossroads.