Nectar, AL Map & Demographics
Nectar Map
Nectar Overview
$19,072
PER CAPITA INCOME
$48,056
AVG FAMILY INCOME
$42,396
AVG HOUSEHOLD INCOME
12.5%
WAGE / INCOME GAP [ % ]
87.5¢/ $1
WAGE / INCOME GAP [ $ ]
0.38
INEQUALITY / GINI INDEX
476
TOTAL POPULATION
212
MALE POPULATION
264
FEMALE POPULATION
80.30
MALES / 100 FEMALES
124.53
FEMALES / 100 MALES
30.7
MEDIAN AGE
3.9
AVG FAMILY SIZE
3.4
AVG HOUSEHOLD SIZE
200
LABOR FORCE [ PEOPLE ]
63.1%
PERCENT IN LABOR FORCE
9.5%
UNEMPLOYMENT RATE
Nectar Area Codes
Income in Nectar
Income Overview in Nectar
Per Capita Income in Nectar is $19,072, while median incomes of families and households are $48,056 and $42,396 respectively.
| Characteristic | Number | Measure |
| Per Capita Income | 476 | $19,072 |
| Median Family Income | 110 | $48,056 |
| Mean Family Income | 110 | $65,736 |
| Median Household Income | 141 | $42,396 |
| Mean Household Income | 141 | $59,970 |
| Income Deficit | 110 | $0 |
| Wage / Income Gap (%) | 476 | 12.51% |
| Wage / Income Gap ($) | 476 | 87.49¢ per $1 |
| Gini / Inequality Index | 476 | 0.38 |
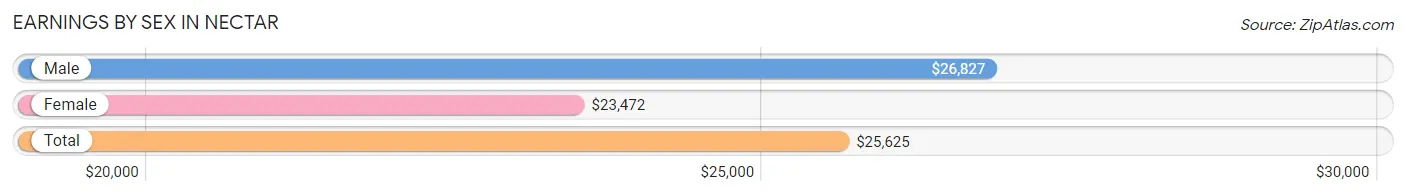
Earnings by Sex in Nectar
Average Earnings in Nectar are $25,625, $26,827 for men and $23,472 for women, a difference of 12.5%.
| Sex | Number | Average Earnings |
| Male | 109 (55.0%) | $26,827 |
| Female | 89 (45.0%) | $23,472 |
| Total | 198 (100.0%) | $25,625 |
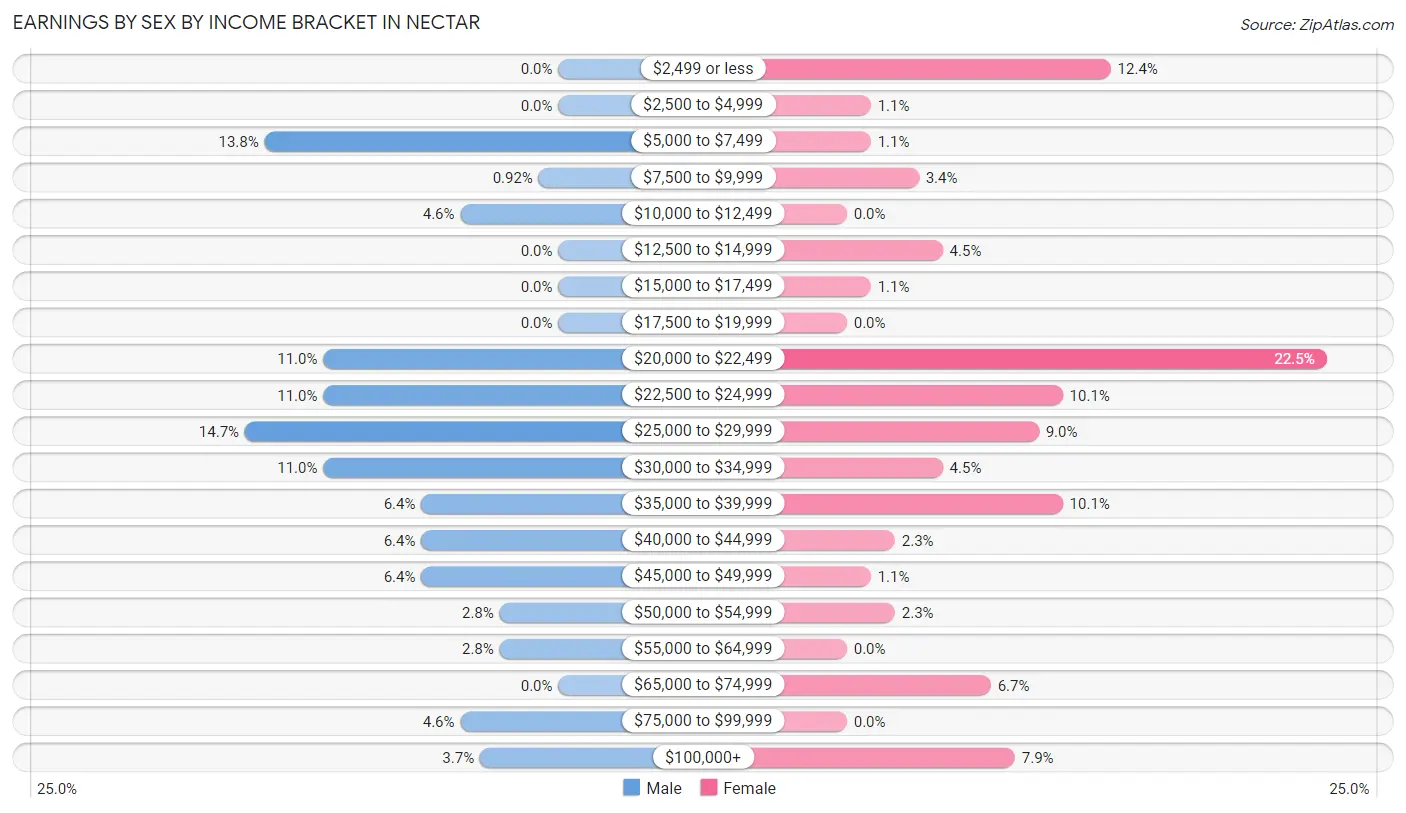
Earnings by Sex by Income Bracket in Nectar
The most common earnings brackets in Nectar are $25,000 to $29,999 for men (16 | 14.7%) and $20,000 to $22,499 for women (20 | 22.5%).
| Income | Male | Female |
| $2,499 or less | 0 (0.0%) | 11 (12.4%) |
| $2,500 to $4,999 | 0 (0.0%) | 1 (1.1%) |
| $5,000 to $7,499 | 15 (13.8%) | 1 (1.1%) |
| $7,500 to $9,999 | 1 (0.9%) | 3 (3.4%) |
| $10,000 to $12,499 | 5 (4.6%) | 0 (0.0%) |
| $12,500 to $14,999 | 0 (0.0%) | 4 (4.5%) |
| $15,000 to $17,499 | 0 (0.0%) | 1 (1.1%) |
| $17,500 to $19,999 | 0 (0.0%) | 0 (0.0%) |
| $20,000 to $22,499 | 12 (11.0%) | 20 (22.5%) |
| $22,500 to $24,999 | 12 (11.0%) | 9 (10.1%) |
| $25,000 to $29,999 | 16 (14.7%) | 8 (9.0%) |
| $30,000 to $34,999 | 12 (11.0%) | 4 (4.5%) |
| $35,000 to $39,999 | 7 (6.4%) | 9 (10.1%) |
| $40,000 to $44,999 | 7 (6.4%) | 2 (2.2%) |
| $45,000 to $49,999 | 7 (6.4%) | 1 (1.1%) |
| $50,000 to $54,999 | 3 (2.8%) | 2 (2.2%) |
| $55,000 to $64,999 | 3 (2.8%) | 0 (0.0%) |
| $65,000 to $74,999 | 0 (0.0%) | 6 (6.7%) |
| $75,000 to $99,999 | 5 (4.6%) | 0 (0.0%) |
| $100,000+ | 4 (3.7%) | 7 (7.9%) |
| Total | 109 (100.0%) | 89 (100.0%) |
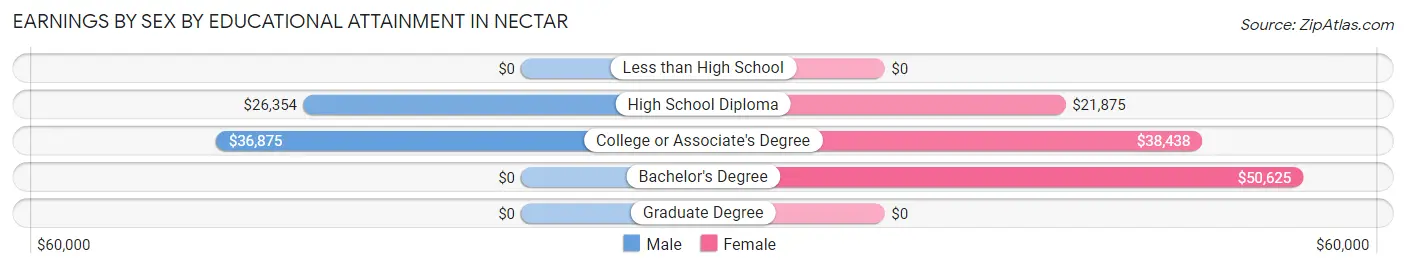
Earnings by Sex by Educational Attainment in Nectar
Average earnings in Nectar are $26,250 for men and $24,444 for women, a difference of 6.9%. Men with an educational attainment of college or associate's degree enjoy the highest average annual earnings of $36,875, while those with high school diploma education earn the least with $26,354. Women with an educational attainment of bachelor's degree earn the most with the average annual earnings of $50,625, while those with high school diploma education have the smallest earnings of $21,875.
| Educational Attainment | Male Income | Female Income |
| Less than High School | - | - |
| High School Diploma | $26,354 | $21,875 |
| College or Associate's Degree | $36,875 | $38,438 |
| Bachelor's Degree | - | - |
| Graduate Degree | - | - |
| Total | $26,250 | $24,444 |
Family Income in Nectar
Family Income Brackets in Nectar
According to the Nectar family income data, there are 33 families falling into the $35,000 to $49,999 income range, which is the most common income bracket and makes up 30.0% of all families. Conversely, the $200,000+ income bracket is the least frequent group with only 1 families (0.9%) belonging to this category.
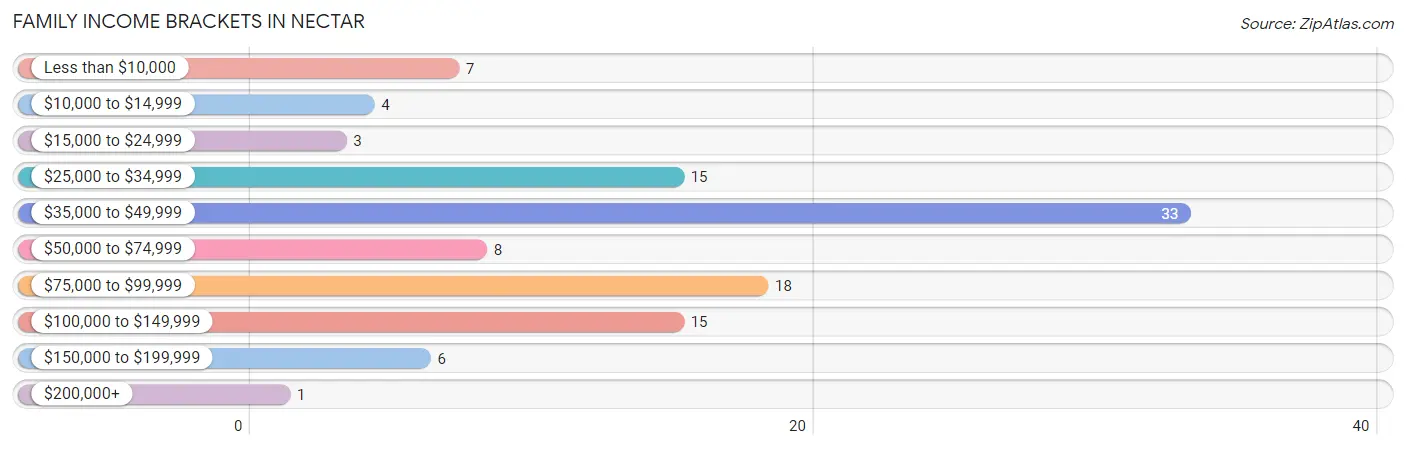
| Income Bracket | # Families | % Families |
| Less than $10,000 | 7 | 6.4% |
| $10,000 to $14,999 | 4 | 3.6% |
| $15,000 to $24,999 | 3 | 2.7% |
| $25,000 to $34,999 | 15 | 13.6% |
| $35,000 to $49,999 | 33 | 30.0% |
| $50,000 to $74,999 | 8 | 7.3% |
| $75,000 to $99,999 | 18 | 16.4% |
| $100,000 to $149,999 | 15 | 13.6% |
| $150,000 to $199,999 | 6 | 5.5% |
| $200,000+ | 1 | 0.9% |
Family Income by Famaliy Size in Nectar
5-person families (9 | 8.2%) account for the highest median family income in Nectar with $138,250 per family, while 3-person families (10 | 9.1%) have the highest median income of $28,542 per family member.
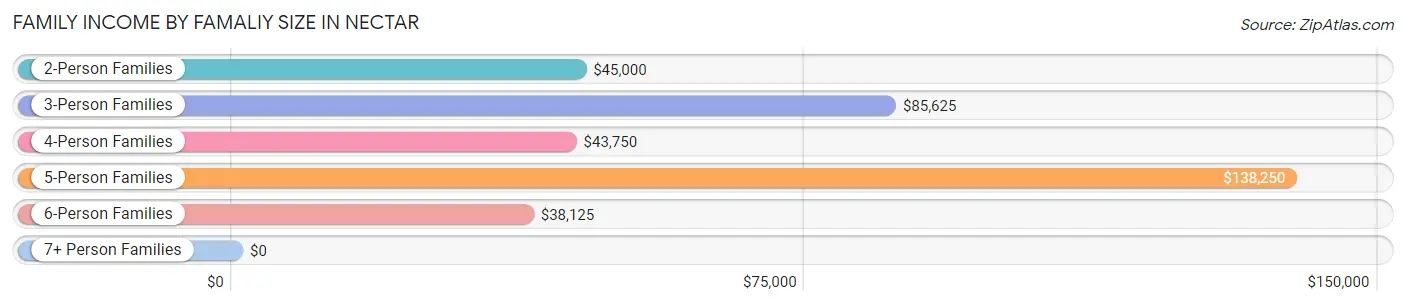
| Income Bracket | # Families | Median Income |
| 2-Person Families | 60 (54.5%) | $45,000 |
| 3-Person Families | 10 (9.1%) | $85,625 |
| 4-Person Families | 25 (22.7%) | $43,750 |
| 5-Person Families | 9 (8.2%) | $138,250 |
| 6-Person Families | 5 (4.5%) | $38,125 |
| 7+ Person Families | 1 (0.9%) | $0 |
| Total | 110 (100.0%) | $48,056 |
Family Income by Number of Earners in Nectar
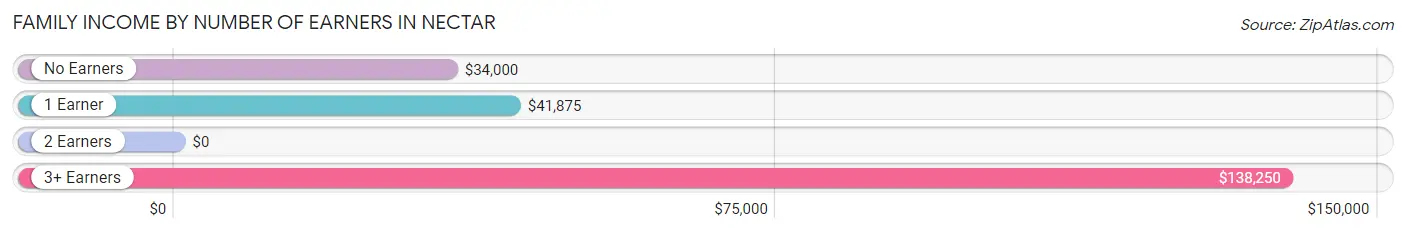
| Number of Earners | # Families | Median Income |
| No Earners | 30 (27.3%) | $34,000 |
| 1 Earner | 27 (24.5%) | $41,875 |
| 2 Earners | 46 (41.8%) | $0 |
| 3+ Earners | 7 (6.4%) | $138,250 |
| Total | 110 (100.0%) | $48,056 |
Household Income in Nectar
Household Income Brackets in Nectar
With 38 households falling in the category, the $35,000 to $49,999 income range is the most frequent in Nectar, accounting for 27.0% of all households. In contrast, only 1 households (0.7%) fall into the $200,000+ income bracket, making it the least populous group.
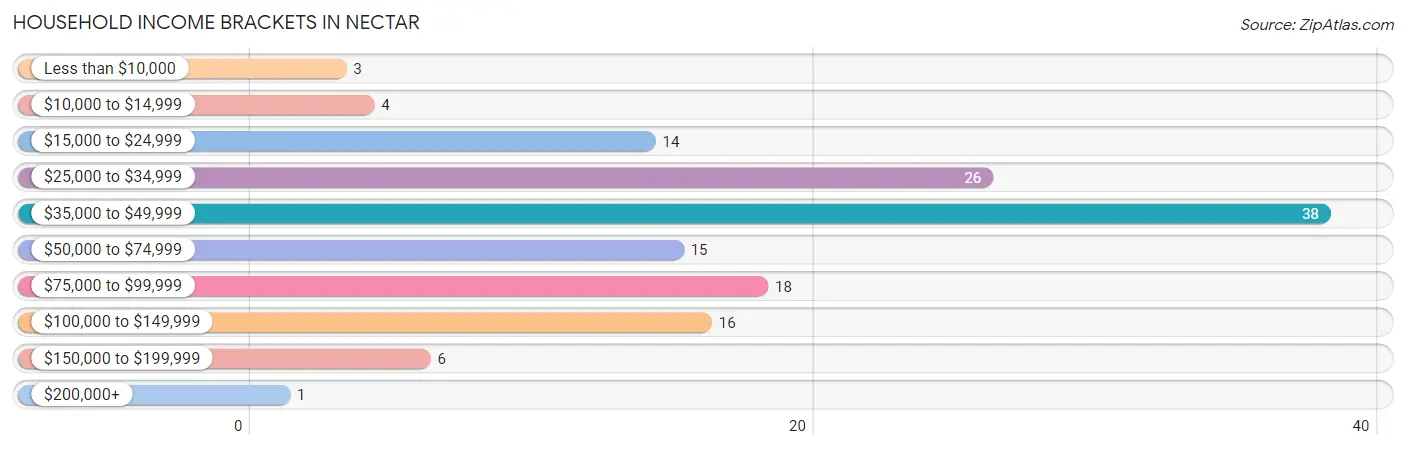
| Income Bracket | # Households | % Households |
| Less than $10,000 | 3 | 2.1% |
| $10,000 to $14,999 | 4 | 2.8% |
| $15,000 to $24,999 | 14 | 9.9% |
| $25,000 to $34,999 | 26 | 18.4% |
| $35,000 to $49,999 | 38 | 27.0% |
| $50,000 to $74,999 | 15 | 10.6% |
| $75,000 to $99,999 | 18 | 12.8% |
| $100,000 to $149,999 | 16 | 11.3% |
| $150,000 to $199,999 | 6 | 4.3% |
| $200,000+ | 1 | 0.7% |
Household Income by Householder Age in Nectar
The median household income in Nectar is $42,396, with the highest median household income of $48,214 found in the 25 to 44 years age bracket for the primary householder. A total of 36 households (25.5%) fall into this category. Meanwhile, the 15 to 24 years age bracket for the primary householder has the lowest median household income of $0, with 4 households (2.8%) in this group.
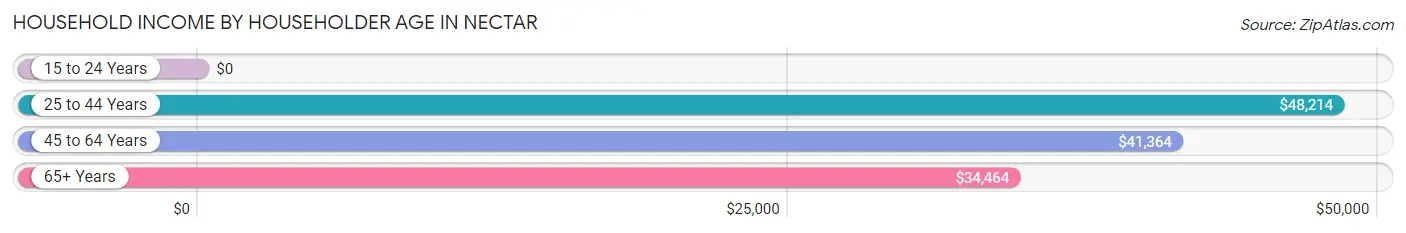
| Income Bracket | # Households | Median Income |
| 15 to 24 Years | 4 (2.8%) | $0 |
| 25 to 44 Years | 36 (25.5%) | $48,214 |
| 45 to 64 Years | 68 (48.2%) | $41,364 |
| 65+ Years | 33 (23.4%) | $34,464 |
| Total | 141 (100.0%) | $42,396 |
Poverty in Nectar
Income Below Poverty by Sex and Age in Nectar
With 11.3% poverty level for males and 14.4% for females among the residents of Nectar, 5 year old males and 12 to 14 year old females are the most vulnerable to poverty, with 1 males (50.0%) and 2 females (100.0%) in their respective age groups living below the poverty level.
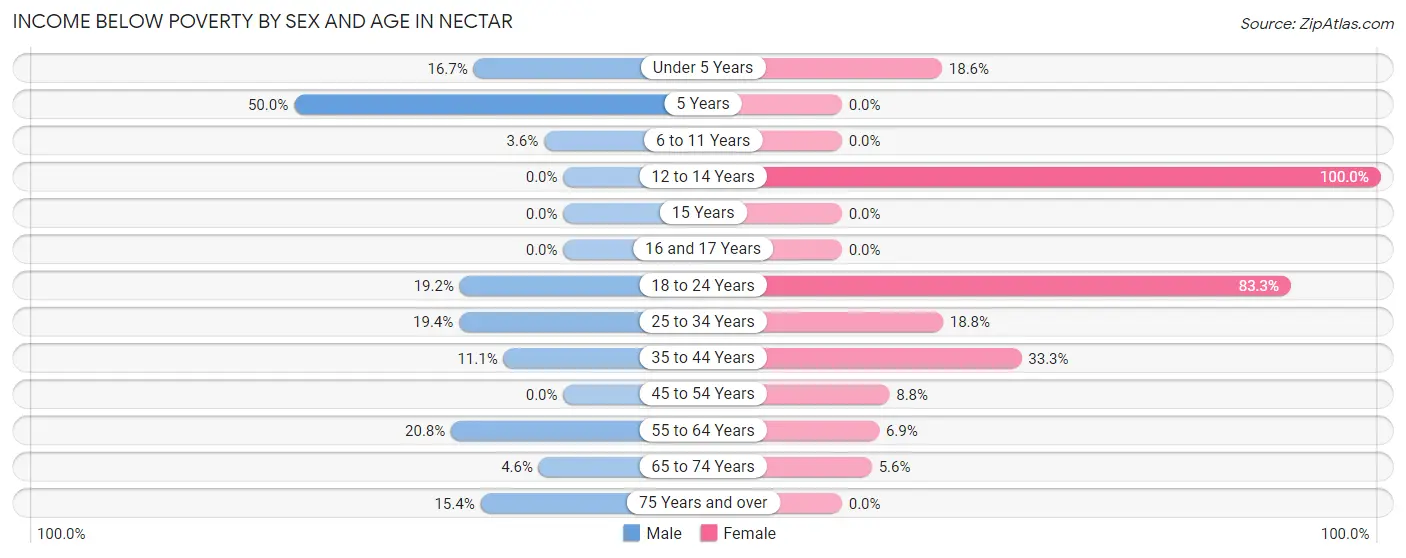
| Age Bracket | Male | Female |
| Under 5 Years | 2 (16.7%) | 13 (18.6%) |
| 5 Years | 1 (50.0%) | 0 (0.0%) |
| 6 to 11 Years | 1 (3.6%) | 0 (0.0%) |
| 12 to 14 Years | 0 (0.0%) | 2 (100.0%) |
| 15 Years | 0 (0.0%) | 0 (0.0%) |
| 16 and 17 Years | 0 (0.0%) | 0 (0.0%) |
| 18 to 24 Years | 5 (19.2%) | 5 (83.3%) |
| 25 to 34 Years | 6 (19.4%) | 6 (18.8%) |
| 35 to 44 Years | 1 (11.1%) | 6 (33.3%) |
| 45 to 54 Years | 0 (0.0%) | 3 (8.8%) |
| 55 to 64 Years | 5 (20.8%) | 2 (6.9%) |
| 65 to 74 Years | 1 (4.5%) | 1 (5.6%) |
| 75 Years and over | 2 (15.4%) | 0 (0.0%) |
| Total | 24 (11.3%) | 38 (14.4%) |
Income Above Poverty by Sex and Age in Nectar
According to the poverty statistics in Nectar, males aged 15 years and females aged 5 years are the age groups that are most secure financially, with 100.0% of males and 100.0% of females in these age groups living above the poverty line.
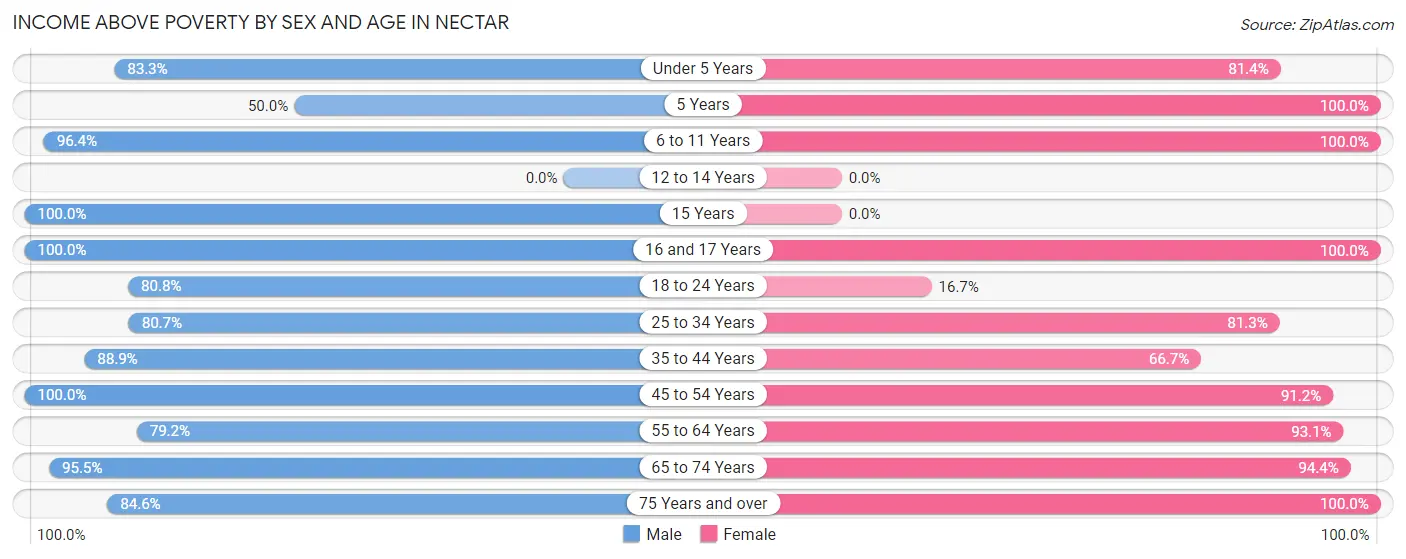
| Age Bracket | Male | Female |
| Under 5 Years | 10 (83.3%) | 57 (81.4%) |
| 5 Years | 1 (50.0%) | 6 (100.0%) |
| 6 to 11 Years | 27 (96.4%) | 34 (100.0%) |
| 12 to 14 Years | 0 (0.0%) | 0 (0.0%) |
| 15 Years | 5 (100.0%) | 0 (0.0%) |
| 16 and 17 Years | 4 (100.0%) | 1 (100.0%) |
| 18 to 24 Years | 21 (80.8%) | 1 (16.7%) |
| 25 to 34 Years | 25 (80.6%) | 26 (81.2%) |
| 35 to 44 Years | 8 (88.9%) | 12 (66.7%) |
| 45 to 54 Years | 36 (100.0%) | 31 (91.2%) |
| 55 to 64 Years | 19 (79.2%) | 27 (93.1%) |
| 65 to 74 Years | 21 (95.5%) | 17 (94.4%) |
| 75 Years and over | 11 (84.6%) | 14 (100.0%) |
| Total | 188 (88.7%) | 226 (85.6%) |
Income Below Poverty Among Married-Couple Families in Nectar
The poverty statistics for married-couple families in Nectar show that 8.8% or 9 of the total 102 families live below the poverty line. Families with 3 or 4 children have the highest poverty rate of 40.0%, comprising of 4 families. On the other hand, families with 1 or 2 children have the lowest poverty rate of 0.0%, which includes 0 families.
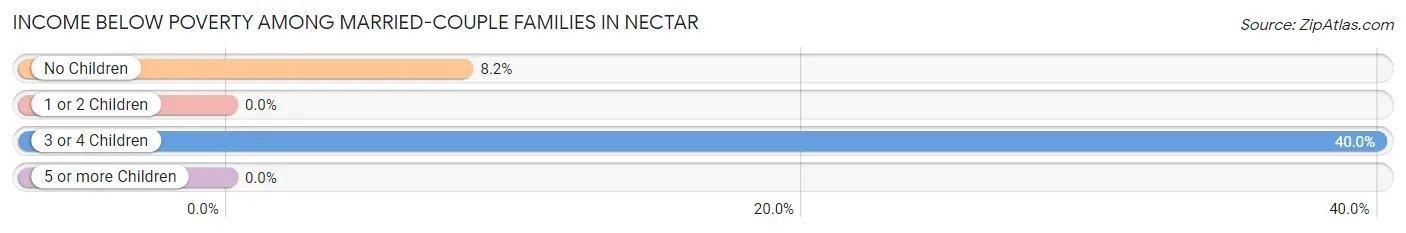
| Children | Above Poverty | Below Poverty |
| No Children | 56 (91.8%) | 5 (8.2%) |
| 1 or 2 Children | 31 (100.0%) | 0 (0.0%) |
| 3 or 4 Children | 6 (60.0%) | 4 (40.0%) |
| 5 or more Children | 0 (0.0%) | 0 (0.0%) |
| Total | 93 (91.2%) | 9 (8.8%) |
Income Below Poverty Among Single-Parent Households in Nectar
According to the poverty data in Nectar, 100.0% or 4 single-father households and 100.0% or 4 single-mother households are living below the poverty line. Among single-father households, those with no children have the highest poverty rate, with 4 households (100.0%) experiencing poverty. Likewise, among single-mother households, those with 1 or 2 children have the highest poverty rate, with 4 households (100.0%) falling below the poverty line.
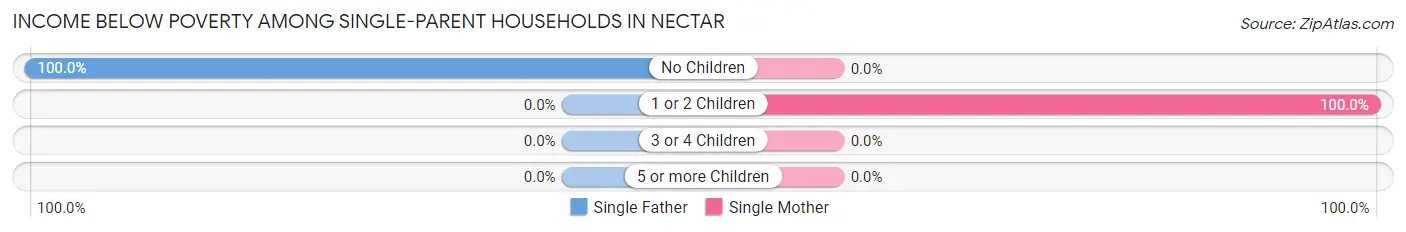
| Children | Single Father | Single Mother |
| No Children | 4 (100.0%) | 0 (0.0%) |
| 1 or 2 Children | 0 (0.0%) | 4 (100.0%) |
| 3 or 4 Children | 0 (0.0%) | 0 (0.0%) |
| 5 or more Children | 0 (0.0%) | 0 (0.0%) |
| Total | 4 (100.0%) | 4 (100.0%) |
Income Below Poverty Among Married-Couple vs Single-Parent Households in Nectar
The poverty data for Nectar shows that 9 of the married-couple family households (8.8%) and 8 of the single-parent households (100.0%) are living below the poverty level. Within the married-couple family households, those with 3 or 4 children have the highest poverty rate, with 4 households (40.0%) falling below the poverty line. Among the single-parent households, those with no children have the highest poverty rate, with 4 household (100.0%) living below poverty.
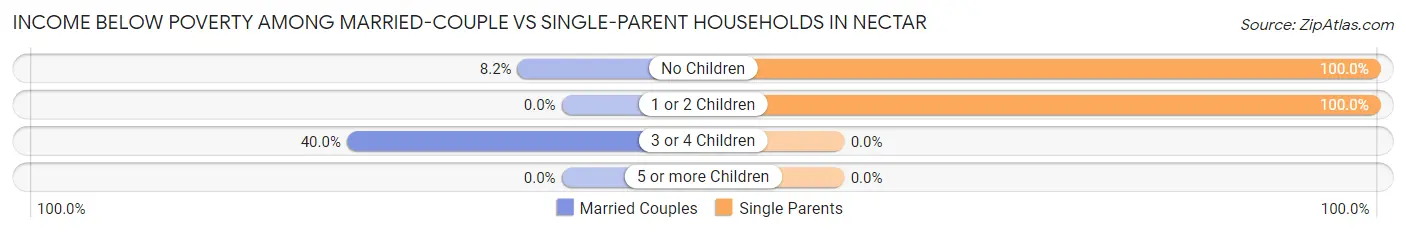
| Children | Married-Couple Families | Single-Parent Households |
| No Children | 5 (8.2%) | 4 (100.0%) |
| 1 or 2 Children | 0 (0.0%) | 4 (100.0%) |
| 3 or 4 Children | 4 (40.0%) | 0 (0.0%) |
| 5 or more Children | 0 (0.0%) | 0 (0.0%) |
| Total | 9 (8.8%) | 8 (100.0%) |
Race in Nectar
The most populous races in Nectar are White / Caucasian (395 | 83.0%), Hispanic or Latino (143 | 30.0%), and Two or more Races (81 | 17.0%).
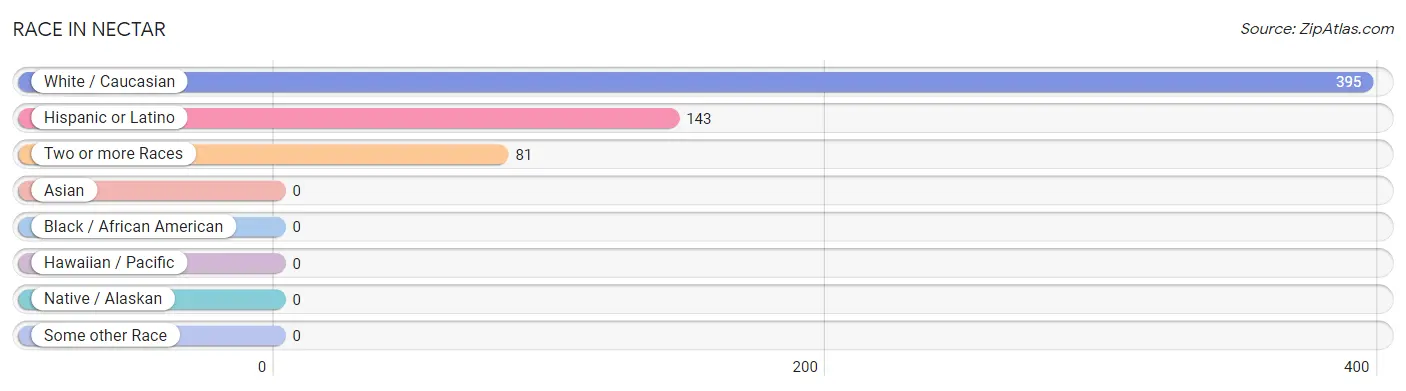
| Race | # Population | % Population |
| Asian | 0 | 0.0% |
| Black / African American | 0 | 0.0% |
| Hawaiian / Pacific | 0 | 0.0% |
| Hispanic or Latino | 143 | 30.0% |
| Native / Alaskan | 0 | 0.0% |
| White / Caucasian | 395 | 83.0% |
| Two or more Races | 81 | 17.0% |
| Some other Race | 0 | 0.0% |
| Total | 476 | 100.0% |
Ancestry in Nectar
The most populous ancestries reported in Nectar are Mexican (143 | 30.0%), English (62 | 13.0%), Irish (51 | 10.7%), German (32 | 6.7%), and American (22 | 4.6%), together accounting for 65.1% of all Nectar residents.
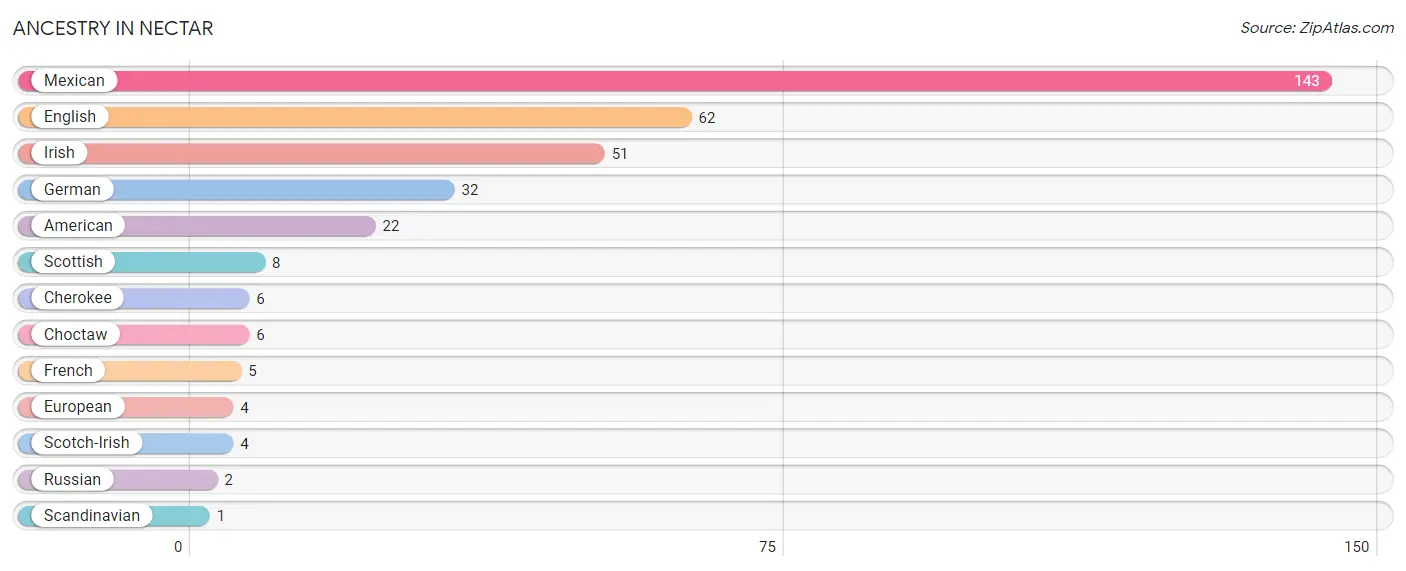
| Ancestry | # Population | % Population |
| American | 22 | 4.6% |
| Cherokee | 6 | 1.3% |
| Choctaw | 6 | 1.3% |
| English | 62 | 13.0% |
| European | 4 | 0.8% |
| French | 5 | 1.1% |
| German | 32 | 6.7% |
| Irish | 51 | 10.7% |
| Mexican | 143 | 30.0% |
| Russian | 2 | 0.4% |
| Scandinavian | 1 | 0.2% |
| Scotch-Irish | 4 | 0.8% |
| Scottish | 8 | 1.7% | View All 13 Rows |
Immigrants in Nectar
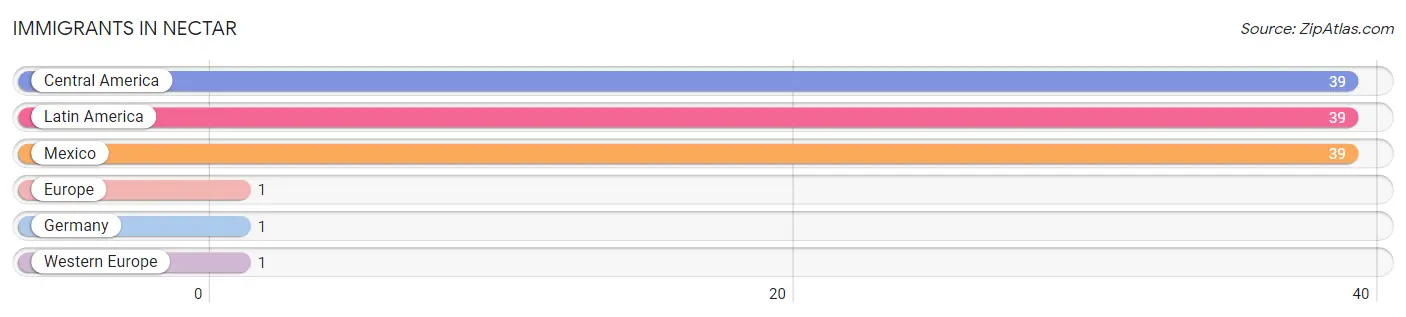
The most numerous immigrant groups reported in Nectar came from Central America (39 | 8.2%), Latin America (39 | 8.2%), Mexico (39 | 8.2%), Europe (1 | 0.2%), and Germany (1 | 0.2%), together accounting for 25.0% of all Nectar residents.
| Immigration Origin | # Population | % Population |
| Central America | 39 | 8.2% |
| Europe | 1 | 0.2% |
| Germany | 1 | 0.2% |
| Latin America | 39 | 8.2% |
| Mexico | 39 | 8.2% |
| Western Europe | 1 | 0.2% | View All 6 Rows |
Sex and Age in Nectar
Sex and Age in Nectar
The most populous age groups in Nectar are 50 to 54 Years (28 | 13.2%) for men and Under 5 Years (70 | 26.5%) for women.

| Age Bracket | Male | Female |
| Under 5 Years | 12 (5.7%) | 70 (26.5%) |
| 5 to 9 Years | 8 (3.8%) | 38 (14.4%) |
| 10 to 14 Years | 22 (10.4%) | 4 (1.5%) |
| 15 to 19 Years | 14 (6.6%) | 2 (0.8%) |
| 20 to 24 Years | 21 (9.9%) | 5 (1.9%) |
| 25 to 29 Years | 18 (8.5%) | 18 (6.8%) |
| 30 to 34 Years | 13 (6.1%) | 14 (5.3%) |
| 35 to 39 Years | 7 (3.3%) | 5 (1.9%) |
| 40 to 44 Years | 2 (0.9%) | 13 (4.9%) |
| 45 to 49 Years | 8 (3.8%) | 25 (9.5%) |
| 50 to 54 Years | 28 (13.2%) | 9 (3.4%) |
| 55 to 59 Years | 11 (5.2%) | 11 (4.2%) |
| 60 to 64 Years | 13 (6.1%) | 18 (6.8%) |
| 65 to 69 Years | 18 (8.5%) | 13 (4.9%) |
| 70 to 74 Years | 4 (1.9%) | 5 (1.9%) |
| 75 to 79 Years | 3 (1.4%) | 9 (3.4%) |
| 80 to 84 Years | 8 (3.8%) | 1 (0.4%) |
| 85 Years and over | 2 (0.9%) | 4 (1.5%) |
| Total | 212 (100.0%) | 264 (100.0%) |
Families and Households in Nectar
Median Family Size in Nectar
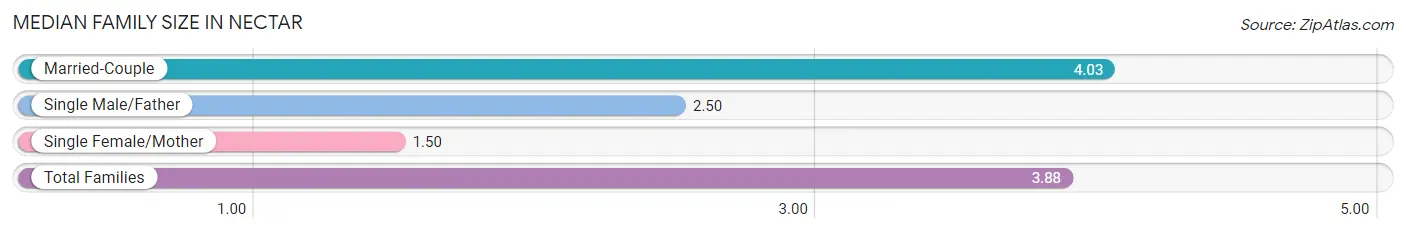
The median family size in Nectar is 3.88 persons per family, with married-couple families (102 | 92.7%) accounting for the largest median family size of 4.03 persons per family. On the other hand, single female/mother families (4 | 3.6%) represent the smallest median family size with 1.50 persons per family.
| Family Type | # Families | Family Size |
| Married-Couple | 102 (92.7%) | 4.03 |
| Single Male/Father | 4 (3.6%) | 2.50 |
| Single Female/Mother | 4 (3.6%) | 1.50 |
| Total Families | 110 (100.0%) | 3.88 |
Median Household Size in Nectar
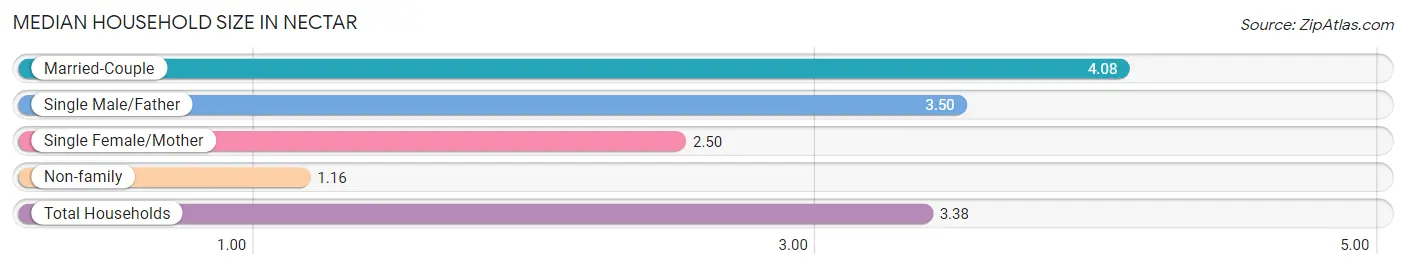
The median household size in Nectar is 3.38 persons per household, with married-couple households (102 | 72.3%) accounting for the largest median household size of 4.08 persons per household. non-family households (31 | 22.0%) represent the smallest median household size with 1.16 persons per household.
| Household Type | # Households | Household Size |
| Married-Couple | 102 (72.3%) | 4.08 |
| Single Male/Father | 4 (2.8%) | 3.50 |
| Single Female/Mother | 4 (2.8%) | 2.50 |
| Non-family | 31 (22.0%) | 1.16 |
| Total Households | 141 (100.0%) | 3.38 |
Household Size by Marriage Status in Nectar
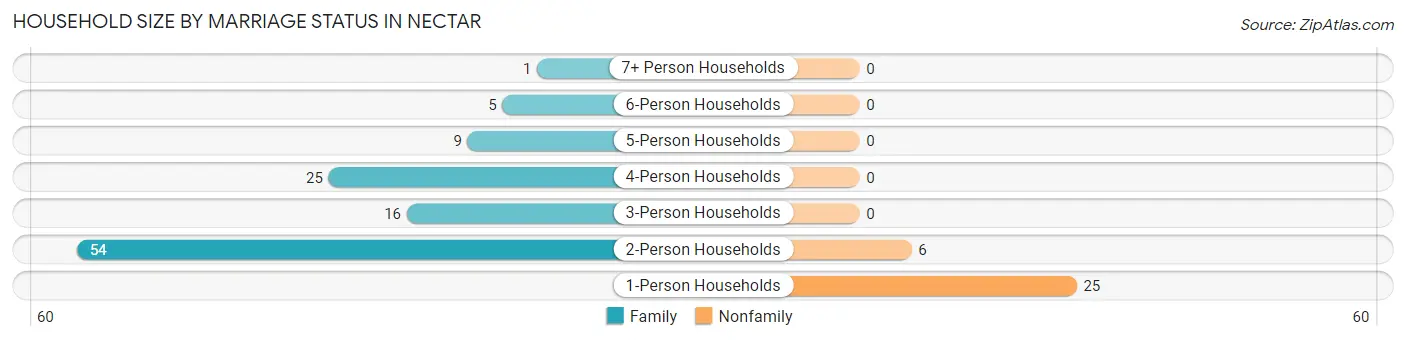
Out of a total of 141 households in Nectar, 110 (78.0%) are family households, while 31 (22.0%) are nonfamily households. The most numerous type of family households are 2-person households, comprising 54, and the most common type of nonfamily households are 1-person households, comprising 25.
| Household Size | Family Households | Nonfamily Households |
| 1-Person Households | - | 25 (17.7%) |
| 2-Person Households | 54 (38.3%) | 6 (4.3%) |
| 3-Person Households | 16 (11.4%) | 0 (0.0%) |
| 4-Person Households | 25 (17.7%) | 0 (0.0%) |
| 5-Person Households | 9 (6.4%) | 0 (0.0%) |
| 6-Person Households | 5 (3.5%) | 0 (0.0%) |
| 7+ Person Households | 1 (0.7%) | 0 (0.0%) |
| Total | 110 (78.0%) | 31 (22.0%) |
Female Fertility in Nectar
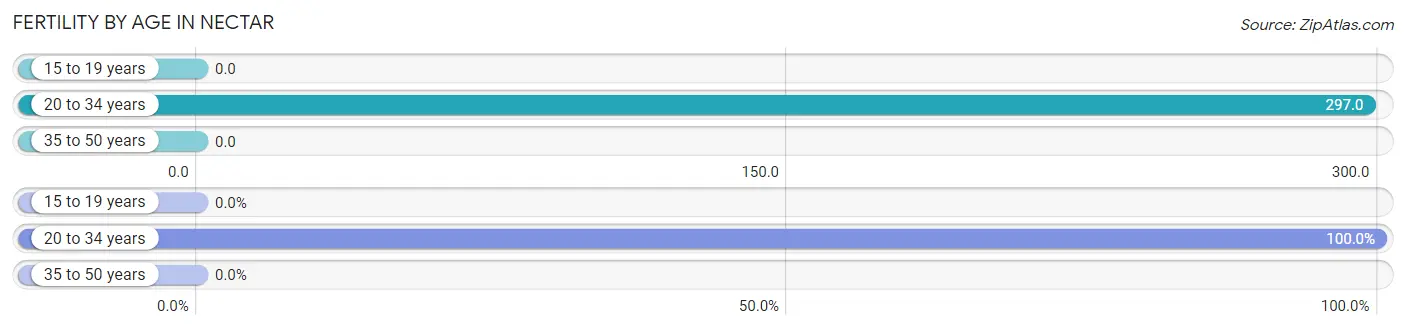
Fertility by Age in Nectar
Average fertility rate in Nectar is 133.0 births per 1,000 women. Women in the age bracket of 20 to 34 years have the highest fertility rate with 297.0 births per 1,000 women. Women in the age bracket of 20 to 34 years acount for 100.0% of all women with births.
| Age Bracket | Women with Births | Births / 1,000 Women |
| 15 to 19 years | 0 (0.0%) | 0.0 |
| 20 to 34 years | 11 (100.0%) | 297.0 |
| 35 to 50 years | 0 (0.0%) | 0.0 |
| Total | 11 (100.0%) | 133.0 |
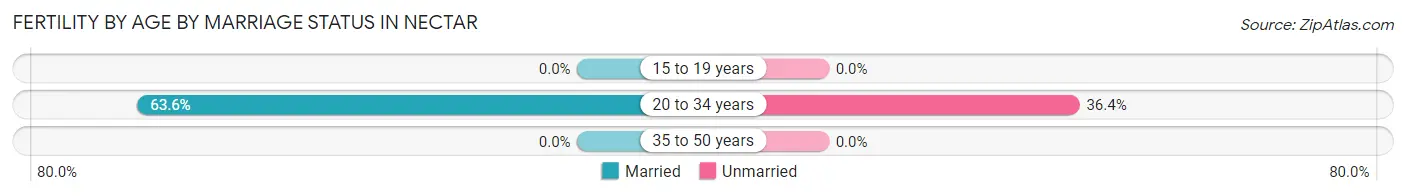
Fertility by Age by Marriage Status in Nectar
63.6% of women with births (11) in Nectar are married. The highest percentage of unmarried women with births falls into 20 to 34 years age bracket with 36.4% of them unmarried at the time of birth, while the lowest percentage of unmarried women with births belong to 20 to 34 years age bracket with 36.4% of them unmarried.
| Age Bracket | Married | Unmarried |
| 15 to 19 years | 0 (0.0%) | 0 (0.0%) |
| 20 to 34 years | 7 (63.6%) | 4 (36.4%) |
| 35 to 50 years | 0 (0.0%) | 0 (0.0%) |
| Total | 7 (63.6%) | 4 (36.4%) |
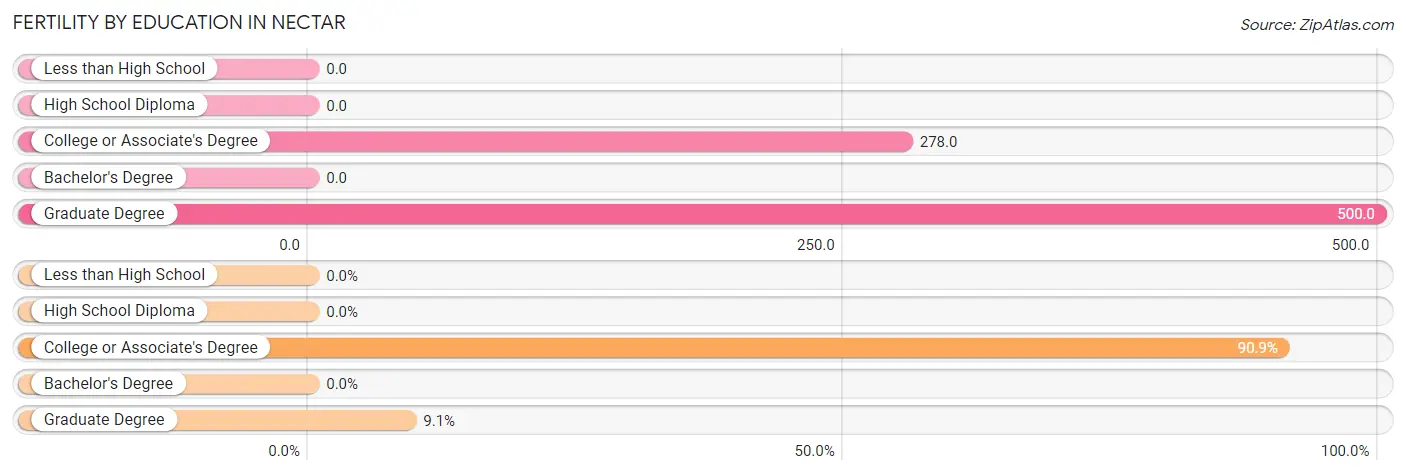
Fertility by Education in Nectar
| Educational Attainment | Women with Births | Births / 1,000 Women |
| Less than High School | 0 (0.0%) | 0.0 |
| High School Diploma | 0 (0.0%) | 0.0 |
| College or Associate's Degree | 10 (90.9%) | 278.0 |
| Bachelor's Degree | 0 (0.0%) | 0.0 |
| Graduate Degree | 1 (9.1%) | 500.0 |
| Total | 11 (100.0%) | 133.0 |
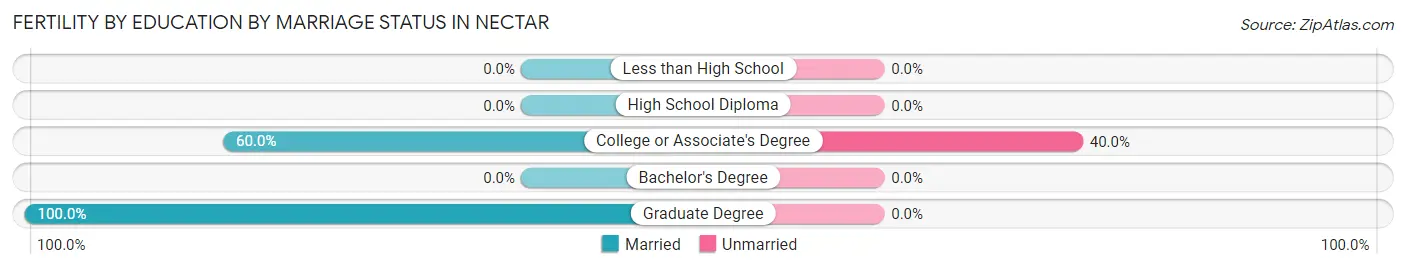
Fertility by Education by Marriage Status in Nectar
36.4% of women with births in Nectar are unmarried. Women with the educational attainment of graduate degree are most likely to be married with 100.0% of them married at childbirth, while women with the educational attainment of college or associate's degree are least likely to be married with 40.0% of them unmarried at childbirth.
| Educational Attainment | Married | Unmarried |
| Less than High School | 0 (0.0%) | 0 (0.0%) |
| High School Diploma | 0 (0.0%) | 0 (0.0%) |
| College or Associate's Degree | 6 (60.0%) | 4 (40.0%) |
| Bachelor's Degree | 0 (0.0%) | 0 (0.0%) |
| Graduate Degree | 1 (100.0%) | 0 (0.0%) |
| Total | 7 (63.6%) | 4 (36.4%) |
Employment Characteristics in Nectar
Employment by Class of Employer in Nectar
Among the 179 employed individuals in Nectar, private company employees (105 | 58.7%), not-for-profit organizations (36 | 20.1%), and state government employees (23 | 12.9%) make up the most common classes of employment.
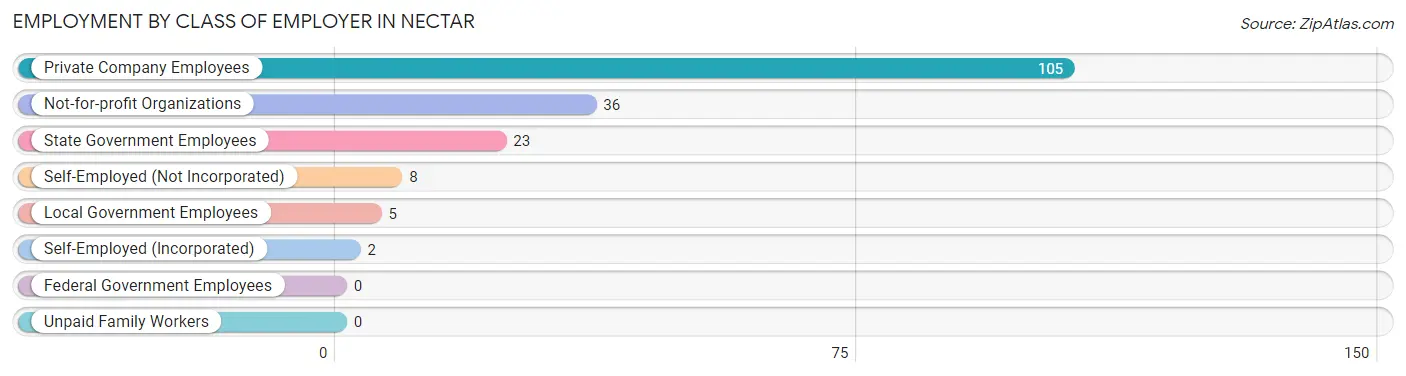
| Employer Class | # Employees | % Employees |
| Private Company Employees | 105 | 58.7% |
| Self-Employed (Incorporated) | 2 | 1.1% |
| Self-Employed (Not Incorporated) | 8 | 4.5% |
| Not-for-profit Organizations | 36 | 20.1% |
| Local Government Employees | 5 | 2.8% |
| State Government Employees | 23 | 12.9% |
| Federal Government Employees | 0 | 0.0% |
| Unpaid Family Workers | 0 | 0.0% |
| Total | 179 | 100.0% |
Employment Status by Age in Nectar
According to the labor force statistics for Nectar, out of the total population over 16 years of age (317), 63.1% or 200 individuals are in the labor force, with 9.5% or 19 of them unemployed. The age group with the highest labor force participation rate is 30 to 34 years, with 100.0% or 27 individuals in the labor force. Within the labor force, the 35 to 44 years age range has the highest percentage of unemployed individuals, with 20.8% or 5 of them being unemployed.
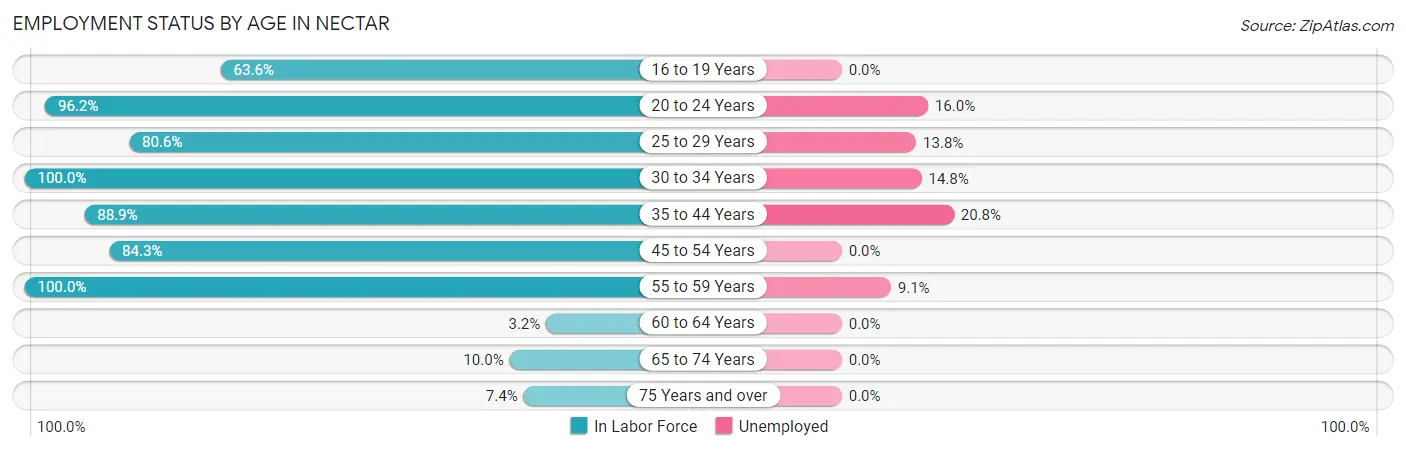
| Age Bracket | In Labor Force | Unemployed |
| 16 to 19 Years | 7 (63.6%) | 0 (0.0%) |
| 20 to 24 Years | 25 (96.2%) | 4 (16.0%) |
| 25 to 29 Years | 29 (80.6%) | 4 (13.8%) |
| 30 to 34 Years | 27 (100.0%) | 4 (14.8%) |
| 35 to 44 Years | 24 (88.9%) | 5 (20.8%) |
| 45 to 54 Years | 59 (84.3%) | 0 (0.0%) |
| 55 to 59 Years | 22 (100.0%) | 2 (9.1%) |
| 60 to 64 Years | 1 (3.2%) | 0 (0.0%) |
| 65 to 74 Years | 4 (10.0%) | 0 (0.0%) |
| 75 Years and over | 2 (7.4%) | 0 (0.0%) |
| Total | 200 (63.1%) | 19 (9.5%) |
Employment Status by Educational Attainment in Nectar
According to labor force statistics for Nectar, 76.1% of individuals (162) out of the total population between 25 and 64 years of age (213) are in the labor force, with 9.3% or 15 of them being unemployed. The group with the highest labor force participation rate are those with the educational attainment of bachelor's degree or higher, with 90.0% or 9 individuals in the labor force. Within the labor force, individuals with less than high school education have the highest percentage of unemployment, with 41.7% or 5 of them being unemployed.
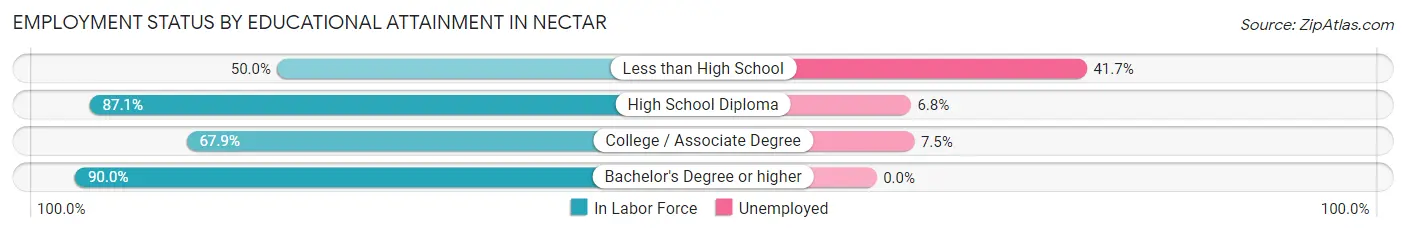
| Educational Attainment | In Labor Force | Unemployed |
| Less than High School | 12 (50.0%) | 10 (41.7%) |
| High School Diploma | 88 (87.1%) | 7 (6.8%) |
| College / Associate Degree | 53 (67.9%) | 6 (7.5%) |
| Bachelor's Degree or higher | 9 (90.0%) | 0 (0.0%) |
| Total | 162 (76.1%) | 20 (9.3%) |
Employment Occupations by Sex in Nectar
Management, Business, Science and Arts Occupations
The most common Management, Business, Science and Arts occupations in Nectar are Management (19 | 10.5%), Community & Social Service (13 | 7.2%), Health Diagnosing & Treating (13 | 7.2%), Education Instruction & Library (12 | 6.6%), and Computers, Engineering & Science (7 | 3.9%).
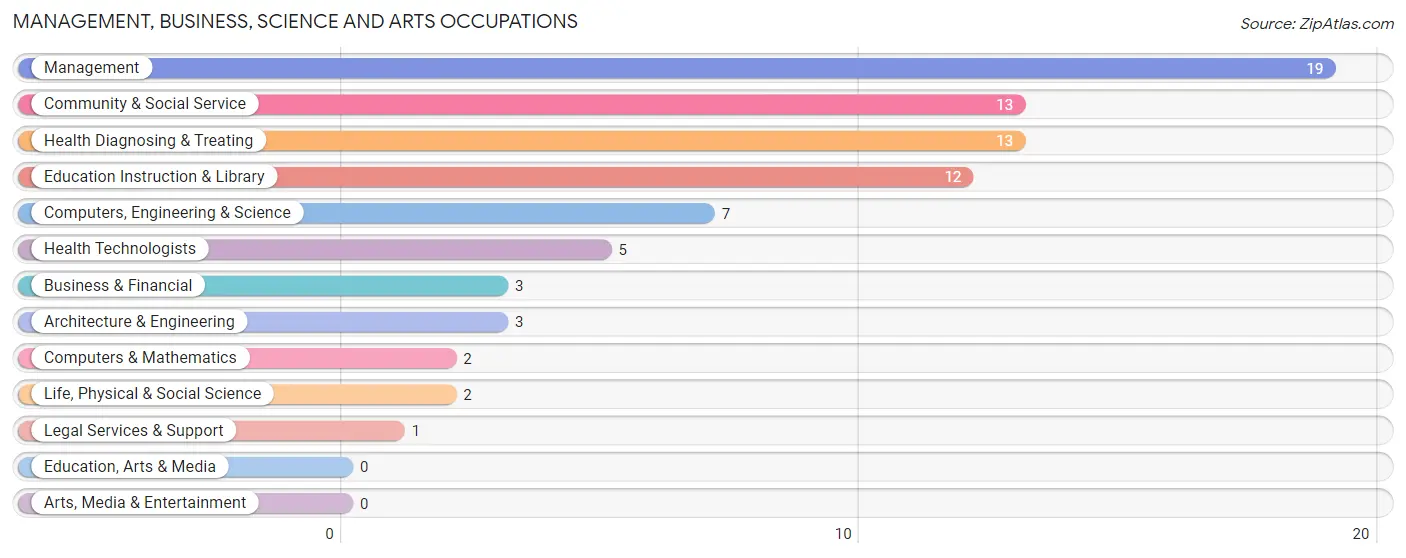
Management, Business, Science and Arts Occupations by Sex
Within the Management, Business, Science and Arts occupations in Nectar, the most male-oriented occupations are Computers & Mathematics (100.0%), Management (52.6%), and Health Diagnosing & Treating (46.2%), while the most female-oriented occupations are Business & Financial (100.0%), Life, Physical & Social Science (100.0%), and Legal Services & Support (100.0%).
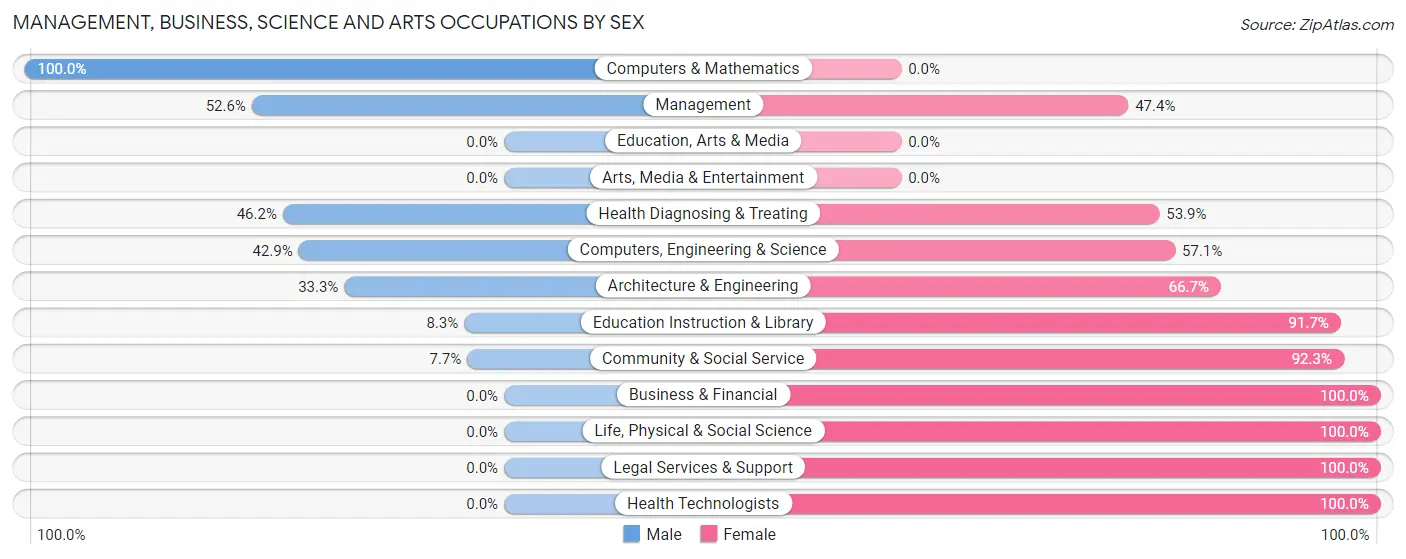
| Occupation | Male | Female |
| Management | 10 (52.6%) | 9 (47.4%) |
| Business & Financial | 0 (0.0%) | 3 (100.0%) |
| Computers, Engineering & Science | 3 (42.9%) | 4 (57.1%) |
| Computers & Mathematics | 2 (100.0%) | 0 (0.0%) |
| Architecture & Engineering | 1 (33.3%) | 2 (66.7%) |
| Life, Physical & Social Science | 0 (0.0%) | 2 (100.0%) |
| Community & Social Service | 1 (7.7%) | 12 (92.3%) |
| Education, Arts & Media | 0 (0.0%) | 0 (0.0%) |
| Legal Services & Support | 0 (0.0%) | 1 (100.0%) |
| Education Instruction & Library | 1 (8.3%) | 11 (91.7%) |
| Arts, Media & Entertainment | 0 (0.0%) | 0 (0.0%) |
| Health Diagnosing & Treating | 6 (46.2%) | 7 (53.8%) |
| Health Technologists | 0 (0.0%) | 5 (100.0%) |
| Total (Category) | 20 (36.4%) | 35 (63.6%) |
| Total (Overall) | 104 (57.5%) | 77 (42.5%) |
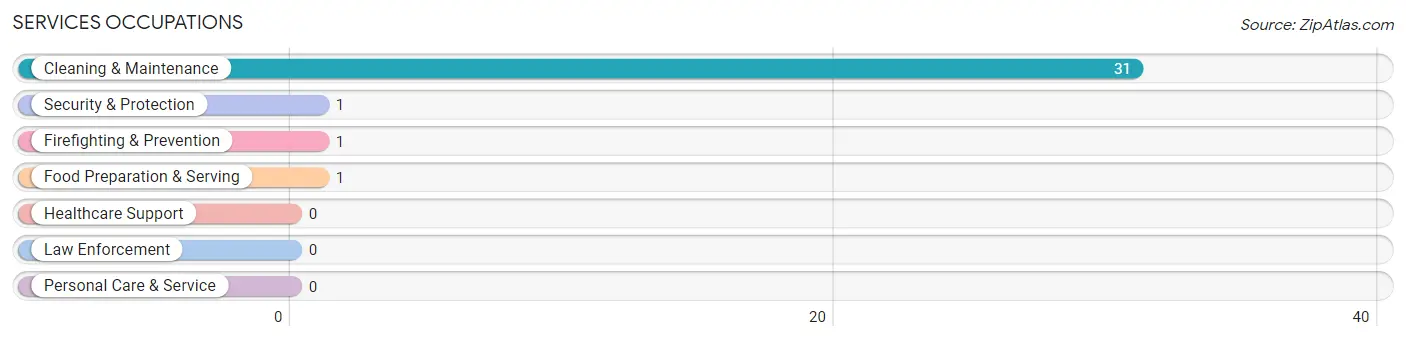
Services Occupations
The most common Services occupations in Nectar are Cleaning & Maintenance (31 | 17.1%), Security & Protection (1 | 0.5%), Firefighting & Prevention (1 | 0.5%), and Food Preparation & Serving (1 | 0.5%).
Services Occupations by Sex
Within the Services occupations in Nectar, the most male-oriented occupations are Security & Protection (100.0%), Firefighting & Prevention (100.0%), and Cleaning & Maintenance (35.5%), while the most female-oriented occupations are Food Preparation & Serving (100.0%), and Cleaning & Maintenance (64.5%).
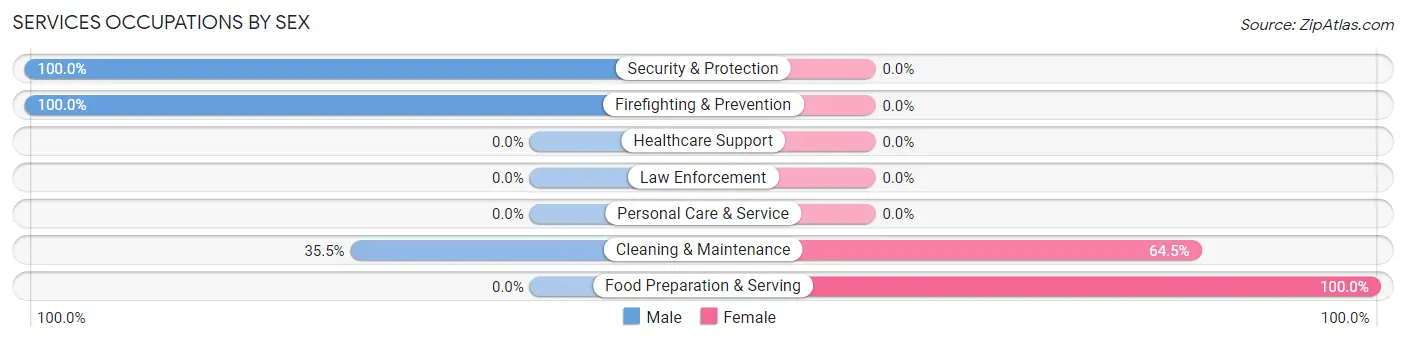
| Occupation | Male | Female |
| Healthcare Support | 0 (0.0%) | 0 (0.0%) |
| Security & Protection | 1 (100.0%) | 0 (0.0%) |
| Firefighting & Prevention | 1 (100.0%) | 0 (0.0%) |
| Law Enforcement | 0 (0.0%) | 0 (0.0%) |
| Food Preparation & Serving | 0 (0.0%) | 1 (100.0%) |
| Cleaning & Maintenance | 11 (35.5%) | 20 (64.5%) |
| Personal Care & Service | 0 (0.0%) | 0 (0.0%) |
| Total (Category) | 12 (36.4%) | 21 (63.6%) |
| Total (Overall) | 104 (57.5%) | 77 (42.5%) |
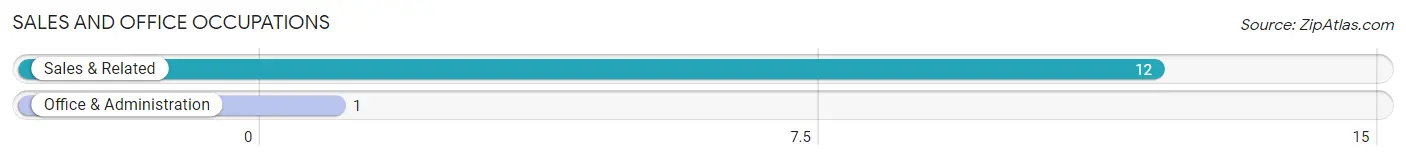
Sales and Office Occupations
The most common Sales and Office occupations in Nectar are Sales & Related (12 | 6.6%), and Office & Administration (1 | 0.5%).
Sales and Office Occupations by Sex
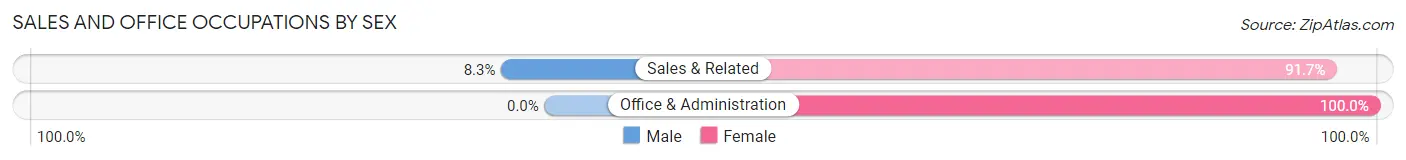
| Occupation | Male | Female |
| Sales & Related | 1 (8.3%) | 11 (91.7%) |
| Office & Administration | 0 (0.0%) | 1 (100.0%) |
| Total (Category) | 1 (7.7%) | 12 (92.3%) |
| Total (Overall) | 104 (57.5%) | 77 (42.5%) |
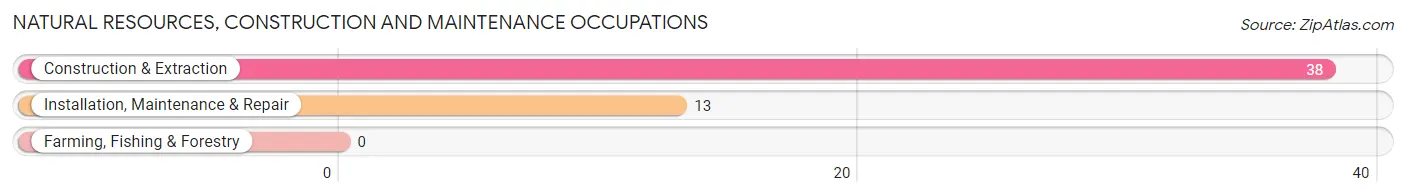
Natural Resources, Construction and Maintenance Occupations
The most common Natural Resources, Construction and Maintenance occupations in Nectar are Construction & Extraction (38 | 21.0%), and Installation, Maintenance & Repair (13 | 7.2%).
Natural Resources, Construction and Maintenance Occupations by Sex
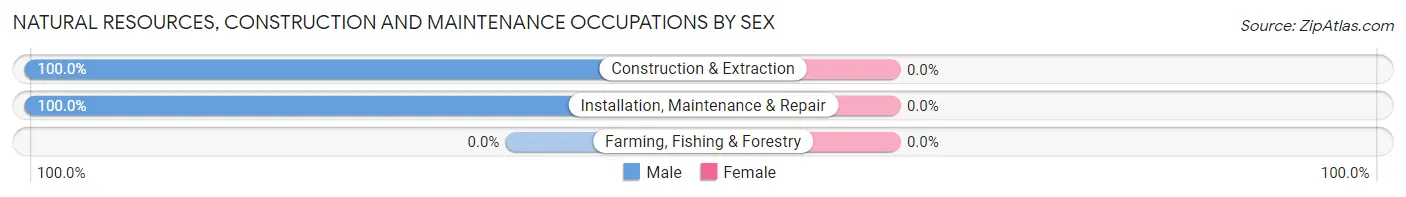
| Occupation | Male | Female |
| Farming, Fishing & Forestry | 0 (0.0%) | 0 (0.0%) |
| Construction & Extraction | 38 (100.0%) | 0 (0.0%) |
| Installation, Maintenance & Repair | 13 (100.0%) | 0 (0.0%) |
| Total (Category) | 51 (100.0%) | 0 (0.0%) |
| Total (Overall) | 104 (57.5%) | 77 (42.5%) |
Production, Transportation and Moving Occupations
The most common Production, Transportation and Moving occupations in Nectar are Material Moving (12 | 6.6%), Production (11 | 6.1%), and Transportation (6 | 3.3%).
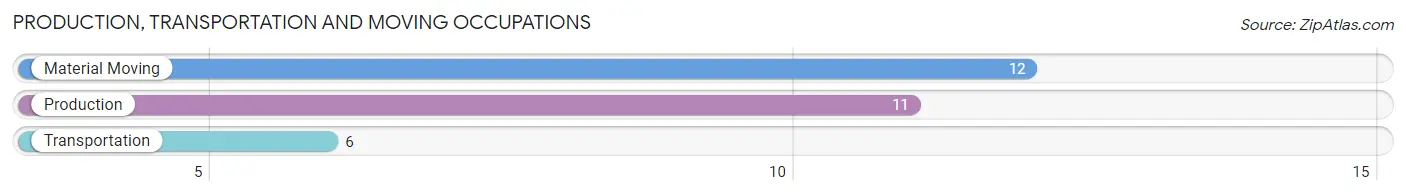
Production, Transportation and Moving Occupations by Sex
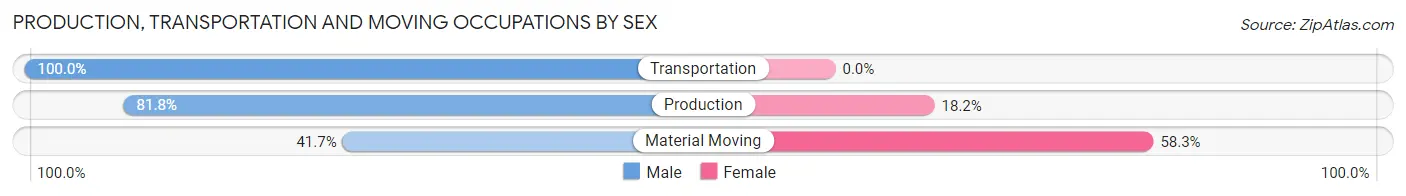
| Occupation | Male | Female |
| Production | 9 (81.8%) | 2 (18.2%) |
| Transportation | 6 (100.0%) | 0 (0.0%) |
| Material Moving | 5 (41.7%) | 7 (58.3%) |
| Total (Category) | 20 (69.0%) | 9 (31.0%) |
| Total (Overall) | 104 (57.5%) | 77 (42.5%) |
Employment Industries by Sex in Nectar
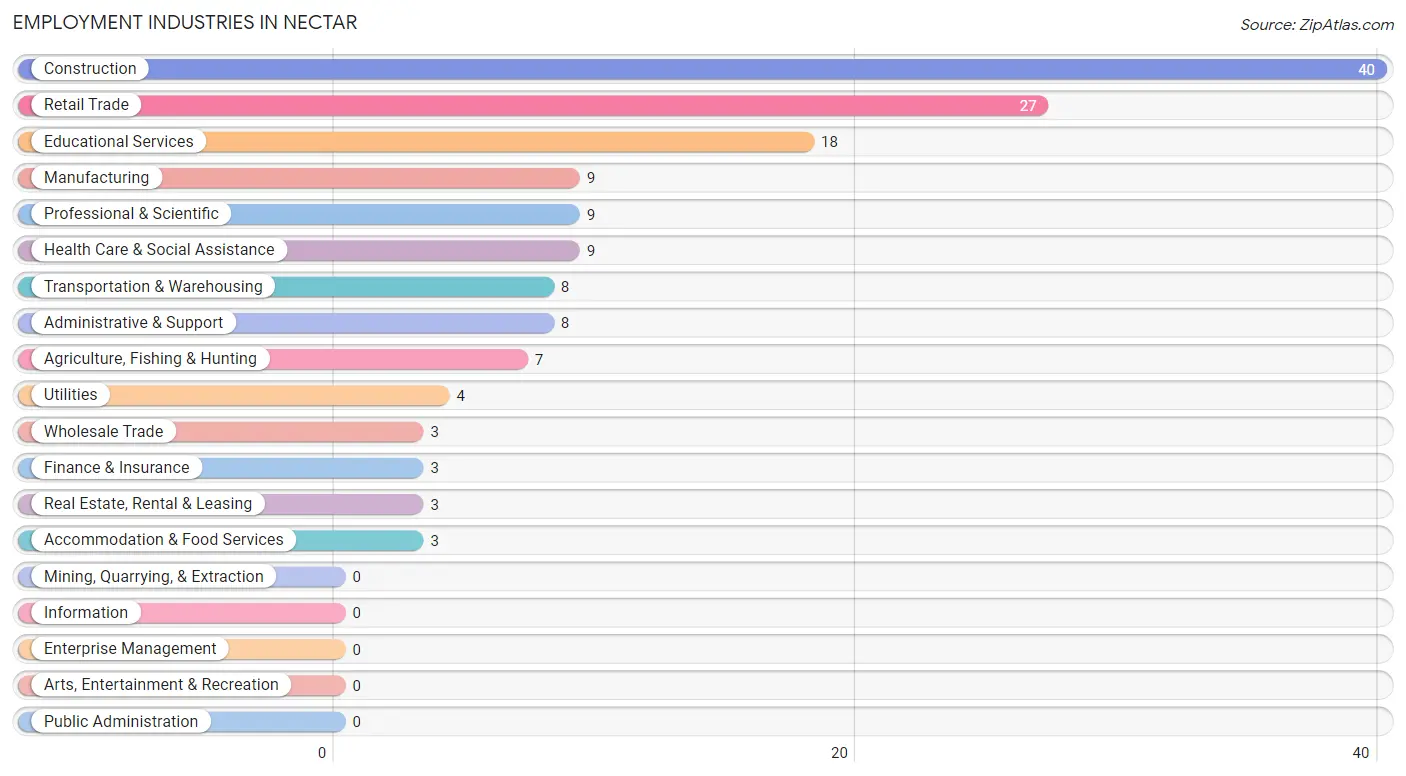
Employment Industries in Nectar
The major employment industries in Nectar include Construction (40 | 22.1%), Retail Trade (27 | 14.9%), Educational Services (18 | 9.9%), Manufacturing (9 | 5.0%), and Professional & Scientific (9 | 5.0%).
Employment Industries by Sex in Nectar
The Nectar industries that see more men than women are Agriculture, Fishing & Hunting (100.0%), Construction (100.0%), and Wholesale Trade (100.0%), whereas the industries that tend to have a higher number of women are Health Care & Social Assistance (100.0%), Accommodation & Food Services (100.0%), and Professional & Scientific (88.9%).
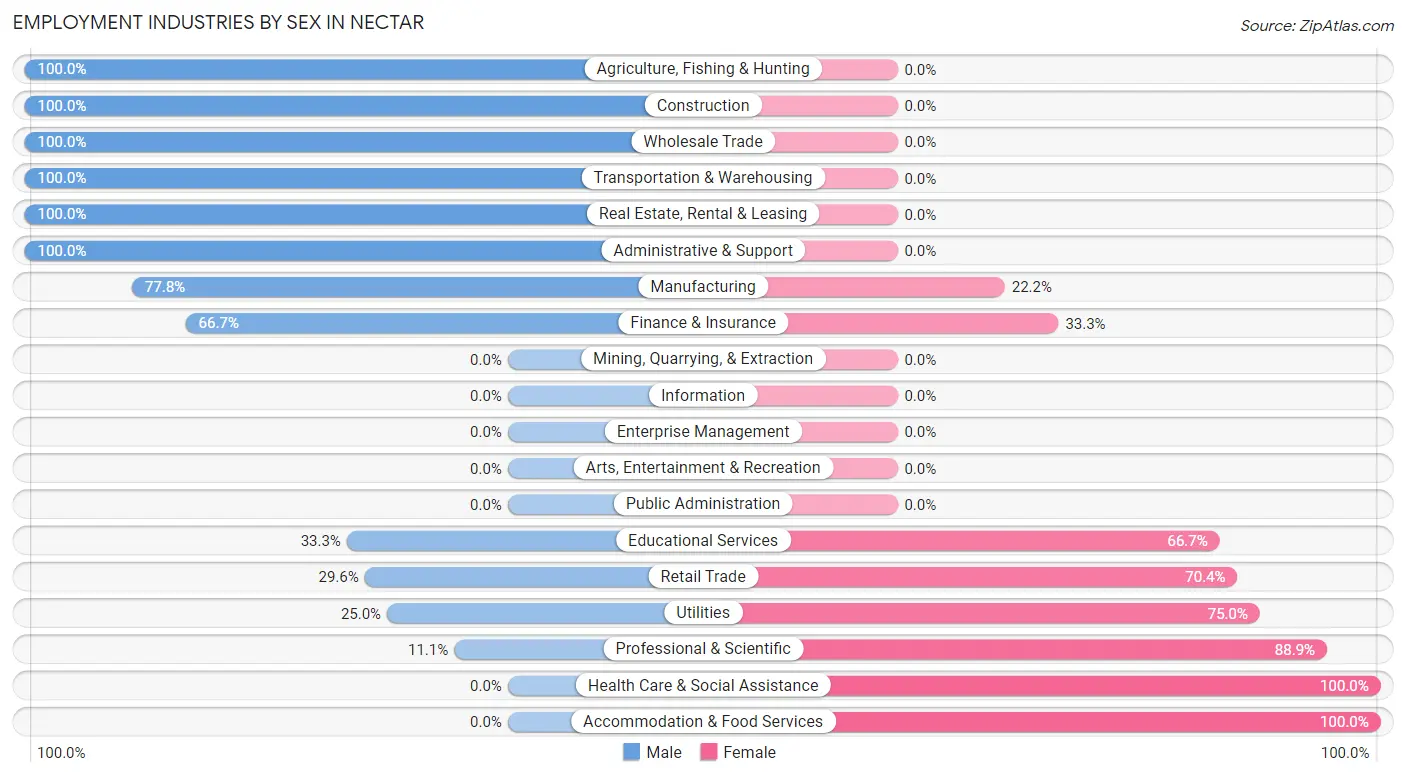
| Industry | Male | Female |
| Agriculture, Fishing & Hunting | 7 (100.0%) | 0 (0.0%) |
| Mining, Quarrying, & Extraction | 0 (0.0%) | 0 (0.0%) |
| Construction | 40 (100.0%) | 0 (0.0%) |
| Manufacturing | 7 (77.8%) | 2 (22.2%) |
| Wholesale Trade | 3 (100.0%) | 0 (0.0%) |
| Retail Trade | 8 (29.6%) | 19 (70.4%) |
| Transportation & Warehousing | 8 (100.0%) | 0 (0.0%) |
| Utilities | 1 (25.0%) | 3 (75.0%) |
| Information | 0 (0.0%) | 0 (0.0%) |
| Finance & Insurance | 2 (66.7%) | 1 (33.3%) |
| Real Estate, Rental & Leasing | 3 (100.0%) | 0 (0.0%) |
| Professional & Scientific | 1 (11.1%) | 8 (88.9%) |
| Enterprise Management | 0 (0.0%) | 0 (0.0%) |
| Administrative & Support | 8 (100.0%) | 0 (0.0%) |
| Educational Services | 6 (33.3%) | 12 (66.7%) |
| Health Care & Social Assistance | 0 (0.0%) | 9 (100.0%) |
| Arts, Entertainment & Recreation | 0 (0.0%) | 0 (0.0%) |
| Accommodation & Food Services | 0 (0.0%) | 3 (100.0%) |
| Public Administration | 0 (0.0%) | 0 (0.0%) |
| Total | 104 (57.5%) | 77 (42.5%) |
Education in Nectar
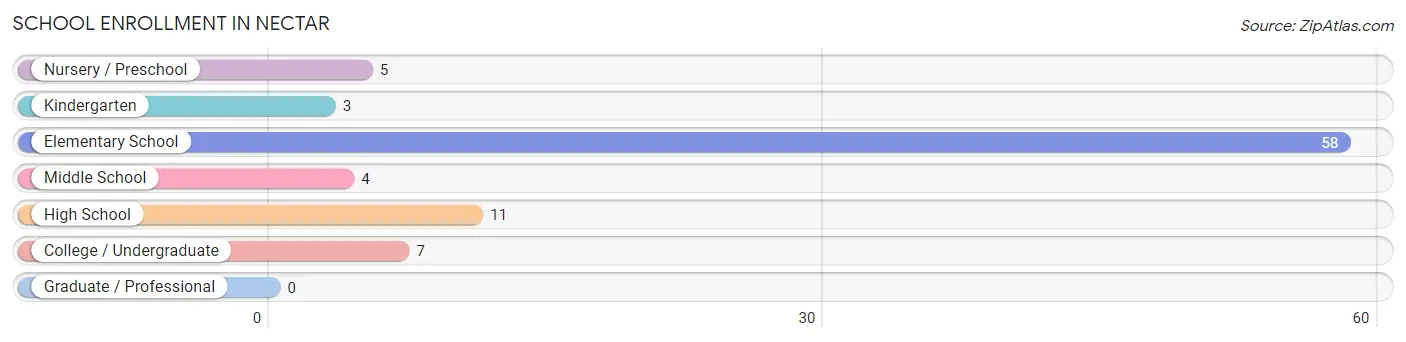
School Enrollment in Nectar
The most common levels of schooling among the 88 students in Nectar are elementary school (58 | 65.9%), high school (11 | 12.5%), and college / undergraduate (7 | 8.0%).
| School Level | # Students | % Students |
| Nursery / Preschool | 5 | 5.7% |
| Kindergarten | 3 | 3.4% |
| Elementary School | 58 | 65.9% |
| Middle School | 4 | 4.5% |
| High School | 11 | 12.5% |
| College / Undergraduate | 7 | 8.0% |
| Graduate / Professional | 0 | 0.0% |
| Total | 88 | 100.0% |
School Enrollment by Age by Funding Source in Nectar
Out of a total of 88 students who are enrolled in schools in Nectar, 4 (4.5%) attend a private institution, while the remaining 84 (95.5%) are enrolled in public schools. The age group of 3 to 4 year olds has the highest likelihood of being enrolled in private schools, with 1 (25.0% in the age bracket) enrolled. Conversely, the age group of 5 to 9 year old has the lowest likelihood of being enrolled in a private school, with 41 (100.0% in the age bracket) attending a public institution.
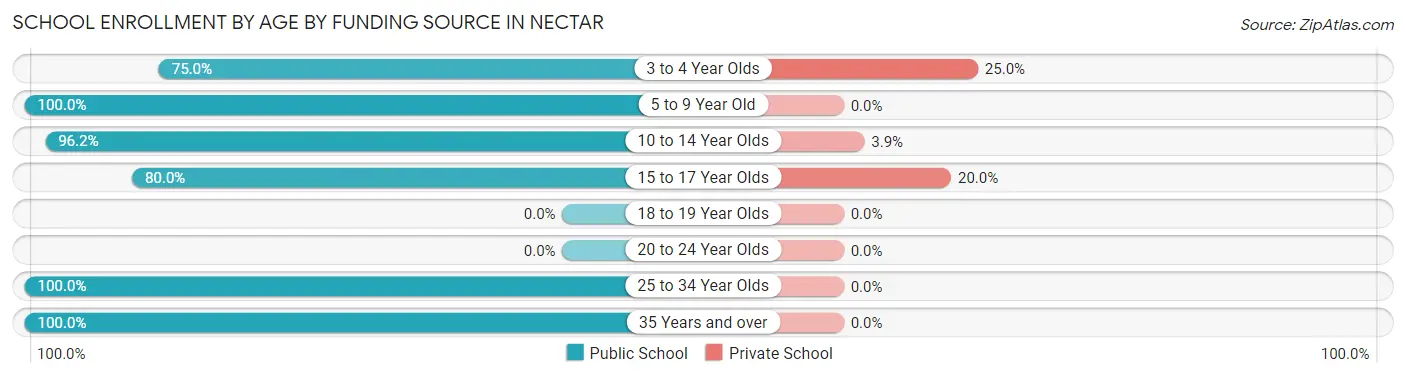
| Age Bracket | Public School | Private School |
| 3 to 4 Year Olds | 3 (75.0%) | 1 (25.0%) |
| 5 to 9 Year Old | 41 (100.0%) | 0 (0.0%) |
| 10 to 14 Year Olds | 25 (96.2%) | 1 (3.8%) |
| 15 to 17 Year Olds | 8 (80.0%) | 2 (20.0%) |
| 18 to 19 Year Olds | 0 (0.0%) | 0 (0.0%) |
| 20 to 24 Year Olds | 0 (0.0%) | 0 (0.0%) |
| 25 to 34 Year Olds | 2 (100.0%) | 0 (0.0%) |
| 35 Years and over | 5 (100.0%) | 0 (0.0%) |
| Total | 84 (95.5%) | 4 (4.5%) |
Educational Attainment by Field of Study in Nectar
Education (6 | 40.0%), visual & performing arts (3 | 20.0%), engineering (2 | 13.3%), business (2 | 13.3%), and bio, nature & agricultural (1 | 6.7%) are the most common fields of study among 15 individuals in Nectar who have obtained a bachelor's degree or higher.
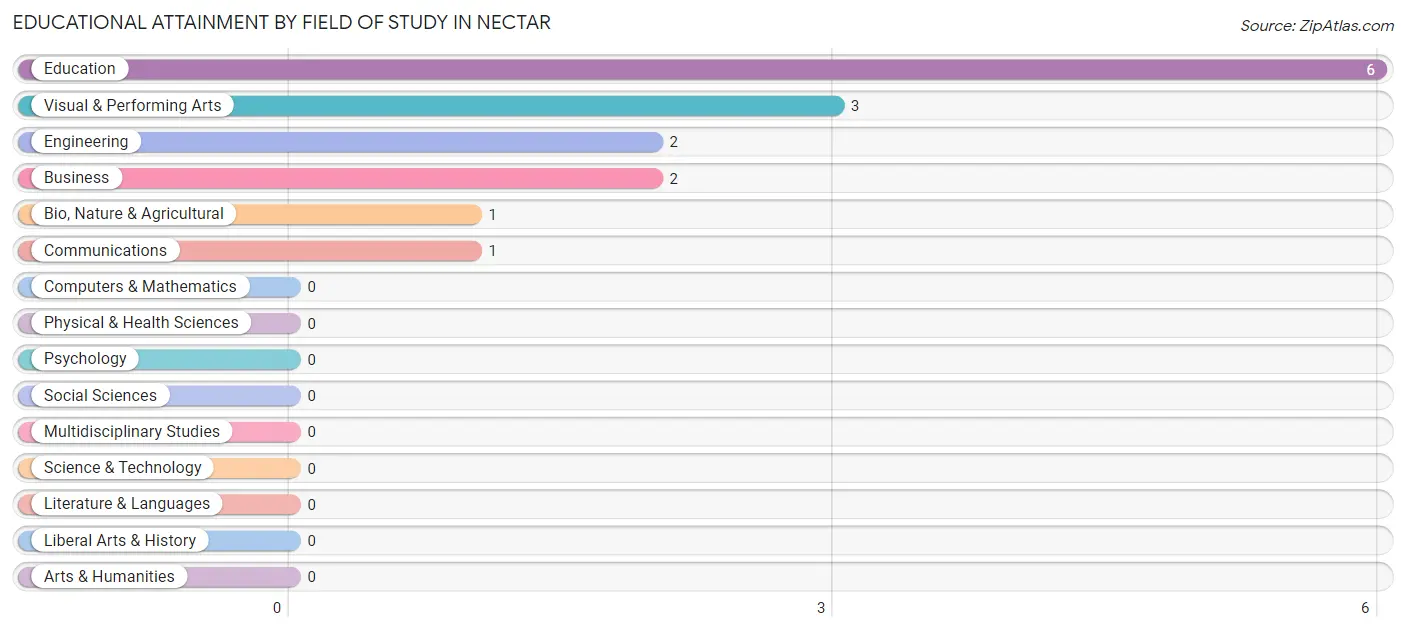
| Field of Study | # Graduates | % Graduates |
| Computers & Mathematics | 0 | 0.0% |
| Bio, Nature & Agricultural | 1 | 6.7% |
| Physical & Health Sciences | 0 | 0.0% |
| Psychology | 0 | 0.0% |
| Social Sciences | 0 | 0.0% |
| Engineering | 2 | 13.3% |
| Multidisciplinary Studies | 0 | 0.0% |
| Science & Technology | 0 | 0.0% |
| Business | 2 | 13.3% |
| Education | 6 | 40.0% |
| Literature & Languages | 0 | 0.0% |
| Liberal Arts & History | 0 | 0.0% |
| Visual & Performing Arts | 3 | 20.0% |
| Communications | 1 | 6.7% |
| Arts & Humanities | 0 | 0.0% |
| Total | 15 | 100.0% |
Transportation & Commute in Nectar
Vehicle Availability by Sex in Nectar
The most prevalent vehicle ownership categories in Nectar are males with 2 vehicles (37, accounting for 35.9%) and females with 2 vehicles (43, making up 48.7%).
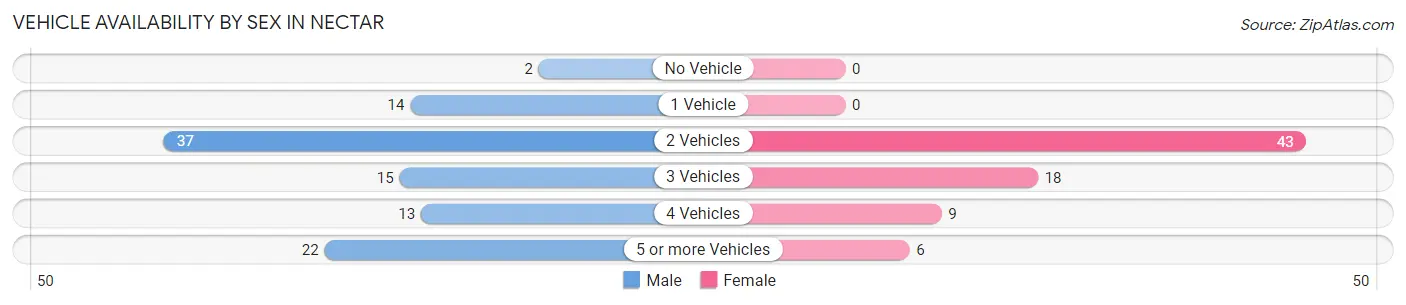
| Vehicles Available | Male | Female |
| No Vehicle | 2 (1.9%) | 0 (0.0%) |
| 1 Vehicle | 14 (13.6%) | 0 (0.0%) |
| 2 Vehicles | 37 (35.9%) | 43 (56.6%) |
| 3 Vehicles | 15 (14.6%) | 18 (23.7%) |
| 4 Vehicles | 13 (12.6%) | 9 (11.8%) |
| 5 or more Vehicles | 22 (21.4%) | 6 (7.9%) |
| Total | 103 (100.0%) | 76 (100.0%) |
Commute Time in Nectar
The most frequently occuring commute durations in Nectar are 45 to 59 minutes (50 commuters, 29.9%), 10 to 14 minutes (26 commuters, 15.6%), and 20 to 24 minutes (21 commuters, 12.6%).
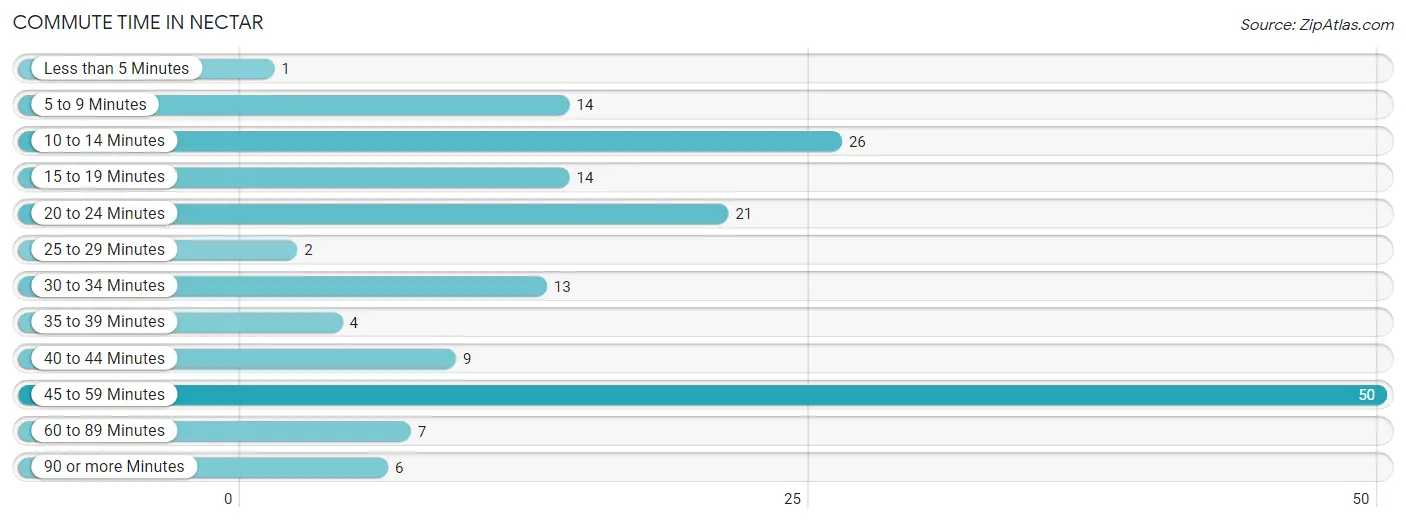
| Commute Time | # Commuters | % Commuters |
| Less than 5 Minutes | 1 | 0.6% |
| 5 to 9 Minutes | 14 | 8.4% |
| 10 to 14 Minutes | 26 | 15.6% |
| 15 to 19 Minutes | 14 | 8.4% |
| 20 to 24 Minutes | 21 | 12.6% |
| 25 to 29 Minutes | 2 | 1.2% |
| 30 to 34 Minutes | 13 | 7.8% |
| 35 to 39 Minutes | 4 | 2.4% |
| 40 to 44 Minutes | 9 | 5.4% |
| 45 to 59 Minutes | 50 | 29.9% |
| 60 to 89 Minutes | 7 | 4.2% |
| 90 or more Minutes | 6 | 3.6% |
Commute Time by Sex in Nectar
The most common commute times in Nectar are 45 to 59 minutes (21 commuters, 23.1%) for males and 45 to 59 minutes (29 commuters, 38.2%) for females.
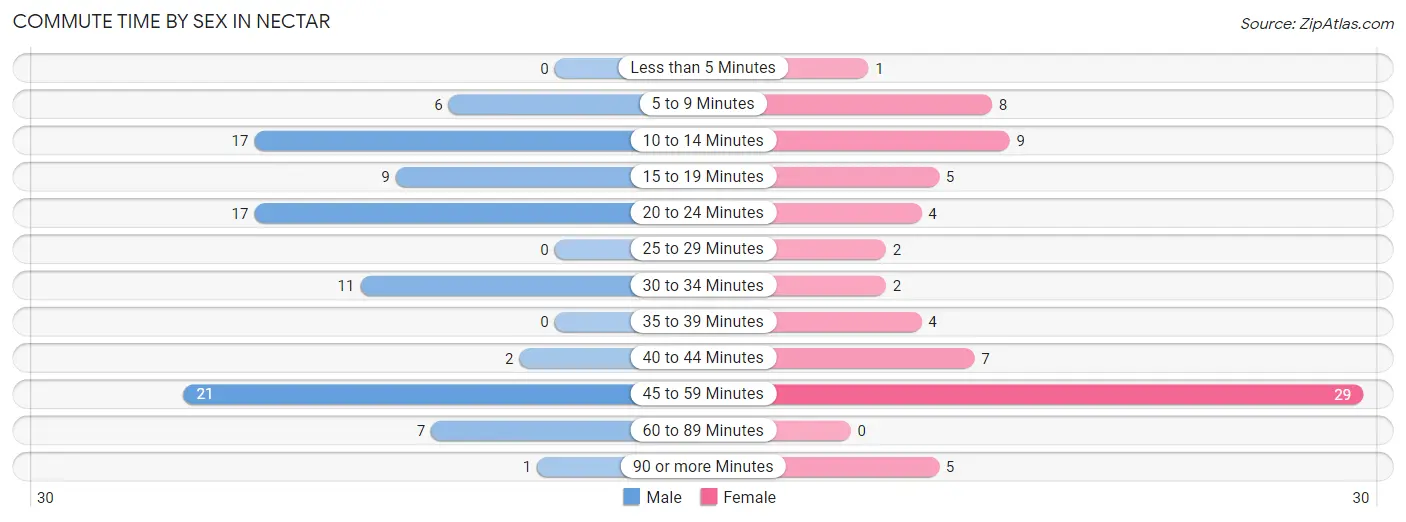
| Commute Time | Male | Female |
| Less than 5 Minutes | 0 (0.0%) | 1 (1.3%) |
| 5 to 9 Minutes | 6 (6.6%) | 8 (10.5%) |
| 10 to 14 Minutes | 17 (18.7%) | 9 (11.8%) |
| 15 to 19 Minutes | 9 (9.9%) | 5 (6.6%) |
| 20 to 24 Minutes | 17 (18.7%) | 4 (5.3%) |
| 25 to 29 Minutes | 0 (0.0%) | 2 (2.6%) |
| 30 to 34 Minutes | 11 (12.1%) | 2 (2.6%) |
| 35 to 39 Minutes | 0 (0.0%) | 4 (5.3%) |
| 40 to 44 Minutes | 2 (2.2%) | 7 (9.2%) |
| 45 to 59 Minutes | 21 (23.1%) | 29 (38.2%) |
| 60 to 89 Minutes | 7 (7.7%) | 0 (0.0%) |
| 90 or more Minutes | 1 (1.1%) | 5 (6.6%) |
Time of Departure to Work by Sex in Nectar
The most frequent times of departure to work in Nectar are 6:00 AM to 6:29 AM (32, 35.2%) for males and 6:00 AM to 6:29 AM (36, 47.4%) for females.
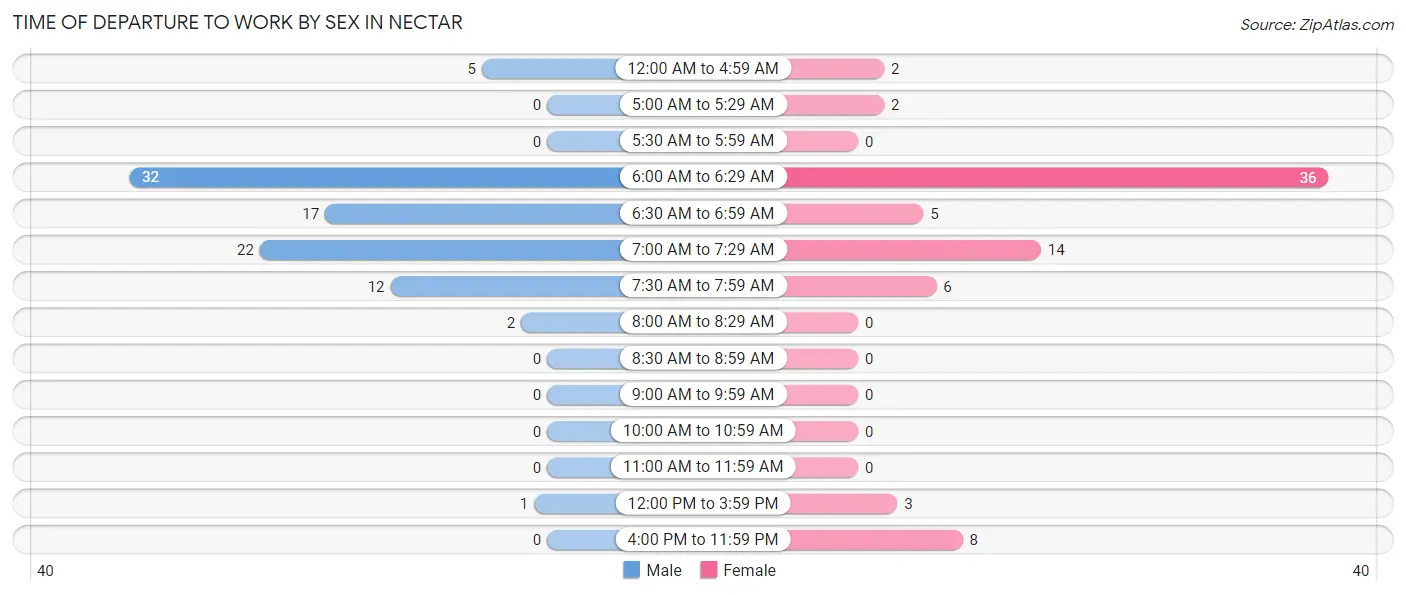
| Time of Departure | Male | Female |
| 12:00 AM to 4:59 AM | 5 (5.5%) | 2 (2.6%) |
| 5:00 AM to 5:29 AM | 0 (0.0%) | 2 (2.6%) |
| 5:30 AM to 5:59 AM | 0 (0.0%) | 0 (0.0%) |
| 6:00 AM to 6:29 AM | 32 (35.2%) | 36 (47.4%) |
| 6:30 AM to 6:59 AM | 17 (18.7%) | 5 (6.6%) |
| 7:00 AM to 7:29 AM | 22 (24.2%) | 14 (18.4%) |
| 7:30 AM to 7:59 AM | 12 (13.2%) | 6 (7.9%) |
| 8:00 AM to 8:29 AM | 2 (2.2%) | 0 (0.0%) |
| 8:30 AM to 8:59 AM | 0 (0.0%) | 0 (0.0%) |
| 9:00 AM to 9:59 AM | 0 (0.0%) | 0 (0.0%) |
| 10:00 AM to 10:59 AM | 0 (0.0%) | 0 (0.0%) |
| 11:00 AM to 11:59 AM | 0 (0.0%) | 0 (0.0%) |
| 12:00 PM to 3:59 PM | 1 (1.1%) | 3 (4.0%) |
| 4:00 PM to 11:59 PM | 0 (0.0%) | 8 (10.5%) |
| Total | 91 (100.0%) | 76 (100.0%) |
Housing Occupancy in Nectar
Occupancy by Ownership in Nectar
Of the total 141 dwellings in Nectar, owner-occupied units account for 102 (72.3%), while renter-occupied units make up 39 (27.7%).
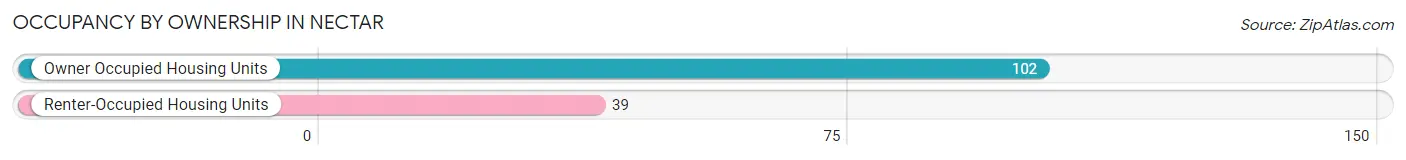
| Occupancy | # Housing Units | % Housing Units |
| Owner Occupied Housing Units | 102 | 72.3% |
| Renter-Occupied Housing Units | 39 | 27.7% |
| Total Occupied Housing Units | 141 | 100.0% |
Occupancy by Household Size in Nectar
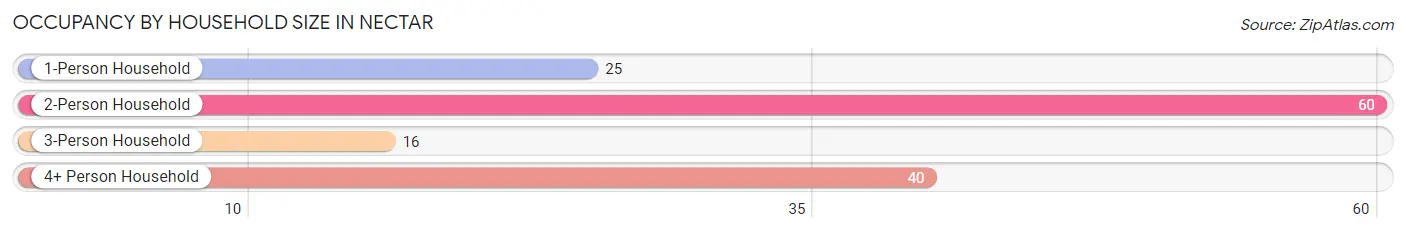
| Household Size | # Housing Units | % Housing Units |
| 1-Person Household | 25 | 17.7% |
| 2-Person Household | 60 | 42.5% |
| 3-Person Household | 16 | 11.4% |
| 4+ Person Household | 40 | 28.4% |
| Total Housing Units | 141 | 100.0% |
Occupancy by Ownership by Household Size in Nectar
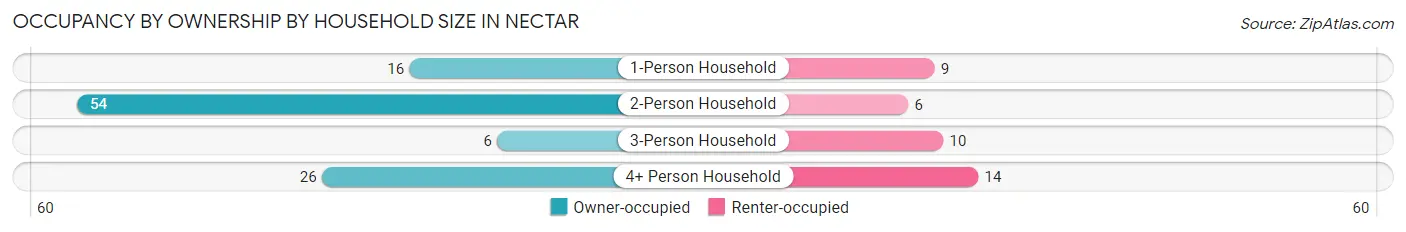
| Household Size | Owner-occupied | Renter-occupied |
| 1-Person Household | 16 (64.0%) | 9 (36.0%) |
| 2-Person Household | 54 (90.0%) | 6 (10.0%) |
| 3-Person Household | 6 (37.5%) | 10 (62.5%) |
| 4+ Person Household | 26 (65.0%) | 14 (35.0%) |
| Total Housing Units | 102 (72.3%) | 39 (27.7%) |
Occupancy by Educational Attainment in Nectar
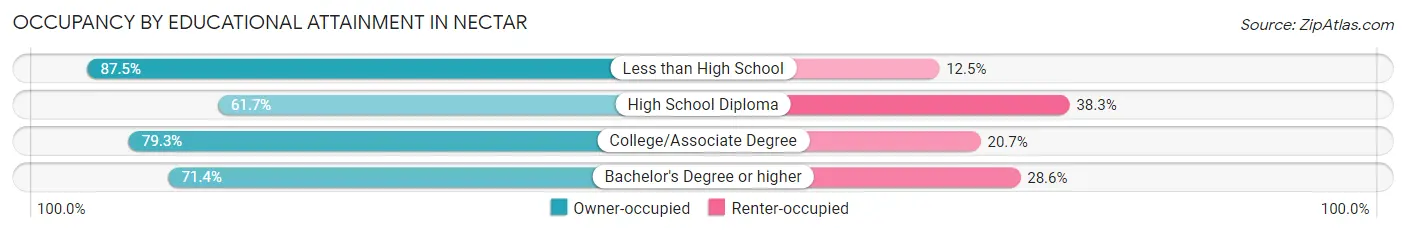
| Household Size | Owner-occupied | Renter-occupied |
| Less than High School | 14 (87.5%) | 2 (12.5%) |
| High School Diploma | 37 (61.7%) | 23 (38.3%) |
| College/Associate Degree | 46 (79.3%) | 12 (20.7%) |
| Bachelor's Degree or higher | 5 (71.4%) | 2 (28.6%) |
Occupancy by Age of Householder in Nectar
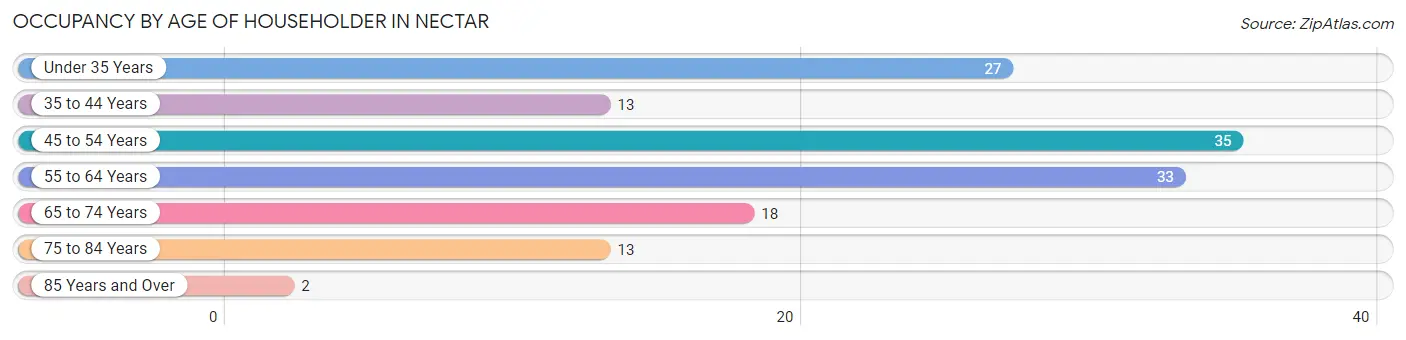
| Age Bracket | # Households | % Households |
| Under 35 Years | 27 | 19.2% |
| 35 to 44 Years | 13 | 9.2% |
| 45 to 54 Years | 35 | 24.8% |
| 55 to 64 Years | 33 | 23.4% |
| 65 to 74 Years | 18 | 12.8% |
| 75 to 84 Years | 13 | 9.2% |
| 85 Years and Over | 2 | 1.4% |
| Total | 141 | 100.0% |
Housing Finances in Nectar
Median Income by Occupancy in Nectar
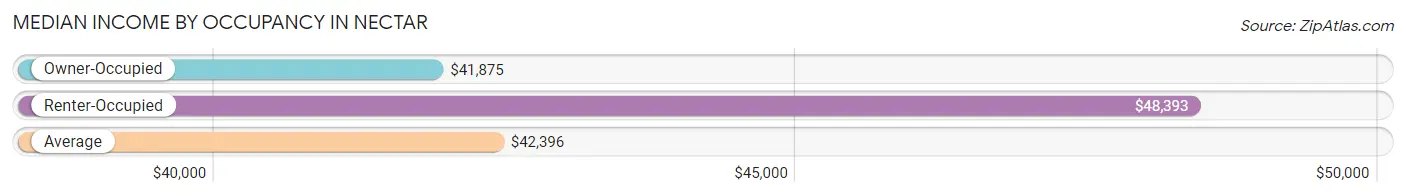
| Occupancy Type | # Households | Median Income |
| Owner-Occupied | 102 (72.3%) | $41,875 |
| Renter-Occupied | 39 (27.7%) | $48,393 |
| Average | 141 (100.0%) | $42,396 |
Occupancy by Householder Income Bracket in Nectar
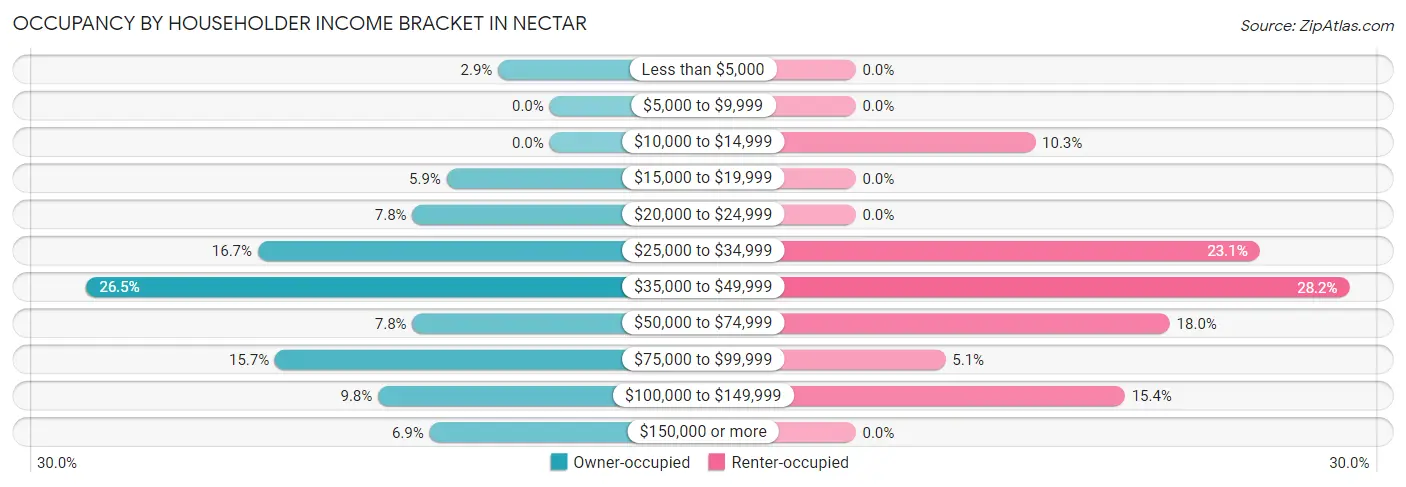
| Income Bracket | Owner-occupied | Renter-occupied |
| Less than $5,000 | 3 (2.9%) | 0 (0.0%) |
| $5,000 to $9,999 | 0 (0.0%) | 0 (0.0%) |
| $10,000 to $14,999 | 0 (0.0%) | 4 (10.3%) |
| $15,000 to $19,999 | 6 (5.9%) | 0 (0.0%) |
| $20,000 to $24,999 | 8 (7.8%) | 0 (0.0%) |
| $25,000 to $34,999 | 17 (16.7%) | 9 (23.1%) |
| $35,000 to $49,999 | 27 (26.5%) | 11 (28.2%) |
| $50,000 to $74,999 | 8 (7.8%) | 7 (17.9%) |
| $75,000 to $99,999 | 16 (15.7%) | 2 (5.1%) |
| $100,000 to $149,999 | 10 (9.8%) | 6 (15.4%) |
| $150,000 or more | 7 (6.9%) | 0 (0.0%) |
| Total | 102 (100.0%) | 39 (100.0%) |
Monthly Housing Cost Tiers in Nectar
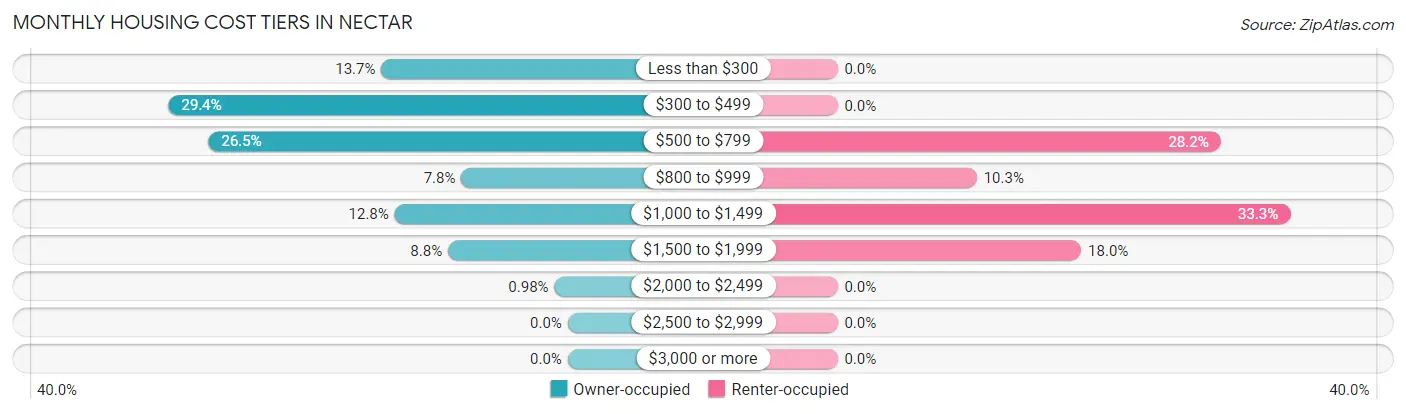
| Monthly Cost | Owner-occupied | Renter-occupied |
| Less than $300 | 14 (13.7%) | 0 (0.0%) |
| $300 to $499 | 30 (29.4%) | 0 (0.0%) |
| $500 to $799 | 27 (26.5%) | 11 (28.2%) |
| $800 to $999 | 8 (7.8%) | 4 (10.3%) |
| $1,000 to $1,499 | 13 (12.8%) | 13 (33.3%) |
| $1,500 to $1,999 | 9 (8.8%) | 7 (17.9%) |
| $2,000 to $2,499 | 1 (1.0%) | 0 (0.0%) |
| $2,500 to $2,999 | 0 (0.0%) | 0 (0.0%) |
| $3,000 or more | 0 (0.0%) | 0 (0.0%) |
| Total | 102 (100.0%) | 39 (100.0%) |
Physical Housing Characteristics in Nectar
Housing Structures in Nectar
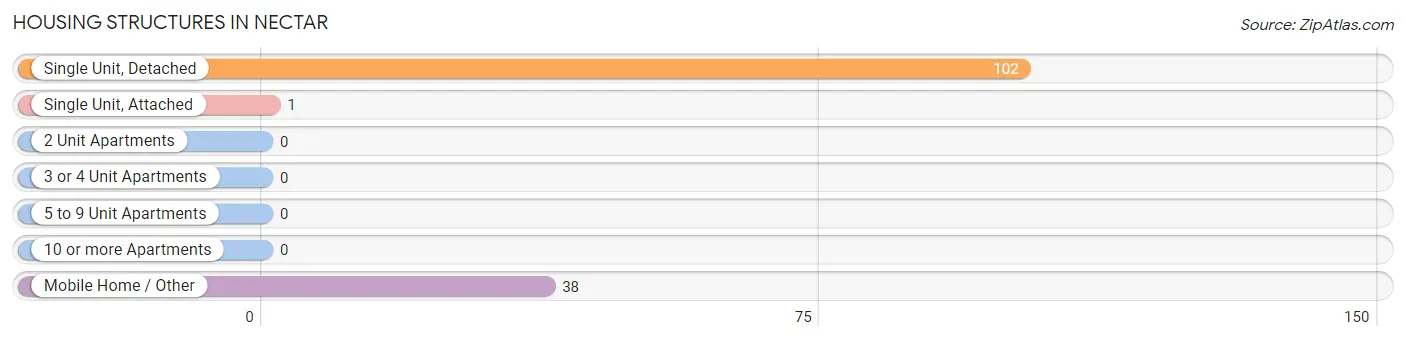
| Structure Type | # Housing Units | % Housing Units |
| Single Unit, Detached | 102 | 72.3% |
| Single Unit, Attached | 1 | 0.7% |
| 2 Unit Apartments | 0 | 0.0% |
| 3 or 4 Unit Apartments | 0 | 0.0% |
| 5 to 9 Unit Apartments | 0 | 0.0% |
| 10 or more Apartments | 0 | 0.0% |
| Mobile Home / Other | 38 | 27.0% |
| Total | 141 | 100.0% |
Housing Structures by Occupancy in Nectar
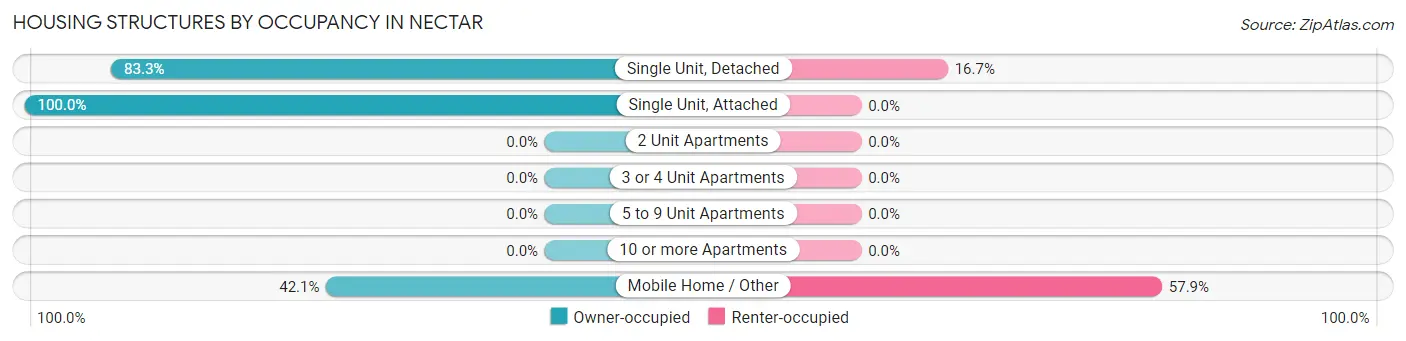
| Structure Type | Owner-occupied | Renter-occupied |
| Single Unit, Detached | 85 (83.3%) | 17 (16.7%) |
| Single Unit, Attached | 1 (100.0%) | 0 (0.0%) |
| 2 Unit Apartments | 0 (0.0%) | 0 (0.0%) |
| 3 or 4 Unit Apartments | 0 (0.0%) | 0 (0.0%) |
| 5 to 9 Unit Apartments | 0 (0.0%) | 0 (0.0%) |
| 10 or more Apartments | 0 (0.0%) | 0 (0.0%) |
| Mobile Home / Other | 16 (42.1%) | 22 (57.9%) |
| Total | 102 (72.3%) | 39 (27.7%) |
Housing Structures by Number of Rooms in Nectar
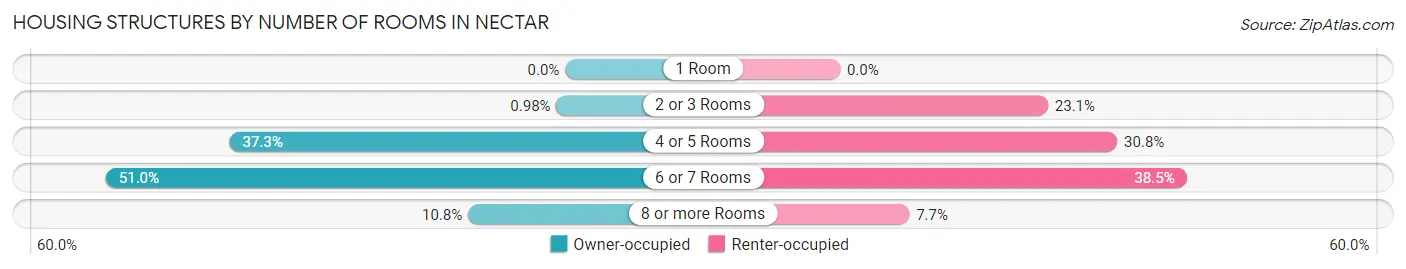
| Number of Rooms | Owner-occupied | Renter-occupied |
| 1 Room | 0 (0.0%) | 0 (0.0%) |
| 2 or 3 Rooms | 1 (1.0%) | 9 (23.1%) |
| 4 or 5 Rooms | 38 (37.2%) | 12 (30.8%) |
| 6 or 7 Rooms | 52 (51.0%) | 15 (38.5%) |
| 8 or more Rooms | 11 (10.8%) | 3 (7.7%) |
| Total | 102 (100.0%) | 39 (100.0%) |
Housing Structure by Heating Type in Nectar
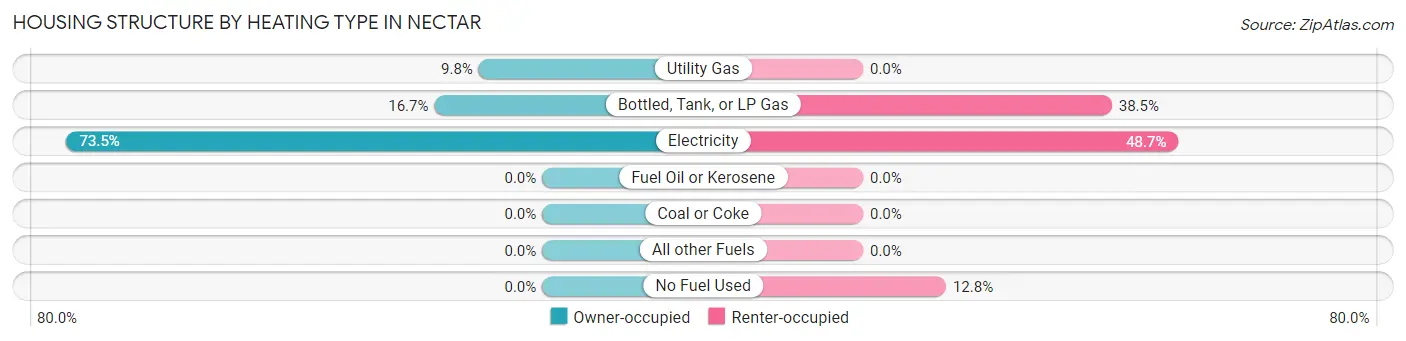
| Heating Type | Owner-occupied | Renter-occupied |
| Utility Gas | 10 (9.8%) | 0 (0.0%) |
| Bottled, Tank, or LP Gas | 17 (16.7%) | 15 (38.5%) |
| Electricity | 75 (73.5%) | 19 (48.7%) |
| Fuel Oil or Kerosene | 0 (0.0%) | 0 (0.0%) |
| Coal or Coke | 0 (0.0%) | 0 (0.0%) |
| All other Fuels | 0 (0.0%) | 0 (0.0%) |
| No Fuel Used | 0 (0.0%) | 5 (12.8%) |
| Total | 102 (100.0%) | 39 (100.0%) |
Household Vehicle Usage in Nectar
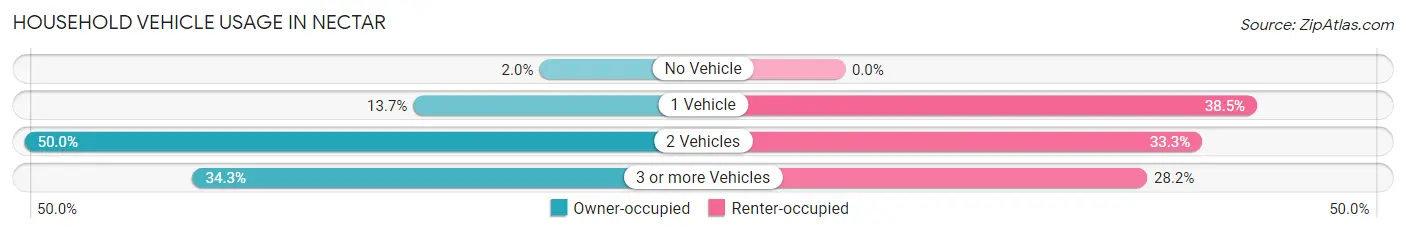
| Vehicles per Household | Owner-occupied | Renter-occupied |
| No Vehicle | 2 (2.0%) | 0 (0.0%) |
| 1 Vehicle | 14 (13.7%) | 15 (38.5%) |
| 2 Vehicles | 51 (50.0%) | 13 (33.3%) |
| 3 or more Vehicles | 35 (34.3%) | 11 (28.2%) |
| Total | 102 (100.0%) | 39 (100.0%) |
Real Estate & Mortgages in Nectar
Real Estate and Mortgage Overview in Nectar
| Characteristic | Without Mortgage | With Mortgage |
| Housing Units | 70 | 32 |
| Median Property Value | $147,200 | $165,600 |
| Median Household Income | $41,364 | $2 |
| Monthly Housing Costs | $450 | $0 |
| Real Estate Taxes | $514 | $11 |
Property Value by Mortgage Status in Nectar
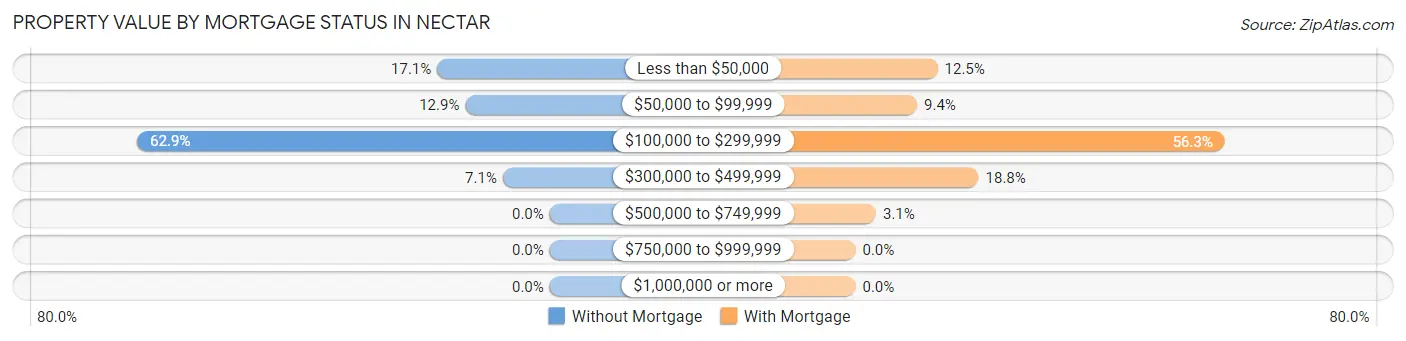
| Property Value | Without Mortgage | With Mortgage |
| Less than $50,000 | 12 (17.1%) | 4 (12.5%) |
| $50,000 to $99,999 | 9 (12.9%) | 3 (9.4%) |
| $100,000 to $299,999 | 44 (62.9%) | 18 (56.2%) |
| $300,000 to $499,999 | 5 (7.1%) | 6 (18.8%) |
| $500,000 to $749,999 | 0 (0.0%) | 1 (3.1%) |
| $750,000 to $999,999 | 0 (0.0%) | 0 (0.0%) |
| $1,000,000 or more | 0 (0.0%) | 0 (0.0%) |
| Total | 70 (100.0%) | 32 (100.0%) |
Household Income by Mortgage Status in Nectar
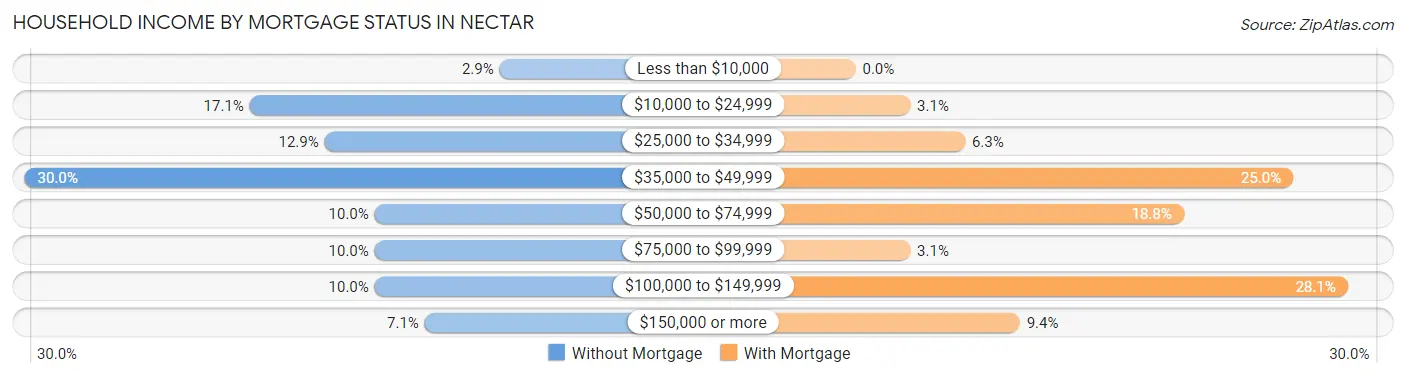
| Household Income | Without Mortgage | With Mortgage |
| Less than $10,000 | 2 (2.9%) | 0 (0.0%) |
| $10,000 to $24,999 | 12 (17.1%) | 1 (3.1%) |
| $25,000 to $34,999 | 9 (12.9%) | 2 (6.2%) |
| $35,000 to $49,999 | 21 (30.0%) | 8 (25.0%) |
| $50,000 to $74,999 | 7 (10.0%) | 6 (18.8%) |
| $75,000 to $99,999 | 7 (10.0%) | 1 (3.1%) |
| $100,000 to $149,999 | 7 (10.0%) | 9 (28.1%) |
| $150,000 or more | 5 (7.1%) | 3 (9.4%) |
| Total | 70 (100.0%) | 32 (100.0%) |
Property Value to Household Income Ratio in Nectar
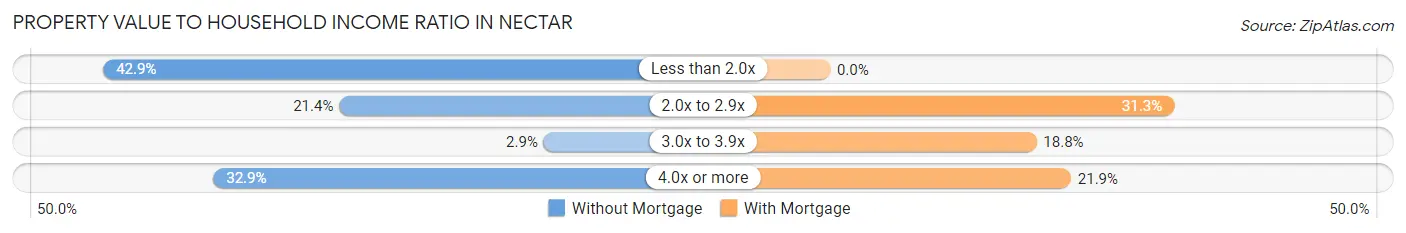
| Value-to-Income Ratio | Without Mortgage | With Mortgage |
| Less than 2.0x | 30 (42.9%) | 0 (0.0%) |
| 2.0x to 2.9x | 15 (21.4%) | 10 (31.2%) |
| 3.0x to 3.9x | 2 (2.9%) | 6 (18.8%) |
| 4.0x or more | 23 (32.9%) | 7 (21.9%) |
| Total | 70 (100.0%) | 32 (100.0%) |
Real Estate Taxes by Mortgage Status in Nectar
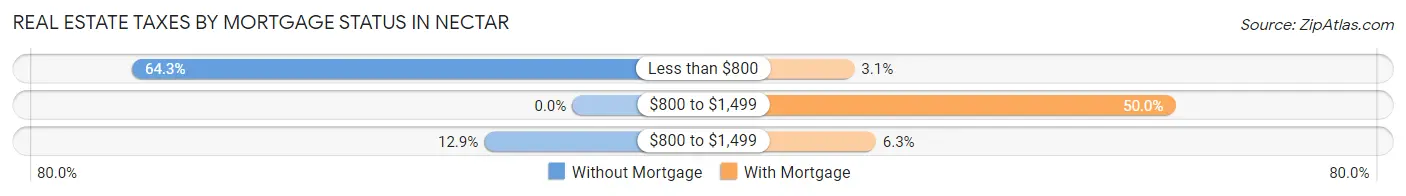
| Property Taxes | Without Mortgage | With Mortgage |
| Less than $800 | 45 (64.3%) | 1 (3.1%) |
| $800 to $1,499 | 0 (0.0%) | 16 (50.0%) |
| $800 to $1,499 | 9 (12.9%) | 2 (6.2%) |
| Total | 70 (100.0%) | 32 (100.0%) |
Health & Disability in Nectar
Health Insurance Coverage by Age in Nectar
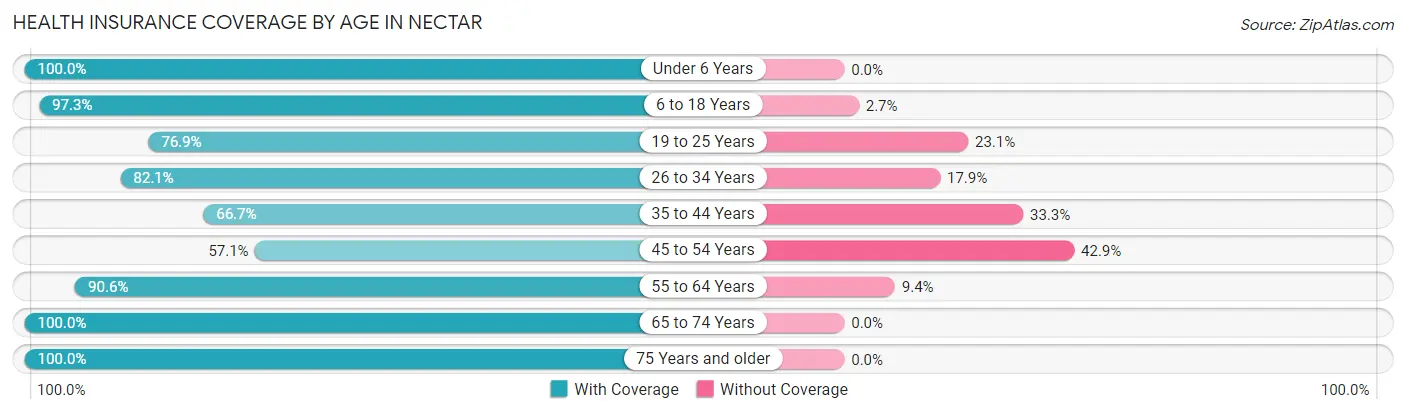
| Age Bracket | With Coverage | Without Coverage |
| Under 6 Years | 90 (100.0%) | 0 (0.0%) |
| 6 to 18 Years | 72 (97.3%) | 2 (2.7%) |
| 19 to 25 Years | 30 (76.9%) | 9 (23.1%) |
| 26 to 34 Years | 46 (82.1%) | 10 (17.9%) |
| 35 to 44 Years | 18 (66.7%) | 9 (33.3%) |
| 45 to 54 Years | 40 (57.1%) | 30 (42.9%) |
| 55 to 64 Years | 48 (90.6%) | 5 (9.4%) |
| 65 to 74 Years | 40 (100.0%) | 0 (0.0%) |
| 75 Years and older | 27 (100.0%) | 0 (0.0%) |
| Total | 411 (86.3%) | 65 (13.7%) |
Health Insurance Coverage by Citizenship Status in Nectar
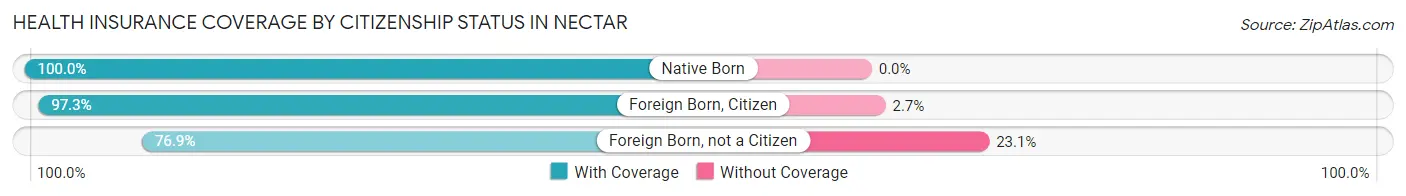
| Citizenship Status | With Coverage | Without Coverage |
| Native Born | 90 (100.0%) | 0 (0.0%) |
| Foreign Born, Citizen | 72 (97.3%) | 2 (2.7%) |
| Foreign Born, not a Citizen | 30 (76.9%) | 9 (23.1%) |
Health Insurance Coverage by Household Income in Nectar
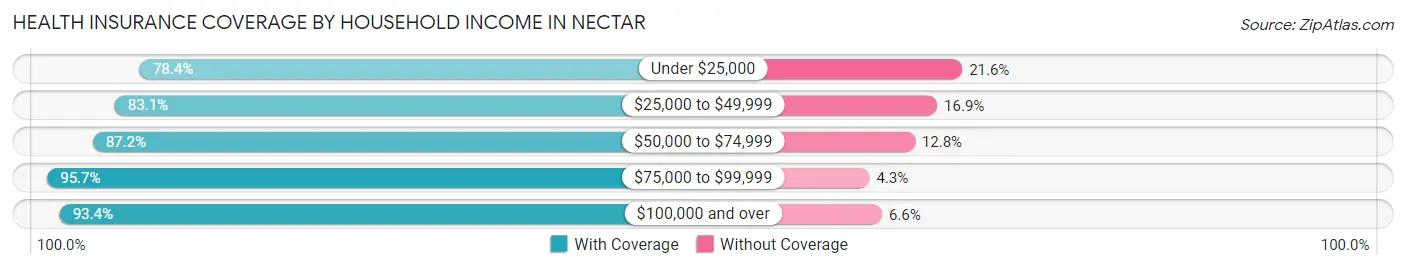
| Household Income | With Coverage | Without Coverage |
| Under $25,000 | 29 (78.4%) | 8 (21.6%) |
| $25,000 to $49,999 | 211 (83.1%) | 43 (16.9%) |
| $50,000 to $74,999 | 41 (87.2%) | 6 (12.8%) |
| $75,000 to $99,999 | 45 (95.7%) | 2 (4.3%) |
| $100,000 and over | 85 (93.4%) | 6 (6.6%) |
Public vs Private Health Insurance Coverage by Age in Nectar
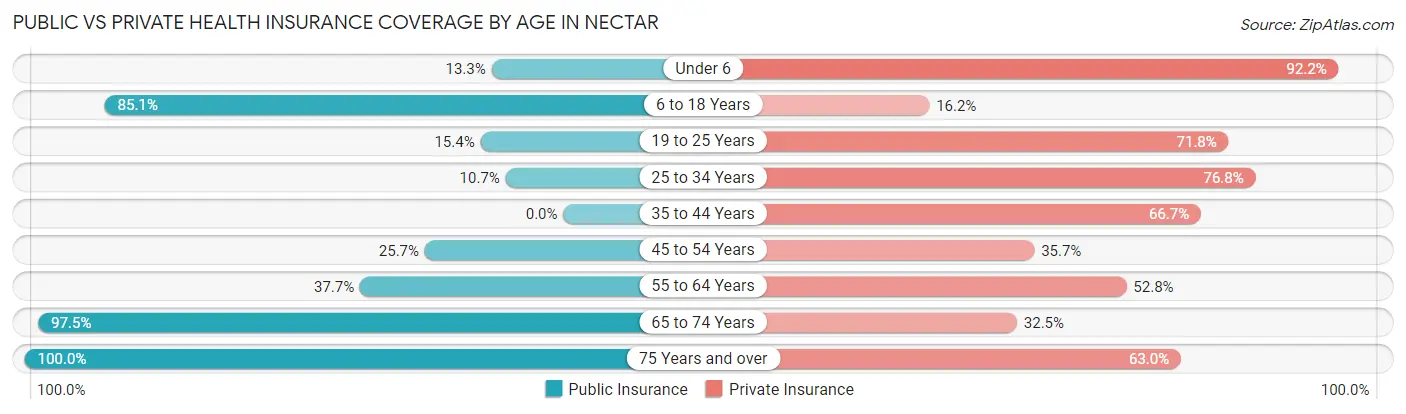
| Age Bracket | Public Insurance | Private Insurance |
| Under 6 | 12 (13.3%) | 83 (92.2%) |
| 6 to 18 Years | 63 (85.1%) | 12 (16.2%) |
| 19 to 25 Years | 6 (15.4%) | 28 (71.8%) |
| 25 to 34 Years | 6 (10.7%) | 43 (76.8%) |
| 35 to 44 Years | 0 (0.0%) | 18 (66.7%) |
| 45 to 54 Years | 18 (25.7%) | 25 (35.7%) |
| 55 to 64 Years | 20 (37.7%) | 28 (52.8%) |
| 65 to 74 Years | 39 (97.5%) | 13 (32.5%) |
| 75 Years and over | 27 (100.0%) | 17 (63.0%) |
| Total | 191 (40.1%) | 267 (56.1%) |
Disability Status by Sex by Age in Nectar
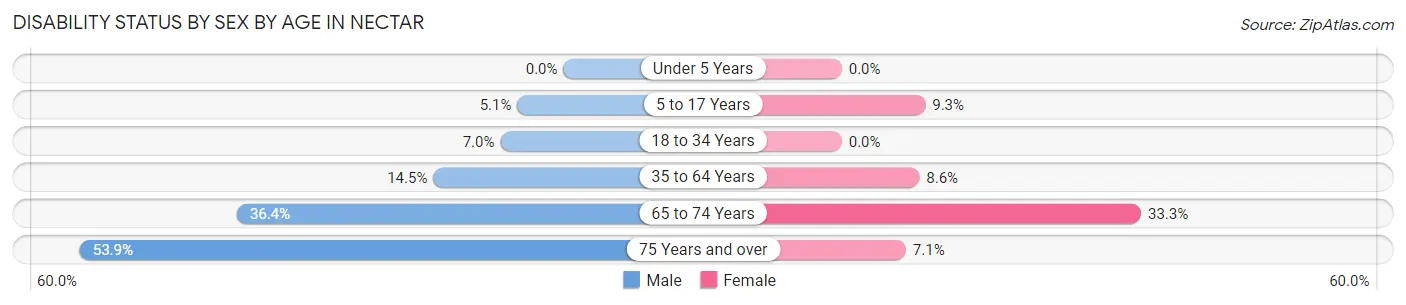
| Age Bracket | Male | Female |
| Under 5 Years | 0 (0.0%) | 0 (0.0%) |
| 5 to 17 Years | 2 (5.1%) | 4 (9.3%) |
| 18 to 34 Years | 4 (7.0%) | 0 (0.0%) |
| 35 to 64 Years | 10 (14.5%) | 7 (8.6%) |
| 65 to 74 Years | 8 (36.4%) | 6 (33.3%) |
| 75 Years and over | 7 (53.8%) | 1 (7.1%) |
Disability Class by Sex by Age in Nectar
Disability Class: Hearing Difficulty
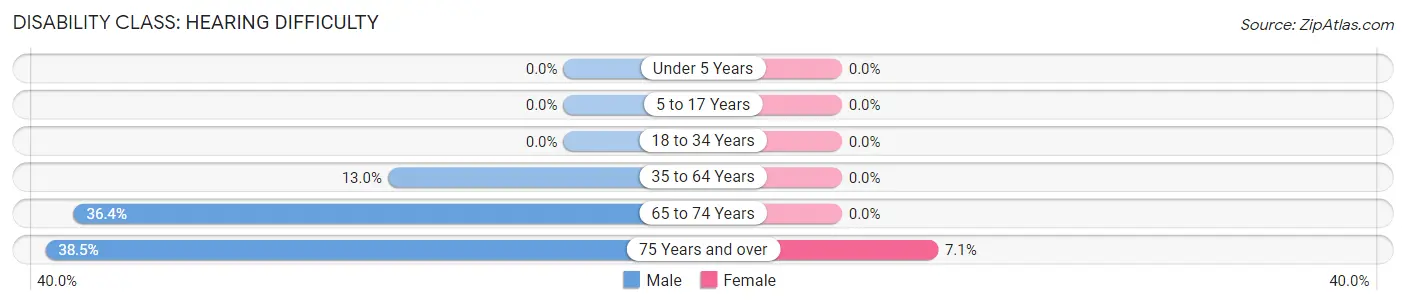
| Age Bracket | Male | Female |
| Under 5 Years | 0 (0.0%) | 0 (0.0%) |
| 5 to 17 Years | 0 (0.0%) | 0 (0.0%) |
| 18 to 34 Years | 0 (0.0%) | 0 (0.0%) |
| 35 to 64 Years | 9 (13.0%) | 0 (0.0%) |
| 65 to 74 Years | 8 (36.4%) | 0 (0.0%) |
| 75 Years and over | 5 (38.5%) | 1 (7.1%) |
Disability Class: Vision Difficulty
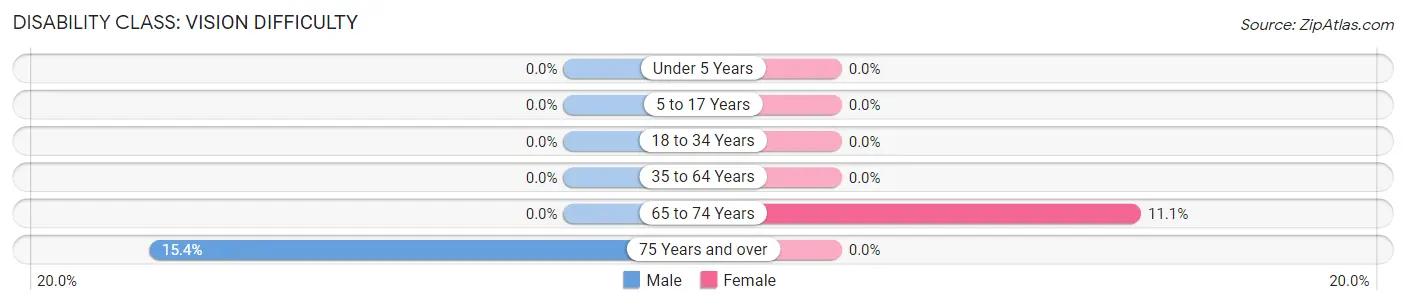
| Age Bracket | Male | Female |
| Under 5 Years | 0 (0.0%) | 0 (0.0%) |
| 5 to 17 Years | 0 (0.0%) | 0 (0.0%) |
| 18 to 34 Years | 0 (0.0%) | 0 (0.0%) |
| 35 to 64 Years | 0 (0.0%) | 0 (0.0%) |
| 65 to 74 Years | 0 (0.0%) | 2 (11.1%) |
| 75 Years and over | 2 (15.4%) | 0 (0.0%) |
Disability Class: Cognitive Difficulty
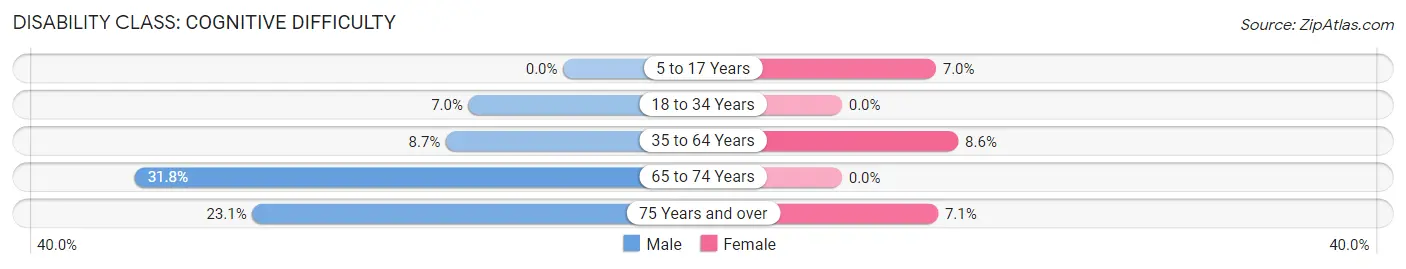
| Age Bracket | Male | Female |
| 5 to 17 Years | 0 (0.0%) | 3 (7.0%) |
| 18 to 34 Years | 4 (7.0%) | 0 (0.0%) |
| 35 to 64 Years | 6 (8.7%) | 7 (8.6%) |
| 65 to 74 Years | 7 (31.8%) | 0 (0.0%) |
| 75 Years and over | 3 (23.1%) | 1 (7.1%) |
Disability Class: Ambulatory Difficulty
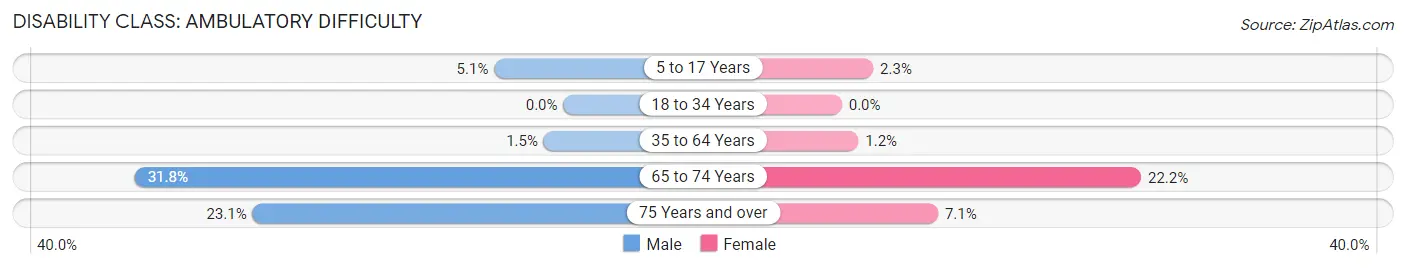
| Age Bracket | Male | Female |
| 5 to 17 Years | 2 (5.1%) | 1 (2.3%) |
| 18 to 34 Years | 0 (0.0%) | 0 (0.0%) |
| 35 to 64 Years | 1 (1.5%) | 1 (1.2%) |
| 65 to 74 Years | 7 (31.8%) | 4 (22.2%) |
| 75 Years and over | 3 (23.1%) | 1 (7.1%) |
Disability Class: Self-Care Difficulty
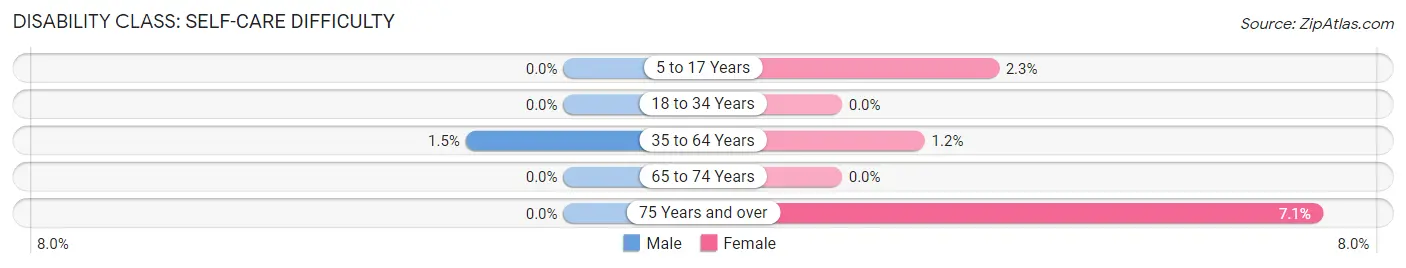
| Age Bracket | Male | Female |
| 5 to 17 Years | 0 (0.0%) | 1 (2.3%) |
| 18 to 34 Years | 0 (0.0%) | 0 (0.0%) |
| 35 to 64 Years | 1 (1.5%) | 1 (1.2%) |
| 65 to 74 Years | 0 (0.0%) | 0 (0.0%) |
| 75 Years and over | 0 (0.0%) | 1 (7.1%) |
Technology Access in Nectar
Computing Device Access in Nectar
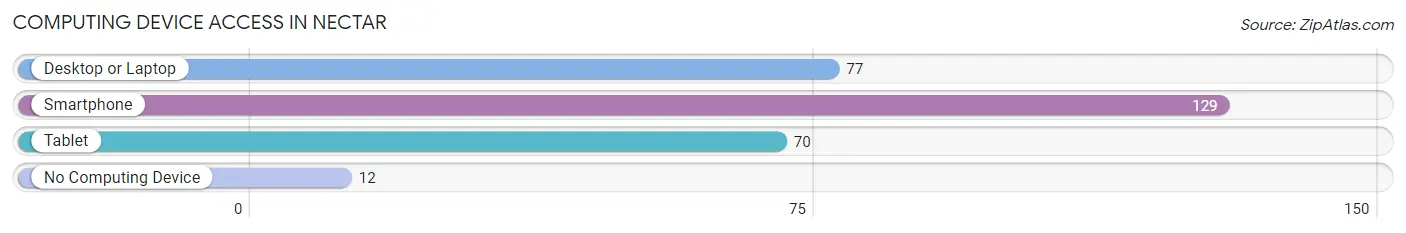
| Device Type | # Households | % Households |
| Desktop or Laptop | 77 | 54.6% |
| Smartphone | 129 | 91.5% |
| Tablet | 70 | 49.6% |
| No Computing Device | 12 | 8.5% |
| Total | 141 | 100.0% |
Internet Access in Nectar
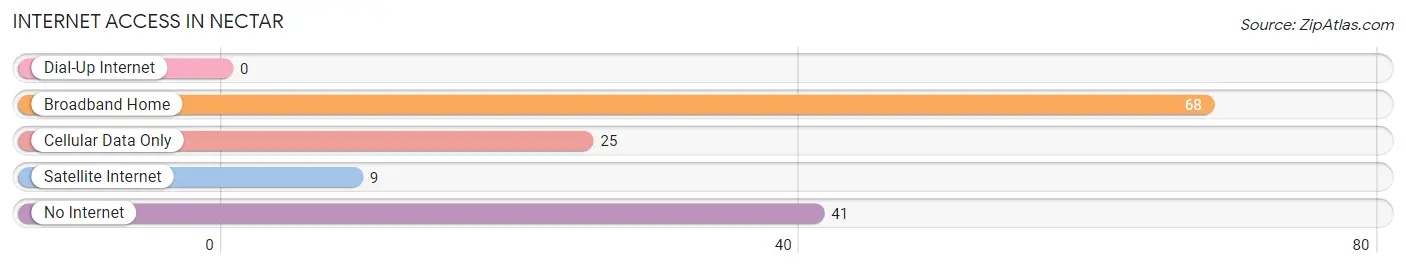
| Internet Type | # Households | % Households |
| Dial-Up Internet | 0 | 0.0% |
| Broadband Home | 68 | 48.2% |
| Cellular Data Only | 25 | 17.7% |
| Satellite Internet | 9 | 6.4% |
| No Internet | 41 | 29.1% |
| Total | 141 | 100.0% |
Nectar Summary
Nectar, Alabama is a small town located in the southeastern corner of the state, in the foothills of the Appalachian Mountains. It is situated in the heart of the Black Belt region, an area known for its rich soil and agricultural production. The town was founded in 1820 and has a population of approximately 1,500 people.
Nectar is located in the county of Clarke, which is part of the Mobile metropolitan area. The town is situated on the banks of the Tombigbee River, which provides a source of water for the area. The town is also located near the Tombigbee National Forest, which provides a variety of recreational activities for residents and visitors alike.
Geographically, Nectar is located in a region of rolling hills and valleys, with the Tombigbee River running through the center of town. The town is surrounded by forests and farmland, and is home to a variety of wildlife. The climate in Nectar is mild, with temperatures ranging from the mid-50s in the winter to the mid-80s in the summer.
The economy of Nectar is largely based on agriculture, with the majority of the population employed in farming and related industries. The town is home to several small businesses, including a grocery store, a hardware store, and a few restaurants. The town also has a small manufacturing sector, with a few factories producing furniture and other goods.
The demographics of Nectar are largely rural, with a majority of the population being white. The town has a small African American population, as well as a small Hispanic population. The median household income in Nectar is approximately $30,000, and the median age is around 40 years old.
Nectar is a small town with a rich history and a unique culture. The town is home to a variety of festivals and events throughout the year, including the annual Nectar Festival, which celebrates the town’s history and culture. The town is also home to a variety of outdoor activities, including fishing, hunting, and camping.
Nectar is a small town with a lot to offer. It is a great place to live, work, and play, and is a great place to raise a family. The town has a rich history and culture, and is a great place to explore and experience the beauty of the Black Belt region.
Common Questions
What is Per Capita Income in Nectar?
Per Capita income in Nectar is $19,072.
What is the Median Family Income in Nectar?
Median Family Income in Nectar is $48,056.
What is the Median Household income in Nectar?
Median Household Income in Nectar is $42,396.
What is Income or Wage Gap in Nectar?
Income or Wage Gap in Nectar is 12.5%.
Women in Nectar earn 87.5 cents for every dollar earned by a man.
What is Inequality or Gini Index in Nectar?
Inequality or Gini Index in Nectar is 0.38.
What is the Total Population of Nectar?
Total Population of Nectar is 476.
What is the Total Male Population of Nectar?
Total Male Population of Nectar is 212.
What is the Total Female Population of Nectar?
Total Female Population of Nectar is 264.
What is the Ratio of Males per 100 Females in Nectar?
There are 80.30 Males per 100 Females in Nectar.
What is the Ratio of Females per 100 Males in Nectar?
There are 124.53 Females per 100 Males in Nectar.
What is the Median Population Age in Nectar?
Median Population Age in Nectar is 30.7 Years.
What is the Average Family Size in Nectar
Average Family Size in Nectar is 3.9 People.
What is the Average Household Size in Nectar
Average Household Size in Nectar is 3.4 People.
How Large is the Labor Force in Nectar?
There are 200 People in the Labor Forcein in Nectar.
What is the Percentage of People in the Labor Force in Nectar?
63.1% of People are in the Labor Force in Nectar.
What is the Unemployment Rate in Nectar?
Unemployment Rate in Nectar is 9.5%.