Pollard, AL Map & Demographics
Pollard Map
Pollard Overview
$23,141
PER CAPITA INCOME
$55,625
AVG FAMILY INCOME
$68,125
AVG HOUSEHOLD INCOME
4.2%
WAGE / INCOME GAP [ % ]
95.8¢/ $1
WAGE / INCOME GAP [ $ ]
0.43
INEQUALITY / GINI INDEX
110
TOTAL POPULATION
58
MALE POPULATION
52
FEMALE POPULATION
111.54
MALES / 100 FEMALES
89.66
FEMALES / 100 MALES
40.5
MEDIAN AGE
3.4
AVG FAMILY SIZE
2.8
AVG HOUSEHOLD SIZE
46
LABOR FORCE [ PEOPLE ]
61.3%
PERCENT IN LABOR FORCE
Income in Pollard
Income Overview in Pollard
Per Capita Income in Pollard is $23,141, while median incomes of families and households are $55,625 and $68,125 respectively.
| Characteristic | Number | Measure |
| Per Capita Income | 110 | $23,141 |
| Median Family Income | 27 | $55,625 |
| Mean Family Income | 27 | $73,859 |
| Median Household Income | 39 | $68,125 |
| Mean Household Income | 39 | $67,364 |
| Income Deficit | 27 | $0 |
| Wage / Income Gap (%) | 110 | 4.17% |
| Wage / Income Gap ($) | 110 | 95.83¢ per $1 |
| Gini / Inequality Index | 110 | 0.43 |
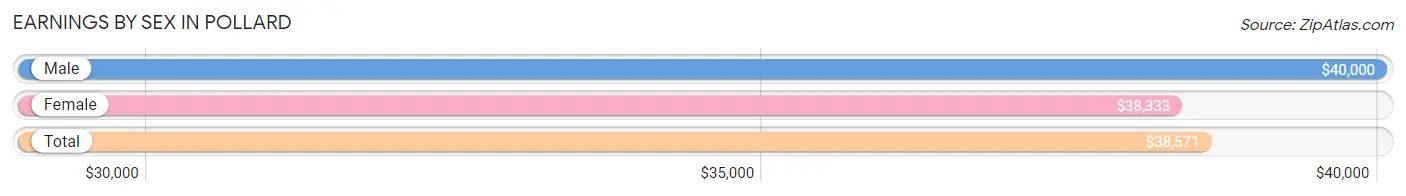
Earnings by Sex in Pollard
Average Earnings in Pollard are $38,571, $40,000 for men and $38,333 for women, a difference of 4.2%.
| Sex | Number | Average Earnings |
| Male | 22 (45.8%) | $40,000 |
| Female | 26 (54.2%) | $38,333 |
| Total | 48 (100.0%) | $38,571 |
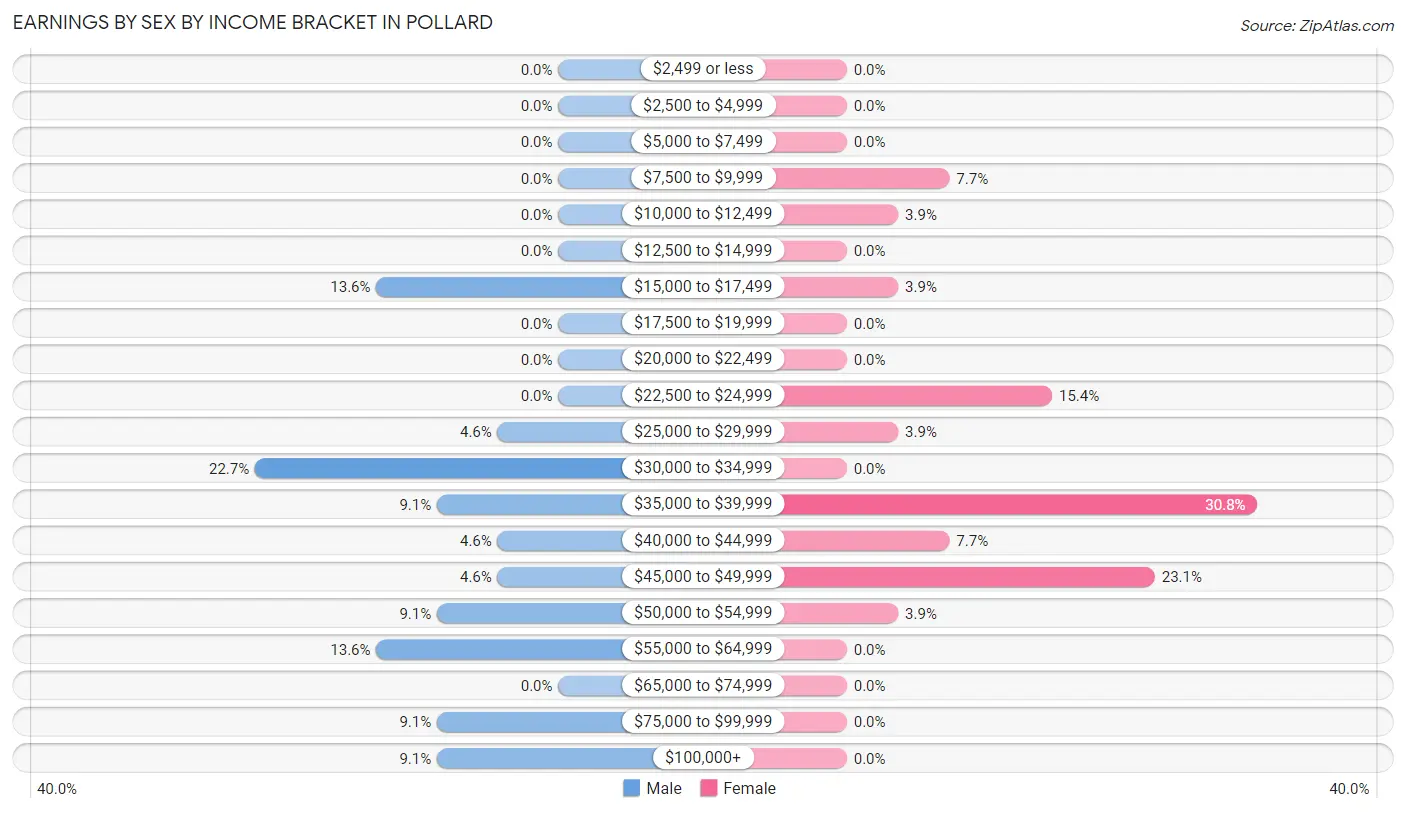
Earnings by Sex by Income Bracket in Pollard
The most common earnings brackets in Pollard are $30,000 to $34,999 for men (5 | 22.7%) and $35,000 to $39,999 for women (8 | 30.8%).
| Income | Male | Female |
| $2,499 or less | 0 (0.0%) | 0 (0.0%) |
| $2,500 to $4,999 | 0 (0.0%) | 0 (0.0%) |
| $5,000 to $7,499 | 0 (0.0%) | 0 (0.0%) |
| $7,500 to $9,999 | 0 (0.0%) | 2 (7.7%) |
| $10,000 to $12,499 | 0 (0.0%) | 1 (3.8%) |
| $12,500 to $14,999 | 0 (0.0%) | 0 (0.0%) |
| $15,000 to $17,499 | 3 (13.6%) | 1 (3.8%) |
| $17,500 to $19,999 | 0 (0.0%) | 0 (0.0%) |
| $20,000 to $22,499 | 0 (0.0%) | 0 (0.0%) |
| $22,500 to $24,999 | 0 (0.0%) | 4 (15.4%) |
| $25,000 to $29,999 | 1 (4.5%) | 1 (3.8%) |
| $30,000 to $34,999 | 5 (22.7%) | 0 (0.0%) |
| $35,000 to $39,999 | 2 (9.1%) | 8 (30.8%) |
| $40,000 to $44,999 | 1 (4.5%) | 2 (7.7%) |
| $45,000 to $49,999 | 1 (4.5%) | 6 (23.1%) |
| $50,000 to $54,999 | 2 (9.1%) | 1 (3.8%) |
| $55,000 to $64,999 | 3 (13.6%) | 0 (0.0%) |
| $65,000 to $74,999 | 0 (0.0%) | 0 (0.0%) |
| $75,000 to $99,999 | 2 (9.1%) | 0 (0.0%) |
| $100,000+ | 2 (9.1%) | 0 (0.0%) |
| Total | 22 (100.0%) | 26 (100.0%) |
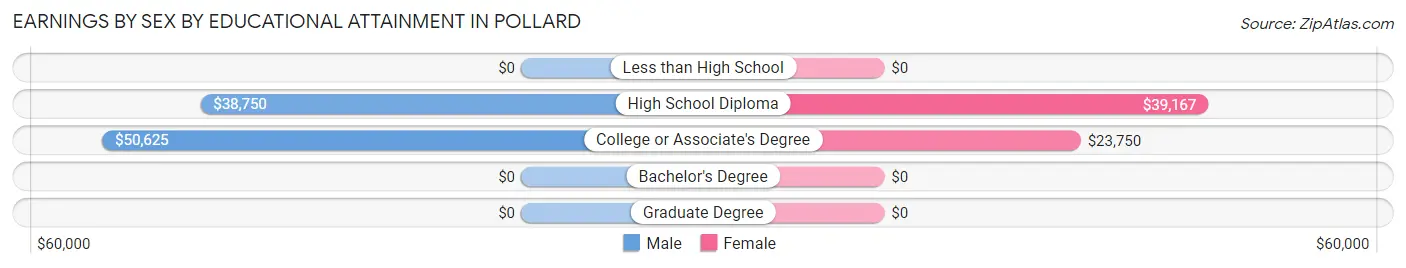
Earnings by Sex by Educational Attainment in Pollard
Average earnings in Pollard are $40,000 for men and $38,542 for women, a difference of 3.6%. Men with an educational attainment of college or associate's degree enjoy the highest average annual earnings of $50,625, while those with high school diploma education earn the least with $38,750. Women with an educational attainment of high school diploma earn the most with the average annual earnings of $39,167, while those with college or associate's degree education have the smallest earnings of $23,750.
| Educational Attainment | Male Income | Female Income |
| Less than High School | - | - |
| High School Diploma | $38,750 | $39,167 |
| College or Associate's Degree | $50,625 | $23,750 |
| Bachelor's Degree | - | - |
| Graduate Degree | - | - |
| Total | $40,000 | $38,542 |
Family Income in Pollard
Family Income Brackets in Pollard
According to the Pollard family income data, there are 6 families falling into the $15,000 to $24,999 income range, which is the most common income bracket and makes up 22.2% of all families.
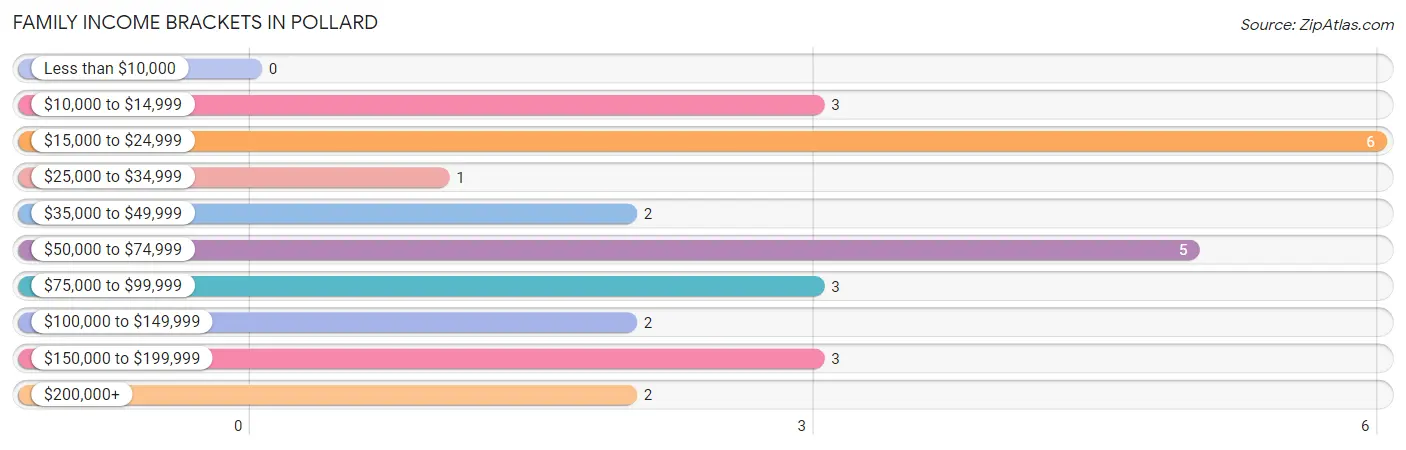
| Income Bracket | # Families | % Families |
| Less than $10,000 | 0 | 0.0% |
| $10,000 to $14,999 | 3 | 11.1% |
| $15,000 to $24,999 | 6 | 22.2% |
| $25,000 to $34,999 | 1 | 3.7% |
| $35,000 to $49,999 | 2 | 7.4% |
| $50,000 to $74,999 | 5 | 18.5% |
| $75,000 to $99,999 | 3 | 11.1% |
| $100,000 to $149,999 | 2 | 7.4% |
| $150,000 to $199,999 | 3 | 11.1% |
| $200,000+ | 2 | 7.4% |
Family Income by Famaliy Size in Pollard
4-person families (7 | 25.9%) account for the highest median family income in Pollard with $111,250 per family, while 4-person families (7 | 25.9%) have the highest median income of $27,812 per family member.
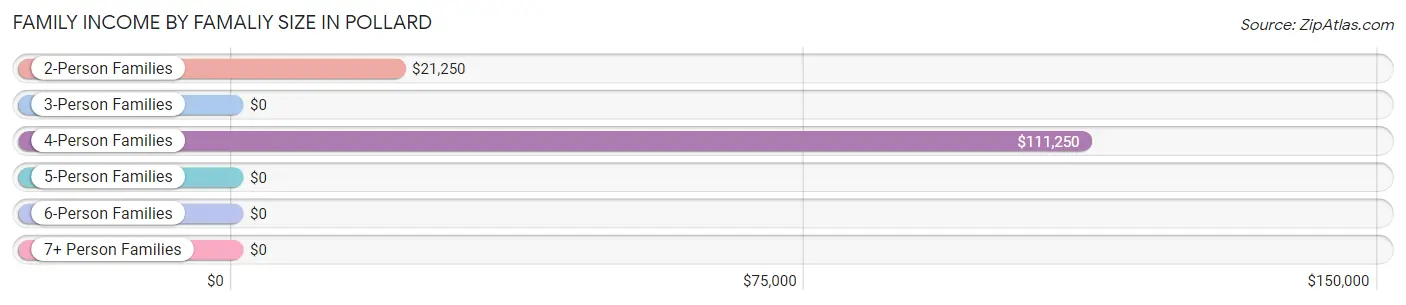
| Income Bracket | # Families | Median Income |
| 2-Person Families | 11 (40.7%) | $21,250 |
| 3-Person Families | 3 (11.1%) | $0 |
| 4-Person Families | 7 (25.9%) | $111,250 |
| 5-Person Families | 3 (11.1%) | $0 |
| 6-Person Families | 1 (3.7%) | $0 |
| 7+ Person Families | 2 (7.4%) | $0 |
| Total | 27 (100.0%) | $55,625 |
Family Income by Number of Earners in Pollard
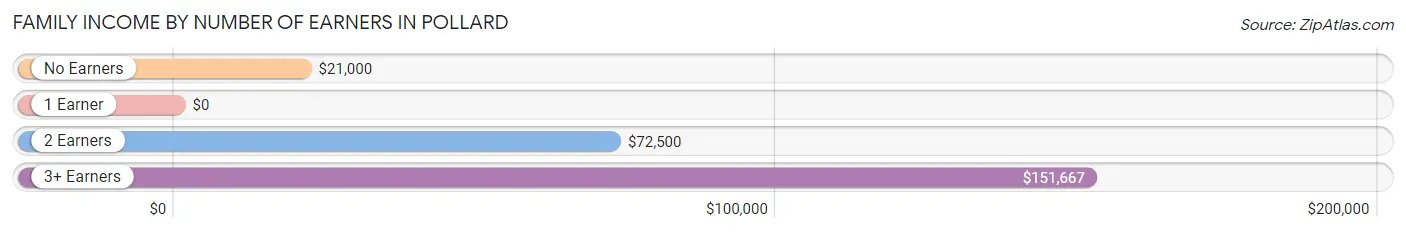
| Number of Earners | # Families | Median Income |
| No Earners | 8 (29.6%) | $21,000 |
| 1 Earner | 7 (25.9%) | $0 |
| 2 Earners | 6 (22.2%) | $72,500 |
| 3+ Earners | 6 (22.2%) | $151,667 |
| Total | 27 (100.0%) | $55,625 |
Household Income in Pollard
Household Income Brackets in Pollard
With 11 households falling in the category, the $50,000 to $74,999 income range is the most frequent in Pollard, accounting for 28.2% of all households.
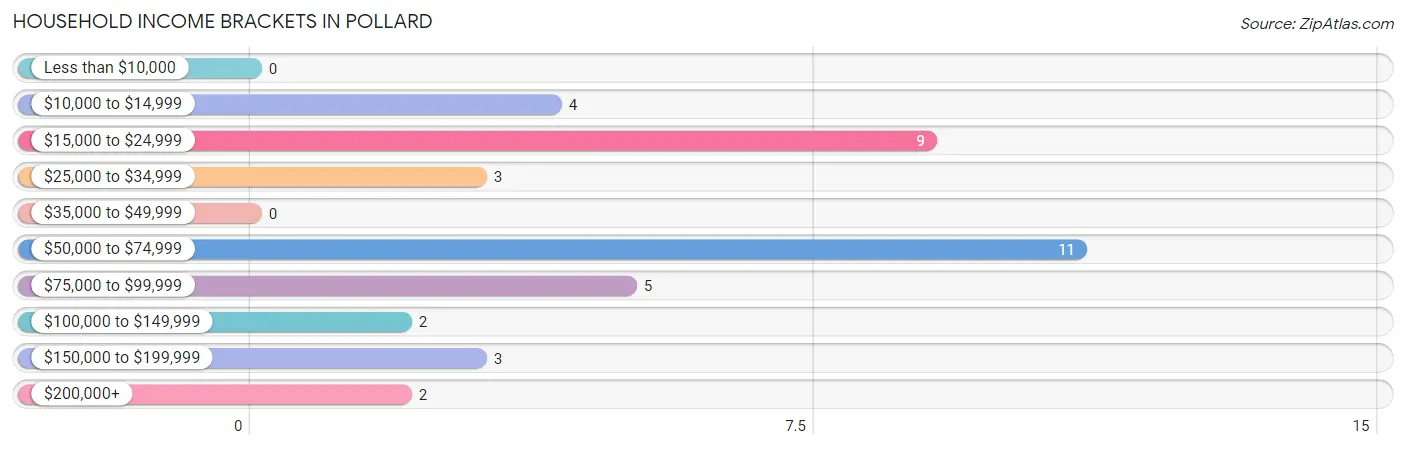
| Income Bracket | # Households | % Households |
| Less than $10,000 | 0 | 0.0% |
| $10,000 to $14,999 | 4 | 10.3% |
| $15,000 to $24,999 | 9 | 23.1% |
| $25,000 to $34,999 | 3 | 7.7% |
| $35,000 to $49,999 | 0 | 0.0% |
| $50,000 to $74,999 | 11 | 28.2% |
| $75,000 to $99,999 | 5 | 12.8% |
| $100,000 to $149,999 | 2 | 5.1% |
| $150,000 to $199,999 | 3 | 7.7% |
| $200,000+ | 2 | 5.1% |
Household Income by Householder Age in Pollard
The median household income in Pollard is $68,125, with the highest median household income of $71,667 found in the 25 to 44 years age bracket for the primary householder. A total of 14 households (35.9%) fall into this category.
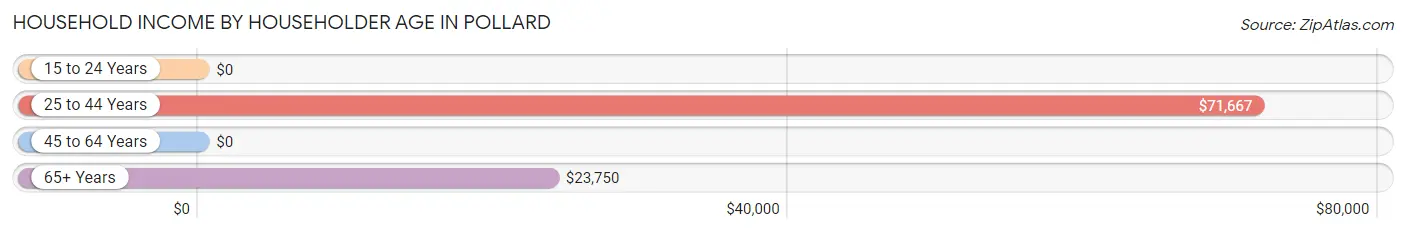
| Income Bracket | # Households | Median Income |
| 15 to 24 Years | 0 (0.0%) | $0 |
| 25 to 44 Years | 14 (35.9%) | $71,667 |
| 45 to 64 Years | 19 (48.7%) | $0 |
| 65+ Years | 6 (15.4%) | $23,750 |
| Total | 39 (100.0%) | $68,125 |
Poverty in Pollard
Income Below Poverty by Sex and Age in Pollard
With 12.1% poverty level for males and 15.4% for females among the residents of Pollard, under 5 year old males and 15 year old females are the most vulnerable to poverty, with 3 males (75.0%) and 1 females (50.0%) in their respective age groups living below the poverty level.
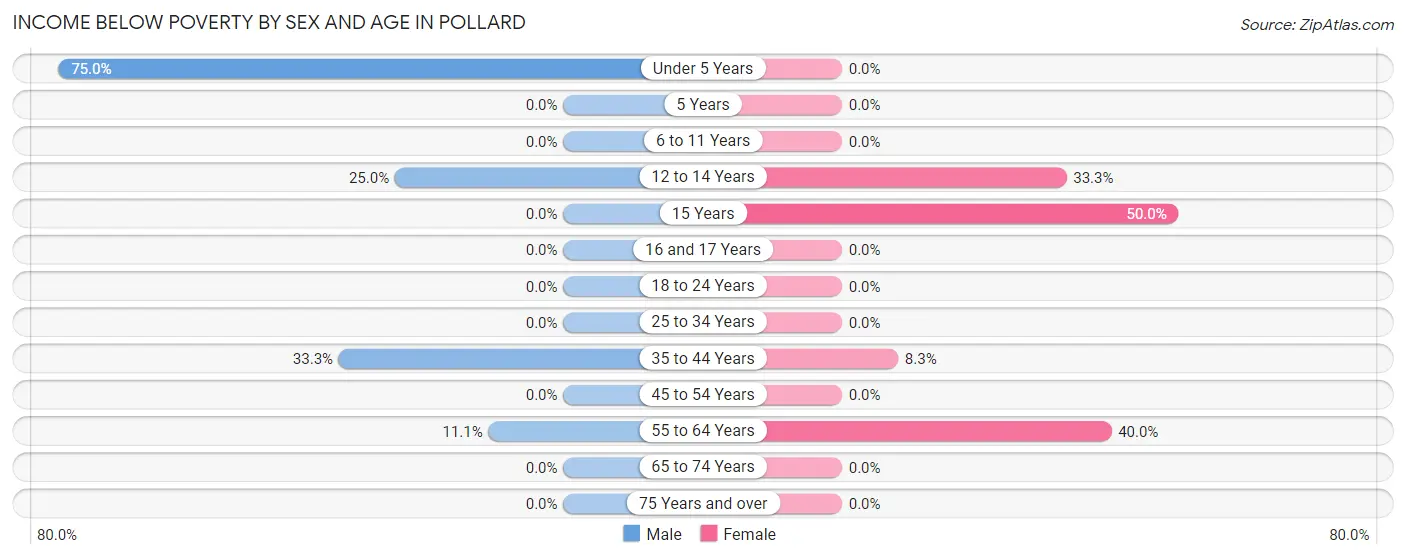
| Age Bracket | Male | Female |
| Under 5 Years | 3 (75.0%) | 0 (0.0%) |
| 5 Years | 0 (0.0%) | 0 (0.0%) |
| 6 to 11 Years | 0 (0.0%) | 0 (0.0%) |
| 12 to 14 Years | 2 (25.0%) | 2 (33.3%) |
| 15 Years | 0 (0.0%) | 1 (50.0%) |
| 16 and 17 Years | 0 (0.0%) | 0 (0.0%) |
| 18 to 24 Years | 0 (0.0%) | 0 (0.0%) |
| 25 to 34 Years | 0 (0.0%) | 0 (0.0%) |
| 35 to 44 Years | 1 (33.3%) | 1 (8.3%) |
| 45 to 54 Years | 0 (0.0%) | 0 (0.0%) |
| 55 to 64 Years | 1 (11.1%) | 4 (40.0%) |
| 65 to 74 Years | 0 (0.0%) | 0 (0.0%) |
| 75 Years and over | 0 (0.0%) | 0 (0.0%) |
| Total | 7 (12.1%) | 8 (15.4%) |
Income Above Poverty by Sex and Age in Pollard
According to the poverty statistics in Pollard, males aged 6 to 11 years and females aged 6 to 11 years are the age groups that are most secure financially, with 100.0% of males and 100.0% of females in these age groups living above the poverty line.
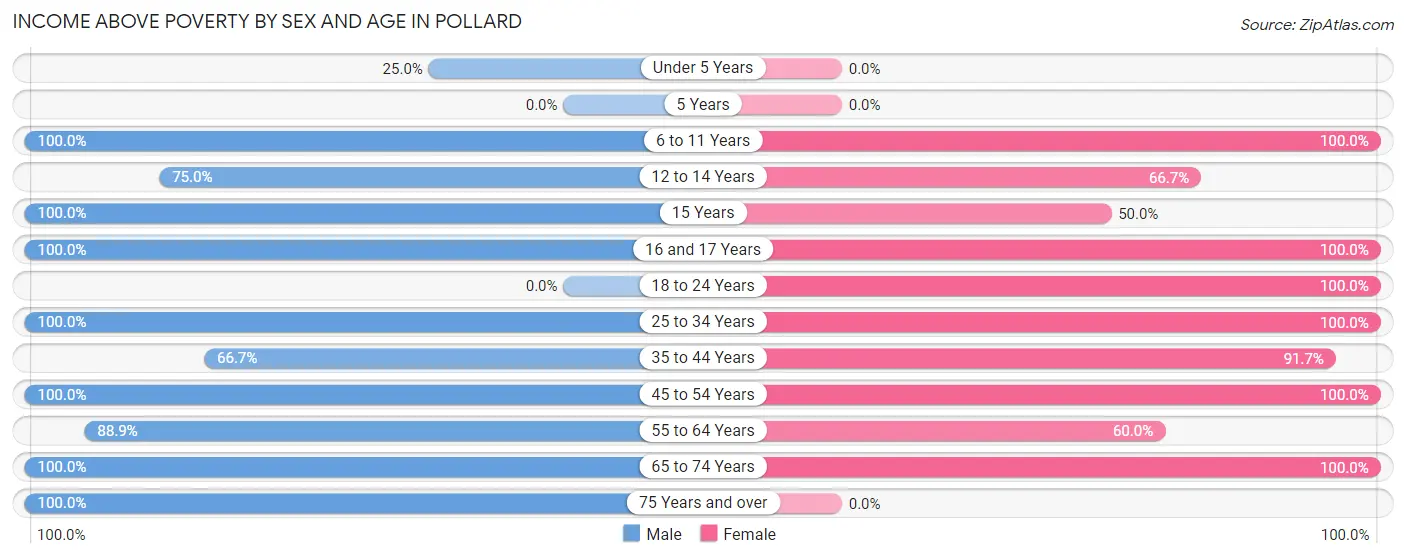
| Age Bracket | Male | Female |
| Under 5 Years | 1 (25.0%) | 0 (0.0%) |
| 5 Years | 0 (0.0%) | 0 (0.0%) |
| 6 to 11 Years | 6 (100.0%) | 4 (100.0%) |
| 12 to 14 Years | 6 (75.0%) | 4 (66.7%) |
| 15 Years | 5 (100.0%) | 1 (50.0%) |
| 16 and 17 Years | 1 (100.0%) | 1 (100.0%) |
| 18 to 24 Years | 0 (0.0%) | 1 (100.0%) |
| 25 to 34 Years | 4 (100.0%) | 6 (100.0%) |
| 35 to 44 Years | 2 (66.7%) | 11 (91.7%) |
| 45 to 54 Years | 12 (100.0%) | 3 (100.0%) |
| 55 to 64 Years | 8 (88.9%) | 6 (60.0%) |
| 65 to 74 Years | 2 (100.0%) | 7 (100.0%) |
| 75 Years and over | 4 (100.0%) | 0 (0.0%) |
| Total | 51 (87.9%) | 44 (84.6%) |
Income Below Poverty Among Married-Couple Families in Pollard
The poverty statistics for married-couple families in Pollard show that 4.8% or 1 of the total 21 families live below the poverty line. Families with no children have the highest poverty rate of 10.0%, comprising of 1 families. On the other hand, families with 1 or 2 children have the lowest poverty rate of 0.0%, which includes 0 families.
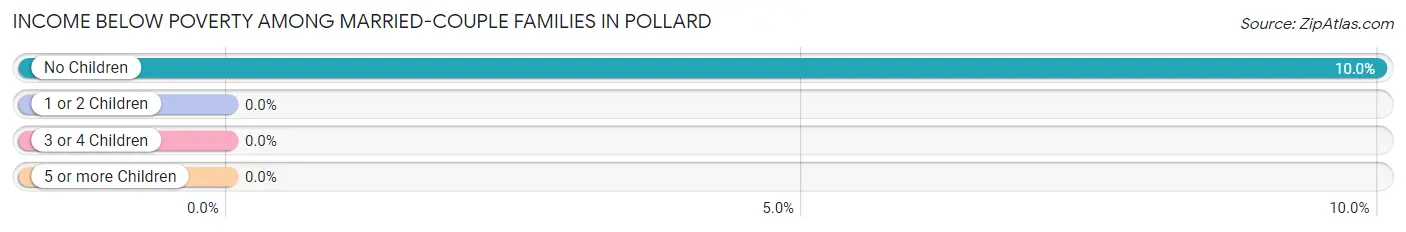
| Children | Above Poverty | Below Poverty |
| No Children | 9 (90.0%) | 1 (10.0%) |
| 1 or 2 Children | 6 (100.0%) | 0 (0.0%) |
| 3 or 4 Children | 3 (100.0%) | 0 (0.0%) |
| 5 or more Children | 2 (100.0%) | 0 (0.0%) |
| Total | 20 (95.2%) | 1 (4.8%) |
Income Below Poverty Among Single-Parent Households in Pollard
According to the poverty data in Pollard, 100.0% or 1 single-father households and 40.0% or 2 single-mother households are living below the poverty line. Among single-father households, those with 5 or more children have the highest poverty rate, with 1 households (100.0%) experiencing poverty. Likewise, among single-mother households, those with 1 or 2 children have the highest poverty rate, with 2 households (50.0%) falling below the poverty line.
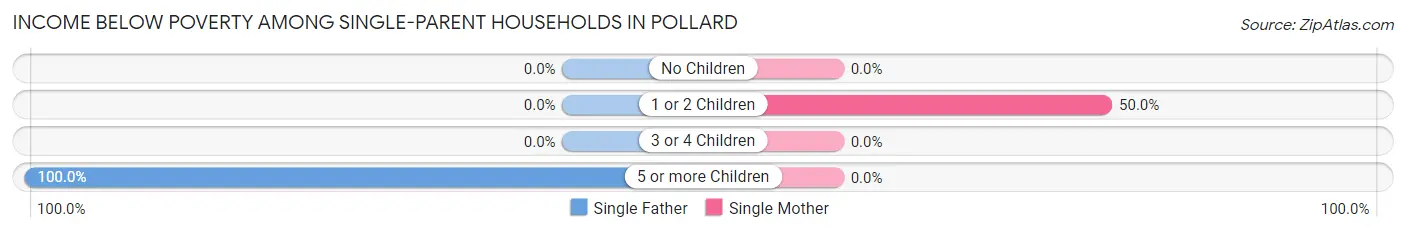
| Children | Single Father | Single Mother |
| No Children | 0 (0.0%) | 0 (0.0%) |
| 1 or 2 Children | 0 (0.0%) | 2 (50.0%) |
| 3 or 4 Children | 0 (0.0%) | 0 (0.0%) |
| 5 or more Children | 1 (100.0%) | 0 (0.0%) |
| Total | 1 (100.0%) | 2 (40.0%) |
Income Below Poverty Among Married-Couple vs Single-Parent Households in Pollard
The poverty data for Pollard shows that 1 of the married-couple family households (4.8%) and 3 of the single-parent households (50.0%) are living below the poverty level. Within the married-couple family households, those with no children have the highest poverty rate, with 1 households (10.0%) falling below the poverty line. Among the single-parent households, those with 5 or more children have the highest poverty rate, with 1 household (100.0%) living below poverty.
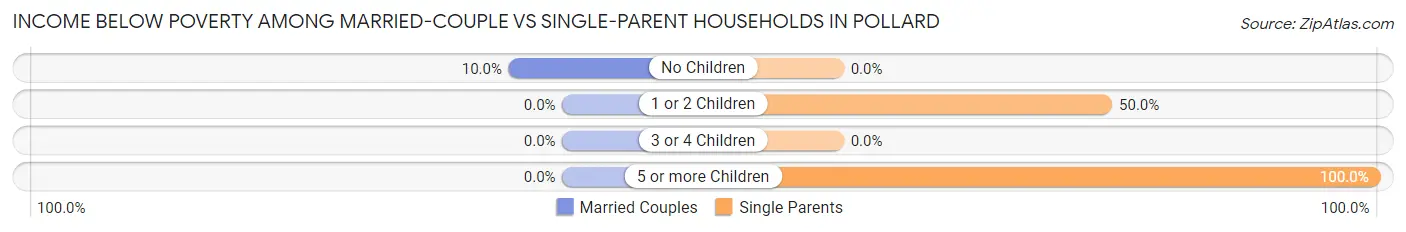
| Children | Married-Couple Families | Single-Parent Households |
| No Children | 1 (10.0%) | 0 (0.0%) |
| 1 or 2 Children | 0 (0.0%) | 2 (50.0%) |
| 3 or 4 Children | 0 (0.0%) | 0 (0.0%) |
| 5 or more Children | 0 (0.0%) | 1 (100.0%) |
| Total | 1 (4.8%) | 3 (50.0%) |
Race in Pollard
The most populous races in Pollard are White / Caucasian (72 | 65.4%), Black / African American (25 | 22.7%), and Hispanic or Latino (9 | 8.2%).
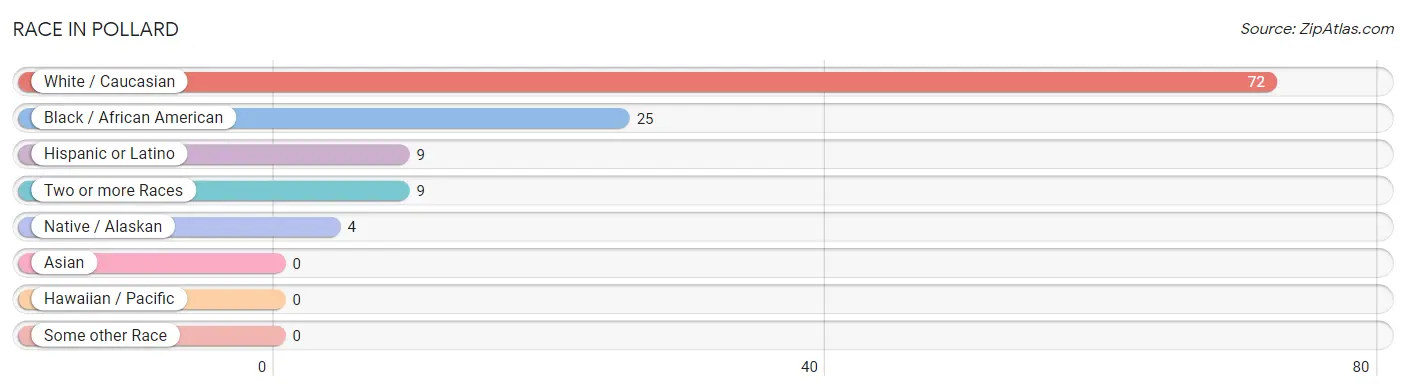
| Race | # Population | % Population |
| Asian | 0 | 0.0% |
| Black / African American | 25 | 22.7% |
| Hawaiian / Pacific | 0 | 0.0% |
| Hispanic or Latino | 9 | 8.2% |
| Native / Alaskan | 4 | 3.6% |
| White / Caucasian | 72 | 65.4% |
| Two or more Races | 9 | 8.2% |
| Some other Race | 0 | 0.0% |
| Total | 110 | 100.0% |
Ancestry in Pollard
The most populous ancestries reported in Pollard are American (12 | 10.9%), Mexican (9 | 8.2%), Irish (3 | 2.7%), British (2 | 1.8%), and English (2 | 1.8%), together accounting for 25.5% of all Pollard residents.
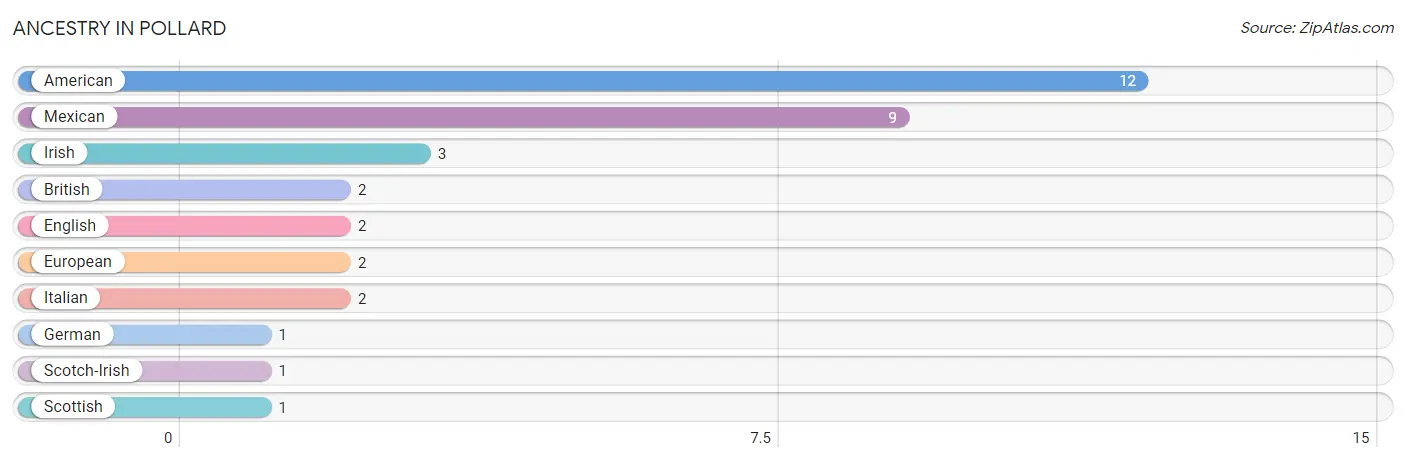
| Ancestry | # Population | % Population |
| American | 12 | 10.9% |
| British | 2 | 1.8% |
| English | 2 | 1.8% |
| European | 2 | 1.8% |
| German | 1 | 0.9% |
| Irish | 3 | 2.7% |
| Italian | 2 | 1.8% |
| Mexican | 9 | 8.2% |
| Scotch-Irish | 1 | 0.9% |
| Scottish | 1 | 0.9% | View All 10 Rows |
Immigrants in Pollard
The most numerous immigrant groups reported in Pollard came from Central America (4 | 3.6%), Latin America (4 | 3.6%), and Mexico (4 | 3.6%), together accounting for 10.9% of all Pollard residents.
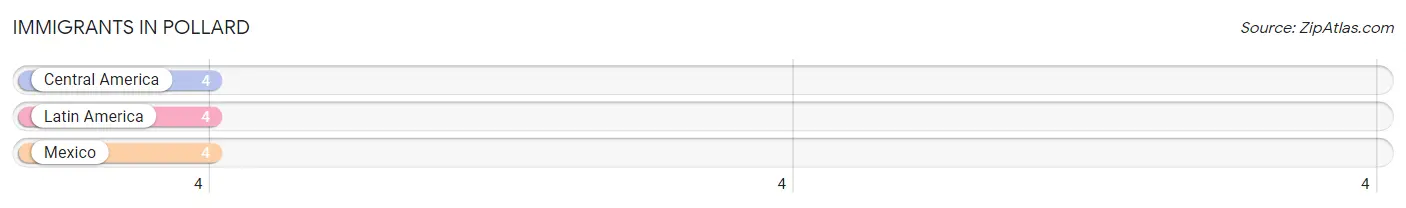
| Immigration Origin | # Population | % Population |
| Central America | 4 | 3.6% |
| Latin America | 4 | 3.6% |
| Mexico | 4 | 3.6% | View All 3 Rows |
Sex and Age in Pollard
Sex and Age in Pollard
The most populous age groups in Pollard are 10 to 14 Years (14 | 24.1%) for men and 40 to 44 Years (10 | 19.2%) for women.
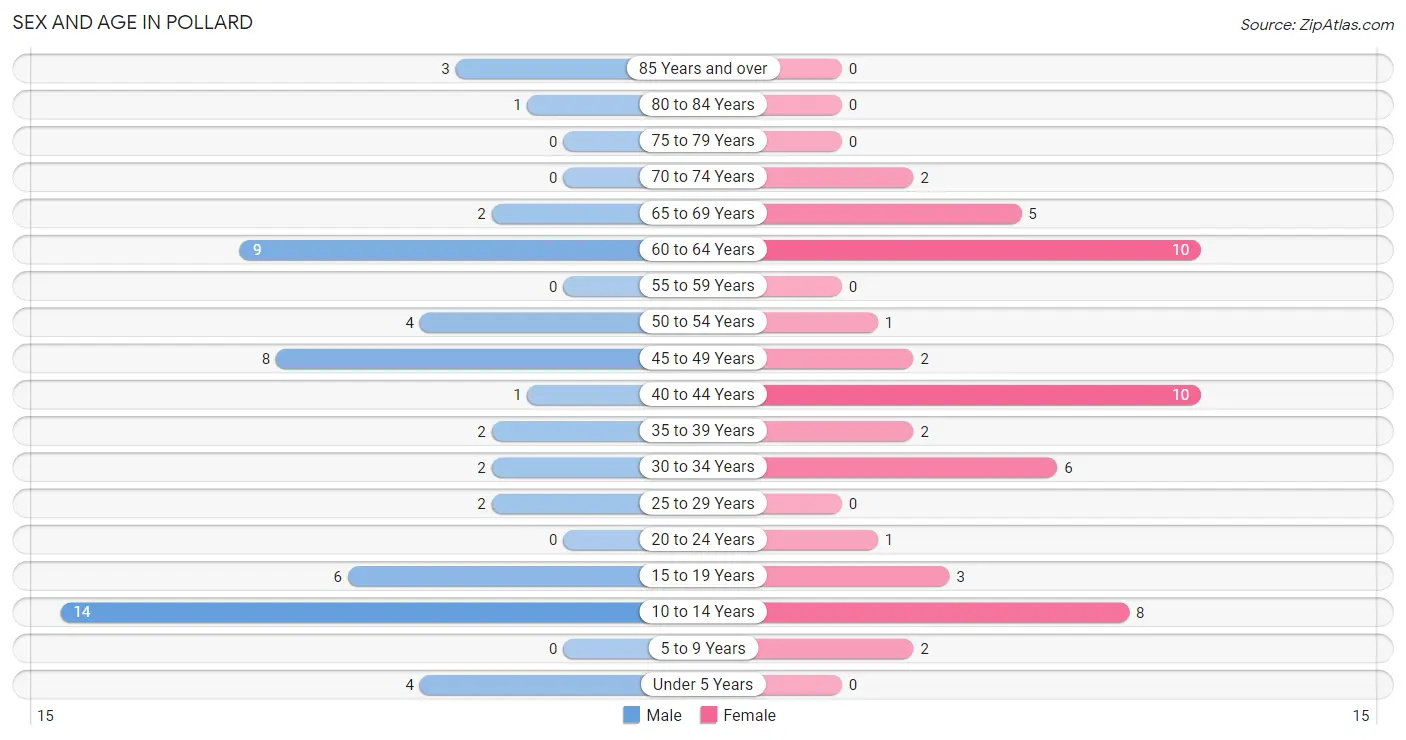
| Age Bracket | Male | Female |
| Under 5 Years | 4 (6.9%) | 0 (0.0%) |
| 5 to 9 Years | 0 (0.0%) | 2 (3.8%) |
| 10 to 14 Years | 14 (24.1%) | 8 (15.4%) |
| 15 to 19 Years | 6 (10.3%) | 3 (5.8%) |
| 20 to 24 Years | 0 (0.0%) | 1 (1.9%) |
| 25 to 29 Years | 2 (3.5%) | 0 (0.0%) |
| 30 to 34 Years | 2 (3.5%) | 6 (11.5%) |
| 35 to 39 Years | 2 (3.5%) | 2 (3.8%) |
| 40 to 44 Years | 1 (1.7%) | 10 (19.2%) |
| 45 to 49 Years | 8 (13.8%) | 2 (3.8%) |
| 50 to 54 Years | 4 (6.9%) | 1 (1.9%) |
| 55 to 59 Years | 0 (0.0%) | 0 (0.0%) |
| 60 to 64 Years | 9 (15.5%) | 10 (19.2%) |
| 65 to 69 Years | 2 (3.5%) | 5 (9.6%) |
| 70 to 74 Years | 0 (0.0%) | 2 (3.8%) |
| 75 to 79 Years | 0 (0.0%) | 0 (0.0%) |
| 80 to 84 Years | 1 (1.7%) | 0 (0.0%) |
| 85 Years and over | 3 (5.2%) | 0 (0.0%) |
| Total | 58 (100.0%) | 52 (100.0%) |
Families and Households in Pollard
Median Family Size in Pollard
The median family size in Pollard is 3.37 persons per family, with single male/father families (1 | 3.7%) accounting for the largest median family size of 7 persons per family. On the other hand, single female/mother families (5 | 18.5%) represent the smallest median family size with 2.80 persons per family.
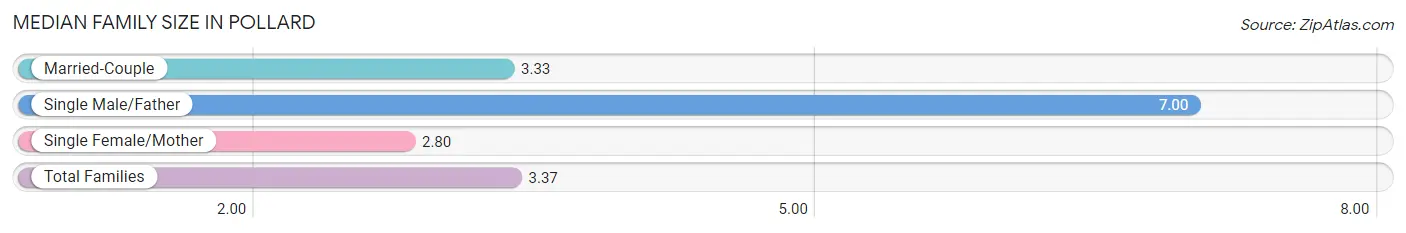
| Family Type | # Families | Family Size |
| Married-Couple | 21 (77.8%) | 3.33 |
| Single Male/Father | 1 (3.7%) | 7.00 |
| Single Female/Mother | 5 (18.5%) | 2.80 |
| Total Families | 27 (100.0%) | 3.37 |
Median Household Size in Pollard
The median household size in Pollard is 2.82 persons per household, with single male/father households (1 | 2.6%) accounting for the largest median household size of 8 persons per household. non-family households (12 | 30.8%) represent the smallest median household size with 1.42 persons per household.
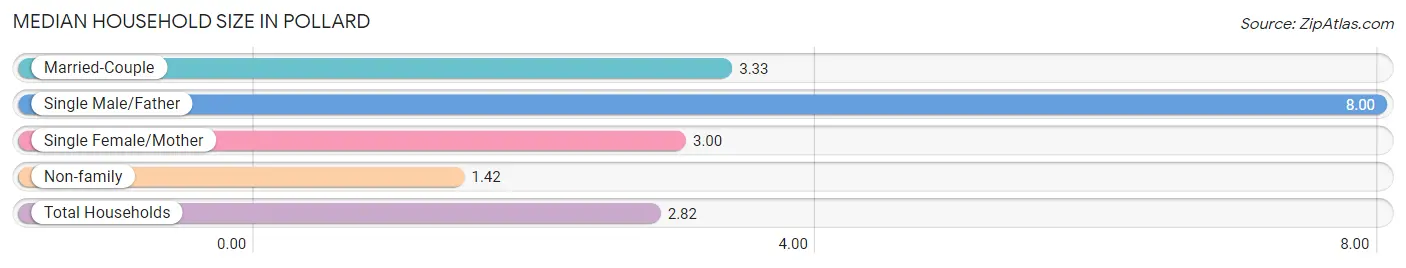
| Household Type | # Households | Household Size |
| Married-Couple | 21 (53.8%) | 3.33 |
| Single Male/Father | 1 (2.6%) | 8.00 |
| Single Female/Mother | 5 (12.8%) | 3.00 |
| Non-family | 12 (30.8%) | 1.42 |
| Total Households | 39 (100.0%) | 2.82 |
Household Size by Marriage Status in Pollard
Out of a total of 39 households in Pollard, 27 (69.2%) are family households, while 12 (30.8%) are nonfamily households. The most numerous type of family households are 2-person households, comprising 11, and the most common type of nonfamily households are 1-person households, comprising 6.
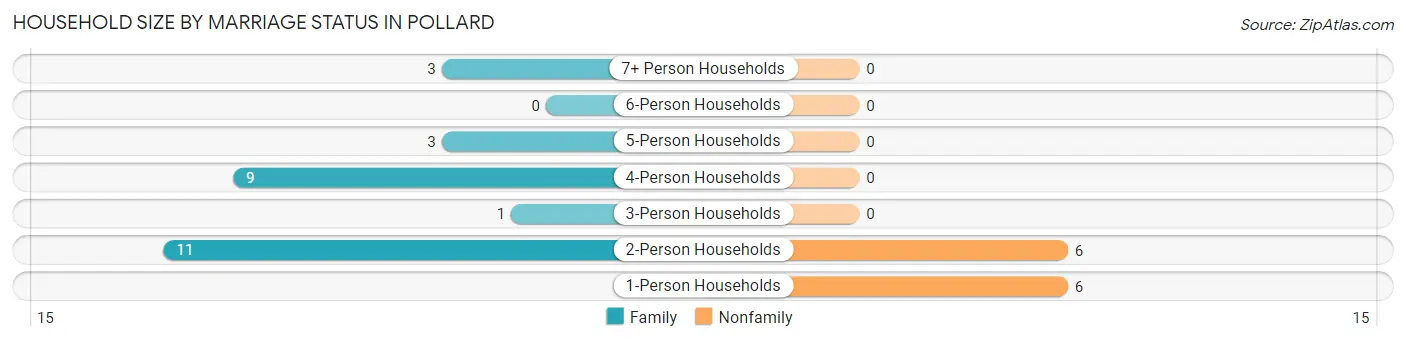
| Household Size | Family Households | Nonfamily Households |
| 1-Person Households | - | 6 (15.4%) |
| 2-Person Households | 11 (28.2%) | 6 (15.4%) |
| 3-Person Households | 1 (2.6%) | 0 (0.0%) |
| 4-Person Households | 9 (23.1%) | 0 (0.0%) |
| 5-Person Households | 3 (7.7%) | 0 (0.0%) |
| 6-Person Households | 0 (0.0%) | 0 (0.0%) |
| 7+ Person Households | 3 (7.7%) | 0 (0.0%) |
| Total | 27 (69.2%) | 12 (30.8%) |
Female Fertility in Pollard
Fertility by Age in Pollard
| Age Bracket | Women with Births | Births / 1,000 Women |
| 15 to 19 years | 0 (0.0%) | 0.0 |
| 20 to 34 years | 0 (0.0%) | 0.0 |
| 35 to 50 years | 0 (0.0%) | 0.0 |
| Total | 0 (0.0%) | 0.0 |
Fertility by Age by Marriage Status in Pollard
| Age Bracket | Married | Unmarried |
| 15 to 19 years | 0 (0.0%) | 0 (0.0%) |
| 20 to 34 years | 0 (0.0%) | 0 (0.0%) |
| 35 to 50 years | 0 (0.0%) | 0 (0.0%) |
| Total | 0 (0.0%) | 0 (0.0%) |
Fertility by Education in Pollard
| Educational Attainment | Women with Births | Births / 1,000 Women |
| Less than High School | 0 (0.0%) | 0.0 |
| High School Diploma | 0 (0.0%) | 0.0 |
| College or Associate's Degree | 0 (0.0%) | 0.0 |
| Bachelor's Degree | 0 (0.0%) | 0.0 |
| Graduate Degree | 0 (0.0%) | 0.0 |
| Total | 0 (0.0%) | 0.0 |
Fertility by Education by Marriage Status in Pollard
| Educational Attainment | Married | Unmarried |
| Less than High School | 0 (0.0%) | 0 (0.0%) |
| High School Diploma | 0 (0.0%) | 0 (0.0%) |
| College or Associate's Degree | 0 (0.0%) | 0 (0.0%) |
| Bachelor's Degree | 0 (0.0%) | 0 (0.0%) |
| Graduate Degree | 0 (0.0%) | 0 (0.0%) |
| Total | 0 (0.0%) | 0 (0.0%) |
Employment Characteristics in Pollard
Employment by Class of Employer in Pollard
Among the 46 employed individuals in Pollard, private company employees (36 | 78.3%), local government employees (5 | 10.9%), and self-employed (not incorporated) (3 | 6.5%) make up the most common classes of employment.
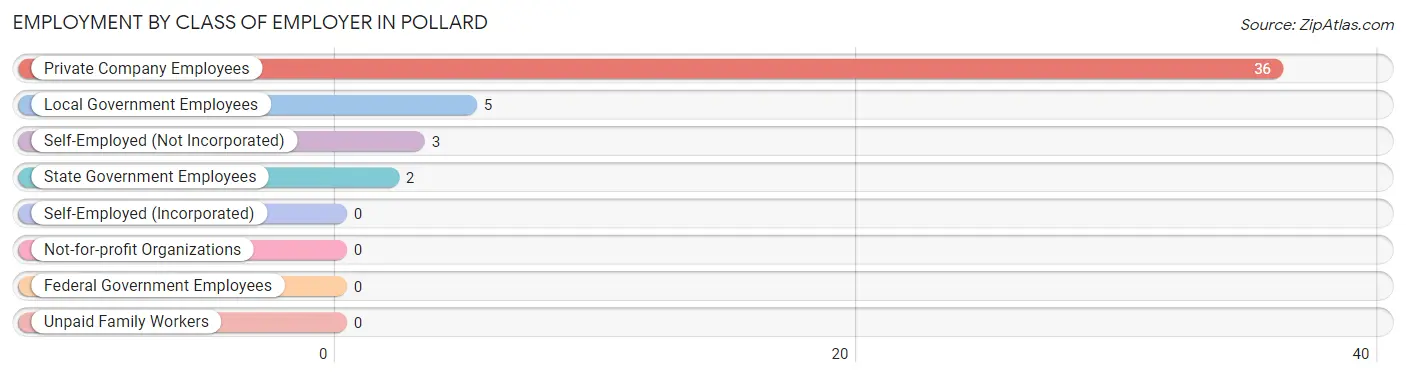
| Employer Class | # Employees | % Employees |
| Private Company Employees | 36 | 78.3% |
| Self-Employed (Incorporated) | 0 | 0.0% |
| Self-Employed (Not Incorporated) | 3 | 6.5% |
| Not-for-profit Organizations | 0 | 0.0% |
| Local Government Employees | 5 | 10.9% |
| State Government Employees | 2 | 4.3% |
| Federal Government Employees | 0 | 0.0% |
| Unpaid Family Workers | 0 | 0.0% |
| Total | 46 | 100.0% |
Employment Status by Age in Pollard
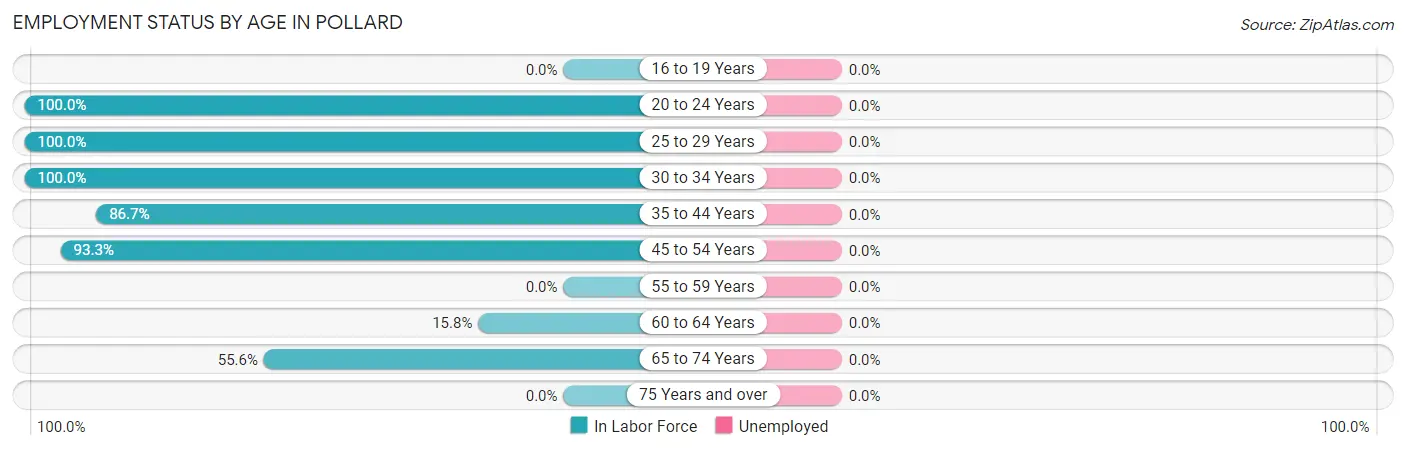
| Age Bracket | In Labor Force | Unemployed |
| 16 to 19 Years | 0 (0.0%) | 0 (0.0%) |
| 20 to 24 Years | 1 (100.0%) | 0 (0.0%) |
| 25 to 29 Years | 2 (100.0%) | 0 (0.0%) |
| 30 to 34 Years | 8 (100.0%) | 0 (0.0%) |
| 35 to 44 Years | 13 (86.7%) | 0 (0.0%) |
| 45 to 54 Years | 14 (93.3%) | 0 (0.0%) |
| 55 to 59 Years | 0 (0.0%) | 0 (0.0%) |
| 60 to 64 Years | 3 (15.8%) | 0 (0.0%) |
| 65 to 74 Years | 5 (55.6%) | 0 (0.0%) |
| 75 Years and over | 0 (0.0%) | 0 (0.0%) |
| Total | 46 (61.3%) | 0 (0.0%) |
Employment Status by Educational Attainment in Pollard
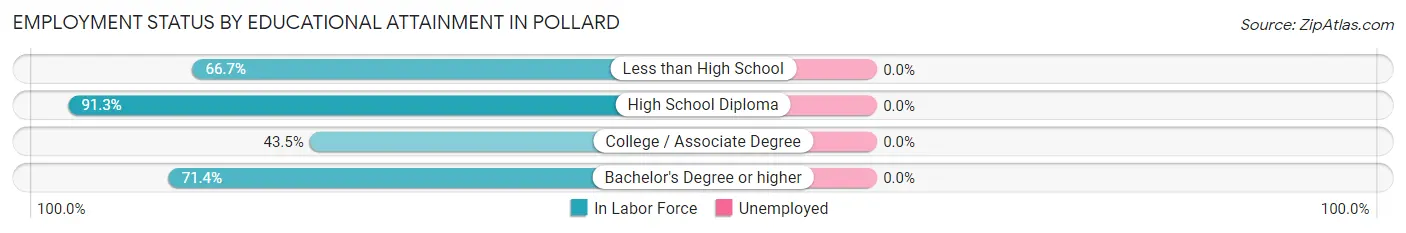
| Educational Attainment | In Labor Force | Unemployed |
| Less than High School | 4 (66.7%) | 0 (0.0%) |
| High School Diploma | 21 (91.3%) | 0 (0.0%) |
| College / Associate Degree | 10 (43.5%) | 0 (0.0%) |
| Bachelor's Degree or higher | 5 (71.4%) | 0 (0.0%) |
| Total | 40 (67.8%) | 0 (0.0%) |
Employment Occupations by Sex in Pollard
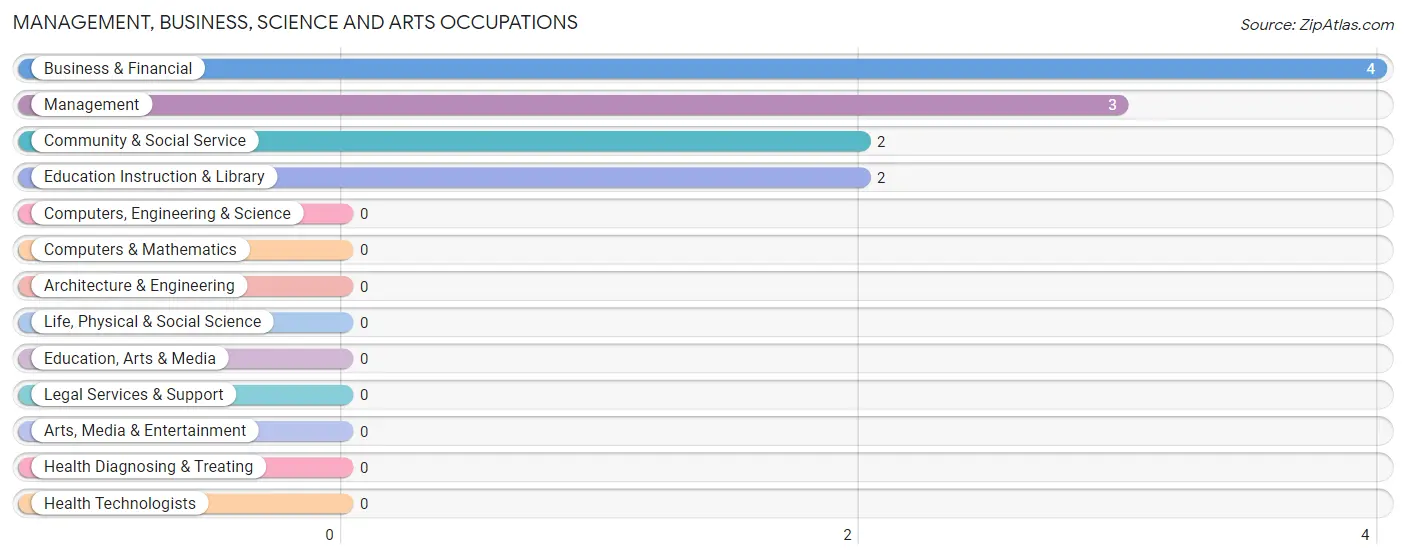
Management, Business, Science and Arts Occupations
The most common Management, Business, Science and Arts occupations in Pollard are Business & Financial (4 | 8.7%), Management (3 | 6.5%), Community & Social Service (2 | 4.3%), and Education Instruction & Library (2 | 4.3%).
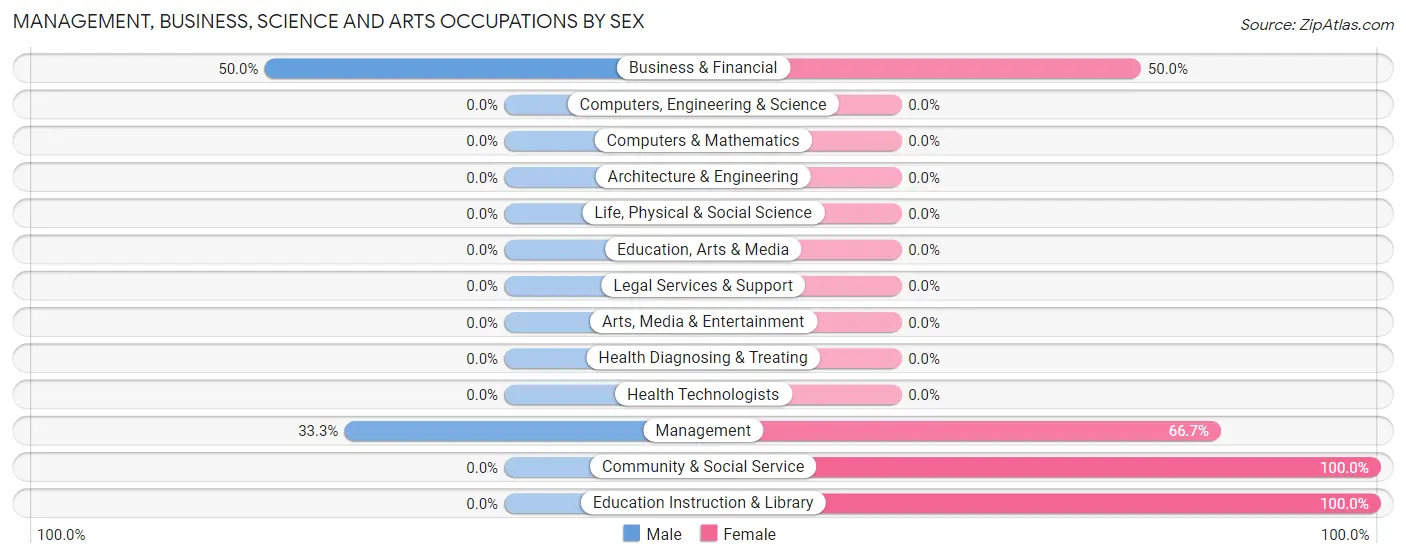
Management, Business, Science and Arts Occupations by Sex
Within the Management, Business, Science and Arts occupations in Pollard, the most male-oriented occupations are Business & Financial (50.0%), and Management (33.3%), while the most female-oriented occupations are Community & Social Service (100.0%), Education Instruction & Library (100.0%), and Management (66.7%).
| Occupation | Male | Female |
| Management | 1 (33.3%) | 2 (66.7%) |
| Business & Financial | 2 (50.0%) | 2 (50.0%) |
| Computers, Engineering & Science | 0 (0.0%) | 0 (0.0%) |
| Computers & Mathematics | 0 (0.0%) | 0 (0.0%) |
| Architecture & Engineering | 0 (0.0%) | 0 (0.0%) |
| Life, Physical & Social Science | 0 (0.0%) | 0 (0.0%) |
| Community & Social Service | 0 (0.0%) | 2 (100.0%) |
| Education, Arts & Media | 0 (0.0%) | 0 (0.0%) |
| Legal Services & Support | 0 (0.0%) | 0 (0.0%) |
| Education Instruction & Library | 0 (0.0%) | 2 (100.0%) |
| Arts, Media & Entertainment | 0 (0.0%) | 0 (0.0%) |
| Health Diagnosing & Treating | 0 (0.0%) | 0 (0.0%) |
| Health Technologists | 0 (0.0%) | 0 (0.0%) |
| Total (Category) | 3 (33.3%) | 6 (66.7%) |
| Total (Overall) | 22 (47.8%) | 24 (52.2%) |
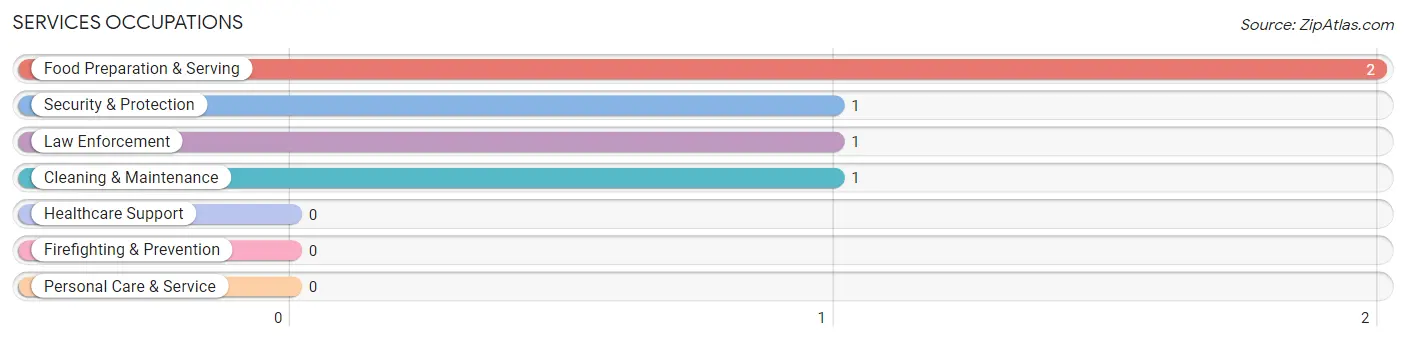
Services Occupations
The most common Services occupations in Pollard are Food Preparation & Serving (2 | 4.3%), Security & Protection (1 | 2.2%), Law Enforcement (1 | 2.2%), and Cleaning & Maintenance (1 | 2.2%).
Services Occupations by Sex
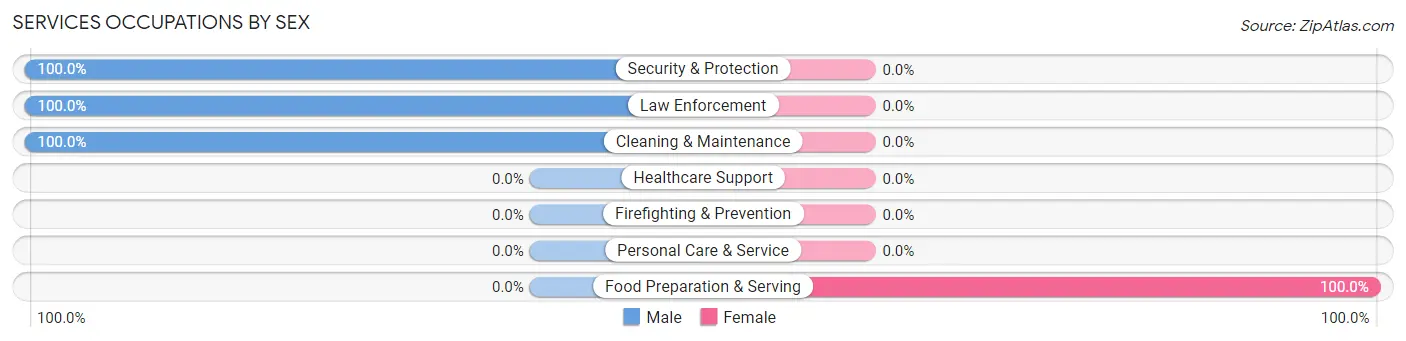
| Occupation | Male | Female |
| Healthcare Support | 0 (0.0%) | 0 (0.0%) |
| Security & Protection | 1 (100.0%) | 0 (0.0%) |
| Firefighting & Prevention | 0 (0.0%) | 0 (0.0%) |
| Law Enforcement | 1 (100.0%) | 0 (0.0%) |
| Food Preparation & Serving | 0 (0.0%) | 2 (100.0%) |
| Cleaning & Maintenance | 1 (100.0%) | 0 (0.0%) |
| Personal Care & Service | 0 (0.0%) | 0 (0.0%) |
| Total (Category) | 2 (50.0%) | 2 (50.0%) |
| Total (Overall) | 22 (47.8%) | 24 (52.2%) |
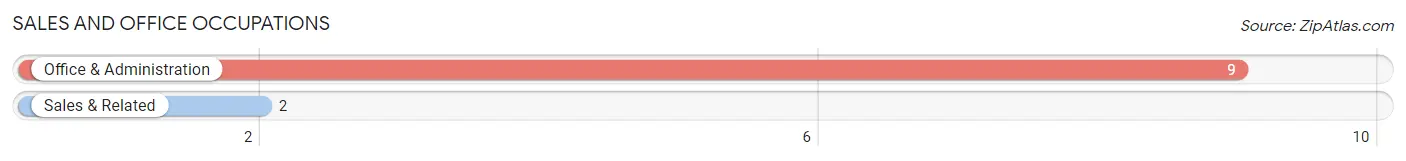
Sales and Office Occupations
The most common Sales and Office occupations in Pollard are Office & Administration (9 | 19.6%), and Sales & Related (2 | 4.3%).
Sales and Office Occupations by Sex
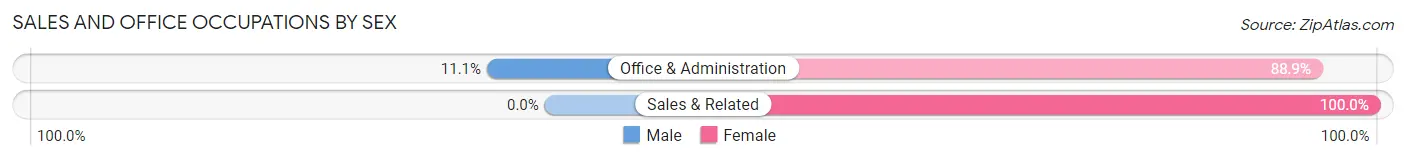
| Occupation | Male | Female |
| Sales & Related | 0 (0.0%) | 2 (100.0%) |
| Office & Administration | 1 (11.1%) | 8 (88.9%) |
| Total (Category) | 1 (9.1%) | 10 (90.9%) |
| Total (Overall) | 22 (47.8%) | 24 (52.2%) |
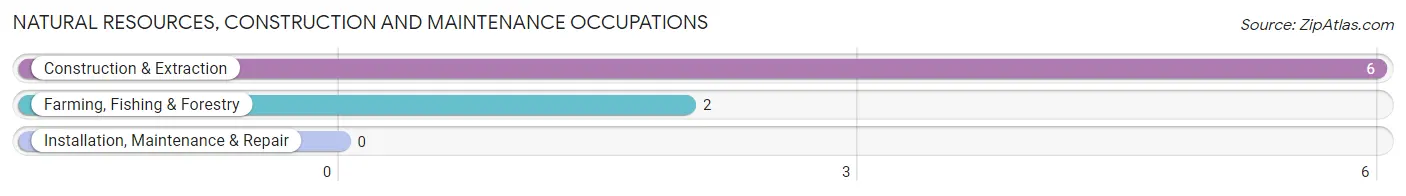
Natural Resources, Construction and Maintenance Occupations
The most common Natural Resources, Construction and Maintenance occupations in Pollard are Construction & Extraction (6 | 13.0%), and Farming, Fishing & Forestry (2 | 4.3%).
Natural Resources, Construction and Maintenance Occupations by Sex
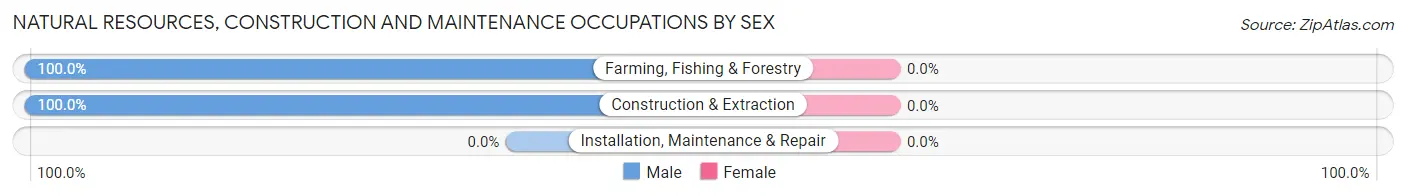
| Occupation | Male | Female |
| Farming, Fishing & Forestry | 2 (100.0%) | 0 (0.0%) |
| Construction & Extraction | 6 (100.0%) | 0 (0.0%) |
| Installation, Maintenance & Repair | 0 (0.0%) | 0 (0.0%) |
| Total (Category) | 8 (100.0%) | 0 (0.0%) |
| Total (Overall) | 22 (47.8%) | 24 (52.2%) |
Production, Transportation and Moving Occupations
The most common Production, Transportation and Moving occupations in Pollard are Production (12 | 26.1%), Transportation (1 | 2.2%), and Material Moving (1 | 2.2%).
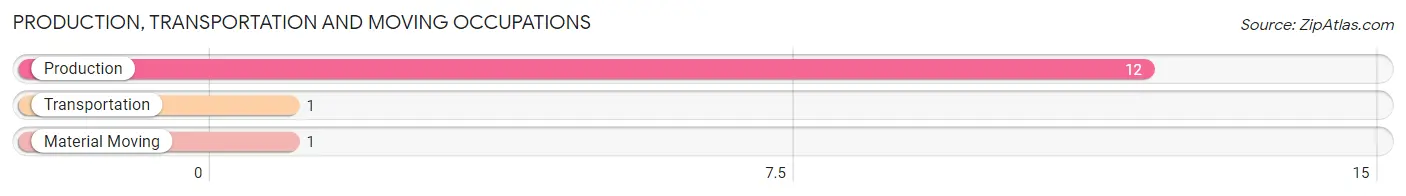
Production, Transportation and Moving Occupations by Sex
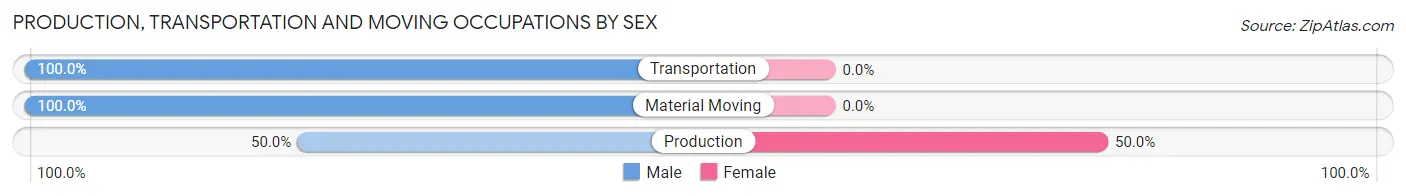
| Occupation | Male | Female |
| Production | 6 (50.0%) | 6 (50.0%) |
| Transportation | 1 (100.0%) | 0 (0.0%) |
| Material Moving | 1 (100.0%) | 0 (0.0%) |
| Total (Category) | 8 (57.1%) | 6 (42.9%) |
| Total (Overall) | 22 (47.8%) | 24 (52.2%) |
Employment Industries by Sex in Pollard
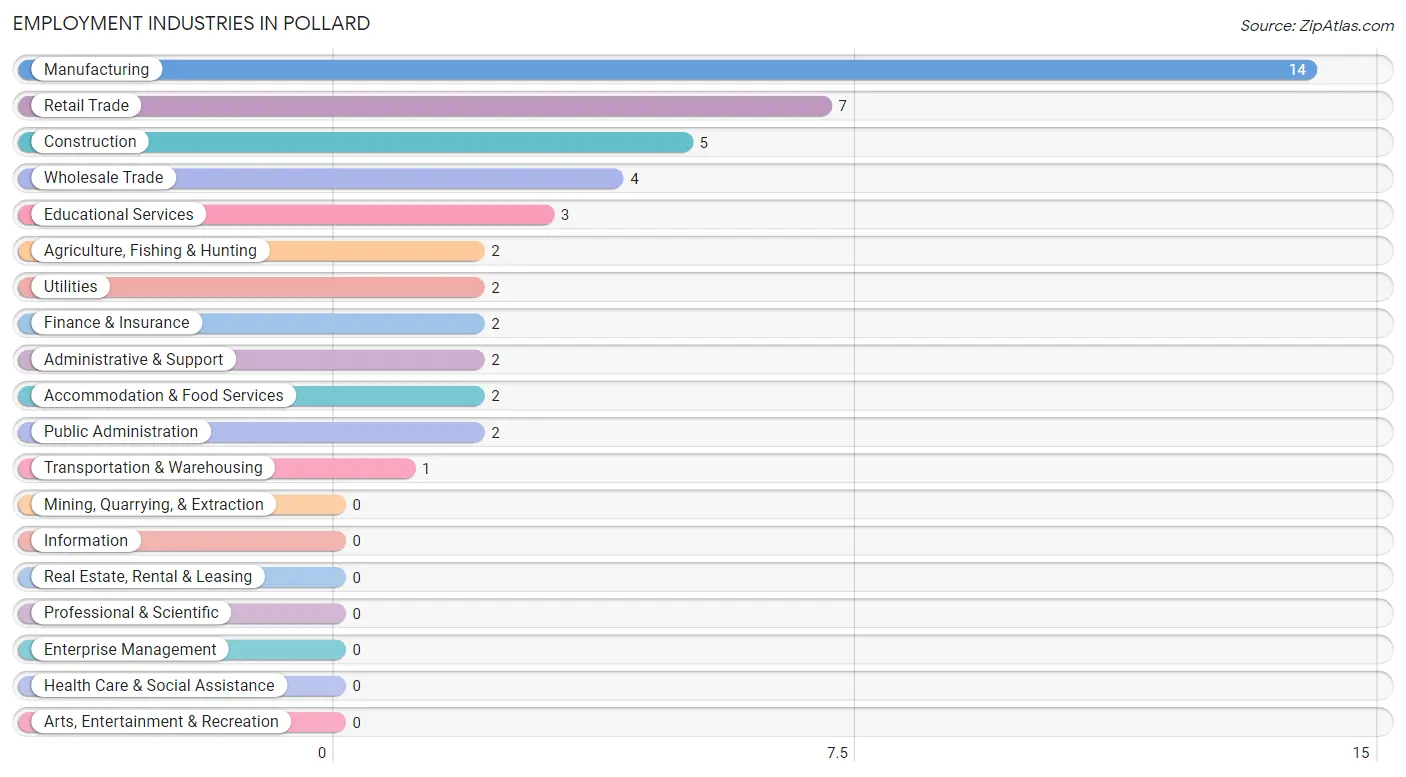
Employment Industries in Pollard
The major employment industries in Pollard include Manufacturing (14 | 30.4%), Retail Trade (7 | 15.2%), Construction (5 | 10.9%), Wholesale Trade (4 | 8.7%), and Educational Services (3 | 6.5%).
Employment Industries by Sex in Pollard
The Pollard industries that see more men than women are Agriculture, Fishing & Hunting (100.0%), Wholesale Trade (100.0%), and Transportation & Warehousing (100.0%), whereas the industries that tend to have a higher number of women are Retail Trade (100.0%), Utilities (100.0%), and Administrative & Support (100.0%).
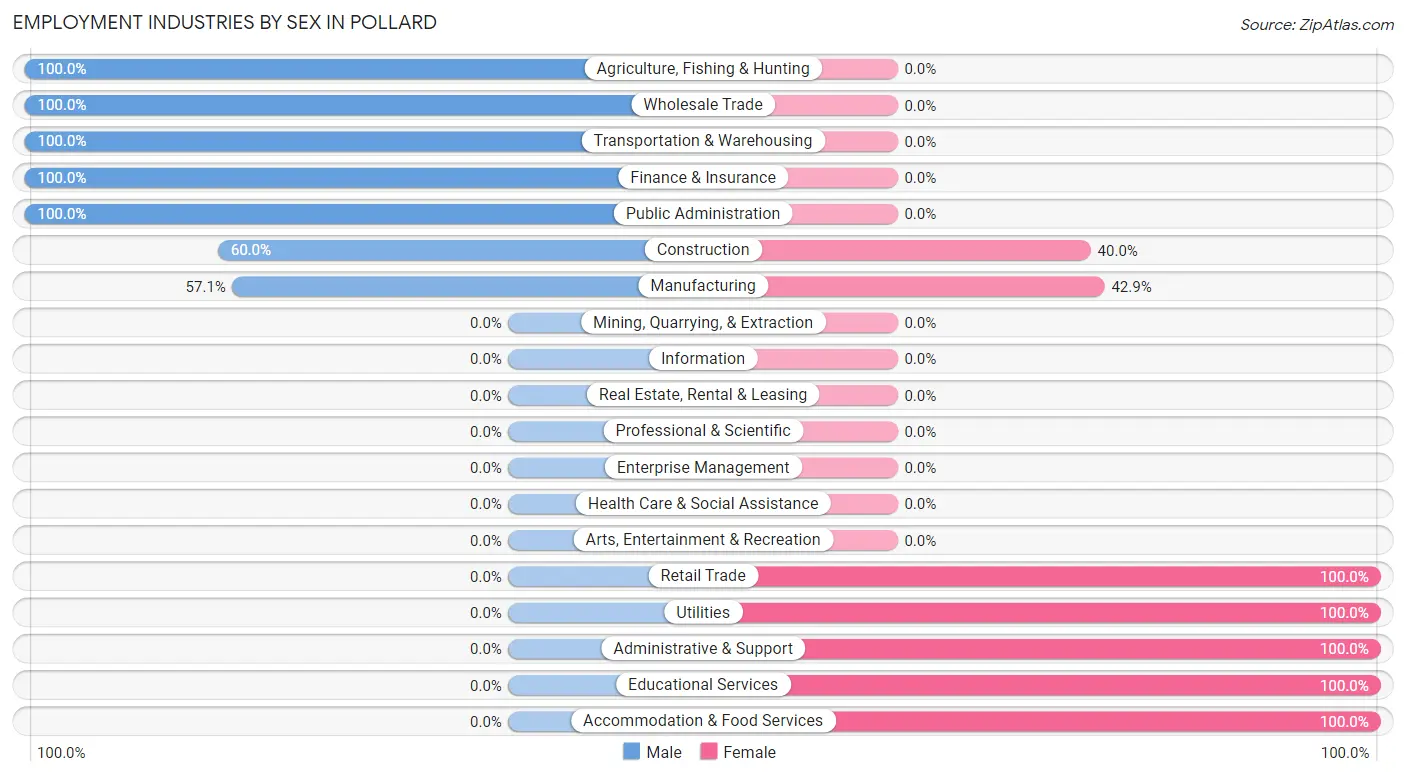
| Industry | Male | Female |
| Agriculture, Fishing & Hunting | 2 (100.0%) | 0 (0.0%) |
| Mining, Quarrying, & Extraction | 0 (0.0%) | 0 (0.0%) |
| Construction | 3 (60.0%) | 2 (40.0%) |
| Manufacturing | 8 (57.1%) | 6 (42.9%) |
| Wholesale Trade | 4 (100.0%) | 0 (0.0%) |
| Retail Trade | 0 (0.0%) | 7 (100.0%) |
| Transportation & Warehousing | 1 (100.0%) | 0 (0.0%) |
| Utilities | 0 (0.0%) | 2 (100.0%) |
| Information | 0 (0.0%) | 0 (0.0%) |
| Finance & Insurance | 2 (100.0%) | 0 (0.0%) |
| Real Estate, Rental & Leasing | 0 (0.0%) | 0 (0.0%) |
| Professional & Scientific | 0 (0.0%) | 0 (0.0%) |
| Enterprise Management | 0 (0.0%) | 0 (0.0%) |
| Administrative & Support | 0 (0.0%) | 2 (100.0%) |
| Educational Services | 0 (0.0%) | 3 (100.0%) |
| Health Care & Social Assistance | 0 (0.0%) | 0 (0.0%) |
| Arts, Entertainment & Recreation | 0 (0.0%) | 0 (0.0%) |
| Accommodation & Food Services | 0 (0.0%) | 2 (100.0%) |
| Public Administration | 2 (100.0%) | 0 (0.0%) |
| Total | 22 (47.8%) | 24 (52.2%) |
Education in Pollard
School Enrollment in Pollard
The most common levels of schooling among the 33 students in Pollard are middle school (16 | 48.5%), elementary school (8 | 24.2%), and high school (8 | 24.2%).
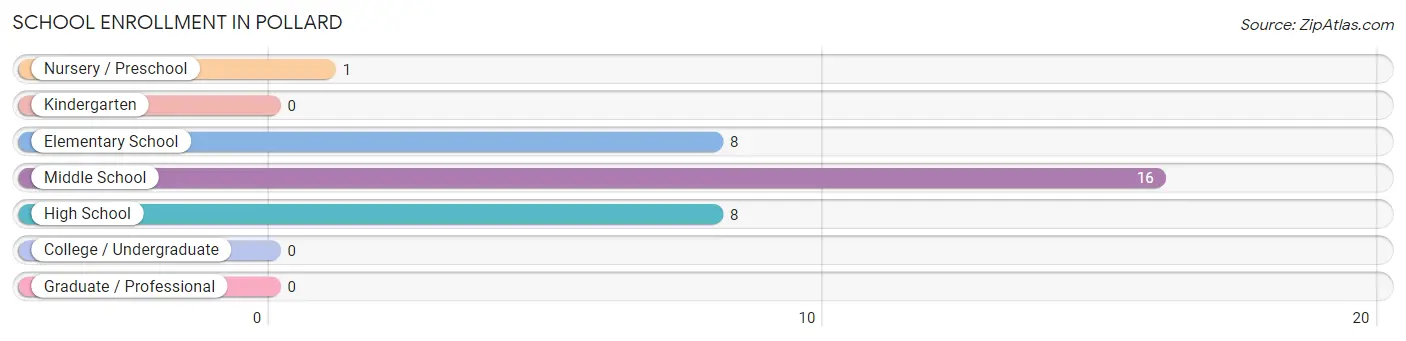
| School Level | # Students | % Students |
| Nursery / Preschool | 1 | 3.0% |
| Kindergarten | 0 | 0.0% |
| Elementary School | 8 | 24.2% |
| Middle School | 16 | 48.5% |
| High School | 8 | 24.2% |
| College / Undergraduate | 0 | 0.0% |
| Graduate / Professional | 0 | 0.0% |
| Total | 33 | 100.0% |
School Enrollment by Age by Funding Source in Pollard
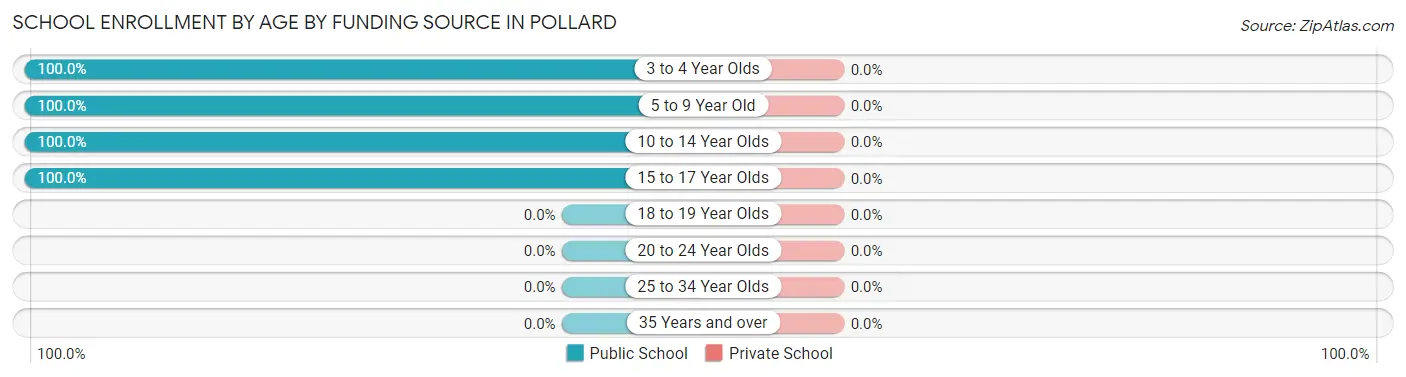
| Age Bracket | Public School | Private School |
| 3 to 4 Year Olds | 1 (100.0%) | 0 (0.0%) |
| 5 to 9 Year Old | 2 (100.0%) | 0 (0.0%) |
| 10 to 14 Year Olds | 21 (100.0%) | 0 (0.0%) |
| 15 to 17 Year Olds | 9 (100.0%) | 0 (0.0%) |
| 18 to 19 Year Olds | 0 (0.0%) | 0 (0.0%) |
| 20 to 24 Year Olds | 0 (0.0%) | 0 (0.0%) |
| 25 to 34 Year Olds | 0 (0.0%) | 0 (0.0%) |
| 35 Years and over | 0 (0.0%) | 0 (0.0%) |
| Total | 33 (100.0%) | 0 (0.0%) |
Educational Attainment by Field of Study in Pollard
Education (4 | 57.1%), science & technology (2 | 28.6%), and arts & humanities (1 | 14.3%) are the most common fields of study among 7 individuals in Pollard who have obtained a bachelor's degree or higher.
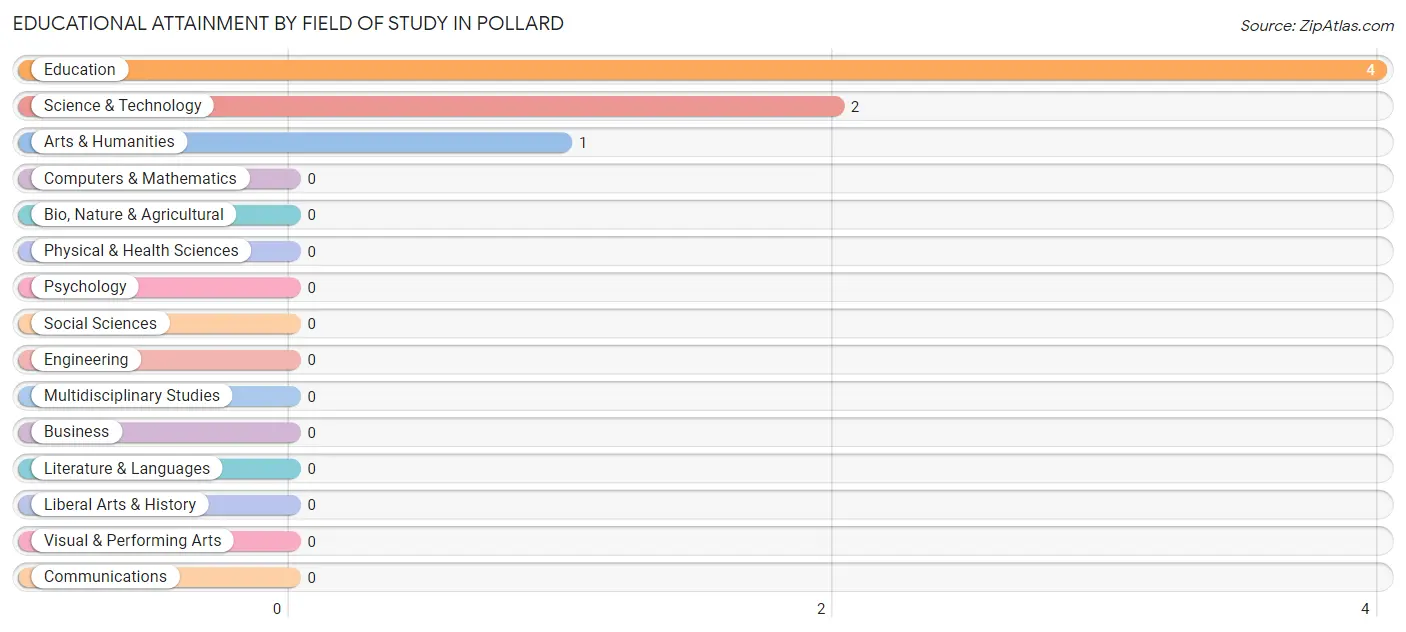
| Field of Study | # Graduates | % Graduates |
| Computers & Mathematics | 0 | 0.0% |
| Bio, Nature & Agricultural | 0 | 0.0% |
| Physical & Health Sciences | 0 | 0.0% |
| Psychology | 0 | 0.0% |
| Social Sciences | 0 | 0.0% |
| Engineering | 0 | 0.0% |
| Multidisciplinary Studies | 0 | 0.0% |
| Science & Technology | 2 | 28.6% |
| Business | 0 | 0.0% |
| Education | 4 | 57.1% |
| Literature & Languages | 0 | 0.0% |
| Liberal Arts & History | 0 | 0.0% |
| Visual & Performing Arts | 0 | 0.0% |
| Communications | 0 | 0.0% |
| Arts & Humanities | 1 | 14.3% |
| Total | 7 | 100.0% |
Transportation & Commute in Pollard
Vehicle Availability by Sex in Pollard
The most prevalent vehicle ownership categories in Pollard are males with 3 vehicles (9, accounting for 40.9%) and females with 3 vehicles (13, making up 37.5%).
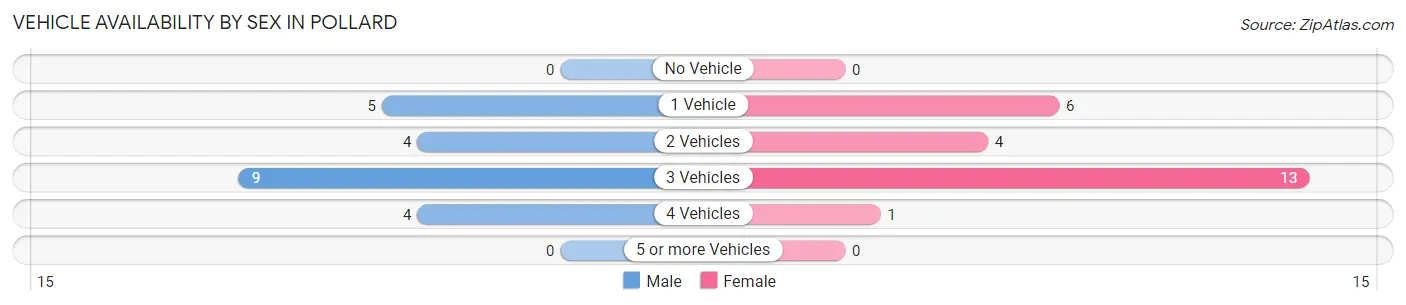
| Vehicles Available | Male | Female |
| No Vehicle | 0 (0.0%) | 0 (0.0%) |
| 1 Vehicle | 5 (22.7%) | 6 (25.0%) |
| 2 Vehicles | 4 (18.2%) | 4 (16.7%) |
| 3 Vehicles | 9 (40.9%) | 13 (54.2%) |
| 4 Vehicles | 4 (18.2%) | 1 (4.2%) |
| 5 or more Vehicles | 0 (0.0%) | 0 (0.0%) |
| Total | 22 (100.0%) | 24 (100.0%) |
Commute Time in Pollard
The most frequently occuring commute durations in Pollard are 15 to 19 minutes (15 commuters, 34.9%), 30 to 34 minutes (9 commuters, 20.9%), and 20 to 24 minutes (7 commuters, 16.3%).
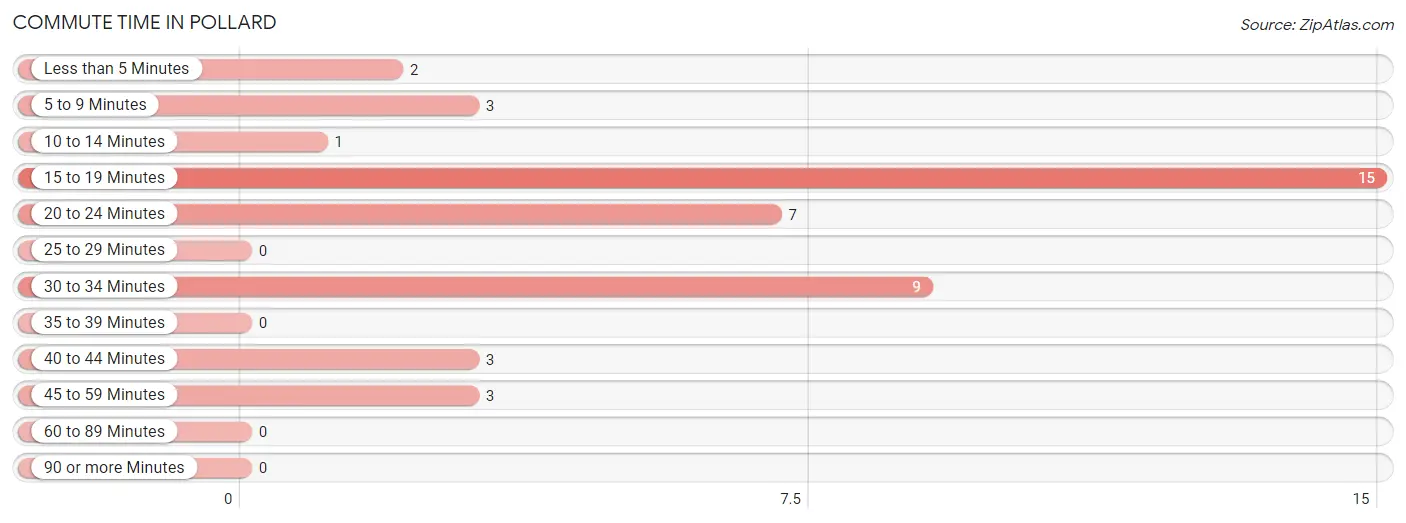
| Commute Time | # Commuters | % Commuters |
| Less than 5 Minutes | 2 | 4.6% |
| 5 to 9 Minutes | 3 | 7.0% |
| 10 to 14 Minutes | 1 | 2.3% |
| 15 to 19 Minutes | 15 | 34.9% |
| 20 to 24 Minutes | 7 | 16.3% |
| 25 to 29 Minutes | 0 | 0.0% |
| 30 to 34 Minutes | 9 | 20.9% |
| 35 to 39 Minutes | 0 | 0.0% |
| 40 to 44 Minutes | 3 | 7.0% |
| 45 to 59 Minutes | 3 | 7.0% |
| 60 to 89 Minutes | 0 | 0.0% |
| 90 or more Minutes | 0 | 0.0% |
Commute Time by Sex in Pollard
The most common commute times in Pollard are 30 to 34 minutes (9 commuters, 47.4%) for males and 15 to 19 minutes (12 commuters, 50.0%) for females.
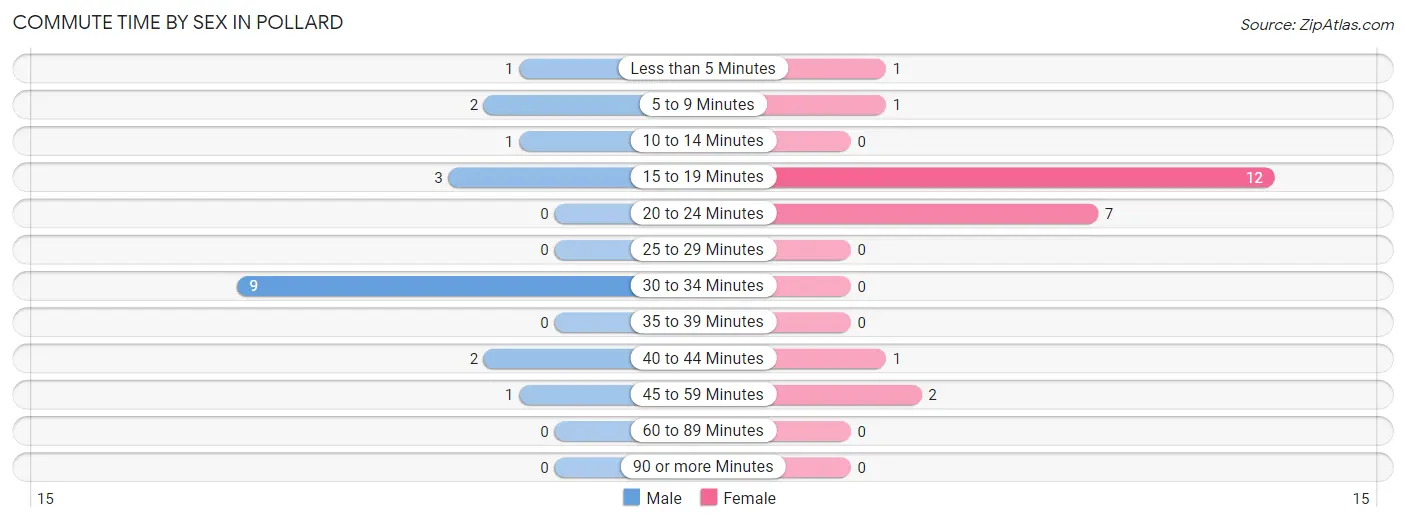
| Commute Time | Male | Female |
| Less than 5 Minutes | 1 (5.3%) | 1 (4.2%) |
| 5 to 9 Minutes | 2 (10.5%) | 1 (4.2%) |
| 10 to 14 Minutes | 1 (5.3%) | 0 (0.0%) |
| 15 to 19 Minutes | 3 (15.8%) | 12 (50.0%) |
| 20 to 24 Minutes | 0 (0.0%) | 7 (29.2%) |
| 25 to 29 Minutes | 0 (0.0%) | 0 (0.0%) |
| 30 to 34 Minutes | 9 (47.4%) | 0 (0.0%) |
| 35 to 39 Minutes | 0 (0.0%) | 0 (0.0%) |
| 40 to 44 Minutes | 2 (10.5%) | 1 (4.2%) |
| 45 to 59 Minutes | 1 (5.3%) | 2 (8.3%) |
| 60 to 89 Minutes | 0 (0.0%) | 0 (0.0%) |
| 90 or more Minutes | 0 (0.0%) | 0 (0.0%) |
Time of Departure to Work by Sex in Pollard
The most frequent times of departure to work in Pollard are 7:00 AM to 7:29 AM (9, 47.4%) for males and 8:30 AM to 8:59 AM (6, 25.0%) for females.
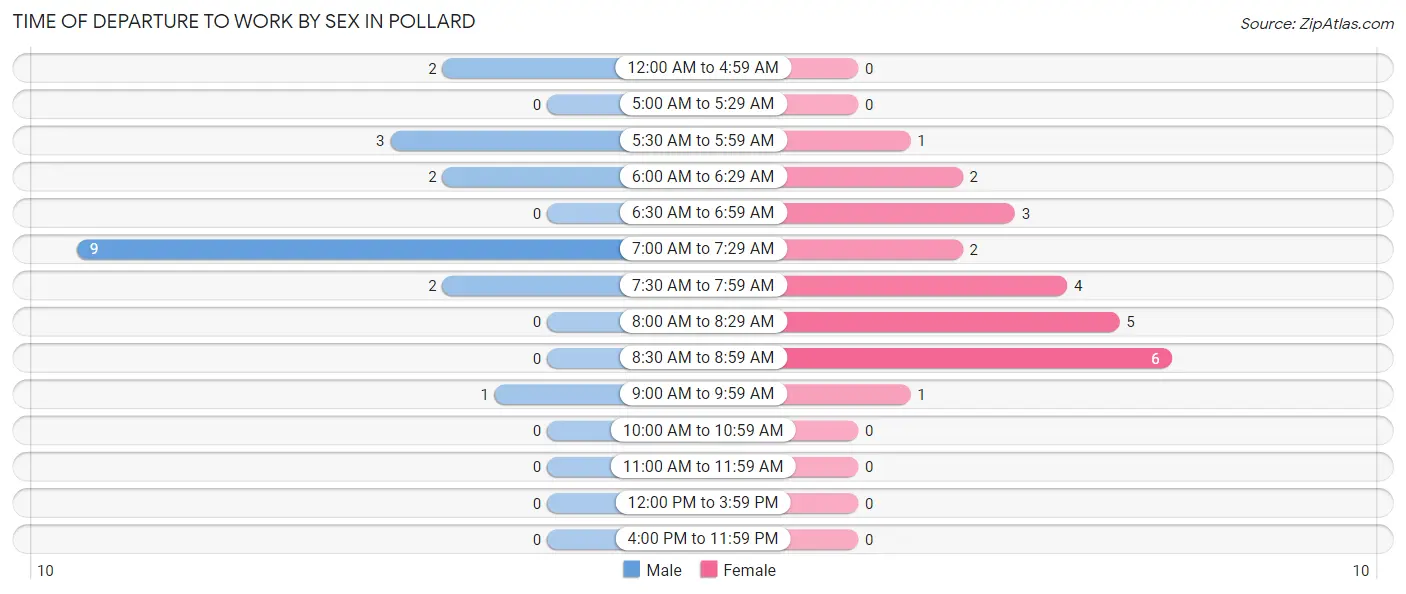
| Time of Departure | Male | Female |
| 12:00 AM to 4:59 AM | 2 (10.5%) | 0 (0.0%) |
| 5:00 AM to 5:29 AM | 0 (0.0%) | 0 (0.0%) |
| 5:30 AM to 5:59 AM | 3 (15.8%) | 1 (4.2%) |
| 6:00 AM to 6:29 AM | 2 (10.5%) | 2 (8.3%) |
| 6:30 AM to 6:59 AM | 0 (0.0%) | 3 (12.5%) |
| 7:00 AM to 7:29 AM | 9 (47.4%) | 2 (8.3%) |
| 7:30 AM to 7:59 AM | 2 (10.5%) | 4 (16.7%) |
| 8:00 AM to 8:29 AM | 0 (0.0%) | 5 (20.8%) |
| 8:30 AM to 8:59 AM | 0 (0.0%) | 6 (25.0%) |
| 9:00 AM to 9:59 AM | 1 (5.3%) | 1 (4.2%) |
| 10:00 AM to 10:59 AM | 0 (0.0%) | 0 (0.0%) |
| 11:00 AM to 11:59 AM | 0 (0.0%) | 0 (0.0%) |
| 12:00 PM to 3:59 PM | 0 (0.0%) | 0 (0.0%) |
| 4:00 PM to 11:59 PM | 0 (0.0%) | 0 (0.0%) |
| Total | 19 (100.0%) | 24 (100.0%) |
Housing Occupancy in Pollard
Occupancy by Ownership in Pollard
Of the total 39 dwellings in Pollard, owner-occupied units account for 29 (74.4%), while renter-occupied units make up 10 (25.6%).
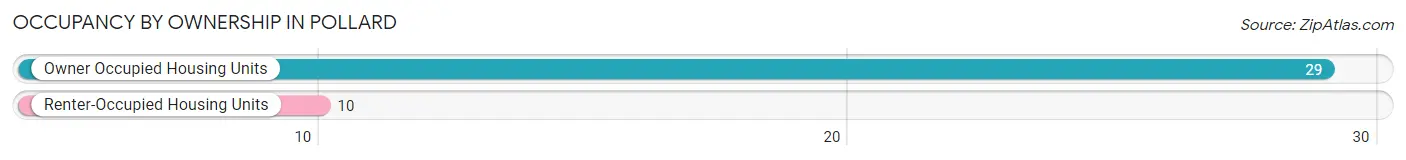
| Occupancy | # Housing Units | % Housing Units |
| Owner Occupied Housing Units | 29 | 74.4% |
| Renter-Occupied Housing Units | 10 | 25.6% |
| Total Occupied Housing Units | 39 | 100.0% |
Occupancy by Household Size in Pollard
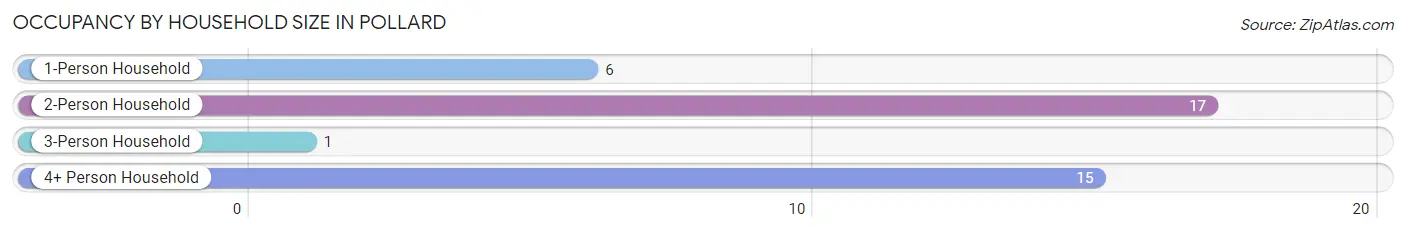
| Household Size | # Housing Units | % Housing Units |
| 1-Person Household | 6 | 15.4% |
| 2-Person Household | 17 | 43.6% |
| 3-Person Household | 1 | 2.6% |
| 4+ Person Household | 15 | 38.5% |
| Total Housing Units | 39 | 100.0% |
Occupancy by Ownership by Household Size in Pollard
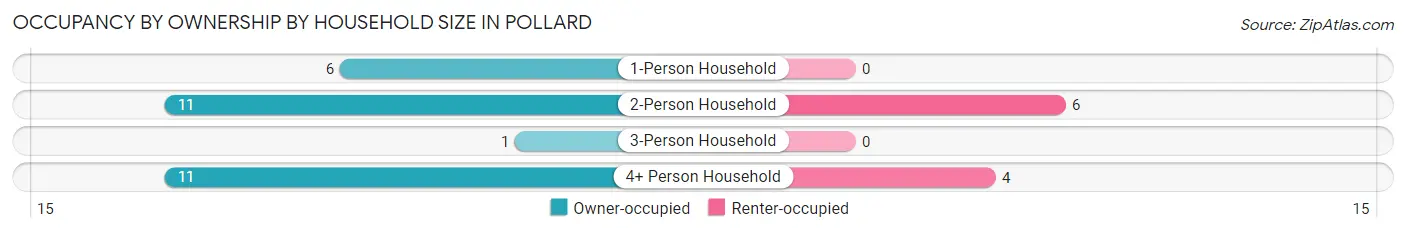
| Household Size | Owner-occupied | Renter-occupied |
| 1-Person Household | 6 (100.0%) | 0 (0.0%) |
| 2-Person Household | 11 (64.7%) | 6 (35.3%) |
| 3-Person Household | 1 (100.0%) | 0 (0.0%) |
| 4+ Person Household | 11 (73.3%) | 4 (26.7%) |
| Total Housing Units | 29 (74.4%) | 10 (25.6%) |
Occupancy by Educational Attainment in Pollard
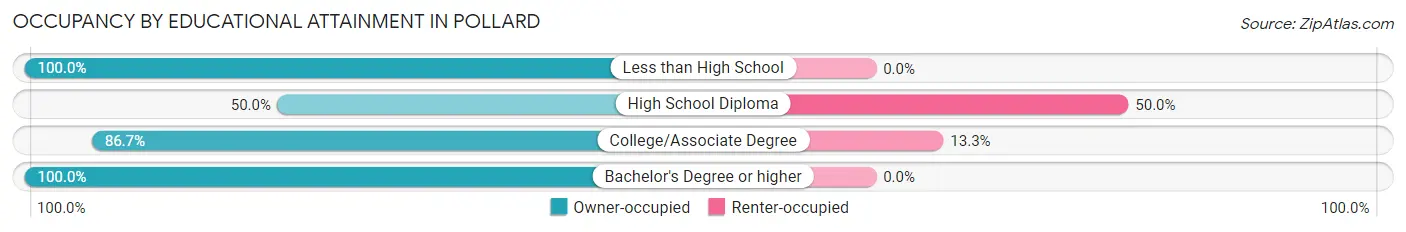
| Household Size | Owner-occupied | Renter-occupied |
| Less than High School | 4 (100.0%) | 0 (0.0%) |
| High School Diploma | 8 (50.0%) | 8 (50.0%) |
| College/Associate Degree | 13 (86.7%) | 2 (13.3%) |
| Bachelor's Degree or higher | 4 (100.0%) | 0 (0.0%) |
Occupancy by Age of Householder in Pollard
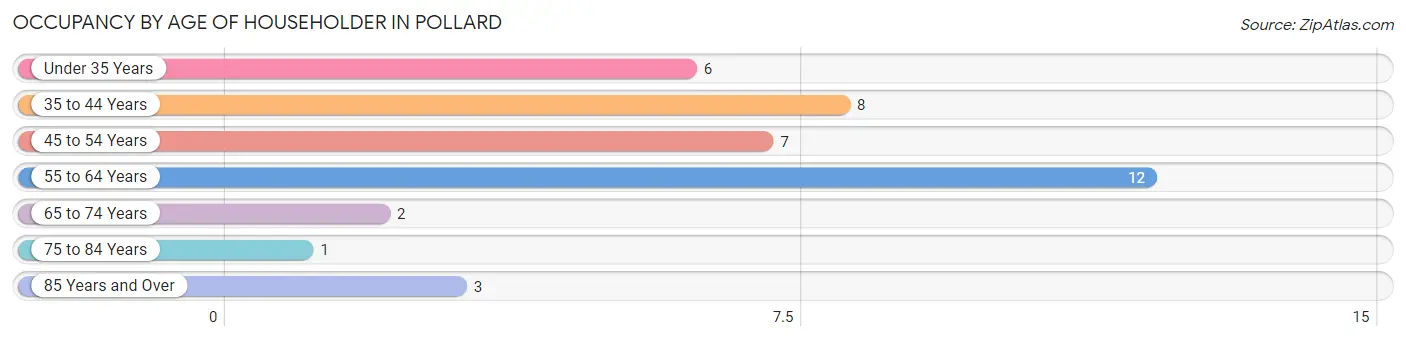
| Age Bracket | # Households | % Households |
| Under 35 Years | 6 | 15.4% |
| 35 to 44 Years | 8 | 20.5% |
| 45 to 54 Years | 7 | 17.9% |
| 55 to 64 Years | 12 | 30.8% |
| 65 to 74 Years | 2 | 5.1% |
| 75 to 84 Years | 1 | 2.6% |
| 85 Years and Over | 3 | 7.7% |
| Total | 39 | 100.0% |
Housing Finances in Pollard
Median Income by Occupancy in Pollard
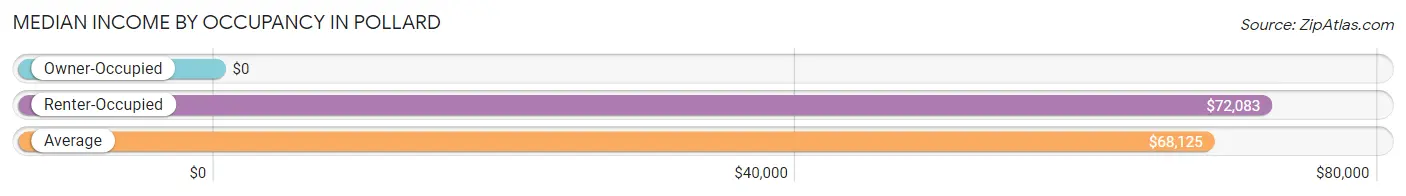
| Occupancy Type | # Households | Median Income |
| Owner-Occupied | 29 (74.4%) | $0 |
| Renter-Occupied | 10 (25.6%) | $72,083 |
| Average | 39 (100.0%) | $68,125 |
Occupancy by Householder Income Bracket in Pollard

| Income Bracket | Owner-occupied | Renter-occupied |
| Less than $5,000 | 0 (0.0%) | 0 (0.0%) |
| $5,000 to $9,999 | 0 (0.0%) | 0 (0.0%) |
| $10,000 to $14,999 | 4 (13.8%) | 0 (0.0%) |
| $15,000 to $19,999 | 4 (13.8%) | 0 (0.0%) |
| $20,000 to $24,999 | 5 (17.2%) | 0 (0.0%) |
| $25,000 to $34,999 | 3 (10.3%) | 0 (0.0%) |
| $35,000 to $49,999 | 0 (0.0%) | 0 (0.0%) |
| $50,000 to $74,999 | 5 (17.2%) | 6 (60.0%) |
| $75,000 to $99,999 | 1 (3.5%) | 4 (40.0%) |
| $100,000 to $149,999 | 2 (6.9%) | 0 (0.0%) |
| $150,000 or more | 5 (17.2%) | 0 (0.0%) |
| Total | 29 (100.0%) | 10 (100.0%) |
Monthly Housing Cost Tiers in Pollard
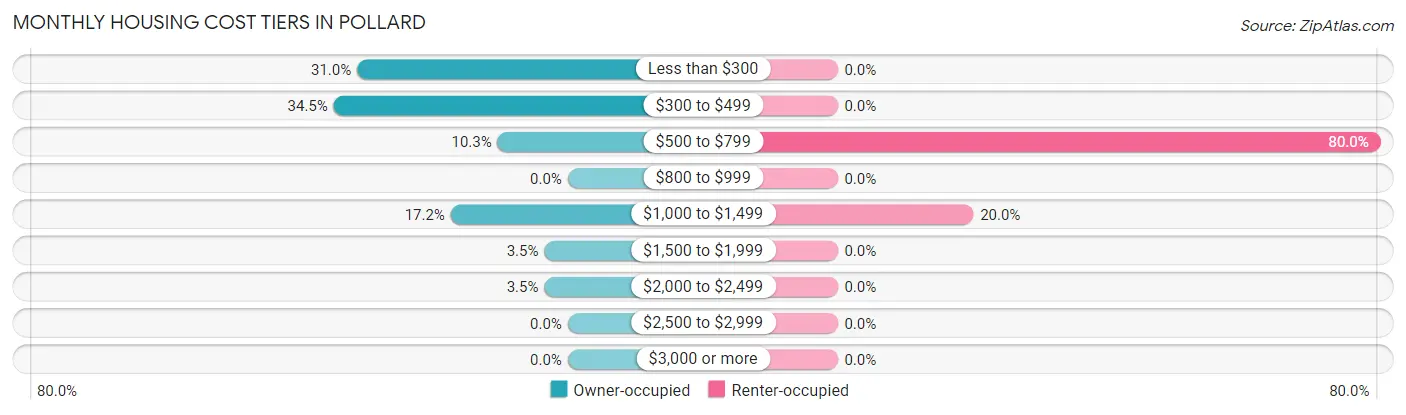
| Monthly Cost | Owner-occupied | Renter-occupied |
| Less than $300 | 9 (31.0%) | 0 (0.0%) |
| $300 to $499 | 10 (34.5%) | 0 (0.0%) |
| $500 to $799 | 3 (10.3%) | 8 (80.0%) |
| $800 to $999 | 0 (0.0%) | 0 (0.0%) |
| $1,000 to $1,499 | 5 (17.2%) | 2 (20.0%) |
| $1,500 to $1,999 | 1 (3.5%) | 0 (0.0%) |
| $2,000 to $2,499 | 1 (3.5%) | 0 (0.0%) |
| $2,500 to $2,999 | 0 (0.0%) | 0 (0.0%) |
| $3,000 or more | 0 (0.0%) | 0 (0.0%) |
| Total | 29 (100.0%) | 10 (100.0%) |
Physical Housing Characteristics in Pollard
Housing Structures in Pollard
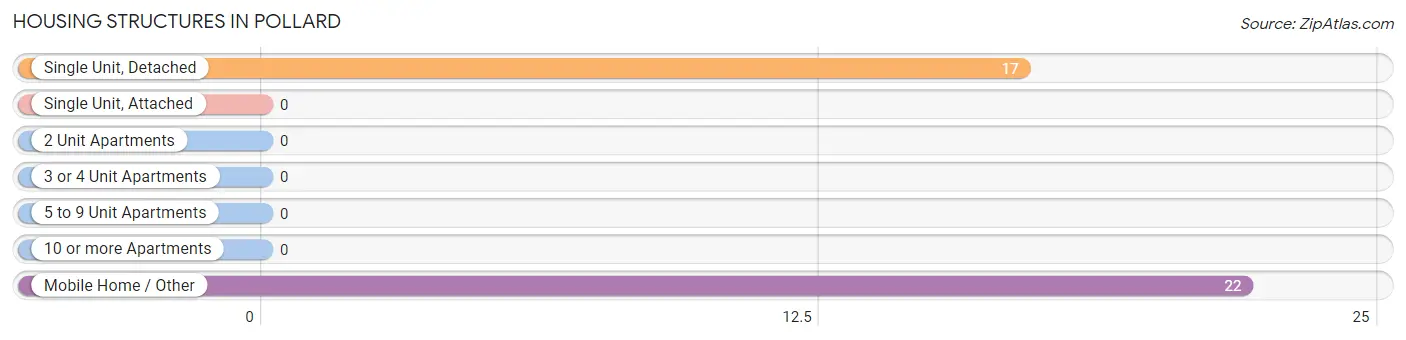
| Structure Type | # Housing Units | % Housing Units |
| Single Unit, Detached | 17 | 43.6% |
| Single Unit, Attached | 0 | 0.0% |
| 2 Unit Apartments | 0 | 0.0% |
| 3 or 4 Unit Apartments | 0 | 0.0% |
| 5 to 9 Unit Apartments | 0 | 0.0% |
| 10 or more Apartments | 0 | 0.0% |
| Mobile Home / Other | 22 | 56.4% |
| Total | 39 | 100.0% |
Housing Structures by Occupancy in Pollard
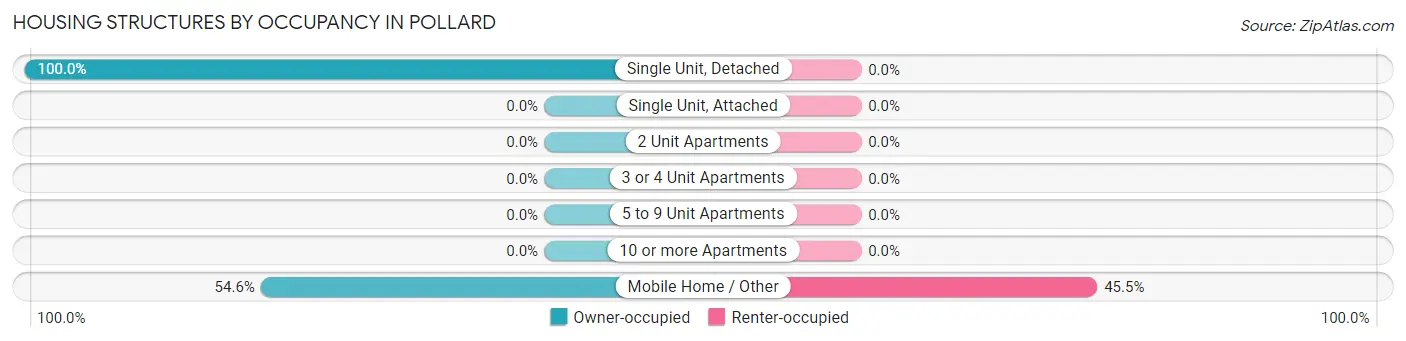
| Structure Type | Owner-occupied | Renter-occupied |
| Single Unit, Detached | 17 (100.0%) | 0 (0.0%) |
| Single Unit, Attached | 0 (0.0%) | 0 (0.0%) |
| 2 Unit Apartments | 0 (0.0%) | 0 (0.0%) |
| 3 or 4 Unit Apartments | 0 (0.0%) | 0 (0.0%) |
| 5 to 9 Unit Apartments | 0 (0.0%) | 0 (0.0%) |
| 10 or more Apartments | 0 (0.0%) | 0 (0.0%) |
| Mobile Home / Other | 12 (54.5%) | 10 (45.5%) |
| Total | 29 (74.4%) | 10 (25.6%) |
Housing Structures by Number of Rooms in Pollard
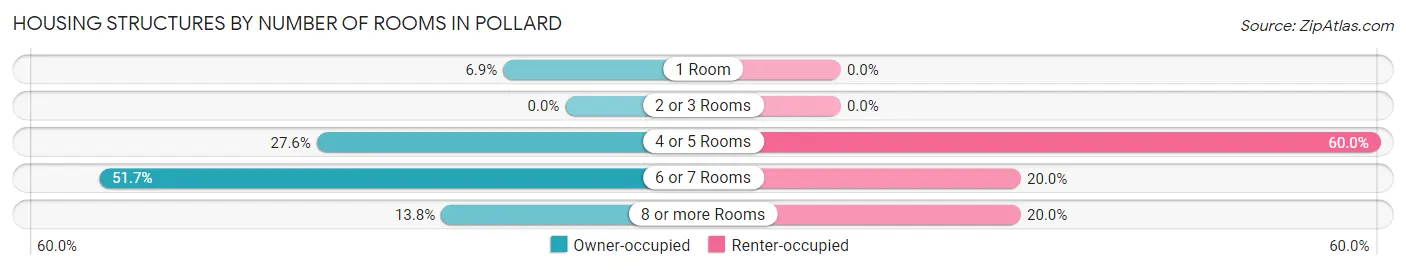
| Number of Rooms | Owner-occupied | Renter-occupied |
| 1 Room | 2 (6.9%) | 0 (0.0%) |
| 2 or 3 Rooms | 0 (0.0%) | 0 (0.0%) |
| 4 or 5 Rooms | 8 (27.6%) | 6 (60.0%) |
| 6 or 7 Rooms | 15 (51.7%) | 2 (20.0%) |
| 8 or more Rooms | 4 (13.8%) | 2 (20.0%) |
| Total | 29 (100.0%) | 10 (100.0%) |
Housing Structure by Heating Type in Pollard
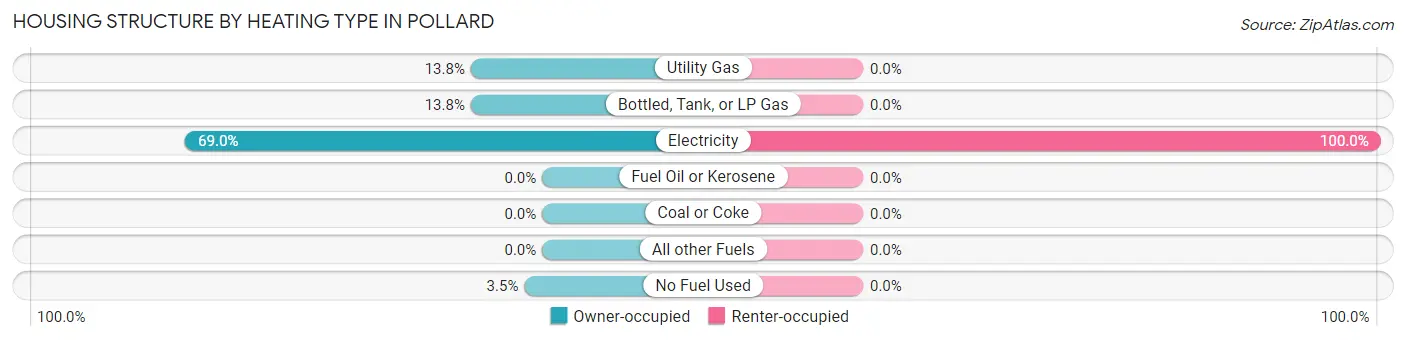
| Heating Type | Owner-occupied | Renter-occupied |
| Utility Gas | 4 (13.8%) | 0 (0.0%) |
| Bottled, Tank, or LP Gas | 4 (13.8%) | 0 (0.0%) |
| Electricity | 20 (69.0%) | 10 (100.0%) |
| Fuel Oil or Kerosene | 0 (0.0%) | 0 (0.0%) |
| Coal or Coke | 0 (0.0%) | 0 (0.0%) |
| All other Fuels | 0 (0.0%) | 0 (0.0%) |
| No Fuel Used | 1 (3.5%) | 0 (0.0%) |
| Total | 29 (100.0%) | 10 (100.0%) |
Household Vehicle Usage in Pollard
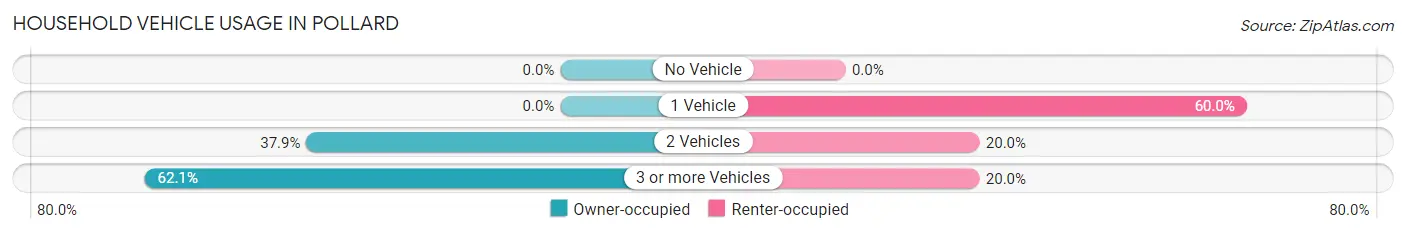
| Vehicles per Household | Owner-occupied | Renter-occupied |
| No Vehicle | 0 (0.0%) | 0 (0.0%) |
| 1 Vehicle | 0 (0.0%) | 6 (60.0%) |
| 2 Vehicles | 11 (37.9%) | 2 (20.0%) |
| 3 or more Vehicles | 18 (62.1%) | 2 (20.0%) |
| Total | 29 (100.0%) | 10 (100.0%) |
Real Estate & Mortgages in Pollard
Real Estate and Mortgage Overview in Pollard
| Characteristic | Without Mortgage | With Mortgage |
| Housing Units | 24 | 5 |
| Median Property Value | $75,000 | $0 |
| Median Household Income | $25,000 | $0 |
| Monthly Housing Costs | $400 | $0 |
| Real Estate Taxes | $258 | $2 |
Property Value by Mortgage Status in Pollard
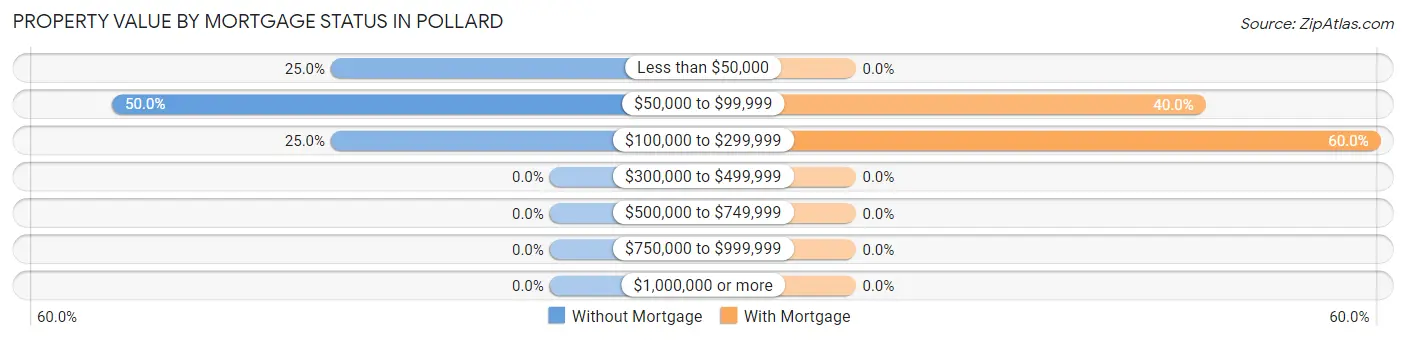
| Property Value | Without Mortgage | With Mortgage |
| Less than $50,000 | 6 (25.0%) | 0 (0.0%) |
| $50,000 to $99,999 | 12 (50.0%) | 2 (40.0%) |
| $100,000 to $299,999 | 6 (25.0%) | 3 (60.0%) |
| $300,000 to $499,999 | 0 (0.0%) | 0 (0.0%) |
| $500,000 to $749,999 | 0 (0.0%) | 0 (0.0%) |
| $750,000 to $999,999 | 0 (0.0%) | 0 (0.0%) |
| $1,000,000 or more | 0 (0.0%) | 0 (0.0%) |
| Total | 24 (100.0%) | 5 (100.0%) |
Household Income by Mortgage Status in Pollard
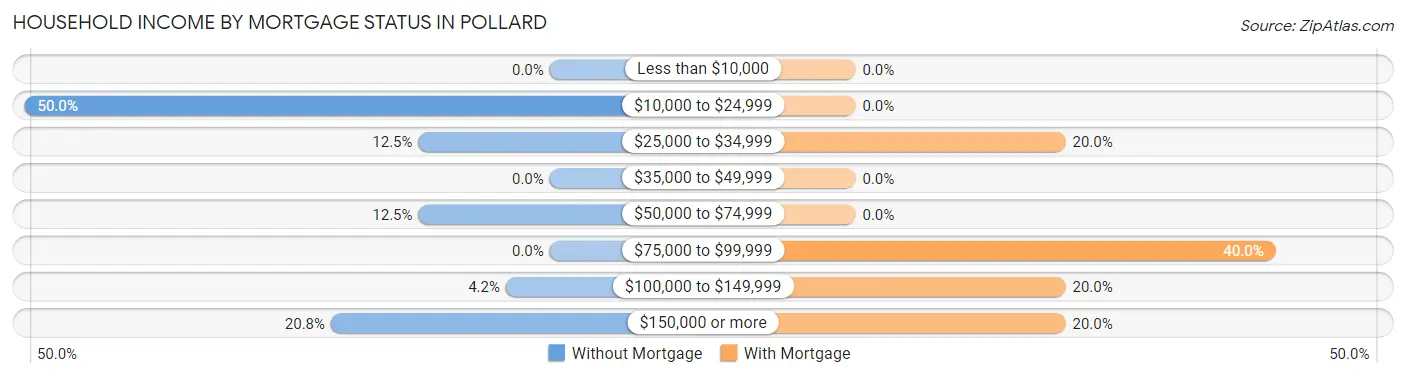
| Household Income | Without Mortgage | With Mortgage |
| Less than $10,000 | 0 (0.0%) | 0 (0.0%) |
| $10,000 to $24,999 | 12 (50.0%) | 0 (0.0%) |
| $25,000 to $34,999 | 3 (12.5%) | 1 (20.0%) |
| $35,000 to $49,999 | 0 (0.0%) | 0 (0.0%) |
| $50,000 to $74,999 | 3 (12.5%) | 0 (0.0%) |
| $75,000 to $99,999 | 0 (0.0%) | 2 (40.0%) |
| $100,000 to $149,999 | 1 (4.2%) | 1 (20.0%) |
| $150,000 or more | 5 (20.8%) | 1 (20.0%) |
| Total | 24 (100.0%) | 5 (100.0%) |
Property Value to Household Income Ratio in Pollard

| Value-to-Income Ratio | Without Mortgage | With Mortgage |
| Less than 2.0x | 12 (50.0%) | 69,375 (1,387,500.0%) |
| 2.0x to 2.9x | 3 (12.5%) | 3 (60.0%) |
| 3.0x to 3.9x | 9 (37.5%) | 0 (0.0%) |
| 4.0x or more | 0 (0.0%) | 1 (20.0%) |
| Total | 24 (100.0%) | 5 (100.0%) |
Real Estate Taxes by Mortgage Status in Pollard
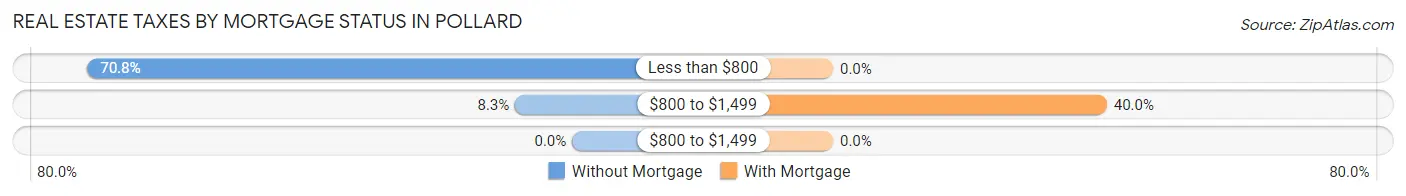
| Property Taxes | Without Mortgage | With Mortgage |
| Less than $800 | 17 (70.8%) | 0 (0.0%) |
| $800 to $1,499 | 2 (8.3%) | 2 (40.0%) |
| $800 to $1,499 | 0 (0.0%) | 0 (0.0%) |
| Total | 24 (100.0%) | 5 (100.0%) |
Health & Disability in Pollard
Health Insurance Coverage by Age in Pollard
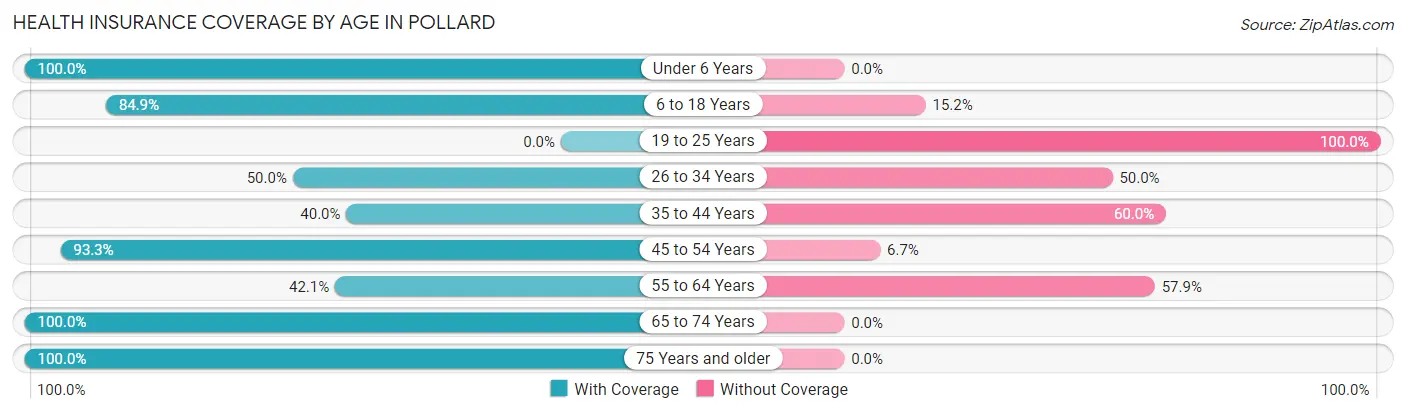
| Age Bracket | With Coverage | Without Coverage |
| Under 6 Years | 4 (100.0%) | 0 (0.0%) |
| 6 to 18 Years | 28 (84.9%) | 5 (15.1%) |
| 19 to 25 Years | 0 (0.0%) | 1 (100.0%) |
| 26 to 34 Years | 5 (50.0%) | 5 (50.0%) |
| 35 to 44 Years | 6 (40.0%) | 9 (60.0%) |
| 45 to 54 Years | 14 (93.3%) | 1 (6.7%) |
| 55 to 64 Years | 8 (42.1%) | 11 (57.9%) |
| 65 to 74 Years | 9 (100.0%) | 0 (0.0%) |
| 75 Years and older | 4 (100.0%) | 0 (0.0%) |
| Total | 78 (70.9%) | 32 (29.1%) |
Health Insurance Coverage by Citizenship Status in Pollard
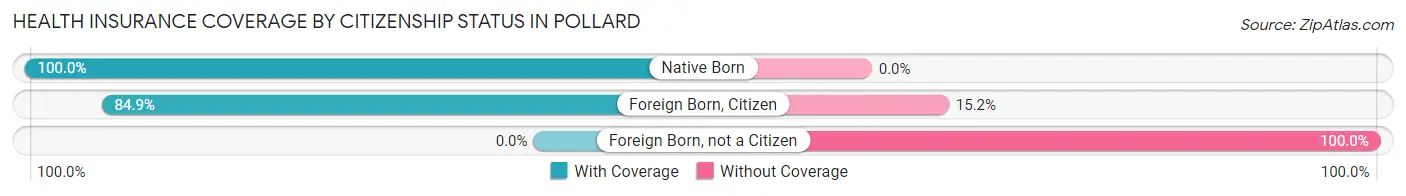
| Citizenship Status | With Coverage | Without Coverage |
| Native Born | 4 (100.0%) | 0 (0.0%) |
| Foreign Born, Citizen | 28 (84.9%) | 5 (15.1%) |
| Foreign Born, not a Citizen | 0 (0.0%) | 1 (100.0%) |
Health Insurance Coverage by Household Income in Pollard
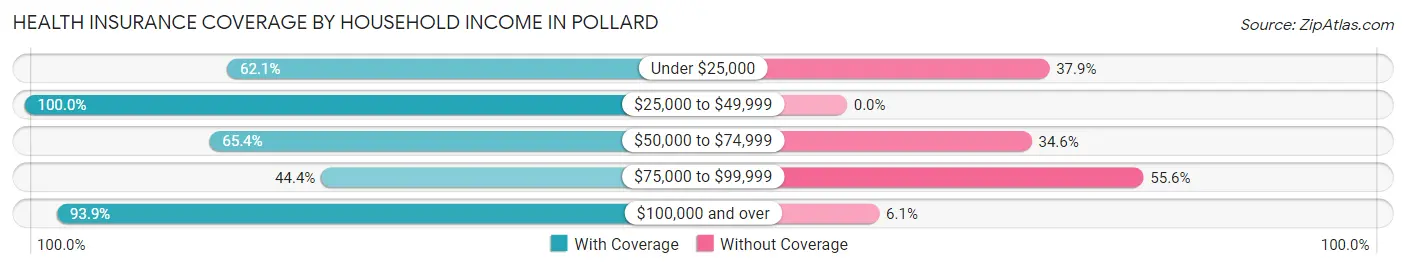
| Household Income | With Coverage | Without Coverage |
| Under $25,000 | 18 (62.1%) | 11 (37.9%) |
| $25,000 to $49,999 | 4 (100.0%) | 0 (0.0%) |
| $50,000 to $74,999 | 17 (65.4%) | 9 (34.6%) |
| $75,000 to $99,999 | 8 (44.4%) | 10 (55.6%) |
| $100,000 and over | 31 (93.9%) | 2 (6.1%) |
Public vs Private Health Insurance Coverage by Age in Pollard
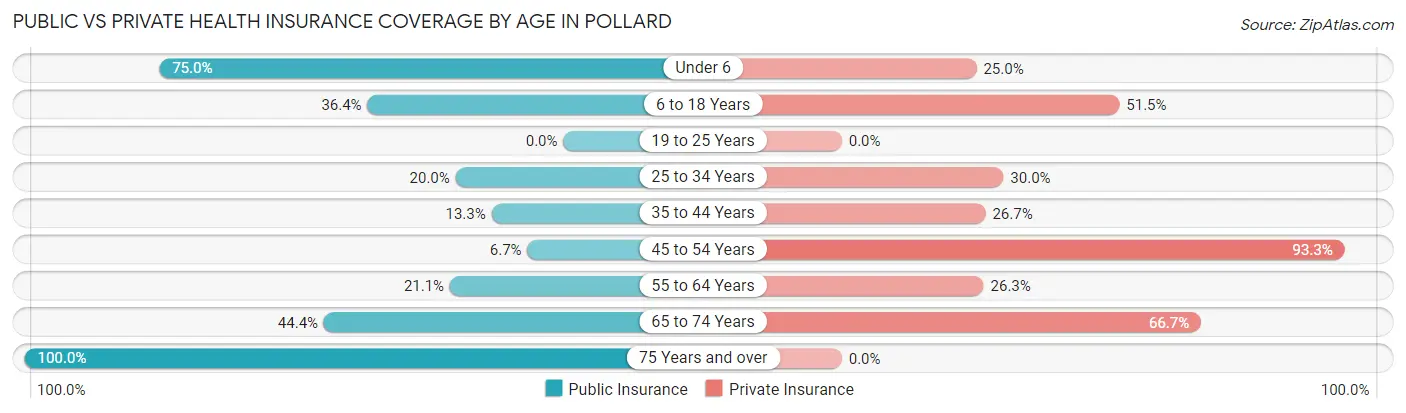
| Age Bracket | Public Insurance | Private Insurance |
| Under 6 | 3 (75.0%) | 1 (25.0%) |
| 6 to 18 Years | 12 (36.4%) | 17 (51.5%) |
| 19 to 25 Years | 0 (0.0%) | 0 (0.0%) |
| 25 to 34 Years | 2 (20.0%) | 3 (30.0%) |
| 35 to 44 Years | 2 (13.3%) | 4 (26.7%) |
| 45 to 54 Years | 1 (6.7%) | 14 (93.3%) |
| 55 to 64 Years | 4 (21.0%) | 5 (26.3%) |
| 65 to 74 Years | 4 (44.4%) | 6 (66.7%) |
| 75 Years and over | 4 (100.0%) | 0 (0.0%) |
| Total | 32 (29.1%) | 50 (45.5%) |
Disability Status by Sex by Age in Pollard
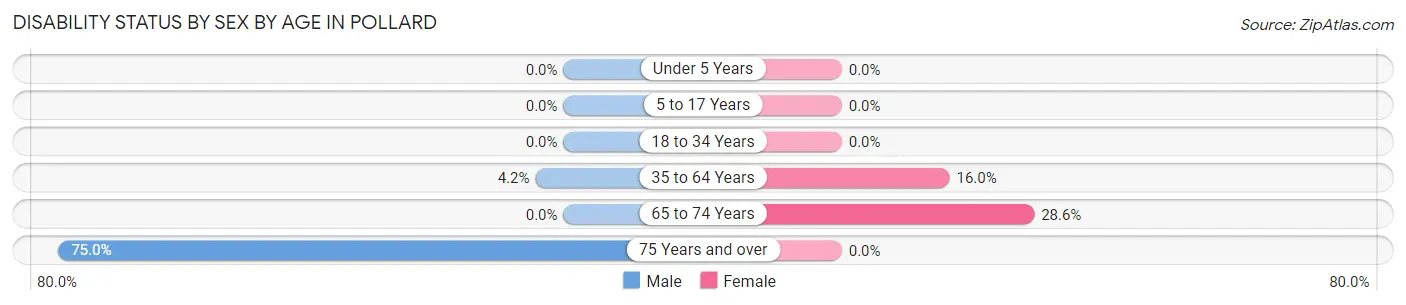
| Age Bracket | Male | Female |
| Under 5 Years | 0 (0.0%) | 0 (0.0%) |
| 5 to 17 Years | 0 (0.0%) | 0 (0.0%) |
| 18 to 34 Years | 0 (0.0%) | 0 (0.0%) |
| 35 to 64 Years | 1 (4.2%) | 4 (16.0%) |
| 65 to 74 Years | 0 (0.0%) | 2 (28.6%) |
| 75 Years and over | 3 (75.0%) | 0 (0.0%) |
Disability Class by Sex by Age in Pollard
Disability Class: Hearing Difficulty
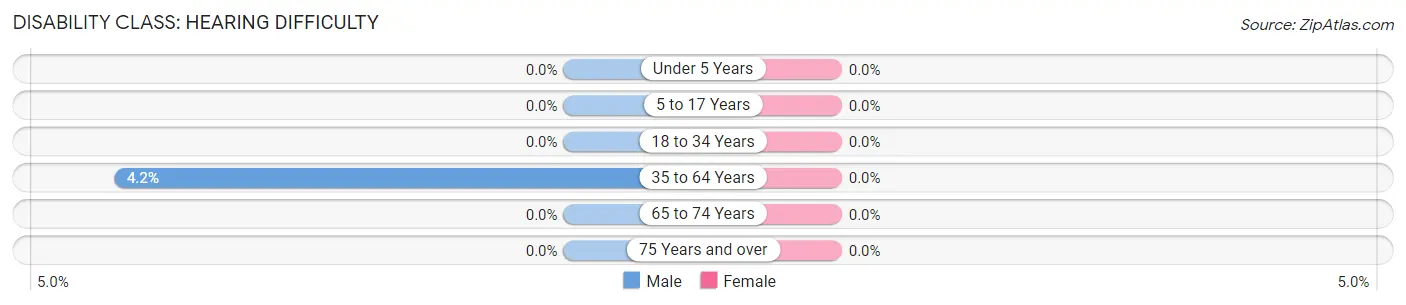
| Age Bracket | Male | Female |
| Under 5 Years | 0 (0.0%) | 0 (0.0%) |
| 5 to 17 Years | 0 (0.0%) | 0 (0.0%) |
| 18 to 34 Years | 0 (0.0%) | 0 (0.0%) |
| 35 to 64 Years | 1 (4.2%) | 0 (0.0%) |
| 65 to 74 Years | 0 (0.0%) | 0 (0.0%) |
| 75 Years and over | 0 (0.0%) | 0 (0.0%) |
Disability Class: Vision Difficulty
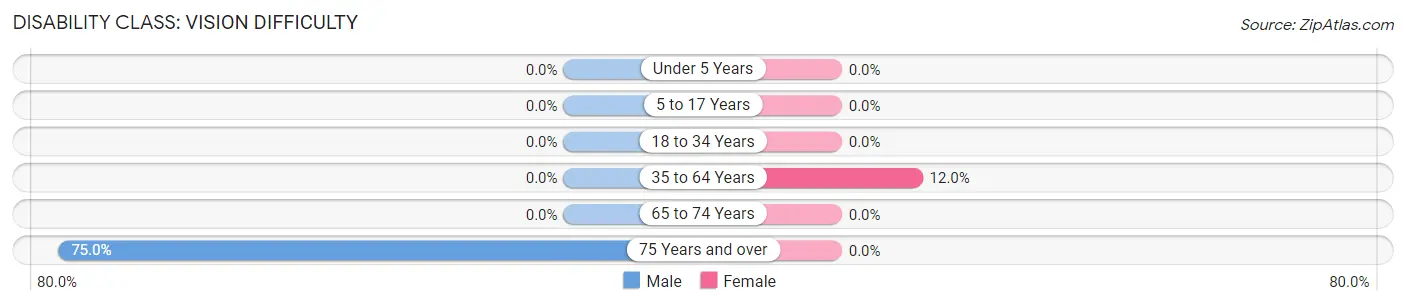
| Age Bracket | Male | Female |
| Under 5 Years | 0 (0.0%) | 0 (0.0%) |
| 5 to 17 Years | 0 (0.0%) | 0 (0.0%) |
| 18 to 34 Years | 0 (0.0%) | 0 (0.0%) |
| 35 to 64 Years | 0 (0.0%) | 3 (12.0%) |
| 65 to 74 Years | 0 (0.0%) | 0 (0.0%) |
| 75 Years and over | 3 (75.0%) | 0 (0.0%) |
Disability Class: Cognitive Difficulty
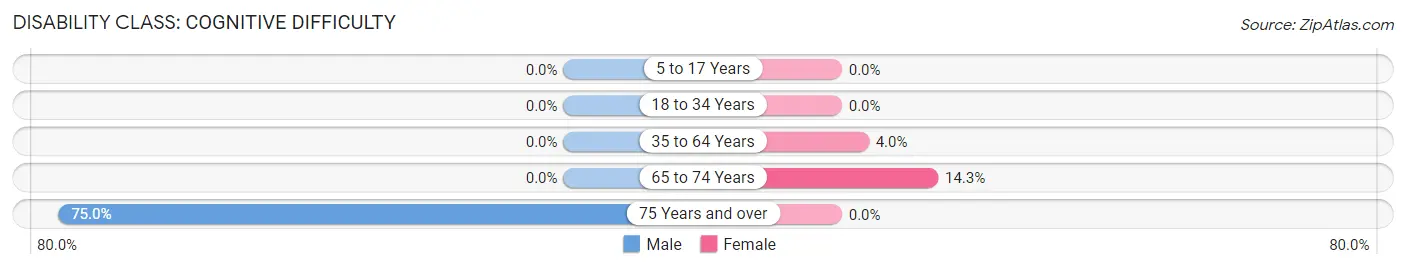
| Age Bracket | Male | Female |
| 5 to 17 Years | 0 (0.0%) | 0 (0.0%) |
| 18 to 34 Years | 0 (0.0%) | 0 (0.0%) |
| 35 to 64 Years | 0 (0.0%) | 1 (4.0%) |
| 65 to 74 Years | 0 (0.0%) | 1 (14.3%) |
| 75 Years and over | 3 (75.0%) | 0 (0.0%) |
Disability Class: Ambulatory Difficulty
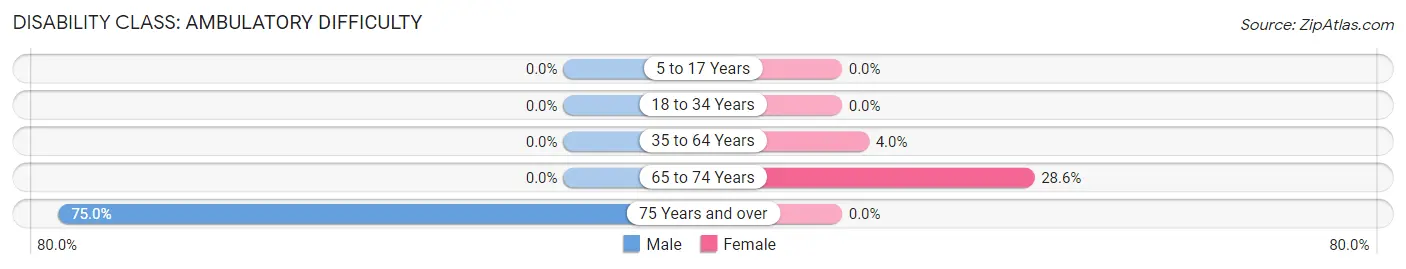
| Age Bracket | Male | Female |
| 5 to 17 Years | 0 (0.0%) | 0 (0.0%) |
| 18 to 34 Years | 0 (0.0%) | 0 (0.0%) |
| 35 to 64 Years | 0 (0.0%) | 1 (4.0%) |
| 65 to 74 Years | 0 (0.0%) | 2 (28.6%) |
| 75 Years and over | 3 (75.0%) | 0 (0.0%) |
Disability Class: Self-Care Difficulty
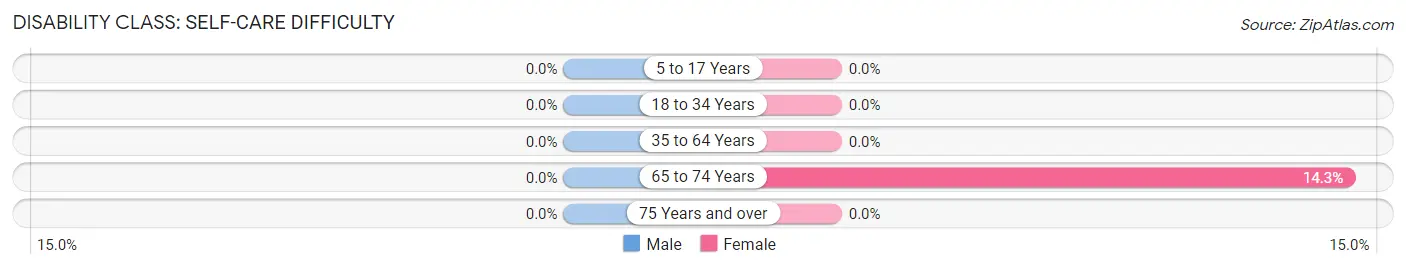
| Age Bracket | Male | Female |
| 5 to 17 Years | 0 (0.0%) | 0 (0.0%) |
| 18 to 34 Years | 0 (0.0%) | 0 (0.0%) |
| 35 to 64 Years | 0 (0.0%) | 0 (0.0%) |
| 65 to 74 Years | 0 (0.0%) | 1 (14.3%) |
| 75 Years and over | 0 (0.0%) | 0 (0.0%) |
Technology Access in Pollard
Computing Device Access in Pollard
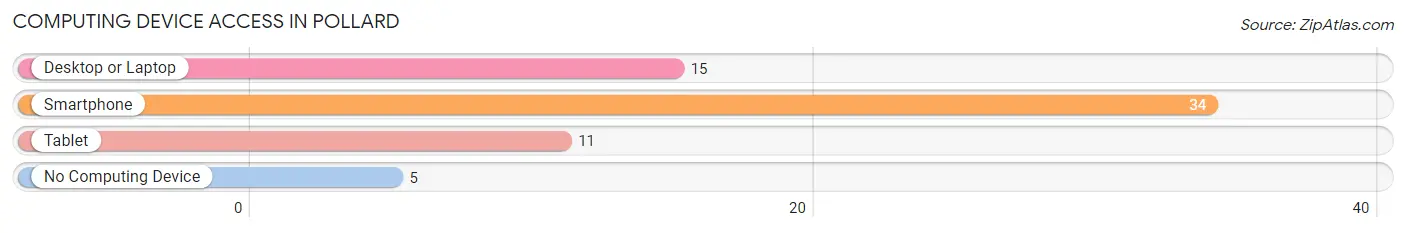
| Device Type | # Households | % Households |
| Desktop or Laptop | 15 | 38.5% |
| Smartphone | 34 | 87.2% |
| Tablet | 11 | 28.2% |
| No Computing Device | 5 | 12.8% |
| Total | 39 | 100.0% |
Internet Access in Pollard
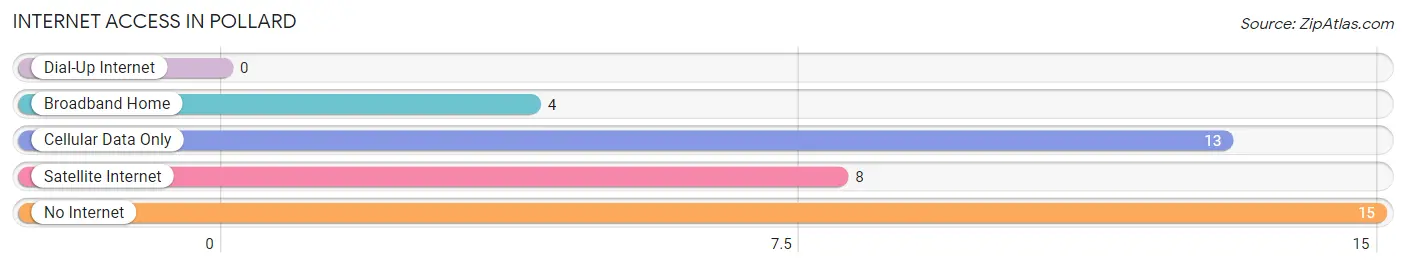
| Internet Type | # Households | % Households |
| Dial-Up Internet | 0 | 0.0% |
| Broadband Home | 4 | 10.3% |
| Cellular Data Only | 13 | 33.3% |
| Satellite Internet | 8 | 20.5% |
| No Internet | 15 | 38.5% |
| Total | 39 | 100.0% |
Pollard Summary
History
The town of Pollard, Alabama is located in the southeastern corner of the state, in the county of Covington. It is situated on the banks of the Choctawhatchee River, and is part of the Dothan Metropolitan Statistical Area. The town was founded in 1820 by William Pollard, a settler from Georgia. He purchased the land from the Creek Indians, and the town was named after him.
The town was originally a small farming community, but it soon grew to become a major trading center for the surrounding area. The town was also a major stop on the stagecoach route between Mobile and Montgomery. In the late 1800s, the town was home to several cotton mills, and it was also a major shipping point for cotton and other goods.
In the early 1900s, the town began to experience a decline in population as many of the residents moved away to larger cities. However, the town was able to remain a viable community due to its proximity to the nearby cities of Dothan and Enterprise.
Geography
Pollard is located in the southeastern corner of Alabama, in the county of Covington. It is situated on the banks of the Choctawhatchee River, and is part of the Dothan Metropolitan Statistical Area. The town is located approximately 20 miles south of Dothan, and about 40 miles north of Panama City, Florida.
The town is situated in a rural area, and is surrounded by rolling hills and forests. The town is located in a humid subtropical climate zone, and experiences hot, humid summers and mild winters. The average annual temperature is around 70 degrees Fahrenheit, and the average annual precipitation is around 50 inches.
Economy
The economy of Pollard is largely based on agriculture and forestry. The town is home to several farms, and the surrounding area is known for its production of cotton, corn, soybeans, and other crops. The town is also home to several timber companies, which harvest the surrounding forests for lumber and other wood products.
The town is also home to several small businesses, including restaurants, retail stores, and service providers. The town is also home to a few manufacturing companies, which produce a variety of products, including furniture, clothing, and electronics.
Demographics
As of the 2010 census, the population of Pollard was 1,845. The town is predominantly white, with a small African American population. The median household income is around $35,000, and the median home value is around $90,000. The town has a low unemployment rate, and the poverty rate is around 10%.
The town is served by the Covington County School District, and is home to several churches. The town is also home to a few parks and recreational areas, including the Pollard Park and the Pollard Nature Trail. The town is also home to a few historic sites, including the Pollard House and the Pollard Cemetery.
Common Questions
What is Per Capita Income in Pollard?
Per Capita income in Pollard is $23,141.
What is the Median Family Income in Pollard?
Median Family Income in Pollard is $55,625.
What is the Median Household income in Pollard?
Median Household Income in Pollard is $68,125.
What is Income or Wage Gap in Pollard?
Income or Wage Gap in Pollard is 4.2%.
Women in Pollard earn 95.8 cents for every dollar earned by a man.
What is Inequality or Gini Index in Pollard?
Inequality or Gini Index in Pollard is 0.43.
What is the Total Population of Pollard?
Total Population of Pollard is 110.
What is the Total Male Population of Pollard?
Total Male Population of Pollard is 58.
What is the Total Female Population of Pollard?
Total Female Population of Pollard is 52.
What is the Ratio of Males per 100 Females in Pollard?
There are 111.54 Males per 100 Females in Pollard.
What is the Ratio of Females per 100 Males in Pollard?
There are 89.66 Females per 100 Males in Pollard.
What is the Median Population Age in Pollard?
Median Population Age in Pollard is 40.5 Years.
What is the Average Family Size in Pollard
Average Family Size in Pollard is 3.4 People.
What is the Average Household Size in Pollard
Average Household Size in Pollard is 2.8 People.
How Large is the Labor Force in Pollard?
There are 46 People in the Labor Forcein in Pollard.
What is the Percentage of People in the Labor Force in Pollard?
61.3% of People are in the Labor Force in Pollard.