Fort Payne, AL Map & Demographics
Fort Payne Map
Fort Payne Overview
$26,436
PER CAPITA INCOME
$55,465
AVG FAMILY INCOME
$44,549
AVG HOUSEHOLD INCOME
30.7%
WAGE / INCOME GAP [ % ]
69.3¢/ $1
WAGE / INCOME GAP [ $ ]
$9,073
FAMILY INCOME DEFICIT
0.49
INEQUALITY / GINI INDEX
14,815
TOTAL POPULATION
7,054
MALE POPULATION
7,761
FEMALE POPULATION
90.89
MALES / 100 FEMALES
110.02
FEMALES / 100 MALES
39.7
MEDIAN AGE
3.2
AVG FAMILY SIZE
2.5
AVG HOUSEHOLD SIZE
6,376
LABOR FORCE [ PEOPLE ]
55.3%
PERCENT IN LABOR FORCE
6.1%
UNEMPLOYMENT RATE
Fort Payne Area Codes
Income in Fort Payne
Income Overview in Fort Payne
Per Capita Income in Fort Payne is $26,436, while median incomes of families and households are $55,465 and $44,549 respectively.
| Characteristic | Number | Measure |
| Per Capita Income | 14,815 | $26,436 |
| Median Family Income | 3,621 | $55,465 |
| Mean Family Income | 3,621 | $75,918 |
| Median Household Income | 5,814 | $44,549 |
| Mean Household Income | 5,814 | $62,999 |
| Income Deficit | 3,621 | $9,073 |
| Wage / Income Gap (%) | 14,815 | 30.73% |
| Wage / Income Gap ($) | 14,815 | 69.27¢ per $1 |
| Gini / Inequality Index | 14,815 | 0.49 |
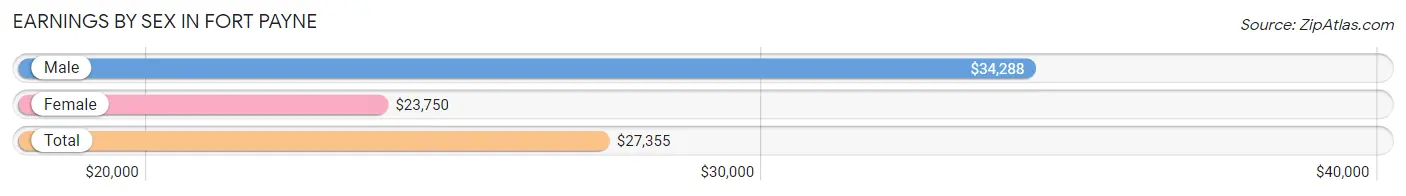
Earnings by Sex in Fort Payne
Average Earnings in Fort Payne are $27,355, $34,288 for men and $23,750 for women, a difference of 30.7%.
| Sex | Number | Average Earnings |
| Male | 3,634 (53.9%) | $34,288 |
| Female | 3,107 (46.1%) | $23,750 |
| Total | 6,741 (100.0%) | $27,355 |
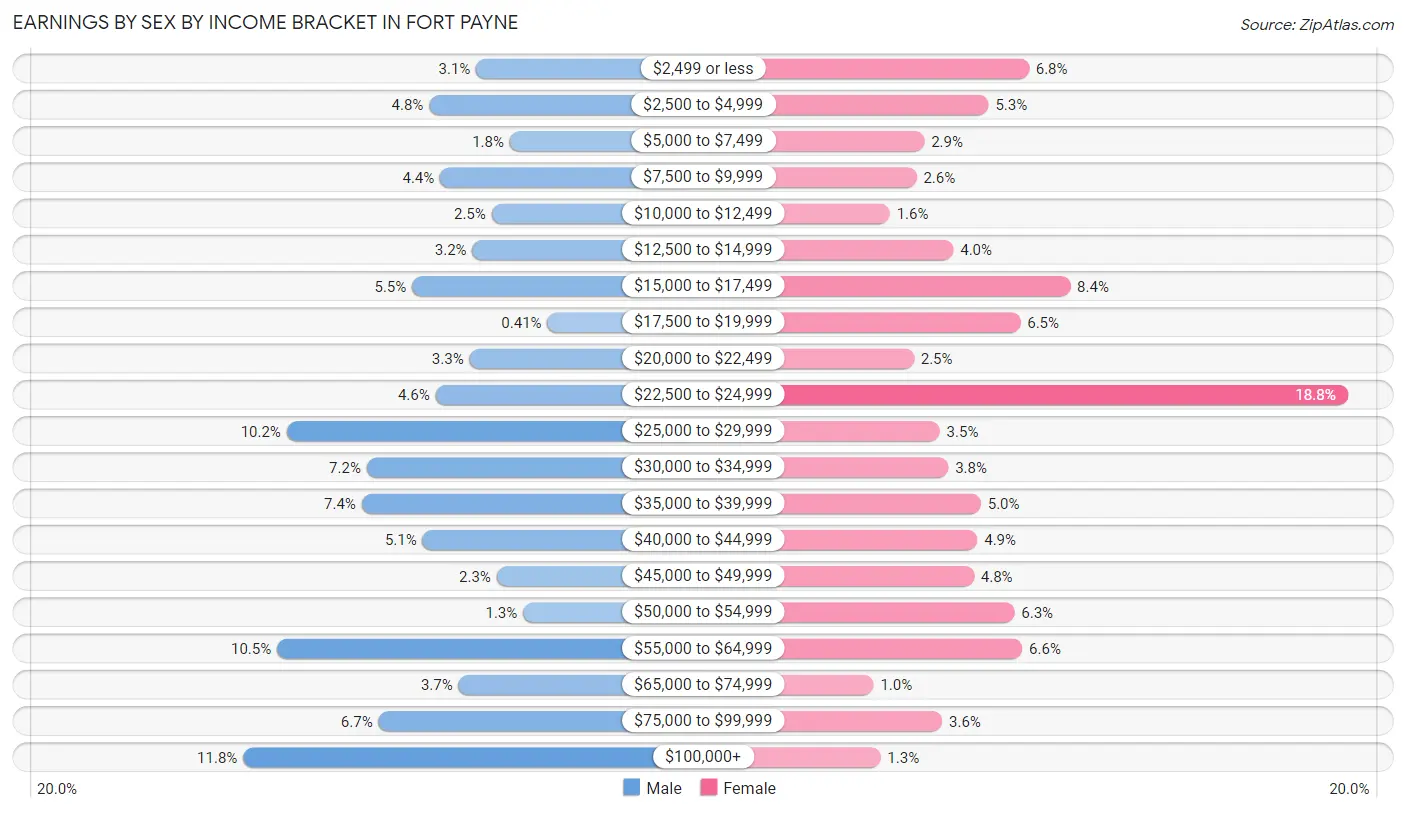
Earnings by Sex by Income Bracket in Fort Payne
The most common earnings brackets in Fort Payne are $100,000+ for men (429 | 11.8%) and $22,500 to $24,999 for women (583 | 18.8%).
| Income | Male | Female |
| $2,499 or less | 112 (3.1%) | 212 (6.8%) |
| $2,500 to $4,999 | 176 (4.8%) | 165 (5.3%) |
| $5,000 to $7,499 | 66 (1.8%) | 90 (2.9%) |
| $7,500 to $9,999 | 161 (4.4%) | 81 (2.6%) |
| $10,000 to $12,499 | 91 (2.5%) | 50 (1.6%) |
| $12,500 to $14,999 | 117 (3.2%) | 124 (4.0%) |
| $15,000 to $17,499 | 199 (5.5%) | 260 (8.4%) |
| $17,500 to $19,999 | 15 (0.4%) | 202 (6.5%) |
| $20,000 to $22,499 | 121 (3.3%) | 78 (2.5%) |
| $22,500 to $24,999 | 167 (4.6%) | 583 (18.8%) |
| $25,000 to $29,999 | 370 (10.2%) | 108 (3.5%) |
| $30,000 to $34,999 | 261 (7.2%) | 118 (3.8%) |
| $35,000 to $39,999 | 268 (7.4%) | 156 (5.0%) |
| $40,000 to $44,999 | 185 (5.1%) | 152 (4.9%) |
| $45,000 to $49,999 | 84 (2.3%) | 148 (4.8%) |
| $50,000 to $54,999 | 48 (1.3%) | 195 (6.3%) |
| $55,000 to $64,999 | 383 (10.5%) | 204 (6.6%) |
| $65,000 to $74,999 | 136 (3.7%) | 31 (1.0%) |
| $75,000 to $99,999 | 245 (6.7%) | 111 (3.6%) |
| $100,000+ | 429 (11.8%) | 39 (1.3%) |
| Total | 3,634 (100.0%) | 3,107 (100.0%) |
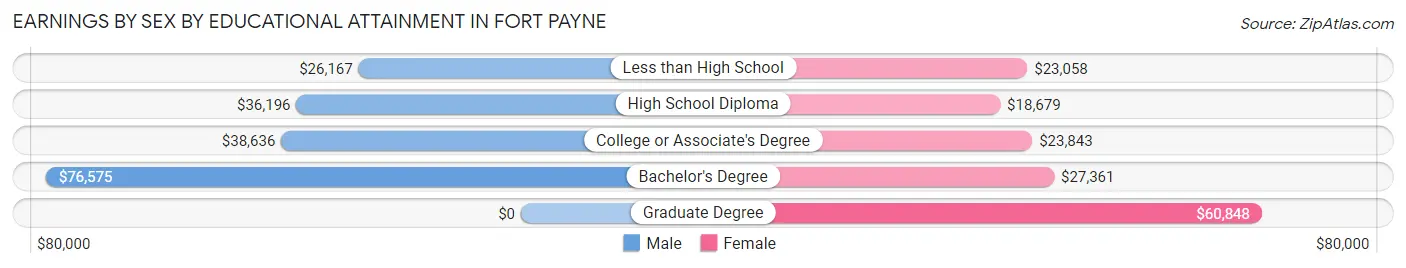
Earnings by Sex by Educational Attainment in Fort Payne
Average earnings in Fort Payne are $38,519 for men and $23,995 for women, a difference of 37.7%. Men with an educational attainment of bachelor's degree enjoy the highest average annual earnings of $76,575, while those with less than high school education earn the least with $26,167. Women with an educational attainment of graduate degree earn the most with the average annual earnings of $60,848, while those with high school diploma education have the smallest earnings of $18,679.
| Educational Attainment | Male Income | Female Income |
| Less than High School | $26,167 | $23,058 |
| High School Diploma | $36,196 | $18,679 |
| College or Associate's Degree | $38,636 | $23,843 |
| Bachelor's Degree | $76,575 | $27,361 |
| Graduate Degree | - | - |
| Total | $38,519 | $23,995 |
Family Income in Fort Payne
Family Income Brackets in Fort Payne
According to the Fort Payne family income data, there are 902 families falling into the $50,000 to $74,999 income range, which is the most common income bracket and makes up 24.9% of all families. Conversely, the $10,000 to $14,999 income bracket is the least frequent group with only 51 families (1.4%) belonging to this category.
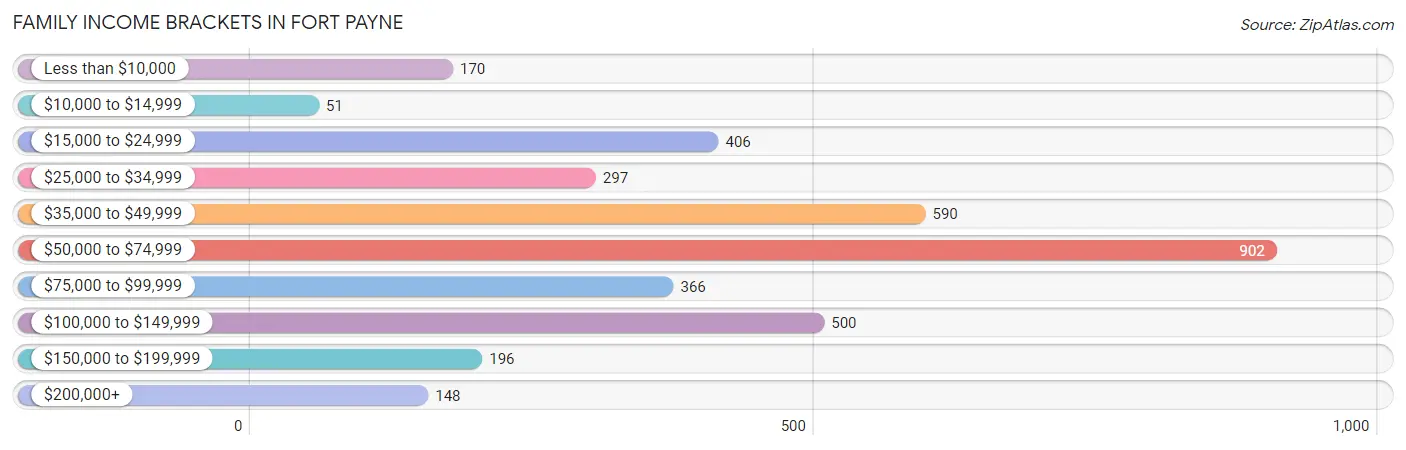
| Income Bracket | # Families | % Families |
| Less than $10,000 | 170 | 4.7% |
| $10,000 to $14,999 | 51 | 1.4% |
| $15,000 to $24,999 | 406 | 11.2% |
| $25,000 to $34,999 | 297 | 8.2% |
| $35,000 to $49,999 | 590 | 16.3% |
| $50,000 to $74,999 | 902 | 24.9% |
| $75,000 to $99,999 | 366 | 10.1% |
| $100,000 to $149,999 | 500 | 13.8% |
| $150,000 to $199,999 | 196 | 5.4% |
| $200,000+ | 148 | 4.1% |
Family Income by Famaliy Size in Fort Payne
6-person families (28 | 0.8%) account for the highest median family income in Fort Payne with $112,941 per family, while 2-person families (1,842 | 50.9%) have the highest median income of $27,912 per family member.
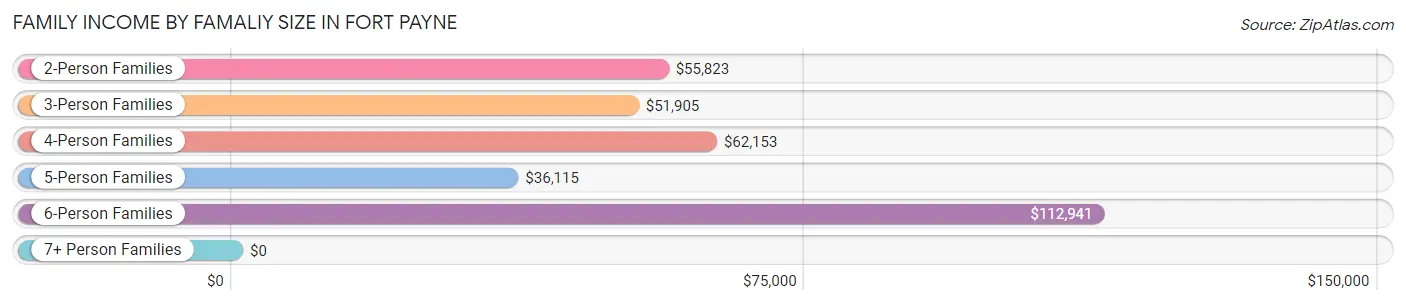
| Income Bracket | # Families | Median Income |
| 2-Person Families | 1,842 (50.9%) | $55,823 |
| 3-Person Families | 786 (21.7%) | $51,905 |
| 4-Person Families | 563 (15.5%) | $62,153 |
| 5-Person Families | 384 (10.6%) | $36,115 |
| 6-Person Families | 28 (0.8%) | $112,941 |
| 7+ Person Families | 18 (0.5%) | $0 |
| Total | 3,621 (100.0%) | $55,465 |
Family Income by Number of Earners in Fort Payne
The median family income in Fort Payne is $55,465, with families comprising 3+ earners (148) having the highest median family income of $100,833, while families with no earners (766) have the lowest median family income of $46,450, accounting for 4.1% and 21.1% of families, respectively.
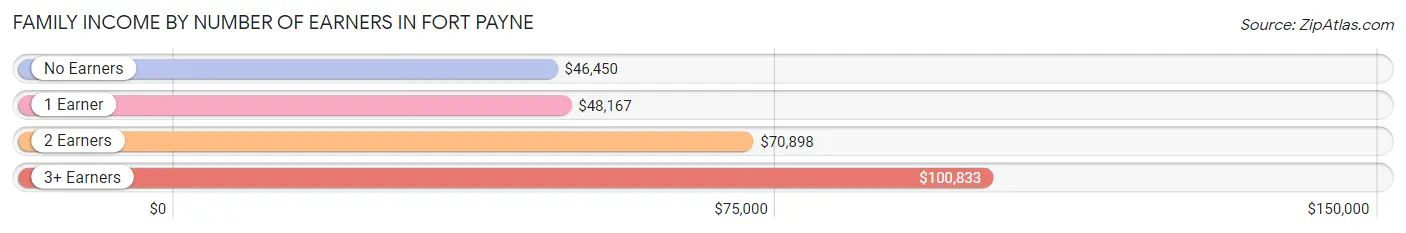
| Number of Earners | # Families | Median Income |
| No Earners | 766 (21.1%) | $46,450 |
| 1 Earner | 1,142 (31.5%) | $48,167 |
| 2 Earners | 1,565 (43.2%) | $70,898 |
| 3+ Earners | 148 (4.1%) | $100,833 |
| Total | 3,621 (100.0%) | $55,465 |
Household Income in Fort Payne
Household Income Brackets in Fort Payne
With 1,000 households falling in the category, the $35,000 to $49,999 income range is the most frequent in Fort Payne, accounting for 17.2% of all households. In contrast, only 186 households (3.2%) fall into the $200,000+ income bracket, making it the least populous group.
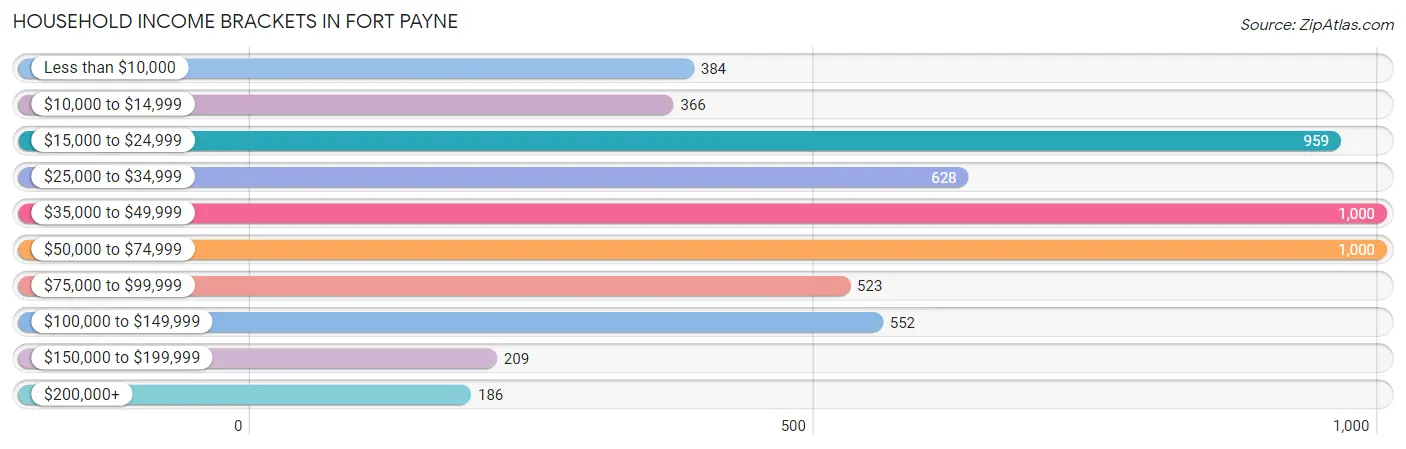
| Income Bracket | # Households | % Households |
| Less than $10,000 | 384 | 6.6% |
| $10,000 to $14,999 | 366 | 6.3% |
| $15,000 to $24,999 | 959 | 16.5% |
| $25,000 to $34,999 | 628 | 10.8% |
| $35,000 to $49,999 | 1,000 | 17.2% |
| $50,000 to $74,999 | 1,000 | 17.2% |
| $75,000 to $99,999 | 523 | 9.0% |
| $100,000 to $149,999 | 552 | 9.5% |
| $150,000 to $199,999 | 209 | 3.6% |
| $200,000+ | 186 | 3.2% |
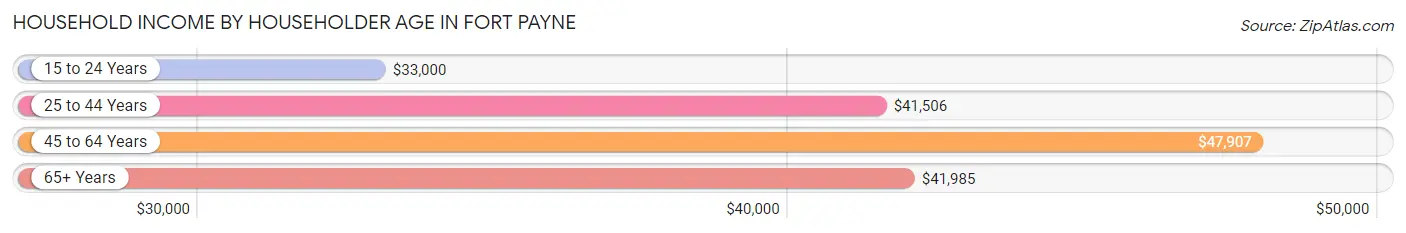
Household Income by Householder Age in Fort Payne
The median household income in Fort Payne is $44,549, with the highest median household income of $47,907 found in the 45 to 64 years age bracket for the primary householder. A total of 2,088 households (35.9%) fall into this category. Meanwhile, the 15 to 24 years age bracket for the primary householder has the lowest median household income of $33,000, with 140 households (2.4%) in this group.
| Income Bracket | # Households | Median Income |
| 15 to 24 Years | 140 (2.4%) | $33,000 |
| 25 to 44 Years | 1,869 (32.2%) | $41,506 |
| 45 to 64 Years | 2,088 (35.9%) | $47,907 |
| 65+ Years | 1,717 (29.5%) | $41,985 |
| Total | 5,814 (100.0%) | $44,549 |
Poverty in Fort Payne
Income Below Poverty by Sex and Age in Fort Payne
With 22.1% poverty level for males and 24.9% for females among the residents of Fort Payne, 6 to 11 year old males and 15 year old females are the most vulnerable to poverty, with 377 males (52.3%) and 41 females (100.0%) in their respective age groups living below the poverty level.
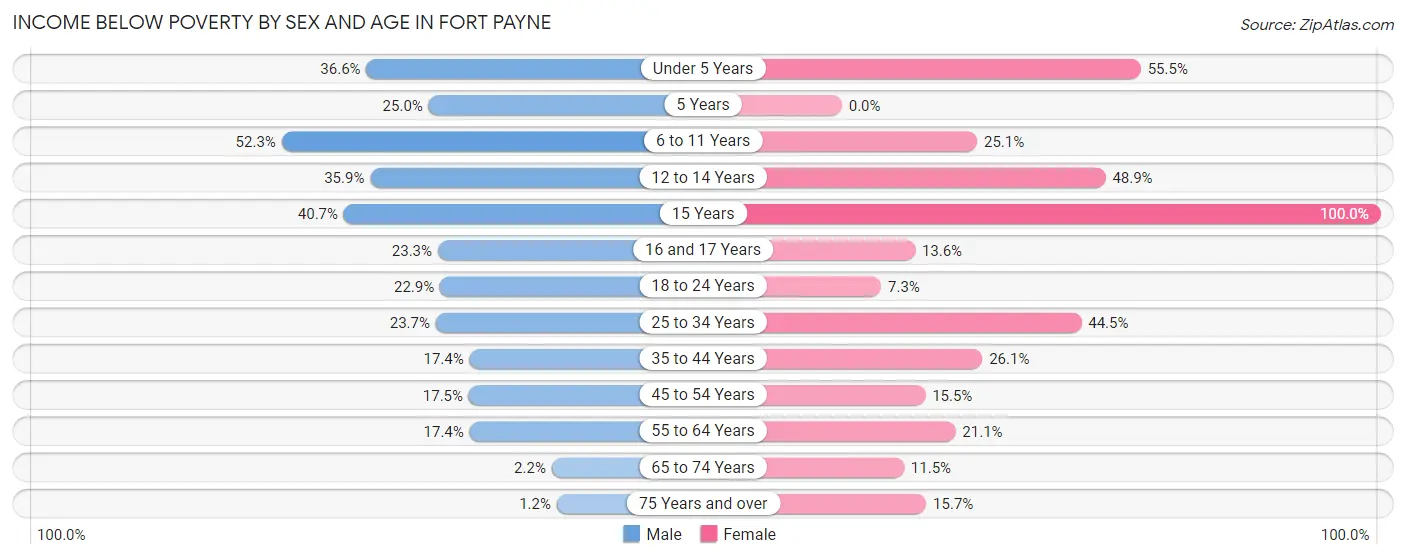
| Age Bracket | Male | Female |
| Under 5 Years | 155 (36.6%) | 303 (55.5%) |
| 5 Years | 24 (25.0%) | 0 (0.0%) |
| 6 to 11 Years | 377 (52.3%) | 122 (25.1%) |
| 12 to 14 Years | 95 (35.8%) | 255 (48.9%) |
| 15 Years | 11 (40.7%) | 41 (100.0%) |
| 16 and 17 Years | 51 (23.3%) | 11 (13.6%) |
| 18 to 24 Years | 151 (22.9%) | 53 (7.3%) |
| 25 to 34 Years | 164 (23.7%) | 293 (44.5%) |
| 35 to 44 Years | 156 (17.4%) | 214 (26.1%) |
| 45 to 54 Years | 117 (17.5%) | 141 (15.5%) |
| 55 to 64 Years | 163 (17.4%) | 248 (21.1%) |
| 65 to 74 Years | 15 (2.2%) | 99 (11.5%) |
| 75 Years and over | 5 (1.2%) | 111 (15.7%) |
| Total | 1,484 (22.1%) | 1,891 (24.9%) |
Income Above Poverty by Sex and Age in Fort Payne
According to the poverty statistics in Fort Payne, males aged 75 years and over and females aged 5 years are the age groups that are most secure financially, with 98.8% of males and 100.0% of females in these age groups living above the poverty line.
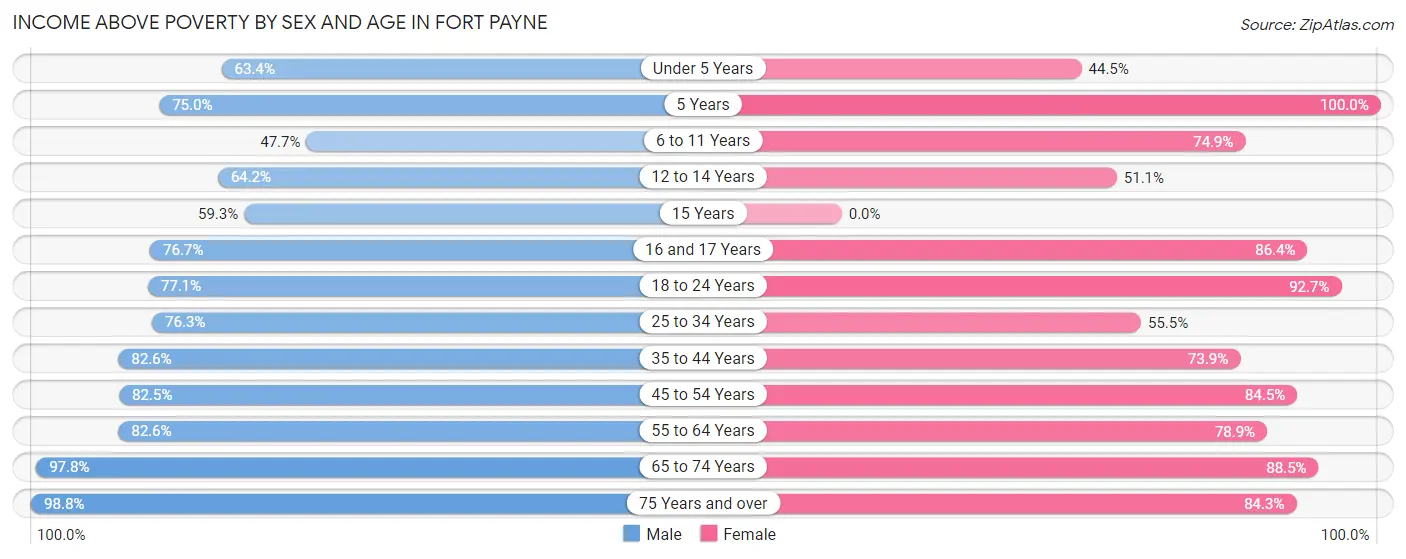
| Age Bracket | Male | Female |
| Under 5 Years | 269 (63.4%) | 243 (44.5%) |
| 5 Years | 72 (75.0%) | 64 (100.0%) |
| 6 to 11 Years | 344 (47.7%) | 364 (74.9%) |
| 12 to 14 Years | 170 (64.1%) | 266 (51.1%) |
| 15 Years | 16 (59.3%) | 0 (0.0%) |
| 16 and 17 Years | 168 (76.7%) | 70 (86.4%) |
| 18 to 24 Years | 509 (77.1%) | 673 (92.7%) |
| 25 to 34 Years | 529 (76.3%) | 366 (55.5%) |
| 35 to 44 Years | 740 (82.6%) | 607 (73.9%) |
| 45 to 54 Years | 550 (82.5%) | 770 (84.5%) |
| 55 to 64 Years | 774 (82.6%) | 928 (78.9%) |
| 65 to 74 Years | 681 (97.8%) | 760 (88.5%) |
| 75 Years and over | 404 (98.8%) | 598 (84.3%) |
| Total | 5,226 (77.9%) | 5,709 (75.1%) |
Income Below Poverty Among Married-Couple Families in Fort Payne
The poverty statistics for married-couple families in Fort Payne show that 12.0% or 318 of the total 2,646 families live below the poverty line. Families with 5 or more children have the highest poverty rate of 100.0%, comprising of 10 families. On the other hand, families with no children have the lowest poverty rate of 6.1%, which includes 92 families.
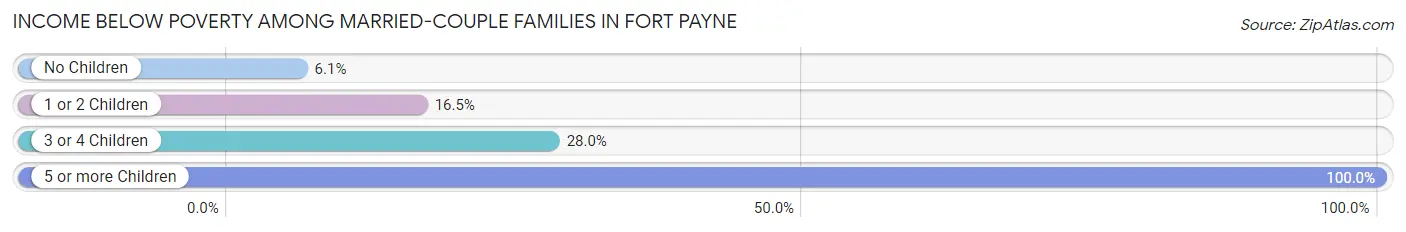
| Children | Above Poverty | Below Poverty |
| No Children | 1,427 (93.9%) | 92 (6.1%) |
| 1 or 2 Children | 703 (83.5%) | 139 (16.5%) |
| 3 or 4 Children | 198 (72.0%) | 77 (28.0%) |
| 5 or more Children | 0 (0.0%) | 10 (100.0%) |
| Total | 2,328 (88.0%) | 318 (12.0%) |
Income Below Poverty Among Single-Parent Households in Fort Payne
According to the poverty data in Fort Payne, 46.8% or 88 single-father households and 33.4% or 263 single-mother households are living below the poverty line. Among single-father households, those with 3 or 4 children have the highest poverty rate, with 46 households (86.8%) experiencing poverty. Likewise, among single-mother households, those with 3 or 4 children have the highest poverty rate, with 43 households (100.0%) falling below the poverty line.
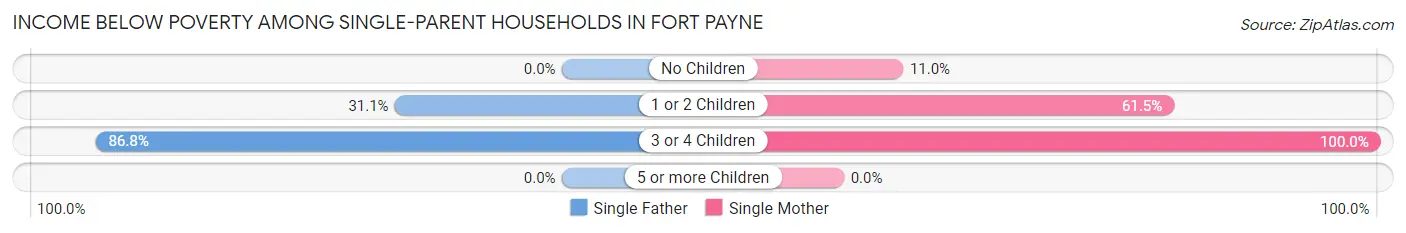
| Children | Single Father | Single Mother |
| No Children | 0 (0.0%) | 52 (11.0%) |
| 1 or 2 Children | 42 (31.1%) | 168 (61.5%) |
| 3 or 4 Children | 46 (86.8%) | 43 (100.0%) |
| 5 or more Children | 0 (0.0%) | 0 (0.0%) |
| Total | 88 (46.8%) | 263 (33.4%) |
Income Below Poverty Among Married-Couple vs Single-Parent Households in Fort Payne
The poverty data for Fort Payne shows that 318 of the married-couple family households (12.0%) and 351 of the single-parent households (36.0%) are living below the poverty level. Within the married-couple family households, those with 5 or more children have the highest poverty rate, with 10 households (100.0%) falling below the poverty line. Among the single-parent households, those with 3 or 4 children have the highest poverty rate, with 89 household (92.7%) living below poverty.
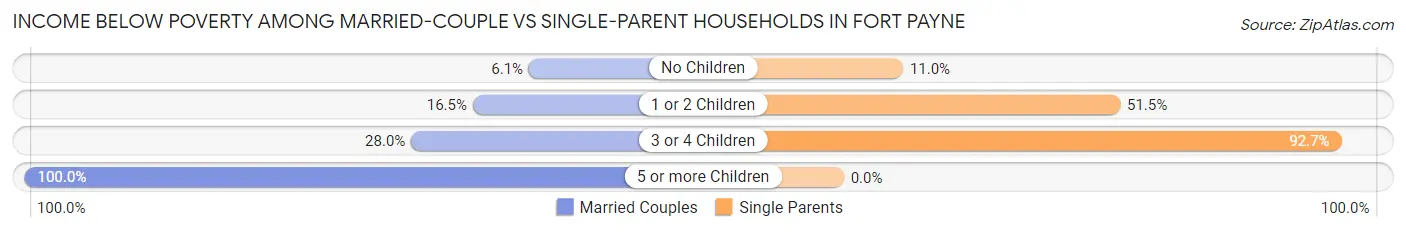
| Children | Married-Couple Families | Single-Parent Households |
| No Children | 92 (6.1%) | 52 (11.0%) |
| 1 or 2 Children | 139 (16.5%) | 210 (51.5%) |
| 3 or 4 Children | 77 (28.0%) | 89 (92.7%) |
| 5 or more Children | 10 (100.0%) | 0 (0.0%) |
| Total | 318 (12.0%) | 351 (36.0%) |
Race in Fort Payne
The most populous races in Fort Payne are White / Caucasian (12,016 | 81.1%), Hispanic or Latino (2,907 | 19.6%), and Some other Race (1,621 | 10.9%).
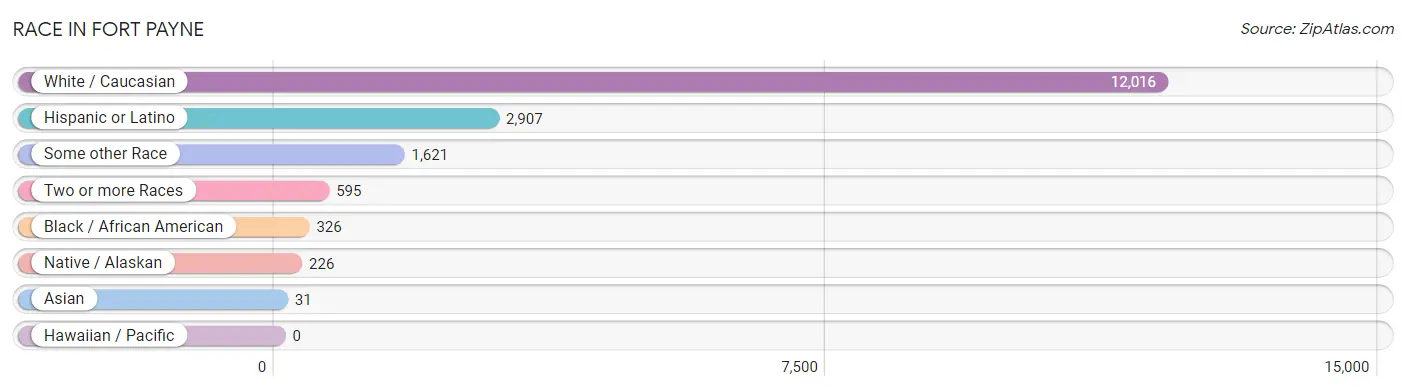
| Race | # Population | % Population |
| Asian | 31 | 0.2% |
| Black / African American | 326 | 2.2% |
| Hawaiian / Pacific | 0 | 0.0% |
| Hispanic or Latino | 2,907 | 19.6% |
| Native / Alaskan | 226 | 1.5% |
| White / Caucasian | 12,016 | 81.1% |
| Two or more Races | 595 | 4.0% |
| Some other Race | 1,621 | 10.9% |
| Total | 14,815 | 100.0% |
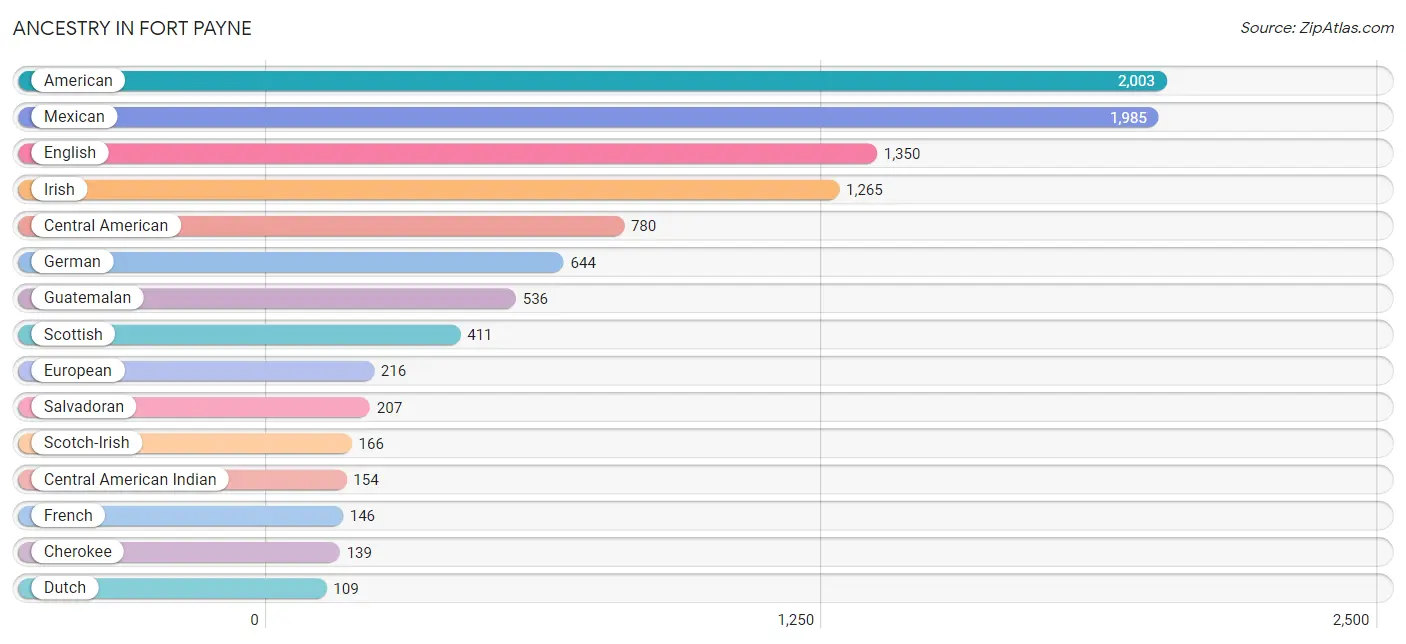
Ancestry in Fort Payne
The most populous ancestries reported in Fort Payne are American (2,003 | 13.5%), Mexican (1,985 | 13.4%), English (1,350 | 9.1%), Irish (1,265 | 8.5%), and Central American (780 | 5.3%), together accounting for 49.8% of all Fort Payne residents.
| Ancestry | # Population | % Population |
| African | 15 | 0.1% |
| Alaska Native | 72 | 0.5% |
| American | 2,003 | 13.5% |
| Basque | 19 | 0.1% |
| Belgian | 21 | 0.1% |
| Bhutanese | 6 | 0.0% |
| British | 70 | 0.5% |
| Cajun | 7 | 0.1% |
| Canadian | 4 | 0.0% |
| Central American | 780 | 5.3% |
| Central American Indian | 154 | 1.0% |
| Cherokee | 139 | 0.9% |
| Colombian | 22 | 0.2% |
| Czech | 15 | 0.1% |
| Dutch | 109 | 0.7% |
| English | 1,350 | 9.1% |
| European | 216 | 1.5% |
| Finnish | 15 | 0.1% |
| French | 146 | 1.0% |
| French Canadian | 7 | 0.1% |
| German | 644 | 4.3% |
| Greek | 87 | 0.6% |
| Guatemalan | 536 | 3.6% |
| Honduran | 37 | 0.3% |
| Hungarian | 19 | 0.1% |
| Irish | 1,265 | 8.5% |
| Italian | 57 | 0.4% |
| Korean | 77 | 0.5% |
| Mexican | 1,985 | 13.4% |
| Norwegian | 50 | 0.3% |
| Peruvian | 65 | 0.4% |
| Polish | 40 | 0.3% |
| Portuguese | 31 | 0.2% |
| Russian | 31 | 0.2% |
| Salvadoran | 207 | 1.4% |
| Scotch-Irish | 166 | 1.1% |
| Scottish | 411 | 2.8% |
| South American | 87 | 0.6% |
| Subsaharan African | 15 | 0.1% |
| Swedish | 26 | 0.2% |
| Thai | 3 | 0.0% |
| Ukrainian | 16 | 0.1% |
| Welsh | 52 | 0.4% | View All 43 Rows |
Immigrants in Fort Payne
The most numerous immigrant groups reported in Fort Payne came from Latin America (1,114 | 7.5%), Central America (1,092 | 7.4%), Mexico (646 | 4.4%), Guatemala (289 | 1.9%), and El Salvador (120 | 0.8%), together accounting for 22.0% of all Fort Payne residents.
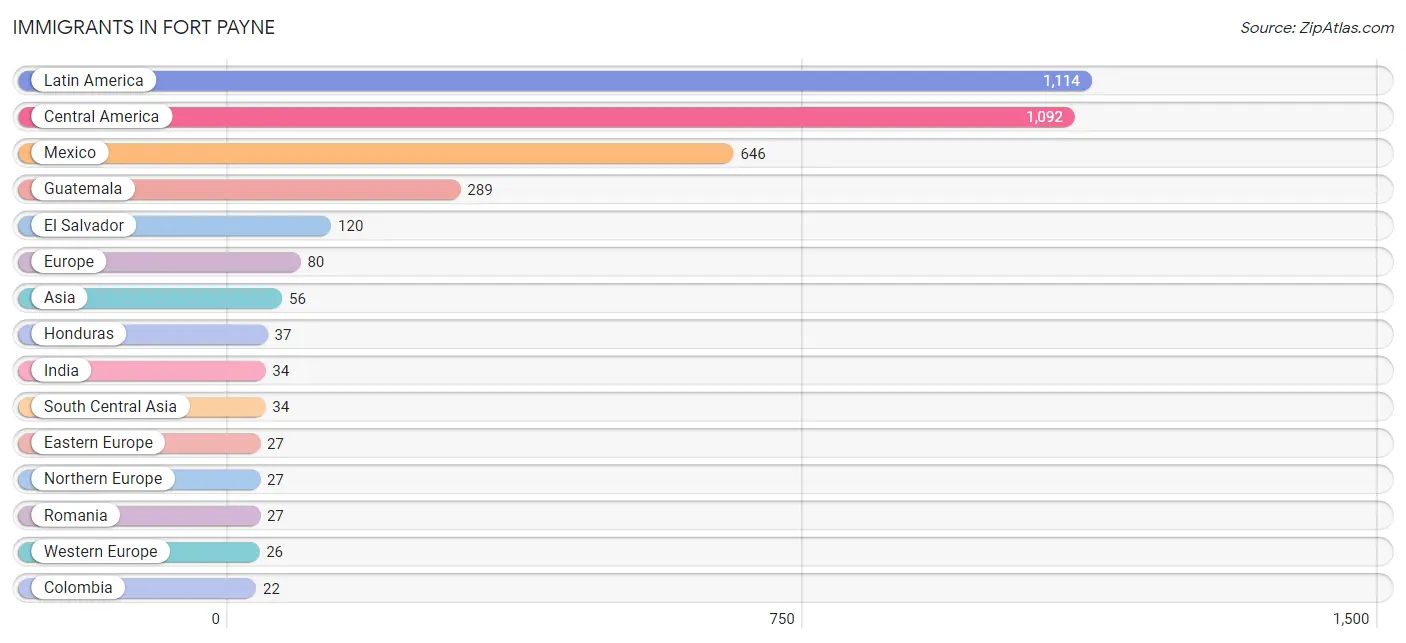
| Immigration Origin | # Population | % Population |
| Asia | 56 | 0.4% |
| Belgium | 21 | 0.1% |
| Canada | 15 | 0.1% |
| Central America | 1,092 | 7.4% |
| Colombia | 22 | 0.2% |
| Eastern Europe | 27 | 0.2% |
| El Salvador | 120 | 0.8% |
| Europe | 80 | 0.5% |
| Germany | 5 | 0.0% |
| Guatemala | 289 | 1.9% |
| Honduras | 37 | 0.3% |
| India | 34 | 0.2% |
| Latin America | 1,114 | 7.5% |
| Mexico | 646 | 4.4% |
| Northern Europe | 27 | 0.2% |
| Philippines | 22 | 0.2% |
| Romania | 27 | 0.2% |
| South America | 22 | 0.2% |
| South Central Asia | 34 | 0.2% |
| South Eastern Asia | 22 | 0.2% |
| Western Europe | 26 | 0.2% | View All 21 Rows |
Sex and Age in Fort Payne
Sex and Age in Fort Payne
The most populous age groups in Fort Payne are 10 to 14 Years (619 | 8.8%) for men and 10 to 14 Years (760 | 9.8%) for women.
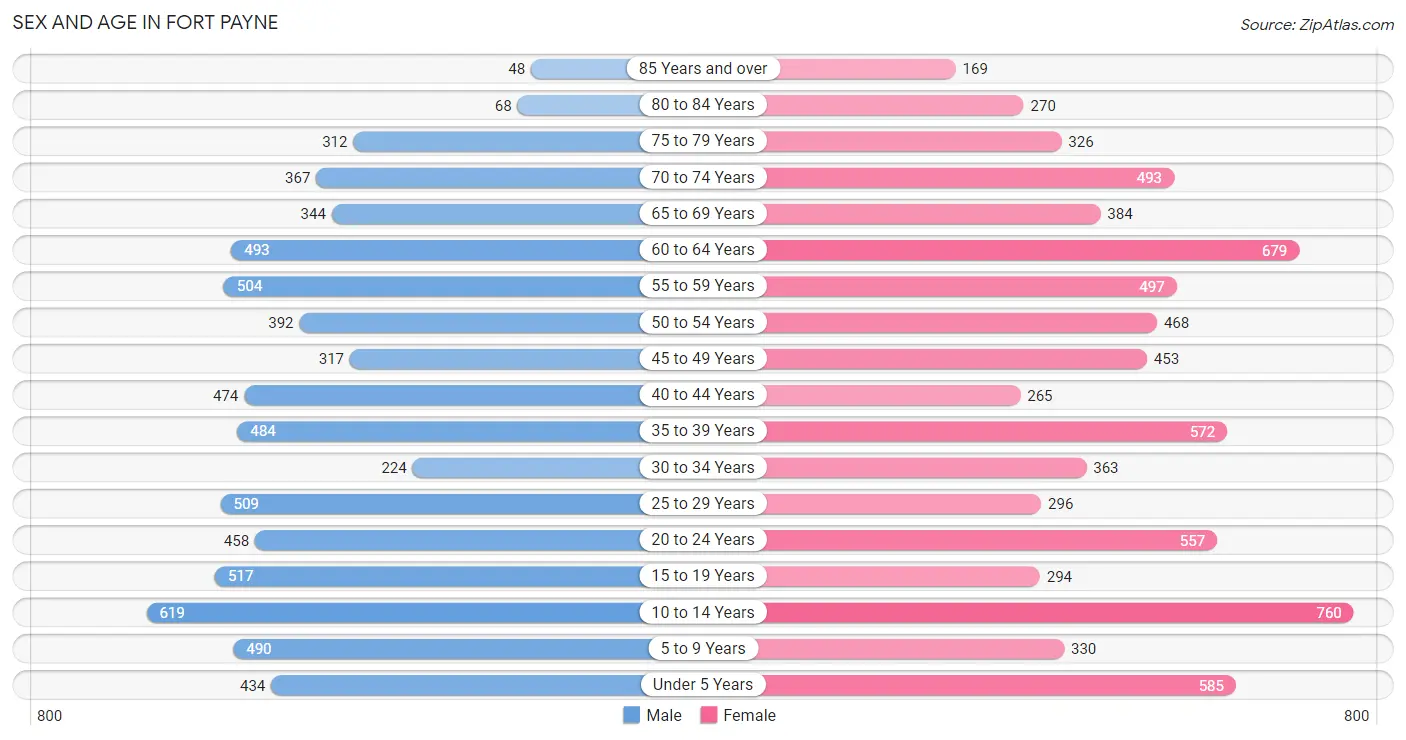
| Age Bracket | Male | Female |
| Under 5 Years | 434 (6.1%) | 585 (7.5%) |
| 5 to 9 Years | 490 (7.0%) | 330 (4.3%) |
| 10 to 14 Years | 619 (8.8%) | 760 (9.8%) |
| 15 to 19 Years | 517 (7.3%) | 294 (3.8%) |
| 20 to 24 Years | 458 (6.5%) | 557 (7.2%) |
| 25 to 29 Years | 509 (7.2%) | 296 (3.8%) |
| 30 to 34 Years | 224 (3.2%) | 363 (4.7%) |
| 35 to 39 Years | 484 (6.9%) | 572 (7.4%) |
| 40 to 44 Years | 474 (6.7%) | 265 (3.4%) |
| 45 to 49 Years | 317 (4.5%) | 453 (5.8%) |
| 50 to 54 Years | 392 (5.6%) | 468 (6.0%) |
| 55 to 59 Years | 504 (7.1%) | 497 (6.4%) |
| 60 to 64 Years | 493 (7.0%) | 679 (8.7%) |
| 65 to 69 Years | 344 (4.9%) | 384 (5.0%) |
| 70 to 74 Years | 367 (5.2%) | 493 (6.4%) |
| 75 to 79 Years | 312 (4.4%) | 326 (4.2%) |
| 80 to 84 Years | 68 (1.0%) | 270 (3.5%) |
| 85 Years and over | 48 (0.7%) | 169 (2.2%) |
| Total | 7,054 (100.0%) | 7,761 (100.0%) |
Families and Households in Fort Payne
Median Family Size in Fort Payne
The median family size in Fort Payne is 3.22 persons per family, with married-couple families (2,646 | 73.1%) accounting for the largest median family size of 3.26 persons per family. On the other hand, single female/mother families (787 | 21.7%) represent the smallest median family size with 3.06 persons per family.
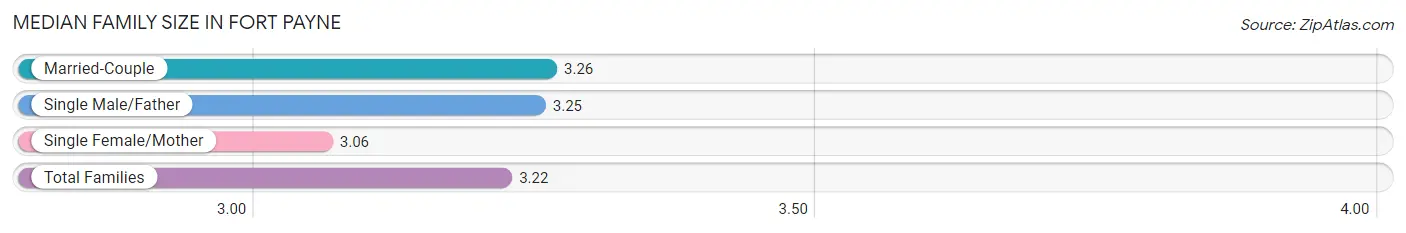
| Family Type | # Families | Family Size |
| Married-Couple | 2,646 (73.1%) | 3.26 |
| Single Male/Father | 188 (5.2%) | 3.25 |
| Single Female/Mother | 787 (21.7%) | 3.06 |
| Total Families | 3,621 (100.0%) | 3.22 |
Median Household Size in Fort Payne
The median household size in Fort Payne is 2.47 persons per household, with single male/father households (188 | 3.2%) accounting for the largest median household size of 3.71 persons per household. non-family households (2,193 | 37.7%) represent the smallest median household size with 1.09 persons per household.
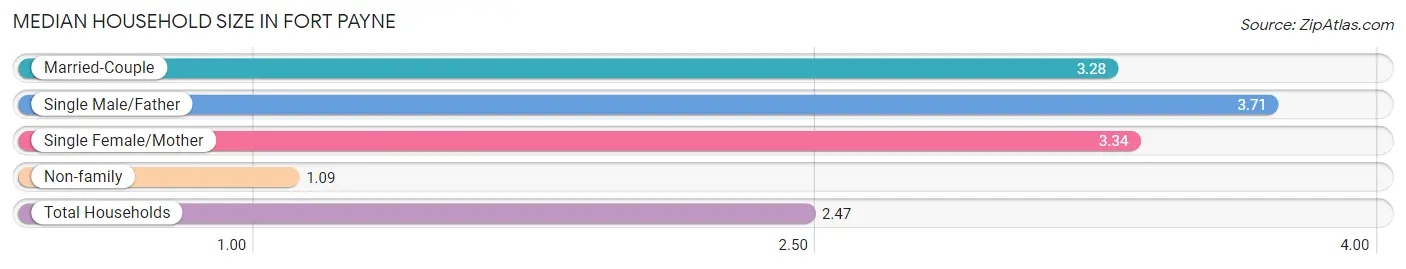
| Household Type | # Households | Household Size |
| Married-Couple | 2,646 (45.5%) | 3.28 |
| Single Male/Father | 188 (3.2%) | 3.71 |
| Single Female/Mother | 787 (13.5%) | 3.34 |
| Non-family | 2,193 (37.7%) | 1.09 |
| Total Households | 5,814 (100.0%) | 2.47 |
Household Size by Marriage Status in Fort Payne
Out of a total of 5,814 households in Fort Payne, 3,621 (62.3%) are family households, while 2,193 (37.7%) are nonfamily households. The most numerous type of family households are 2-person households, comprising 1,697, and the most common type of nonfamily households are 1-person households, comprising 2,061.
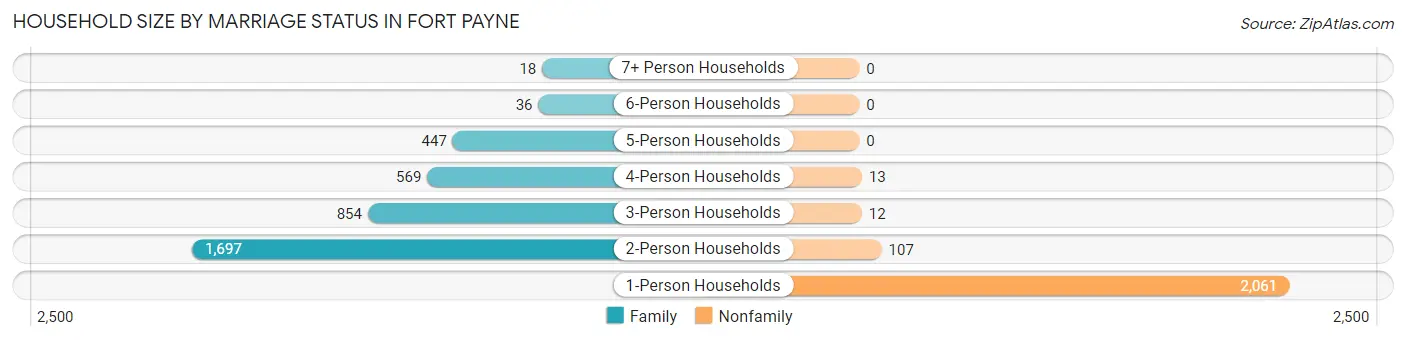
| Household Size | Family Households | Nonfamily Households |
| 1-Person Households | - | 2,061 (35.4%) |
| 2-Person Households | 1,697 (29.2%) | 107 (1.8%) |
| 3-Person Households | 854 (14.7%) | 12 (0.2%) |
| 4-Person Households | 569 (9.8%) | 13 (0.2%) |
| 5-Person Households | 447 (7.7%) | 0 (0.0%) |
| 6-Person Households | 36 (0.6%) | 0 (0.0%) |
| 7+ Person Households | 18 (0.3%) | 0 (0.0%) |
| Total | 3,621 (62.3%) | 2,193 (37.7%) |
Female Fertility in Fort Payne
Fertility by Age in Fort Payne
Average fertility rate in Fort Payne is 73.0 births per 1,000 women. Women in the age bracket of 20 to 34 years have the highest fertility rate with 156.0 births per 1,000 women. Women in the age bracket of 20 to 34 years acount for 89.2% of all women with births.
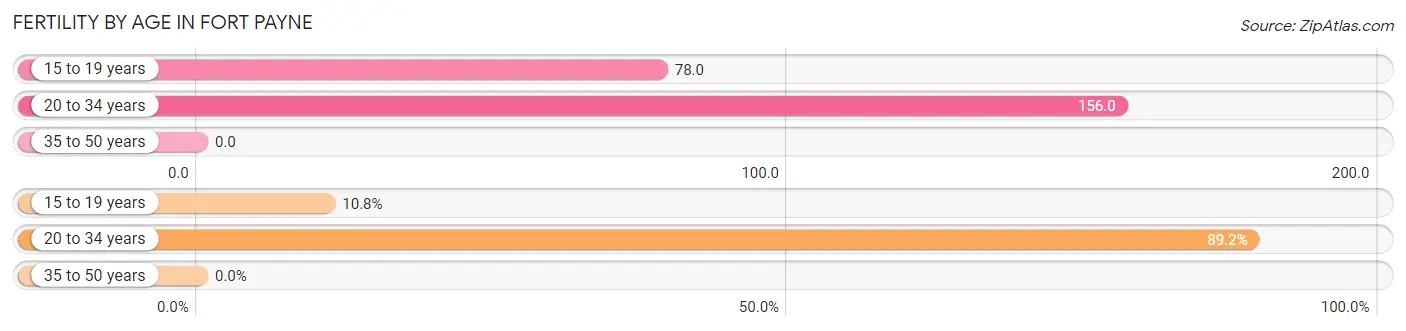
| Age Bracket | Women with Births | Births / 1,000 Women |
| 15 to 19 years | 23 (10.8%) | 78.0 |
| 20 to 34 years | 190 (89.2%) | 156.0 |
| 35 to 50 years | 0 (0.0%) | 0.0 |
| Total | 213 (100.0%) | 73.0 |
Fertility by Age by Marriage Status in Fort Payne
44.6% of women with births (213) in Fort Payne are married. The highest percentage of unmarried women with births falls into 15 to 19 years age bracket with 100.0% of them unmarried at the time of birth, while the lowest percentage of unmarried women with births belong to 20 to 34 years age bracket with 50.0% of them unmarried.
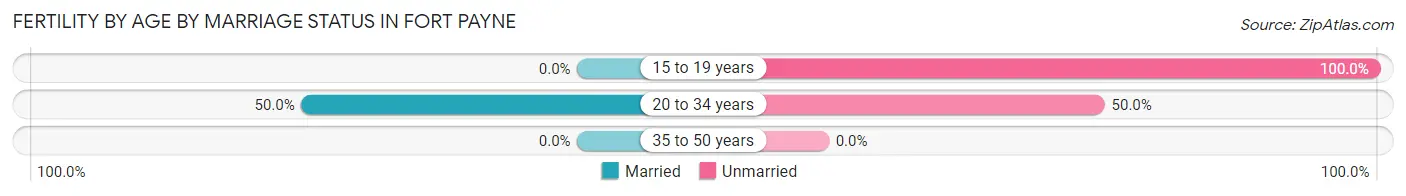
| Age Bracket | Married | Unmarried |
| 15 to 19 years | 0 (0.0%) | 23 (100.0%) |
| 20 to 34 years | 95 (50.0%) | 95 (50.0%) |
| 35 to 50 years | 0 (0.0%) | 0 (0.0%) |
| Total | 95 (44.6%) | 118 (55.4%) |
Fertility by Education in Fort Payne
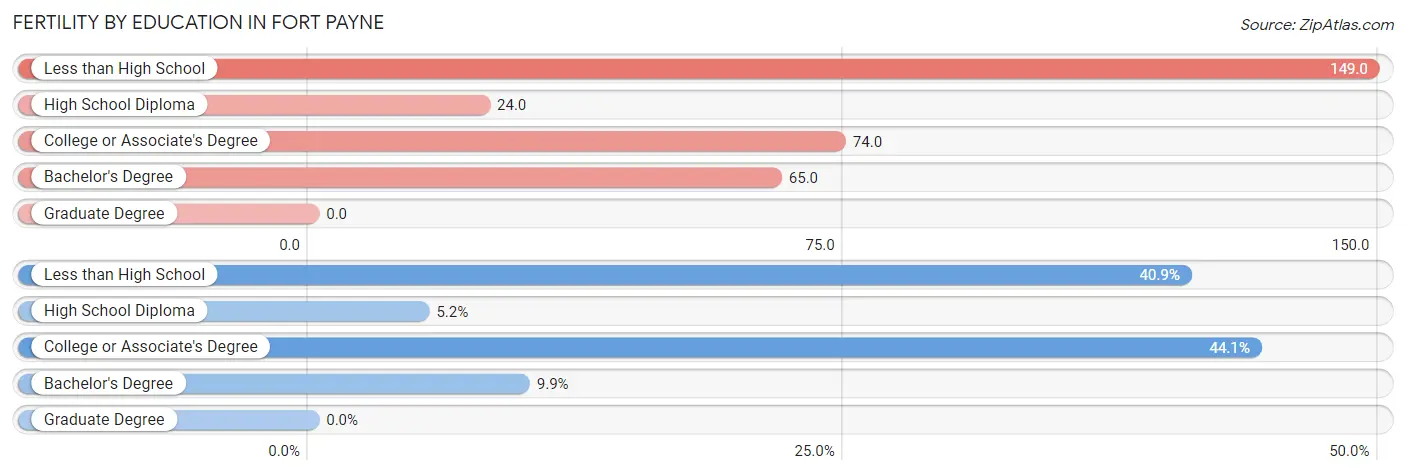
| Educational Attainment | Women with Births | Births / 1,000 Women |
| Less than High School | 87 (40.8%) | 149.0 |
| High School Diploma | 11 (5.2%) | 24.0 |
| College or Associate's Degree | 94 (44.1%) | 74.0 |
| Bachelor's Degree | 21 (9.9%) | 65.0 |
| Graduate Degree | 0 (0.0%) | 0.0 |
| Total | 213 (100.0%) | 73.0 |
Fertility by Education by Marriage Status in Fort Payne
55.4% of women with births in Fort Payne are unmarried. Women with the educational attainment of bachelor's degree are most likely to be married with 100.0% of them married at childbirth, while women with the educational attainment of high school diploma are least likely to be married with 100.0% of them unmarried at childbirth.
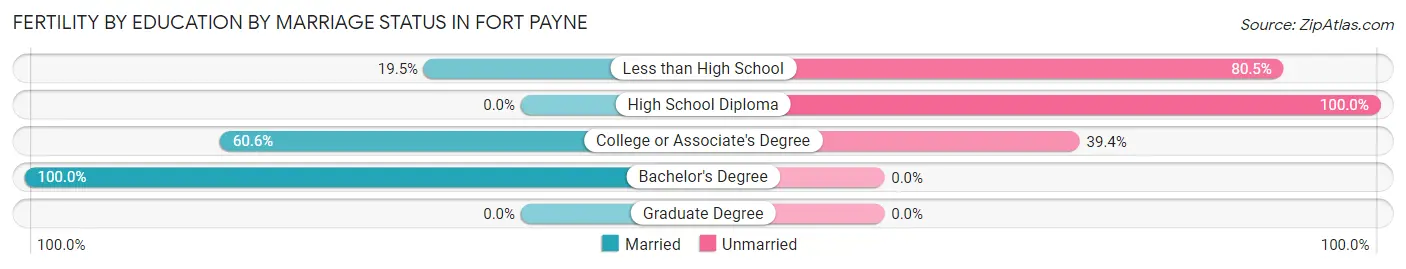
| Educational Attainment | Married | Unmarried |
| Less than High School | 17 (19.5%) | 70 (80.5%) |
| High School Diploma | 0 (0.0%) | 11 (100.0%) |
| College or Associate's Degree | 57 (60.6%) | 37 (39.4%) |
| Bachelor's Degree | 21 (100.0%) | 0 (0.0%) |
| Graduate Degree | 0 (0.0%) | 0 (0.0%) |
| Total | 95 (44.6%) | 118 (55.4%) |
Employment Characteristics in Fort Payne
Employment by Class of Employer in Fort Payne
Among the 5,942 employed individuals in Fort Payne, private company employees (4,211 | 70.9%), self-employed (not incorporated) (530 | 8.9%), and local government employees (519 | 8.7%) make up the most common classes of employment.
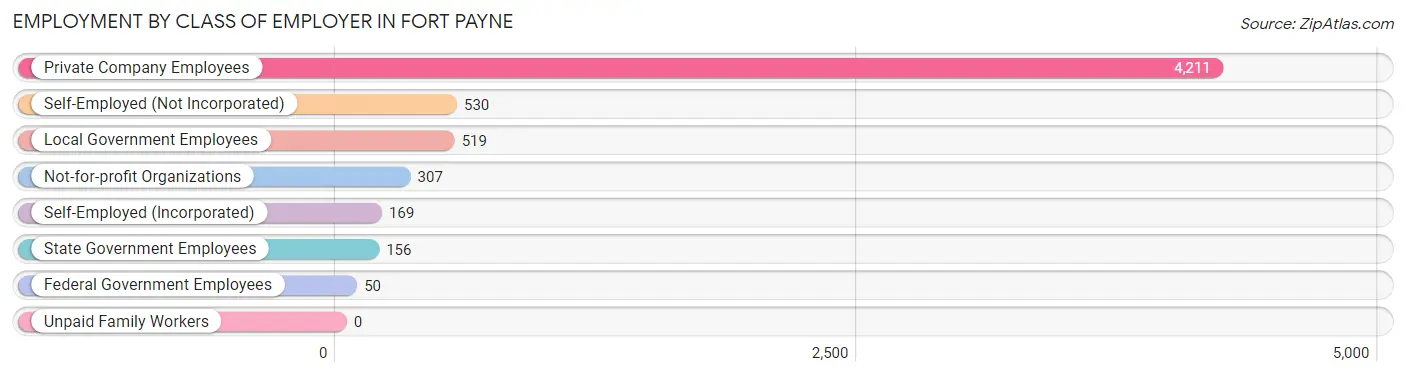
| Employer Class | # Employees | % Employees |
| Private Company Employees | 4,211 | 70.9% |
| Self-Employed (Incorporated) | 169 | 2.8% |
| Self-Employed (Not Incorporated) | 530 | 8.9% |
| Not-for-profit Organizations | 307 | 5.2% |
| Local Government Employees | 519 | 8.7% |
| State Government Employees | 156 | 2.6% |
| Federal Government Employees | 50 | 0.8% |
| Unpaid Family Workers | 0 | 0.0% |
| Total | 5,942 | 100.0% |
Employment Status by Age in Fort Payne
According to the labor force statistics for Fort Payne, out of the total population over 16 years of age (11,529), 55.3% or 6,376 individuals are in the labor force, with 6.1% or 389 of them unemployed. The age group with the highest labor force participation rate is 35 to 44 years, with 85.7% or 1,538 individuals in the labor force. Within the labor force, the 16 to 19 years age range has the highest percentage of unemployed individuals, with 26.5% or 69 of them being unemployed.
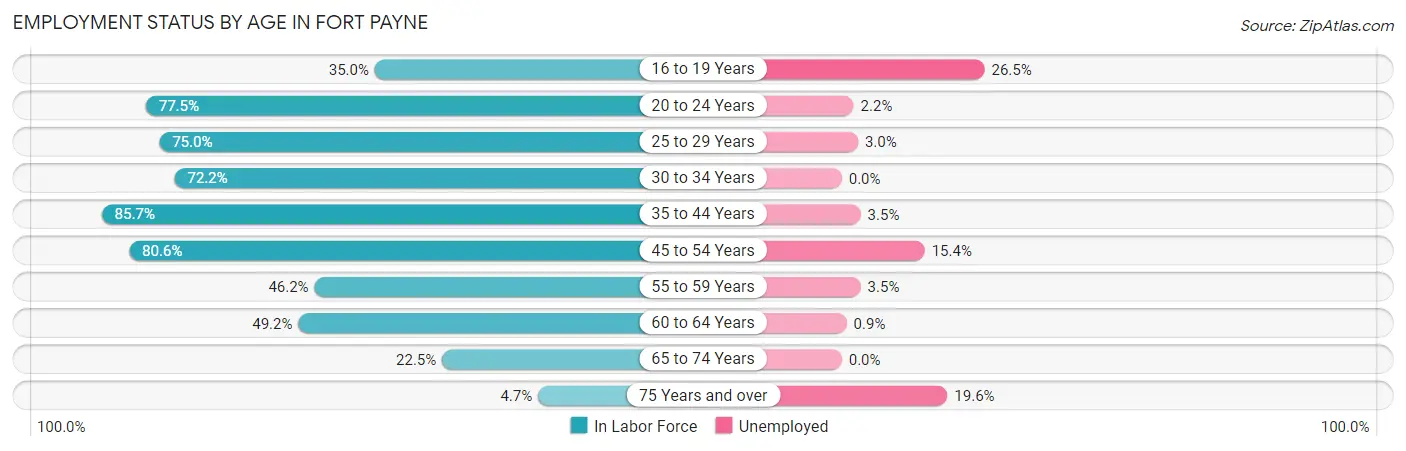
| Age Bracket | In Labor Force | Unemployed |
| 16 to 19 Years | 260 (35.0%) | 69 (26.5%) |
| 20 to 24 Years | 787 (77.5%) | 17 (2.2%) |
| 25 to 29 Years | 604 (75.0%) | 18 (3.0%) |
| 30 to 34 Years | 424 (72.2%) | 0 (0.0%) |
| 35 to 44 Years | 1,538 (85.7%) | 54 (3.5%) |
| 45 to 54 Years | 1,314 (80.6%) | 202 (15.4%) |
| 55 to 59 Years | 462 (46.2%) | 16 (3.5%) |
| 60 to 64 Years | 577 (49.2%) | 5 (0.9%) |
| 65 to 74 Years | 357 (22.5%) | 0 (0.0%) |
| 75 Years and over | 56 (4.7%) | 11 (19.6%) |
| Total | 6,376 (55.3%) | 389 (6.1%) |
Employment Status by Educational Attainment in Fort Payne
According to labor force statistics for Fort Payne, 70.4% of individuals (4,921) out of the total population between 25 and 64 years of age (6,990) are in the labor force, with 6.0% or 295 of them being unemployed. The group with the highest labor force participation rate are those with the educational attainment of bachelor's degree or higher, with 84.7% or 1,016 individuals in the labor force. Within the labor force, individuals with college / associate degree education have the highest percentage of unemployment, with 11.4% or 232 of them being unemployed.
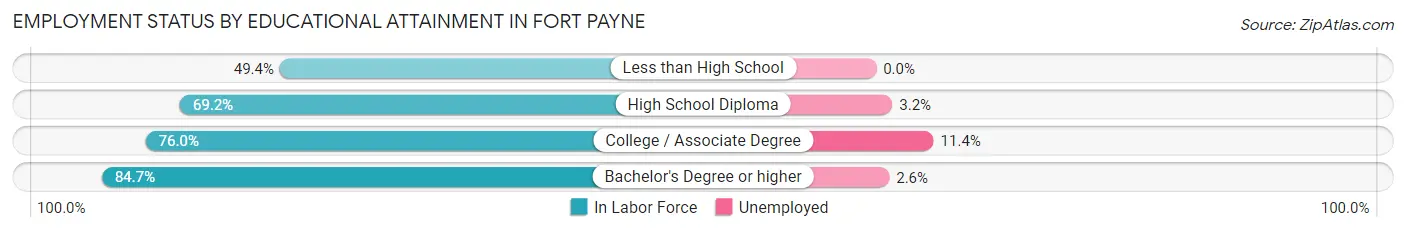
| Educational Attainment | In Labor Force | Unemployed |
| Less than High School | 714 (49.4%) | 0 (0.0%) |
| High School Diploma | 1,156 (69.2%) | 53 (3.2%) |
| College / Associate Degree | 2,033 (76.0%) | 305 (11.4%) |
| Bachelor's Degree or higher | 1,016 (84.7%) | 31 (2.6%) |
| Total | 4,921 (70.4%) | 419 (6.0%) |
Employment Occupations by Sex in Fort Payne
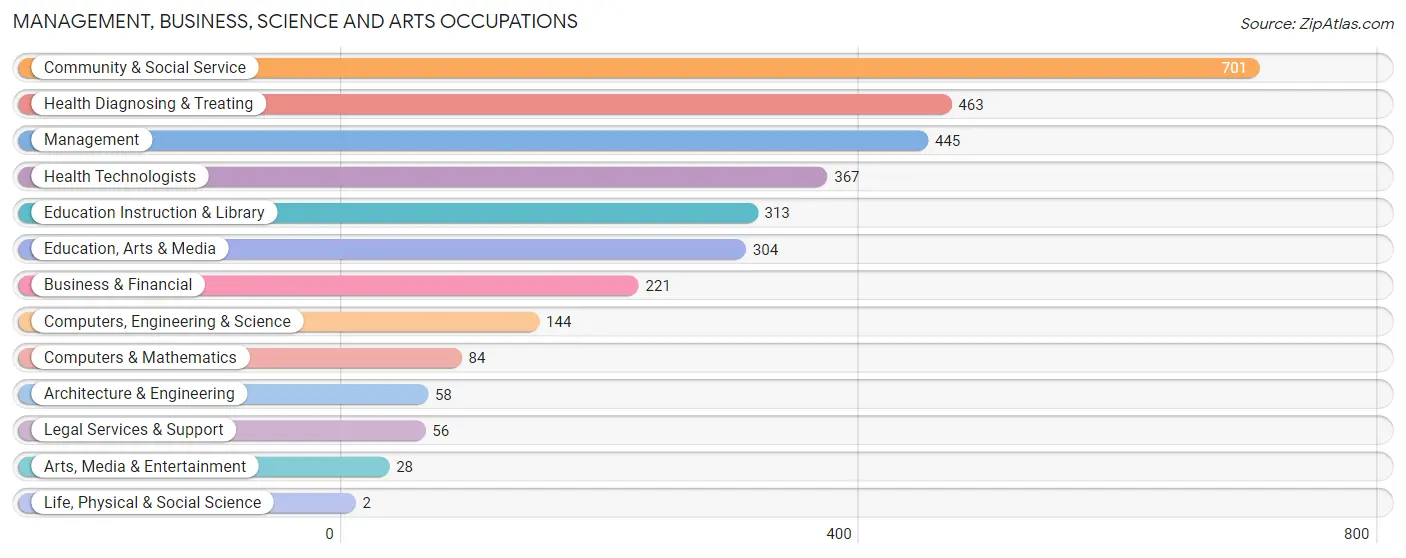
Management, Business, Science and Arts Occupations
The most common Management, Business, Science and Arts occupations in Fort Payne are Community & Social Service (701 | 11.7%), Health Diagnosing & Treating (463 | 7.7%), Management (445 | 7.4%), Health Technologists (367 | 6.1%), and Education Instruction & Library (313 | 5.2%).
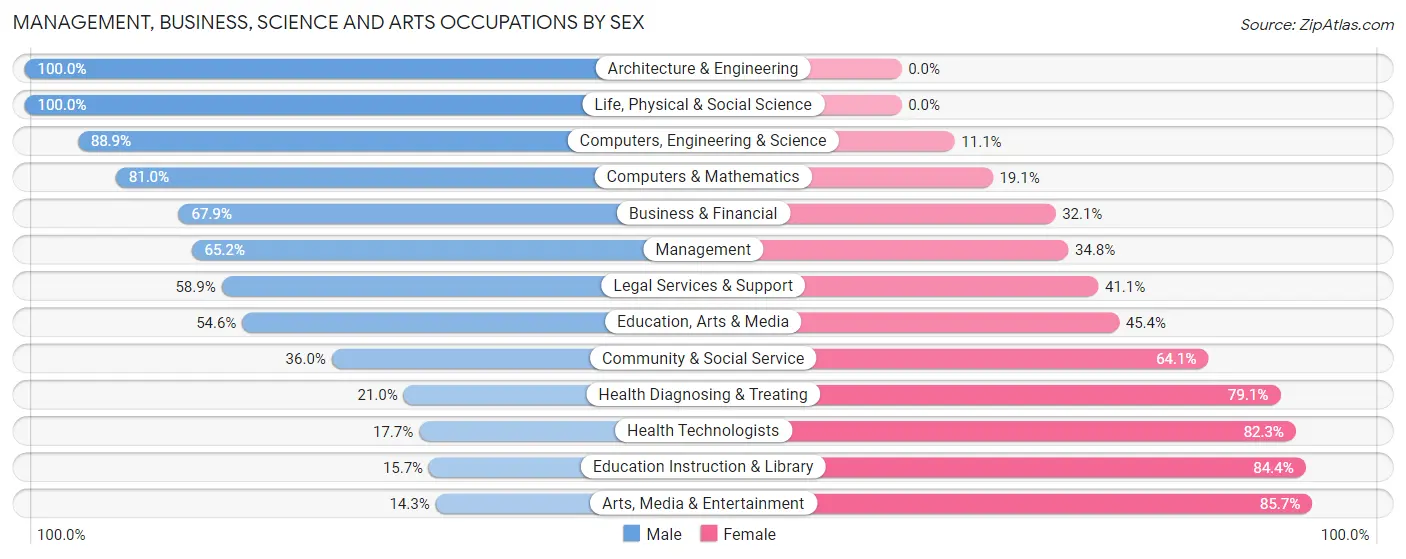
Management, Business, Science and Arts Occupations by Sex
Within the Management, Business, Science and Arts occupations in Fort Payne, the most male-oriented occupations are Architecture & Engineering (100.0%), Life, Physical & Social Science (100.0%), and Computers, Engineering & Science (88.9%), while the most female-oriented occupations are Arts, Media & Entertainment (85.7%), Education Instruction & Library (84.4%), and Health Technologists (82.3%).
| Occupation | Male | Female |
| Management | 290 (65.2%) | 155 (34.8%) |
| Business & Financial | 150 (67.9%) | 71 (32.1%) |
| Computers, Engineering & Science | 128 (88.9%) | 16 (11.1%) |
| Computers & Mathematics | 68 (80.9%) | 16 (19.1%) |
| Architecture & Engineering | 58 (100.0%) | 0 (0.0%) |
| Life, Physical & Social Science | 2 (100.0%) | 0 (0.0%) |
| Community & Social Service | 252 (35.9%) | 449 (64.0%) |
| Education, Arts & Media | 166 (54.6%) | 138 (45.4%) |
| Legal Services & Support | 33 (58.9%) | 23 (41.1%) |
| Education Instruction & Library | 49 (15.7%) | 264 (84.4%) |
| Arts, Media & Entertainment | 4 (14.3%) | 24 (85.7%) |
| Health Diagnosing & Treating | 97 (20.9%) | 366 (79.0%) |
| Health Technologists | 65 (17.7%) | 302 (82.3%) |
| Total (Category) | 917 (46.5%) | 1,057 (53.5%) |
| Total (Overall) | 3,339 (55.8%) | 2,640 (44.2%) |
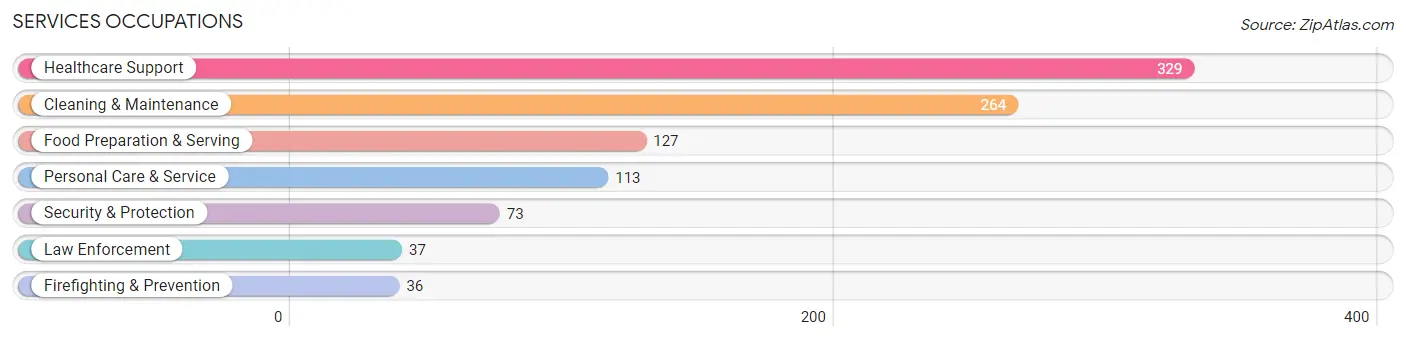
Services Occupations
The most common Services occupations in Fort Payne are Healthcare Support (329 | 5.5%), Cleaning & Maintenance (264 | 4.4%), Food Preparation & Serving (127 | 2.1%), Personal Care & Service (113 | 1.9%), and Security & Protection (73 | 1.2%).
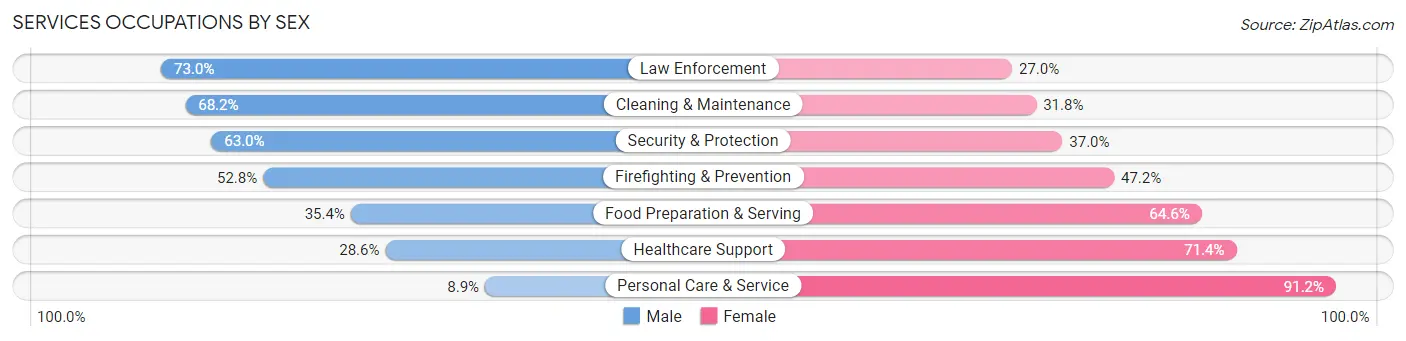
Services Occupations by Sex
Within the Services occupations in Fort Payne, the most male-oriented occupations are Law Enforcement (73.0%), Cleaning & Maintenance (68.2%), and Security & Protection (63.0%), while the most female-oriented occupations are Personal Care & Service (91.1%), Healthcare Support (71.4%), and Food Preparation & Serving (64.6%).
| Occupation | Male | Female |
| Healthcare Support | 94 (28.6%) | 235 (71.4%) |
| Security & Protection | 46 (63.0%) | 27 (37.0%) |
| Firefighting & Prevention | 19 (52.8%) | 17 (47.2%) |
| Law Enforcement | 27 (73.0%) | 10 (27.0%) |
| Food Preparation & Serving | 45 (35.4%) | 82 (64.6%) |
| Cleaning & Maintenance | 180 (68.2%) | 84 (31.8%) |
| Personal Care & Service | 10 (8.8%) | 103 (91.1%) |
| Total (Category) | 375 (41.4%) | 531 (58.6%) |
| Total (Overall) | 3,339 (55.8%) | 2,640 (44.2%) |
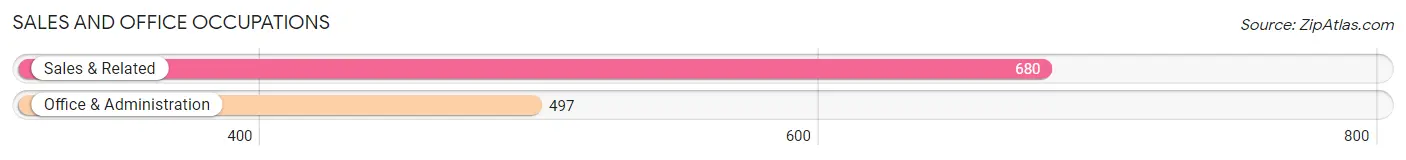
Sales and Office Occupations
The most common Sales and Office occupations in Fort Payne are Sales & Related (680 | 11.4%), and Office & Administration (497 | 8.3%).
Sales and Office Occupations by Sex
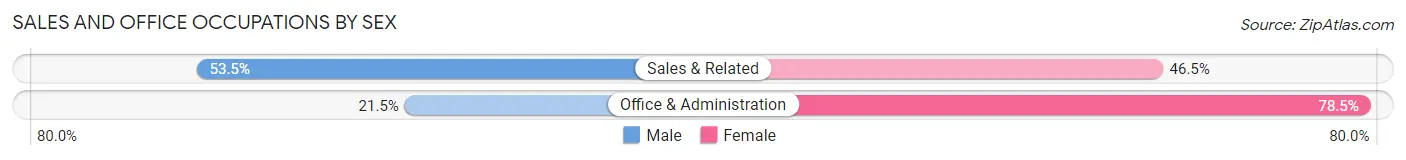
| Occupation | Male | Female |
| Sales & Related | 364 (53.5%) | 316 (46.5%) |
| Office & Administration | 107 (21.5%) | 390 (78.5%) |
| Total (Category) | 471 (40.0%) | 706 (60.0%) |
| Total (Overall) | 3,339 (55.8%) | 2,640 (44.2%) |
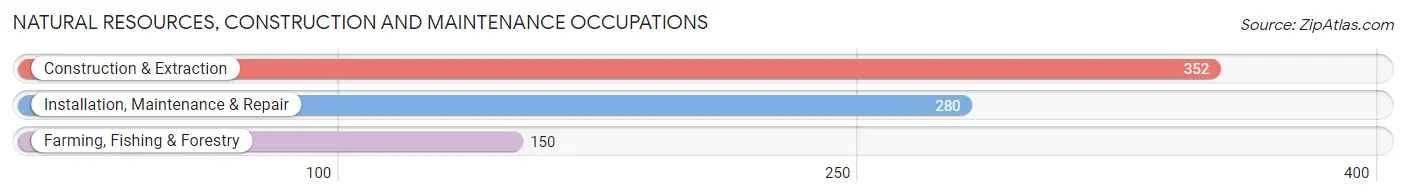
Natural Resources, Construction and Maintenance Occupations
The most common Natural Resources, Construction and Maintenance occupations in Fort Payne are Construction & Extraction (352 | 5.9%), Installation, Maintenance & Repair (280 | 4.7%), and Farming, Fishing & Forestry (150 | 2.5%).
Natural Resources, Construction and Maintenance Occupations by Sex
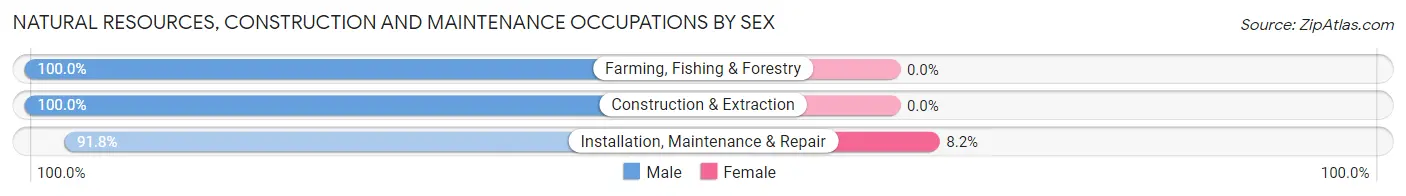
| Occupation | Male | Female |
| Farming, Fishing & Forestry | 150 (100.0%) | 0 (0.0%) |
| Construction & Extraction | 352 (100.0%) | 0 (0.0%) |
| Installation, Maintenance & Repair | 257 (91.8%) | 23 (8.2%) |
| Total (Category) | 759 (97.1%) | 23 (2.9%) |
| Total (Overall) | 3,339 (55.8%) | 2,640 (44.2%) |
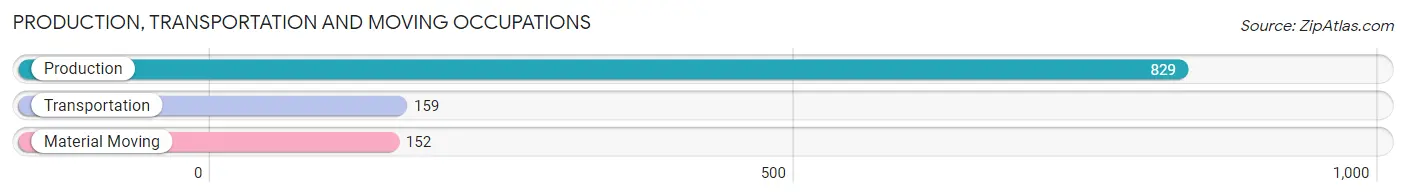
Production, Transportation and Moving Occupations
The most common Production, Transportation and Moving occupations in Fort Payne are Production (829 | 13.9%), Transportation (159 | 2.7%), and Material Moving (152 | 2.5%).
Production, Transportation and Moving Occupations by Sex
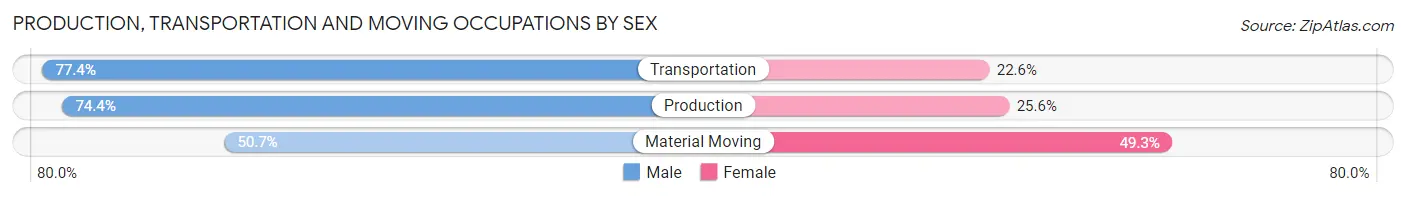
| Occupation | Male | Female |
| Production | 617 (74.4%) | 212 (25.6%) |
| Transportation | 123 (77.4%) | 36 (22.6%) |
| Material Moving | 77 (50.7%) | 75 (49.3%) |
| Total (Category) | 817 (71.7%) | 323 (28.3%) |
| Total (Overall) | 3,339 (55.8%) | 2,640 (44.2%) |
Employment Industries by Sex in Fort Payne
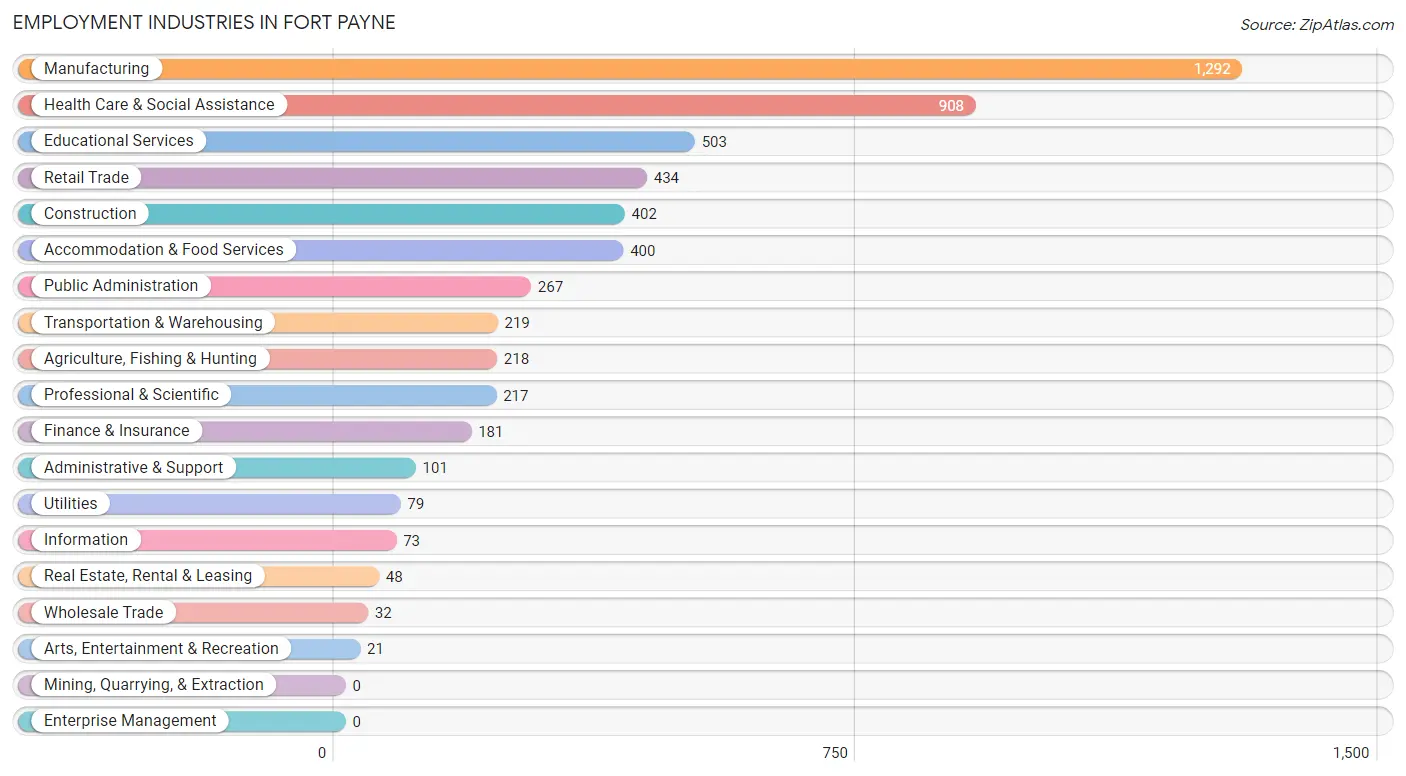
Employment Industries in Fort Payne
The major employment industries in Fort Payne include Manufacturing (1,292 | 21.6%), Health Care & Social Assistance (908 | 15.2%), Educational Services (503 | 8.4%), Retail Trade (434 | 7.3%), and Construction (402 | 6.7%).
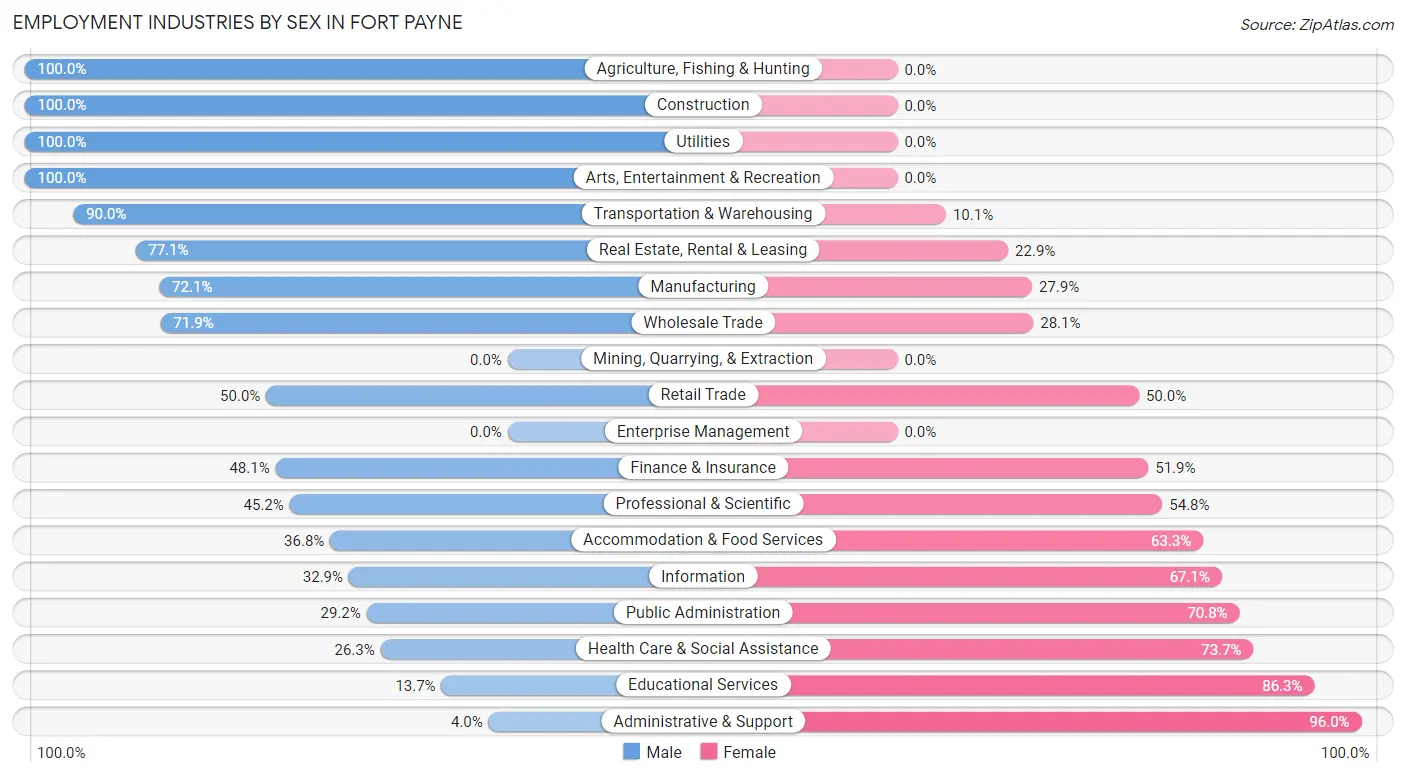
Employment Industries by Sex in Fort Payne
The Fort Payne industries that see more men than women are Agriculture, Fishing & Hunting (100.0%), Construction (100.0%), and Utilities (100.0%), whereas the industries that tend to have a higher number of women are Administrative & Support (96.0%), Educational Services (86.3%), and Health Care & Social Assistance (73.7%).
| Industry | Male | Female |
| Agriculture, Fishing & Hunting | 218 (100.0%) | 0 (0.0%) |
| Mining, Quarrying, & Extraction | 0 (0.0%) | 0 (0.0%) |
| Construction | 402 (100.0%) | 0 (0.0%) |
| Manufacturing | 932 (72.1%) | 360 (27.9%) |
| Wholesale Trade | 23 (71.9%) | 9 (28.1%) |
| Retail Trade | 217 (50.0%) | 217 (50.0%) |
| Transportation & Warehousing | 197 (89.9%) | 22 (10.1%) |
| Utilities | 79 (100.0%) | 0 (0.0%) |
| Information | 24 (32.9%) | 49 (67.1%) |
| Finance & Insurance | 87 (48.1%) | 94 (51.9%) |
| Real Estate, Rental & Leasing | 37 (77.1%) | 11 (22.9%) |
| Professional & Scientific | 98 (45.2%) | 119 (54.8%) |
| Enterprise Management | 0 (0.0%) | 0 (0.0%) |
| Administrative & Support | 4 (4.0%) | 97 (96.0%) |
| Educational Services | 69 (13.7%) | 434 (86.3%) |
| Health Care & Social Assistance | 239 (26.3%) | 669 (73.7%) |
| Arts, Entertainment & Recreation | 21 (100.0%) | 0 (0.0%) |
| Accommodation & Food Services | 147 (36.7%) | 253 (63.2%) |
| Public Administration | 78 (29.2%) | 189 (70.8%) |
| Total | 3,339 (55.8%) | 2,640 (44.2%) |
Education in Fort Payne
School Enrollment in Fort Payne
The most common levels of schooling among the 3,443 students in Fort Payne are middle school (1,035 | 30.1%), elementary school (812 | 23.6%), and high school (678 | 19.7%).
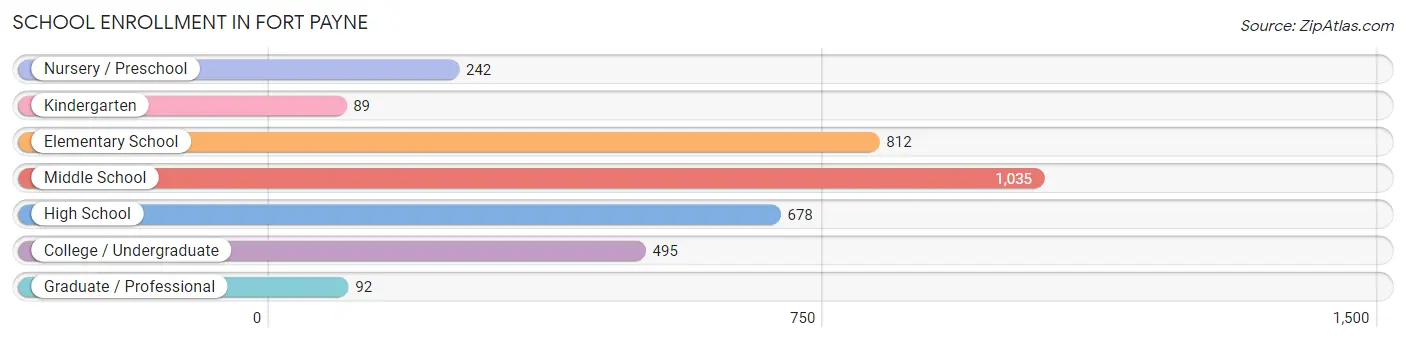
| School Level | # Students | % Students |
| Nursery / Preschool | 242 | 7.0% |
| Kindergarten | 89 | 2.6% |
| Elementary School | 812 | 23.6% |
| Middle School | 1,035 | 30.1% |
| High School | 678 | 19.7% |
| College / Undergraduate | 495 | 14.4% |
| Graduate / Professional | 92 | 2.7% |
| Total | 3,443 | 100.0% |
School Enrollment by Age by Funding Source in Fort Payne
Out of a total of 3,443 students who are enrolled in schools in Fort Payne, 331 (9.6%) attend a private institution, while the remaining 3,112 (90.4%) are enrolled in public schools. The age group of 3 to 4 year olds has the highest likelihood of being enrolled in private schools, with 52 (34.9% in the age bracket) enrolled. Conversely, the age group of 25 to 34 year olds has the lowest likelihood of being enrolled in a private school, with 115 (100.0% in the age bracket) attending a public institution.
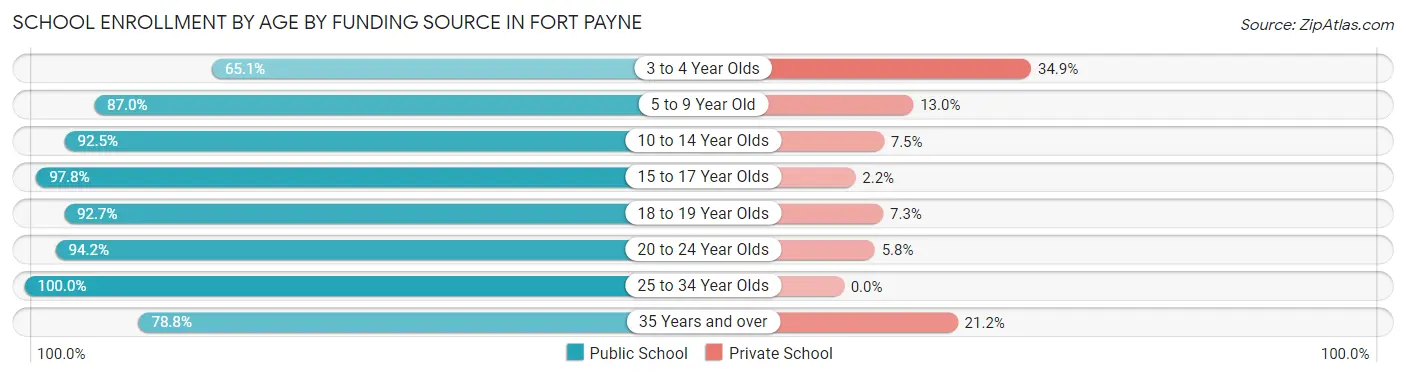
| Age Bracket | Public School | Private School |
| 3 to 4 Year Olds | 97 (65.1%) | 52 (34.9%) |
| 5 to 9 Year Old | 705 (87.0%) | 105 (13.0%) |
| 10 to 14 Year Olds | 1,276 (92.5%) | 103 (7.5%) |
| 15 to 17 Year Olds | 361 (97.8%) | 8 (2.2%) |
| 18 to 19 Year Olds | 328 (92.7%) | 26 (7.3%) |
| 20 to 24 Year Olds | 114 (94.2%) | 7 (5.8%) |
| 25 to 34 Year Olds | 115 (100.0%) | 0 (0.0%) |
| 35 Years and over | 115 (78.8%) | 31 (21.2%) |
| Total | 3,112 (90.4%) | 331 (9.6%) |
Educational Attainment by Field of Study in Fort Payne
Education (499 | 26.5%), liberal arts & history (214 | 11.4%), business (213 | 11.3%), psychology (157 | 8.3%), and science & technology (152 | 8.1%) are the most common fields of study among 1,882 individuals in Fort Payne who have obtained a bachelor's degree or higher.
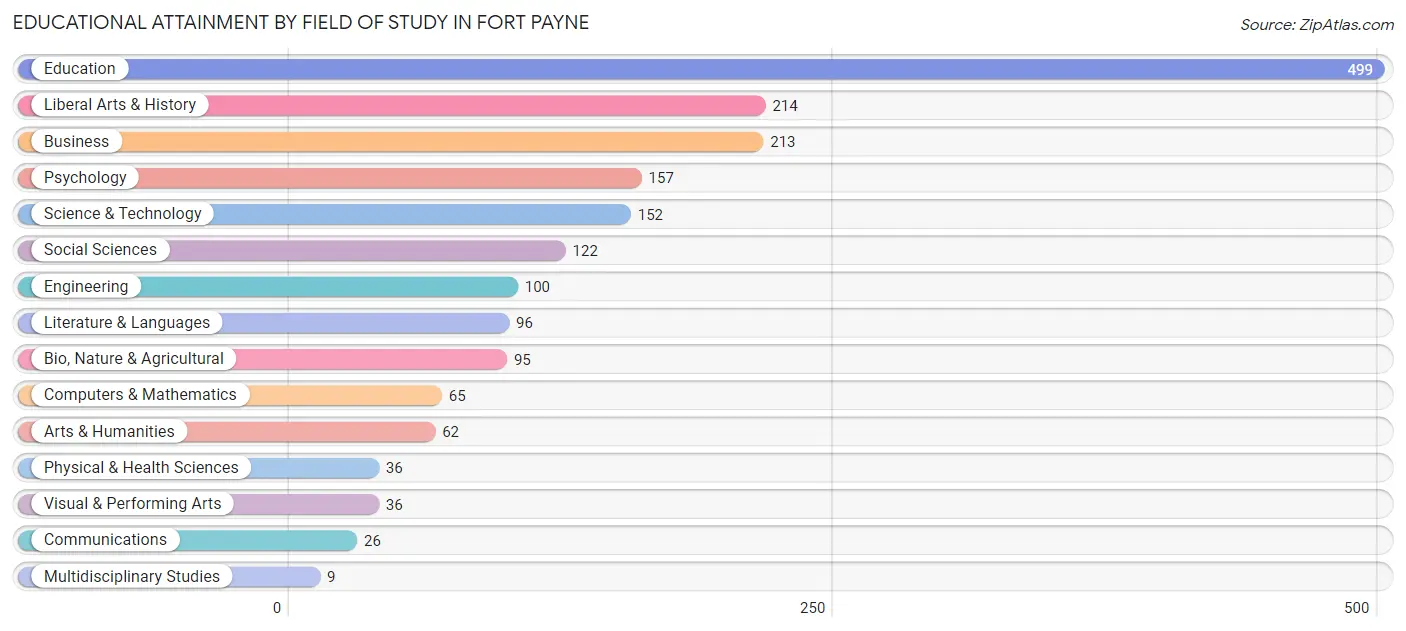
| Field of Study | # Graduates | % Graduates |
| Computers & Mathematics | 65 | 3.5% |
| Bio, Nature & Agricultural | 95 | 5.1% |
| Physical & Health Sciences | 36 | 1.9% |
| Psychology | 157 | 8.3% |
| Social Sciences | 122 | 6.5% |
| Engineering | 100 | 5.3% |
| Multidisciplinary Studies | 9 | 0.5% |
| Science & Technology | 152 | 8.1% |
| Business | 213 | 11.3% |
| Education | 499 | 26.5% |
| Literature & Languages | 96 | 5.1% |
| Liberal Arts & History | 214 | 11.4% |
| Visual & Performing Arts | 36 | 1.9% |
| Communications | 26 | 1.4% |
| Arts & Humanities | 62 | 3.3% |
| Total | 1,882 | 100.0% |
Transportation & Commute in Fort Payne
Vehicle Availability by Sex in Fort Payne
The most prevalent vehicle ownership categories in Fort Payne are males with 2 vehicles (1,452, accounting for 43.6%) and females with 2 vehicles (1,117, making up 55.8%).
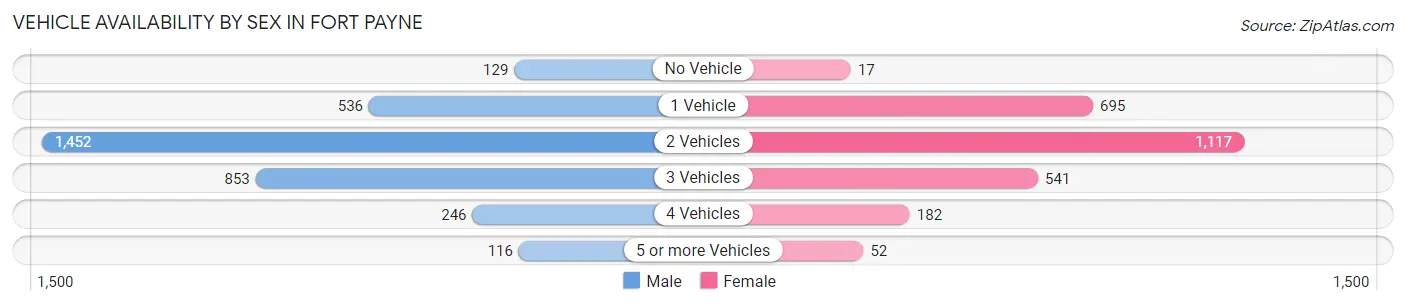
| Vehicles Available | Male | Female |
| No Vehicle | 129 (3.9%) | 17 (0.6%) |
| 1 Vehicle | 536 (16.1%) | 695 (26.7%) |
| 2 Vehicles | 1,452 (43.6%) | 1,117 (42.9%) |
| 3 Vehicles | 853 (25.6%) | 541 (20.8%) |
| 4 Vehicles | 246 (7.4%) | 182 (7.0%) |
| 5 or more Vehicles | 116 (3.5%) | 52 (2.0%) |
| Total | 3,332 (100.0%) | 2,604 (100.0%) |
Commute Time in Fort Payne
The most frequently occuring commute durations in Fort Payne are 10 to 14 minutes (1,287 commuters, 22.8%), 15 to 19 minutes (1,055 commuters, 18.7%), and 5 to 9 minutes (980 commuters, 17.3%).
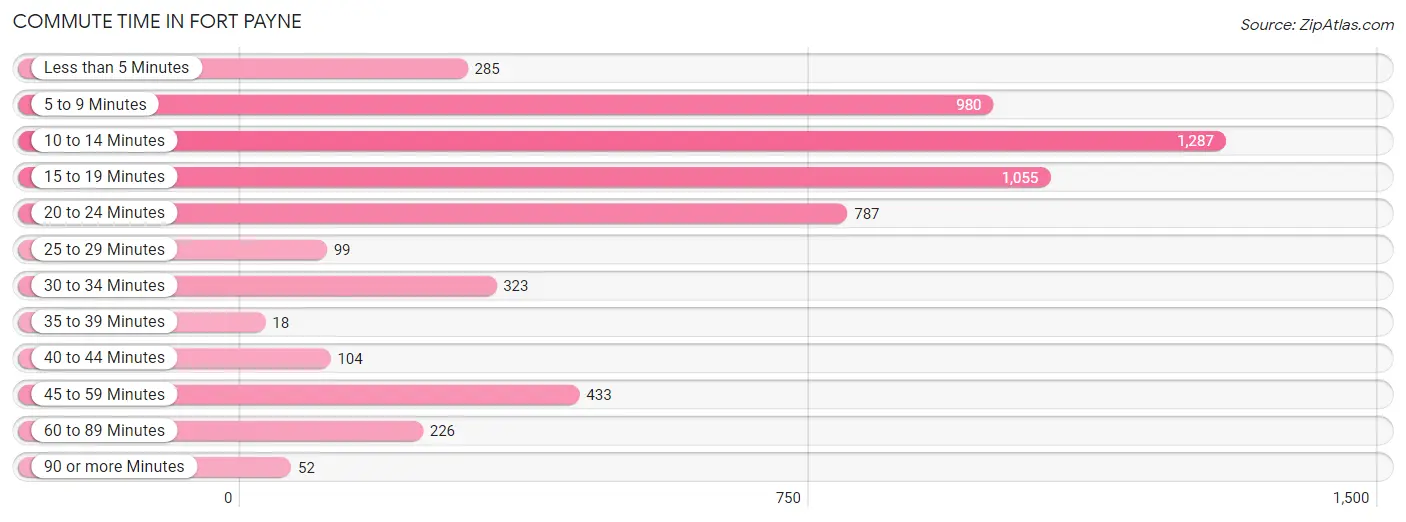
| Commute Time | # Commuters | % Commuters |
| Less than 5 Minutes | 285 | 5.1% |
| 5 to 9 Minutes | 980 | 17.3% |
| 10 to 14 Minutes | 1,287 | 22.8% |
| 15 to 19 Minutes | 1,055 | 18.7% |
| 20 to 24 Minutes | 787 | 13.9% |
| 25 to 29 Minutes | 99 | 1.8% |
| 30 to 34 Minutes | 323 | 5.7% |
| 35 to 39 Minutes | 18 | 0.3% |
| 40 to 44 Minutes | 104 | 1.8% |
| 45 to 59 Minutes | 433 | 7.7% |
| 60 to 89 Minutes | 226 | 4.0% |
| 90 or more Minutes | 52 | 0.9% |
Commute Time by Sex in Fort Payne
The most common commute times in Fort Payne are 10 to 14 minutes (561 commuters, 17.9%) for males and 10 to 14 minutes (726 commuters, 28.8%) for females.
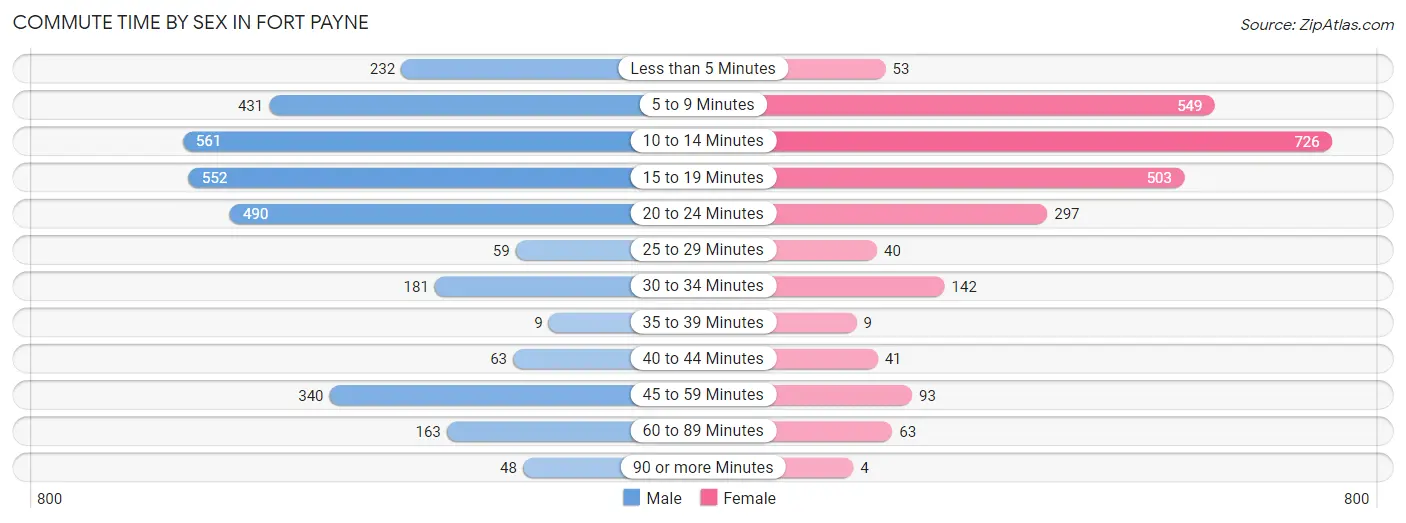
| Commute Time | Male | Female |
| Less than 5 Minutes | 232 (7.4%) | 53 (2.1%) |
| 5 to 9 Minutes | 431 (13.8%) | 549 (21.8%) |
| 10 to 14 Minutes | 561 (17.9%) | 726 (28.8%) |
| 15 to 19 Minutes | 552 (17.6%) | 503 (20.0%) |
| 20 to 24 Minutes | 490 (15.7%) | 297 (11.8%) |
| 25 to 29 Minutes | 59 (1.9%) | 40 (1.6%) |
| 30 to 34 Minutes | 181 (5.8%) | 142 (5.6%) |
| 35 to 39 Minutes | 9 (0.3%) | 9 (0.4%) |
| 40 to 44 Minutes | 63 (2.0%) | 41 (1.6%) |
| 45 to 59 Minutes | 340 (10.9%) | 93 (3.7%) |
| 60 to 89 Minutes | 163 (5.2%) | 63 (2.5%) |
| 90 or more Minutes | 48 (1.5%) | 4 (0.2%) |
Time of Departure to Work by Sex in Fort Payne
The most frequent times of departure to work in Fort Payne are 12:00 AM to 4:59 AM (590, 18.9%) for males and 7:30 AM to 7:59 AM (516, 20.5%) for females.
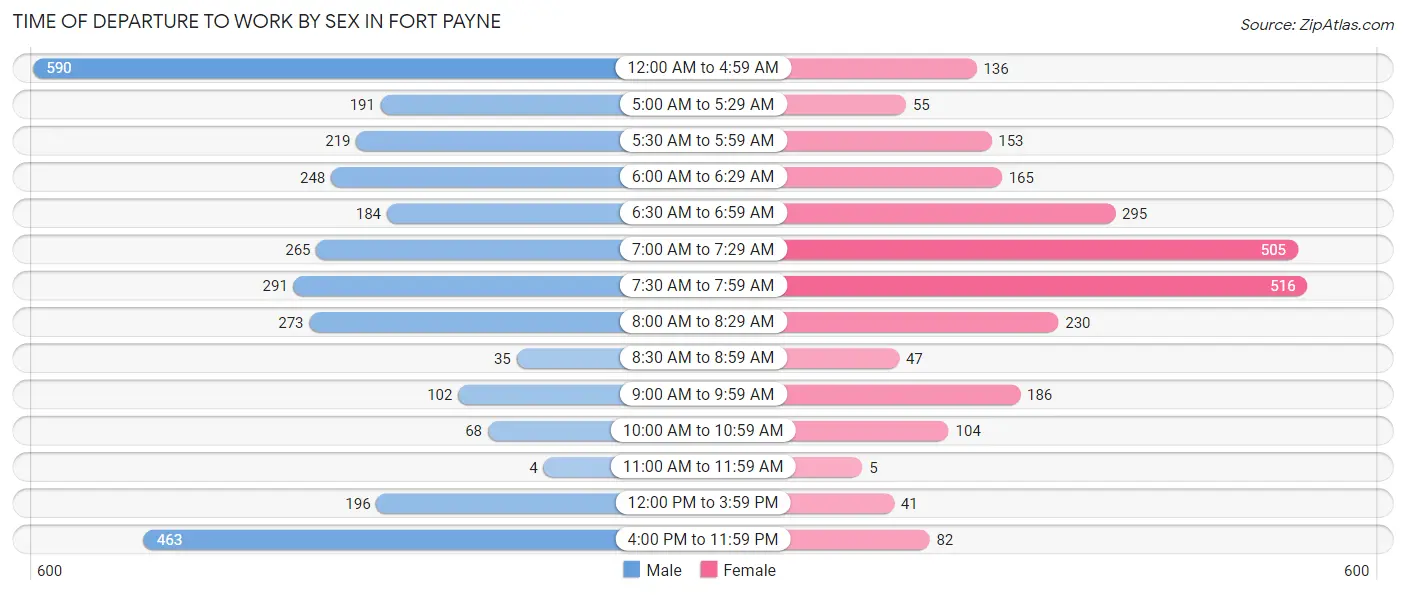
| Time of Departure | Male | Female |
| 12:00 AM to 4:59 AM | 590 (18.9%) | 136 (5.4%) |
| 5:00 AM to 5:29 AM | 191 (6.1%) | 55 (2.2%) |
| 5:30 AM to 5:59 AM | 219 (7.0%) | 153 (6.1%) |
| 6:00 AM to 6:29 AM | 248 (7.9%) | 165 (6.6%) |
| 6:30 AM to 6:59 AM | 184 (5.9%) | 295 (11.7%) |
| 7:00 AM to 7:29 AM | 265 (8.5%) | 505 (20.0%) |
| 7:30 AM to 7:59 AM | 291 (9.3%) | 516 (20.5%) |
| 8:00 AM to 8:29 AM | 273 (8.7%) | 230 (9.1%) |
| 8:30 AM to 8:59 AM | 35 (1.1%) | 47 (1.9%) |
| 9:00 AM to 9:59 AM | 102 (3.3%) | 186 (7.4%) |
| 10:00 AM to 10:59 AM | 68 (2.2%) | 104 (4.1%) |
| 11:00 AM to 11:59 AM | 4 (0.1%) | 5 (0.2%) |
| 12:00 PM to 3:59 PM | 196 (6.3%) | 41 (1.6%) |
| 4:00 PM to 11:59 PM | 463 (14.8%) | 82 (3.3%) |
| Total | 3,129 (100.0%) | 2,520 (100.0%) |
Housing Occupancy in Fort Payne
Occupancy by Ownership in Fort Payne
Of the total 5,814 dwellings in Fort Payne, owner-occupied units account for 3,822 (65.7%), while renter-occupied units make up 1,992 (34.3%).
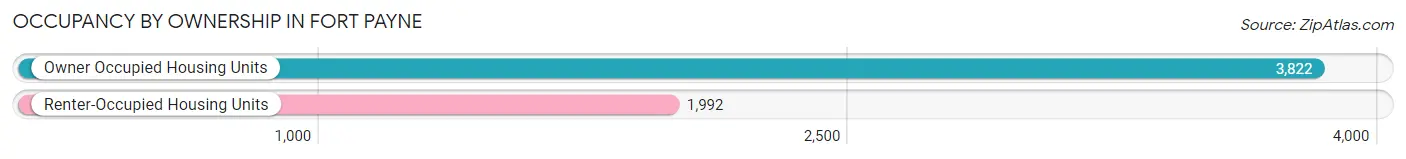
| Occupancy | # Housing Units | % Housing Units |
| Owner Occupied Housing Units | 3,822 | 65.7% |
| Renter-Occupied Housing Units | 1,992 | 34.3% |
| Total Occupied Housing Units | 5,814 | 100.0% |
Occupancy by Household Size in Fort Payne
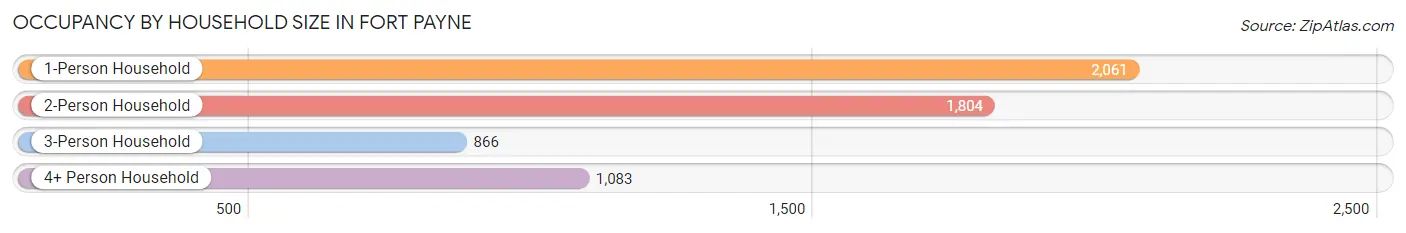
| Household Size | # Housing Units | % Housing Units |
| 1-Person Household | 2,061 | 35.4% |
| 2-Person Household | 1,804 | 31.0% |
| 3-Person Household | 866 | 14.9% |
| 4+ Person Household | 1,083 | 18.6% |
| Total Housing Units | 5,814 | 100.0% |
Occupancy by Ownership by Household Size in Fort Payne
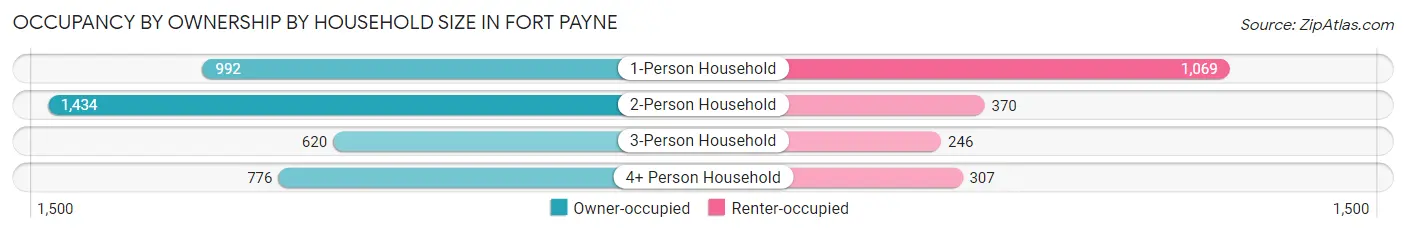
| Household Size | Owner-occupied | Renter-occupied |
| 1-Person Household | 992 (48.1%) | 1,069 (51.9%) |
| 2-Person Household | 1,434 (79.5%) | 370 (20.5%) |
| 3-Person Household | 620 (71.6%) | 246 (28.4%) |
| 4+ Person Household | 776 (71.7%) | 307 (28.3%) |
| Total Housing Units | 3,822 (65.7%) | 1,992 (34.3%) |
Occupancy by Educational Attainment in Fort Payne
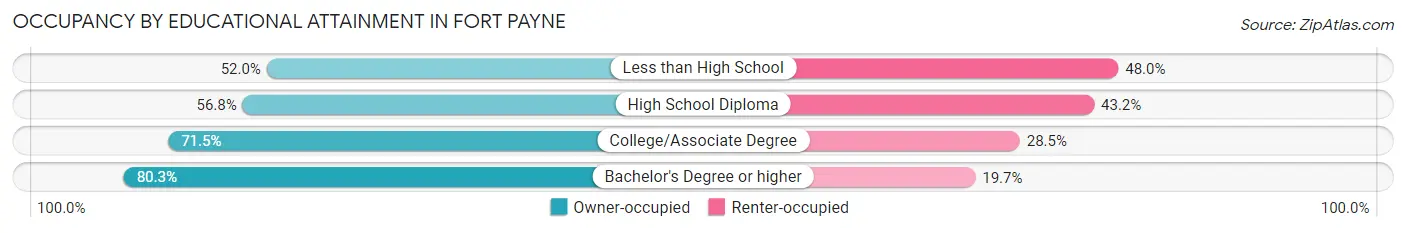
| Household Size | Owner-occupied | Renter-occupied |
| Less than High School | 559 (52.0%) | 516 (48.0%) |
| High School Diploma | 866 (56.8%) | 659 (43.2%) |
| College/Associate Degree | 1,502 (71.5%) | 598 (28.5%) |
| Bachelor's Degree or higher | 895 (80.3%) | 219 (19.7%) |
Occupancy by Age of Householder in Fort Payne
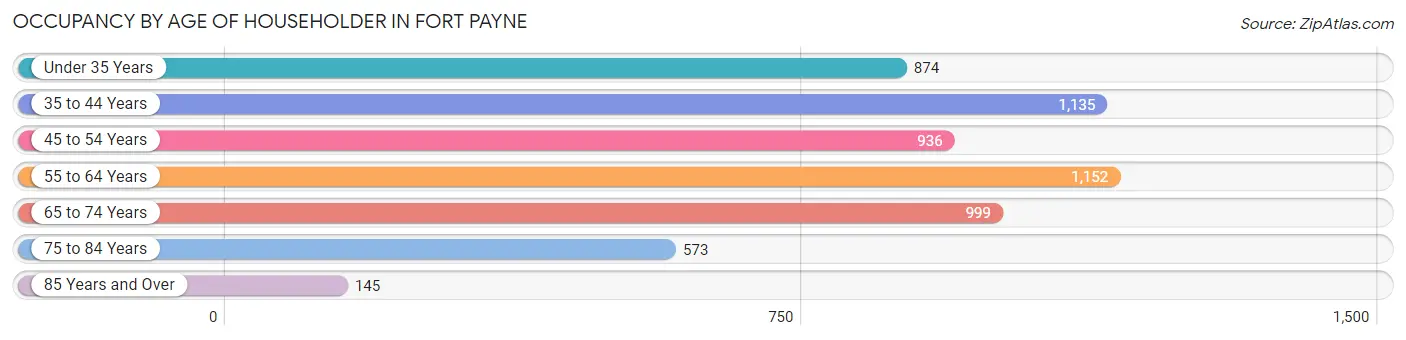
| Age Bracket | # Households | % Households |
| Under 35 Years | 874 | 15.0% |
| 35 to 44 Years | 1,135 | 19.5% |
| 45 to 54 Years | 936 | 16.1% |
| 55 to 64 Years | 1,152 | 19.8% |
| 65 to 74 Years | 999 | 17.2% |
| 75 to 84 Years | 573 | 9.9% |
| 85 Years and Over | 145 | 2.5% |
| Total | 5,814 | 100.0% |
Housing Finances in Fort Payne
Median Income by Occupancy in Fort Payne
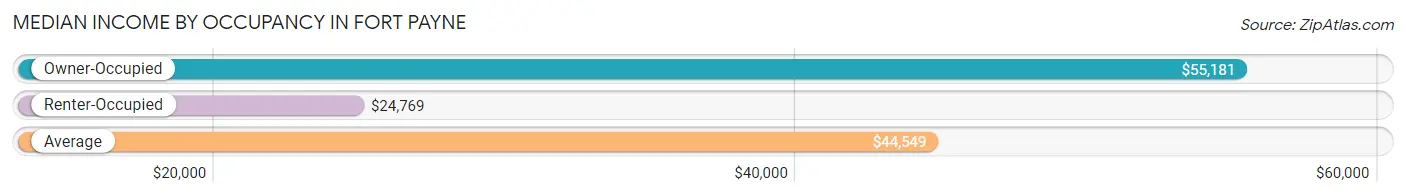
| Occupancy Type | # Households | Median Income |
| Owner-Occupied | 3,822 (65.7%) | $55,181 |
| Renter-Occupied | 1,992 (34.3%) | $24,769 |
| Average | 5,814 (100.0%) | $44,549 |
Occupancy by Householder Income Bracket in Fort Payne
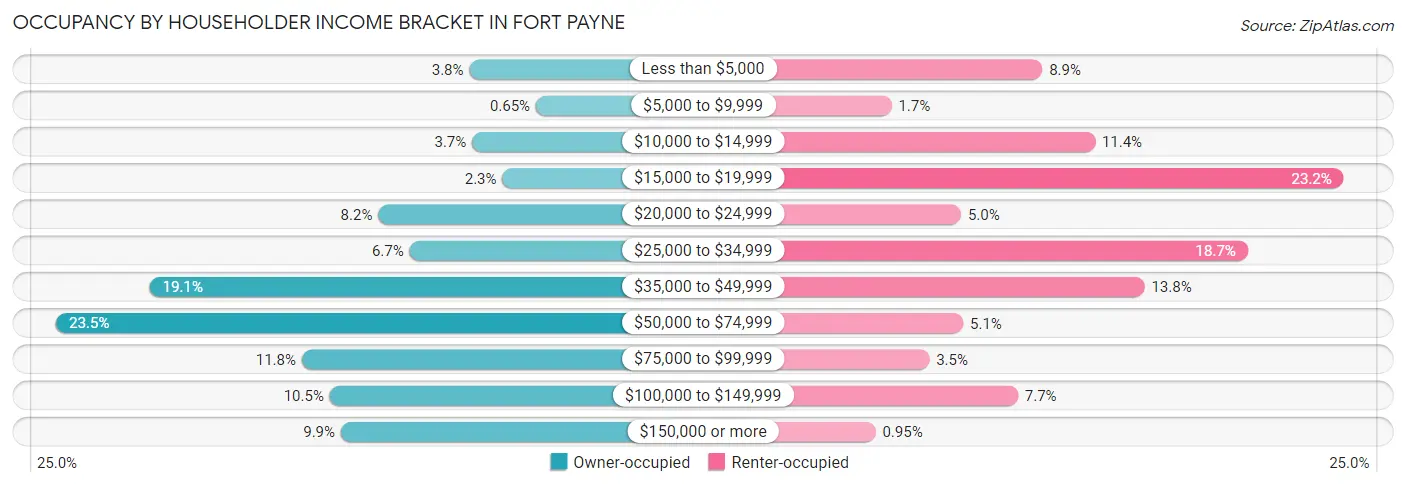
| Income Bracket | Owner-occupied | Renter-occupied |
| Less than $5,000 | 146 (3.8%) | 177 (8.9%) |
| $5,000 to $9,999 | 25 (0.6%) | 34 (1.7%) |
| $10,000 to $14,999 | 141 (3.7%) | 227 (11.4%) |
| $15,000 to $19,999 | 86 (2.2%) | 463 (23.2%) |
| $20,000 to $24,999 | 312 (8.2%) | 100 (5.0%) |
| $25,000 to $34,999 | 255 (6.7%) | 372 (18.7%) |
| $35,000 to $49,999 | 728 (19.1%) | 274 (13.8%) |
| $50,000 to $74,999 | 898 (23.5%) | 102 (5.1%) |
| $75,000 to $99,999 | 451 (11.8%) | 70 (3.5%) |
| $100,000 to $149,999 | 400 (10.5%) | 154 (7.7%) |
| $150,000 or more | 380 (9.9%) | 19 (0.9%) |
| Total | 3,822 (100.0%) | 1,992 (100.0%) |
Monthly Housing Cost Tiers in Fort Payne
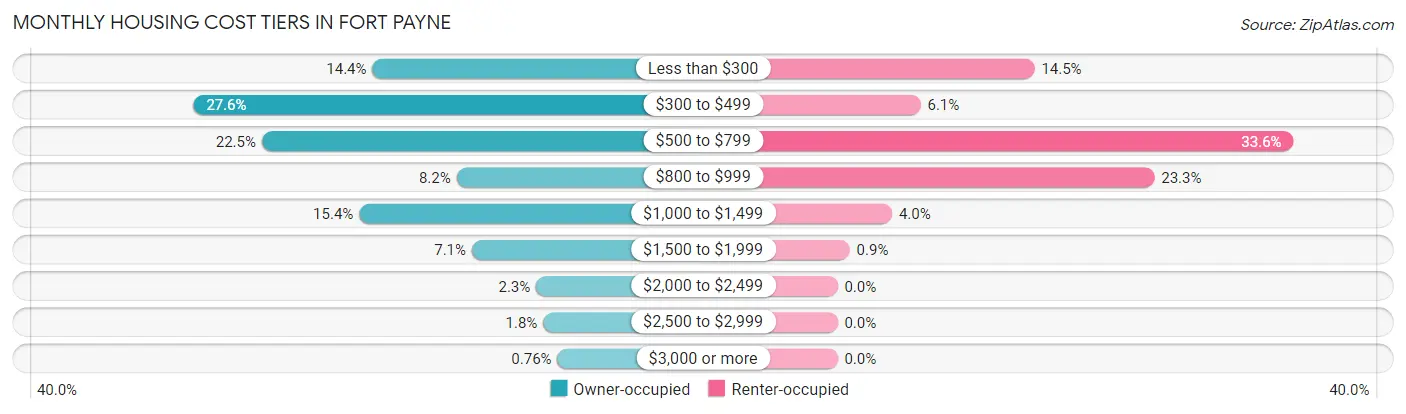
| Monthly Cost | Owner-occupied | Renter-occupied |
| Less than $300 | 550 (14.4%) | 289 (14.5%) |
| $300 to $499 | 1,054 (27.6%) | 122 (6.1%) |
| $500 to $799 | 861 (22.5%) | 669 (33.6%) |
| $800 to $999 | 313 (8.2%) | 465 (23.3%) |
| $1,000 to $1,499 | 587 (15.4%) | 80 (4.0%) |
| $1,500 to $1,999 | 270 (7.1%) | 18 (0.9%) |
| $2,000 to $2,499 | 89 (2.3%) | 0 (0.0%) |
| $2,500 to $2,999 | 69 (1.8%) | 0 (0.0%) |
| $3,000 or more | 29 (0.8%) | 0 (0.0%) |
| Total | 3,822 (100.0%) | 1,992 (100.0%) |
Physical Housing Characteristics in Fort Payne
Housing Structures in Fort Payne
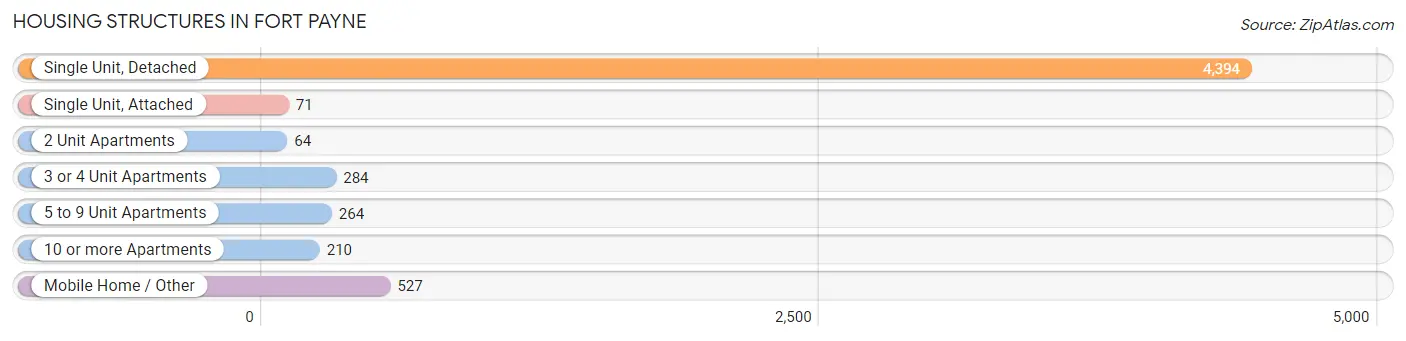
| Structure Type | # Housing Units | % Housing Units |
| Single Unit, Detached | 4,394 | 75.6% |
| Single Unit, Attached | 71 | 1.2% |
| 2 Unit Apartments | 64 | 1.1% |
| 3 or 4 Unit Apartments | 284 | 4.9% |
| 5 to 9 Unit Apartments | 264 | 4.5% |
| 10 or more Apartments | 210 | 3.6% |
| Mobile Home / Other | 527 | 9.1% |
| Total | 5,814 | 100.0% |
Housing Structures by Occupancy in Fort Payne
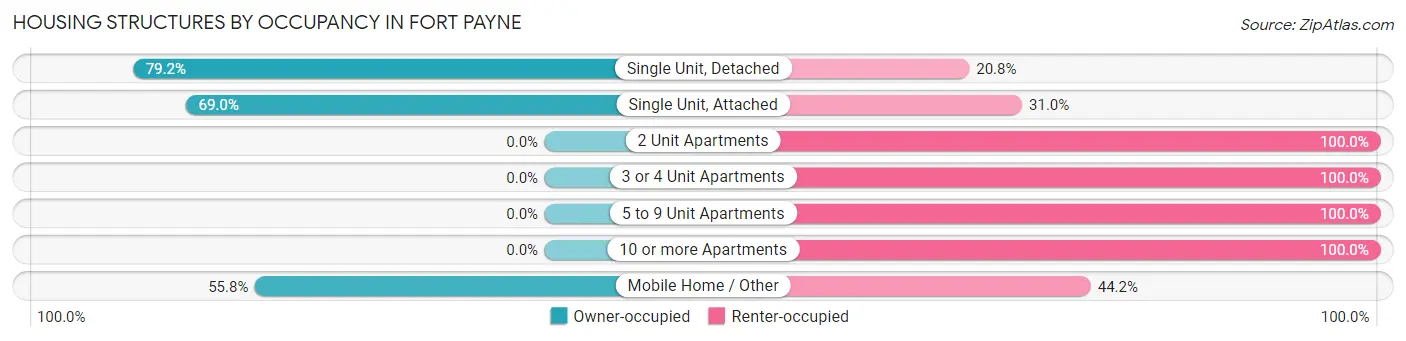
| Structure Type | Owner-occupied | Renter-occupied |
| Single Unit, Detached | 3,479 (79.2%) | 915 (20.8%) |
| Single Unit, Attached | 49 (69.0%) | 22 (31.0%) |
| 2 Unit Apartments | 0 (0.0%) | 64 (100.0%) |
| 3 or 4 Unit Apartments | 0 (0.0%) | 284 (100.0%) |
| 5 to 9 Unit Apartments | 0 (0.0%) | 264 (100.0%) |
| 10 or more Apartments | 0 (0.0%) | 210 (100.0%) |
| Mobile Home / Other | 294 (55.8%) | 233 (44.2%) |
| Total | 3,822 (65.7%) | 1,992 (34.3%) |
Housing Structures by Number of Rooms in Fort Payne
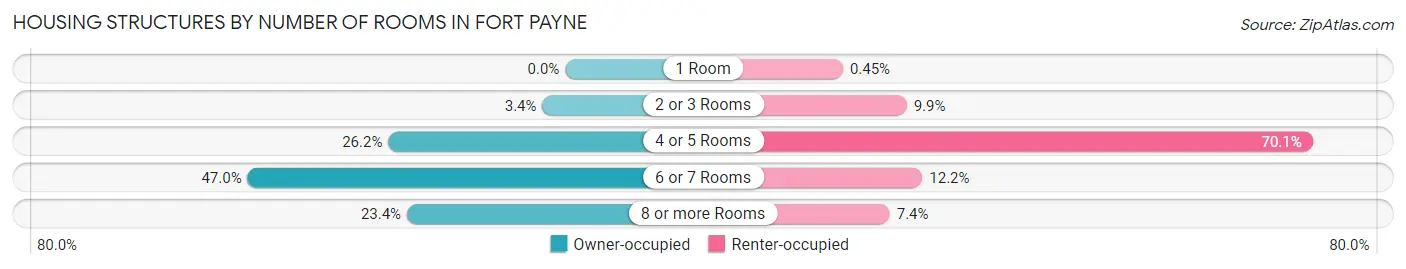
| Number of Rooms | Owner-occupied | Renter-occupied |
| 1 Room | 0 (0.0%) | 9 (0.4%) |
| 2 or 3 Rooms | 129 (3.4%) | 197 (9.9%) |
| 4 or 5 Rooms | 1,001 (26.2%) | 1,396 (70.1%) |
| 6 or 7 Rooms | 1,797 (47.0%) | 243 (12.2%) |
| 8 or more Rooms | 895 (23.4%) | 147 (7.4%) |
| Total | 3,822 (100.0%) | 1,992 (100.0%) |
Housing Structure by Heating Type in Fort Payne
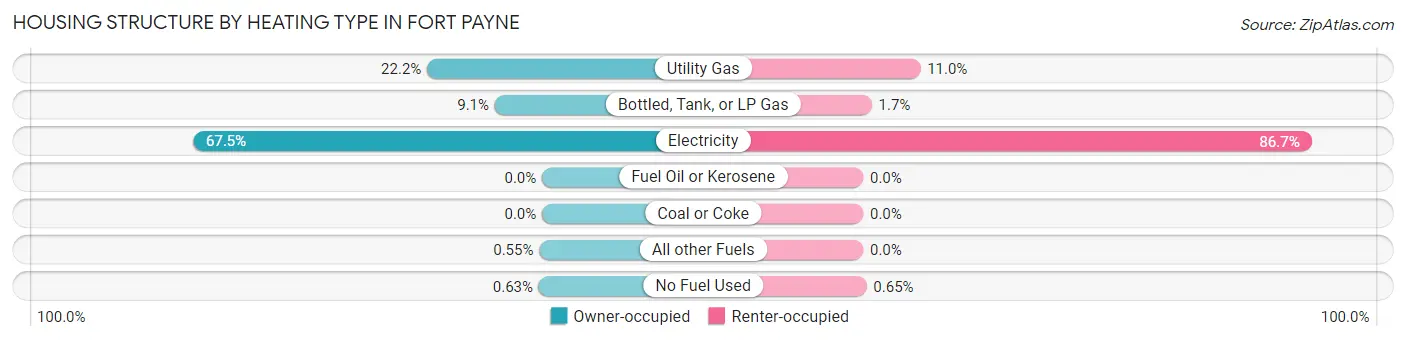
| Heating Type | Owner-occupied | Renter-occupied |
| Utility Gas | 849 (22.2%) | 220 (11.0%) |
| Bottled, Tank, or LP Gas | 349 (9.1%) | 33 (1.7%) |
| Electricity | 2,579 (67.5%) | 1,726 (86.7%) |
| Fuel Oil or Kerosene | 0 (0.0%) | 0 (0.0%) |
| Coal or Coke | 0 (0.0%) | 0 (0.0%) |
| All other Fuels | 21 (0.5%) | 0 (0.0%) |
| No Fuel Used | 24 (0.6%) | 13 (0.6%) |
| Total | 3,822 (100.0%) | 1,992 (100.0%) |
Household Vehicle Usage in Fort Payne
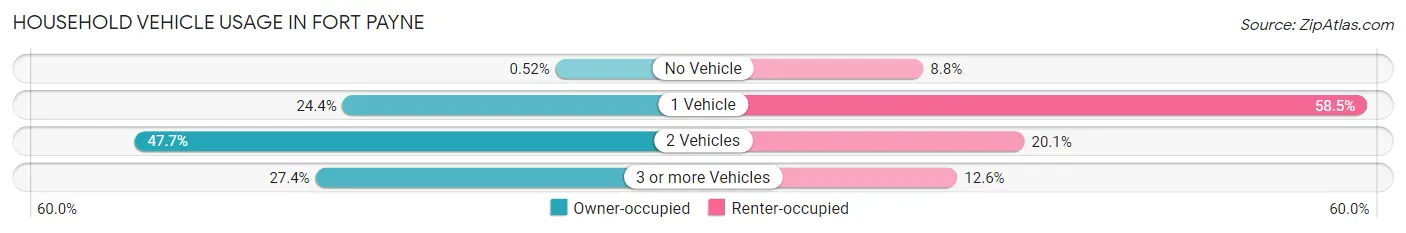
| Vehicles per Household | Owner-occupied | Renter-occupied |
| No Vehicle | 20 (0.5%) | 175 (8.8%) |
| 1 Vehicle | 932 (24.4%) | 1,165 (58.5%) |
| 2 Vehicles | 1,822 (47.7%) | 401 (20.1%) |
| 3 or more Vehicles | 1,048 (27.4%) | 251 (12.6%) |
| Total | 3,822 (100.0%) | 1,992 (100.0%) |
Real Estate & Mortgages in Fort Payne
Real Estate and Mortgage Overview in Fort Payne
| Characteristic | Without Mortgage | With Mortgage |
| Housing Units | 1,987 | 1,835 |
| Median Property Value | $145,300 | $146,300 |
| Median Household Income | $47,607 | $276 |
| Monthly Housing Costs | $383 | $29 |
| Real Estate Taxes | $455 | $84 |
Property Value by Mortgage Status in Fort Payne
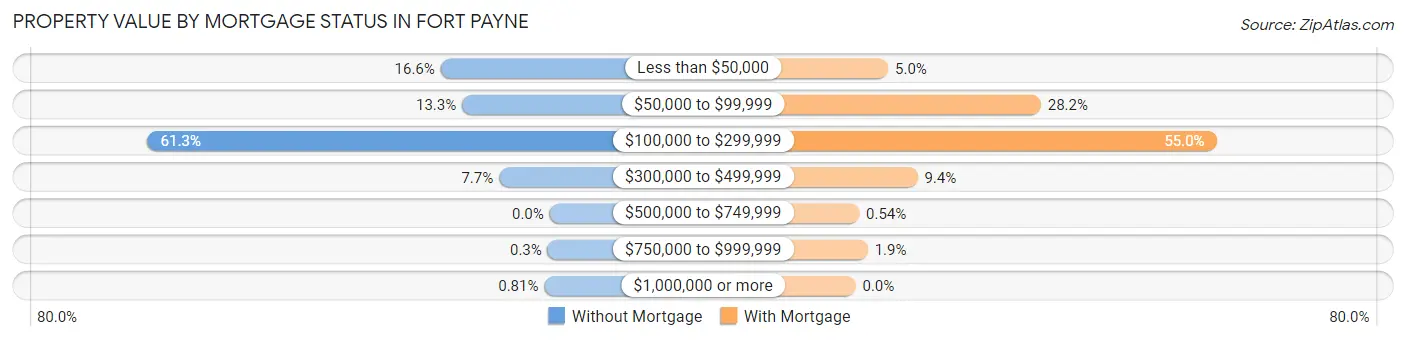
| Property Value | Without Mortgage | With Mortgage |
| Less than $50,000 | 330 (16.6%) | 91 (5.0%) |
| $50,000 to $99,999 | 265 (13.3%) | 518 (28.2%) |
| $100,000 to $299,999 | 1,217 (61.3%) | 1,009 (55.0%) |
| $300,000 to $499,999 | 153 (7.7%) | 173 (9.4%) |
| $500,000 to $749,999 | 0 (0.0%) | 10 (0.5%) |
| $750,000 to $999,999 | 6 (0.3%) | 34 (1.8%) |
| $1,000,000 or more | 16 (0.8%) | 0 (0.0%) |
| Total | 1,987 (100.0%) | 1,835 (100.0%) |
Household Income by Mortgage Status in Fort Payne
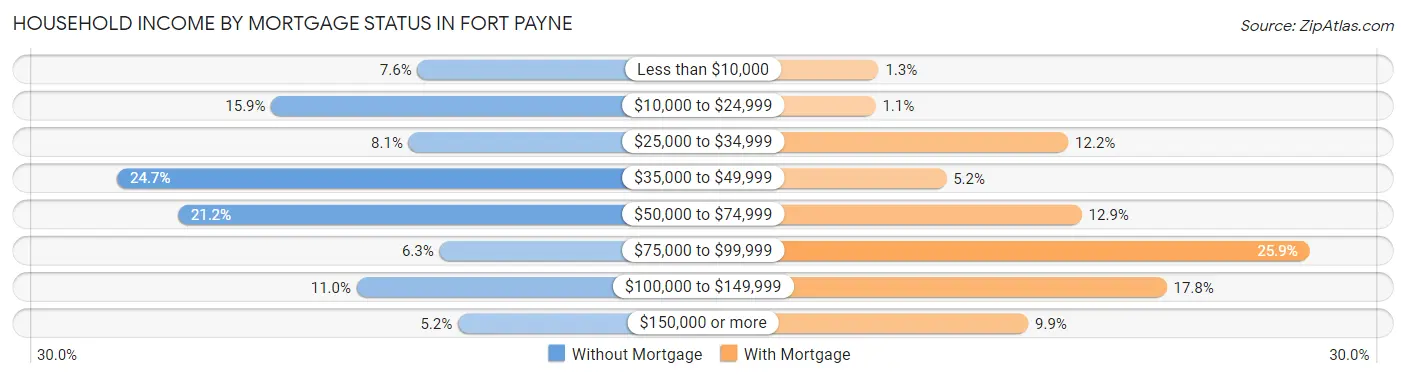
| Household Income | Without Mortgage | With Mortgage |
| Less than $10,000 | 150 (7.5%) | 24 (1.3%) |
| $10,000 to $24,999 | 316 (15.9%) | 21 (1.1%) |
| $25,000 to $34,999 | 160 (8.1%) | 223 (12.1%) |
| $35,000 to $49,999 | 491 (24.7%) | 95 (5.2%) |
| $50,000 to $74,999 | 422 (21.2%) | 237 (12.9%) |
| $75,000 to $99,999 | 125 (6.3%) | 476 (25.9%) |
| $100,000 to $149,999 | 219 (11.0%) | 326 (17.8%) |
| $150,000 or more | 104 (5.2%) | 181 (9.9%) |
| Total | 1,987 (100.0%) | 1,835 (100.0%) |
Property Value to Household Income Ratio in Fort Payne
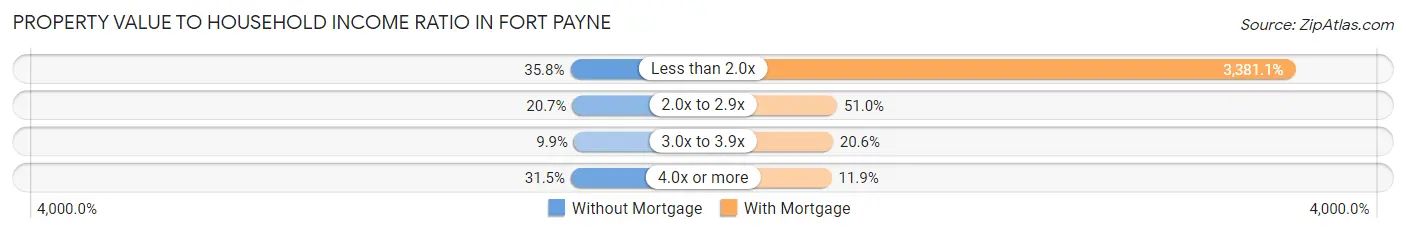
| Value-to-Income Ratio | Without Mortgage | With Mortgage |
| Less than 2.0x | 711 (35.8%) | 62,044 (3,381.1%) |
| 2.0x to 2.9x | 411 (20.7%) | 935 (50.9%) |
| 3.0x to 3.9x | 197 (9.9%) | 378 (20.6%) |
| 4.0x or more | 626 (31.5%) | 218 (11.9%) |
| Total | 1,987 (100.0%) | 1,835 (100.0%) |
Real Estate Taxes by Mortgage Status in Fort Payne
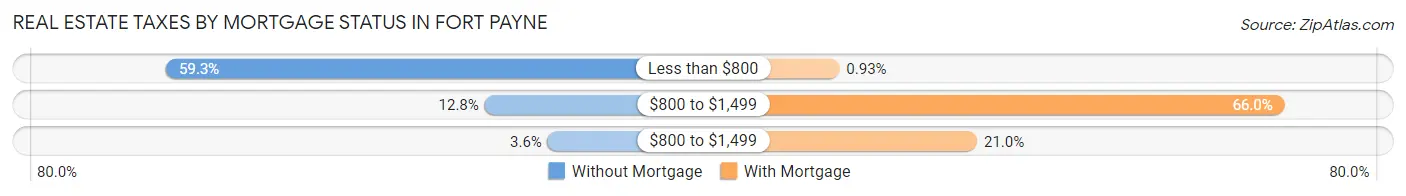
| Property Taxes | Without Mortgage | With Mortgage |
| Less than $800 | 1,179 (59.3%) | 17 (0.9%) |
| $800 to $1,499 | 254 (12.8%) | 1,211 (66.0%) |
| $800 to $1,499 | 71 (3.6%) | 386 (21.0%) |
| Total | 1,987 (100.0%) | 1,835 (100.0%) |
Health & Disability in Fort Payne
Health Insurance Coverage by Age in Fort Payne
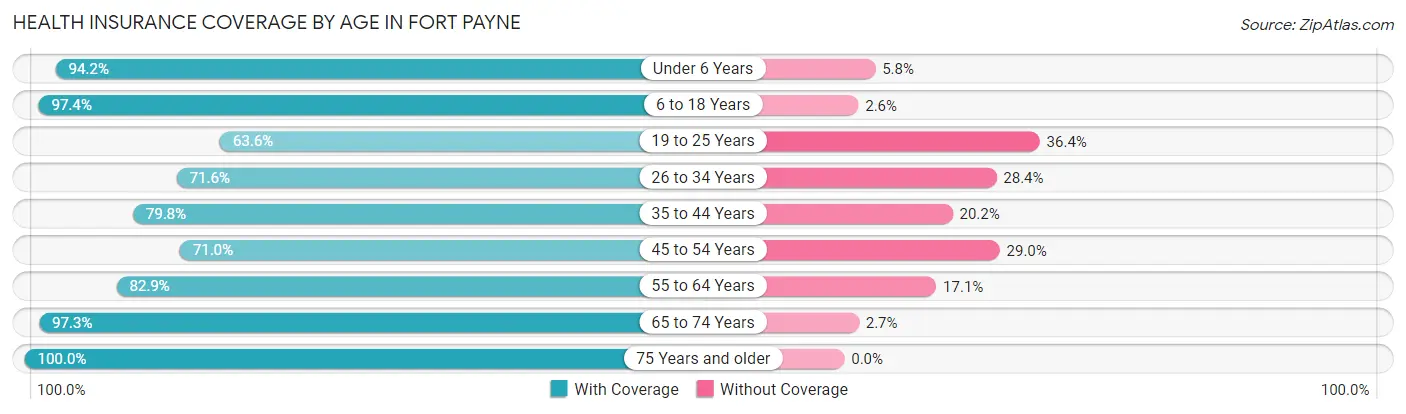
| Age Bracket | With Coverage | Without Coverage |
| Under 6 Years | 1,111 (94.2%) | 68 (5.8%) |
| 6 to 18 Years | 2,611 (97.4%) | 70 (2.6%) |
| 19 to 25 Years | 829 (63.6%) | 475 (36.4%) |
| 26 to 34 Years | 831 (71.6%) | 329 (28.4%) |
| 35 to 44 Years | 1,364 (79.8%) | 345 (20.2%) |
| 45 to 54 Years | 1,121 (71.0%) | 457 (29.0%) |
| 55 to 64 Years | 1,751 (82.9%) | 362 (17.1%) |
| 65 to 74 Years | 1,513 (97.3%) | 42 (2.7%) |
| 75 Years and older | 1,118 (100.0%) | 0 (0.0%) |
| Total | 12,249 (85.1%) | 2,148 (14.9%) |
Health Insurance Coverage by Citizenship Status in Fort Payne
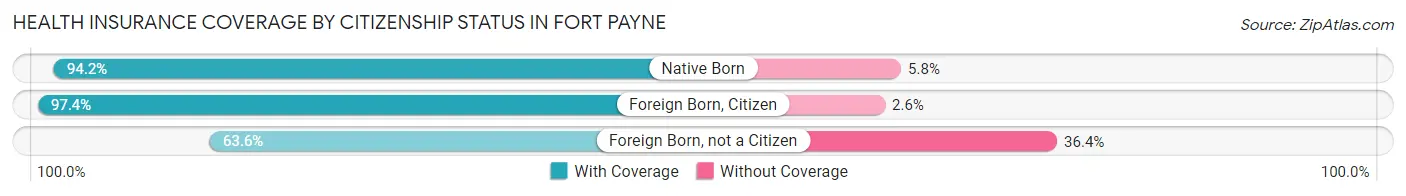
| Citizenship Status | With Coverage | Without Coverage |
| Native Born | 1,111 (94.2%) | 68 (5.8%) |
| Foreign Born, Citizen | 2,611 (97.4%) | 70 (2.6%) |
| Foreign Born, not a Citizen | 829 (63.6%) | 475 (36.4%) |
Health Insurance Coverage by Household Income in Fort Payne
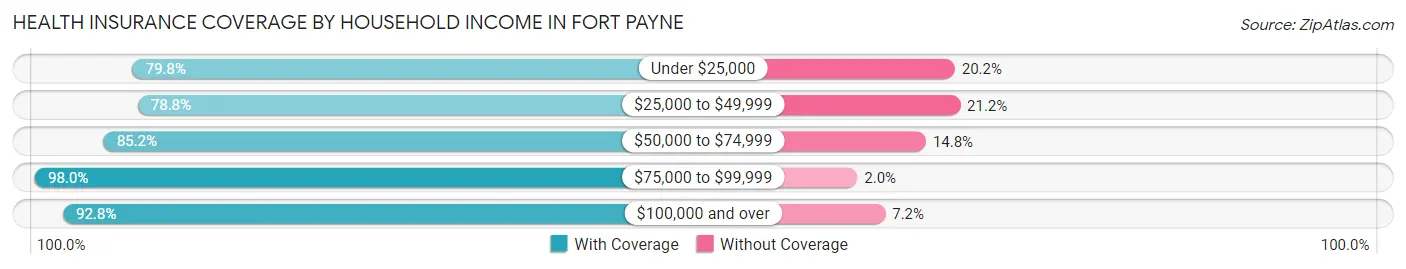
| Household Income | With Coverage | Without Coverage |
| Under $25,000 | 2,661 (79.8%) | 675 (20.2%) |
| $25,000 to $49,999 | 3,098 (78.8%) | 835 (21.2%) |
| $50,000 to $74,999 | 2,205 (85.2%) | 384 (14.8%) |
| $75,000 to $99,999 | 1,347 (98.0%) | 27 (2.0%) |
| $100,000 and over | 2,922 (92.8%) | 227 (7.2%) |
Public vs Private Health Insurance Coverage by Age in Fort Payne
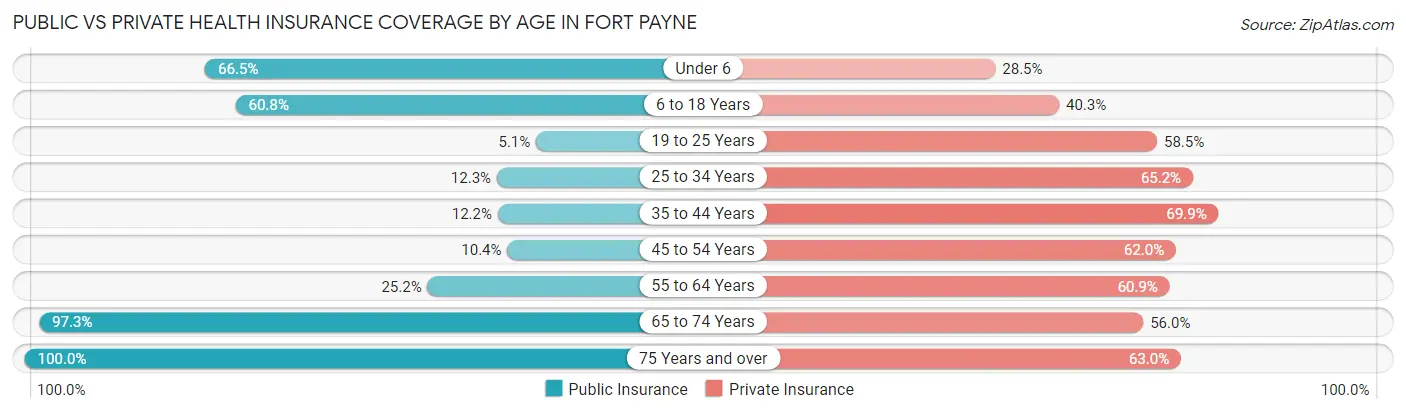
| Age Bracket | Public Insurance | Private Insurance |
| Under 6 | 784 (66.5%) | 336 (28.5%) |
| 6 to 18 Years | 1,631 (60.8%) | 1,081 (40.3%) |
| 19 to 25 Years | 66 (5.1%) | 763 (58.5%) |
| 25 to 34 Years | 143 (12.3%) | 756 (65.2%) |
| 35 to 44 Years | 208 (12.2%) | 1,195 (69.9%) |
| 45 to 54 Years | 164 (10.4%) | 979 (62.0%) |
| 55 to 64 Years | 533 (25.2%) | 1,286 (60.9%) |
| 65 to 74 Years | 1,513 (97.3%) | 870 (55.9%) |
| 75 Years and over | 1,118 (100.0%) | 704 (63.0%) |
| Total | 6,160 (42.8%) | 7,970 (55.4%) |
Disability Status by Sex by Age in Fort Payne
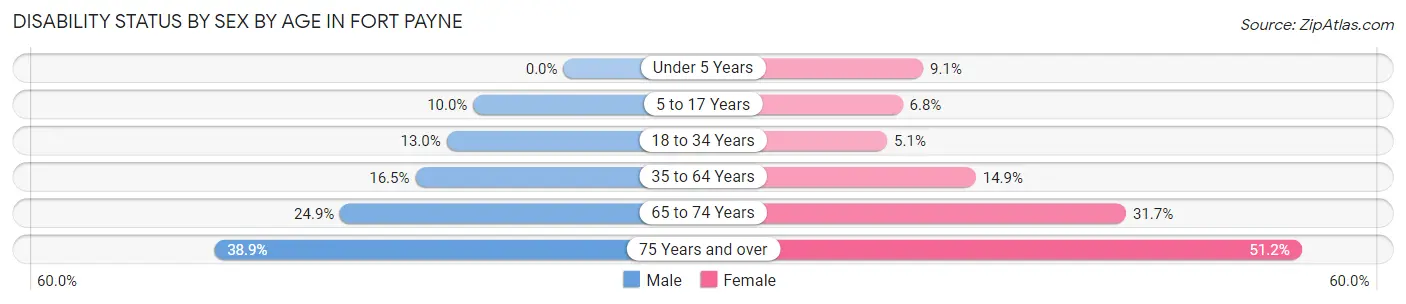
| Age Bracket | Male | Female |
| Under 5 Years | 0 (0.0%) | 53 (9.1%) |
| 5 to 17 Years | 136 (10.0%) | 82 (6.8%) |
| 18 to 34 Years | 176 (13.0%) | 70 (5.1%) |
| 35 to 64 Years | 411 (16.5%) | 434 (14.9%) |
| 65 to 74 Years | 173 (24.9%) | 272 (31.7%) |
| 75 Years and over | 159 (38.9%) | 363 (51.2%) |
Disability Class by Sex by Age in Fort Payne
Disability Class: Hearing Difficulty
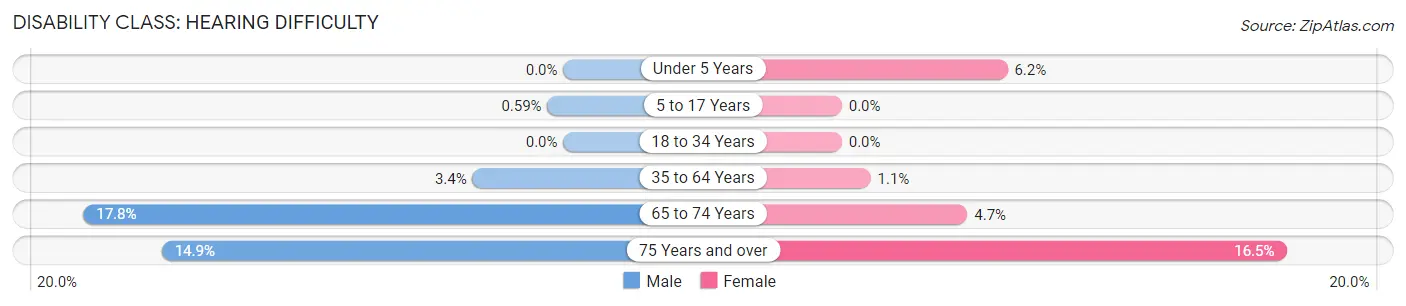
| Age Bracket | Male | Female |
| Under 5 Years | 0 (0.0%) | 36 (6.1%) |
| 5 to 17 Years | 8 (0.6%) | 0 (0.0%) |
| 18 to 34 Years | 0 (0.0%) | 0 (0.0%) |
| 35 to 64 Years | 84 (3.4%) | 31 (1.1%) |
| 65 to 74 Years | 124 (17.8%) | 40 (4.7%) |
| 75 Years and over | 61 (14.9%) | 117 (16.5%) |
Disability Class: Vision Difficulty
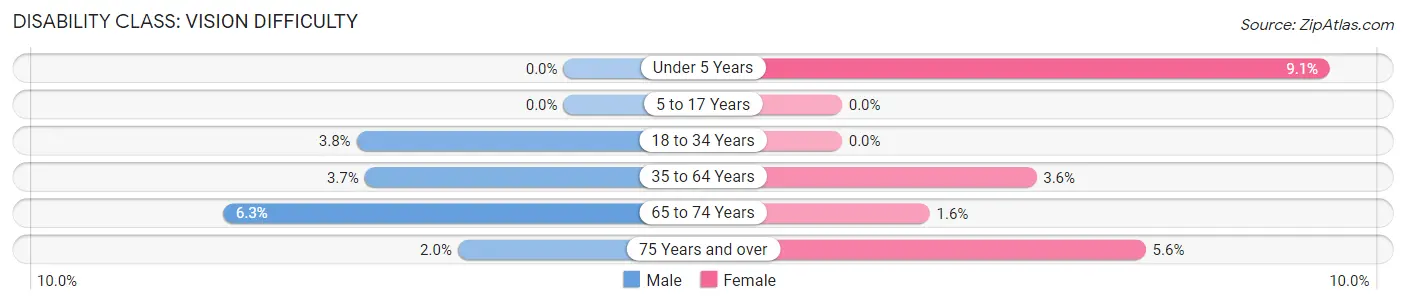
| Age Bracket | Male | Female |
| Under 5 Years | 0 (0.0%) | 53 (9.1%) |
| 5 to 17 Years | 0 (0.0%) | 0 (0.0%) |
| 18 to 34 Years | 52 (3.8%) | 0 (0.0%) |
| 35 to 64 Years | 92 (3.7%) | 105 (3.6%) |
| 65 to 74 Years | 44 (6.3%) | 14 (1.6%) |
| 75 Years and over | 8 (2.0%) | 40 (5.6%) |
Disability Class: Cognitive Difficulty
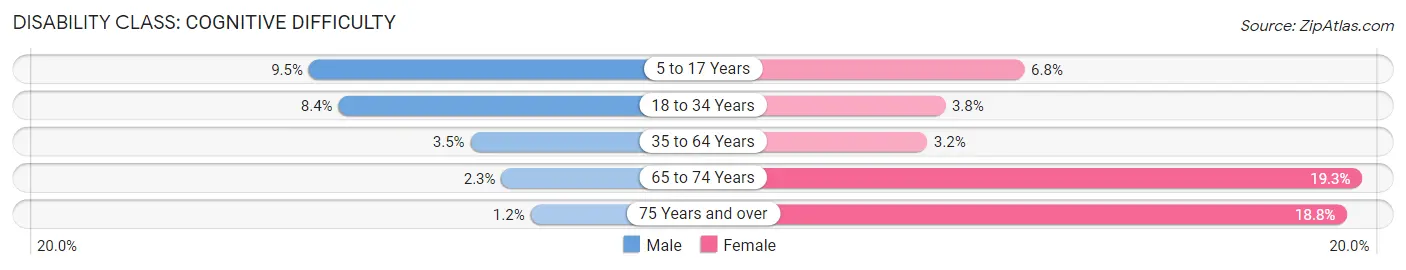
| Age Bracket | Male | Female |
| 5 to 17 Years | 128 (9.5%) | 82 (6.8%) |
| 18 to 34 Years | 113 (8.4%) | 53 (3.8%) |
| 35 to 64 Years | 86 (3.5%) | 92 (3.2%) |
| 65 to 74 Years | 16 (2.3%) | 166 (19.3%) |
| 75 Years and over | 5 (1.2%) | 133 (18.8%) |
Disability Class: Ambulatory Difficulty
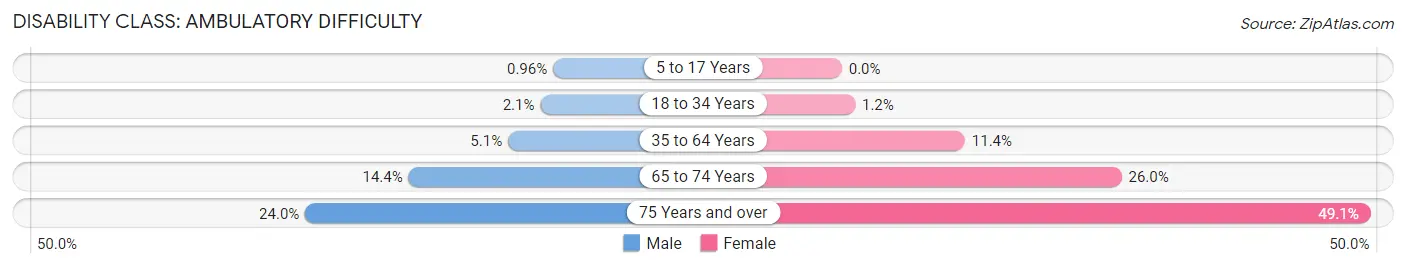
| Age Bracket | Male | Female |
| 5 to 17 Years | 13 (1.0%) | 0 (0.0%) |
| 18 to 34 Years | 29 (2.1%) | 17 (1.2%) |
| 35 to 64 Years | 128 (5.1%) | 332 (11.4%) |
| 65 to 74 Years | 100 (14.4%) | 223 (26.0%) |
| 75 Years and over | 98 (24.0%) | 348 (49.1%) |
Disability Class: Self-Care Difficulty
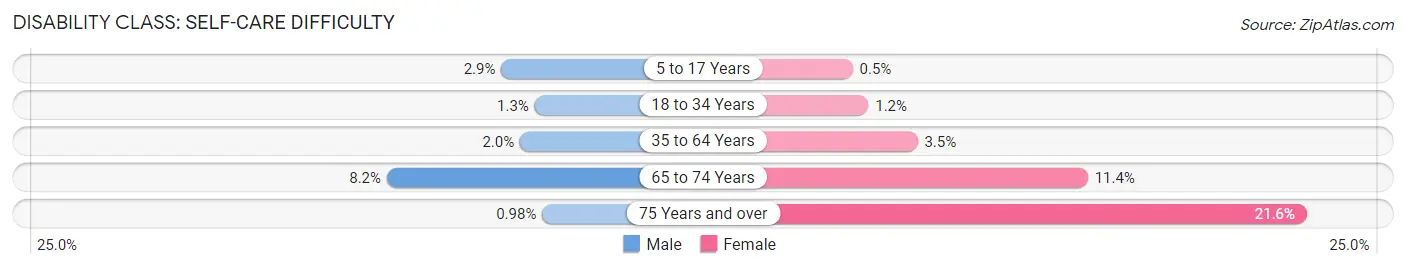
| Age Bracket | Male | Female |
| 5 to 17 Years | 39 (2.9%) | 6 (0.5%) |
| 18 to 34 Years | 18 (1.3%) | 17 (1.2%) |
| 35 to 64 Years | 50 (2.0%) | 102 (3.5%) |
| 65 to 74 Years | 57 (8.2%) | 98 (11.4%) |
| 75 Years and over | 4 (1.0%) | 153 (21.6%) |
Technology Access in Fort Payne
Computing Device Access in Fort Payne
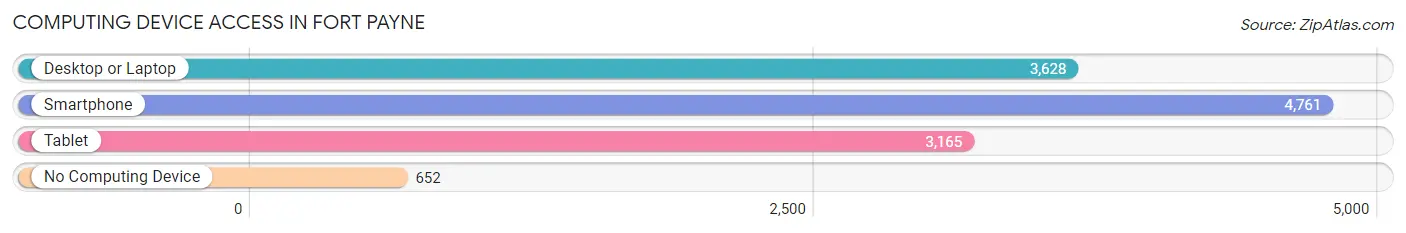
| Device Type | # Households | % Households |
| Desktop or Laptop | 3,628 | 62.4% |
| Smartphone | 4,761 | 81.9% |
| Tablet | 3,165 | 54.4% |
| No Computing Device | 652 | 11.2% |
| Total | 5,814 | 100.0% |
Internet Access in Fort Payne
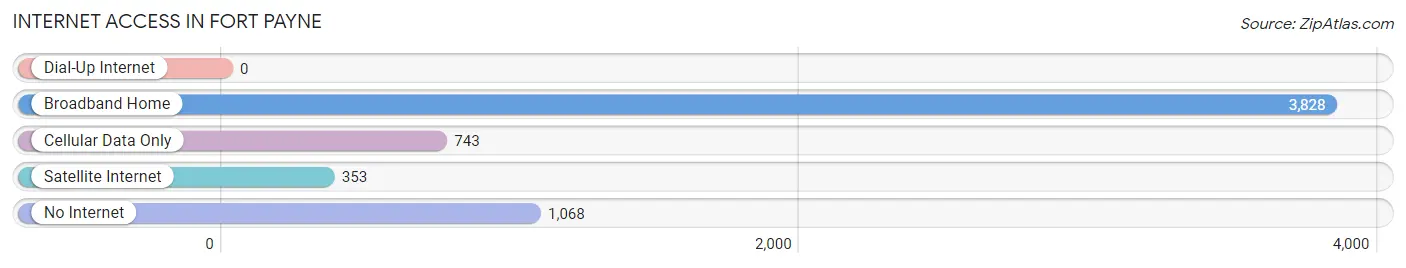
| Internet Type | # Households | % Households |
| Dial-Up Internet | 0 | 0.0% |
| Broadband Home | 3,828 | 65.8% |
| Cellular Data Only | 743 | 12.8% |
| Satellite Internet | 353 | 6.1% |
| No Internet | 1,068 | 18.4% |
| Total | 5,814 | 100.0% |
Fort Payne Summary
Payne, Alabama is a city located in DeKalb County, Alabama. It is the county seat of DeKalb County and is located in the foothills of the Appalachian Mountains. The city is situated along the banks of the Little River and is home to a population of approximately 14,000 people.
History
Payne, Alabama was founded in 1878 by a group of settlers from Georgia. The city was named after Major John Payne, a Revolutionary War veteran who had settled in the area in the early 1800s. The city was incorporated in 1891 and quickly became a center of commerce and industry in the region. The city was home to several cotton mills, a railroad, and a variety of other businesses.
In the early 1900s, Payne was a thriving city with a population of over 5,000 people. The city was home to a variety of businesses, including a cotton mill, a furniture factory, a canning factory, and a variety of other businesses. The city was also home to a variety of churches, schools, and other institutions.
In the late 1950s, the city began to decline as the cotton mills and other businesses began to close. The city’s population began to decline as well, and by the 1970s, the population had dropped to just over 4,000 people.
Geography
Payne, Alabama is located in the foothills of the Appalachian Mountains in the northeastern corner of DeKalb County. The city is situated along the banks of the Little River and is surrounded by rolling hills and forests. The city is located approximately 30 miles from Chattanooga, Tennessee and approximately 60 miles from Birmingham, Alabama.
The climate in Payne is generally mild, with temperatures ranging from the mid-50s in the winter to the mid-80s in the summer. The city receives an average of 48 inches of rain per year and is generally free of snowfall.
Economy
Payne, Alabama is home to a variety of businesses and industries. The city is home to several manufacturing plants, including a furniture factory, a canning factory, and a variety of other businesses. The city is also home to a variety of retail stores, restaurants, and other businesses.
The city is also home to a variety of educational institutions, including a community college, a technical college, and a variety of other schools. The city is also home to a variety of healthcare facilities, including a hospital and a variety of other medical facilities.
Demographics
As of the 2010 census, Payne, Alabama had a population of 14,000 people. The racial makeup of the city was 79.3% White, 17.2% African American, 0.3% Native American, 0.7% Asian, 0.1% Pacific Islander, and 2.4% from other races. The median household income in Payne was $35,000, and the median family income was $41,000.
Payne, Alabama is a small city with a rich history and a diverse population. The city is home to a variety of businesses and industries, as well as a variety of educational and healthcare facilities. The city is also home to a variety of churches, schools, and other institutions. Payne is a great place to live, work, and raise a family.
Common Questions
What is Per Capita Income in Fort Payne?
Per Capita income in Fort Payne is $26,436.
What is the Median Family Income in Fort Payne?
Median Family Income in Fort Payne is $55,465.
What is the Median Household income in Fort Payne?
Median Household Income in Fort Payne is $44,549.
What is Income or Wage Gap in Fort Payne?
Income or Wage Gap in Fort Payne is 30.7%.
Women in Fort Payne earn 69.3 cents for every dollar earned by a man.
What is Family Income Deficit in Fort Payne?
Family Income Deficit in Fort Payne is $9,073.
Families that are below poverty line in Fort Payne earn $9,073 less on average than the poverty threshold level.
What is Inequality or Gini Index in Fort Payne?
Inequality or Gini Index in Fort Payne is 0.49.
What is the Total Population of Fort Payne?
Total Population of Fort Payne is 14,815.
What is the Total Male Population of Fort Payne?
Total Male Population of Fort Payne is 7,054.
What is the Total Female Population of Fort Payne?
Total Female Population of Fort Payne is 7,761.
What is the Ratio of Males per 100 Females in Fort Payne?
There are 90.89 Males per 100 Females in Fort Payne.
What is the Ratio of Females per 100 Males in Fort Payne?
There are 110.02 Females per 100 Males in Fort Payne.
What is the Median Population Age in Fort Payne?
Median Population Age in Fort Payne is 39.7 Years.
What is the Average Family Size in Fort Payne
Average Family Size in Fort Payne is 3.2 People.
What is the Average Household Size in Fort Payne
Average Household Size in Fort Payne is 2.5 People.
How Large is the Labor Force in Fort Payne?
There are 6,376 People in the Labor Forcein in Fort Payne.
What is the Percentage of People in the Labor Force in Fort Payne?
55.3% of People are in the Labor Force in Fort Payne.
What is the Unemployment Rate in Fort Payne?
Unemployment Rate in Fort Payne is 6.1%.