Stewartville, AL Map & Demographics
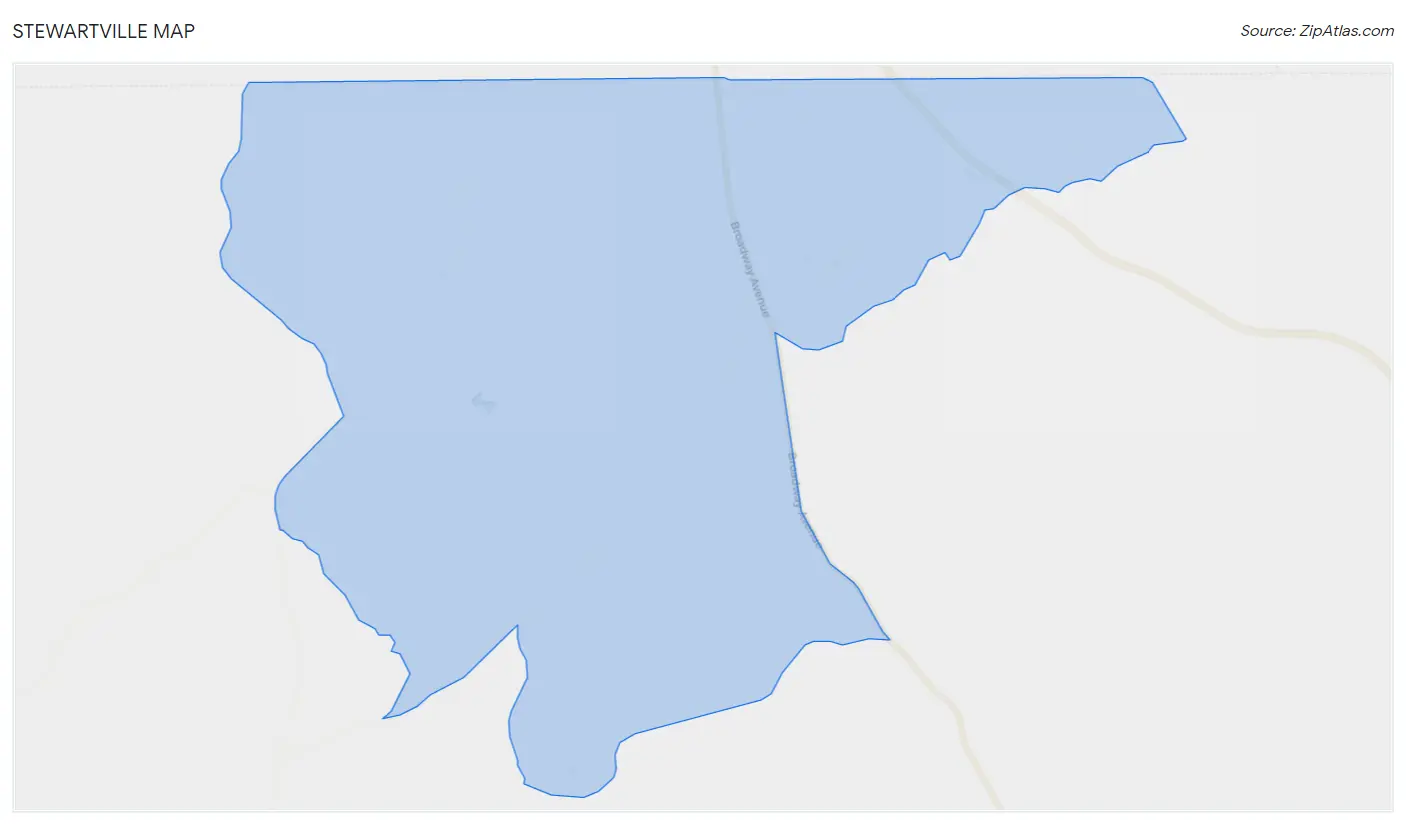
Stewartville Map
Stewartville Overview
$33,371
PER CAPITA INCOME
$83,429
AVG FAMILY INCOME
$59,000
AVG HOUSEHOLD INCOME
47.8%
WAGE / INCOME GAP [ % ]
52.2¢/ $1
WAGE / INCOME GAP [ $ ]
0.50
INEQUALITY / GINI INDEX
1,669
TOTAL POPULATION
789
MALE POPULATION
880
FEMALE POPULATION
89.66
MALES / 100 FEMALES
111.53
FEMALES / 100 MALES
50.0
MEDIAN AGE
3.1
AVG FAMILY SIZE
2.7
AVG HOUSEHOLD SIZE
757
LABOR FORCE [ PEOPLE ]
55.0%
PERCENT IN LABOR FORCE
1.6%
UNEMPLOYMENT RATE
Income in Stewartville
Income Overview in Stewartville
Per Capita Income in Stewartville is $33,371, while median incomes of families and households are $83,429 and $59,000 respectively.
| Characteristic | Number | Measure |
| Per Capita Income | 1,669 | $33,371 |
| Median Family Income | 494 | $83,429 |
| Mean Family Income | 494 | $116,400 |
| Median Household Income | 616 | $59,000 |
| Mean Household Income | 616 | $99,856 |
| Income Deficit | 494 | $0 |
| Wage / Income Gap (%) | 1,669 | 47.77% |
| Wage / Income Gap ($) | 1,669 | 52.23¢ per $1 |
| Gini / Inequality Index | 1,669 | 0.50 |
Earnings by Sex in Stewartville
Average Earnings in Stewartville are $32,298, $40,000 for men and $20,893 for women, a difference of 47.8%.
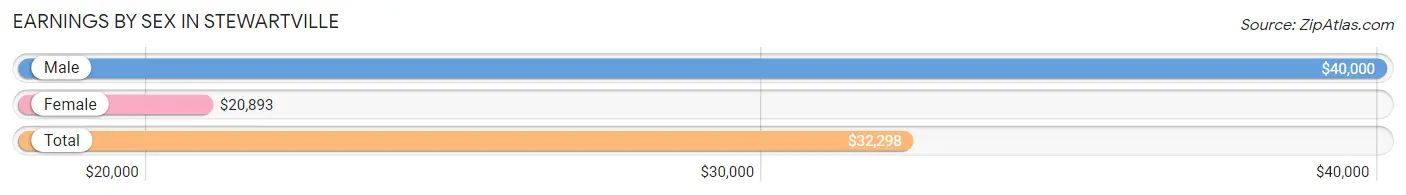
| Sex | Number | Average Earnings |
| Male | 408 (54.2%) | $40,000 |
| Female | 345 (45.8%) | $20,893 |
| Total | 753 (100.0%) | $32,298 |
Earnings by Sex by Income Bracket in Stewartville
The most common earnings brackets in Stewartville are $100,000+ for men (109 | 26.7%) and $5,000 to $7,499 for women (117 | 33.9%).
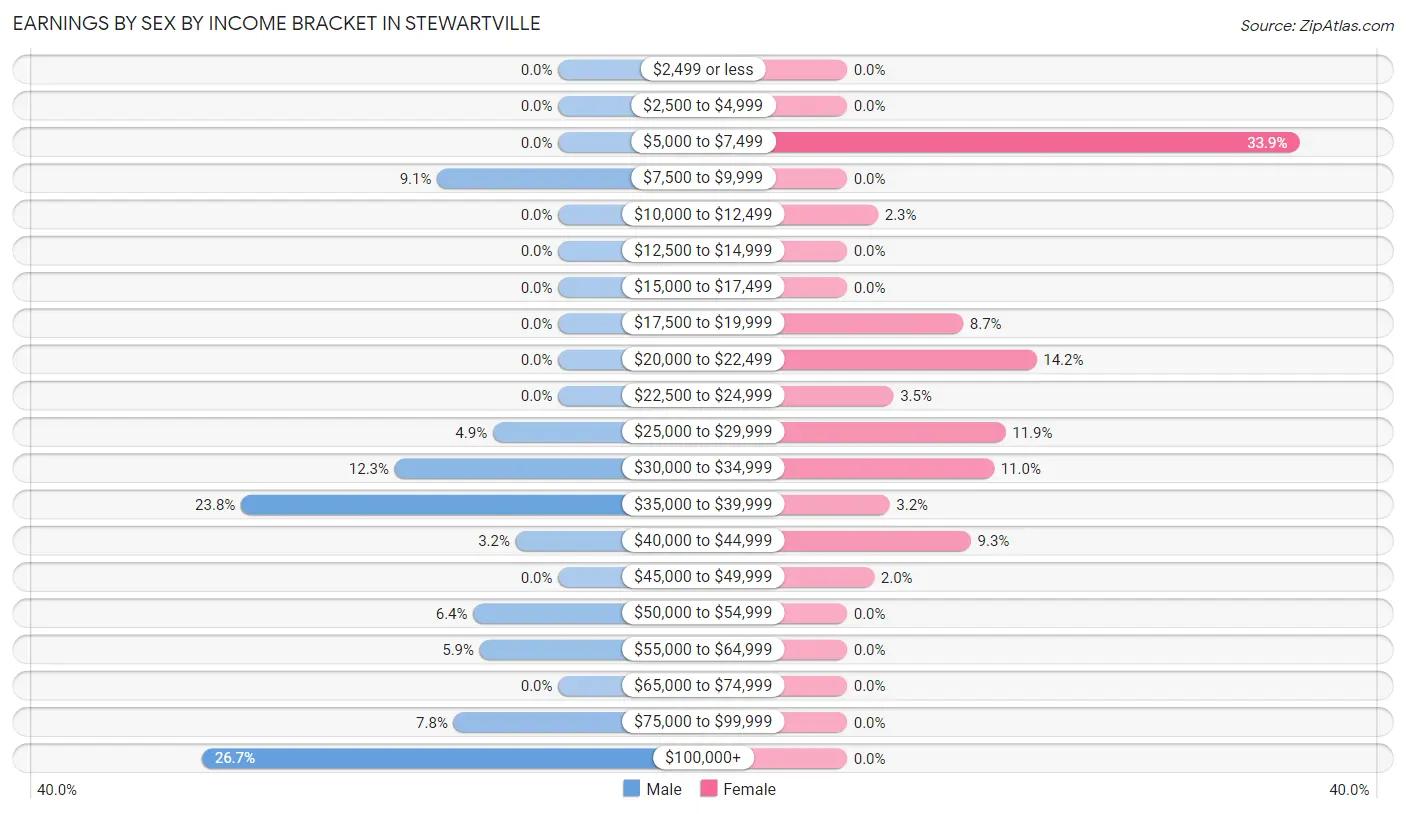
| Income | Male | Female |
| $2,499 or less | 0 (0.0%) | 0 (0.0%) |
| $2,500 to $4,999 | 0 (0.0%) | 0 (0.0%) |
| $5,000 to $7,499 | 0 (0.0%) | 117 (33.9%) |
| $7,500 to $9,999 | 37 (9.1%) | 0 (0.0%) |
| $10,000 to $12,499 | 0 (0.0%) | 8 (2.3%) |
| $12,500 to $14,999 | 0 (0.0%) | 0 (0.0%) |
| $15,000 to $17,499 | 0 (0.0%) | 0 (0.0%) |
| $17,500 to $19,999 | 0 (0.0%) | 30 (8.7%) |
| $20,000 to $22,499 | 0 (0.0%) | 49 (14.2%) |
| $22,500 to $24,999 | 0 (0.0%) | 12 (3.5%) |
| $25,000 to $29,999 | 20 (4.9%) | 41 (11.9%) |
| $30,000 to $34,999 | 50 (12.2%) | 38 (11.0%) |
| $35,000 to $39,999 | 97 (23.8%) | 11 (3.2%) |
| $40,000 to $44,999 | 13 (3.2%) | 32 (9.3%) |
| $45,000 to $49,999 | 0 (0.0%) | 7 (2.0%) |
| $50,000 to $54,999 | 26 (6.4%) | 0 (0.0%) |
| $55,000 to $64,999 | 24 (5.9%) | 0 (0.0%) |
| $65,000 to $74,999 | 0 (0.0%) | 0 (0.0%) |
| $75,000 to $99,999 | 32 (7.8%) | 0 (0.0%) |
| $100,000+ | 109 (26.7%) | 0 (0.0%) |
| Total | 408 (100.0%) | 345 (100.0%) |
Earnings by Sex by Educational Attainment in Stewartville
Average earnings in Stewartville are $40,000 for men and $20,789 for women, a difference of 48.0%. Men with an educational attainment of college or associate's degree enjoy the highest average annual earnings of $122,907, while those with high school diploma education earn the least with $36,395. Women with an educational attainment of high school diploma earn the most with the average annual earnings of $24,167, while those with high school diploma education have the smallest earnings of $24,167.
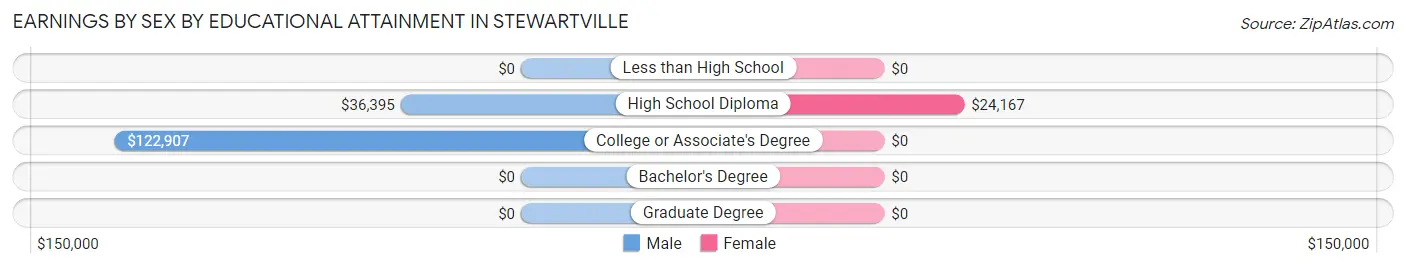
| Educational Attainment | Male Income | Female Income |
| Less than High School | - | - |
| High School Diploma | $36,395 | $24,167 |
| College or Associate's Degree | $122,907 | $0 |
| Bachelor's Degree | - | - |
| Graduate Degree | - | - |
| Total | $40,000 | $20,789 |
Family Income in Stewartville
Family Income Brackets in Stewartville
According to the Stewartville family income data, there are 139 families falling into the $100,000 to $149,999 income range, which is the most common income bracket and makes up 28.1% of all families.
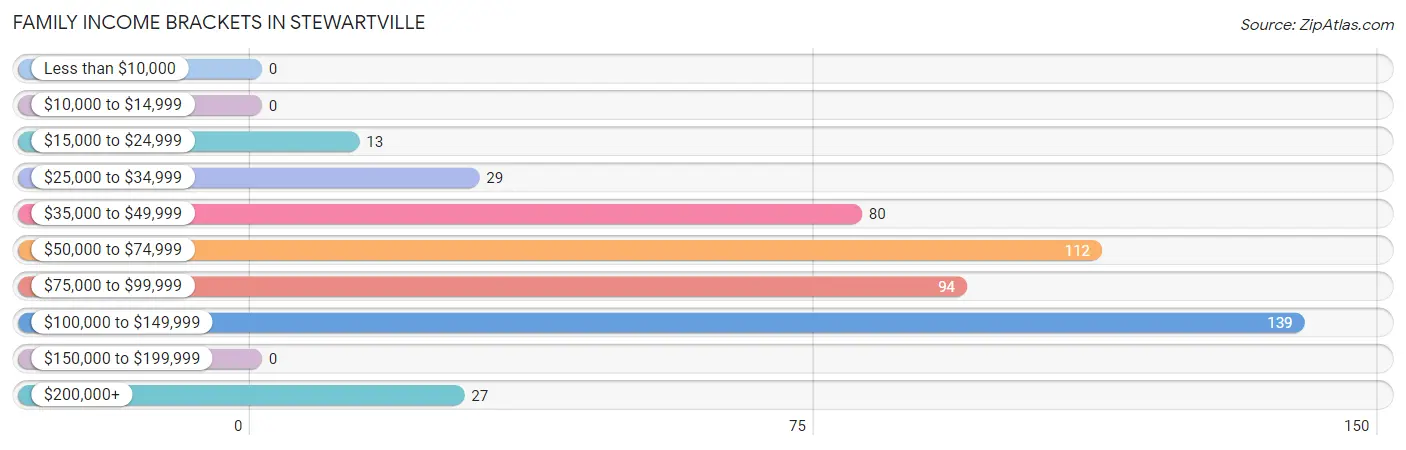
| Income Bracket | # Families | % Families |
| Less than $10,000 | 0 | 0.0% |
| $10,000 to $14,999 | 0 | 0.0% |
| $15,000 to $24,999 | 13 | 2.6% |
| $25,000 to $34,999 | 29 | 5.9% |
| $35,000 to $49,999 | 80 | 16.2% |
| $50,000 to $74,999 | 112 | 22.7% |
| $75,000 to $99,999 | 94 | 19.0% |
| $100,000 to $149,999 | 139 | 28.1% |
| $150,000 to $199,999 | 0 | 0.0% |
| $200,000+ | 27 | 5.5% |
Family Income by Famaliy Size in Stewartville
3-person families (156 | 31.6%) account for the highest median family income in Stewartville with $82,857 per family, while 2-person families (210 | 42.5%) have the highest median income of $29,312 per family member.
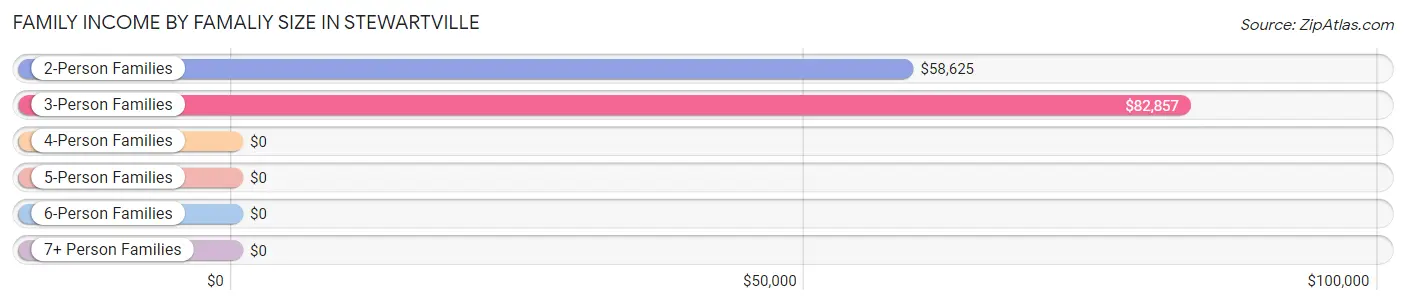
| Income Bracket | # Families | Median Income |
| 2-Person Families | 210 (42.5%) | $58,625 |
| 3-Person Families | 156 (31.6%) | $82,857 |
| 4-Person Families | 101 (20.4%) | $0 |
| 5-Person Families | 27 (5.5%) | $0 |
| 6-Person Families | 0 (0.0%) | $0 |
| 7+ Person Families | 0 (0.0%) | $0 |
| Total | 494 (100.0%) | $83,429 |
Family Income by Number of Earners in Stewartville
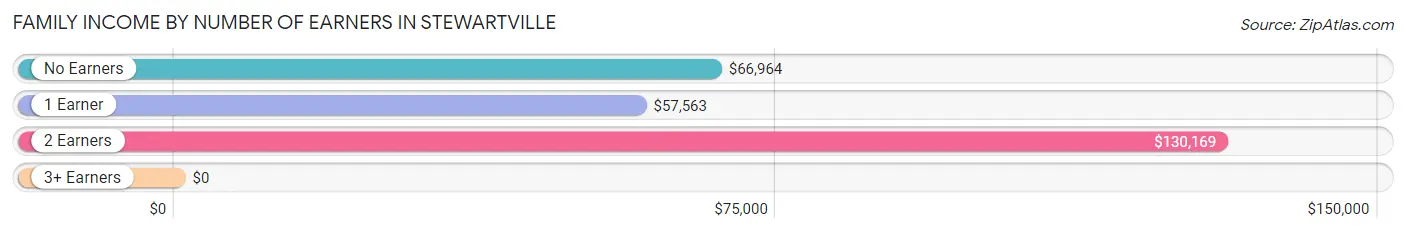
| Number of Earners | # Families | Median Income |
| No Earners | 59 (11.9%) | $66,964 |
| 1 Earner | 251 (50.8%) | $57,563 |
| 2 Earners | 166 (33.6%) | $130,169 |
| 3+ Earners | 18 (3.6%) | $0 |
| Total | 494 (100.0%) | $83,429 |
Household Income in Stewartville
Household Income Brackets in Stewartville
With 154 households falling in the category, the $100,000 to $149,999 income range is the most frequent in Stewartville, accounting for 25.0% of all households.
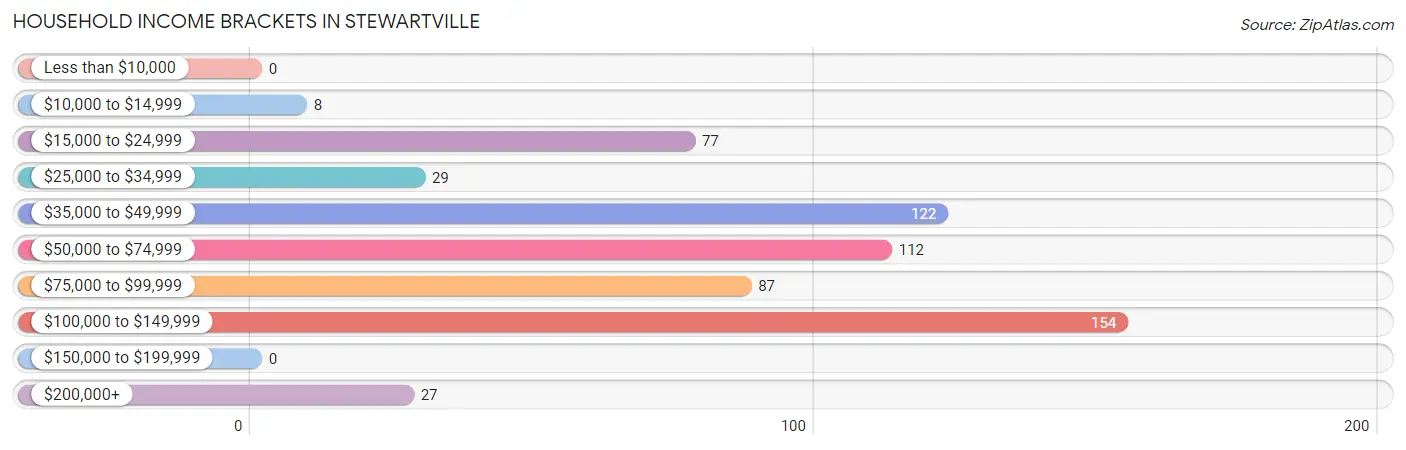
| Income Bracket | # Households | % Households |
| Less than $10,000 | 0 | 0.0% |
| $10,000 to $14,999 | 8 | 1.3% |
| $15,000 to $24,999 | 77 | 12.5% |
| $25,000 to $34,999 | 29 | 4.7% |
| $35,000 to $49,999 | 122 | 19.8% |
| $50,000 to $74,999 | 112 | 18.2% |
| $75,000 to $99,999 | 87 | 14.1% |
| $100,000 to $149,999 | 154 | 25.0% |
| $150,000 to $199,999 | 0 | 0.0% |
| $200,000+ | 27 | 4.4% |
Household Income by Householder Age in Stewartville
The median household income in Stewartville is $59,000, with the highest median household income of $130,112 found in the 25 to 44 years age bracket for the primary householder. A total of 170 households (27.6%) fall into this category. Meanwhile, the 15 to 24 years age bracket for the primary householder has the lowest median household income of $0, with 11 households (1.8%) in this group.
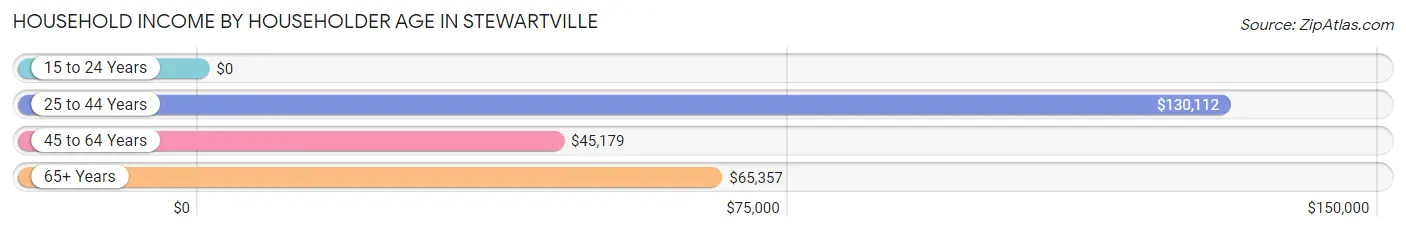
| Income Bracket | # Households | Median Income |
| 15 to 24 Years | 11 (1.8%) | $0 |
| 25 to 44 Years | 170 (27.6%) | $130,112 |
| 45 to 64 Years | 251 (40.7%) | $45,179 |
| 65+ Years | 184 (29.9%) | $65,357 |
| Total | 616 (100.0%) | $59,000 |
Poverty in Stewartville
Income Below Poverty by Sex and Age in Stewartville
With 1.0% poverty level for males and 0.9% for females among the residents of Stewartville, 55 to 64 year old males and 45 to 54 year old females are the most vulnerable to poverty, with 8 males (3.4%) and 8 females (11.1%) in their respective age groups living below the poverty level.
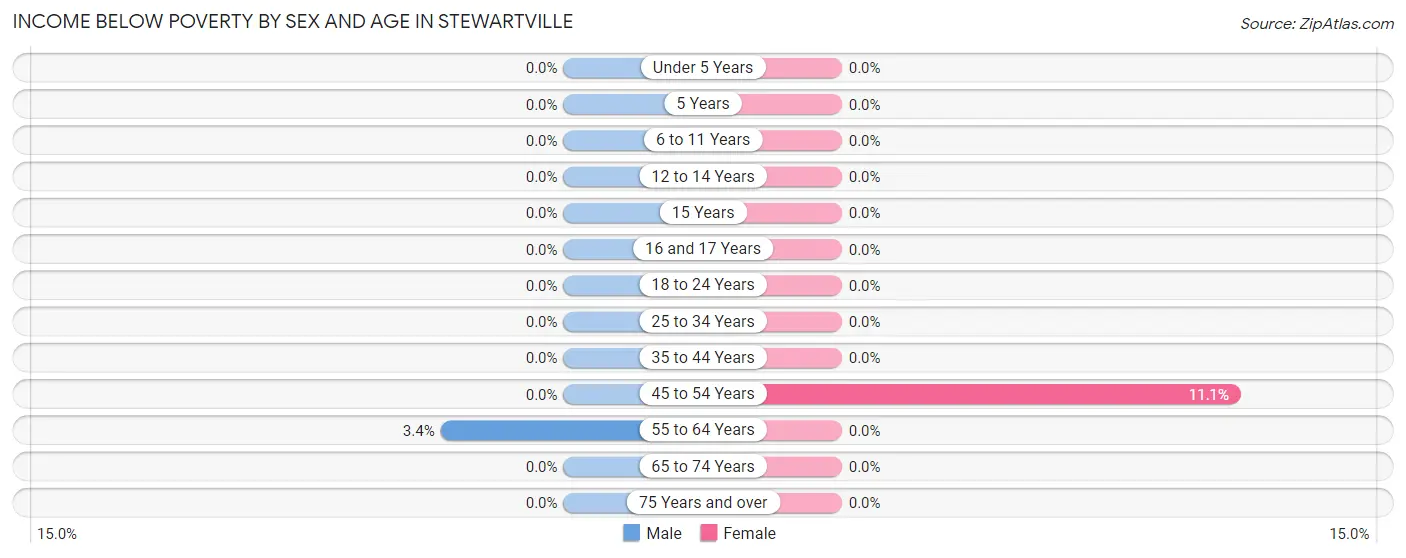
| Age Bracket | Male | Female |
| Under 5 Years | 0 (0.0%) | 0 (0.0%) |
| 5 Years | 0 (0.0%) | 0 (0.0%) |
| 6 to 11 Years | 0 (0.0%) | 0 (0.0%) |
| 12 to 14 Years | 0 (0.0%) | 0 (0.0%) |
| 15 Years | 0 (0.0%) | 0 (0.0%) |
| 16 and 17 Years | 0 (0.0%) | 0 (0.0%) |
| 18 to 24 Years | 0 (0.0%) | 0 (0.0%) |
| 25 to 34 Years | 0 (0.0%) | 0 (0.0%) |
| 35 to 44 Years | 0 (0.0%) | 0 (0.0%) |
| 45 to 54 Years | 0 (0.0%) | 8 (11.1%) |
| 55 to 64 Years | 8 (3.4%) | 0 (0.0%) |
| 65 to 74 Years | 0 (0.0%) | 0 (0.0%) |
| 75 Years and over | 0 (0.0%) | 0 (0.0%) |
| Total | 8 (1.0%) | 8 (0.9%) |
Income Above Poverty by Sex and Age in Stewartville
According to the poverty statistics in Stewartville, males aged under 5 years and females aged under 5 years are the age groups that are most secure financially, with 100.0% of males and 100.0% of females in these age groups living above the poverty line.
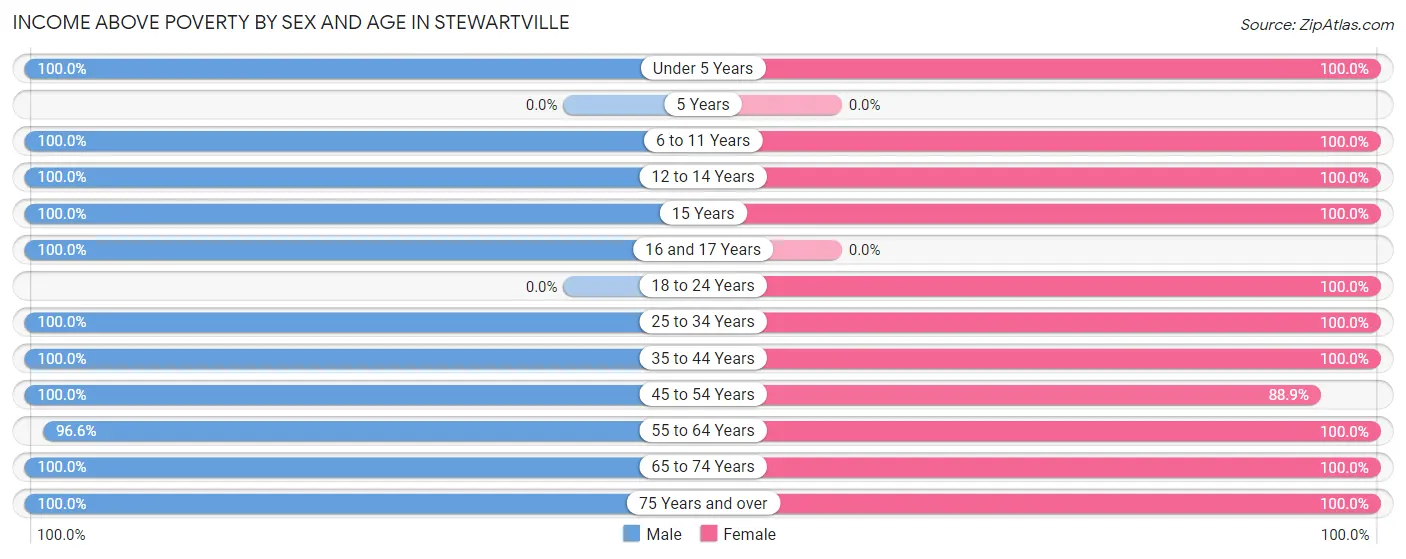
| Age Bracket | Male | Female |
| Under 5 Years | 44 (100.0%) | 37 (100.0%) |
| 5 Years | 0 (0.0%) | 0 (0.0%) |
| 6 to 11 Years | 62 (100.0%) | 21 (100.0%) |
| 12 to 14 Years | 14 (100.0%) | 70 (100.0%) |
| 15 Years | 20 (100.0%) | 24 (100.0%) |
| 16 and 17 Years | 7 (100.0%) | 0 (0.0%) |
| 18 to 24 Years | 0 (0.0%) | 35 (100.0%) |
| 25 to 34 Years | 73 (100.0%) | 29 (100.0%) |
| 35 to 44 Years | 117 (100.0%) | 201 (100.0%) |
| 45 to 54 Years | 41 (100.0%) | 64 (88.9%) |
| 55 to 64 Years | 226 (96.6%) | 154 (100.0%) |
| 65 to 74 Years | 74 (100.0%) | 116 (100.0%) |
| 75 Years and over | 103 (100.0%) | 121 (100.0%) |
| Total | 781 (99.0%) | 872 (99.1%) |
Income Below Poverty Among Married-Couple Families in Stewartville
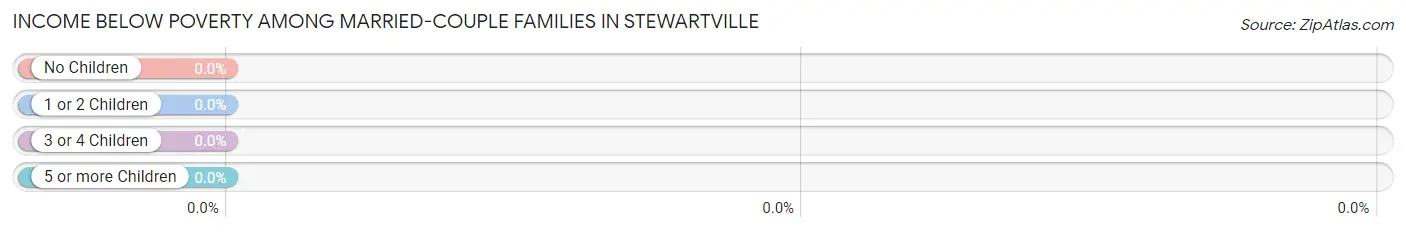
| Children | Above Poverty | Below Poverty |
| No Children | 275 (100.0%) | 0 (0.0%) |
| 1 or 2 Children | 151 (100.0%) | 0 (0.0%) |
| 3 or 4 Children | 9 (100.0%) | 0 (0.0%) |
| 5 or more Children | 0 (0.0%) | 0 (0.0%) |
| Total | 435 (100.0%) | 0 (0.0%) |
Income Below Poverty Among Single-Parent Households in Stewartville
| Children | Single Father | Single Mother |
| No Children | 0 (0.0%) | 0 (0.0%) |
| 1 or 2 Children | 0 (0.0%) | 0 (0.0%) |
| 3 or 4 Children | 0 (0.0%) | 0 (0.0%) |
| 5 or more Children | 0 (0.0%) | 0 (0.0%) |
| Total | 0 (0.0%) | 0 (0.0%) |
Income Below Poverty Among Married-Couple vs Single-Parent Households in Stewartville
| Children | Married-Couple Families | Single-Parent Households |
| No Children | 0 (0.0%) | 0 (0.0%) |
| 1 or 2 Children | 0 (0.0%) | 0 (0.0%) |
| 3 or 4 Children | 0 (0.0%) | 0 (0.0%) |
| 5 or more Children | 0 (0.0%) | 0 (0.0%) |
| Total | 0 (0.0%) | 0 (0.0%) |
Race in Stewartville
The most populous races in Stewartville are White / Caucasian (1,647 | 98.7%), and Black / African American (22 | 1.3%).
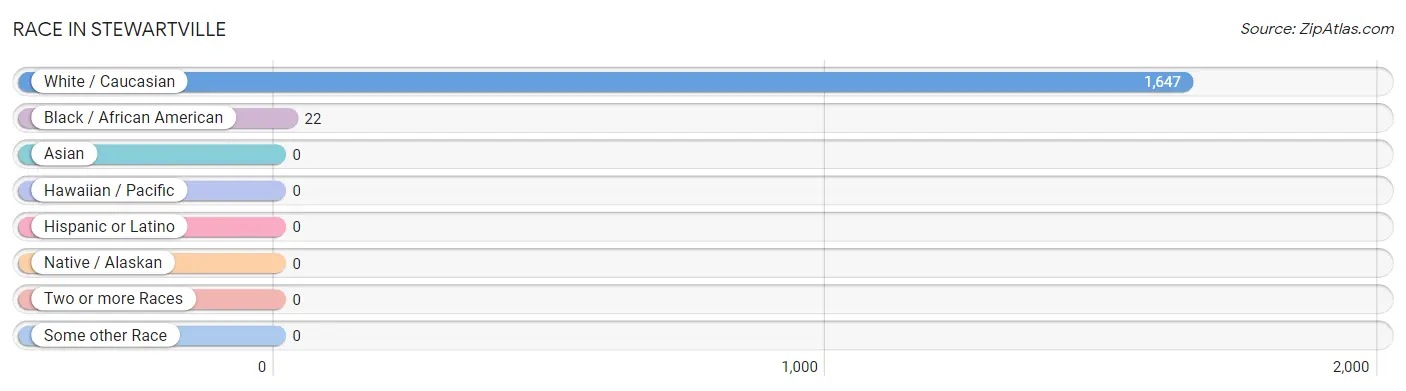
| Race | # Population | % Population |
| Asian | 0 | 0.0% |
| Black / African American | 22 | 1.3% |
| Hawaiian / Pacific | 0 | 0.0% |
| Hispanic or Latino | 0 | 0.0% |
| Native / Alaskan | 0 | 0.0% |
| White / Caucasian | 1,647 | 98.7% |
| Two or more Races | 0 | 0.0% |
| Some other Race | 0 | 0.0% |
| Total | 1,669 | 100.0% |
Ancestry in Stewartville
The most populous ancestries reported in Stewartville are American (295 | 17.7%), English (284 | 17.0%), Irish (255 | 15.3%), Celtic (43 | 2.6%), and South African (32 | 1.9%), together accounting for 54.5% of all Stewartville residents.
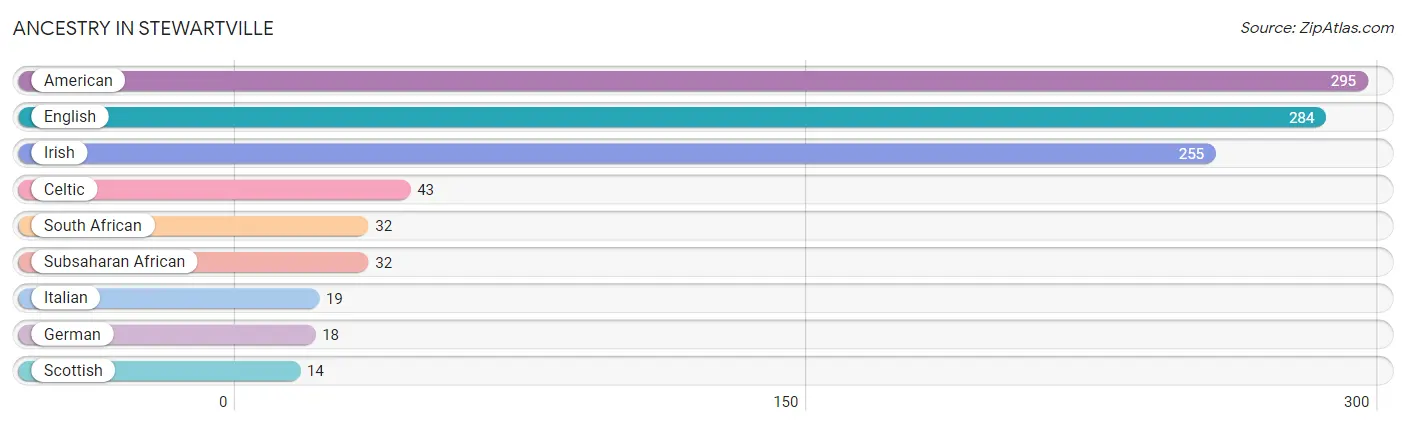
| Ancestry | # Population | % Population |
| American | 295 | 17.7% |
| Celtic | 43 | 2.6% |
| English | 284 | 17.0% |
| German | 18 | 1.1% |
| Irish | 255 | 15.3% |
| Italian | 19 | 1.1% |
| Scottish | 14 | 0.8% |
| South African | 32 | 1.9% |
| Subsaharan African | 32 | 1.9% | View All 9 Rows |
Immigrants in Stewartville

| Immigration Origin | # Population | % Population | View All 0 Rows |
Sex and Age in Stewartville
Sex and Age in Stewartville
The most populous age groups in Stewartville are 55 to 59 Years (199 | 25.2%) for men and 40 to 44 Years (159 | 18.1%) for women.
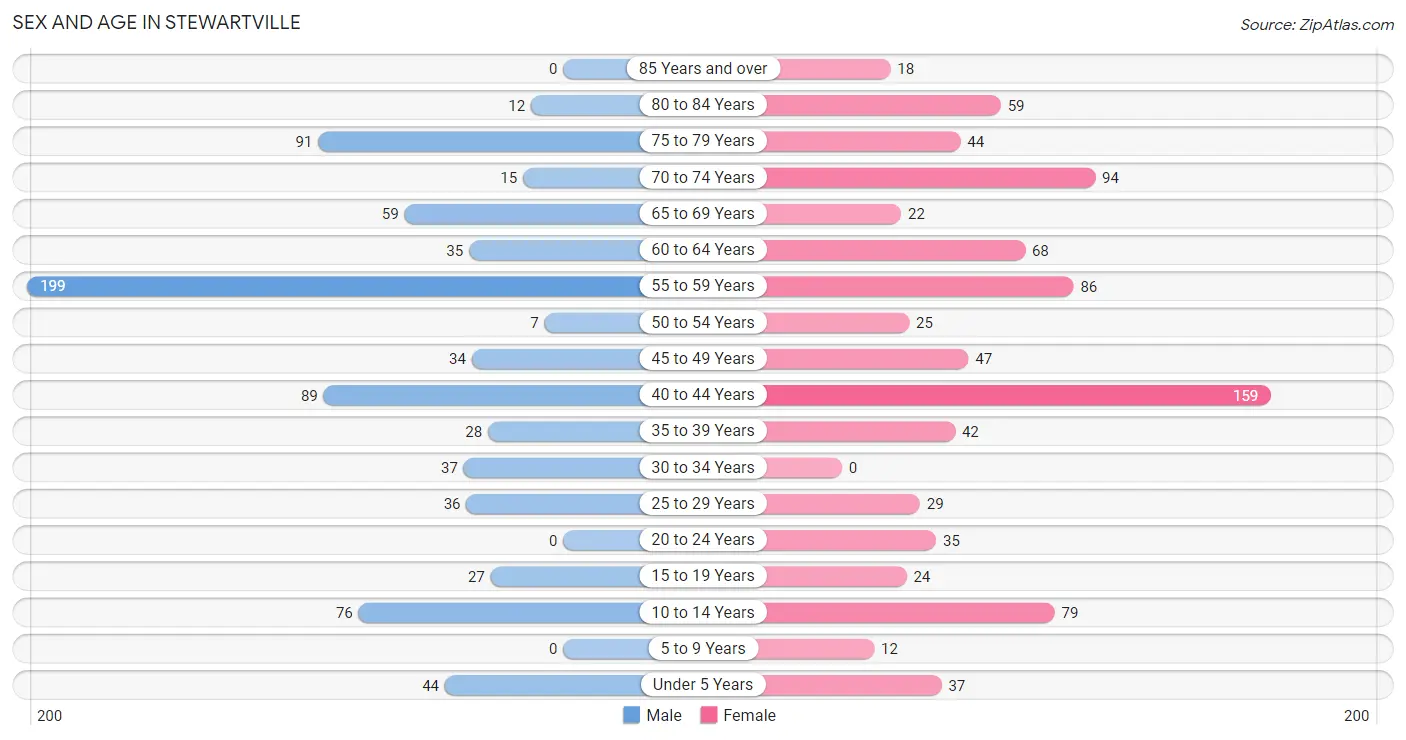
| Age Bracket | Male | Female |
| Under 5 Years | 44 (5.6%) | 37 (4.2%) |
| 5 to 9 Years | 0 (0.0%) | 12 (1.4%) |
| 10 to 14 Years | 76 (9.6%) | 79 (9.0%) |
| 15 to 19 Years | 27 (3.4%) | 24 (2.7%) |
| 20 to 24 Years | 0 (0.0%) | 35 (4.0%) |
| 25 to 29 Years | 36 (4.6%) | 29 (3.3%) |
| 30 to 34 Years | 37 (4.7%) | 0 (0.0%) |
| 35 to 39 Years | 28 (3.5%) | 42 (4.8%) |
| 40 to 44 Years | 89 (11.3%) | 159 (18.1%) |
| 45 to 49 Years | 34 (4.3%) | 47 (5.3%) |
| 50 to 54 Years | 7 (0.9%) | 25 (2.8%) |
| 55 to 59 Years | 199 (25.2%) | 86 (9.8%) |
| 60 to 64 Years | 35 (4.4%) | 68 (7.7%) |
| 65 to 69 Years | 59 (7.5%) | 22 (2.5%) |
| 70 to 74 Years | 15 (1.9%) | 94 (10.7%) |
| 75 to 79 Years | 91 (11.5%) | 44 (5.0%) |
| 80 to 84 Years | 12 (1.5%) | 59 (6.7%) |
| 85 Years and over | 0 (0.0%) | 18 (2.1%) |
| Total | 789 (100.0%) | 880 (100.0%) |
Families and Households in Stewartville
Median Family Size in Stewartville
The median family size in Stewartville is 3.07 persons per family, with married-couple families (435 | 88.1%) accounting for the largest median family size of 3.08 persons per family. On the other hand, single male/father families (7 | 1.4%) represent the smallest median family size with 2.86 persons per family.
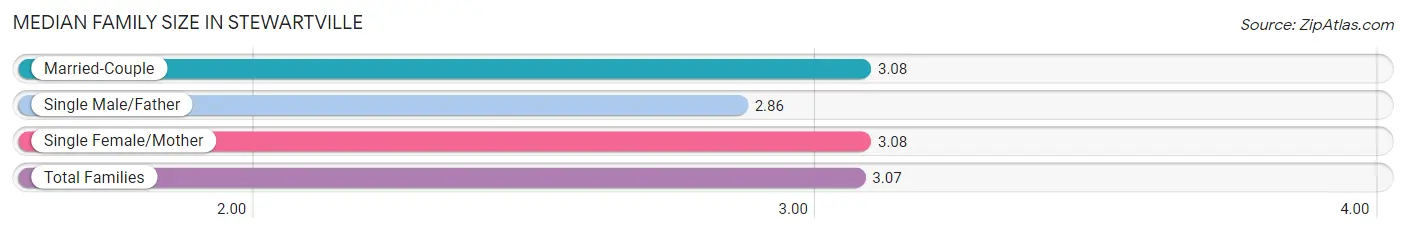
| Family Type | # Families | Family Size |
| Married-Couple | 435 (88.1%) | 3.08 |
| Single Male/Father | 7 (1.4%) | 2.86 |
| Single Female/Mother | 52 (10.5%) | 3.08 |
| Total Families | 494 (100.0%) | 3.07 |
Median Household Size in Stewartville
The median household size in Stewartville is 2.71 persons per household, with married-couple households (435 | 70.6%) accounting for the largest median household size of 3.12 persons per household. non-family households (122 | 19.8%) represent the smallest median household size with 1.07 persons per household.
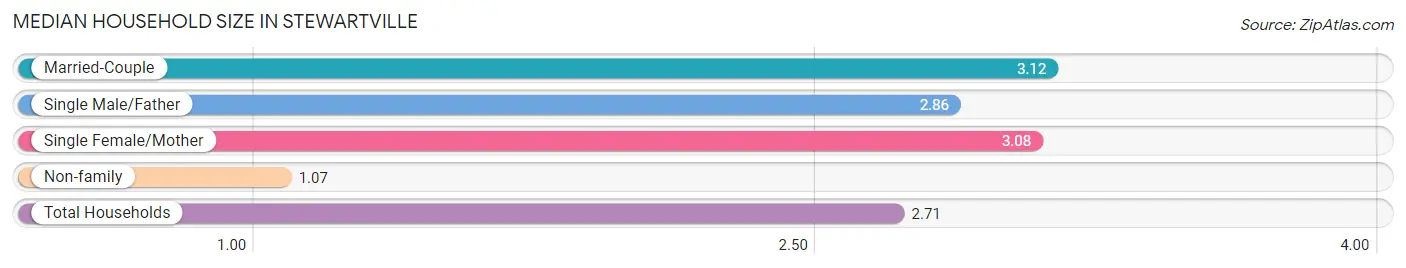
| Household Type | # Households | Household Size |
| Married-Couple | 435 (70.6%) | 3.12 |
| Single Male/Father | 7 (1.1%) | 2.86 |
| Single Female/Mother | 52 (8.4%) | 3.08 |
| Non-family | 122 (19.8%) | 1.07 |
| Total Households | 616 (100.0%) | 2.71 |
Household Size by Marriage Status in Stewartville
Out of a total of 616 households in Stewartville, 494 (80.2%) are family households, while 122 (19.8%) are nonfamily households. The most numerous type of family households are 2-person households, comprising 210, and the most common type of nonfamily households are 1-person households, comprising 114.
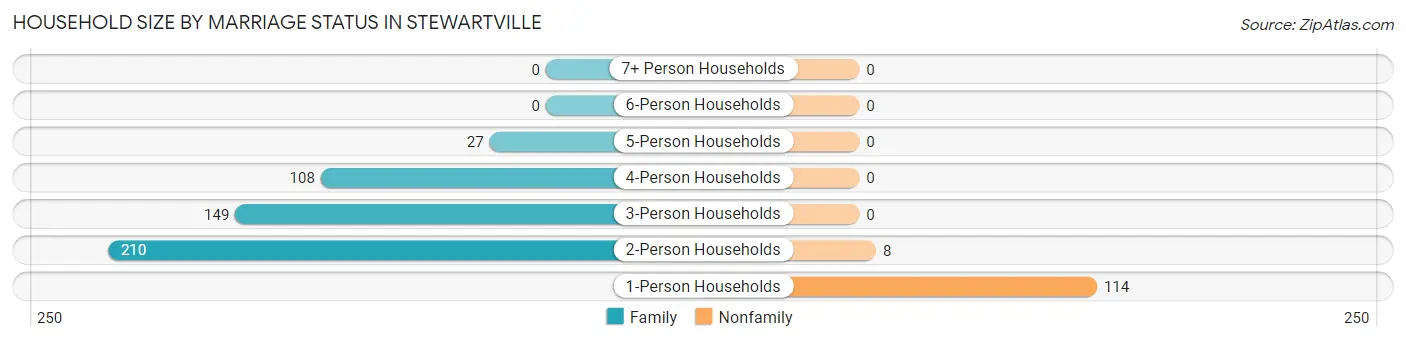
| Household Size | Family Households | Nonfamily Households |
| 1-Person Households | - | 114 (18.5%) |
| 2-Person Households | 210 (34.1%) | 8 (1.3%) |
| 3-Person Households | 149 (24.2%) | 0 (0.0%) |
| 4-Person Households | 108 (17.5%) | 0 (0.0%) |
| 5-Person Households | 27 (4.4%) | 0 (0.0%) |
| 6-Person Households | 0 (0.0%) | 0 (0.0%) |
| 7+ Person Households | 0 (0.0%) | 0 (0.0%) |
| Total | 494 (80.2%) | 122 (19.8%) |
Female Fertility in Stewartville
Fertility by Age in Stewartville
Average fertility rate in Stewartville is 54.0 births per 1,000 women. Women in the age bracket of 35 to 50 years have the highest fertility rate with 71.0 births per 1,000 women. Women in the age bracket of 35 to 50 years acount for 100.0% of all women with births.
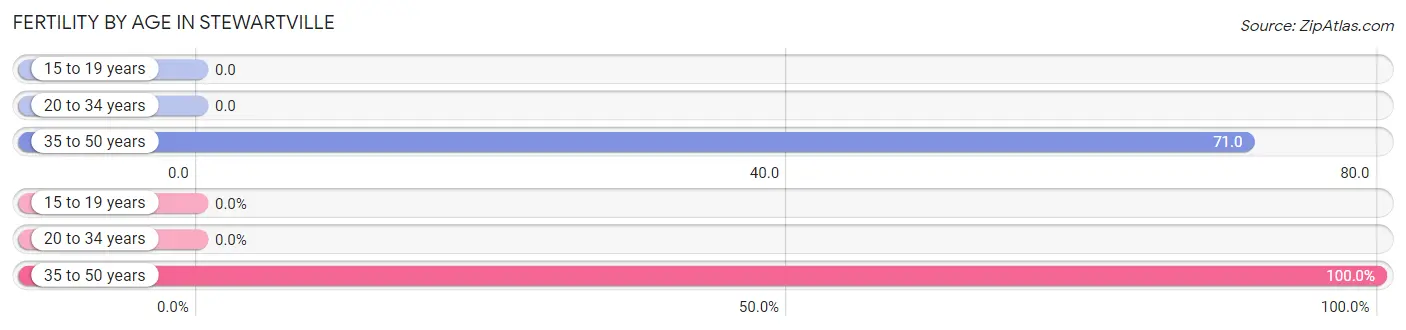
| Age Bracket | Women with Births | Births / 1,000 Women |
| 15 to 19 years | 0 (0.0%) | 0.0 |
| 20 to 34 years | 0 (0.0%) | 0.0 |
| 35 to 50 years | 19 (100.0%) | 71.0 |
| Total | 19 (100.0%) | 54.0 |
Fertility by Age by Marriage Status in Stewartville
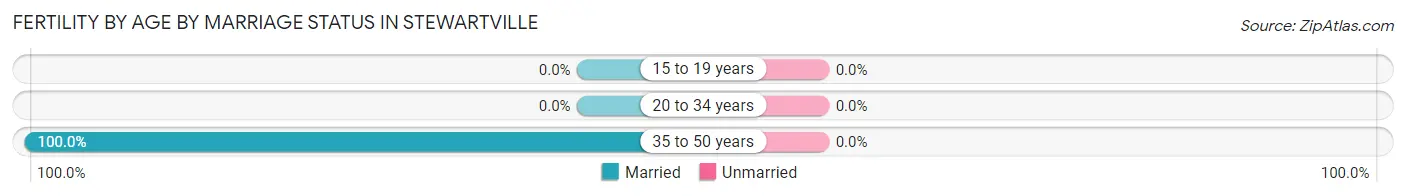
| Age Bracket | Married | Unmarried |
| 15 to 19 years | 0 (0.0%) | 0 (0.0%) |
| 20 to 34 years | 0 (0.0%) | 0 (0.0%) |
| 35 to 50 years | 19 (100.0%) | 0 (0.0%) |
| Total | 19 (100.0%) | 0 (0.0%) |
Fertility by Education in Stewartville
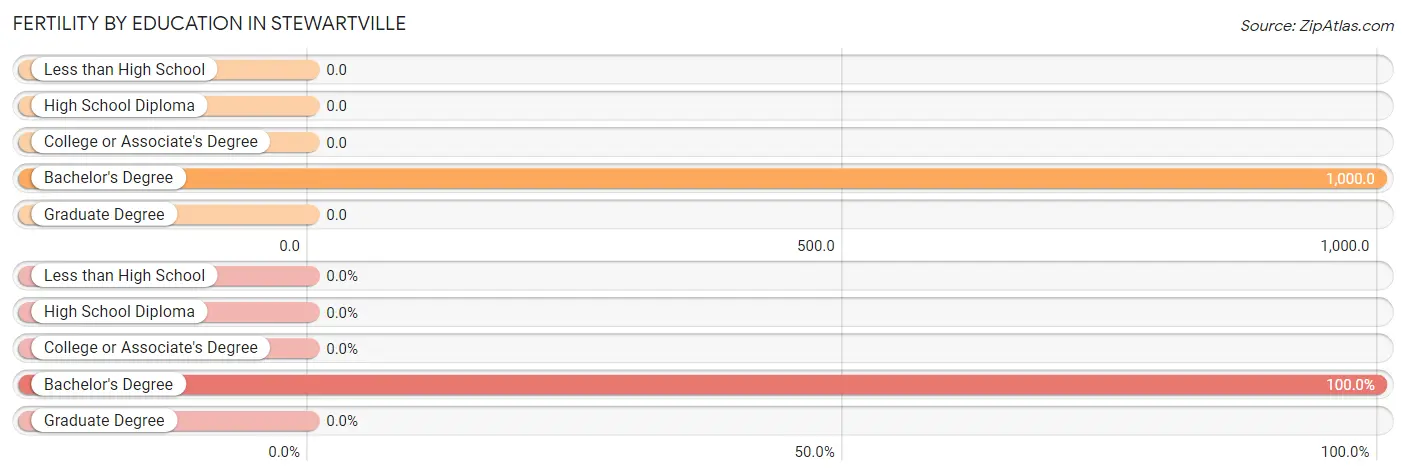
| Educational Attainment | Women with Births | Births / 1,000 Women |
| Less than High School | 0 (0.0%) | 0.0 |
| High School Diploma | 0 (0.0%) | 0.0 |
| College or Associate's Degree | 0 (0.0%) | 0.0 |
| Bachelor's Degree | 19 (100.0%) | 1,000.0 |
| Graduate Degree | 0 (0.0%) | 0.0 |
| Total | 19 (100.0%) | 54.0 |
Fertility by Education by Marriage Status in Stewartville
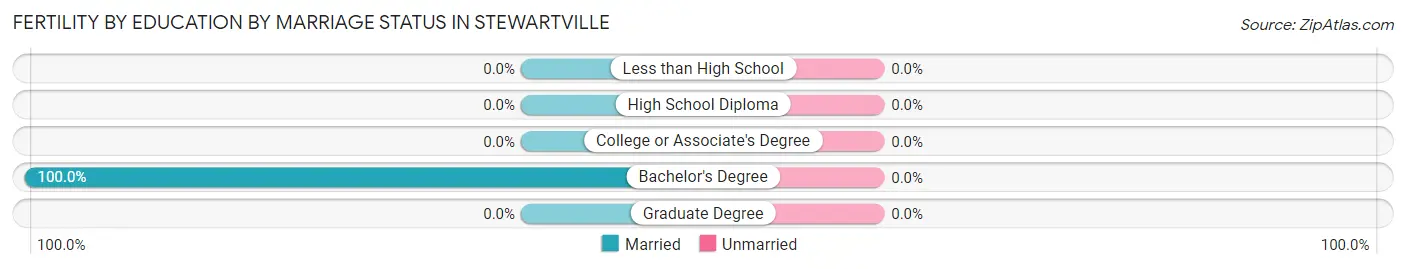
| Educational Attainment | Married | Unmarried |
| Less than High School | 0 (0.0%) | 0 (0.0%) |
| High School Diploma | 0 (0.0%) | 0 (0.0%) |
| College or Associate's Degree | 0 (0.0%) | 0 (0.0%) |
| Bachelor's Degree | 19 (100.0%) | 0 (0.0%) |
| Graduate Degree | 0 (0.0%) | 0 (0.0%) |
| Total | 19 (100.0%) | 0 (0.0%) |
Employment Characteristics in Stewartville
Employment by Class of Employer in Stewartville
Among the 745 employed individuals in Stewartville, private company employees (549 | 73.7%), self-employed (not incorporated) (124 | 16.6%), and not-for-profit organizations (30 | 4.0%) make up the most common classes of employment.
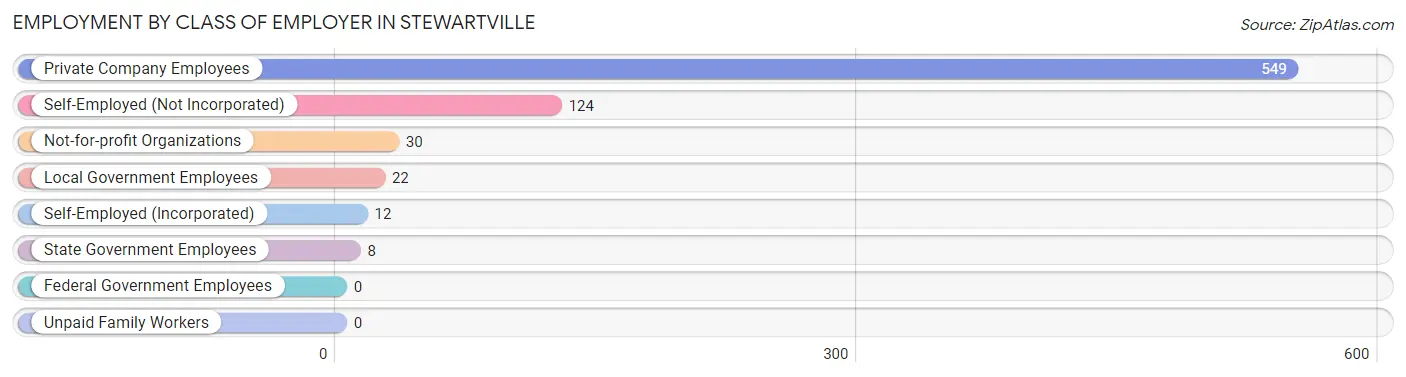
| Employer Class | # Employees | % Employees |
| Private Company Employees | 549 | 73.7% |
| Self-Employed (Incorporated) | 12 | 1.6% |
| Self-Employed (Not Incorporated) | 124 | 16.6% |
| Not-for-profit Organizations | 30 | 4.0% |
| Local Government Employees | 22 | 2.9% |
| State Government Employees | 8 | 1.1% |
| Federal Government Employees | 0 | 0.0% |
| Unpaid Family Workers | 0 | 0.0% |
| Total | 745 | 100.0% |
Employment Status by Age in Stewartville
According to the labor force statistics for Stewartville, out of the total population over 16 years of age (1,377), 55.0% or 757 individuals are in the labor force, with 1.6% or 12 of them unemployed. The age group with the highest labor force participation rate is 30 to 34 years, with 100.0% or 37 individuals in the labor force. Within the labor force, the 35 to 44 years age range has the highest percentage of unemployed individuals, with 3.9% or 12 of them being unemployed.
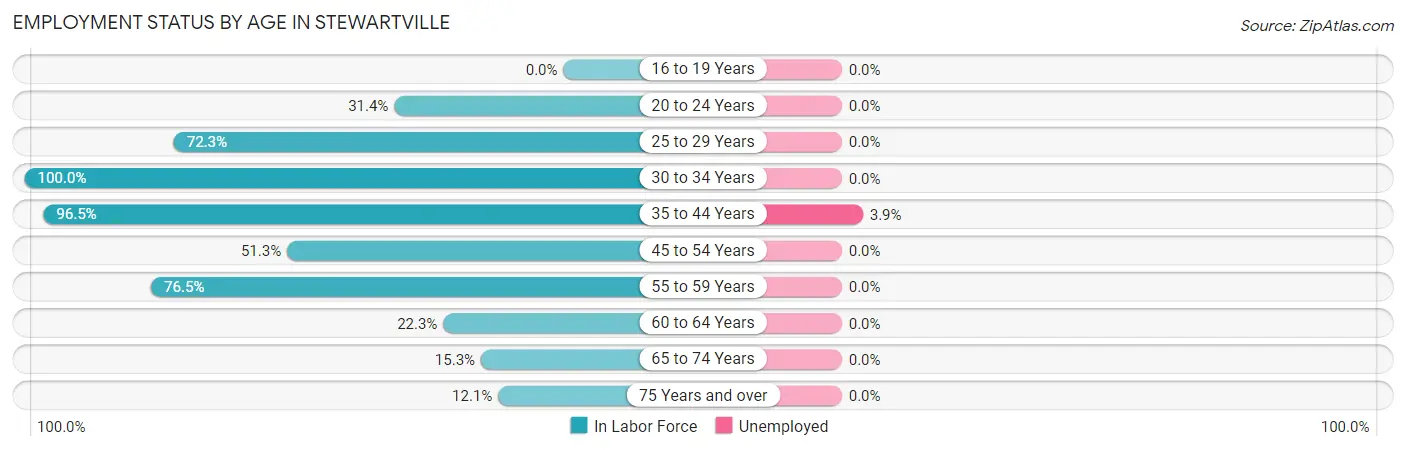
| Age Bracket | In Labor Force | Unemployed |
| 16 to 19 Years | 0 (0.0%) | 0 (0.0%) |
| 20 to 24 Years | 11 (31.4%) | 0 (0.0%) |
| 25 to 29 Years | 47 (72.3%) | 0 (0.0%) |
| 30 to 34 Years | 37 (100.0%) | 0 (0.0%) |
| 35 to 44 Years | 307 (96.5%) | 12 (3.9%) |
| 45 to 54 Years | 58 (51.3%) | 0 (0.0%) |
| 55 to 59 Years | 218 (76.5%) | 0 (0.0%) |
| 60 to 64 Years | 23 (22.3%) | 0 (0.0%) |
| 65 to 74 Years | 29 (15.3%) | 0 (0.0%) |
| 75 Years and over | 27 (12.1%) | 0 (0.0%) |
| Total | 757 (55.0%) | 12 (1.6%) |
Employment Status by Educational Attainment in Stewartville
According to labor force statistics for Stewartville, 74.9% of individuals (690) out of the total population between 25 and 64 years of age (921) are in the labor force, with 1.7% or 12 of them being unemployed. The group with the highest labor force participation rate are those with the educational attainment of high school diploma, with 86.7% or 281 individuals in the labor force. Within the labor force, individuals with college / associate degree education have the highest percentage of unemployment, with 3.3% or 12 of them being unemployed.
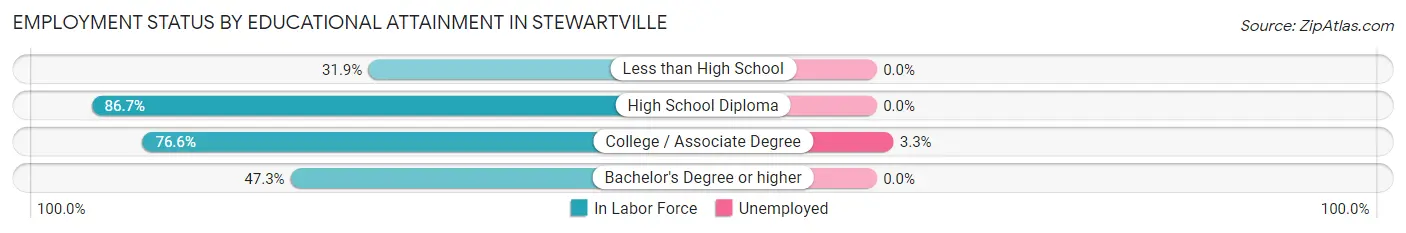
| Educational Attainment | In Labor Force | Unemployed |
| Less than High School | 23 (31.9%) | 0 (0.0%) |
| High School Diploma | 281 (86.7%) | 0 (0.0%) |
| College / Associate Degree | 360 (76.6%) | 16 (3.3%) |
| Bachelor's Degree or higher | 26 (47.3%) | 0 (0.0%) |
| Total | 690 (74.9%) | 16 (1.7%) |
Employment Occupations by Sex in Stewartville
Management, Business, Science and Arts Occupations
The most common Management, Business, Science and Arts occupations in Stewartville are Health Diagnosing & Treating (49 | 6.6%), Management (31 | 4.2%), Health Technologists (19 | 2.5%), Business & Financial (9 | 1.2%), and Computers, Engineering & Science (9 | 1.2%).
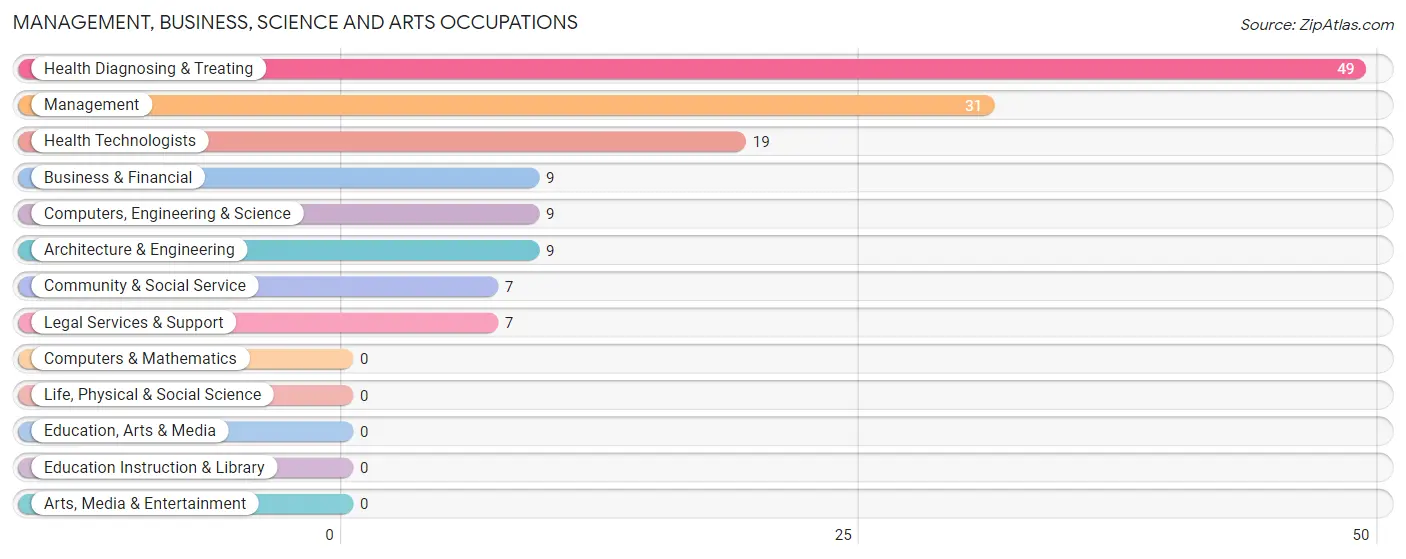
Management, Business, Science and Arts Occupations by Sex
Within the Management, Business, Science and Arts occupations in Stewartville, the most male-oriented occupations are Business & Financial (100.0%), Computers, Engineering & Science (100.0%), and Architecture & Engineering (100.0%), while the most female-oriented occupations are Community & Social Service (100.0%), Legal Services & Support (100.0%), and Health Diagnosing & Treating (61.2%).
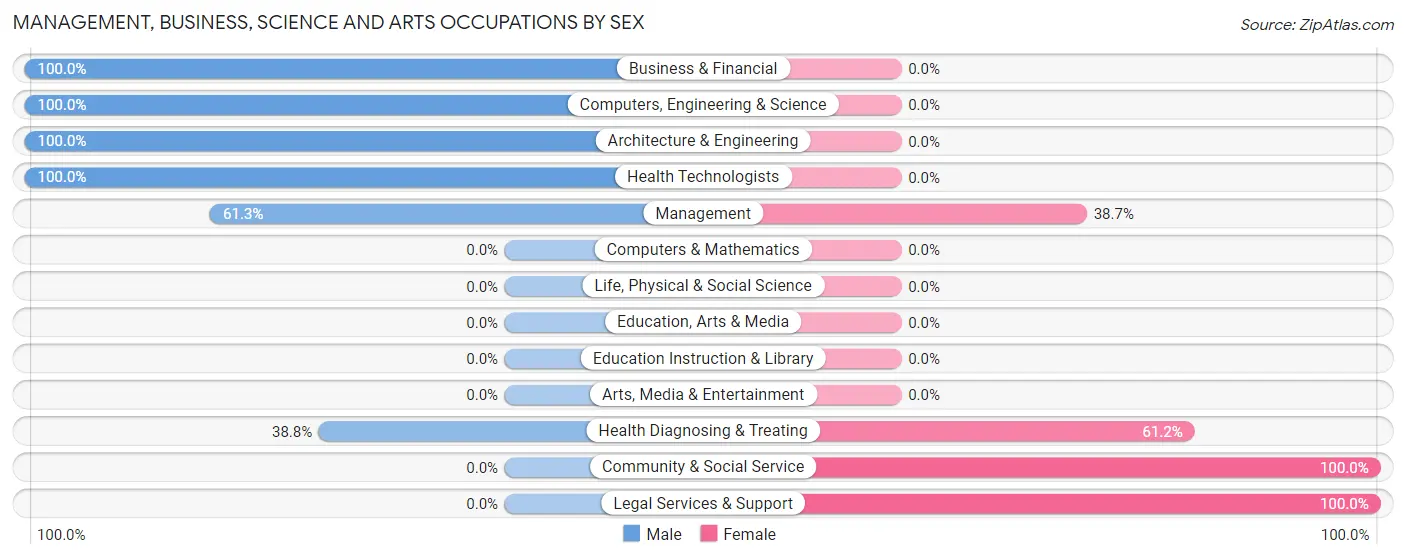
| Occupation | Male | Female |
| Management | 19 (61.3%) | 12 (38.7%) |
| Business & Financial | 9 (100.0%) | 0 (0.0%) |
| Computers, Engineering & Science | 9 (100.0%) | 0 (0.0%) |
| Computers & Mathematics | 0 (0.0%) | 0 (0.0%) |
| Architecture & Engineering | 9 (100.0%) | 0 (0.0%) |
| Life, Physical & Social Science | 0 (0.0%) | 0 (0.0%) |
| Community & Social Service | 0 (0.0%) | 7 (100.0%) |
| Education, Arts & Media | 0 (0.0%) | 0 (0.0%) |
| Legal Services & Support | 0 (0.0%) | 7 (100.0%) |
| Education Instruction & Library | 0 (0.0%) | 0 (0.0%) |
| Arts, Media & Entertainment | 0 (0.0%) | 0 (0.0%) |
| Health Diagnosing & Treating | 19 (38.8%) | 30 (61.2%) |
| Health Technologists | 19 (100.0%) | 0 (0.0%) |
| Total (Category) | 56 (53.3%) | 49 (46.7%) |
| Total (Overall) | 408 (54.8%) | 337 (45.2%) |
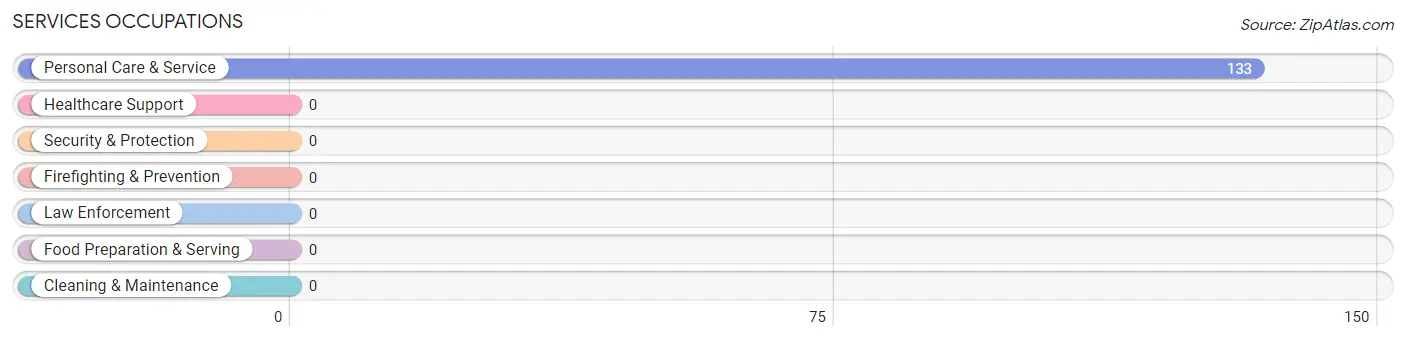
Services Occupations
The most common Services occupations in Stewartville are , and Personal Care & Service (133 | 17.8%).
Services Occupations by Sex
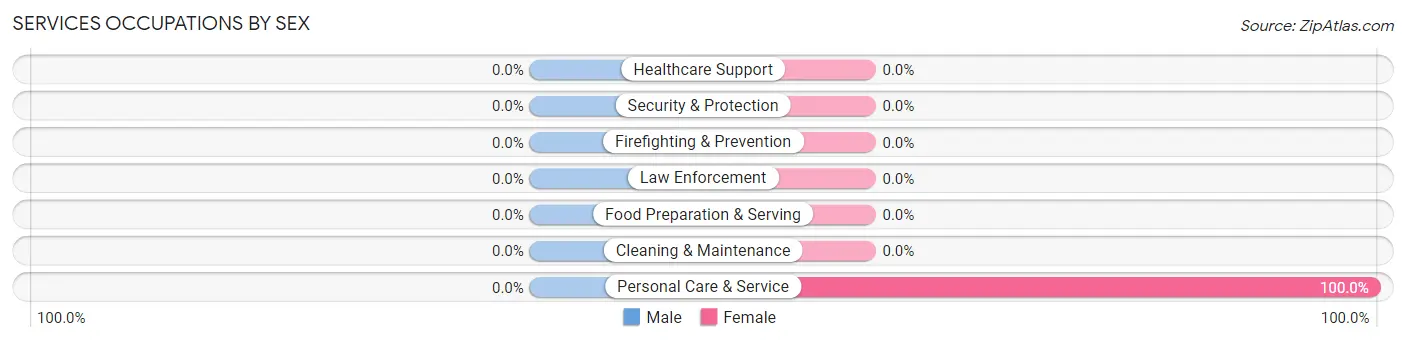
| Occupation | Male | Female |
| Healthcare Support | 0 (0.0%) | 0 (0.0%) |
| Security & Protection | 0 (0.0%) | 0 (0.0%) |
| Firefighting & Prevention | 0 (0.0%) | 0 (0.0%) |
| Law Enforcement | 0 (0.0%) | 0 (0.0%) |
| Food Preparation & Serving | 0 (0.0%) | 0 (0.0%) |
| Cleaning & Maintenance | 0 (0.0%) | 0 (0.0%) |
| Personal Care & Service | 0 (0.0%) | 133 (100.0%) |
| Total (Category) | 0 (0.0%) | 133 (100.0%) |
| Total (Overall) | 408 (54.8%) | 337 (45.2%) |
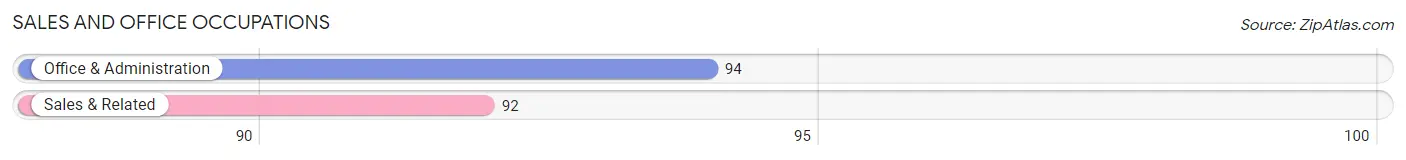
Sales and Office Occupations
The most common Sales and Office occupations in Stewartville are Office & Administration (94 | 12.6%), and Sales & Related (92 | 12.3%).
Sales and Office Occupations by Sex
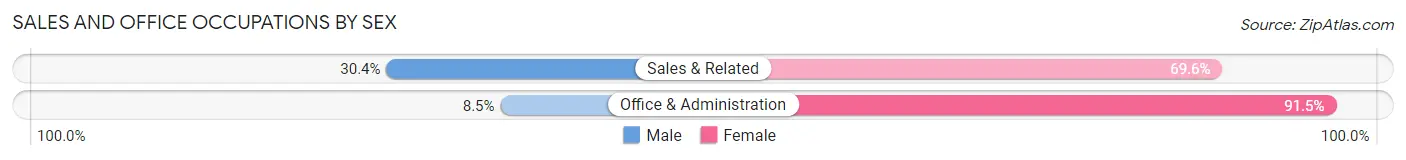
| Occupation | Male | Female |
| Sales & Related | 28 (30.4%) | 64 (69.6%) |
| Office & Administration | 8 (8.5%) | 86 (91.5%) |
| Total (Category) | 36 (19.4%) | 150 (80.6%) |
| Total (Overall) | 408 (54.8%) | 337 (45.2%) |
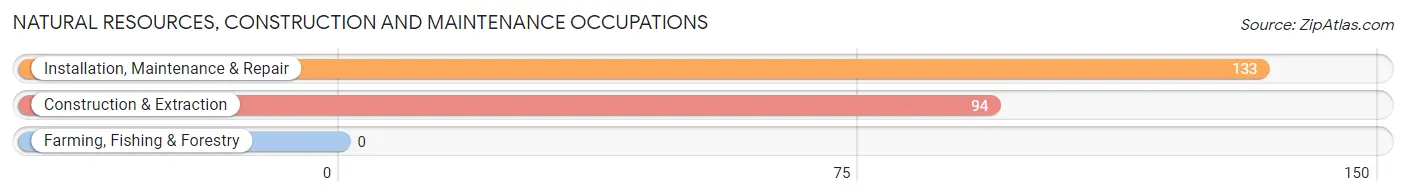
Natural Resources, Construction and Maintenance Occupations
The most common Natural Resources, Construction and Maintenance occupations in Stewartville are Installation, Maintenance & Repair (133 | 17.8%), and Construction & Extraction (94 | 12.6%).
Natural Resources, Construction and Maintenance Occupations by Sex
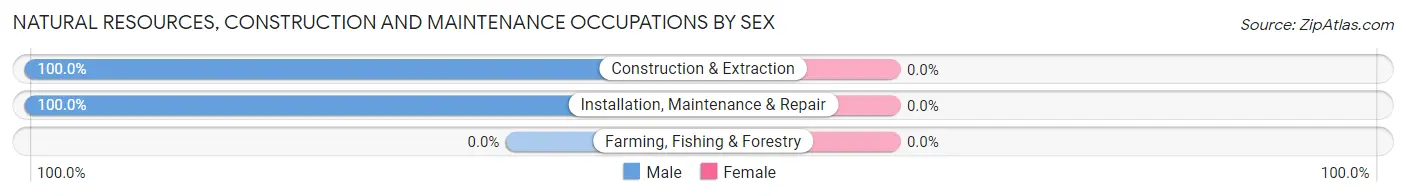
| Occupation | Male | Female |
| Farming, Fishing & Forestry | 0 (0.0%) | 0 (0.0%) |
| Construction & Extraction | 94 (100.0%) | 0 (0.0%) |
| Installation, Maintenance & Repair | 133 (100.0%) | 0 (0.0%) |
| Total (Category) | 227 (100.0%) | 0 (0.0%) |
| Total (Overall) | 408 (54.8%) | 337 (45.2%) |
Production, Transportation and Moving Occupations
The most common Production, Transportation and Moving occupations in Stewartville are Production (82 | 11.0%), and Transportation (12 | 1.6%).
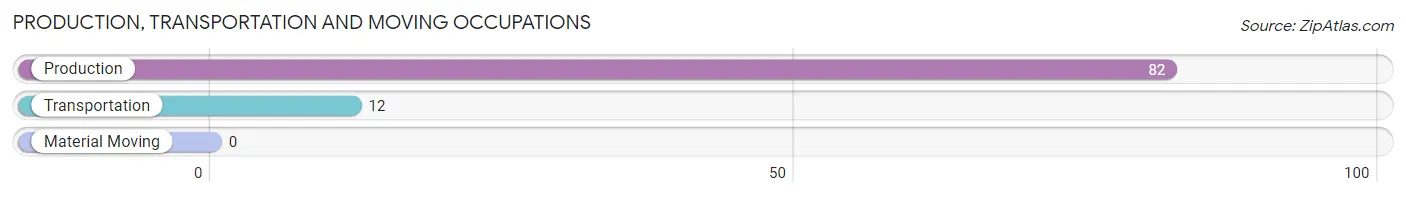
Production, Transportation and Moving Occupations by Sex
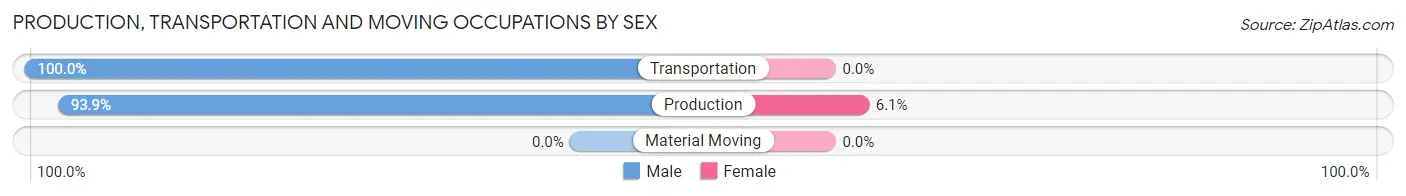
| Occupation | Male | Female |
| Production | 77 (93.9%) | 5 (6.1%) |
| Transportation | 12 (100.0%) | 0 (0.0%) |
| Material Moving | 0 (0.0%) | 0 (0.0%) |
| Total (Category) | 89 (94.7%) | 5 (5.3%) |
| Total (Overall) | 408 (54.8%) | 337 (45.2%) |
Employment Industries by Sex in Stewartville
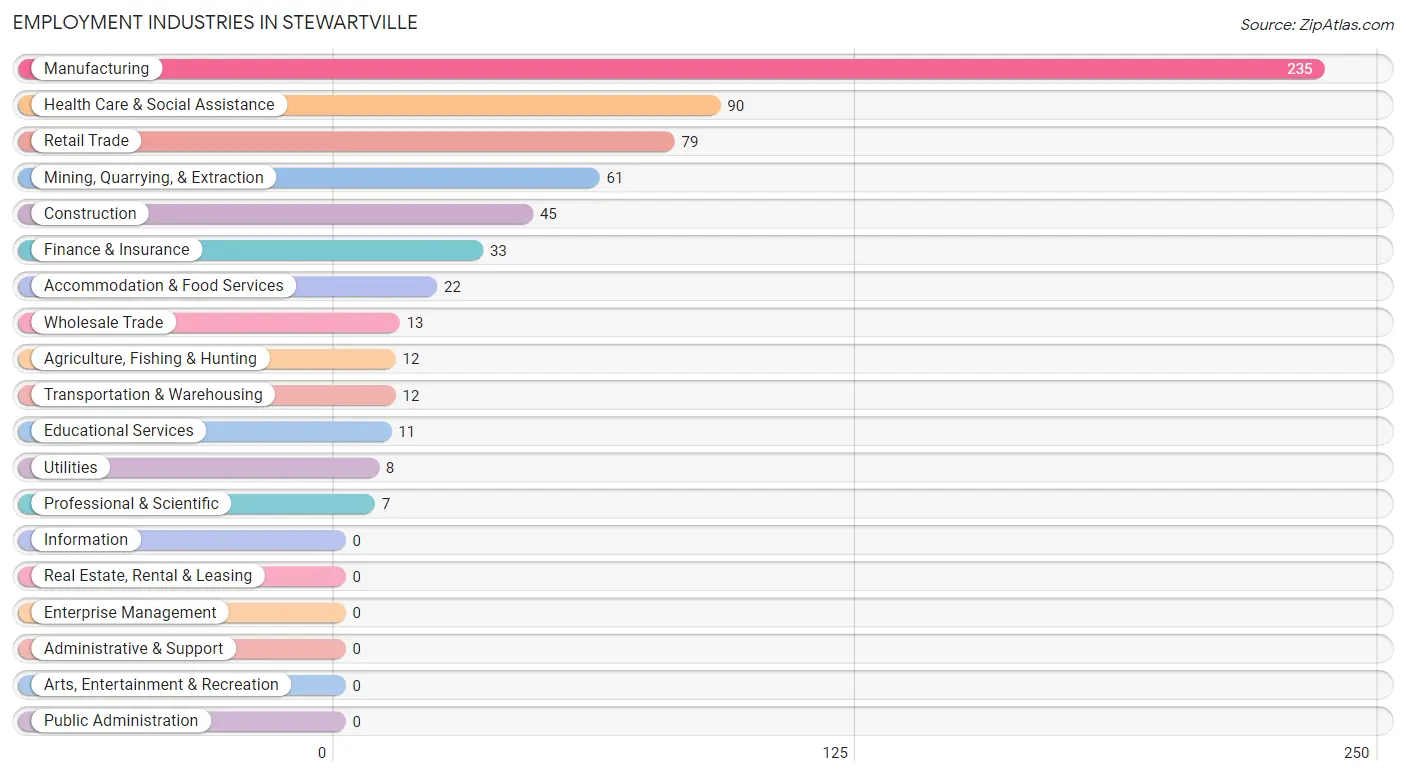
Employment Industries in Stewartville
The major employment industries in Stewartville include Manufacturing (235 | 31.5%), Health Care & Social Assistance (90 | 12.1%), Retail Trade (79 | 10.6%), Mining, Quarrying, & Extraction (61 | 8.2%), and Construction (45 | 6.0%).
Employment Industries by Sex in Stewartville
The Stewartville industries that see more men than women are Agriculture, Fishing & Hunting (100.0%), Mining, Quarrying, & Extraction (100.0%), and Wholesale Trade (100.0%), whereas the industries that tend to have a higher number of women are Finance & Insurance (100.0%), Professional & Scientific (100.0%), and Educational Services (100.0%).
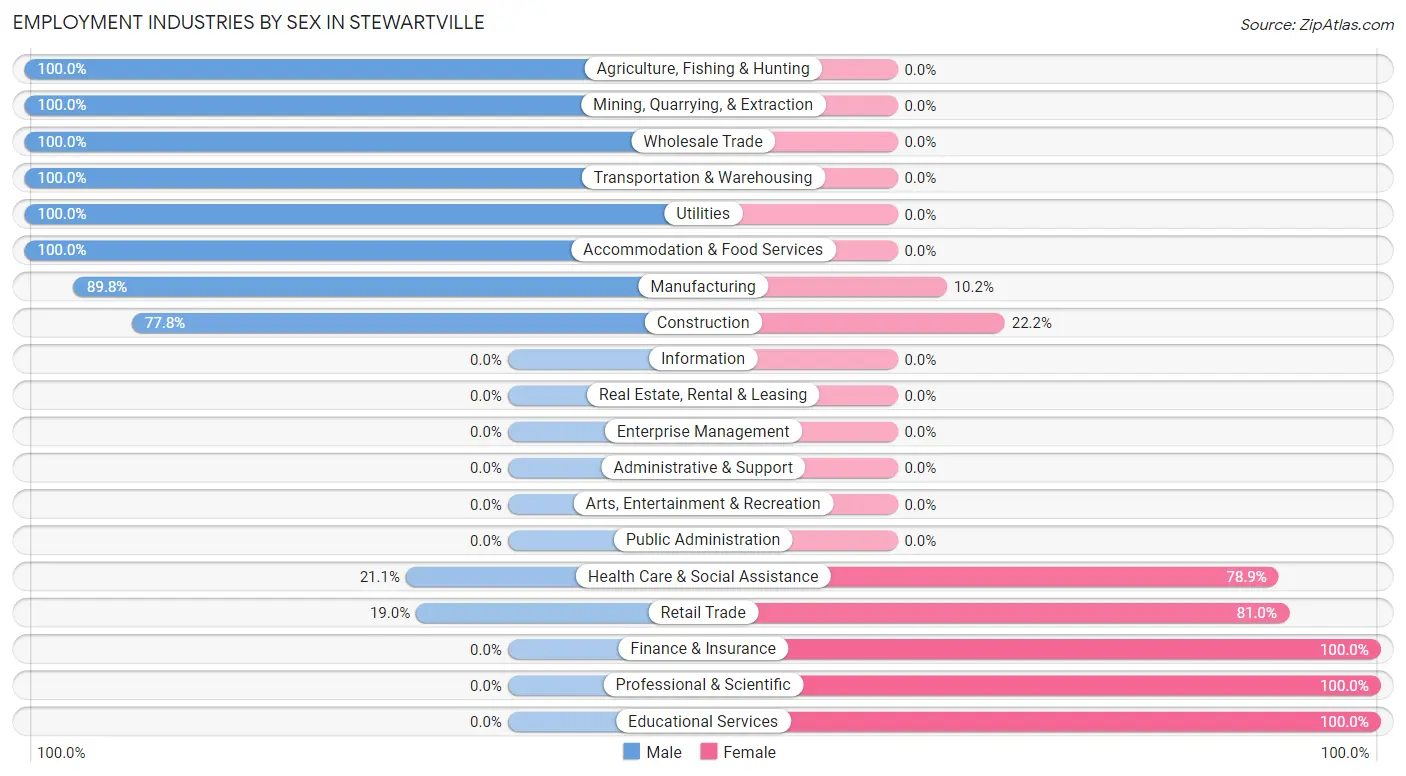
| Industry | Male | Female |
| Agriculture, Fishing & Hunting | 12 (100.0%) | 0 (0.0%) |
| Mining, Quarrying, & Extraction | 61 (100.0%) | 0 (0.0%) |
| Construction | 35 (77.8%) | 10 (22.2%) |
| Manufacturing | 211 (89.8%) | 24 (10.2%) |
| Wholesale Trade | 13 (100.0%) | 0 (0.0%) |
| Retail Trade | 15 (19.0%) | 64 (81.0%) |
| Transportation & Warehousing | 12 (100.0%) | 0 (0.0%) |
| Utilities | 8 (100.0%) | 0 (0.0%) |
| Information | 0 (0.0%) | 0 (0.0%) |
| Finance & Insurance | 0 (0.0%) | 33 (100.0%) |
| Real Estate, Rental & Leasing | 0 (0.0%) | 0 (0.0%) |
| Professional & Scientific | 0 (0.0%) | 7 (100.0%) |
| Enterprise Management | 0 (0.0%) | 0 (0.0%) |
| Administrative & Support | 0 (0.0%) | 0 (0.0%) |
| Educational Services | 0 (0.0%) | 11 (100.0%) |
| Health Care & Social Assistance | 19 (21.1%) | 71 (78.9%) |
| Arts, Entertainment & Recreation | 0 (0.0%) | 0 (0.0%) |
| Accommodation & Food Services | 22 (100.0%) | 0 (0.0%) |
| Public Administration | 0 (0.0%) | 0 (0.0%) |
| Total | 408 (54.8%) | 337 (45.2%) |
Education in Stewartville
School Enrollment in Stewartville
The most common levels of schooling among the 227 students in Stewartville are middle school (158 | 69.6%), high school (39 | 17.2%), and kindergarten (12 | 5.3%).
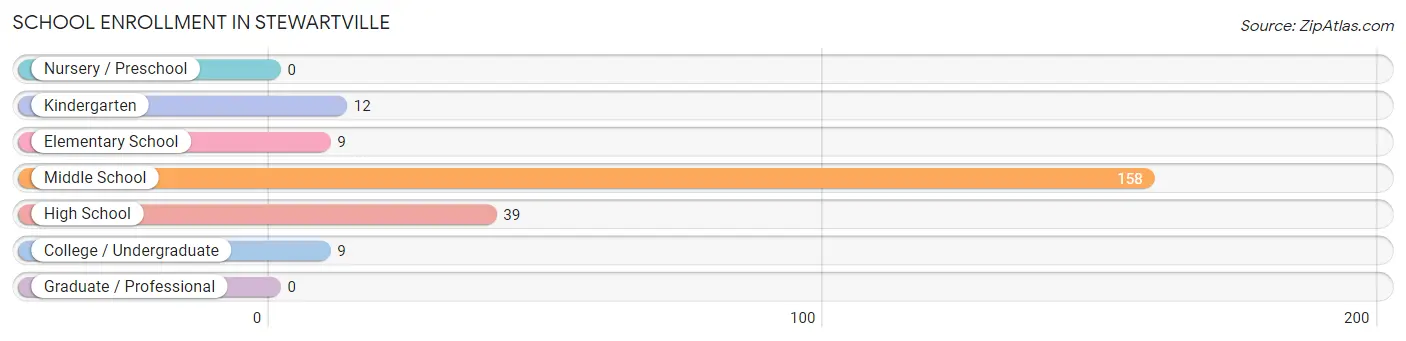
| School Level | # Students | % Students |
| Nursery / Preschool | 0 | 0.0% |
| Kindergarten | 12 | 5.3% |
| Elementary School | 9 | 4.0% |
| Middle School | 158 | 69.6% |
| High School | 39 | 17.2% |
| College / Undergraduate | 9 | 4.0% |
| Graduate / Professional | 0 | 0.0% |
| Total | 227 | 100.0% |
School Enrollment by Age by Funding Source in Stewartville
Out of a total of 227 students who are enrolled in schools in Stewartville, 39 (17.2%) attend a private institution, while the remaining 188 (82.8%) are enrolled in public schools. The age group of 10 to 14 year olds has the highest likelihood of being enrolled in private schools, with 31 (20.0% in the age bracket) enrolled. Conversely, the age group of 5 to 9 year old has the lowest likelihood of being enrolled in a private school, with 12 (100.0% in the age bracket) attending a public institution.
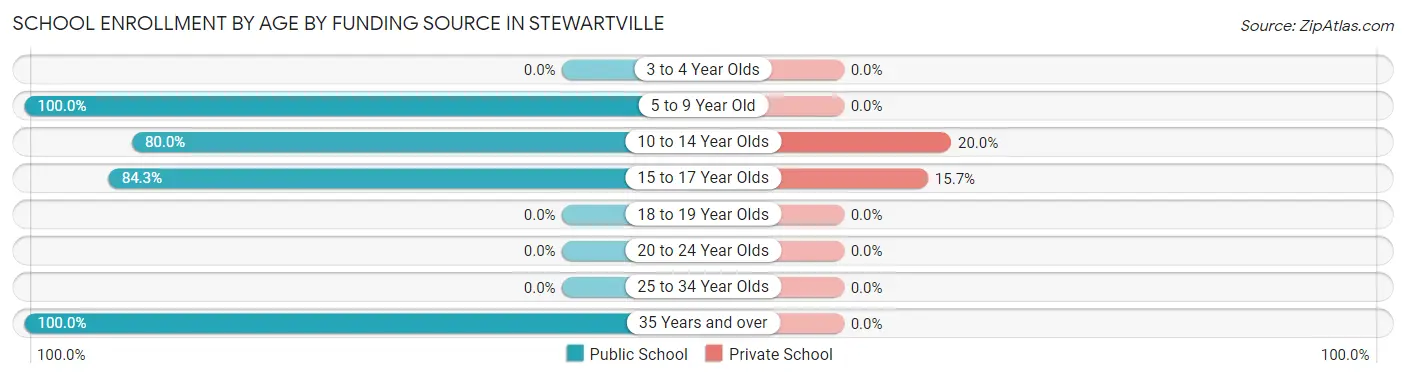
| Age Bracket | Public School | Private School |
| 3 to 4 Year Olds | 0 (0.0%) | 0 (0.0%) |
| 5 to 9 Year Old | 12 (100.0%) | 0 (0.0%) |
| 10 to 14 Year Olds | 124 (80.0%) | 31 (20.0%) |
| 15 to 17 Year Olds | 43 (84.3%) | 8 (15.7%) |
| 18 to 19 Year Olds | 0 (0.0%) | 0 (0.0%) |
| 20 to 24 Year Olds | 0 (0.0%) | 0 (0.0%) |
| 25 to 34 Year Olds | 0 (0.0%) | 0 (0.0%) |
| 35 Years and over | 9 (100.0%) | 0 (0.0%) |
| Total | 188 (82.8%) | 39 (17.2%) |
Educational Attainment by Field of Study in Stewartville
Education (30 | 30.6%), science & technology (28 | 28.6%), business (19 | 19.4%), arts & humanities (14 | 14.3%), and literature & languages (7 | 7.1%) are the most common fields of study among 98 individuals in Stewartville who have obtained a bachelor's degree or higher.
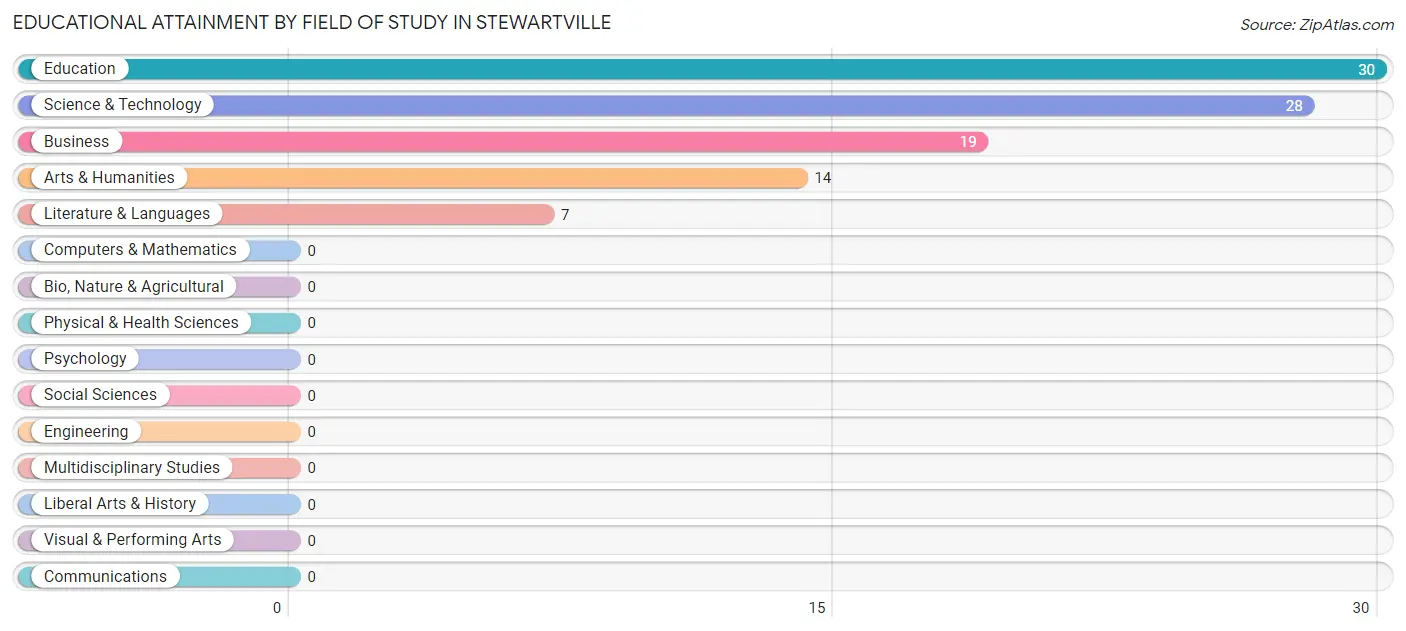
| Field of Study | # Graduates | % Graduates |
| Computers & Mathematics | 0 | 0.0% |
| Bio, Nature & Agricultural | 0 | 0.0% |
| Physical & Health Sciences | 0 | 0.0% |
| Psychology | 0 | 0.0% |
| Social Sciences | 0 | 0.0% |
| Engineering | 0 | 0.0% |
| Multidisciplinary Studies | 0 | 0.0% |
| Science & Technology | 28 | 28.6% |
| Business | 19 | 19.4% |
| Education | 30 | 30.6% |
| Literature & Languages | 7 | 7.1% |
| Liberal Arts & History | 0 | 0.0% |
| Visual & Performing Arts | 0 | 0.0% |
| Communications | 0 | 0.0% |
| Arts & Humanities | 14 | 14.3% |
| Total | 98 | 100.0% |
Transportation & Commute in Stewartville
Vehicle Availability by Sex in Stewartville
The most prevalent vehicle ownership categories in Stewartville are males with 4 vehicles (207, accounting for 50.7%) and females with 4 vehicles (150, making up 61.4%).
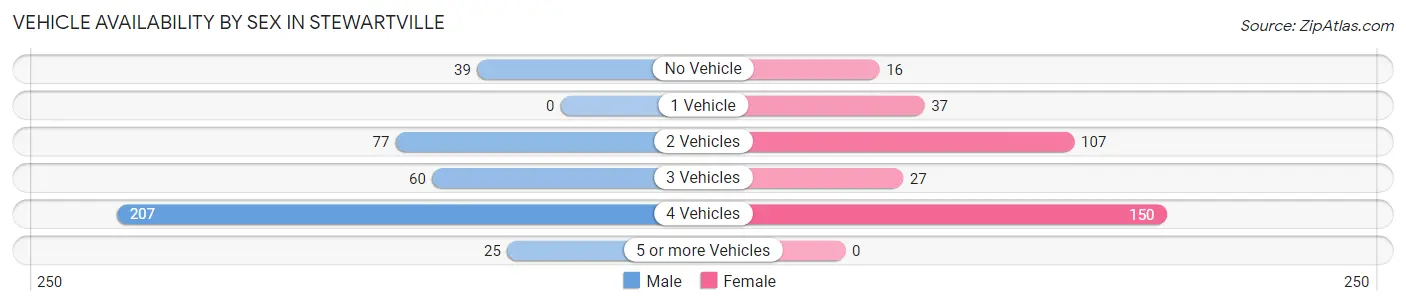
| Vehicles Available | Male | Female |
| No Vehicle | 39 (9.6%) | 16 (4.8%) |
| 1 Vehicle | 0 (0.0%) | 37 (11.0%) |
| 2 Vehicles | 77 (18.9%) | 107 (31.8%) |
| 3 Vehicles | 60 (14.7%) | 27 (8.0%) |
| 4 Vehicles | 207 (50.7%) | 150 (44.5%) |
| 5 or more Vehicles | 25 (6.1%) | 0 (0.0%) |
| Total | 408 (100.0%) | 337 (100.0%) |
Commute Time in Stewartville
The most frequently occuring commute durations in Stewartville are 10 to 14 minutes (148 commuters, 23.6%), 60 to 89 minutes (147 commuters, 23.4%), and 15 to 19 minutes (136 commuters, 21.7%).
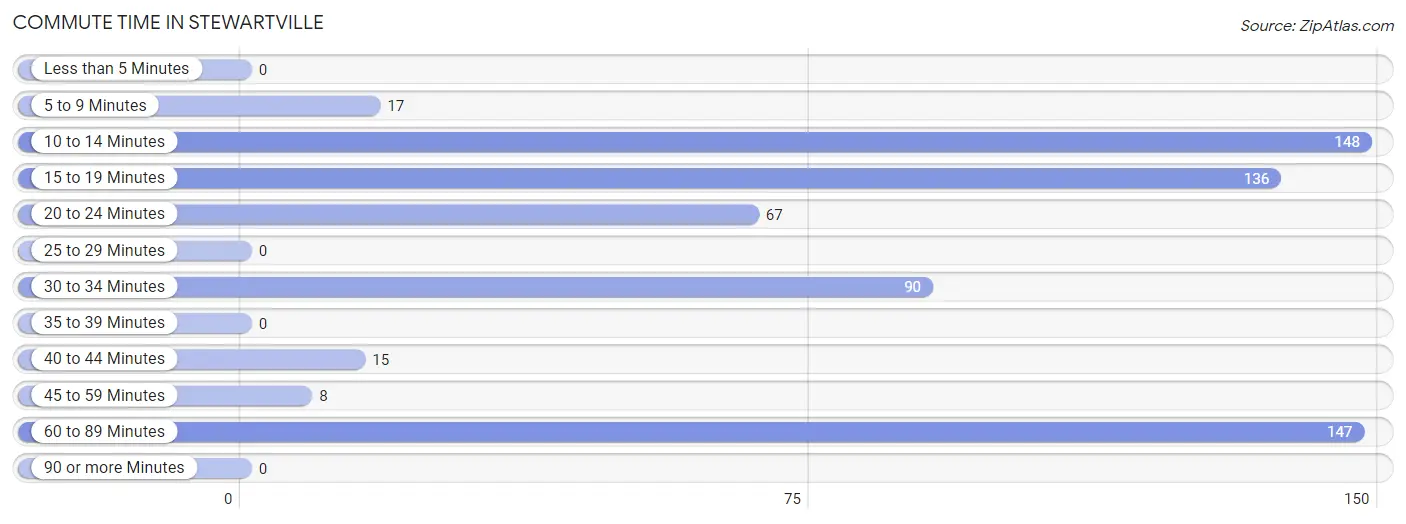
| Commute Time | # Commuters | % Commuters |
| Less than 5 Minutes | 0 | 0.0% |
| 5 to 9 Minutes | 17 | 2.7% |
| 10 to 14 Minutes | 148 | 23.6% |
| 15 to 19 Minutes | 136 | 21.7% |
| 20 to 24 Minutes | 67 | 10.7% |
| 25 to 29 Minutes | 0 | 0.0% |
| 30 to 34 Minutes | 90 | 14.3% |
| 35 to 39 Minutes | 0 | 0.0% |
| 40 to 44 Minutes | 15 | 2.4% |
| 45 to 59 Minutes | 8 | 1.3% |
| 60 to 89 Minutes | 147 | 23.4% |
| 90 or more Minutes | 0 | 0.0% |
Commute Time by Sex in Stewartville
The most common commute times in Stewartville are 60 to 89 minutes (110 commuters, 27.0%) for males and 15 to 19 minutes (72 commuters, 32.7%) for females.
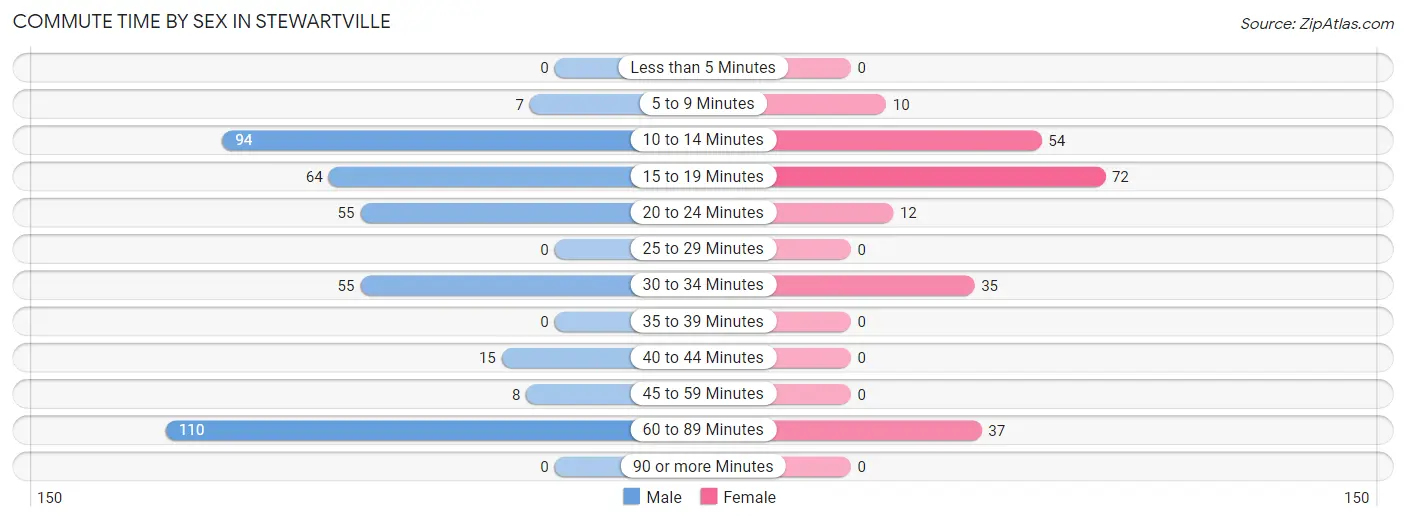
| Commute Time | Male | Female |
| Less than 5 Minutes | 0 (0.0%) | 0 (0.0%) |
| 5 to 9 Minutes | 7 (1.7%) | 10 (4.5%) |
| 10 to 14 Minutes | 94 (23.0%) | 54 (24.5%) |
| 15 to 19 Minutes | 64 (15.7%) | 72 (32.7%) |
| 20 to 24 Minutes | 55 (13.5%) | 12 (5.4%) |
| 25 to 29 Minutes | 0 (0.0%) | 0 (0.0%) |
| 30 to 34 Minutes | 55 (13.5%) | 35 (15.9%) |
| 35 to 39 Minutes | 0 (0.0%) | 0 (0.0%) |
| 40 to 44 Minutes | 15 (3.7%) | 0 (0.0%) |
| 45 to 59 Minutes | 8 (2.0%) | 0 (0.0%) |
| 60 to 89 Minutes | 110 (27.0%) | 37 (16.8%) |
| 90 or more Minutes | 0 (0.0%) | 0 (0.0%) |
Time of Departure to Work by Sex in Stewartville
The most frequent times of departure to work in Stewartville are 12:00 AM to 4:59 AM (190, 46.6%) for males and 6:00 AM to 6:29 AM (41, 18.6%) for females.
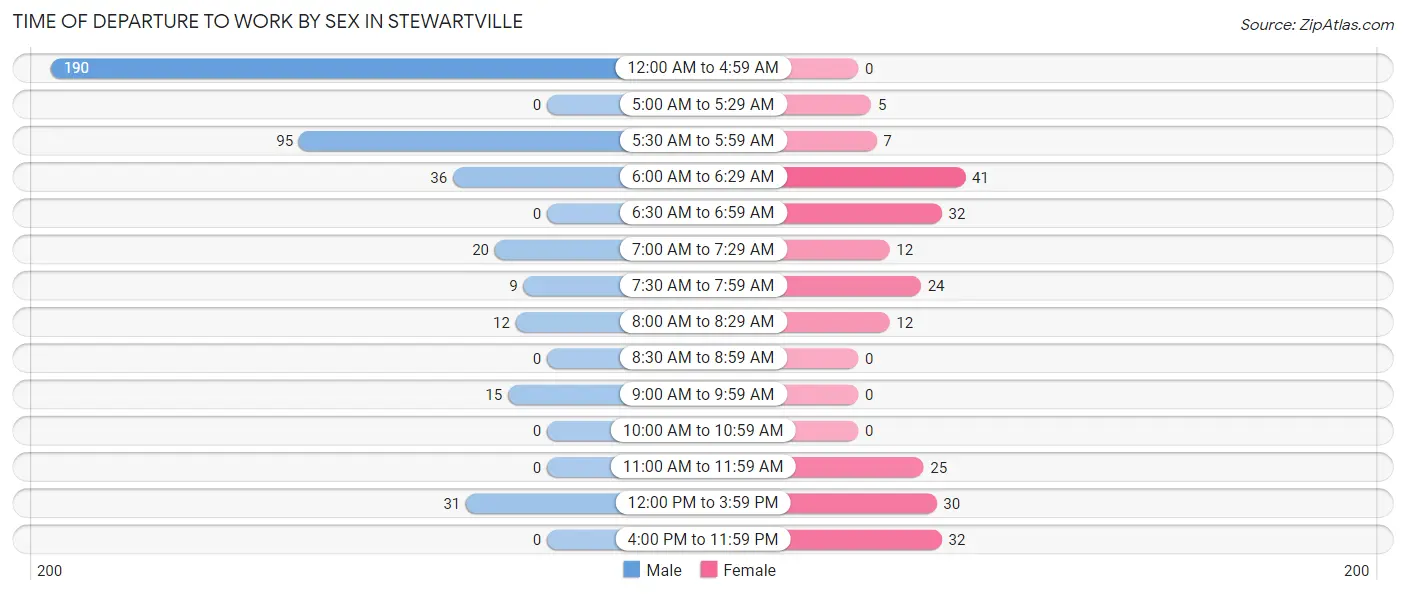
| Time of Departure | Male | Female |
| 12:00 AM to 4:59 AM | 190 (46.6%) | 0 (0.0%) |
| 5:00 AM to 5:29 AM | 0 (0.0%) | 5 (2.3%) |
| 5:30 AM to 5:59 AM | 95 (23.3%) | 7 (3.2%) |
| 6:00 AM to 6:29 AM | 36 (8.8%) | 41 (18.6%) |
| 6:30 AM to 6:59 AM | 0 (0.0%) | 32 (14.5%) |
| 7:00 AM to 7:29 AM | 20 (4.9%) | 12 (5.4%) |
| 7:30 AM to 7:59 AM | 9 (2.2%) | 24 (10.9%) |
| 8:00 AM to 8:29 AM | 12 (2.9%) | 12 (5.4%) |
| 8:30 AM to 8:59 AM | 0 (0.0%) | 0 (0.0%) |
| 9:00 AM to 9:59 AM | 15 (3.7%) | 0 (0.0%) |
| 10:00 AM to 10:59 AM | 0 (0.0%) | 0 (0.0%) |
| 11:00 AM to 11:59 AM | 0 (0.0%) | 25 (11.4%) |
| 12:00 PM to 3:59 PM | 31 (7.6%) | 30 (13.6%) |
| 4:00 PM to 11:59 PM | 0 (0.0%) | 32 (14.5%) |
| Total | 408 (100.0%) | 220 (100.0%) |
Housing Occupancy in Stewartville
Occupancy by Ownership in Stewartville
Of the total 616 dwellings in Stewartville, owner-occupied units account for 472 (76.6%), while renter-occupied units make up 144 (23.4%).
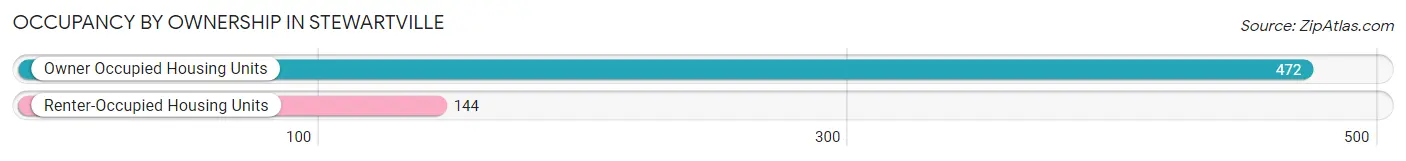
| Occupancy | # Housing Units | % Housing Units |
| Owner Occupied Housing Units | 472 | 76.6% |
| Renter-Occupied Housing Units | 144 | 23.4% |
| Total Occupied Housing Units | 616 | 100.0% |
Occupancy by Household Size in Stewartville
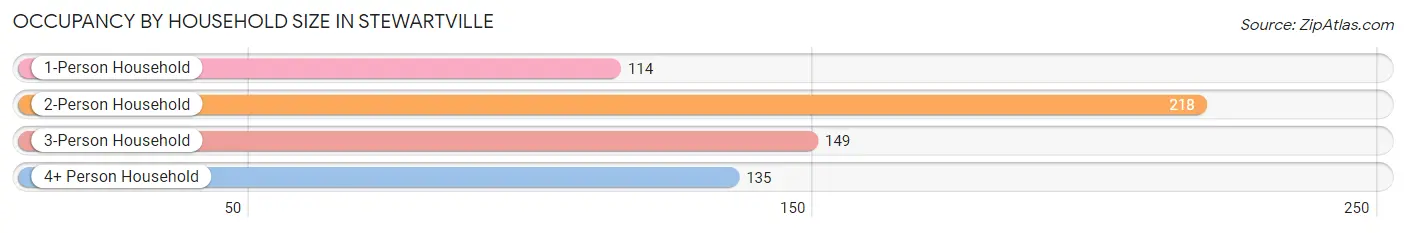
| Household Size | # Housing Units | % Housing Units |
| 1-Person Household | 114 | 18.5% |
| 2-Person Household | 218 | 35.4% |
| 3-Person Household | 149 | 24.2% |
| 4+ Person Household | 135 | 21.9% |
| Total Housing Units | 616 | 100.0% |
Occupancy by Ownership by Household Size in Stewartville
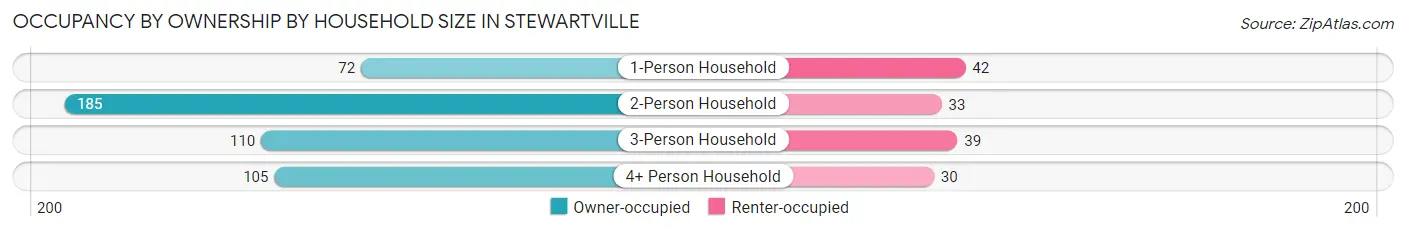
| Household Size | Owner-occupied | Renter-occupied |
| 1-Person Household | 72 (63.2%) | 42 (36.8%) |
| 2-Person Household | 185 (84.9%) | 33 (15.1%) |
| 3-Person Household | 110 (73.8%) | 39 (26.2%) |
| 4+ Person Household | 105 (77.8%) | 30 (22.2%) |
| Total Housing Units | 472 (76.6%) | 144 (23.4%) |
Occupancy by Educational Attainment in Stewartville
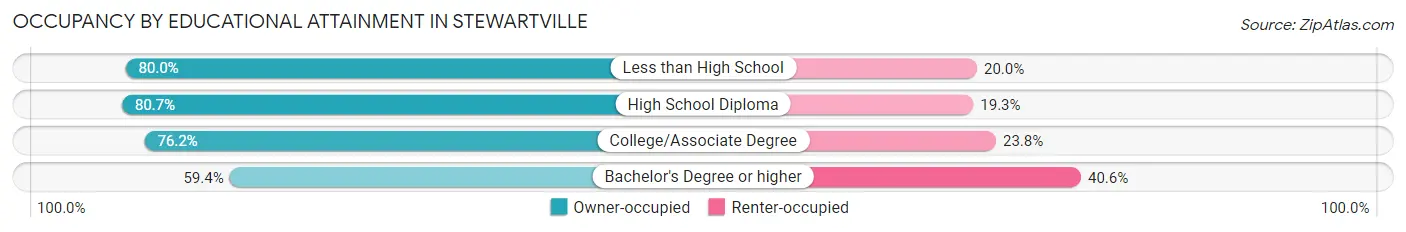
| Household Size | Owner-occupied | Renter-occupied |
| Less than High School | 72 (80.0%) | 18 (20.0%) |
| High School Diploma | 176 (80.7%) | 42 (19.3%) |
| College/Associate Degree | 186 (76.2%) | 58 (23.8%) |
| Bachelor's Degree or higher | 38 (59.4%) | 26 (40.6%) |
Occupancy by Age of Householder in Stewartville
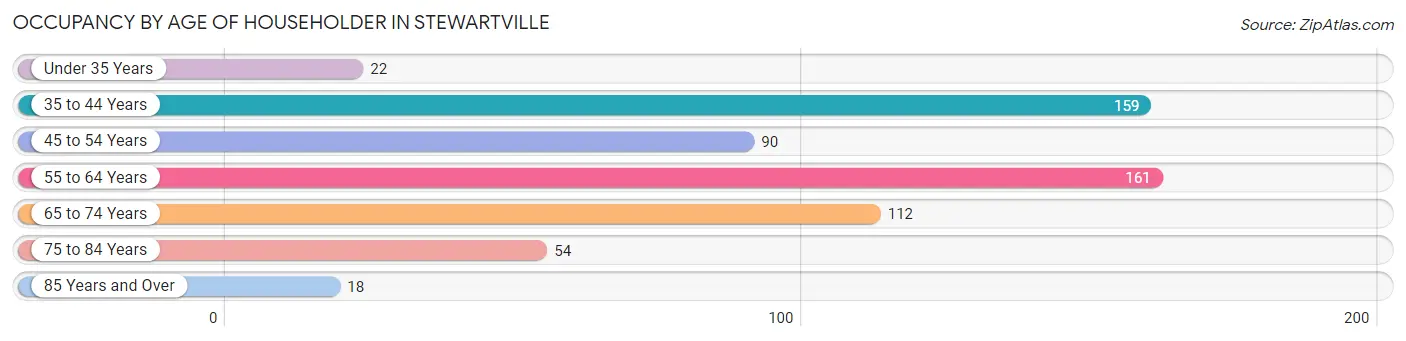
| Age Bracket | # Households | % Households |
| Under 35 Years | 22 | 3.6% |
| 35 to 44 Years | 159 | 25.8% |
| 45 to 54 Years | 90 | 14.6% |
| 55 to 64 Years | 161 | 26.1% |
| 65 to 74 Years | 112 | 18.2% |
| 75 to 84 Years | 54 | 8.8% |
| 85 Years and Over | 18 | 2.9% |
| Total | 616 | 100.0% |
Housing Finances in Stewartville
Median Income by Occupancy in Stewartville
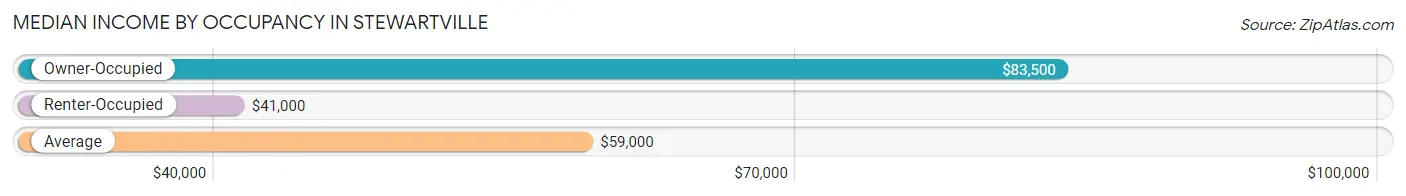
| Occupancy Type | # Households | Median Income |
| Owner-Occupied | 472 (76.6%) | $83,500 |
| Renter-Occupied | 144 (23.4%) | $41,000 |
| Average | 616 (100.0%) | $59,000 |
Occupancy by Householder Income Bracket in Stewartville
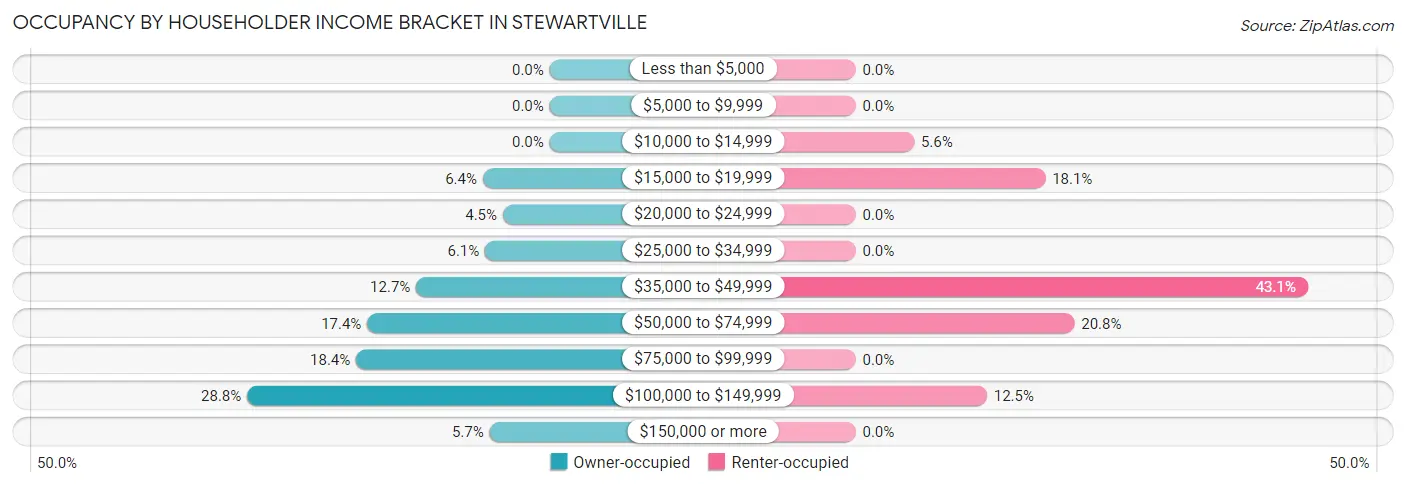
| Income Bracket | Owner-occupied | Renter-occupied |
| Less than $5,000 | 0 (0.0%) | 0 (0.0%) |
| $5,000 to $9,999 | 0 (0.0%) | 0 (0.0%) |
| $10,000 to $14,999 | 0 (0.0%) | 8 (5.6%) |
| $15,000 to $19,999 | 30 (6.4%) | 26 (18.1%) |
| $20,000 to $24,999 | 21 (4.4%) | 0 (0.0%) |
| $25,000 to $34,999 | 29 (6.1%) | 0 (0.0%) |
| $35,000 to $49,999 | 60 (12.7%) | 62 (43.1%) |
| $50,000 to $74,999 | 82 (17.4%) | 30 (20.8%) |
| $75,000 to $99,999 | 87 (18.4%) | 0 (0.0%) |
| $100,000 to $149,999 | 136 (28.8%) | 18 (12.5%) |
| $150,000 or more | 27 (5.7%) | 0 (0.0%) |
| Total | 472 (100.0%) | 144 (100.0%) |
Monthly Housing Cost Tiers in Stewartville
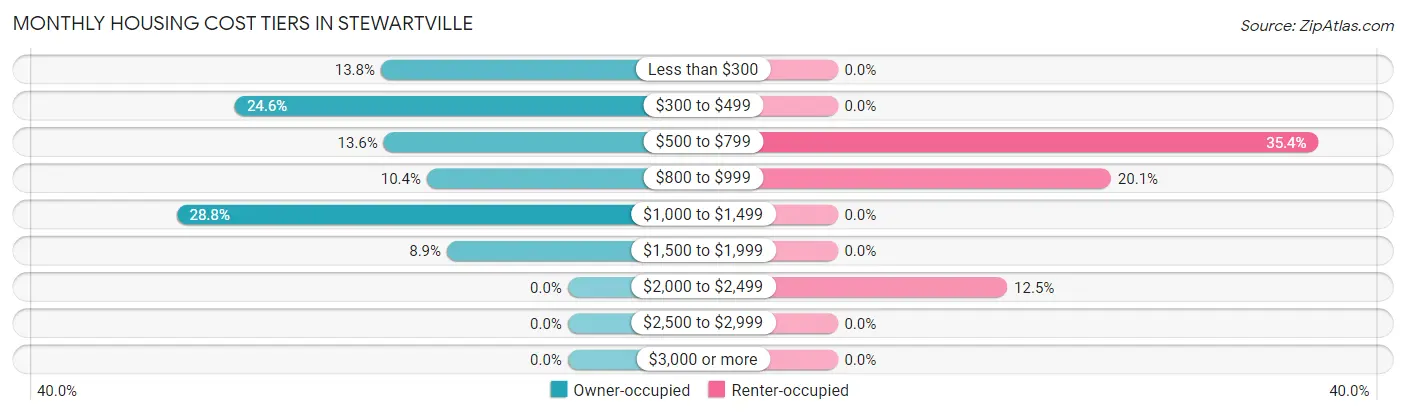
| Monthly Cost | Owner-occupied | Renter-occupied |
| Less than $300 | 65 (13.8%) | 0 (0.0%) |
| $300 to $499 | 116 (24.6%) | 0 (0.0%) |
| $500 to $799 | 64 (13.6%) | 51 (35.4%) |
| $800 to $999 | 49 (10.4%) | 29 (20.1%) |
| $1,000 to $1,499 | 136 (28.8%) | 0 (0.0%) |
| $1,500 to $1,999 | 42 (8.9%) | 0 (0.0%) |
| $2,000 to $2,499 | 0 (0.0%) | 18 (12.5%) |
| $2,500 to $2,999 | 0 (0.0%) | 0 (0.0%) |
| $3,000 or more | 0 (0.0%) | 0 (0.0%) |
| Total | 472 (100.0%) | 144 (100.0%) |
Physical Housing Characteristics in Stewartville
Housing Structures in Stewartville
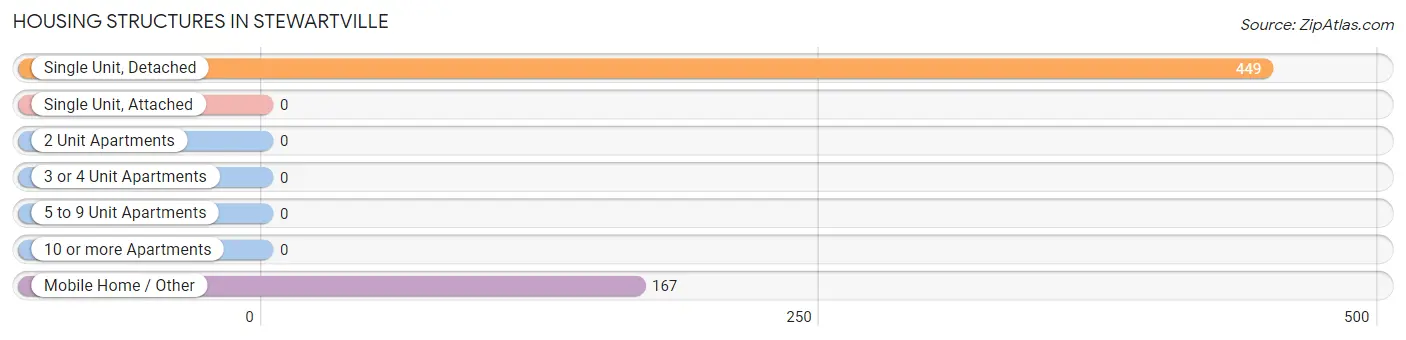
| Structure Type | # Housing Units | % Housing Units |
| Single Unit, Detached | 449 | 72.9% |
| Single Unit, Attached | 0 | 0.0% |
| 2 Unit Apartments | 0 | 0.0% |
| 3 or 4 Unit Apartments | 0 | 0.0% |
| 5 to 9 Unit Apartments | 0 | 0.0% |
| 10 or more Apartments | 0 | 0.0% |
| Mobile Home / Other | 167 | 27.1% |
| Total | 616 | 100.0% |
Housing Structures by Occupancy in Stewartville
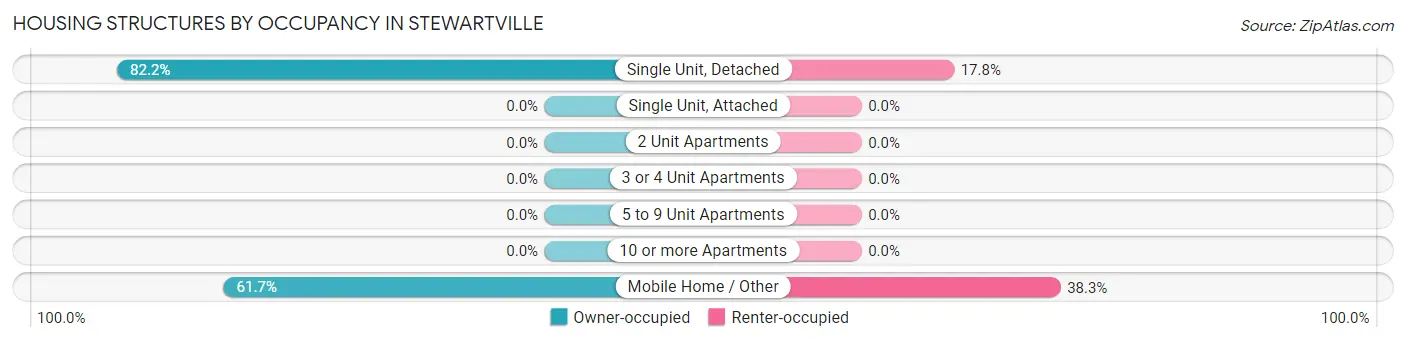
| Structure Type | Owner-occupied | Renter-occupied |
| Single Unit, Detached | 369 (82.2%) | 80 (17.8%) |
| Single Unit, Attached | 0 (0.0%) | 0 (0.0%) |
| 2 Unit Apartments | 0 (0.0%) | 0 (0.0%) |
| 3 or 4 Unit Apartments | 0 (0.0%) | 0 (0.0%) |
| 5 to 9 Unit Apartments | 0 (0.0%) | 0 (0.0%) |
| 10 or more Apartments | 0 (0.0%) | 0 (0.0%) |
| Mobile Home / Other | 103 (61.7%) | 64 (38.3%) |
| Total | 472 (76.6%) | 144 (23.4%) |
Housing Structures by Number of Rooms in Stewartville
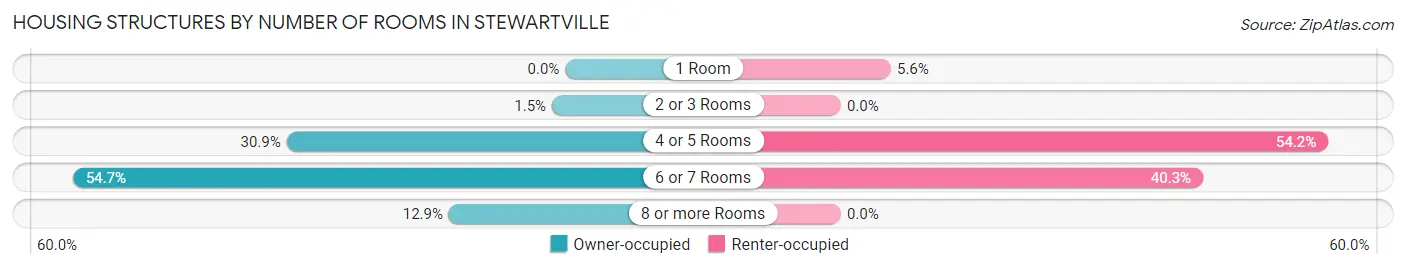
| Number of Rooms | Owner-occupied | Renter-occupied |
| 1 Room | 0 (0.0%) | 8 (5.6%) |
| 2 or 3 Rooms | 7 (1.5%) | 0 (0.0%) |
| 4 or 5 Rooms | 146 (30.9%) | 78 (54.2%) |
| 6 or 7 Rooms | 258 (54.7%) | 58 (40.3%) |
| 8 or more Rooms | 61 (12.9%) | 0 (0.0%) |
| Total | 472 (100.0%) | 144 (100.0%) |
Housing Structure by Heating Type in Stewartville

| Heating Type | Owner-occupied | Renter-occupied |
| Utility Gas | 12 (2.5%) | 0 (0.0%) |
| Bottled, Tank, or LP Gas | 84 (17.8%) | 8 (5.6%) |
| Electricity | 338 (71.6%) | 136 (94.4%) |
| Fuel Oil or Kerosene | 0 (0.0%) | 0 (0.0%) |
| Coal or Coke | 0 (0.0%) | 0 (0.0%) |
| All other Fuels | 38 (8.1%) | 0 (0.0%) |
| No Fuel Used | 0 (0.0%) | 0 (0.0%) |
| Total | 472 (100.0%) | 144 (100.0%) |
Household Vehicle Usage in Stewartville
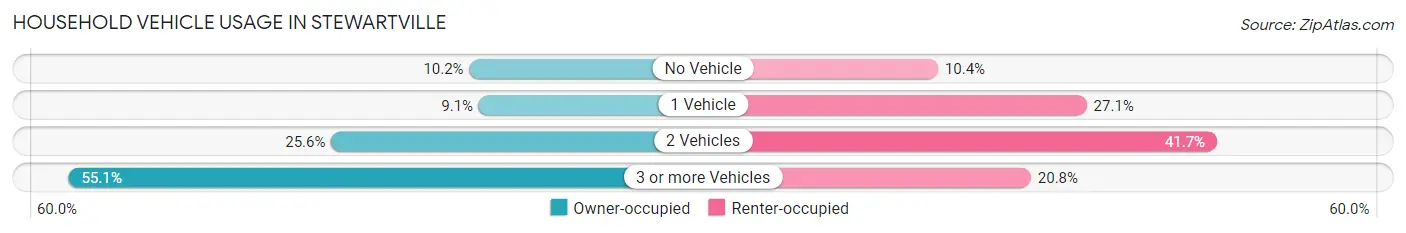
| Vehicles per Household | Owner-occupied | Renter-occupied |
| No Vehicle | 48 (10.2%) | 15 (10.4%) |
| 1 Vehicle | 43 (9.1%) | 39 (27.1%) |
| 2 Vehicles | 121 (25.6%) | 60 (41.7%) |
| 3 or more Vehicles | 260 (55.1%) | 30 (20.8%) |
| Total | 472 (100.0%) | 144 (100.0%) |
Real Estate & Mortgages in Stewartville
Real Estate and Mortgage Overview in Stewartville
| Characteristic | Without Mortgage | With Mortgage |
| Housing Units | 271 | 201 |
| Median Property Value | $96,400 | $162,400 |
| Median Household Income | $51,908 | $16 |
| Monthly Housing Costs | $411 | $0 |
| Real Estate Taxes | $360 | $12 |
Property Value by Mortgage Status in Stewartville
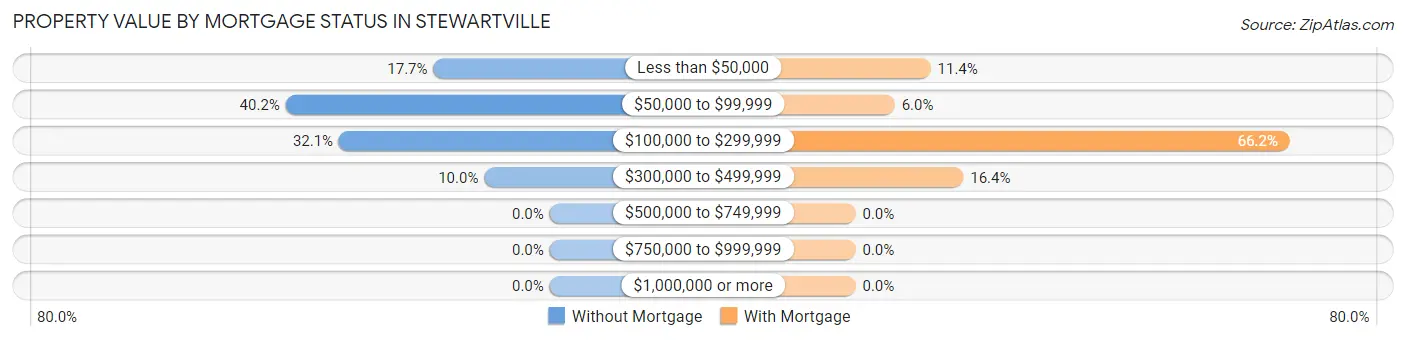
| Property Value | Without Mortgage | With Mortgage |
| Less than $50,000 | 48 (17.7%) | 23 (11.4%) |
| $50,000 to $99,999 | 109 (40.2%) | 12 (6.0%) |
| $100,000 to $299,999 | 87 (32.1%) | 133 (66.2%) |
| $300,000 to $499,999 | 27 (10.0%) | 33 (16.4%) |
| $500,000 to $749,999 | 0 (0.0%) | 0 (0.0%) |
| $750,000 to $999,999 | 0 (0.0%) | 0 (0.0%) |
| $1,000,000 or more | 0 (0.0%) | 0 (0.0%) |
| Total | 271 (100.0%) | 201 (100.0%) |
Household Income by Mortgage Status in Stewartville
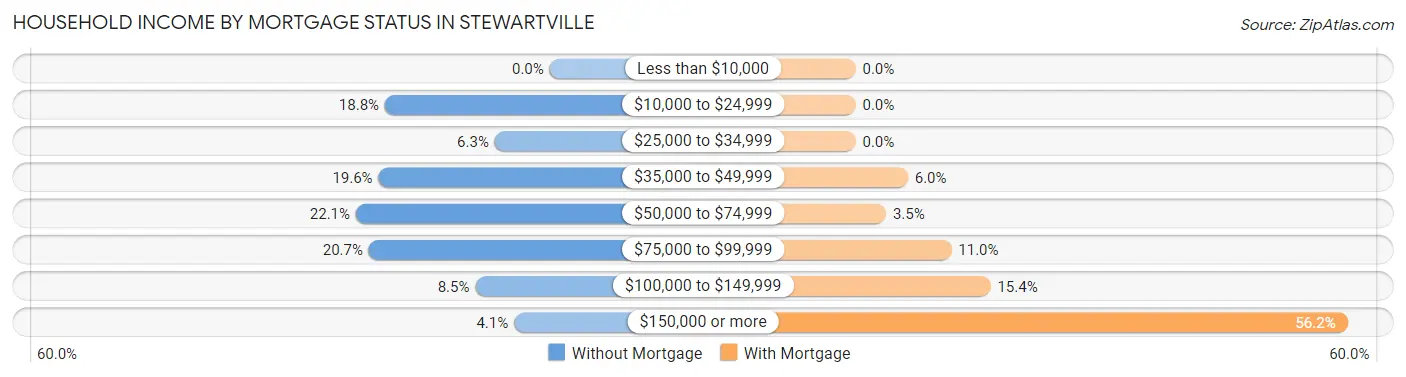
| Household Income | Without Mortgage | With Mortgage |
| Less than $10,000 | 0 (0.0%) | 0 (0.0%) |
| $10,000 to $24,999 | 51 (18.8%) | 0 (0.0%) |
| $25,000 to $34,999 | 17 (6.3%) | 0 (0.0%) |
| $35,000 to $49,999 | 53 (19.6%) | 12 (6.0%) |
| $50,000 to $74,999 | 60 (22.1%) | 7 (3.5%) |
| $75,000 to $99,999 | 56 (20.7%) | 22 (11.0%) |
| $100,000 to $149,999 | 23 (8.5%) | 31 (15.4%) |
| $150,000 or more | 11 (4.1%) | 113 (56.2%) |
| Total | 271 (100.0%) | 201 (100.0%) |
Property Value to Household Income Ratio in Stewartville
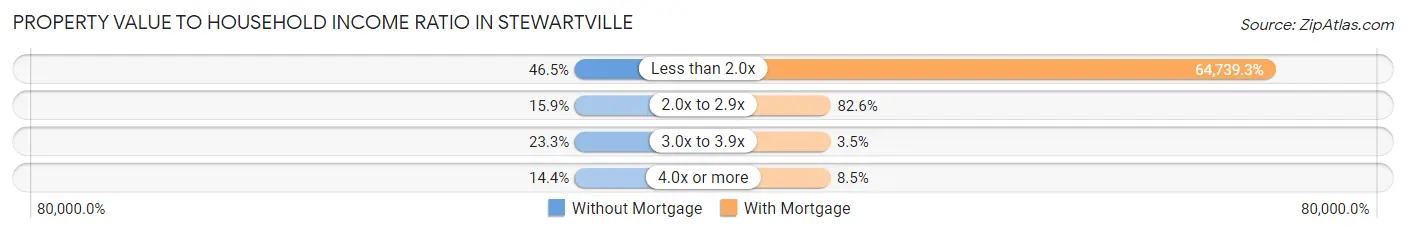
| Value-to-Income Ratio | Without Mortgage | With Mortgage |
| Less than 2.0x | 126 (46.5%) | 130,126 (64,739.3%) |
| 2.0x to 2.9x | 43 (15.9%) | 166 (82.6%) |
| 3.0x to 3.9x | 63 (23.3%) | 7 (3.5%) |
| 4.0x or more | 39 (14.4%) | 17 (8.5%) |
| Total | 271 (100.0%) | 201 (100.0%) |
Real Estate Taxes by Mortgage Status in Stewartville
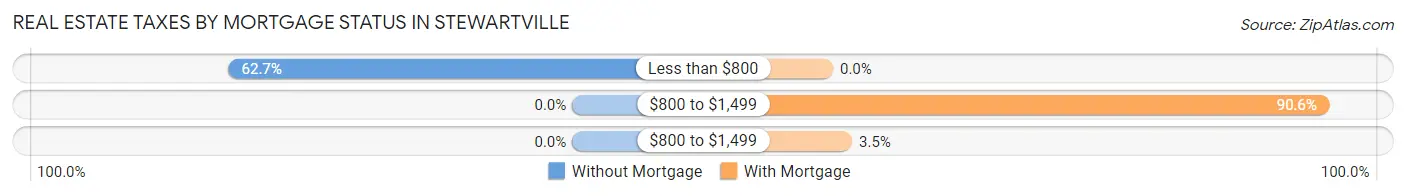
| Property Taxes | Without Mortgage | With Mortgage |
| Less than $800 | 170 (62.7%) | 0 (0.0%) |
| $800 to $1,499 | 0 (0.0%) | 182 (90.5%) |
| $800 to $1,499 | 0 (0.0%) | 7 (3.5%) |
| Total | 271 (100.0%) | 201 (100.0%) |
Health & Disability in Stewartville
Health Insurance Coverage by Age in Stewartville
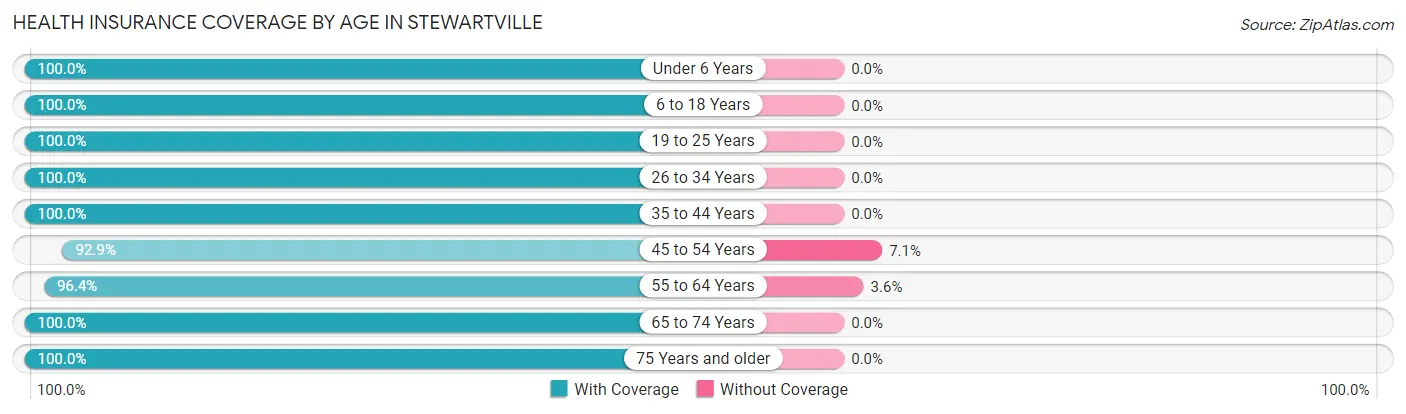
| Age Bracket | With Coverage | Without Coverage |
| Under 6 Years | 81 (100.0%) | 0 (0.0%) |
| 6 to 18 Years | 218 (100.0%) | 0 (0.0%) |
| 19 to 25 Years | 63 (100.0%) | 0 (0.0%) |
| 26 to 34 Years | 74 (100.0%) | 0 (0.0%) |
| 35 to 44 Years | 318 (100.0%) | 0 (0.0%) |
| 45 to 54 Years | 105 (92.9%) | 8 (7.1%) |
| 55 to 64 Years | 374 (96.4%) | 14 (3.6%) |
| 65 to 74 Years | 190 (100.0%) | 0 (0.0%) |
| 75 Years and older | 224 (100.0%) | 0 (0.0%) |
| Total | 1,647 (98.7%) | 22 (1.3%) |
Health Insurance Coverage by Citizenship Status in Stewartville
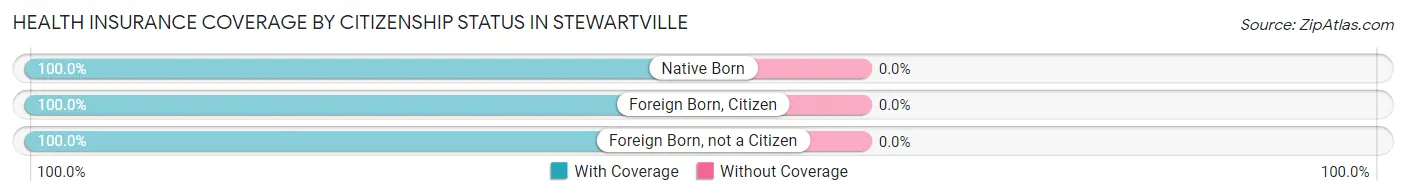
| Citizenship Status | With Coverage | Without Coverage |
| Native Born | 81 (100.0%) | 0 (0.0%) |
| Foreign Born, Citizen | 218 (100.0%) | 0 (0.0%) |
| Foreign Born, not a Citizen | 63 (100.0%) | 0 (0.0%) |
Health Insurance Coverage by Household Income in Stewartville
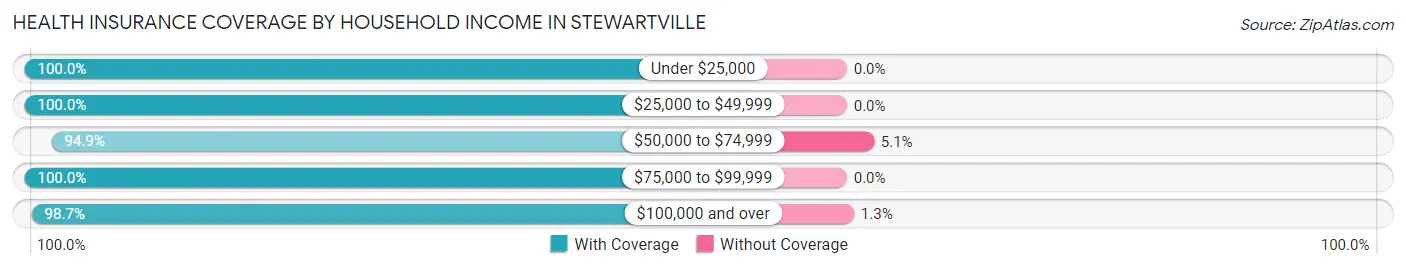
| Household Income | With Coverage | Without Coverage |
| Under $25,000 | 106 (100.0%) | 0 (0.0%) |
| $25,000 to $49,999 | 349 (100.0%) | 0 (0.0%) |
| $50,000 to $74,999 | 262 (94.9%) | 14 (5.1%) |
| $75,000 to $99,999 | 337 (100.0%) | 0 (0.0%) |
| $100,000 and over | 593 (98.7%) | 8 (1.3%) |
Public vs Private Health Insurance Coverage by Age in Stewartville
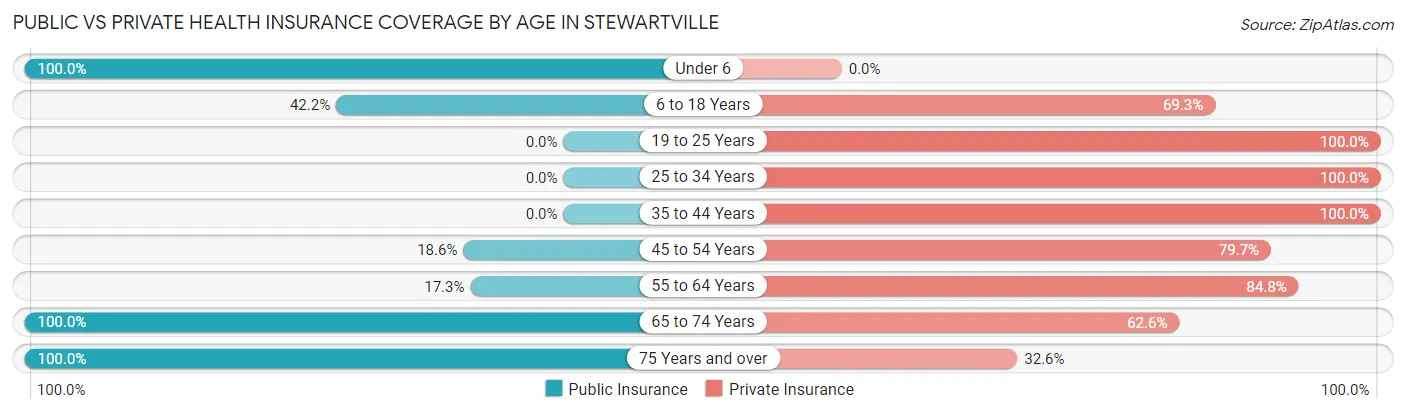
| Age Bracket | Public Insurance | Private Insurance |
| Under 6 | 81 (100.0%) | 0 (0.0%) |
| 6 to 18 Years | 92 (42.2%) | 151 (69.3%) |
| 19 to 25 Years | 0 (0.0%) | 63 (100.0%) |
| 25 to 34 Years | 0 (0.0%) | 74 (100.0%) |
| 35 to 44 Years | 0 (0.0%) | 318 (100.0%) |
| 45 to 54 Years | 21 (18.6%) | 90 (79.6%) |
| 55 to 64 Years | 67 (17.3%) | 329 (84.8%) |
| 65 to 74 Years | 190 (100.0%) | 119 (62.6%) |
| 75 Years and over | 224 (100.0%) | 73 (32.6%) |
| Total | 675 (40.4%) | 1,217 (72.9%) |
Disability Status by Sex by Age in Stewartville
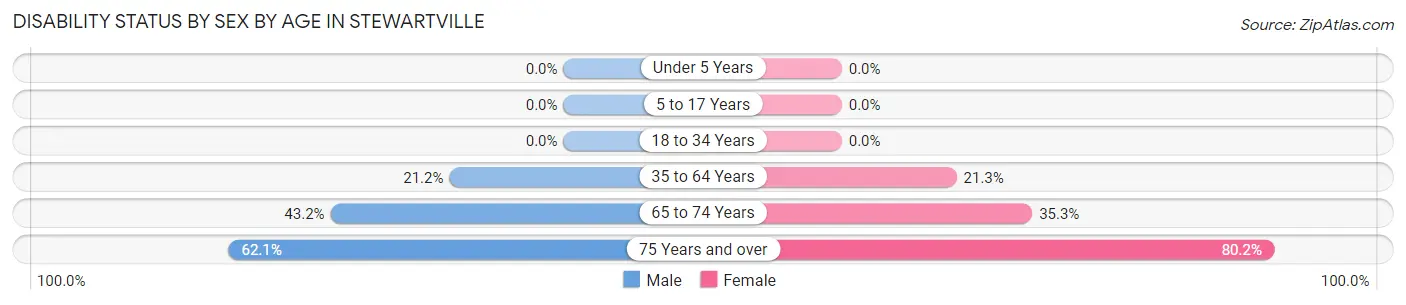
| Age Bracket | Male | Female |
| Under 5 Years | 0 (0.0%) | 0 (0.0%) |
| 5 to 17 Years | 0 (0.0%) | 0 (0.0%) |
| 18 to 34 Years | 0 (0.0%) | 0 (0.0%) |
| 35 to 64 Years | 83 (21.2%) | 91 (21.3%) |
| 65 to 74 Years | 32 (43.2%) | 41 (35.3%) |
| 75 Years and over | 64 (62.1%) | 97 (80.2%) |
Disability Class by Sex by Age in Stewartville
Disability Class: Hearing Difficulty
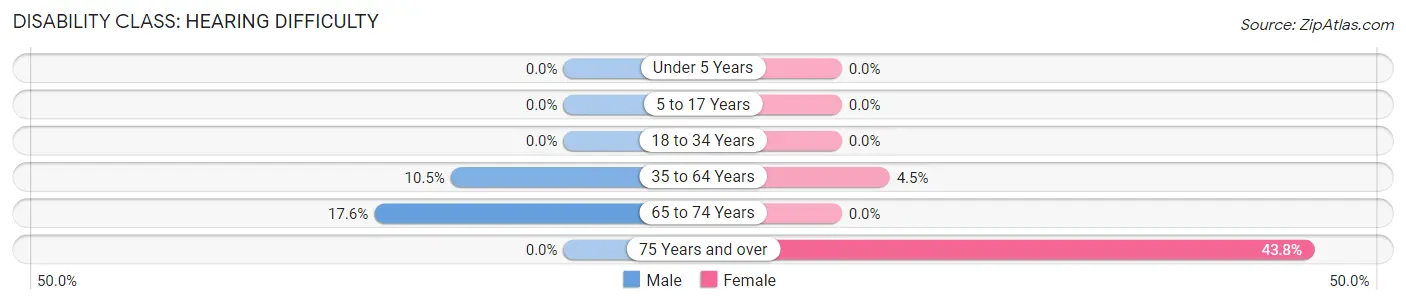
| Age Bracket | Male | Female |
| Under 5 Years | 0 (0.0%) | 0 (0.0%) |
| 5 to 17 Years | 0 (0.0%) | 0 (0.0%) |
| 18 to 34 Years | 0 (0.0%) | 0 (0.0%) |
| 35 to 64 Years | 41 (10.5%) | 19 (4.4%) |
| 65 to 74 Years | 13 (17.6%) | 0 (0.0%) |
| 75 Years and over | 0 (0.0%) | 53 (43.8%) |
Disability Class: Vision Difficulty
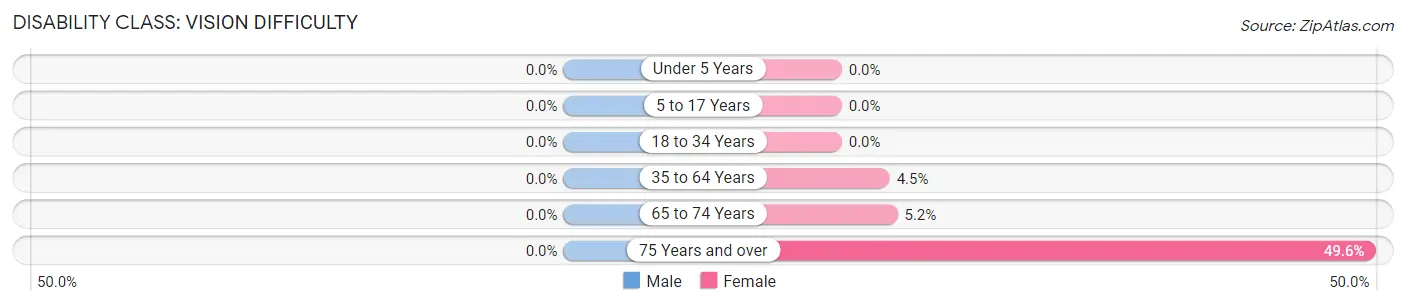
| Age Bracket | Male | Female |
| Under 5 Years | 0 (0.0%) | 0 (0.0%) |
| 5 to 17 Years | 0 (0.0%) | 0 (0.0%) |
| 18 to 34 Years | 0 (0.0%) | 0 (0.0%) |
| 35 to 64 Years | 0 (0.0%) | 19 (4.4%) |
| 65 to 74 Years | 0 (0.0%) | 6 (5.2%) |
| 75 Years and over | 0 (0.0%) | 60 (49.6%) |
Disability Class: Cognitive Difficulty
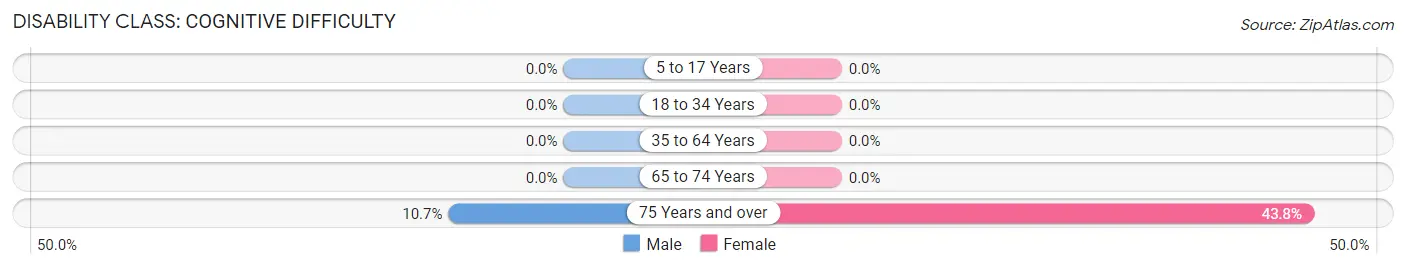
| Age Bracket | Male | Female |
| 5 to 17 Years | 0 (0.0%) | 0 (0.0%) |
| 18 to 34 Years | 0 (0.0%) | 0 (0.0%) |
| 35 to 64 Years | 0 (0.0%) | 0 (0.0%) |
| 65 to 74 Years | 0 (0.0%) | 0 (0.0%) |
| 75 Years and over | 11 (10.7%) | 53 (43.8%) |
Disability Class: Ambulatory Difficulty

| Age Bracket | Male | Female |
| 5 to 17 Years | 0 (0.0%) | 0 (0.0%) |
| 18 to 34 Years | 0 (0.0%) | 0 (0.0%) |
| 35 to 64 Years | 56 (14.3%) | 91 (21.3%) |
| 65 to 74 Years | 19 (25.7%) | 35 (30.2%) |
| 75 Years and over | 64 (62.1%) | 97 (80.2%) |
Disability Class: Self-Care Difficulty
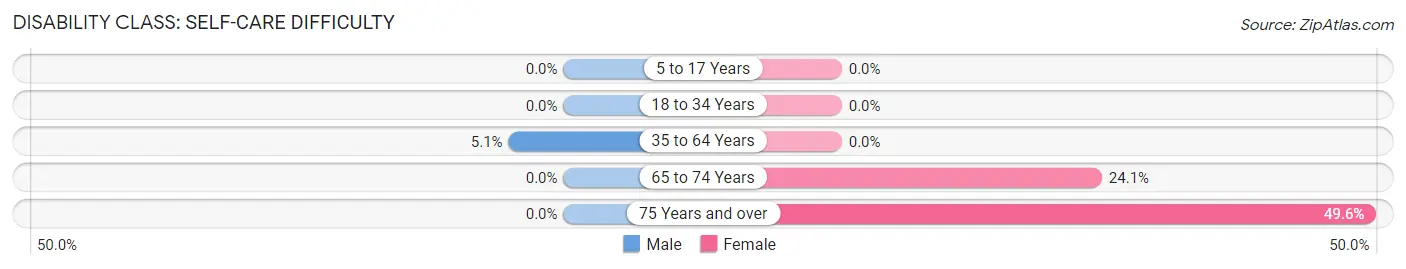
| Age Bracket | Male | Female |
| 5 to 17 Years | 0 (0.0%) | 0 (0.0%) |
| 18 to 34 Years | 0 (0.0%) | 0 (0.0%) |
| 35 to 64 Years | 20 (5.1%) | 0 (0.0%) |
| 65 to 74 Years | 0 (0.0%) | 28 (24.1%) |
| 75 Years and over | 0 (0.0%) | 60 (49.6%) |
Technology Access in Stewartville
Computing Device Access in Stewartville
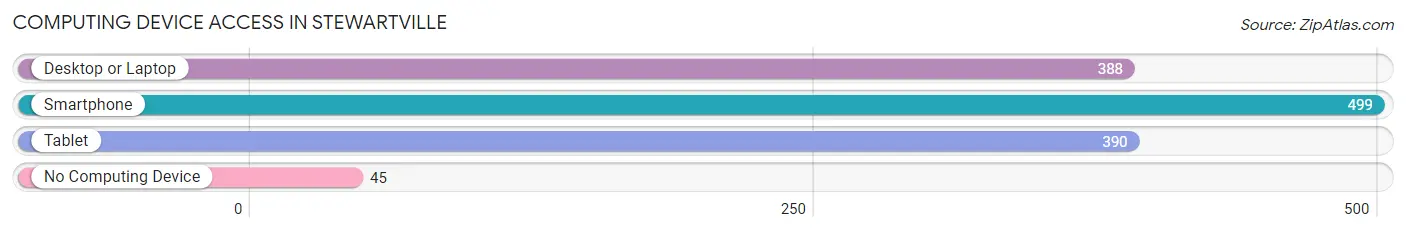
| Device Type | # Households | % Households |
| Desktop or Laptop | 388 | 63.0% |
| Smartphone | 499 | 81.0% |
| Tablet | 390 | 63.3% |
| No Computing Device | 45 | 7.3% |
| Total | 616 | 100.0% |
Internet Access in Stewartville
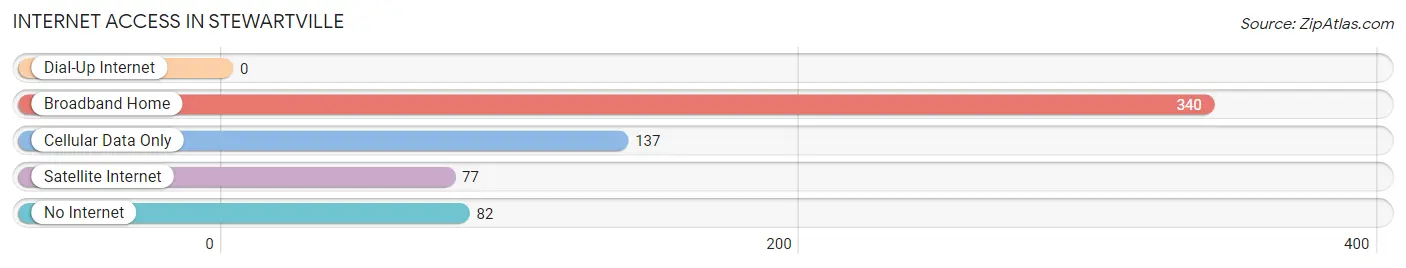
| Internet Type | # Households | % Households |
| Dial-Up Internet | 0 | 0.0% |
| Broadband Home | 340 | 55.2% |
| Cellular Data Only | 137 | 22.2% |
| Satellite Internet | 77 | 12.5% |
| No Internet | 82 | 13.3% |
| Total | 616 | 100.0% |
Stewartville Summary
Stewartville is a small town located in the state of Alabama, in the United States. It is situated in the northwest corner of the state, in the foothills of the Appalachian Mountains. The town is located in the county of Colbert, and is part of the Florence-Muscle Shoals Metropolitan Statistical Area. The population of Stewartville was estimated to be 1,072 in 2019.
History
The area that is now Stewartville was first settled in the early 1800s by settlers from North Carolina and Virginia. The town was originally known as "Stewart's Crossroads" after the Stewart family, who were among the first settlers. The town was officially incorporated in 1887 and was named after the Stewart family.
In the late 1800s, Stewartville was a thriving agricultural community, with cotton and corn being the main crops. The town also had a number of small businesses, including a general store, a blacksmith shop, and a grist mill.
In the early 1900s, the town began to decline as the railroad bypassed it and the population began to move away. The town was nearly abandoned by the 1950s, but in the late 1960s, the town began to experience a revival as people began to move back to the area.
Geography
Stewartville is located in the northwest corner of Alabama, in the foothills of the Appalachian Mountains. The town is situated in the county of Colbert, and is part of the Florence-Muscle Shoals Metropolitan Statistical Area. The town is located at an elevation of 845 feet above sea level.
The town is located near the Tennessee River, which provides a number of recreational opportunities, including fishing, boating, and swimming. The town is also located near the Natchez Trace Parkway, a scenic byway that runs through the area.
Economy
The economy of Stewartville is largely based on agriculture and tourism. The town is home to a number of small businesses, including restaurants, retail stores, and a few small manufacturing companies. The town is also home to a number of farms, which produce a variety of crops, including cotton, corn, soybeans, and wheat.
The town is also home to a number of tourist attractions, including the Natchez Trace Parkway, the Tennessee River, and the nearby Muscle Shoals National Heritage Area. The town is also home to a number of historic sites, including the Stewartville Cemetery, which dates back to the early 1800s.
Demographics
The population of Stewartville was estimated to be 1,072 in 2019. The town has a median age of 44.7 years, with the majority of the population being white (94.2%). The town also has a small African American population (3.2%), as well as a small Hispanic population (1.2%). The town has a median household income of $37,941, and a poverty rate of 17.3%.
Common Questions
What is Per Capita Income in Stewartville?
Per Capita income in Stewartville is $33,371.
What is the Median Family Income in Stewartville?
Median Family Income in Stewartville is $83,429.
What is the Median Household income in Stewartville?
Median Household Income in Stewartville is $59,000.
What is Income or Wage Gap in Stewartville?
Income or Wage Gap in Stewartville is 47.8%.
Women in Stewartville earn 52.2 cents for every dollar earned by a man.
What is Inequality or Gini Index in Stewartville?
Inequality or Gini Index in Stewartville is 0.50.
What is the Total Population of Stewartville?
Total Population of Stewartville is 1,669.
What is the Total Male Population of Stewartville?
Total Male Population of Stewartville is 789.
What is the Total Female Population of Stewartville?
Total Female Population of Stewartville is 880.
What is the Ratio of Males per 100 Females in Stewartville?
There are 89.66 Males per 100 Females in Stewartville.
What is the Ratio of Females per 100 Males in Stewartville?
There are 111.53 Females per 100 Males in Stewartville.
What is the Median Population Age in Stewartville?
Median Population Age in Stewartville is 50.0 Years.
What is the Average Family Size in Stewartville
Average Family Size in Stewartville is 3.1 People.
What is the Average Household Size in Stewartville
Average Household Size in Stewartville is 2.7 People.
How Large is the Labor Force in Stewartville?
There are 757 People in the Labor Forcein in Stewartville.
What is the Percentage of People in the Labor Force in Stewartville?
55.0% of People are in the Labor Force in Stewartville.
What is the Unemployment Rate in Stewartville?
Unemployment Rate in Stewartville is 1.6%.