Littleville, AL Map & Demographics
Littleville Map
Littleville Overview
$29,638
PER CAPITA INCOME
$60,469
AVG FAMILY INCOME
$51,667
AVG HOUSEHOLD INCOME
40.2%
WAGE / INCOME GAP [ % ]
59.8¢/ $1
WAGE / INCOME GAP [ $ ]
0.35
INEQUALITY / GINI INDEX
821
TOTAL POPULATION
369
MALE POPULATION
452
FEMALE POPULATION
81.64
MALES / 100 FEMALES
122.49
FEMALES / 100 MALES
49.7
MEDIAN AGE
2.6
AVG FAMILY SIZE
2.2
AVG HOUSEHOLD SIZE
360
LABOR FORCE [ PEOPLE ]
51.3%
PERCENT IN LABOR FORCE
2.3%
UNEMPLOYMENT RATE
Littleville Area Codes
Income in Littleville
Income Overview in Littleville
Per Capita Income in Littleville is $29,638, while median incomes of families and households are $60,469 and $51,667 respectively.
| Characteristic | Number | Measure |
| Per Capita Income | 821 | $29,638 |
| Median Family Income | 268 | $60,469 |
| Mean Family Income | 268 | $71,192 |
| Median Household Income | 374 | $51,667 |
| Mean Household Income | 374 | $64,900 |
| Income Deficit | 268 | $0 |
| Wage / Income Gap (%) | 821 | 40.18% |
| Wage / Income Gap ($) | 821 | 59.82¢ per $1 |
| Gini / Inequality Index | 821 | 0.35 |
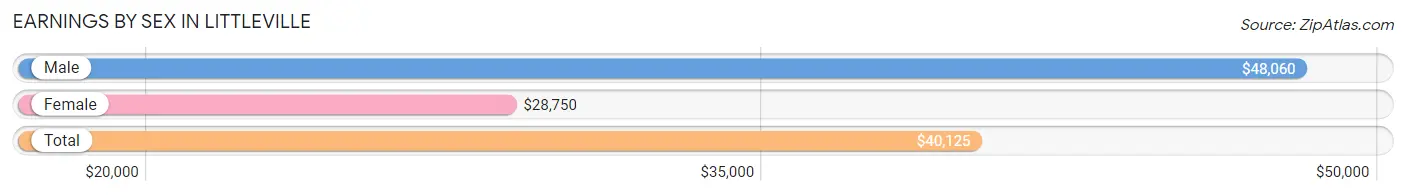
Earnings by Sex in Littleville
Average Earnings in Littleville are $40,125, $48,060 for men and $28,750 for women, a difference of 40.2%.
| Sex | Number | Average Earnings |
| Male | 193 (52.0%) | $48,060 |
| Female | 178 (48.0%) | $28,750 |
| Total | 371 (100.0%) | $40,125 |
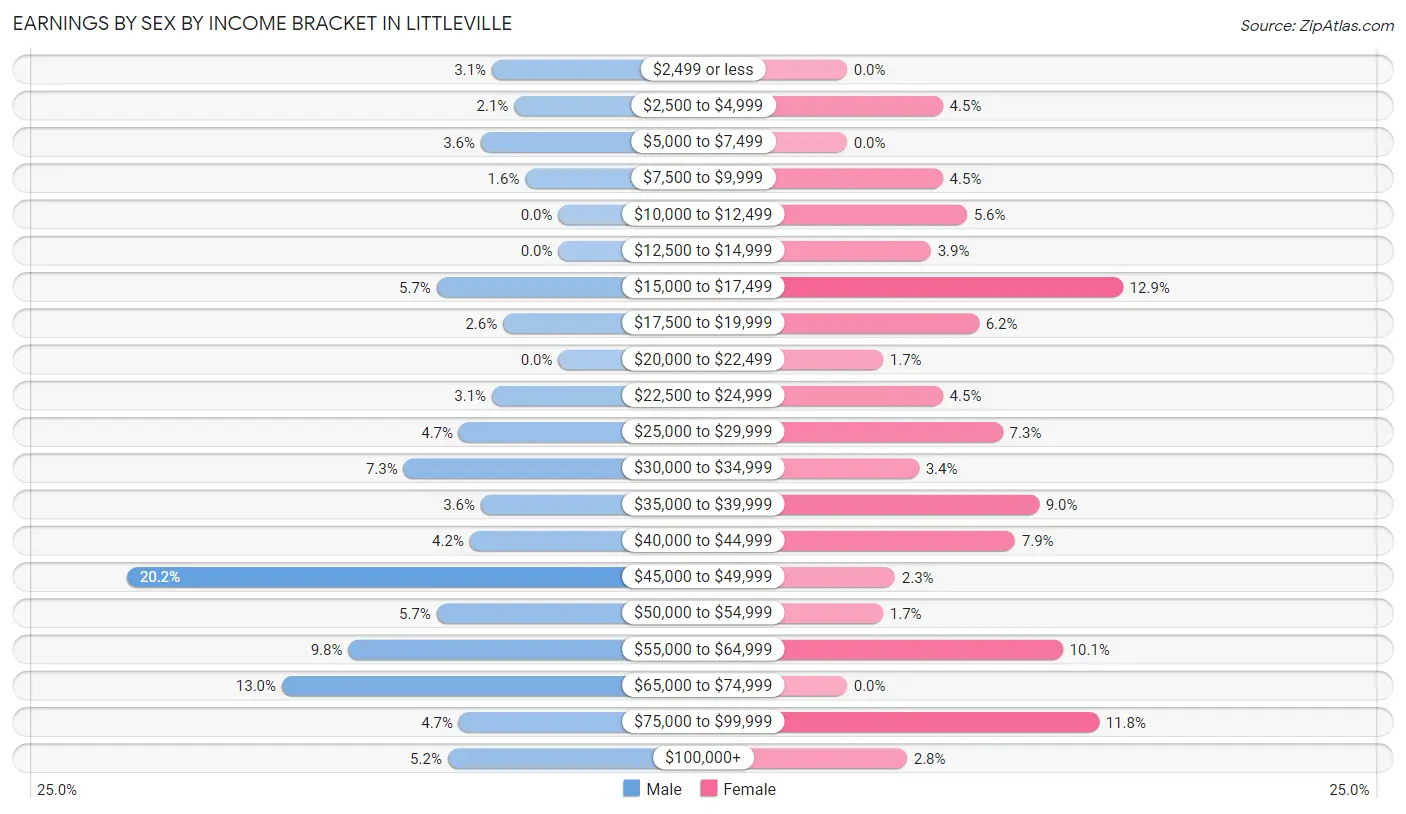
Earnings by Sex by Income Bracket in Littleville
The most common earnings brackets in Littleville are $45,000 to $49,999 for men (39 | 20.2%) and $15,000 to $17,499 for women (23 | 12.9%).
| Income | Male | Female |
| $2,499 or less | 6 (3.1%) | 0 (0.0%) |
| $2,500 to $4,999 | 4 (2.1%) | 8 (4.5%) |
| $5,000 to $7,499 | 7 (3.6%) | 0 (0.0%) |
| $7,500 to $9,999 | 3 (1.5%) | 8 (4.5%) |
| $10,000 to $12,499 | 0 (0.0%) | 10 (5.6%) |
| $12,500 to $14,999 | 0 (0.0%) | 7 (3.9%) |
| $15,000 to $17,499 | 11 (5.7%) | 23 (12.9%) |
| $17,500 to $19,999 | 5 (2.6%) | 11 (6.2%) |
| $20,000 to $22,499 | 0 (0.0%) | 3 (1.7%) |
| $22,500 to $24,999 | 6 (3.1%) | 8 (4.5%) |
| $25,000 to $29,999 | 9 (4.7%) | 13 (7.3%) |
| $30,000 to $34,999 | 14 (7.2%) | 6 (3.4%) |
| $35,000 to $39,999 | 7 (3.6%) | 16 (9.0%) |
| $40,000 to $44,999 | 8 (4.2%) | 14 (7.9%) |
| $45,000 to $49,999 | 39 (20.2%) | 4 (2.2%) |
| $50,000 to $54,999 | 11 (5.7%) | 3 (1.7%) |
| $55,000 to $64,999 | 19 (9.8%) | 18 (10.1%) |
| $65,000 to $74,999 | 25 (13.0%) | 0 (0.0%) |
| $75,000 to $99,999 | 9 (4.7%) | 21 (11.8%) |
| $100,000+ | 10 (5.2%) | 5 (2.8%) |
| Total | 193 (100.0%) | 178 (100.0%) |
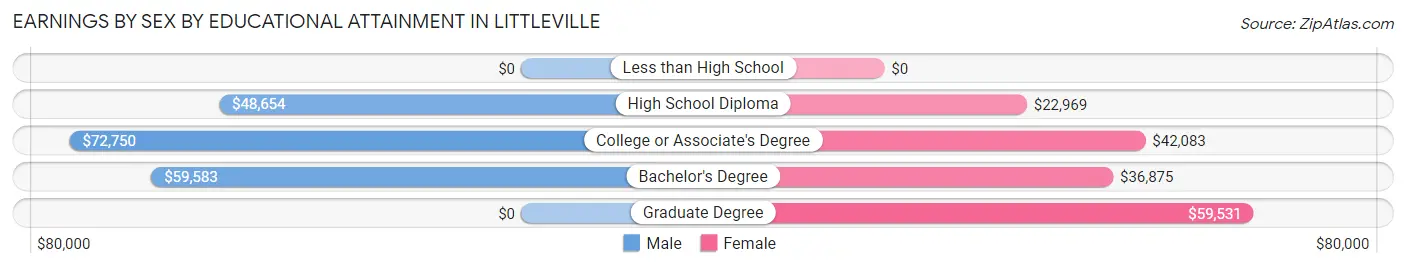
Earnings by Sex by Educational Attainment in Littleville
Average earnings in Littleville are $49,871 for men and $37,308 for women, a difference of 25.2%. Men with an educational attainment of college or associate's degree enjoy the highest average annual earnings of $72,750, while those with high school diploma education earn the least with $48,654. Women with an educational attainment of graduate degree earn the most with the average annual earnings of $59,531, while those with high school diploma education have the smallest earnings of $22,969.
| Educational Attainment | Male Income | Female Income |
| Less than High School | - | - |
| High School Diploma | $48,654 | $22,969 |
| College or Associate's Degree | $72,750 | $42,083 |
| Bachelor's Degree | $59,583 | $36,875 |
| Graduate Degree | - | - |
| Total | $49,871 | $37,308 |
Family Income in Littleville
Family Income Brackets in Littleville
According to the Littleville family income data, there are 60 families falling into the $35,000 to $49,999 income range, which is the most common income bracket and makes up 22.4% of all families.
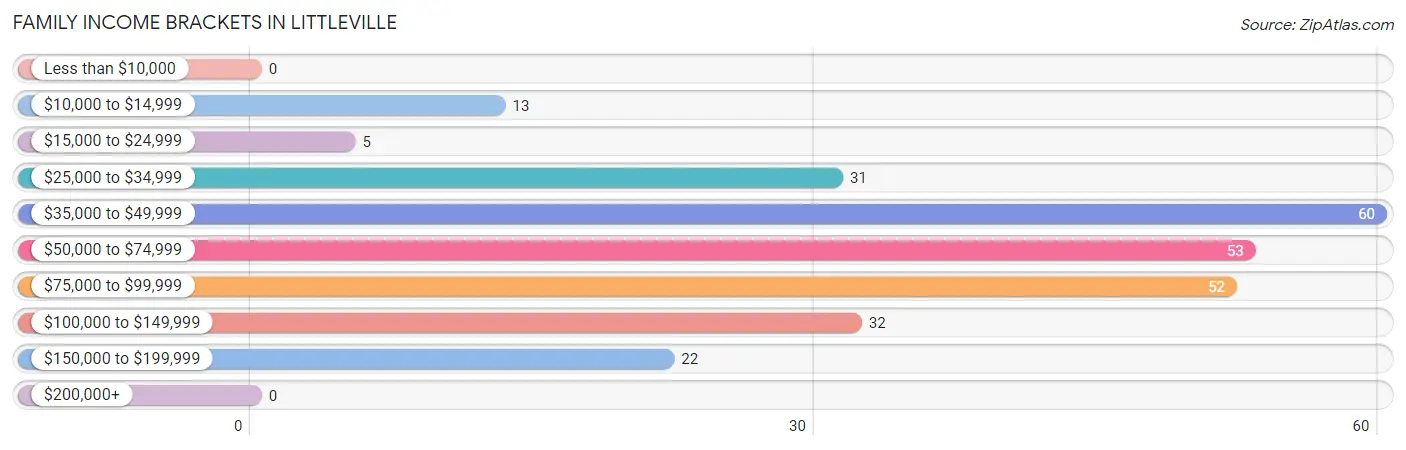
| Income Bracket | # Families | % Families |
| Less than $10,000 | 0 | 0.0% |
| $10,000 to $14,999 | 13 | 4.9% |
| $15,000 to $24,999 | 5 | 1.9% |
| $25,000 to $34,999 | 31 | 11.6% |
| $35,000 to $49,999 | 60 | 22.4% |
| $50,000 to $74,999 | 53 | 19.8% |
| $75,000 to $99,999 | 52 | 19.4% |
| $100,000 to $149,999 | 32 | 11.9% |
| $150,000 to $199,999 | 22 | 8.2% |
| $200,000+ | 0 | 0.0% |
Family Income by Famaliy Size in Littleville
4-person families (28 | 10.4%) account for the highest median family income in Littleville with $122,308 per family, while 4-person families (28 | 10.4%) have the highest median income of $30,577 per family member.
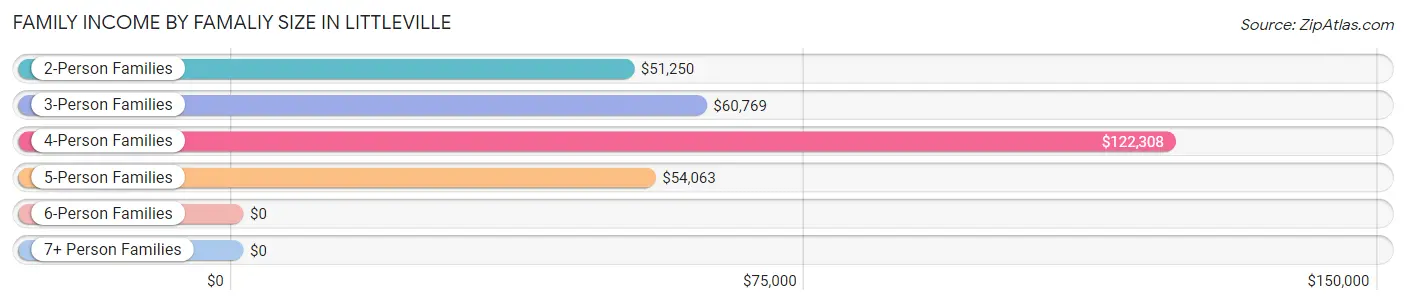
| Income Bracket | # Families | Median Income |
| 2-Person Families | 169 (63.1%) | $51,250 |
| 3-Person Families | 60 (22.4%) | $60,769 |
| 4-Person Families | 28 (10.4%) | $122,308 |
| 5-Person Families | 11 (4.1%) | $54,063 |
| 6-Person Families | 0 (0.0%) | $0 |
| 7+ Person Families | 0 (0.0%) | $0 |
| Total | 268 (100.0%) | $60,469 |
Family Income by Number of Earners in Littleville
The median family income in Littleville is $60,469, with families comprising 3+ earners (8) having the highest median family income of $145,833, while families with no earners (70) have the lowest median family income of $47,500, accounting for 3.0% and 26.1% of families, respectively.
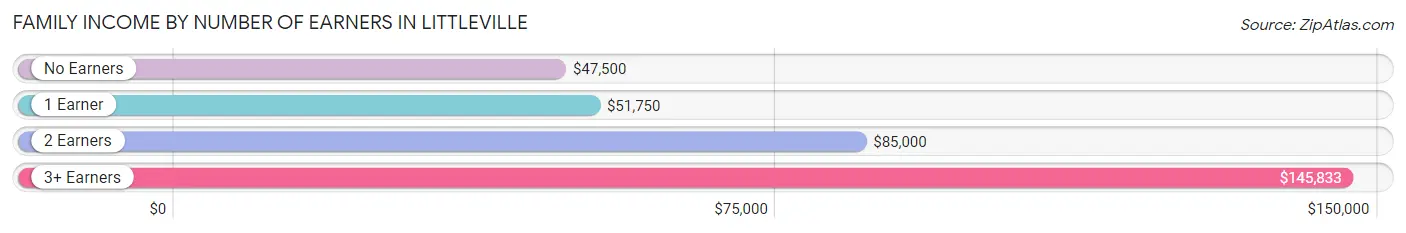
| Number of Earners | # Families | Median Income |
| No Earners | 70 (26.1%) | $47,500 |
| 1 Earner | 114 (42.5%) | $51,750 |
| 2 Earners | 76 (28.4%) | $85,000 |
| 3+ Earners | 8 (3.0%) | $145,833 |
| Total | 268 (100.0%) | $60,469 |
Household Income in Littleville
Household Income Brackets in Littleville
With 91 households falling in the category, the $35,000 to $49,999 income range is the most frequent in Littleville, accounting for 24.3% of all households. In contrast, only 3 households (0.8%) fall into the $200,000+ income bracket, making it the least populous group.
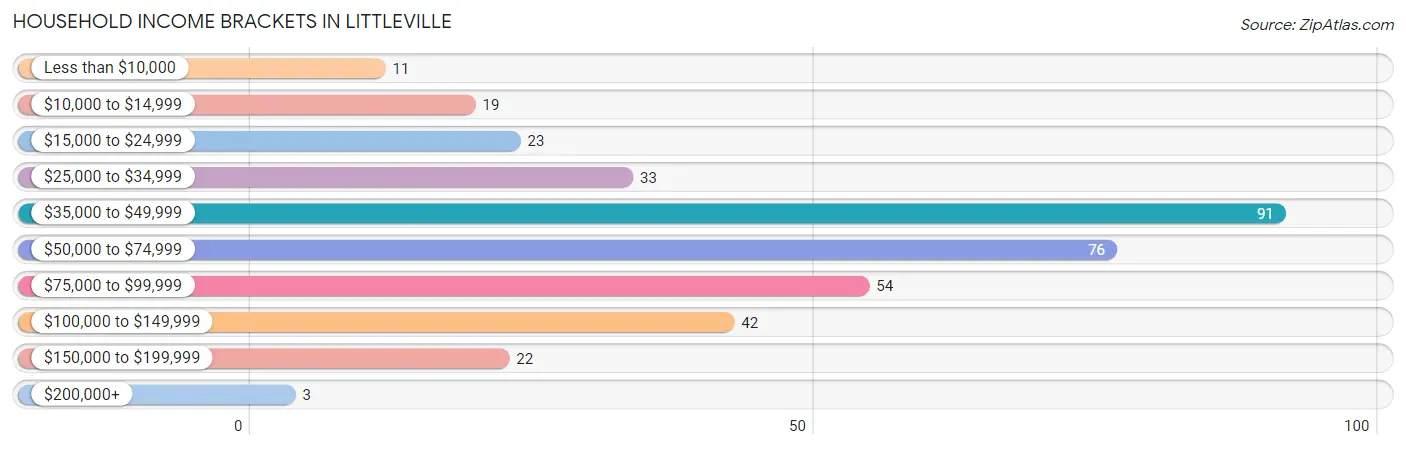
| Income Bracket | # Households | % Households |
| Less than $10,000 | 11 | 2.9% |
| $10,000 to $14,999 | 19 | 5.1% |
| $15,000 to $24,999 | 23 | 6.1% |
| $25,000 to $34,999 | 33 | 8.8% |
| $35,000 to $49,999 | 91 | 24.3% |
| $50,000 to $74,999 | 76 | 20.3% |
| $75,000 to $99,999 | 54 | 14.4% |
| $100,000 to $149,999 | 42 | 11.2% |
| $150,000 to $199,999 | 22 | 5.9% |
| $200,000+ | 3 | 0.8% |
Household Income by Householder Age in Littleville
The median household income in Littleville is $51,667, with the highest median household income of $60,577 found in the 45 to 64 years age bracket for the primary householder. A total of 96 households (25.7%) fall into this category. Meanwhile, the 15 to 24 years age bracket for the primary householder has the lowest median household income of $0, with 17 households (4.5%) in this group.
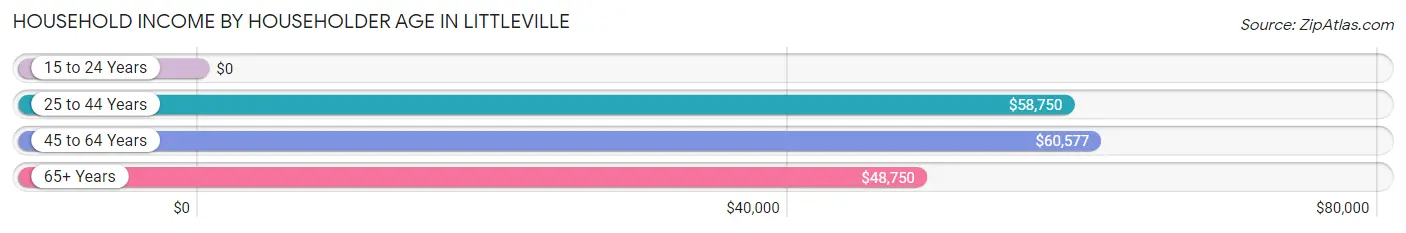
| Income Bracket | # Households | Median Income |
| 15 to 24 Years | 17 (4.5%) | $0 |
| 25 to 44 Years | 102 (27.3%) | $58,750 |
| 45 to 64 Years | 96 (25.7%) | $60,577 |
| 65+ Years | 159 (42.5%) | $48,750 |
| Total | 374 (100.0%) | $51,667 |
Poverty in Littleville
Income Below Poverty by Sex and Age in Littleville
With 6.5% poverty level for males and 11.3% for females among the residents of Littleville, 35 to 44 year old males and under 5 year old females are the most vulnerable to poverty, with 6 males (18.2%) and 6 females (27.3%) in their respective age groups living below the poverty level.
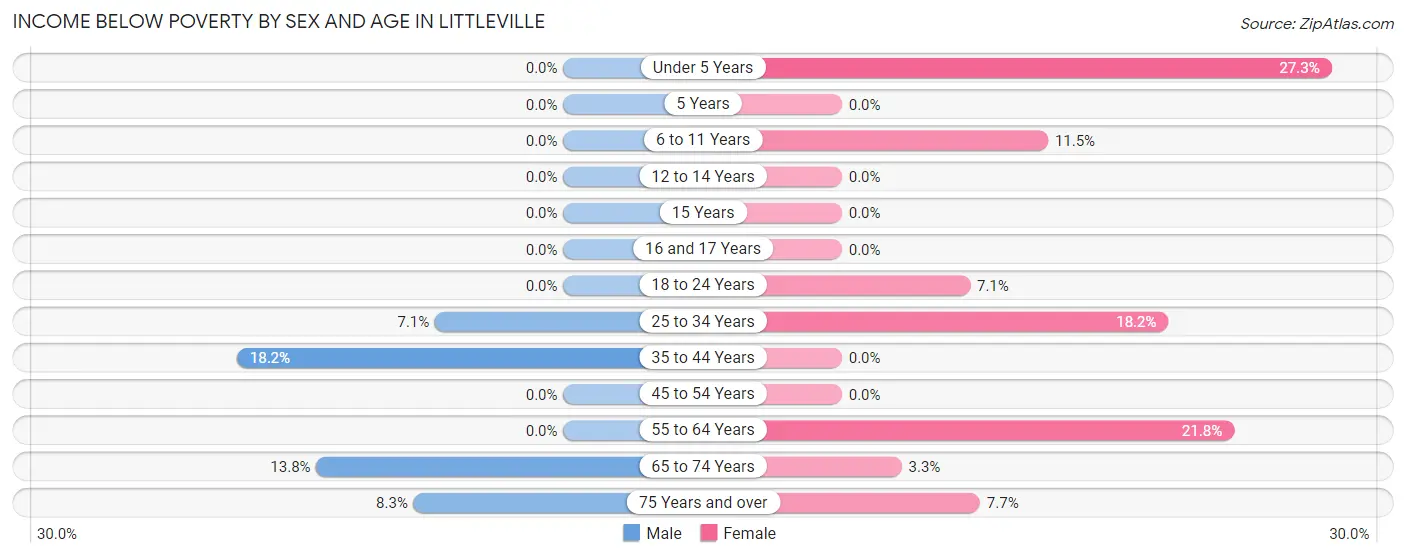
| Age Bracket | Male | Female |
| Under 5 Years | 0 (0.0%) | 6 (27.3%) |
| 5 Years | 0 (0.0%) | 0 (0.0%) |
| 6 to 11 Years | 0 (0.0%) | 7 (11.5%) |
| 12 to 14 Years | 0 (0.0%) | 0 (0.0%) |
| 15 Years | 0 (0.0%) | 0 (0.0%) |
| 16 and 17 Years | 0 (0.0%) | 0 (0.0%) |
| 18 to 24 Years | 0 (0.0%) | 3 (7.1%) |
| 25 to 34 Years | 4 (7.1%) | 10 (18.2%) |
| 35 to 44 Years | 6 (18.2%) | 0 (0.0%) |
| 45 to 54 Years | 0 (0.0%) | 0 (0.0%) |
| 55 to 64 Years | 0 (0.0%) | 19 (21.8%) |
| 65 to 74 Years | 11 (13.8%) | 3 (3.3%) |
| 75 Years and over | 3 (8.3%) | 3 (7.7%) |
| Total | 24 (6.5%) | 51 (11.3%) |
Income Above Poverty by Sex and Age in Littleville
According to the poverty statistics in Littleville, males aged under 5 years and females aged 12 to 14 years are the age groups that are most secure financially, with 100.0% of males and 100.0% of females in these age groups living above the poverty line.
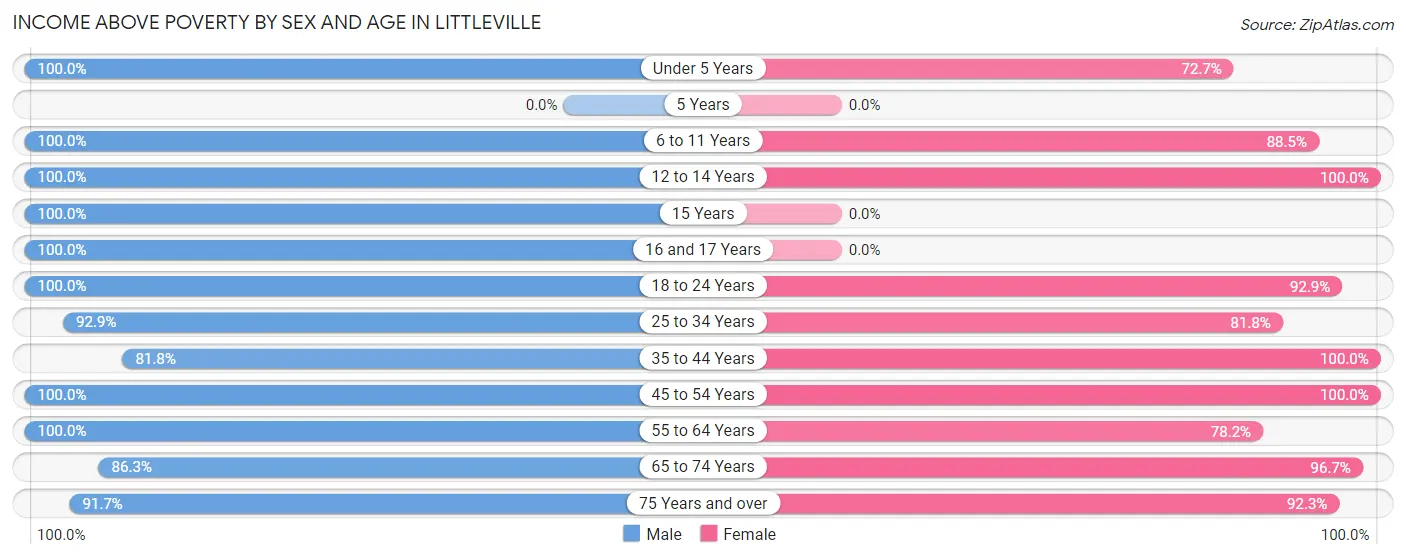
| Age Bracket | Male | Female |
| Under 5 Years | 11 (100.0%) | 16 (72.7%) |
| 5 Years | 0 (0.0%) | 0 (0.0%) |
| 6 to 11 Years | 12 (100.0%) | 54 (88.5%) |
| 12 to 14 Years | 8 (100.0%) | 3 (100.0%) |
| 15 Years | 2 (100.0%) | 0 (0.0%) |
| 16 and 17 Years | 4 (100.0%) | 0 (0.0%) |
| 18 to 24 Years | 46 (100.0%) | 39 (92.9%) |
| 25 to 34 Years | 52 (92.9%) | 45 (81.8%) |
| 35 to 44 Years | 27 (81.8%) | 23 (100.0%) |
| 45 to 54 Years | 60 (100.0%) | 30 (100.0%) |
| 55 to 64 Years | 21 (100.0%) | 68 (78.2%) |
| 65 to 74 Years | 69 (86.3%) | 87 (96.7%) |
| 75 Years and over | 33 (91.7%) | 36 (92.3%) |
| Total | 345 (93.5%) | 401 (88.7%) |
Income Below Poverty Among Married-Couple Families in Littleville
The poverty statistics for married-couple families in Littleville show that 6.6% or 13 of the total 197 families live below the poverty line. Families with 3 or 4 children have the highest poverty rate of 100.0%, comprising of 3 families. On the other hand, families with 1 or 2 children have the lowest poverty rate of 0.0%, which includes 0 families.
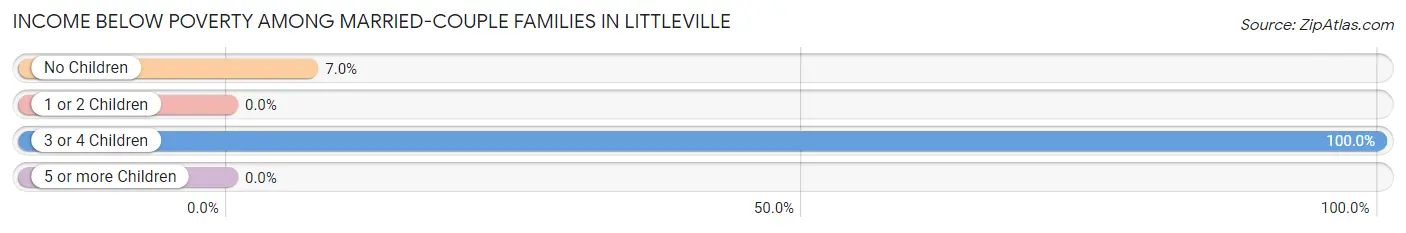
| Children | Above Poverty | Below Poverty |
| No Children | 133 (93.0%) | 10 (7.0%) |
| 1 or 2 Children | 51 (100.0%) | 0 (0.0%) |
| 3 or 4 Children | 0 (0.0%) | 3 (100.0%) |
| 5 or more Children | 0 (0.0%) | 0 (0.0%) |
| Total | 184 (93.4%) | 13 (6.6%) |
Income Below Poverty Among Single-Parent Households in Littleville
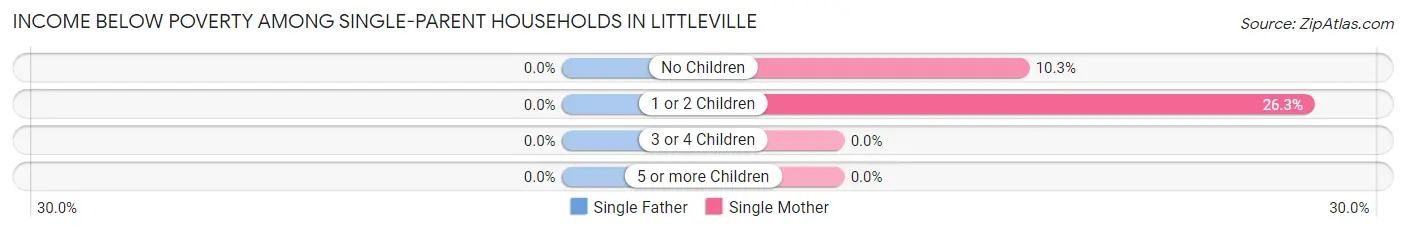
| Children | Single Father | Single Mother |
| No Children | 0 (0.0%) | 3 (10.3%) |
| 1 or 2 Children | 0 (0.0%) | 5 (26.3%) |
| 3 or 4 Children | 0 (0.0%) | 0 (0.0%) |
| 5 or more Children | 0 (0.0%) | 0 (0.0%) |
| Total | 0 (0.0%) | 8 (16.7%) |
Income Below Poverty Among Married-Couple vs Single-Parent Households in Littleville
The poverty data for Littleville shows that 13 of the married-couple family households (6.6%) and 8 of the single-parent households (11.3%) are living below the poverty level. Within the married-couple family households, those with 3 or 4 children have the highest poverty rate, with 3 households (100.0%) falling below the poverty line. Among the single-parent households, those with 1 or 2 children have the highest poverty rate, with 5 household (23.8%) living below poverty.
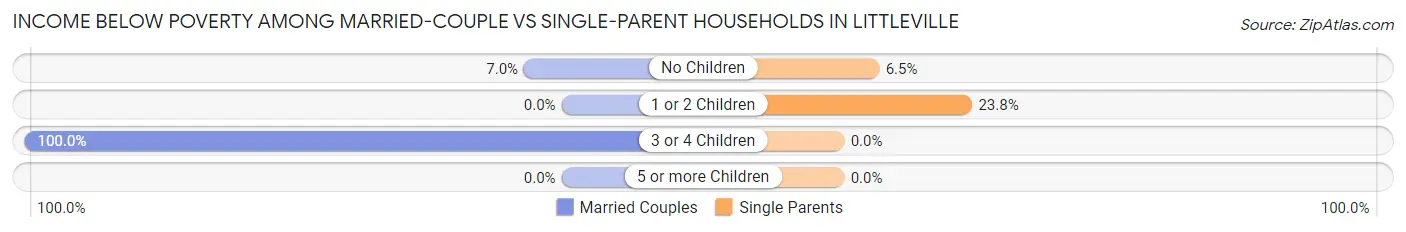
| Children | Married-Couple Families | Single-Parent Households |
| No Children | 10 (7.0%) | 3 (6.5%) |
| 1 or 2 Children | 0 (0.0%) | 5 (23.8%) |
| 3 or 4 Children | 3 (100.0%) | 0 (0.0%) |
| 5 or more Children | 0 (0.0%) | 0 (0.0%) |
| Total | 13 (6.6%) | 8 (11.3%) |
Race in Littleville
The most populous races in Littleville are White / Caucasian (789 | 96.1%), Hispanic or Latino (16 | 1.9%), and Two or more Races (16 | 1.9%).
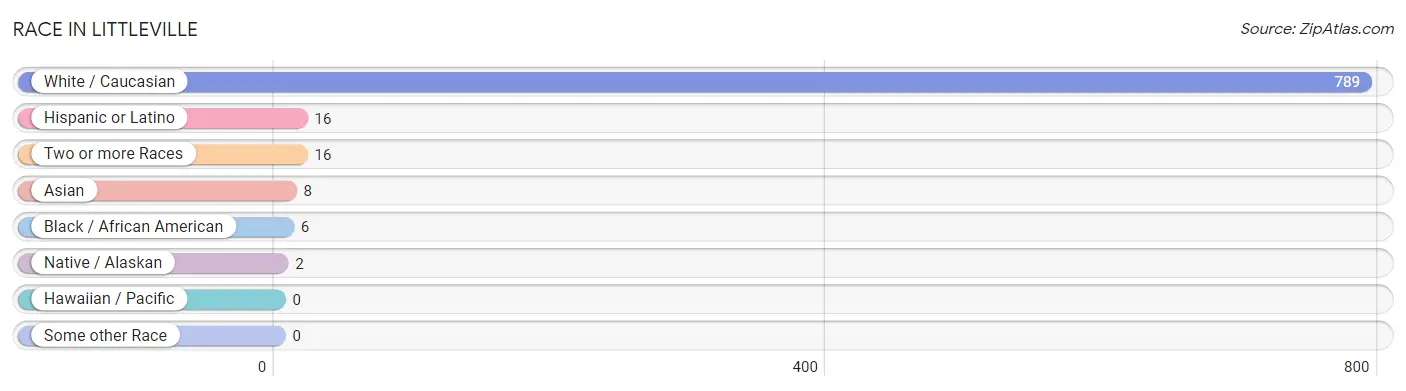
| Race | # Population | % Population |
| Asian | 8 | 1.0% |
| Black / African American | 6 | 0.7% |
| Hawaiian / Pacific | 0 | 0.0% |
| Hispanic or Latino | 16 | 1.9% |
| Native / Alaskan | 2 | 0.2% |
| White / Caucasian | 789 | 96.1% |
| Two or more Races | 16 | 1.9% |
| Some other Race | 0 | 0.0% |
| Total | 821 | 100.0% |
Ancestry in Littleville
The most populous ancestries reported in Littleville are American (299 | 36.4%), Irish (79 | 9.6%), English (77 | 9.4%), German (45 | 5.5%), and Italian (22 | 2.7%), together accounting for 63.6% of all Littleville residents.
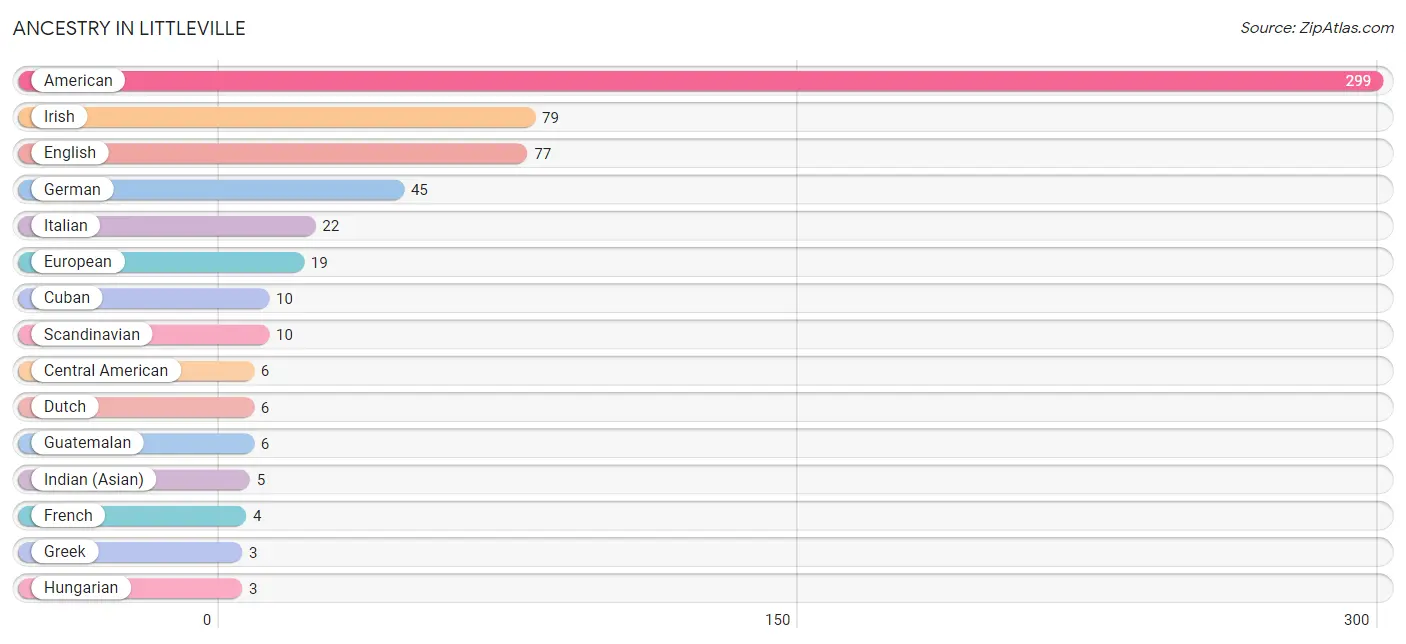
| Ancestry | # Population | % Population |
| American | 299 | 36.4% |
| Central American | 6 | 0.7% |
| Cherokee | 2 | 0.2% |
| Cuban | 10 | 1.2% |
| Dutch | 6 | 0.7% |
| English | 77 | 9.4% |
| European | 19 | 2.3% |
| French | 4 | 0.5% |
| German | 45 | 5.5% |
| Greek | 3 | 0.4% |
| Guatemalan | 6 | 0.7% |
| Hungarian | 3 | 0.4% |
| Indian (Asian) | 5 | 0.6% |
| Irish | 79 | 9.6% |
| Italian | 22 | 2.7% |
| Korean | 3 | 0.4% |
| Scandinavian | 10 | 1.2% |
| Scotch-Irish | 3 | 0.4% |
| Scottish | 3 | 0.4% | View All 19 Rows |
Immigrants in Littleville
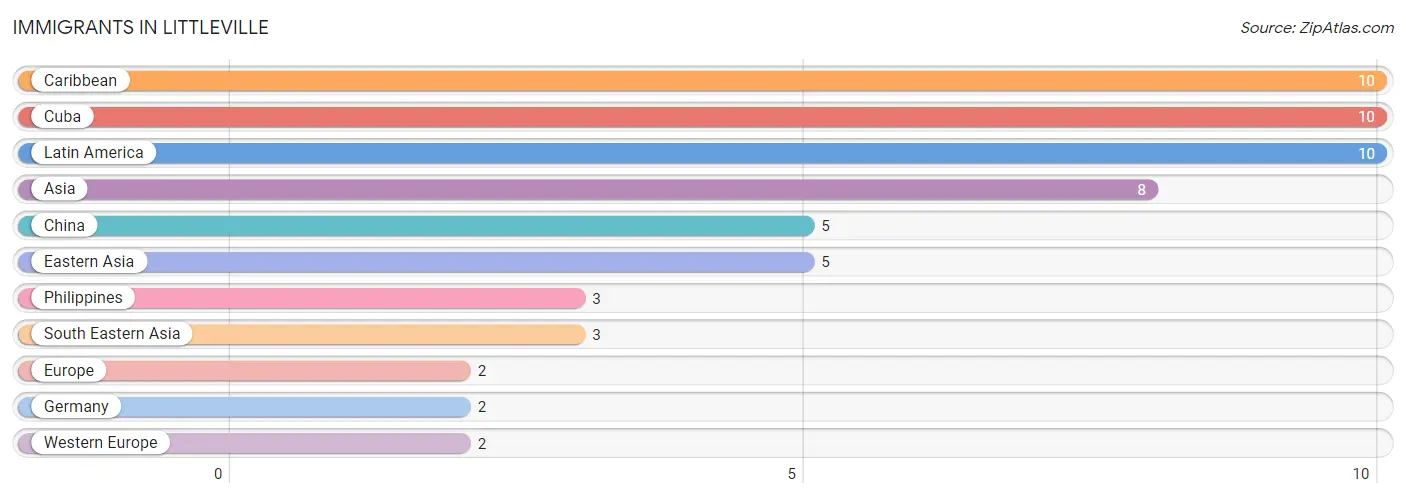
The most numerous immigrant groups reported in Littleville came from Caribbean (10 | 1.2%), Cuba (10 | 1.2%), Latin America (10 | 1.2%), Asia (8 | 1.0%), and China (5 | 0.6%), together accounting for 5.2% of all Littleville residents.
| Immigration Origin | # Population | % Population |
| Asia | 8 | 1.0% |
| Caribbean | 10 | 1.2% |
| China | 5 | 0.6% |
| Cuba | 10 | 1.2% |
| Eastern Asia | 5 | 0.6% |
| Europe | 2 | 0.2% |
| Germany | 2 | 0.2% |
| Latin America | 10 | 1.2% |
| Philippines | 3 | 0.4% |
| South Eastern Asia | 3 | 0.4% |
| Western Europe | 2 | 0.2% | View All 11 Rows |
Sex and Age in Littleville
Sex and Age in Littleville
The most populous age groups in Littleville are 20 to 24 Years (46 | 12.5%) for men and 65 to 69 Years (52 | 11.5%) for women.
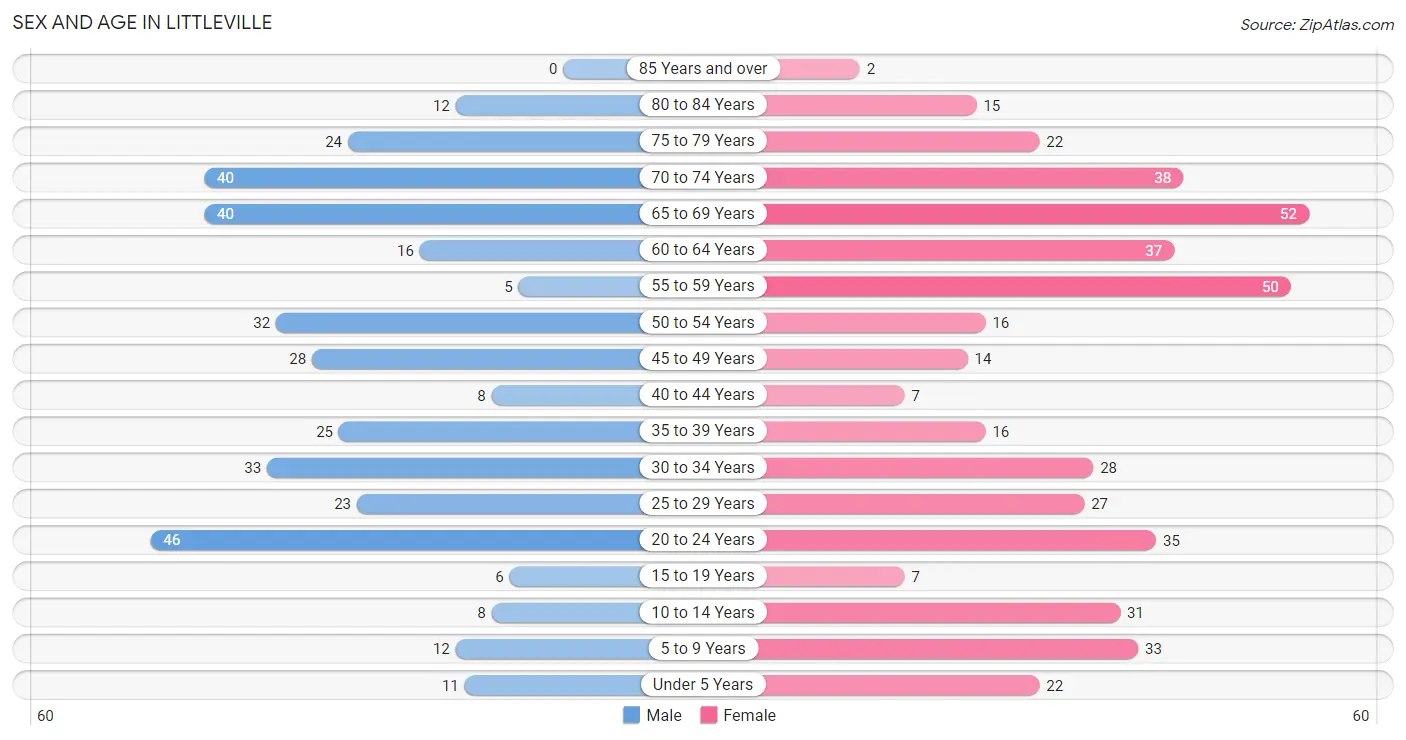
| Age Bracket | Male | Female |
| Under 5 Years | 11 (3.0%) | 22 (4.9%) |
| 5 to 9 Years | 12 (3.3%) | 33 (7.3%) |
| 10 to 14 Years | 8 (2.2%) | 31 (6.9%) |
| 15 to 19 Years | 6 (1.6%) | 7 (1.5%) |
| 20 to 24 Years | 46 (12.5%) | 35 (7.7%) |
| 25 to 29 Years | 23 (6.2%) | 27 (6.0%) |
| 30 to 34 Years | 33 (8.9%) | 28 (6.2%) |
| 35 to 39 Years | 25 (6.8%) | 16 (3.5%) |
| 40 to 44 Years | 8 (2.2%) | 7 (1.5%) |
| 45 to 49 Years | 28 (7.6%) | 14 (3.1%) |
| 50 to 54 Years | 32 (8.7%) | 16 (3.5%) |
| 55 to 59 Years | 5 (1.4%) | 50 (11.1%) |
| 60 to 64 Years | 16 (4.3%) | 37 (8.2%) |
| 65 to 69 Years | 40 (10.8%) | 52 (11.5%) |
| 70 to 74 Years | 40 (10.8%) | 38 (8.4%) |
| 75 to 79 Years | 24 (6.5%) | 22 (4.9%) |
| 80 to 84 Years | 12 (3.3%) | 15 (3.3%) |
| 85 Years and over | 0 (0.0%) | 2 (0.4%) |
| Total | 369 (100.0%) | 452 (100.0%) |
Families and Households in Littleville
Median Family Size in Littleville
The median family size in Littleville is 2.62 persons per family, with single female/mother families (48 | 17.9%) accounting for the largest median family size of 2.85 persons per family. On the other hand, married-couple families (197 | 73.5%) represent the smallest median family size with 2.56 persons per family.
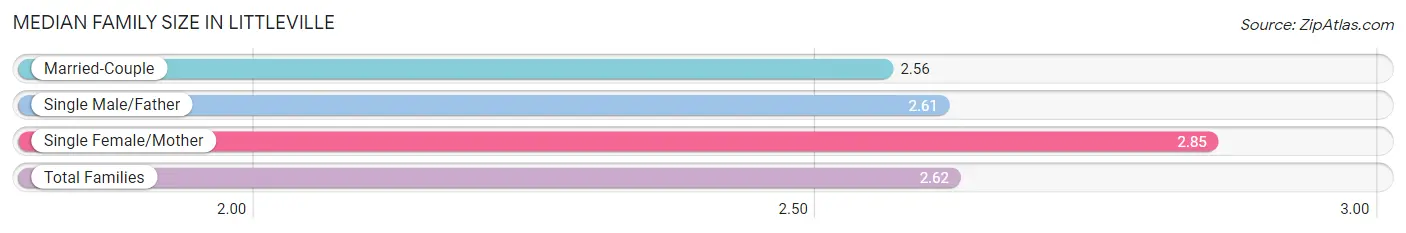
| Family Type | # Families | Family Size |
| Married-Couple | 197 (73.5%) | 2.56 |
| Single Male/Father | 23 (8.6%) | 2.61 |
| Single Female/Mother | 48 (17.9%) | 2.85 |
| Total Families | 268 (100.0%) | 2.62 |
Median Household Size in Littleville
The median household size in Littleville is 2.20 persons per household, with single female/mother households (48 | 12.8%) accounting for the largest median household size of 2.92 persons per household. non-family households (106 | 28.3%) represent the smallest median household size with 1.08 persons per household.
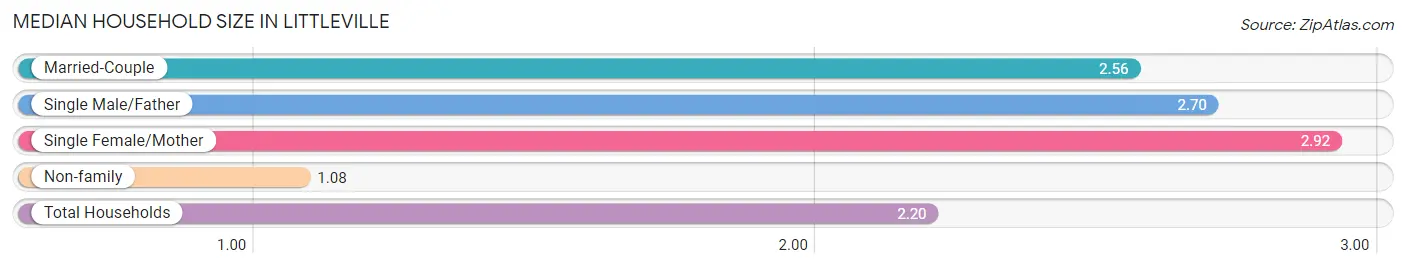
| Household Type | # Households | Household Size |
| Married-Couple | 197 (52.7%) | 2.56 |
| Single Male/Father | 23 (6.1%) | 2.70 |
| Single Female/Mother | 48 (12.8%) | 2.92 |
| Non-family | 106 (28.3%) | 1.08 |
| Total Households | 374 (100.0%) | 2.20 |
Household Size by Marriage Status in Littleville
Out of a total of 374 households in Littleville, 268 (71.7%) are family households, while 106 (28.3%) are nonfamily households. The most numerous type of family households are 2-person households, comprising 169, and the most common type of nonfamily households are 1-person households, comprising 97.
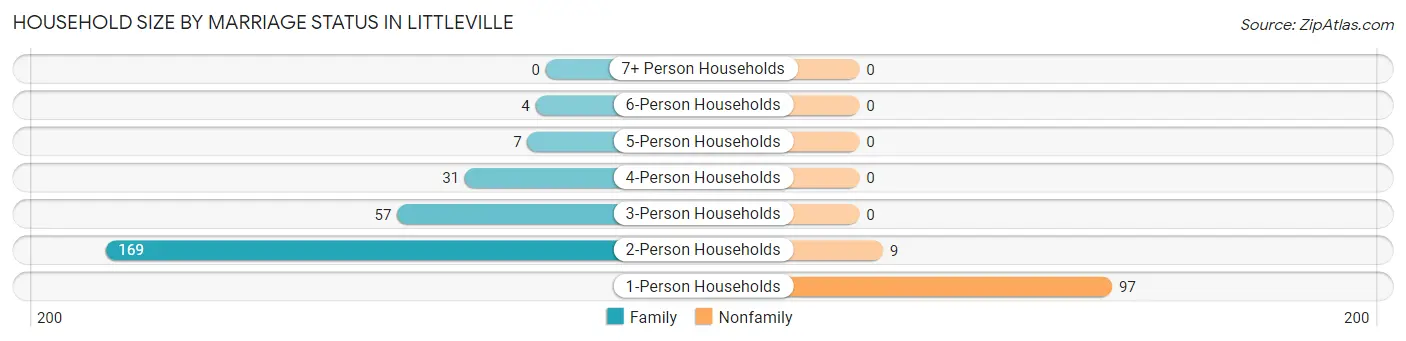
| Household Size | Family Households | Nonfamily Households |
| 1-Person Households | - | 97 (25.9%) |
| 2-Person Households | 169 (45.2%) | 9 (2.4%) |
| 3-Person Households | 57 (15.2%) | 0 (0.0%) |
| 4-Person Households | 31 (8.3%) | 0 (0.0%) |
| 5-Person Households | 7 (1.9%) | 0 (0.0%) |
| 6-Person Households | 4 (1.1%) | 0 (0.0%) |
| 7+ Person Households | 0 (0.0%) | 0 (0.0%) |
| Total | 268 (71.7%) | 106 (28.3%) |
Female Fertility in Littleville
Fertility by Age in Littleville
Average fertility rate in Littleville is 60.0 births per 1,000 women. Women in the age bracket of 20 to 34 years have the highest fertility rate with 89.0 births per 1,000 women. Women in the age bracket of 20 to 34 years acount for 100.0% of all women with births.
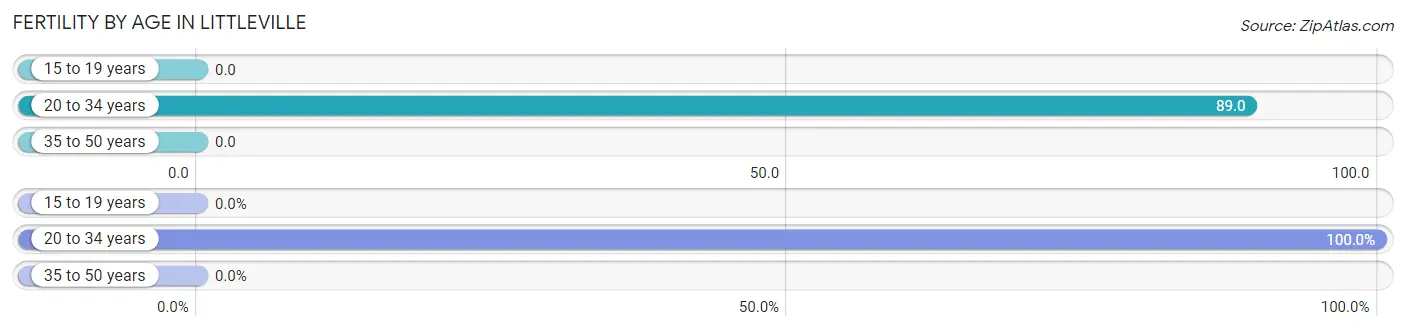
| Age Bracket | Women with Births | Births / 1,000 Women |
| 15 to 19 years | 0 (0.0%) | 0.0 |
| 20 to 34 years | 8 (100.0%) | 89.0 |
| 35 to 50 years | 0 (0.0%) | 0.0 |
| Total | 8 (100.0%) | 60.0 |
Fertility by Age by Marriage Status in Littleville
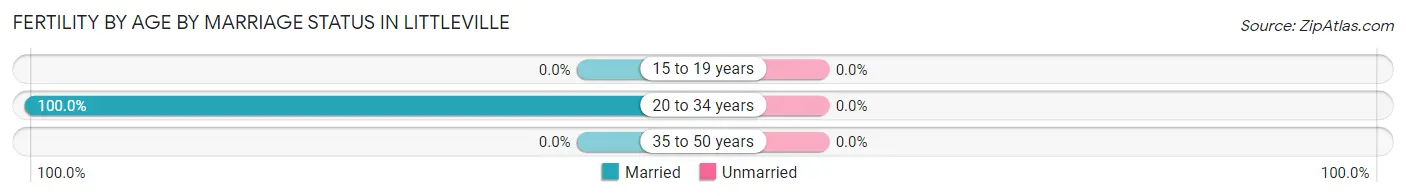
| Age Bracket | Married | Unmarried |
| 15 to 19 years | 0 (0.0%) | 0 (0.0%) |
| 20 to 34 years | 8 (100.0%) | 0 (0.0%) |
| 35 to 50 years | 0 (0.0%) | 0 (0.0%) |
| Total | 8 (100.0%) | 0 (0.0%) |
Fertility by Education in Littleville
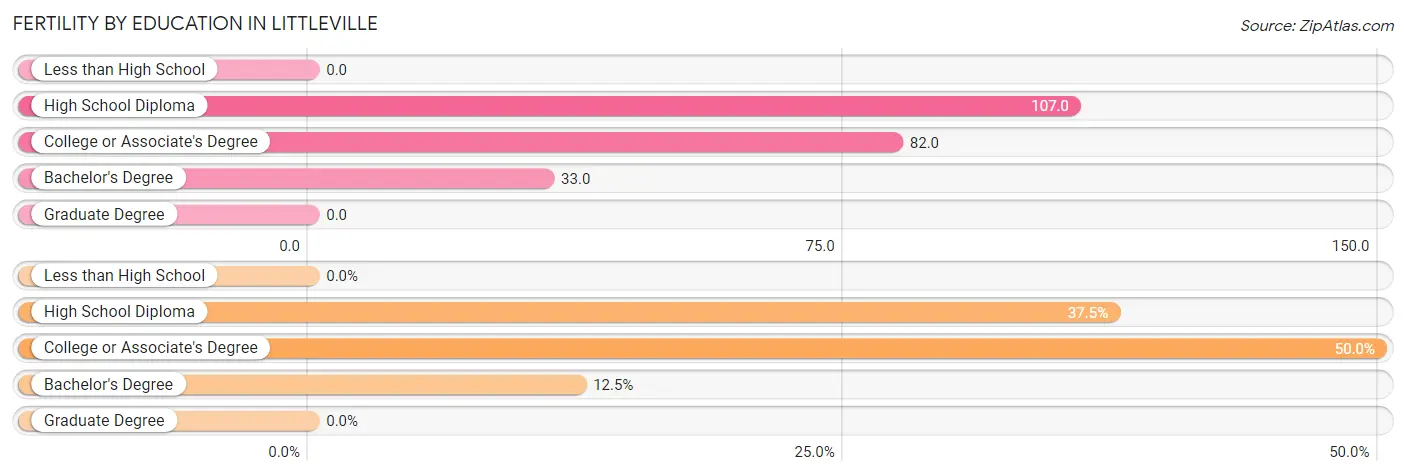
| Educational Attainment | Women with Births | Births / 1,000 Women |
| Less than High School | 0 (0.0%) | 0.0 |
| High School Diploma | 3 (37.5%) | 107.0 |
| College or Associate's Degree | 4 (50.0%) | 82.0 |
| Bachelor's Degree | 1 (12.5%) | 33.0 |
| Graduate Degree | 0 (0.0%) | 0.0 |
| Total | 8 (100.0%) | 60.0 |
Fertility by Education by Marriage Status in Littleville
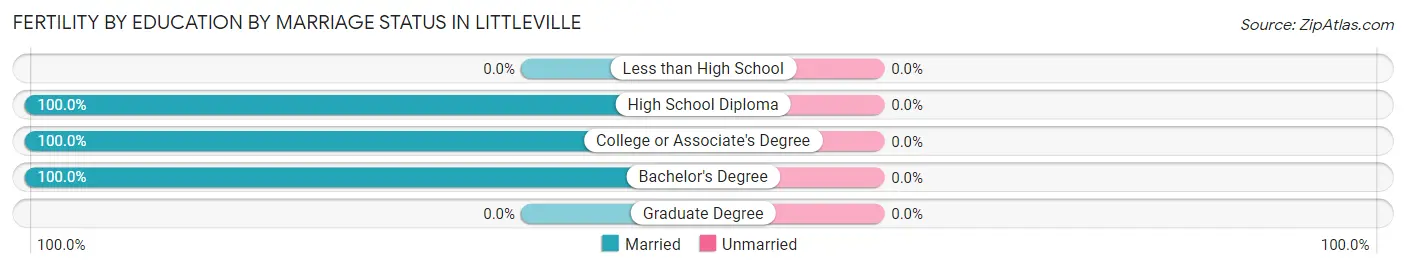
| Educational Attainment | Married | Unmarried |
| Less than High School | 0 (0.0%) | 0 (0.0%) |
| High School Diploma | 3 (100.0%) | 0 (0.0%) |
| College or Associate's Degree | 4 (100.0%) | 0 (0.0%) |
| Bachelor's Degree | 1 (100.0%) | 0 (0.0%) |
| Graduate Degree | 0 (0.0%) | 0 (0.0%) |
| Total | 8 (100.0%) | 0 (0.0%) |
Employment Characteristics in Littleville
Employment by Class of Employer in Littleville
Among the 347 employed individuals in Littleville, private company employees (240 | 69.2%), local government employees (32 | 9.2%), and self-employed (not incorporated) (23 | 6.6%) make up the most common classes of employment.
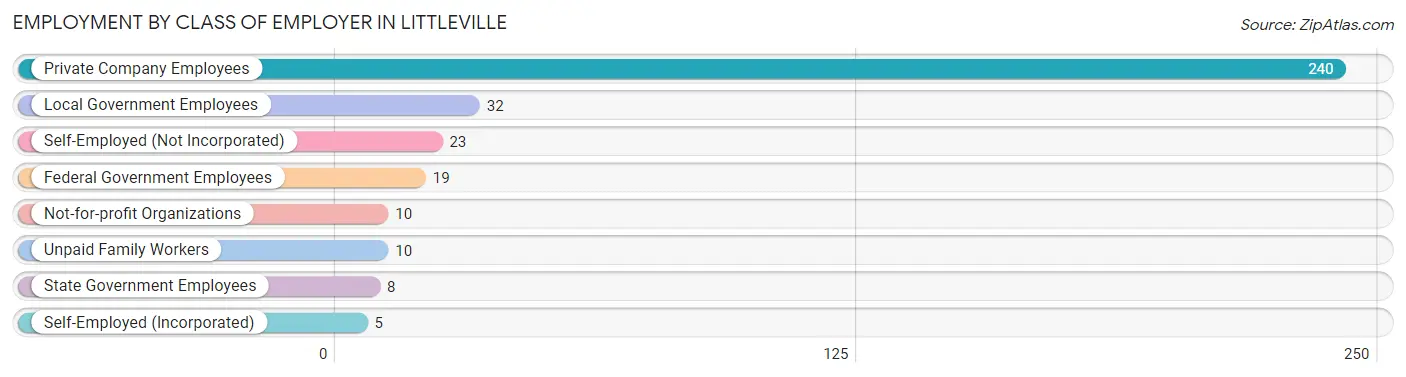
| Employer Class | # Employees | % Employees |
| Private Company Employees | 240 | 69.2% |
| Self-Employed (Incorporated) | 5 | 1.4% |
| Self-Employed (Not Incorporated) | 23 | 6.6% |
| Not-for-profit Organizations | 10 | 2.9% |
| Local Government Employees | 32 | 9.2% |
| State Government Employees | 8 | 2.3% |
| Federal Government Employees | 19 | 5.5% |
| Unpaid Family Workers | 10 | 2.9% |
| Total | 347 | 100.0% |
Employment Status by Age in Littleville
According to the labor force statistics for Littleville, out of the total population over 16 years of age (702), 51.3% or 360 individuals are in the labor force, with 2.3% or 8 of them unemployed. The age group with the highest labor force participation rate is 20 to 24 years, with 97.5% or 79 individuals in the labor force. Within the labor force, the 35 to 44 years age range has the highest percentage of unemployed individuals, with 14.3% or 4 of them being unemployed.
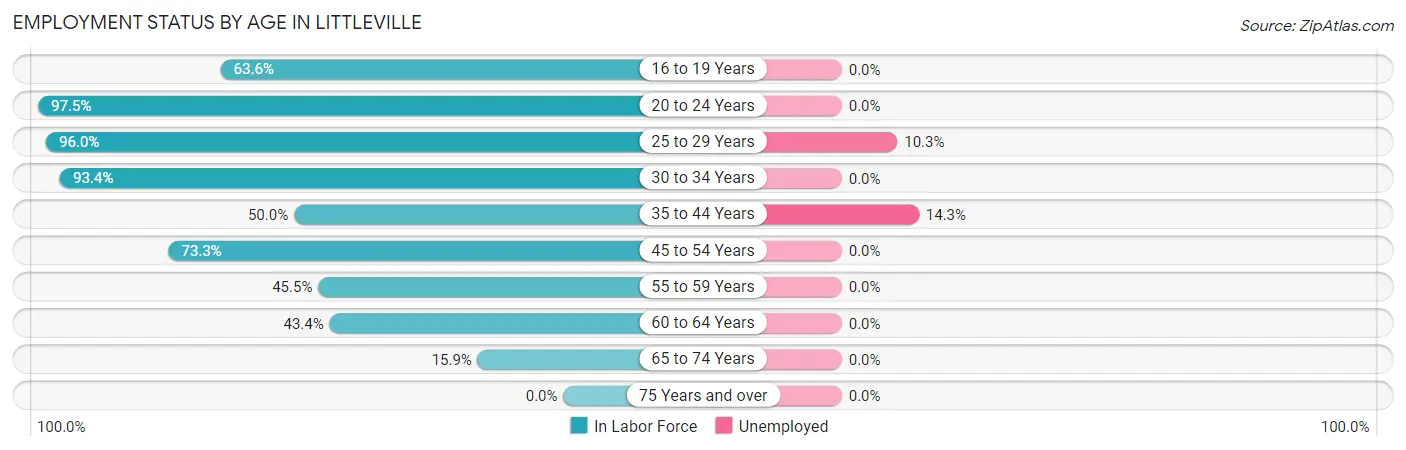
| Age Bracket | In Labor Force | Unemployed |
| 16 to 19 Years | 7 (63.6%) | 0 (0.0%) |
| 20 to 24 Years | 79 (97.5%) | 0 (0.0%) |
| 25 to 29 Years | 48 (96.0%) | 5 (10.3%) |
| 30 to 34 Years | 57 (93.4%) | 0 (0.0%) |
| 35 to 44 Years | 28 (50.0%) | 4 (14.3%) |
| 45 to 54 Years | 66 (73.3%) | 0 (0.0%) |
| 55 to 59 Years | 25 (45.5%) | 0 (0.0%) |
| 60 to 64 Years | 23 (43.4%) | 0 (0.0%) |
| 65 to 74 Years | 27 (15.9%) | 0 (0.0%) |
| 75 Years and over | 0 (0.0%) | 0 (0.0%) |
| Total | 360 (51.3%) | 8 (2.3%) |
Employment Status by Educational Attainment in Littleville
According to labor force statistics for Littleville, 67.7% of individuals (247) out of the total population between 25 and 64 years of age (365) are in the labor force, with 3.4% or 8 of them being unemployed. The group with the highest labor force participation rate are those with the educational attainment of bachelor's degree or higher, with 92.7% or 51 individuals in the labor force. Within the labor force, individuals with less than high school education have the highest percentage of unemployment, with 18.2% or 4 of them being unemployed.
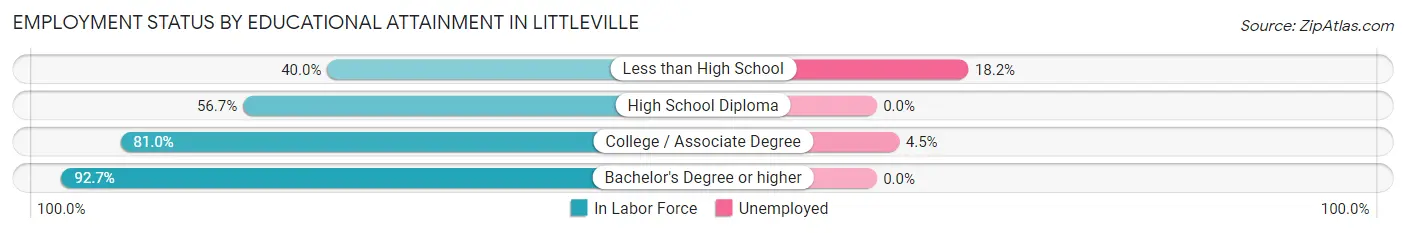
| Educational Attainment | In Labor Force | Unemployed |
| Less than High School | 22 (40.0%) | 10 (18.2%) |
| High School Diploma | 76 (56.7%) | 0 (0.0%) |
| College / Associate Degree | 98 (81.0%) | 5 (4.5%) |
| Bachelor's Degree or higher | 51 (92.7%) | 0 (0.0%) |
| Total | 247 (67.7%) | 12 (3.4%) |
Employment Occupations by Sex in Littleville
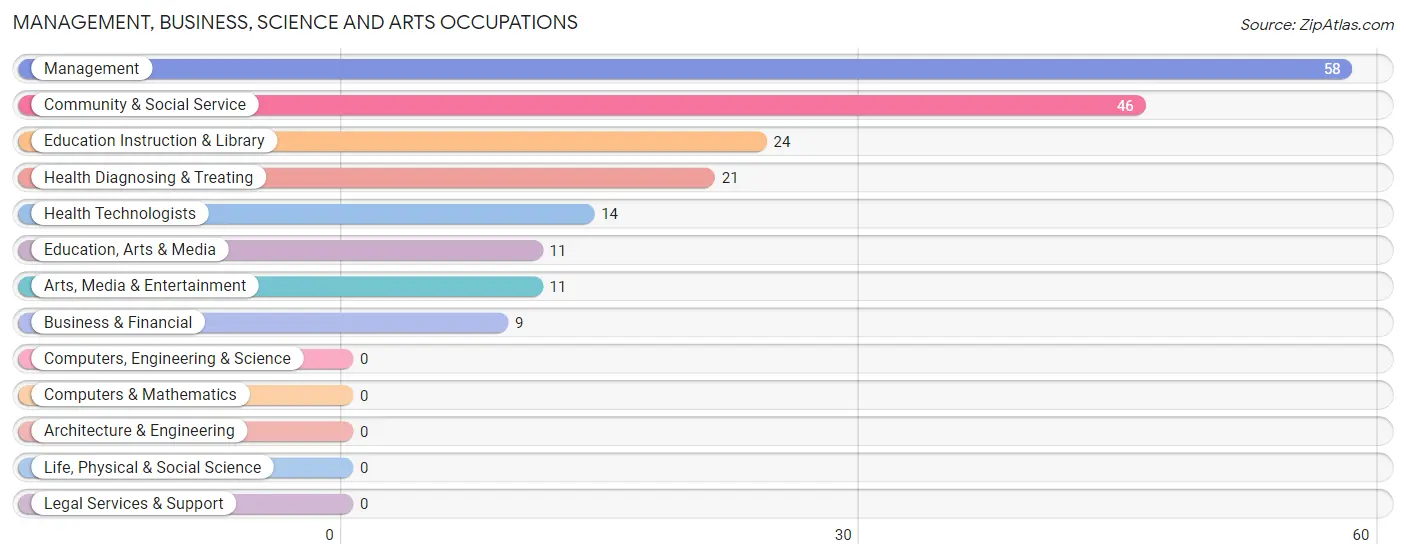
Management, Business, Science and Arts Occupations
The most common Management, Business, Science and Arts occupations in Littleville are Management (58 | 16.9%), Community & Social Service (46 | 13.4%), Education Instruction & Library (24 | 7.0%), Health Diagnosing & Treating (21 | 6.1%), and Health Technologists (14 | 4.1%).
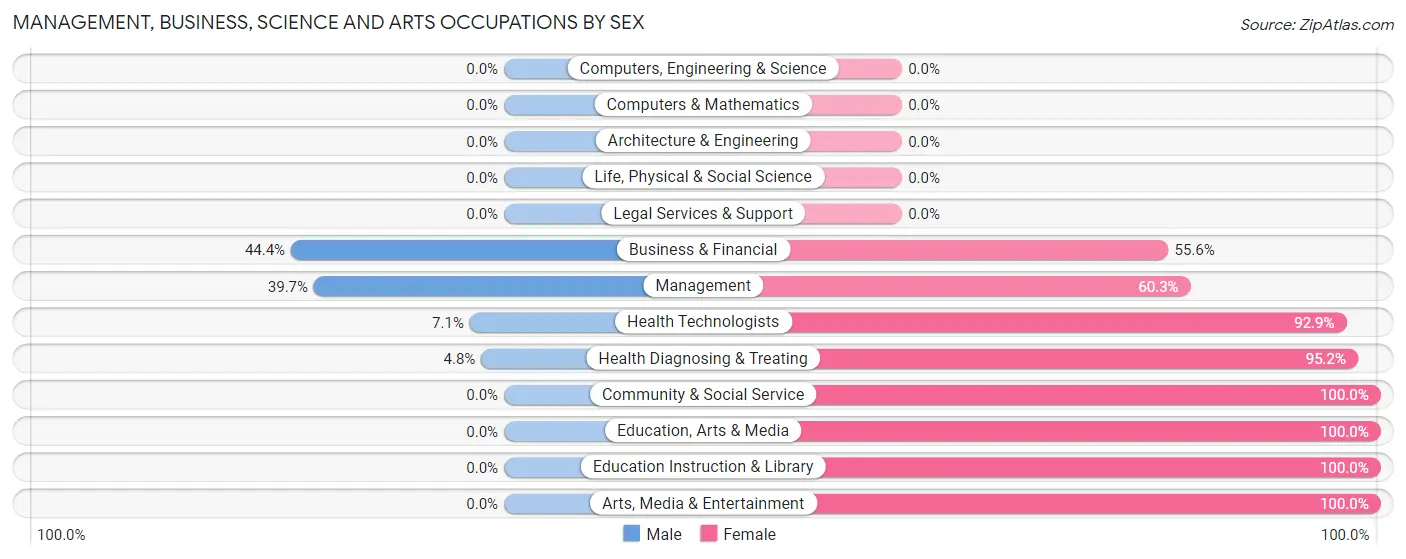
Management, Business, Science and Arts Occupations by Sex
Within the Management, Business, Science and Arts occupations in Littleville, the most male-oriented occupations are Business & Financial (44.4%), Management (39.7%), and Health Technologists (7.1%), while the most female-oriented occupations are Community & Social Service (100.0%), Education, Arts & Media (100.0%), and Education Instruction & Library (100.0%).
| Occupation | Male | Female |
| Management | 23 (39.7%) | 35 (60.3%) |
| Business & Financial | 4 (44.4%) | 5 (55.6%) |
| Computers, Engineering & Science | 0 (0.0%) | 0 (0.0%) |
| Computers & Mathematics | 0 (0.0%) | 0 (0.0%) |
| Architecture & Engineering | 0 (0.0%) | 0 (0.0%) |
| Life, Physical & Social Science | 0 (0.0%) | 0 (0.0%) |
| Community & Social Service | 0 (0.0%) | 46 (100.0%) |
| Education, Arts & Media | 0 (0.0%) | 11 (100.0%) |
| Legal Services & Support | 0 (0.0%) | 0 (0.0%) |
| Education Instruction & Library | 0 (0.0%) | 24 (100.0%) |
| Arts, Media & Entertainment | 0 (0.0%) | 11 (100.0%) |
| Health Diagnosing & Treating | 1 (4.8%) | 20 (95.2%) |
| Health Technologists | 1 (7.1%) | 13 (92.9%) |
| Total (Category) | 28 (20.9%) | 106 (79.1%) |
| Total (Overall) | 166 (48.4%) | 177 (51.6%) |
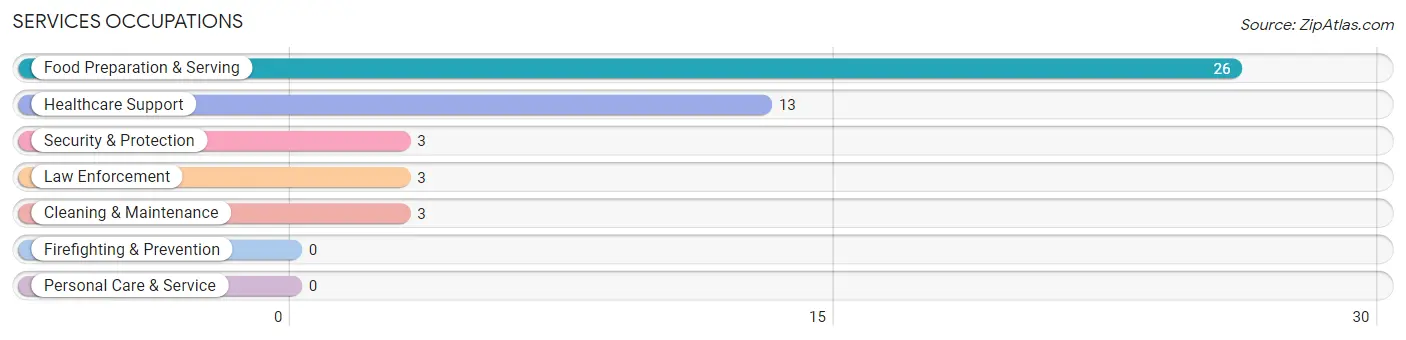
Services Occupations
The most common Services occupations in Littleville are Food Preparation & Serving (26 | 7.6%), Healthcare Support (13 | 3.8%), Security & Protection (3 | 0.9%), Law Enforcement (3 | 0.9%), and Cleaning & Maintenance (3 | 0.9%).
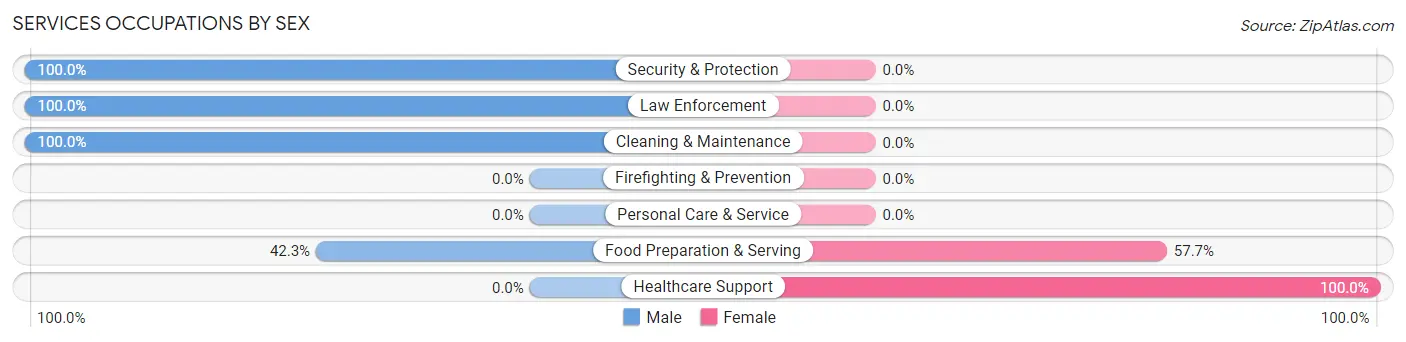
Services Occupations by Sex
Within the Services occupations in Littleville, the most male-oriented occupations are Security & Protection (100.0%), Law Enforcement (100.0%), and Cleaning & Maintenance (100.0%), while the most female-oriented occupations are Healthcare Support (100.0%), and Food Preparation & Serving (57.7%).
| Occupation | Male | Female |
| Healthcare Support | 0 (0.0%) | 13 (100.0%) |
| Security & Protection | 3 (100.0%) | 0 (0.0%) |
| Firefighting & Prevention | 0 (0.0%) | 0 (0.0%) |
| Law Enforcement | 3 (100.0%) | 0 (0.0%) |
| Food Preparation & Serving | 11 (42.3%) | 15 (57.7%) |
| Cleaning & Maintenance | 3 (100.0%) | 0 (0.0%) |
| Personal Care & Service | 0 (0.0%) | 0 (0.0%) |
| Total (Category) | 17 (37.8%) | 28 (62.2%) |
| Total (Overall) | 166 (48.4%) | 177 (51.6%) |
Sales and Office Occupations
The most common Sales and Office occupations in Littleville are Office & Administration (27 | 7.9%), and Sales & Related (13 | 3.8%).

Sales and Office Occupations by Sex
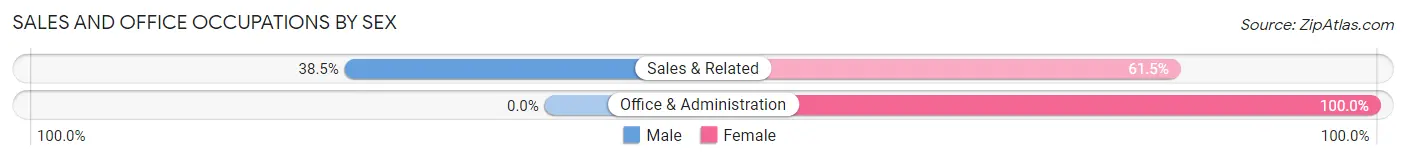
| Occupation | Male | Female |
| Sales & Related | 5 (38.5%) | 8 (61.5%) |
| Office & Administration | 0 (0.0%) | 27 (100.0%) |
| Total (Category) | 5 (12.5%) | 35 (87.5%) |
| Total (Overall) | 166 (48.4%) | 177 (51.6%) |
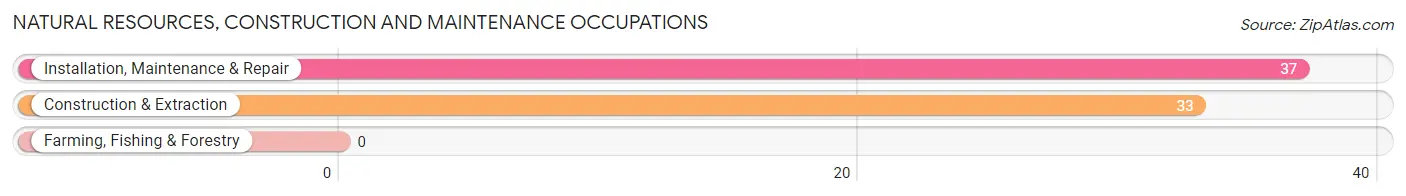
Natural Resources, Construction and Maintenance Occupations
The most common Natural Resources, Construction and Maintenance occupations in Littleville are Installation, Maintenance & Repair (37 | 10.8%), and Construction & Extraction (33 | 9.6%).
Natural Resources, Construction and Maintenance Occupations by Sex
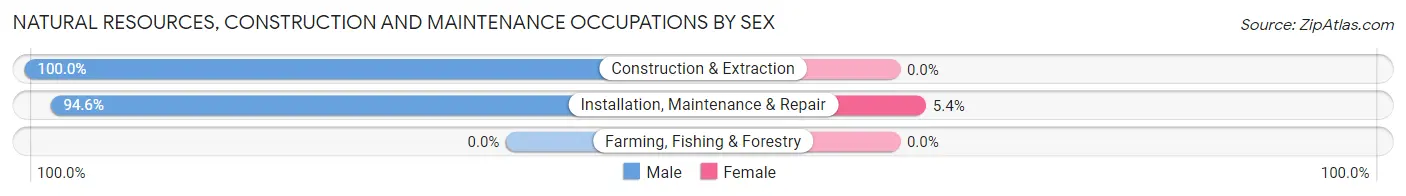
| Occupation | Male | Female |
| Farming, Fishing & Forestry | 0 (0.0%) | 0 (0.0%) |
| Construction & Extraction | 33 (100.0%) | 0 (0.0%) |
| Installation, Maintenance & Repair | 35 (94.6%) | 2 (5.4%) |
| Total (Category) | 68 (97.1%) | 2 (2.9%) |
| Total (Overall) | 166 (48.4%) | 177 (51.6%) |
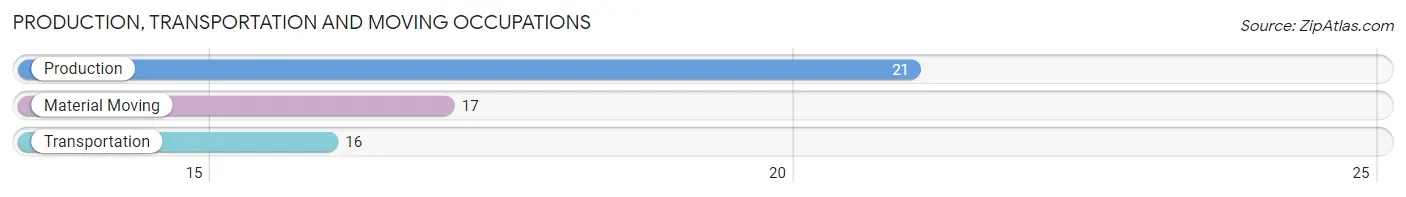
Production, Transportation and Moving Occupations
The most common Production, Transportation and Moving occupations in Littleville are Production (21 | 6.1%), Material Moving (17 | 5.0%), and Transportation (16 | 4.7%).
Production, Transportation and Moving Occupations by Sex
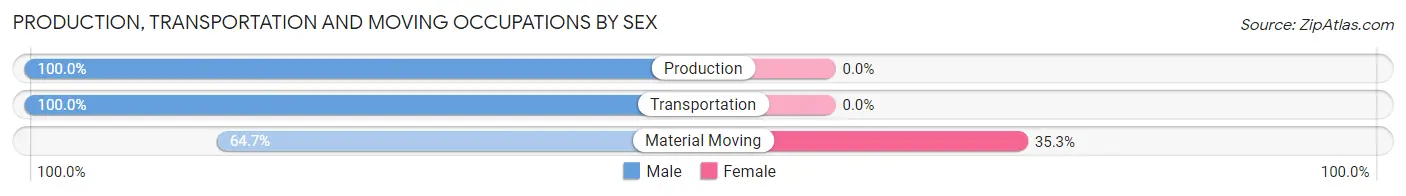
| Occupation | Male | Female |
| Production | 21 (100.0%) | 0 (0.0%) |
| Transportation | 16 (100.0%) | 0 (0.0%) |
| Material Moving | 11 (64.7%) | 6 (35.3%) |
| Total (Category) | 48 (88.9%) | 6 (11.1%) |
| Total (Overall) | 166 (48.4%) | 177 (51.6%) |
Employment Industries by Sex in Littleville
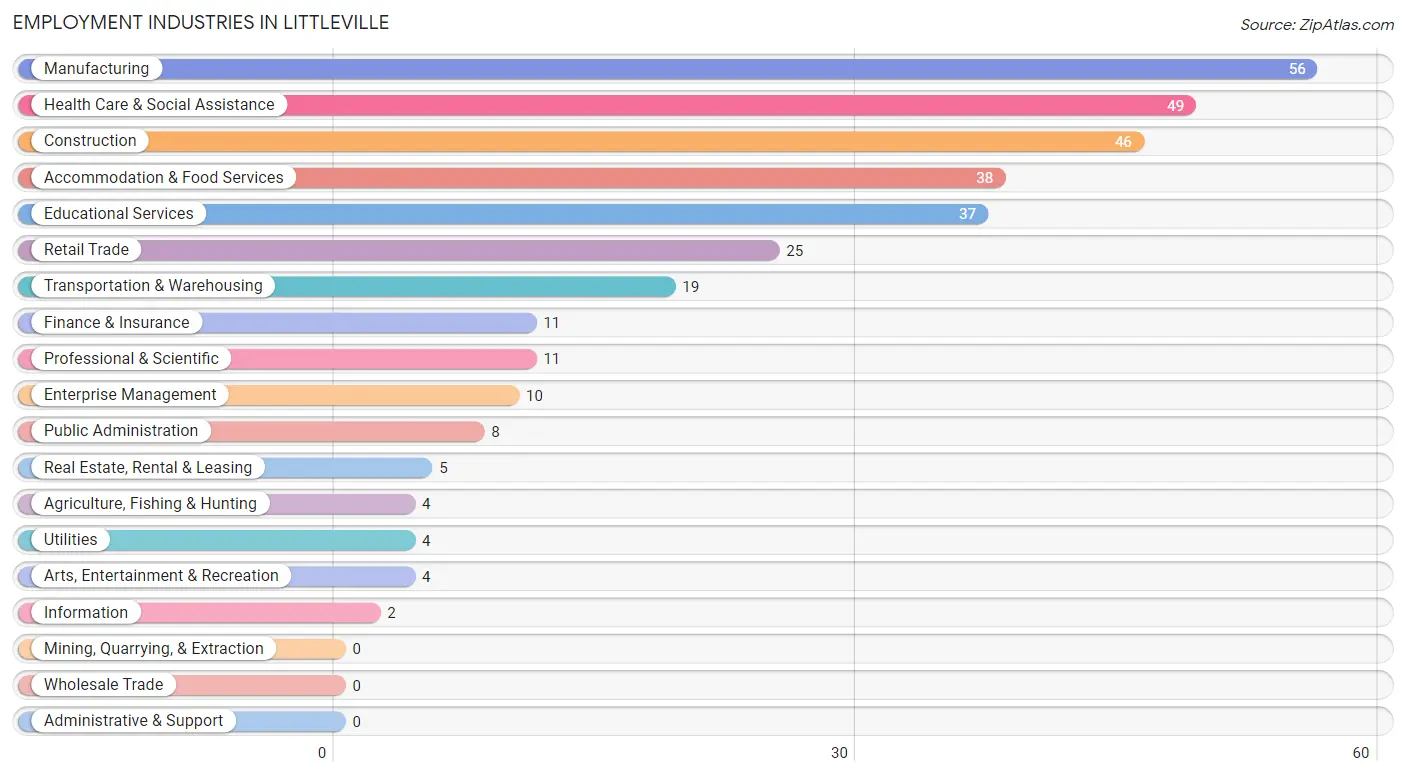
Employment Industries in Littleville
The major employment industries in Littleville include Manufacturing (56 | 16.3%), Health Care & Social Assistance (49 | 14.3%), Construction (46 | 13.4%), Accommodation & Food Services (38 | 11.1%), and Educational Services (37 | 10.8%).
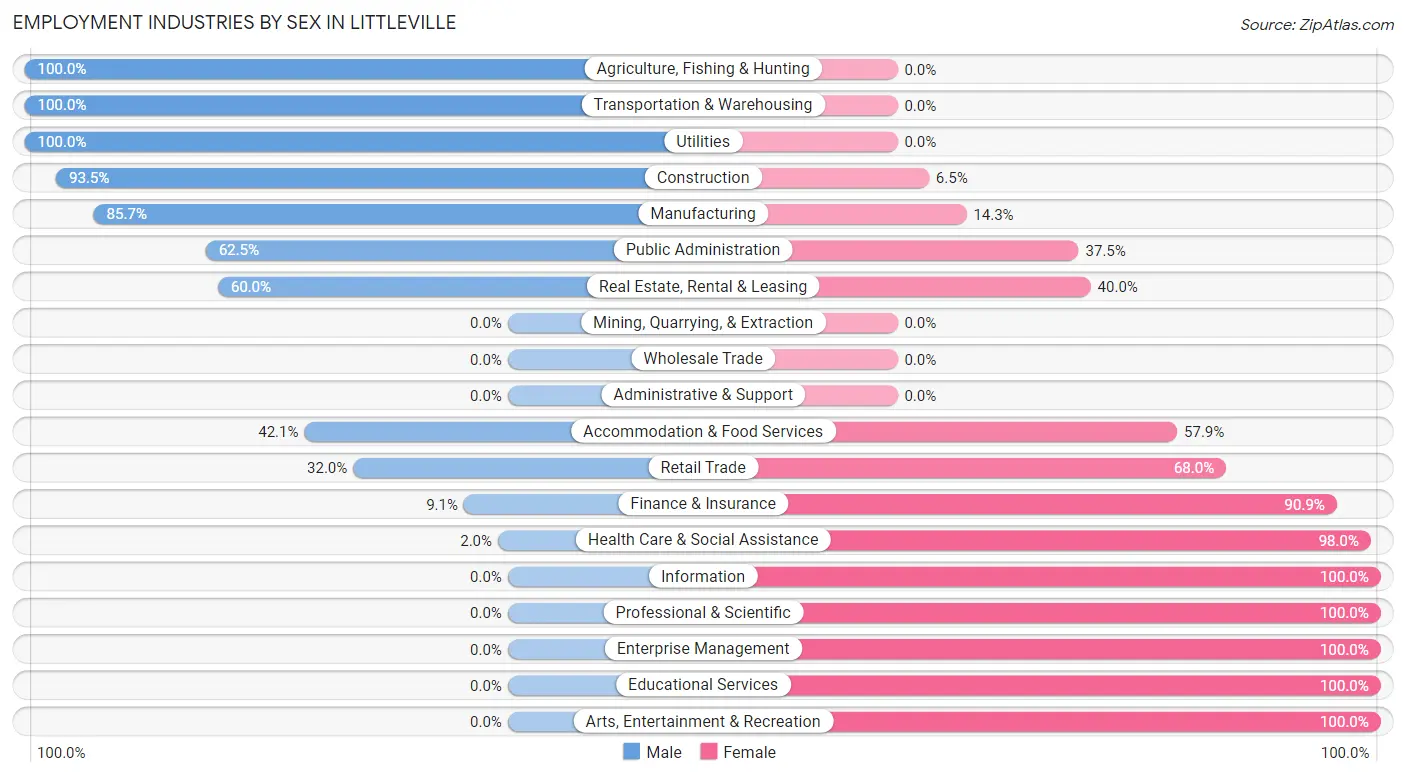
Employment Industries by Sex in Littleville
The Littleville industries that see more men than women are Agriculture, Fishing & Hunting (100.0%), Transportation & Warehousing (100.0%), and Utilities (100.0%), whereas the industries that tend to have a higher number of women are Information (100.0%), Professional & Scientific (100.0%), and Enterprise Management (100.0%).
| Industry | Male | Female |
| Agriculture, Fishing & Hunting | 4 (100.0%) | 0 (0.0%) |
| Mining, Quarrying, & Extraction | 0 (0.0%) | 0 (0.0%) |
| Construction | 43 (93.5%) | 3 (6.5%) |
| Manufacturing | 48 (85.7%) | 8 (14.3%) |
| Wholesale Trade | 0 (0.0%) | 0 (0.0%) |
| Retail Trade | 8 (32.0%) | 17 (68.0%) |
| Transportation & Warehousing | 19 (100.0%) | 0 (0.0%) |
| Utilities | 4 (100.0%) | 0 (0.0%) |
| Information | 0 (0.0%) | 2 (100.0%) |
| Finance & Insurance | 1 (9.1%) | 10 (90.9%) |
| Real Estate, Rental & Leasing | 3 (60.0%) | 2 (40.0%) |
| Professional & Scientific | 0 (0.0%) | 11 (100.0%) |
| Enterprise Management | 0 (0.0%) | 10 (100.0%) |
| Administrative & Support | 0 (0.0%) | 0 (0.0%) |
| Educational Services | 0 (0.0%) | 37 (100.0%) |
| Health Care & Social Assistance | 1 (2.0%) | 48 (98.0%) |
| Arts, Entertainment & Recreation | 0 (0.0%) | 4 (100.0%) |
| Accommodation & Food Services | 16 (42.1%) | 22 (57.9%) |
| Public Administration | 5 (62.5%) | 3 (37.5%) |
| Total | 166 (48.4%) | 177 (51.6%) |
Education in Littleville
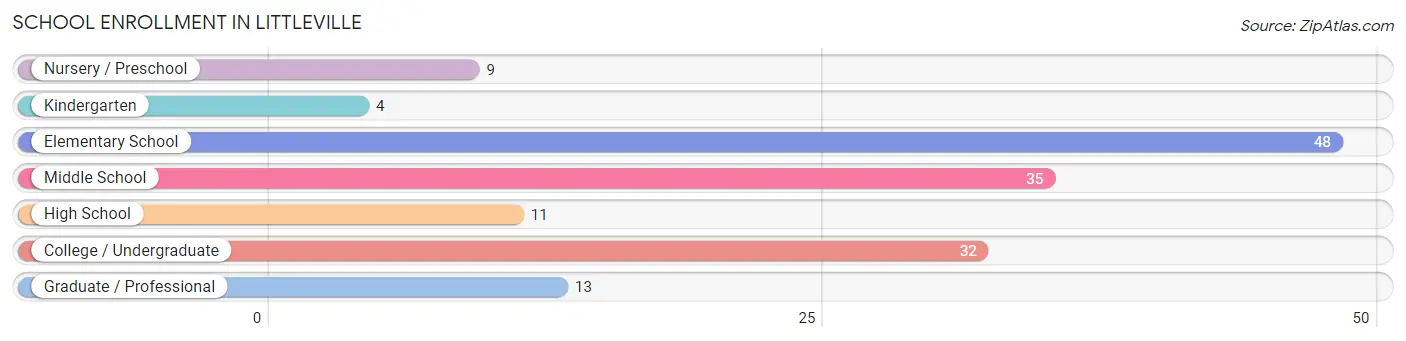
School Enrollment in Littleville
The most common levels of schooling among the 152 students in Littleville are elementary school (48 | 31.6%), middle school (35 | 23.0%), and college / undergraduate (32 | 21.0%).
| School Level | # Students | % Students |
| Nursery / Preschool | 9 | 5.9% |
| Kindergarten | 4 | 2.6% |
| Elementary School | 48 | 31.6% |
| Middle School | 35 | 23.0% |
| High School | 11 | 7.2% |
| College / Undergraduate | 32 | 21.0% |
| Graduate / Professional | 13 | 8.6% |
| Total | 152 | 100.0% |
School Enrollment by Age by Funding Source in Littleville
Out of a total of 152 students who are enrolled in schools in Littleville, 3 (2.0%) attend a private institution, while the remaining 149 (98.0%) are enrolled in public schools. The age group of 3 to 4 year olds has the highest likelihood of being enrolled in private schools, with 3 (25.0% in the age bracket) enrolled. Conversely, the age group of 5 to 9 year old has the lowest likelihood of being enrolled in a private school, with 45 (100.0% in the age bracket) attending a public institution.
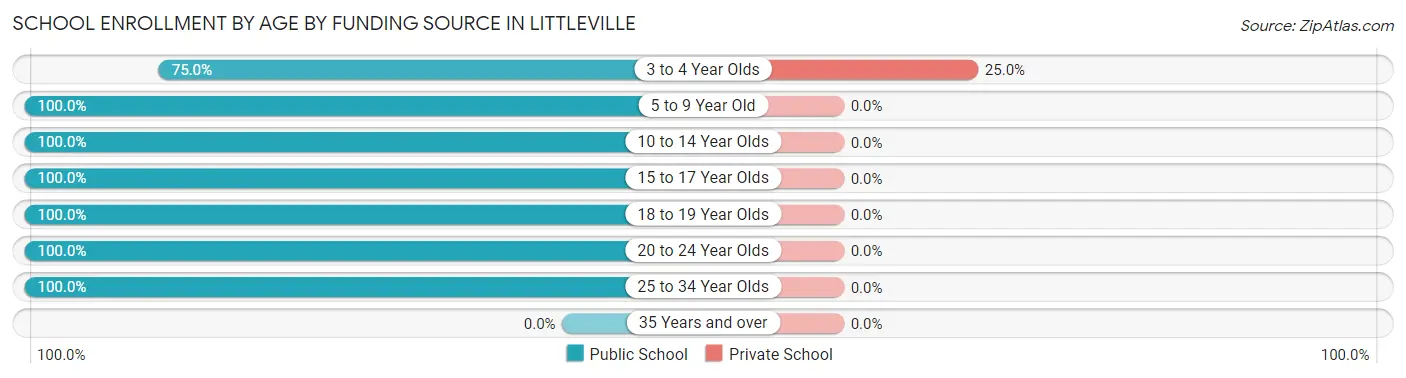
| Age Bracket | Public School | Private School |
| 3 to 4 Year Olds | 9 (75.0%) | 3 (25.0%) |
| 5 to 9 Year Old | 45 (100.0%) | 0 (0.0%) |
| 10 to 14 Year Olds | 39 (100.0%) | 0 (0.0%) |
| 15 to 17 Year Olds | 6 (100.0%) | 0 (0.0%) |
| 18 to 19 Year Olds | 7 (100.0%) | 0 (0.0%) |
| 20 to 24 Year Olds | 21 (100.0%) | 0 (0.0%) |
| 25 to 34 Year Olds | 22 (100.0%) | 0 (0.0%) |
| 35 Years and over | 0 (0.0%) | 0 (0.0%) |
| Total | 149 (98.0%) | 3 (2.0%) |
Educational Attainment by Field of Study in Littleville
Education (28 | 29.2%), science & technology (20 | 20.8%), business (16 | 16.7%), bio, nature & agricultural (11 | 11.5%), and visual & performing arts (10 | 10.4%) are the most common fields of study among 96 individuals in Littleville who have obtained a bachelor's degree or higher.
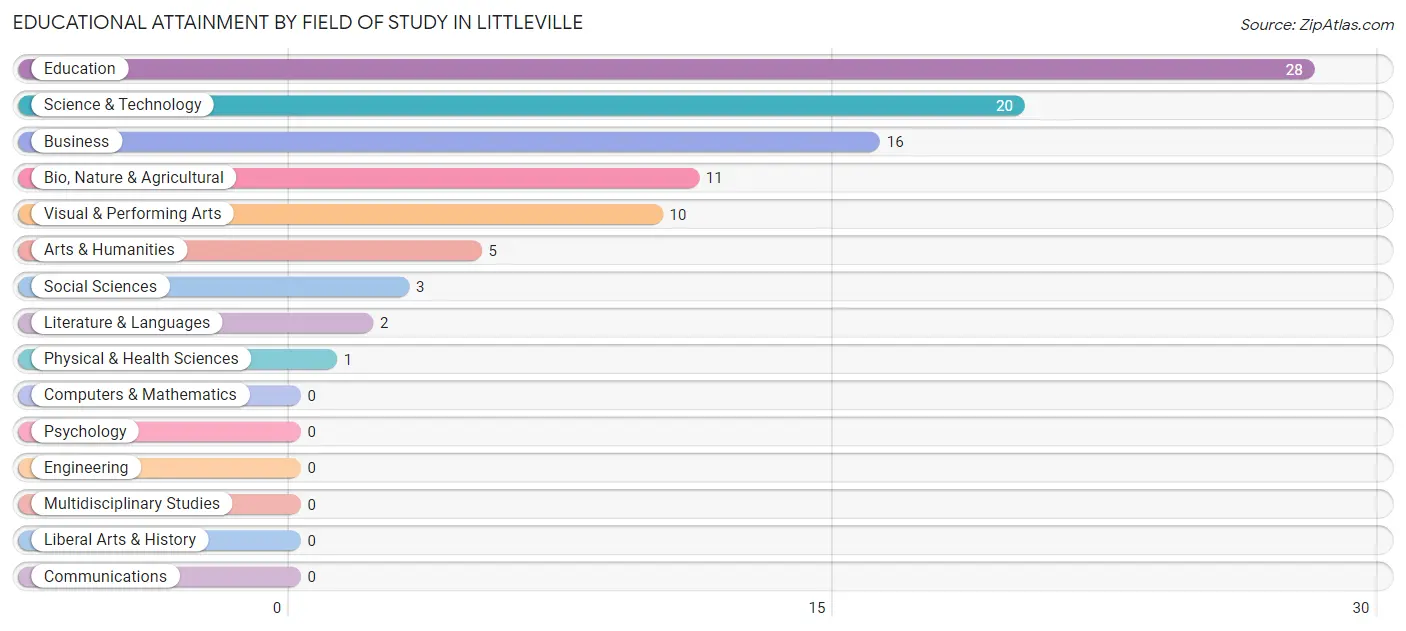
| Field of Study | # Graduates | % Graduates |
| Computers & Mathematics | 0 | 0.0% |
| Bio, Nature & Agricultural | 11 | 11.5% |
| Physical & Health Sciences | 1 | 1.0% |
| Psychology | 0 | 0.0% |
| Social Sciences | 3 | 3.1% |
| Engineering | 0 | 0.0% |
| Multidisciplinary Studies | 0 | 0.0% |
| Science & Technology | 20 | 20.8% |
| Business | 16 | 16.7% |
| Education | 28 | 29.2% |
| Literature & Languages | 2 | 2.1% |
| Liberal Arts & History | 0 | 0.0% |
| Visual & Performing Arts | 10 | 10.4% |
| Communications | 0 | 0.0% |
| Arts & Humanities | 5 | 5.2% |
| Total | 96 | 100.0% |
Transportation & Commute in Littleville
Vehicle Availability by Sex in Littleville
The most prevalent vehicle ownership categories in Littleville are males with 2 vehicles (57, accounting for 32.8%) and females with 2 vehicles (67, making up 33.0%).
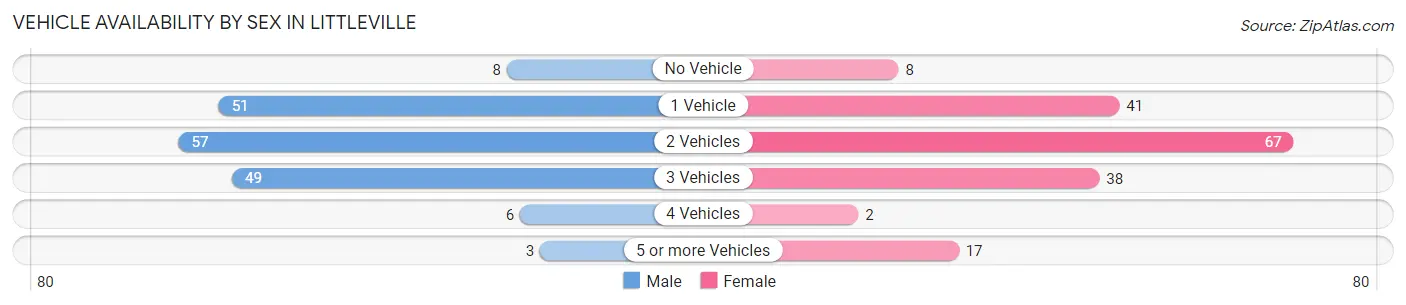
| Vehicles Available | Male | Female |
| No Vehicle | 8 (4.6%) | 8 (4.6%) |
| 1 Vehicle | 51 (29.3%) | 41 (23.7%) |
| 2 Vehicles | 57 (32.8%) | 67 (38.7%) |
| 3 Vehicles | 49 (28.2%) | 38 (22.0%) |
| 4 Vehicles | 6 (3.5%) | 2 (1.2%) |
| 5 or more Vehicles | 3 (1.7%) | 17 (9.8%) |
| Total | 174 (100.0%) | 173 (100.0%) |
Commute Time in Littleville
The most frequently occuring commute durations in Littleville are 20 to 24 minutes (123 commuters, 36.0%), 15 to 19 minutes (53 commuters, 15.5%), and 10 to 14 minutes (47 commuters, 13.7%).
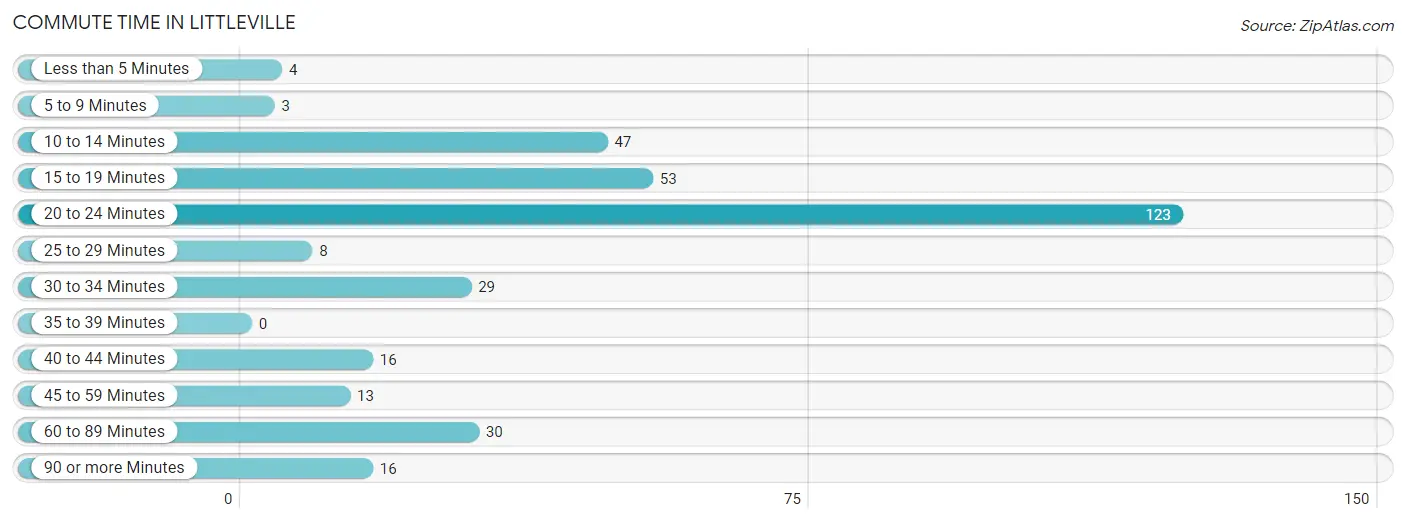
| Commute Time | # Commuters | % Commuters |
| Less than 5 Minutes | 4 | 1.2% |
| 5 to 9 Minutes | 3 | 0.9% |
| 10 to 14 Minutes | 47 | 13.7% |
| 15 to 19 Minutes | 53 | 15.5% |
| 20 to 24 Minutes | 123 | 36.0% |
| 25 to 29 Minutes | 8 | 2.3% |
| 30 to 34 Minutes | 29 | 8.5% |
| 35 to 39 Minutes | 0 | 0.0% |
| 40 to 44 Minutes | 16 | 4.7% |
| 45 to 59 Minutes | 13 | 3.8% |
| 60 to 89 Minutes | 30 | 8.8% |
| 90 or more Minutes | 16 | 4.7% |
Commute Time by Sex in Littleville
The most common commute times in Littleville are 20 to 24 minutes (50 commuters, 28.7%) for males and 20 to 24 minutes (73 commuters, 43.4%) for females.
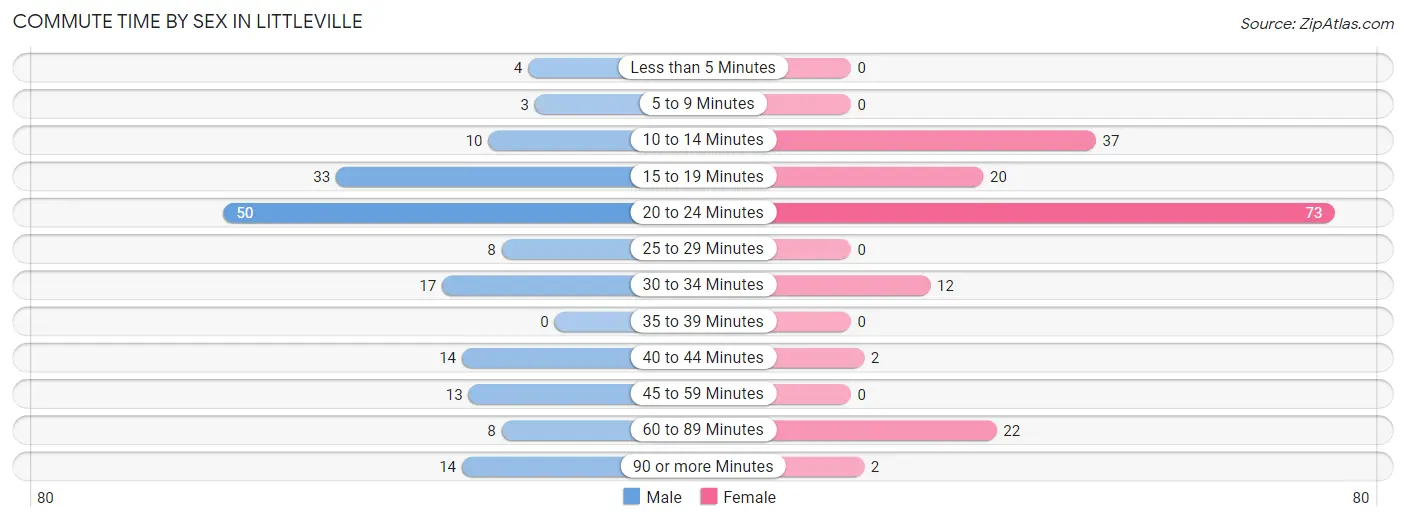
| Commute Time | Male | Female |
| Less than 5 Minutes | 4 (2.3%) | 0 (0.0%) |
| 5 to 9 Minutes | 3 (1.7%) | 0 (0.0%) |
| 10 to 14 Minutes | 10 (5.8%) | 37 (22.0%) |
| 15 to 19 Minutes | 33 (19.0%) | 20 (11.9%) |
| 20 to 24 Minutes | 50 (28.7%) | 73 (43.4%) |
| 25 to 29 Minutes | 8 (4.6%) | 0 (0.0%) |
| 30 to 34 Minutes | 17 (9.8%) | 12 (7.1%) |
| 35 to 39 Minutes | 0 (0.0%) | 0 (0.0%) |
| 40 to 44 Minutes | 14 (8.1%) | 2 (1.2%) |
| 45 to 59 Minutes | 13 (7.5%) | 0 (0.0%) |
| 60 to 89 Minutes | 8 (4.6%) | 22 (13.1%) |
| 90 or more Minutes | 14 (8.1%) | 2 (1.2%) |
Time of Departure to Work by Sex in Littleville
The most frequent times of departure to work in Littleville are 6:00 AM to 6:29 AM (53, 30.5%) for males and 7:00 AM to 7:29 AM (42, 25.0%) for females.
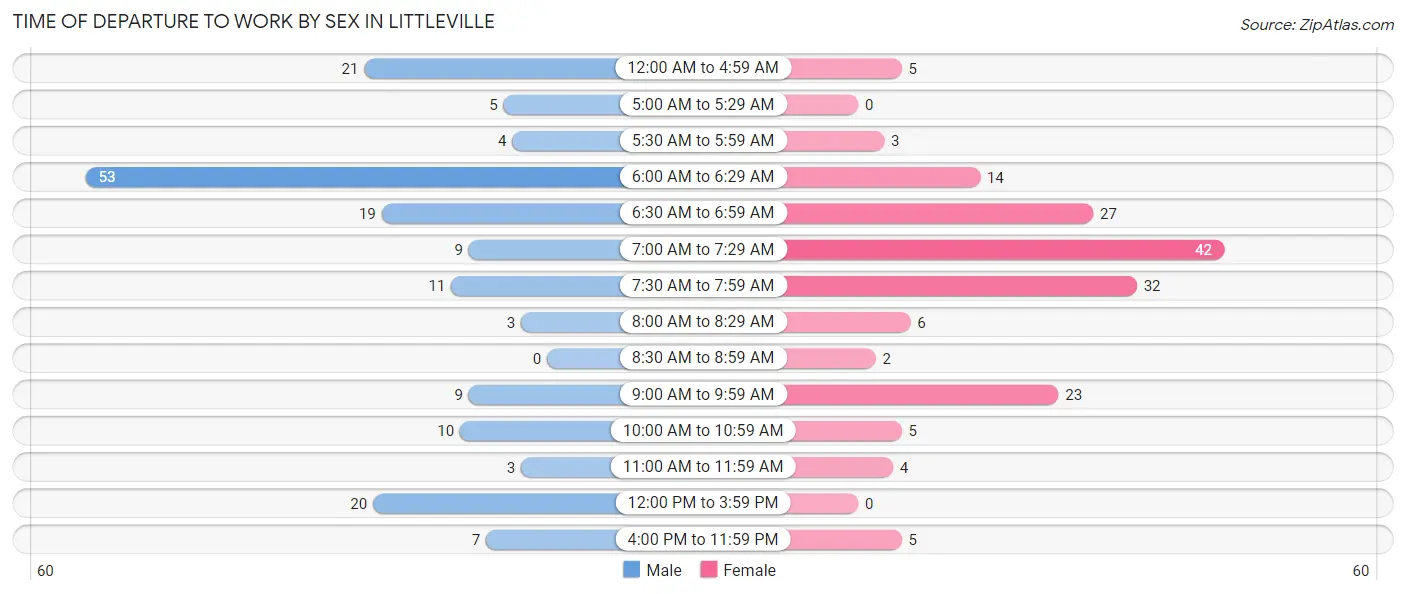
| Time of Departure | Male | Female |
| 12:00 AM to 4:59 AM | 21 (12.1%) | 5 (3.0%) |
| 5:00 AM to 5:29 AM | 5 (2.9%) | 0 (0.0%) |
| 5:30 AM to 5:59 AM | 4 (2.3%) | 3 (1.8%) |
| 6:00 AM to 6:29 AM | 53 (30.5%) | 14 (8.3%) |
| 6:30 AM to 6:59 AM | 19 (10.9%) | 27 (16.1%) |
| 7:00 AM to 7:29 AM | 9 (5.2%) | 42 (25.0%) |
| 7:30 AM to 7:59 AM | 11 (6.3%) | 32 (19.1%) |
| 8:00 AM to 8:29 AM | 3 (1.7%) | 6 (3.6%) |
| 8:30 AM to 8:59 AM | 0 (0.0%) | 2 (1.2%) |
| 9:00 AM to 9:59 AM | 9 (5.2%) | 23 (13.7%) |
| 10:00 AM to 10:59 AM | 10 (5.8%) | 5 (3.0%) |
| 11:00 AM to 11:59 AM | 3 (1.7%) | 4 (2.4%) |
| 12:00 PM to 3:59 PM | 20 (11.5%) | 0 (0.0%) |
| 4:00 PM to 11:59 PM | 7 (4.0%) | 5 (3.0%) |
| Total | 174 (100.0%) | 168 (100.0%) |
Housing Occupancy in Littleville
Occupancy by Ownership in Littleville
Of the total 374 dwellings in Littleville, owner-occupied units account for 261 (69.8%), while renter-occupied units make up 113 (30.2%).
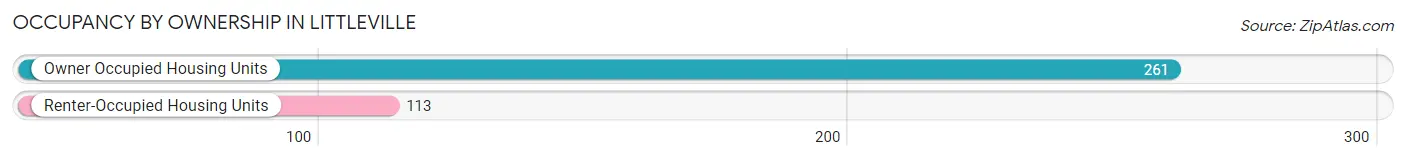
| Occupancy | # Housing Units | % Housing Units |
| Owner Occupied Housing Units | 261 | 69.8% |
| Renter-Occupied Housing Units | 113 | 30.2% |
| Total Occupied Housing Units | 374 | 100.0% |
Occupancy by Household Size in Littleville
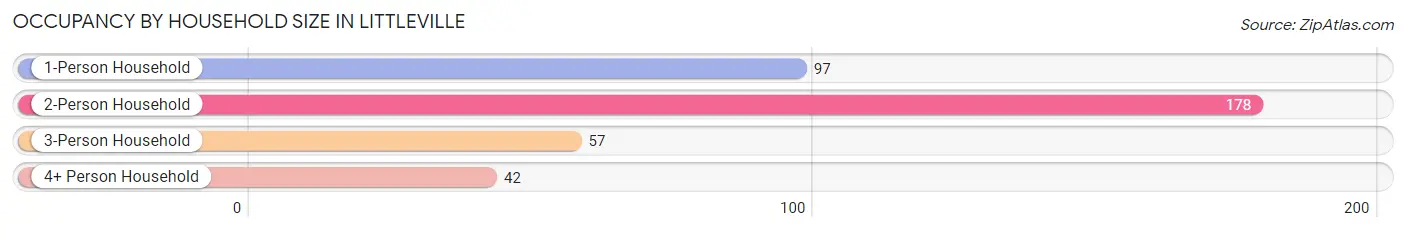
| Household Size | # Housing Units | % Housing Units |
| 1-Person Household | 97 | 25.9% |
| 2-Person Household | 178 | 47.6% |
| 3-Person Household | 57 | 15.2% |
| 4+ Person Household | 42 | 11.2% |
| Total Housing Units | 374 | 100.0% |
Occupancy by Ownership by Household Size in Littleville
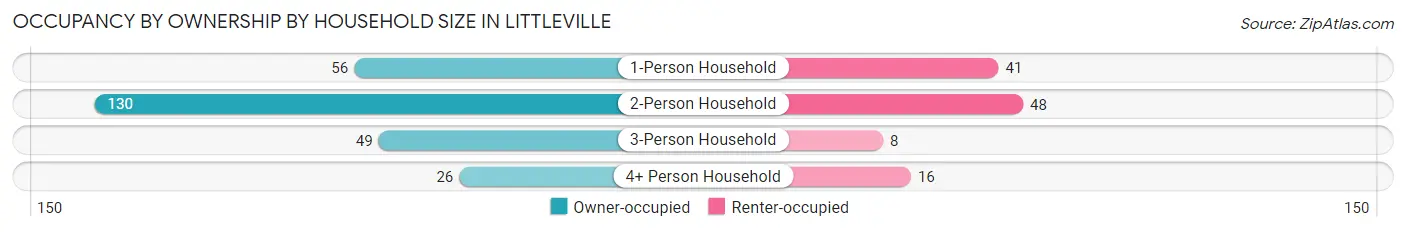
| Household Size | Owner-occupied | Renter-occupied |
| 1-Person Household | 56 (57.7%) | 41 (42.3%) |
| 2-Person Household | 130 (73.0%) | 48 (27.0%) |
| 3-Person Household | 49 (86.0%) | 8 (14.0%) |
| 4+ Person Household | 26 (61.9%) | 16 (38.1%) |
| Total Housing Units | 261 (69.8%) | 113 (30.2%) |
Occupancy by Educational Attainment in Littleville
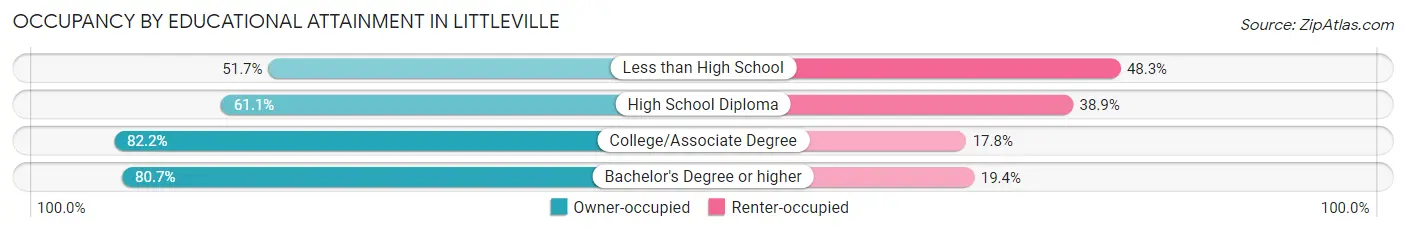
| Household Size | Owner-occupied | Renter-occupied |
| Less than High School | 31 (51.7%) | 29 (48.3%) |
| High School Diploma | 80 (61.1%) | 51 (38.9%) |
| College/Associate Degree | 125 (82.2%) | 27 (17.8%) |
| Bachelor's Degree or higher | 25 (80.6%) | 6 (19.4%) |
Occupancy by Age of Householder in Littleville
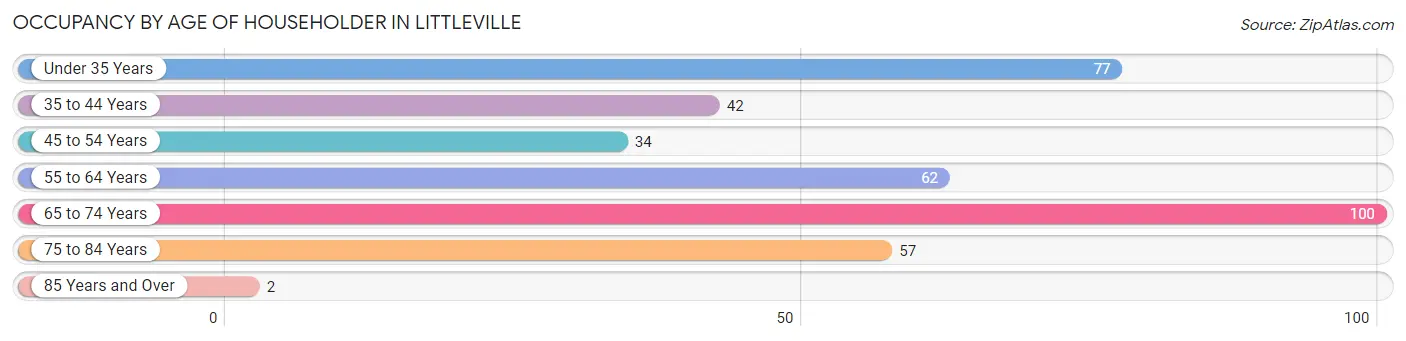
| Age Bracket | # Households | % Households |
| Under 35 Years | 77 | 20.6% |
| 35 to 44 Years | 42 | 11.2% |
| 45 to 54 Years | 34 | 9.1% |
| 55 to 64 Years | 62 | 16.6% |
| 65 to 74 Years | 100 | 26.7% |
| 75 to 84 Years | 57 | 15.2% |
| 85 Years and Over | 2 | 0.5% |
| Total | 374 | 100.0% |
Housing Finances in Littleville
Median Income by Occupancy in Littleville
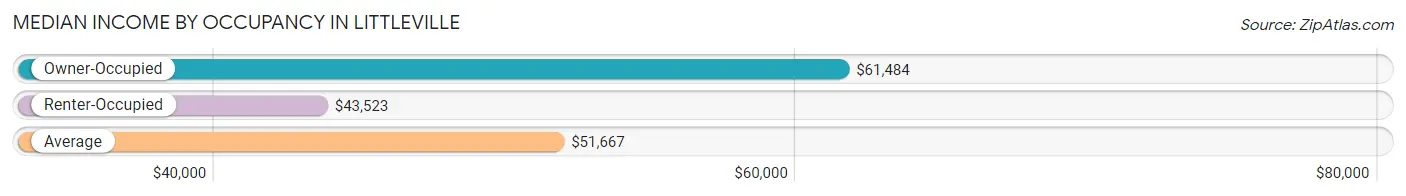
| Occupancy Type | # Households | Median Income |
| Owner-Occupied | 261 (69.8%) | $61,484 |
| Renter-Occupied | 113 (30.2%) | $43,523 |
| Average | 374 (100.0%) | $51,667 |
Occupancy by Householder Income Bracket in Littleville
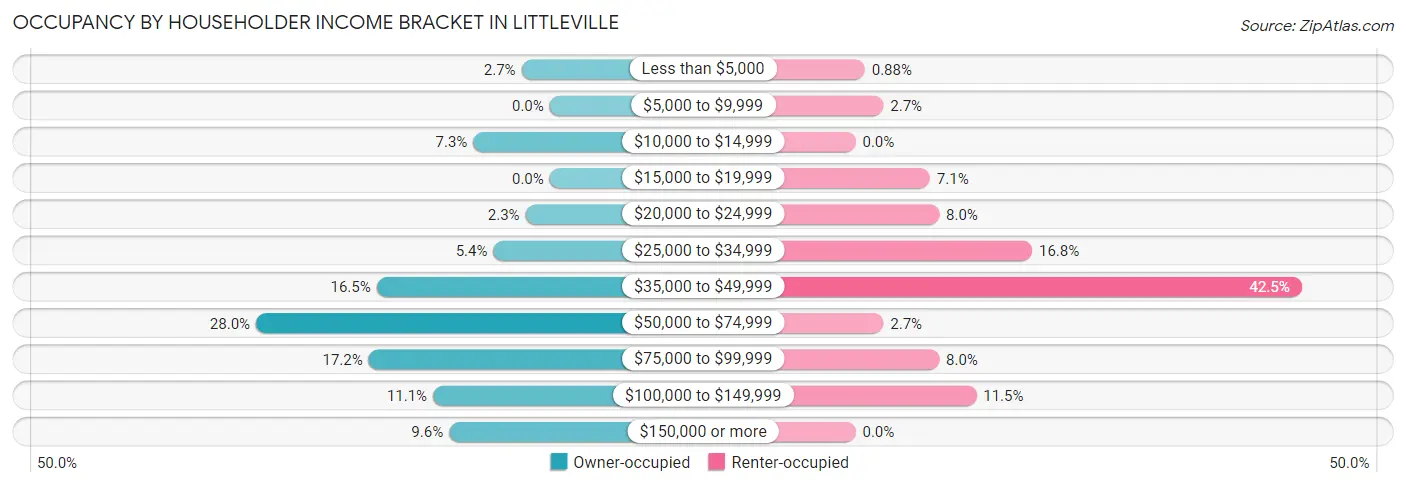
| Income Bracket | Owner-occupied | Renter-occupied |
| Less than $5,000 | 7 (2.7%) | 1 (0.9%) |
| $5,000 to $9,999 | 0 (0.0%) | 3 (2.6%) |
| $10,000 to $14,999 | 19 (7.3%) | 0 (0.0%) |
| $15,000 to $19,999 | 0 (0.0%) | 8 (7.1%) |
| $20,000 to $24,999 | 6 (2.3%) | 9 (8.0%) |
| $25,000 to $34,999 | 14 (5.4%) | 19 (16.8%) |
| $35,000 to $49,999 | 43 (16.5%) | 48 (42.5%) |
| $50,000 to $74,999 | 73 (28.0%) | 3 (2.6%) |
| $75,000 to $99,999 | 45 (17.2%) | 9 (8.0%) |
| $100,000 to $149,999 | 29 (11.1%) | 13 (11.5%) |
| $150,000 or more | 25 (9.6%) | 0 (0.0%) |
| Total | 261 (100.0%) | 113 (100.0%) |
Monthly Housing Cost Tiers in Littleville
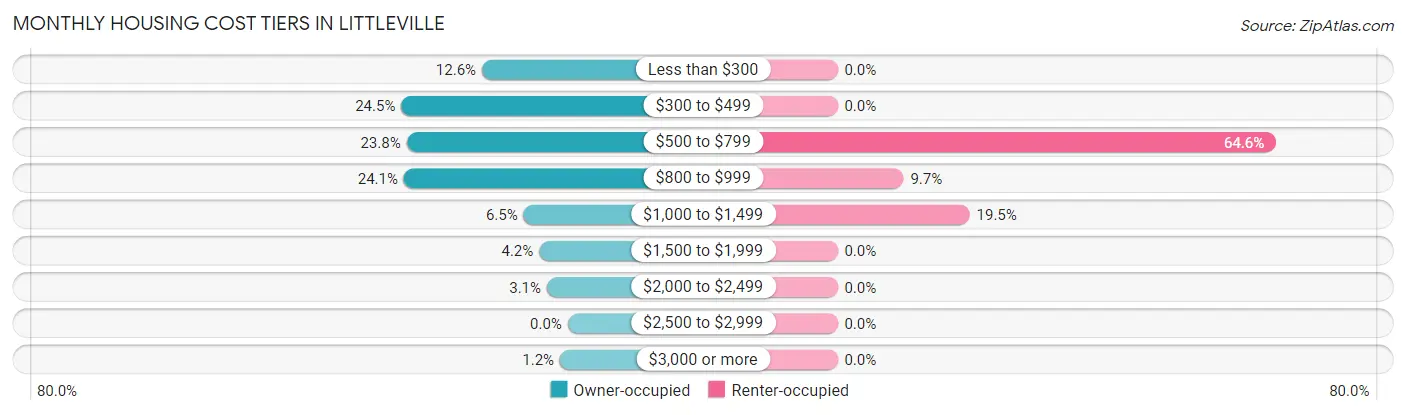
| Monthly Cost | Owner-occupied | Renter-occupied |
| Less than $300 | 33 (12.6%) | 0 (0.0%) |
| $300 to $499 | 64 (24.5%) | 0 (0.0%) |
| $500 to $799 | 62 (23.7%) | 73 (64.6%) |
| $800 to $999 | 63 (24.1%) | 11 (9.7%) |
| $1,000 to $1,499 | 17 (6.5%) | 22 (19.5%) |
| $1,500 to $1,999 | 11 (4.2%) | 0 (0.0%) |
| $2,000 to $2,499 | 8 (3.1%) | 0 (0.0%) |
| $2,500 to $2,999 | 0 (0.0%) | 0 (0.0%) |
| $3,000 or more | 3 (1.1%) | 0 (0.0%) |
| Total | 261 (100.0%) | 113 (100.0%) |
Physical Housing Characteristics in Littleville
Housing Structures in Littleville
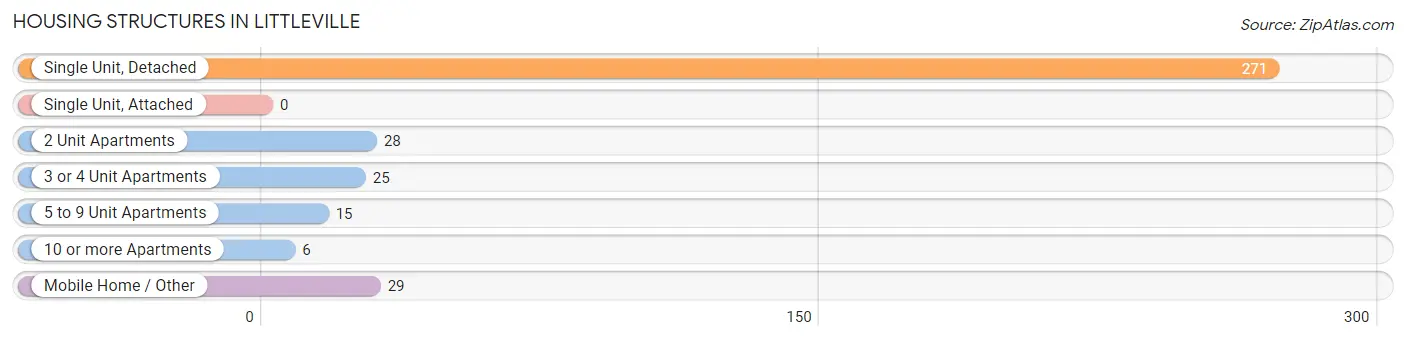
| Structure Type | # Housing Units | % Housing Units |
| Single Unit, Detached | 271 | 72.5% |
| Single Unit, Attached | 0 | 0.0% |
| 2 Unit Apartments | 28 | 7.5% |
| 3 or 4 Unit Apartments | 25 | 6.7% |
| 5 to 9 Unit Apartments | 15 | 4.0% |
| 10 or more Apartments | 6 | 1.6% |
| Mobile Home / Other | 29 | 7.7% |
| Total | 374 | 100.0% |
Housing Structures by Occupancy in Littleville
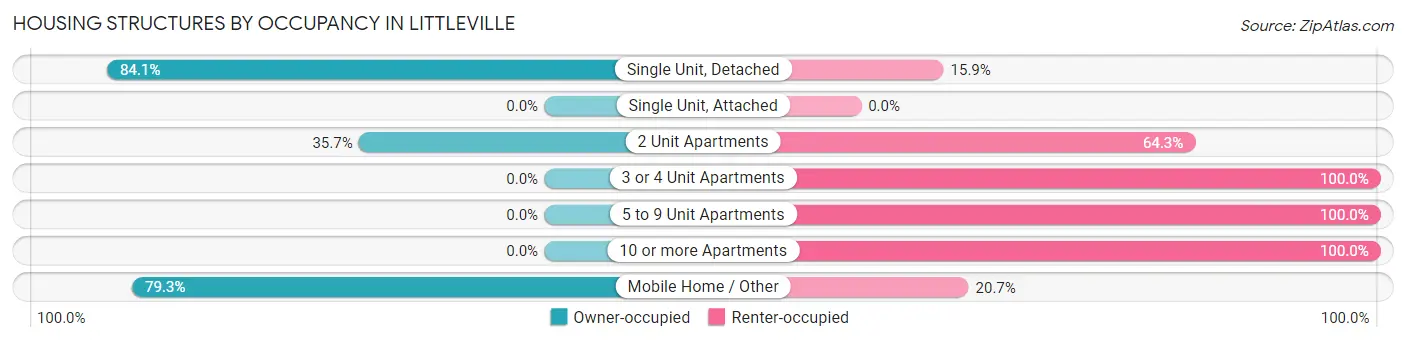
| Structure Type | Owner-occupied | Renter-occupied |
| Single Unit, Detached | 228 (84.1%) | 43 (15.9%) |
| Single Unit, Attached | 0 (0.0%) | 0 (0.0%) |
| 2 Unit Apartments | 10 (35.7%) | 18 (64.3%) |
| 3 or 4 Unit Apartments | 0 (0.0%) | 25 (100.0%) |
| 5 to 9 Unit Apartments | 0 (0.0%) | 15 (100.0%) |
| 10 or more Apartments | 0 (0.0%) | 6 (100.0%) |
| Mobile Home / Other | 23 (79.3%) | 6 (20.7%) |
| Total | 261 (69.8%) | 113 (30.2%) |
Housing Structures by Number of Rooms in Littleville
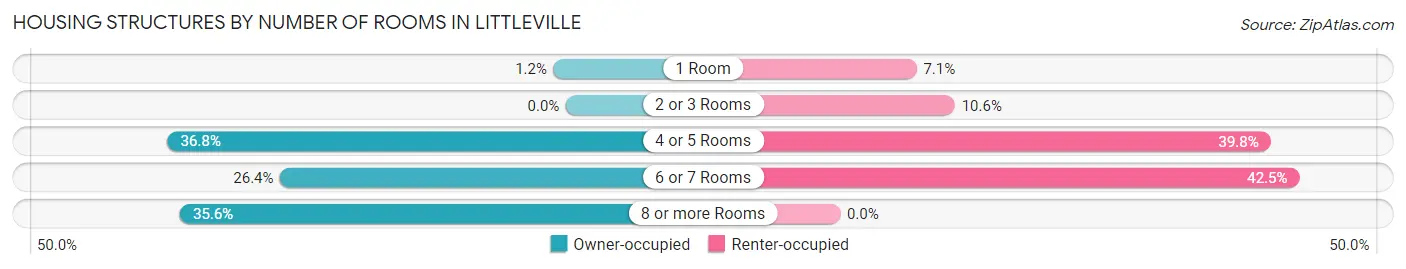
| Number of Rooms | Owner-occupied | Renter-occupied |
| 1 Room | 3 (1.1%) | 8 (7.1%) |
| 2 or 3 Rooms | 0 (0.0%) | 12 (10.6%) |
| 4 or 5 Rooms | 96 (36.8%) | 45 (39.8%) |
| 6 or 7 Rooms | 69 (26.4%) | 48 (42.5%) |
| 8 or more Rooms | 93 (35.6%) | 0 (0.0%) |
| Total | 261 (100.0%) | 113 (100.0%) |
Housing Structure by Heating Type in Littleville
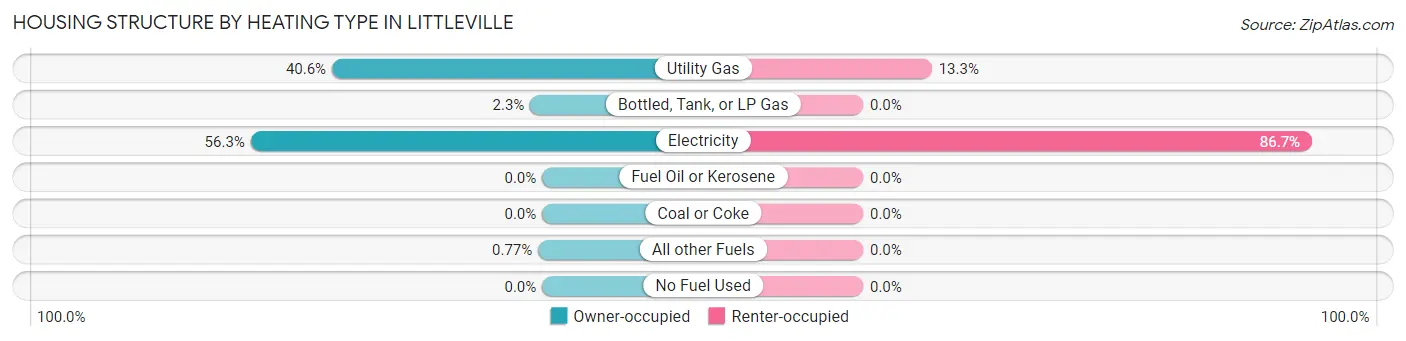
| Heating Type | Owner-occupied | Renter-occupied |
| Utility Gas | 106 (40.6%) | 15 (13.3%) |
| Bottled, Tank, or LP Gas | 6 (2.3%) | 0 (0.0%) |
| Electricity | 147 (56.3%) | 98 (86.7%) |
| Fuel Oil or Kerosene | 0 (0.0%) | 0 (0.0%) |
| Coal or Coke | 0 (0.0%) | 0 (0.0%) |
| All other Fuels | 2 (0.8%) | 0 (0.0%) |
| No Fuel Used | 0 (0.0%) | 0 (0.0%) |
| Total | 261 (100.0%) | 113 (100.0%) |
Household Vehicle Usage in Littleville
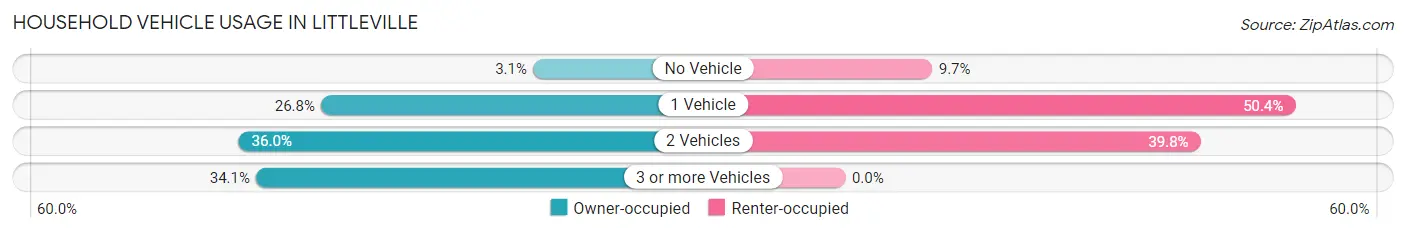
| Vehicles per Household | Owner-occupied | Renter-occupied |
| No Vehicle | 8 (3.1%) | 11 (9.7%) |
| 1 Vehicle | 70 (26.8%) | 57 (50.4%) |
| 2 Vehicles | 94 (36.0%) | 45 (39.8%) |
| 3 or more Vehicles | 89 (34.1%) | 0 (0.0%) |
| Total | 261 (100.0%) | 113 (100.0%) |
Real Estate & Mortgages in Littleville
Real Estate and Mortgage Overview in Littleville
| Characteristic | Without Mortgage | With Mortgage |
| Housing Units | 160 | 101 |
| Median Property Value | $153,900 | $143,100 |
| Median Household Income | $52,500 | $15 |
| Monthly Housing Costs | $463 | $0 |
| Real Estate Taxes | $424 | $40 |
Property Value by Mortgage Status in Littleville
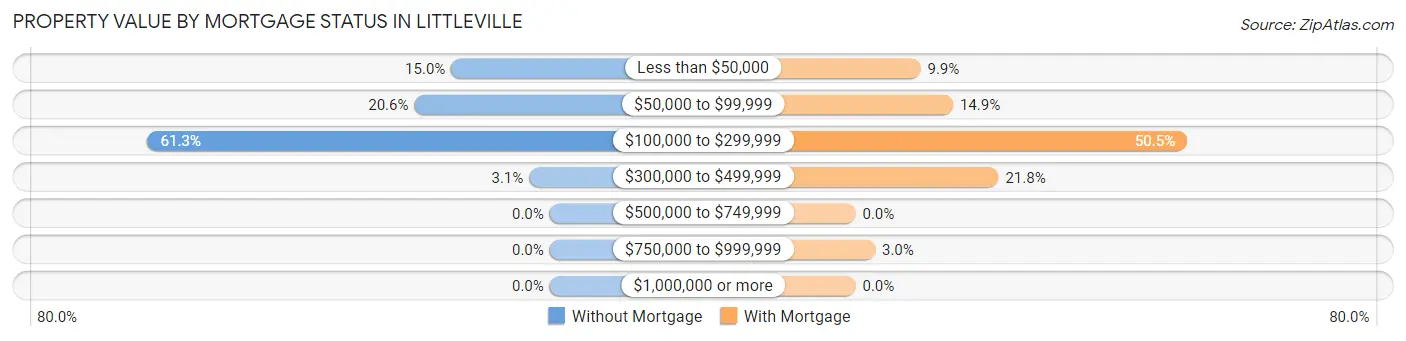
| Property Value | Without Mortgage | With Mortgage |
| Less than $50,000 | 24 (15.0%) | 10 (9.9%) |
| $50,000 to $99,999 | 33 (20.6%) | 15 (14.8%) |
| $100,000 to $299,999 | 98 (61.3%) | 51 (50.5%) |
| $300,000 to $499,999 | 5 (3.1%) | 22 (21.8%) |
| $500,000 to $749,999 | 0 (0.0%) | 0 (0.0%) |
| $750,000 to $999,999 | 0 (0.0%) | 3 (3.0%) |
| $1,000,000 or more | 0 (0.0%) | 0 (0.0%) |
| Total | 160 (100.0%) | 101 (100.0%) |
Household Income by Mortgage Status in Littleville
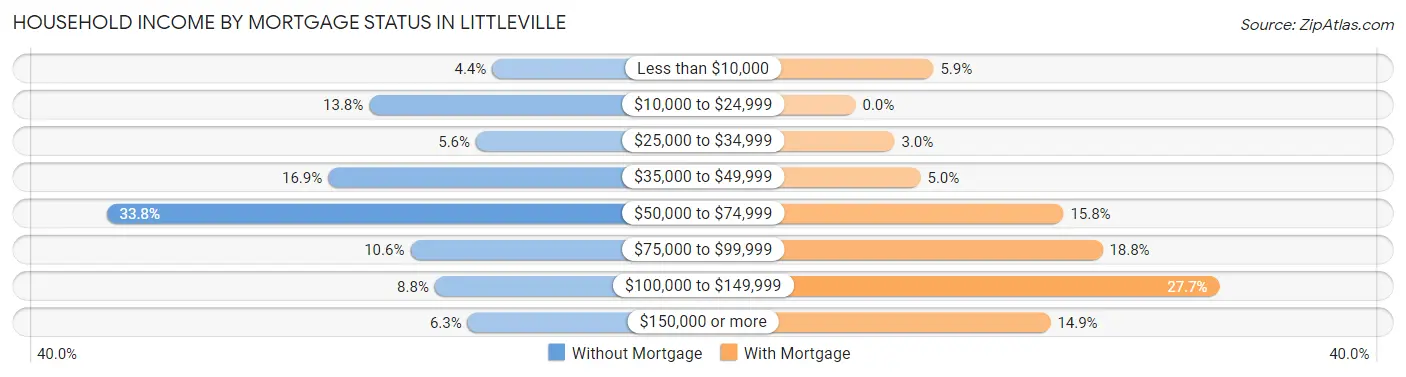
| Household Income | Without Mortgage | With Mortgage |
| Less than $10,000 | 7 (4.4%) | 6 (5.9%) |
| $10,000 to $24,999 | 22 (13.8%) | 0 (0.0%) |
| $25,000 to $34,999 | 9 (5.6%) | 3 (3.0%) |
| $35,000 to $49,999 | 27 (16.9%) | 5 (5.0%) |
| $50,000 to $74,999 | 54 (33.8%) | 16 (15.8%) |
| $75,000 to $99,999 | 17 (10.6%) | 19 (18.8%) |
| $100,000 to $149,999 | 14 (8.7%) | 28 (27.7%) |
| $150,000 or more | 10 (6.2%) | 15 (14.8%) |
| Total | 160 (100.0%) | 101 (100.0%) |
Property Value to Household Income Ratio in Littleville
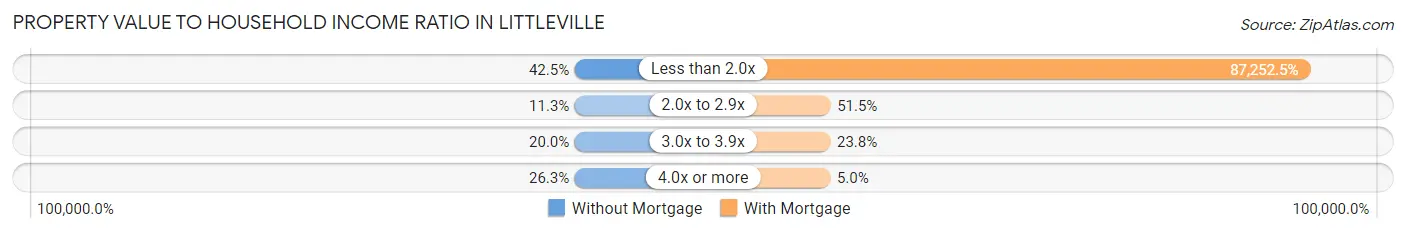
| Value-to-Income Ratio | Without Mortgage | With Mortgage |
| Less than 2.0x | 68 (42.5%) | 88,125 (87,252.5%) |
| 2.0x to 2.9x | 18 (11.3%) | 52 (51.5%) |
| 3.0x to 3.9x | 32 (20.0%) | 24 (23.8%) |
| 4.0x or more | 42 (26.3%) | 5 (5.0%) |
| Total | 160 (100.0%) | 101 (100.0%) |
Real Estate Taxes by Mortgage Status in Littleville
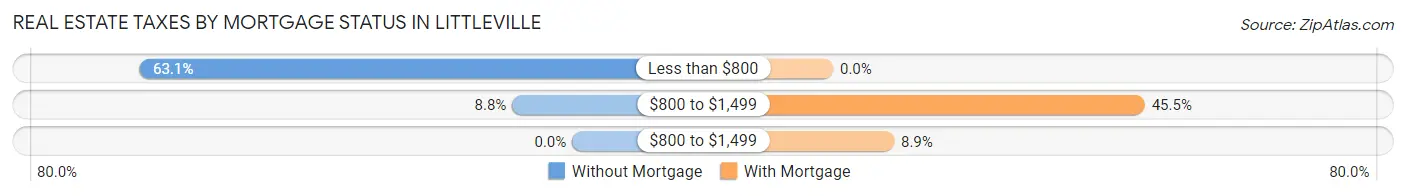
| Property Taxes | Without Mortgage | With Mortgage |
| Less than $800 | 101 (63.1%) | 0 (0.0%) |
| $800 to $1,499 | 14 (8.7%) | 46 (45.5%) |
| $800 to $1,499 | 0 (0.0%) | 9 (8.9%) |
| Total | 160 (100.0%) | 101 (100.0%) |
Health & Disability in Littleville
Health Insurance Coverage by Age in Littleville
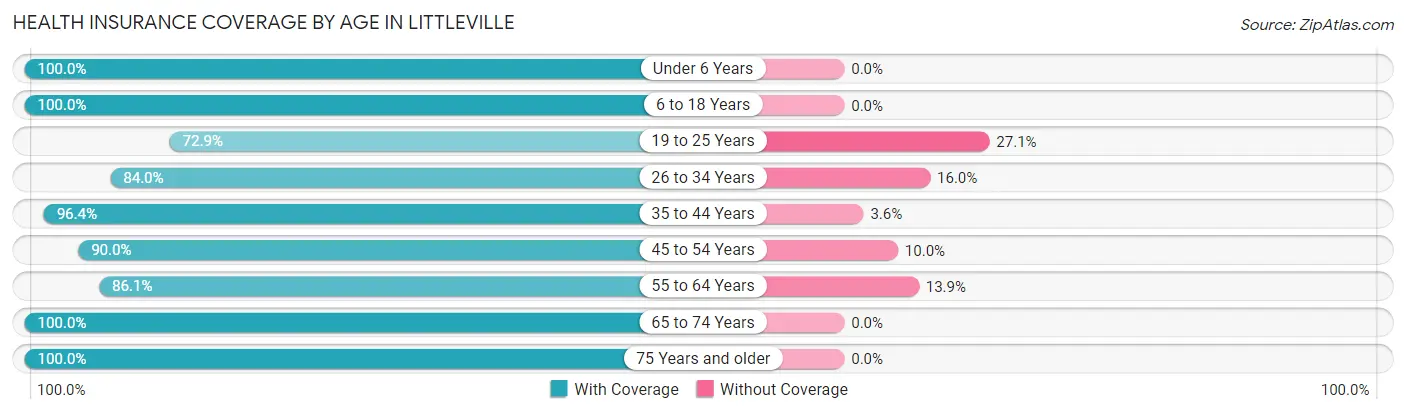
| Age Bracket | With Coverage | Without Coverage |
| Under 6 Years | 33 (100.0%) | 0 (0.0%) |
| 6 to 18 Years | 95 (100.0%) | 0 (0.0%) |
| 19 to 25 Years | 62 (72.9%) | 23 (27.1%) |
| 26 to 34 Years | 84 (84.0%) | 16 (16.0%) |
| 35 to 44 Years | 54 (96.4%) | 2 (3.6%) |
| 45 to 54 Years | 81 (90.0%) | 9 (10.0%) |
| 55 to 64 Years | 93 (86.1%) | 15 (13.9%) |
| 65 to 74 Years | 170 (100.0%) | 0 (0.0%) |
| 75 Years and older | 75 (100.0%) | 0 (0.0%) |
| Total | 747 (92.0%) | 65 (8.0%) |
Health Insurance Coverage by Citizenship Status in Littleville
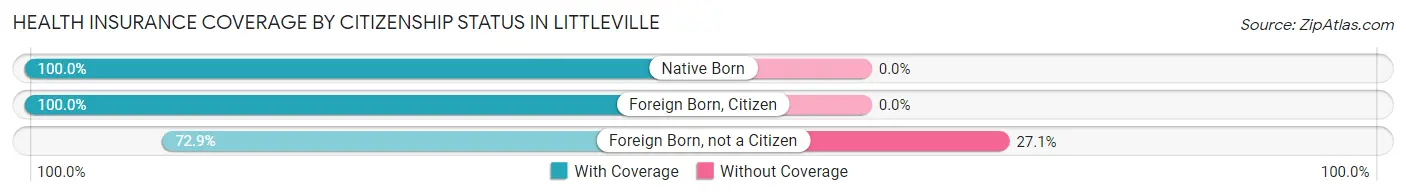
| Citizenship Status | With Coverage | Without Coverage |
| Native Born | 33 (100.0%) | 0 (0.0%) |
| Foreign Born, Citizen | 95 (100.0%) | 0 (0.0%) |
| Foreign Born, not a Citizen | 62 (72.9%) | 23 (27.1%) |
Health Insurance Coverage by Household Income in Littleville
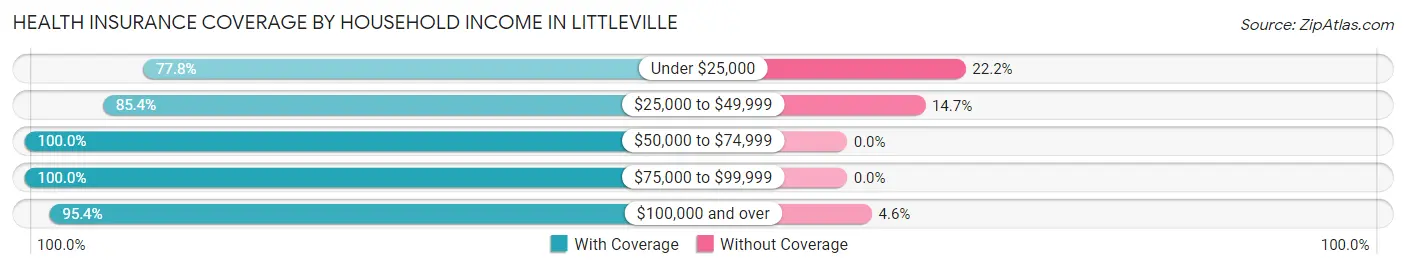
| Household Income | With Coverage | Without Coverage |
| Under $25,000 | 56 (77.8%) | 16 (22.2%) |
| $25,000 to $49,999 | 233 (85.4%) | 40 (14.6%) |
| $50,000 to $74,999 | 153 (100.0%) | 0 (0.0%) |
| $75,000 to $99,999 | 120 (100.0%) | 0 (0.0%) |
| $100,000 and over | 185 (95.4%) | 9 (4.6%) |
Public vs Private Health Insurance Coverage by Age in Littleville
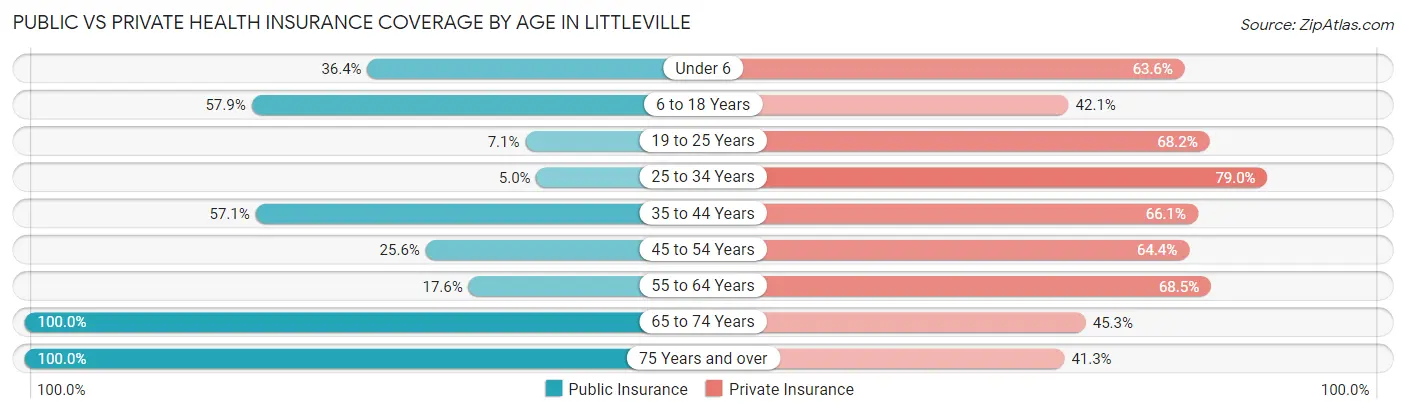
| Age Bracket | Public Insurance | Private Insurance |
| Under 6 | 12 (36.4%) | 21 (63.6%) |
| 6 to 18 Years | 55 (57.9%) | 40 (42.1%) |
| 19 to 25 Years | 6 (7.1%) | 58 (68.2%) |
| 25 to 34 Years | 5 (5.0%) | 79 (79.0%) |
| 35 to 44 Years | 32 (57.1%) | 37 (66.1%) |
| 45 to 54 Years | 23 (25.6%) | 58 (64.4%) |
| 55 to 64 Years | 19 (17.6%) | 74 (68.5%) |
| 65 to 74 Years | 170 (100.0%) | 77 (45.3%) |
| 75 Years and over | 75 (100.0%) | 31 (41.3%) |
| Total | 397 (48.9%) | 475 (58.5%) |
Disability Status by Sex by Age in Littleville
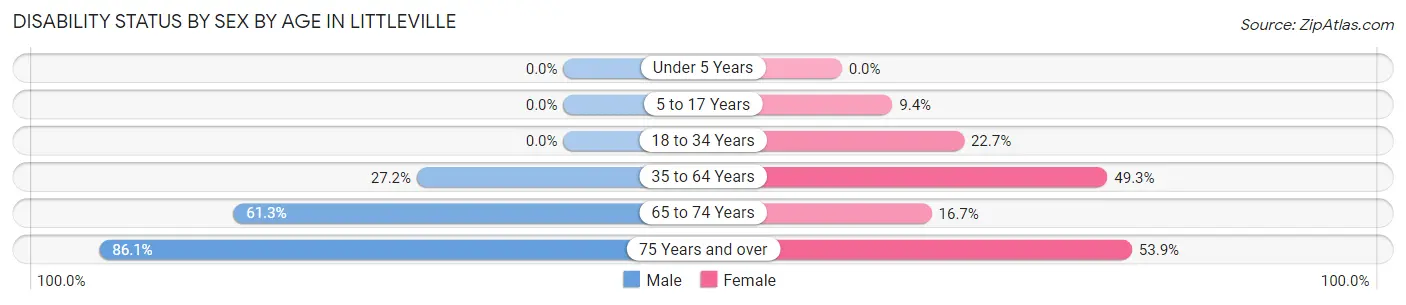
| Age Bracket | Male | Female |
| Under 5 Years | 0 (0.0%) | 0 (0.0%) |
| 5 to 17 Years | 0 (0.0%) | 6 (9.4%) |
| 18 to 34 Years | 0 (0.0%) | 22 (22.7%) |
| 35 to 64 Years | 31 (27.2%) | 69 (49.3%) |
| 65 to 74 Years | 49 (61.3%) | 15 (16.7%) |
| 75 Years and over | 31 (86.1%) | 21 (53.8%) |
Disability Class by Sex by Age in Littleville
Disability Class: Hearing Difficulty
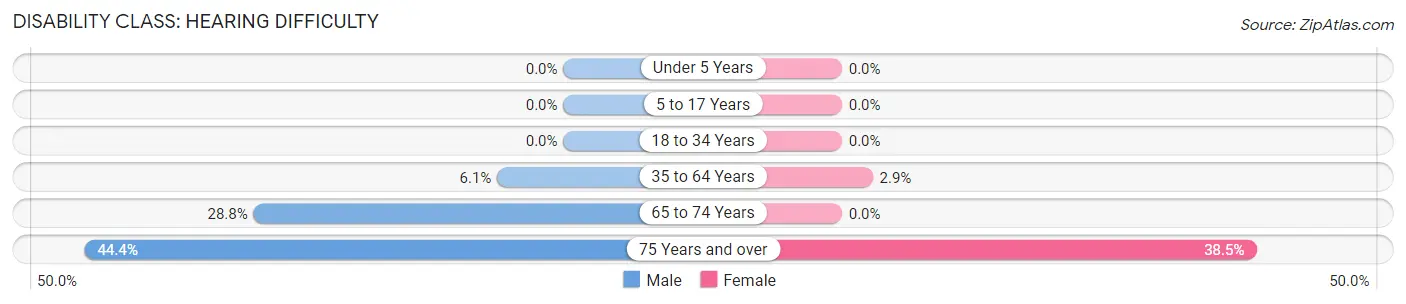
| Age Bracket | Male | Female |
| Under 5 Years | 0 (0.0%) | 0 (0.0%) |
| 5 to 17 Years | 0 (0.0%) | 0 (0.0%) |
| 18 to 34 Years | 0 (0.0%) | 0 (0.0%) |
| 35 to 64 Years | 7 (6.1%) | 4 (2.9%) |
| 65 to 74 Years | 23 (28.7%) | 0 (0.0%) |
| 75 Years and over | 16 (44.4%) | 15 (38.5%) |
Disability Class: Vision Difficulty
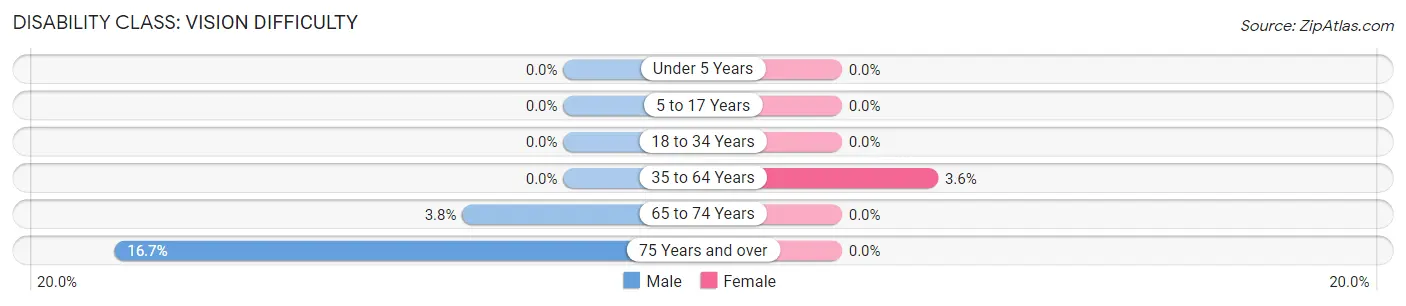
| Age Bracket | Male | Female |
| Under 5 Years | 0 (0.0%) | 0 (0.0%) |
| 5 to 17 Years | 0 (0.0%) | 0 (0.0%) |
| 18 to 34 Years | 0 (0.0%) | 0 (0.0%) |
| 35 to 64 Years | 0 (0.0%) | 5 (3.6%) |
| 65 to 74 Years | 3 (3.7%) | 0 (0.0%) |
| 75 Years and over | 6 (16.7%) | 0 (0.0%) |
Disability Class: Cognitive Difficulty
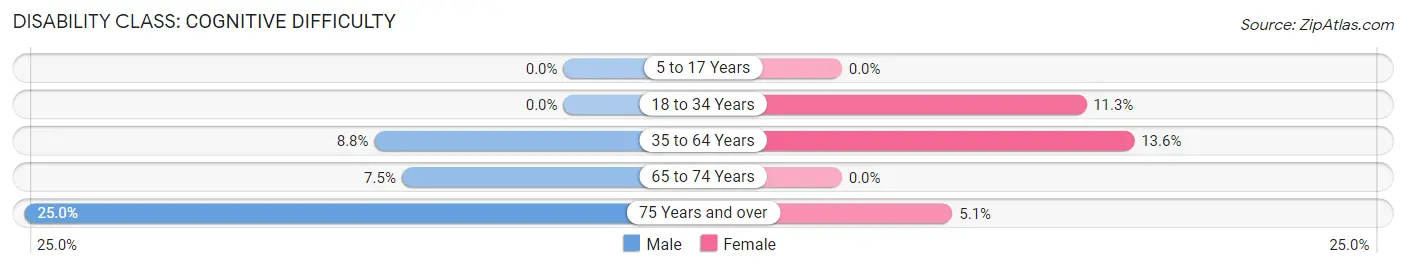
| Age Bracket | Male | Female |
| 5 to 17 Years | 0 (0.0%) | 0 (0.0%) |
| 18 to 34 Years | 0 (0.0%) | 11 (11.3%) |
| 35 to 64 Years | 10 (8.8%) | 19 (13.6%) |
| 65 to 74 Years | 6 (7.5%) | 0 (0.0%) |
| 75 Years and over | 9 (25.0%) | 2 (5.1%) |
Disability Class: Ambulatory Difficulty
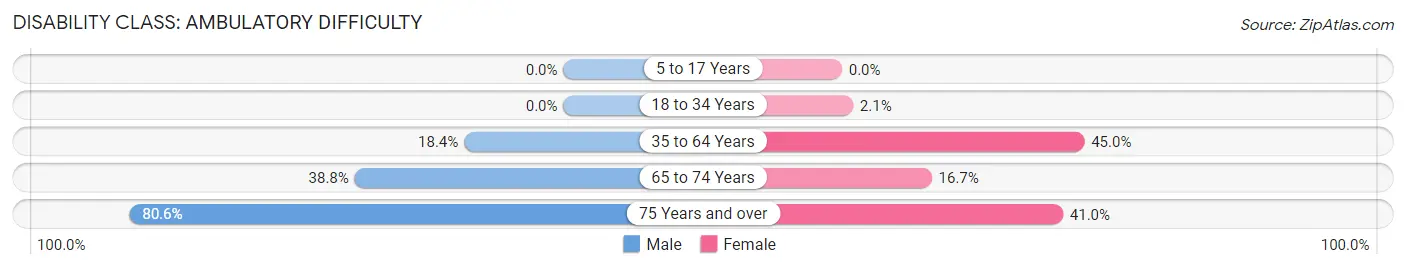
| Age Bracket | Male | Female |
| 5 to 17 Years | 0 (0.0%) | 0 (0.0%) |
| 18 to 34 Years | 0 (0.0%) | 2 (2.1%) |
| 35 to 64 Years | 21 (18.4%) | 63 (45.0%) |
| 65 to 74 Years | 31 (38.8%) | 15 (16.7%) |
| 75 Years and over | 29 (80.6%) | 16 (41.0%) |
Disability Class: Self-Care Difficulty
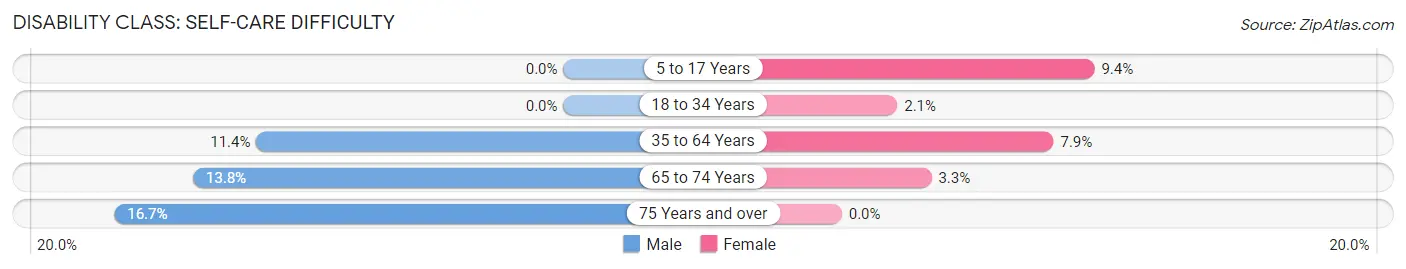
| Age Bracket | Male | Female |
| 5 to 17 Years | 0 (0.0%) | 6 (9.4%) |
| 18 to 34 Years | 0 (0.0%) | 2 (2.1%) |
| 35 to 64 Years | 13 (11.4%) | 11 (7.9%) |
| 65 to 74 Years | 11 (13.8%) | 3 (3.3%) |
| 75 Years and over | 6 (16.7%) | 0 (0.0%) |
Technology Access in Littleville
Computing Device Access in Littleville
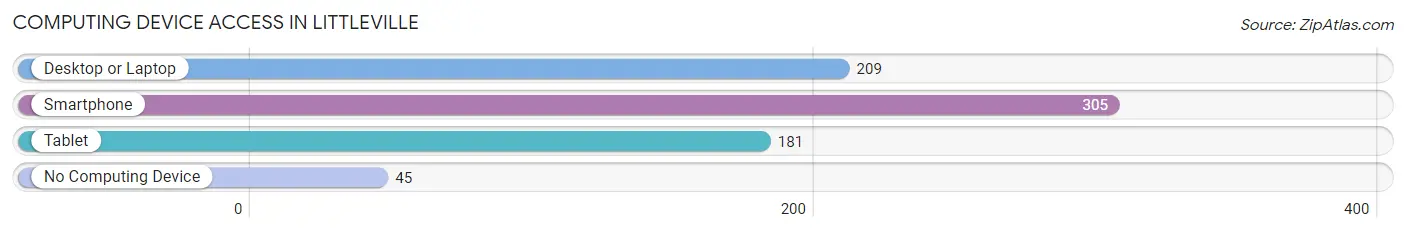
| Device Type | # Households | % Households |
| Desktop or Laptop | 209 | 55.9% |
| Smartphone | 305 | 81.6% |
| Tablet | 181 | 48.4% |
| No Computing Device | 45 | 12.0% |
| Total | 374 | 100.0% |
Internet Access in Littleville
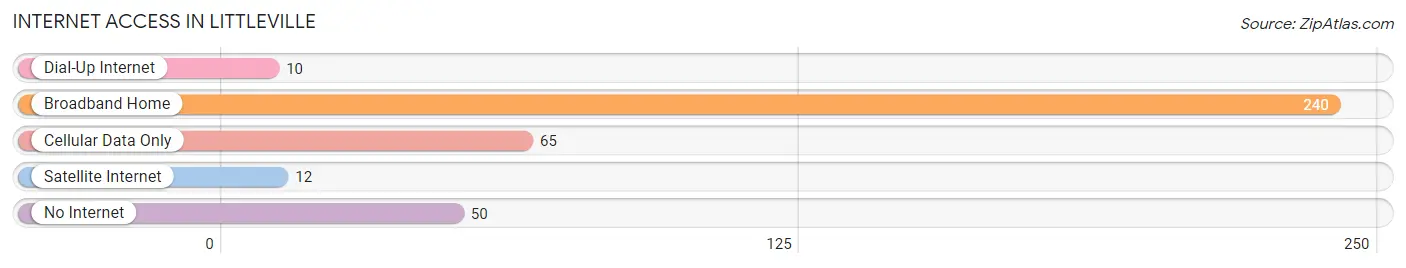
| Internet Type | # Households | % Households |
| Dial-Up Internet | 10 | 2.7% |
| Broadband Home | 240 | 64.2% |
| Cellular Data Only | 65 | 17.4% |
| Satellite Internet | 12 | 3.2% |
| No Internet | 50 | 13.4% |
| Total | 374 | 100.0% |
Littleville Summary
Littleville, Alabama is a small town located in Colbert County in the northwest corner of the state. It is situated on the banks of the Tennessee River, just south of the Tennessee-Alabama state line. The town was founded in 1820 and has a population of approximately 1,500 people.
Littleville is located in the foothills of the Appalachian Mountains and is surrounded by rolling hills and lush forests. The town is home to a variety of wildlife, including deer, wild turkeys, and a variety of birds. The area is also known for its abundance of wildflowers, which bloom in the spring and summer months.
The economy of Littleville is largely based on agriculture and forestry. The town is home to several farms, which produce a variety of crops, including corn, soybeans, and cotton. The town also has a thriving timber industry, with several sawmills located in the area. In addition, Littleville is home to several small businesses, including a grocery store, a hardware store, and a few restaurants.
The demographics of Littleville are largely white, with a small African American population. The median household income is approximately $30,000, and the median age is around 40 years old. The town is home to a variety of churches, including Baptist, Methodist, and Presbyterian.
Littleville is served by the Colbert County School System, which includes two elementary schools, a middle school, and a high school. The town also has a library, a post office, and a few parks. The town is home to a variety of recreational activities, including fishing, hunting, and camping.
Littleville is a small town with a rich history and a vibrant economy. It is a great place to live and work, and it offers a variety of activities for residents and visitors alike. The town is a great place to raise a family, and it is a great place to call home.
Common Questions
What is Per Capita Income in Littleville?
Per Capita income in Littleville is $29,638.
What is the Median Family Income in Littleville?
Median Family Income in Littleville is $60,469.
What is the Median Household income in Littleville?
Median Household Income in Littleville is $51,667.
What is Income or Wage Gap in Littleville?
Income or Wage Gap in Littleville is 40.2%.
Women in Littleville earn 59.8 cents for every dollar earned by a man.
What is Inequality or Gini Index in Littleville?
Inequality or Gini Index in Littleville is 0.35.
What is the Total Population of Littleville?
Total Population of Littleville is 821.
What is the Total Male Population of Littleville?
Total Male Population of Littleville is 369.
What is the Total Female Population of Littleville?
Total Female Population of Littleville is 452.
What is the Ratio of Males per 100 Females in Littleville?
There are 81.64 Males per 100 Females in Littleville.
What is the Ratio of Females per 100 Males in Littleville?
There are 122.49 Females per 100 Males in Littleville.
What is the Median Population Age in Littleville?
Median Population Age in Littleville is 49.7 Years.
What is the Average Family Size in Littleville
Average Family Size in Littleville is 2.6 People.
What is the Average Household Size in Littleville
Average Household Size in Littleville is 2.2 People.
How Large is the Labor Force in Littleville?
There are 360 People in the Labor Forcein in Littleville.
What is the Percentage of People in the Labor Force in Littleville?
51.3% of People are in the Labor Force in Littleville.
What is the Unemployment Rate in Littleville?
Unemployment Rate in Littleville is 2.3%.