Brookwood, AL Map & Demographics
Brookwood Map
Brookwood Overview
$32,634
PER CAPITA INCOME
$82,765
AVG FAMILY INCOME
$75,125
AVG HOUSEHOLD INCOME
19.6%
WAGE / INCOME GAP [ % ]
80.4¢/ $1
WAGE / INCOME GAP [ $ ]
0.35
INEQUALITY / GINI INDEX
2,420
TOTAL POPULATION
1,142
MALE POPULATION
1,278
FEMALE POPULATION
89.36
MALES / 100 FEMALES
111.91
FEMALES / 100 MALES
34.7
MEDIAN AGE
3.1
AVG FAMILY SIZE
2.7
AVG HOUSEHOLD SIZE
1,384
LABOR FORCE [ PEOPLE ]
67.5%
PERCENT IN LABOR FORCE
1.5%
UNEMPLOYMENT RATE
Brookwood Zip Codes
Income in Brookwood
Income Overview in Brookwood
Per Capita Income in Brookwood is $32,634, while median incomes of families and households are $82,765 and $75,125 respectively.
| Characteristic | Number | Measure |
| Per Capita Income | 2,420 | $32,634 |
| Median Family Income | 687 | $82,765 |
| Mean Family Income | 687 | $94,320 |
| Median Household Income | 890 | $75,125 |
| Mean Household Income | 890 | $82,834 |
| Income Deficit | 687 | $0 |
| Wage / Income Gap (%) | 2,420 | 19.56% |
| Wage / Income Gap ($) | 2,420 | 80.44¢ per $1 |
| Gini / Inequality Index | 2,420 | 0.35 |
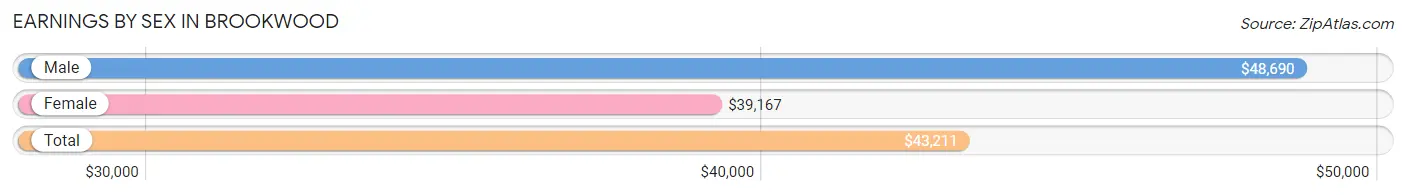
Earnings by Sex in Brookwood
Average Earnings in Brookwood are $43,211, $48,690 for men and $39,167 for women, a difference of 19.6%.
| Sex | Number | Average Earnings |
| Male | 750 (52.8%) | $48,690 |
| Female | 670 (47.2%) | $39,167 |
| Total | 1,420 (100.0%) | $43,211 |
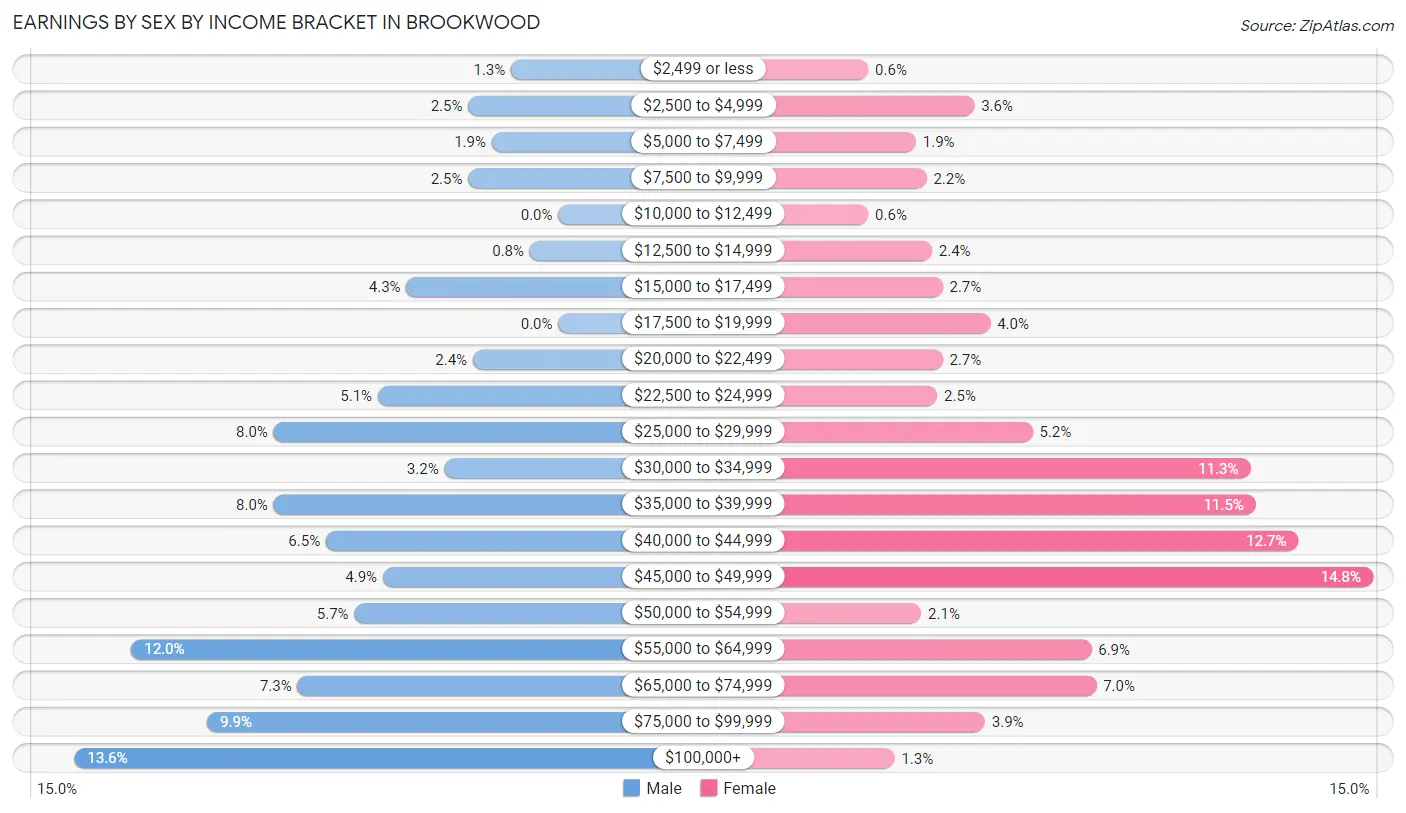
Earnings by Sex by Income Bracket in Brookwood
The most common earnings brackets in Brookwood are $100,000+ for men (102 | 13.6%) and $45,000 to $49,999 for women (99 | 14.8%).
| Income | Male | Female |
| $2,499 or less | 10 (1.3%) | 4 (0.6%) |
| $2,500 to $4,999 | 19 (2.5%) | 24 (3.6%) |
| $5,000 to $7,499 | 14 (1.9%) | 13 (1.9%) |
| $7,500 to $9,999 | 19 (2.5%) | 15 (2.2%) |
| $10,000 to $12,499 | 0 (0.0%) | 4 (0.6%) |
| $12,500 to $14,999 | 6 (0.8%) | 16 (2.4%) |
| $15,000 to $17,499 | 32 (4.3%) | 18 (2.7%) |
| $17,500 to $19,999 | 0 (0.0%) | 27 (4.0%) |
| $20,000 to $22,499 | 18 (2.4%) | 18 (2.7%) |
| $22,500 to $24,999 | 38 (5.1%) | 17 (2.5%) |
| $25,000 to $29,999 | 60 (8.0%) | 35 (5.2%) |
| $30,000 to $34,999 | 24 (3.2%) | 76 (11.3%) |
| $35,000 to $39,999 | 60 (8.0%) | 77 (11.5%) |
| $40,000 to $44,999 | 49 (6.5%) | 85 (12.7%) |
| $45,000 to $49,999 | 37 (4.9%) | 99 (14.8%) |
| $50,000 to $54,999 | 43 (5.7%) | 14 (2.1%) |
| $55,000 to $64,999 | 90 (12.0%) | 46 (6.9%) |
| $65,000 to $74,999 | 55 (7.3%) | 47 (7.0%) |
| $75,000 to $99,999 | 74 (9.9%) | 26 (3.9%) |
| $100,000+ | 102 (13.6%) | 9 (1.3%) |
| Total | 750 (100.0%) | 670 (100.0%) |
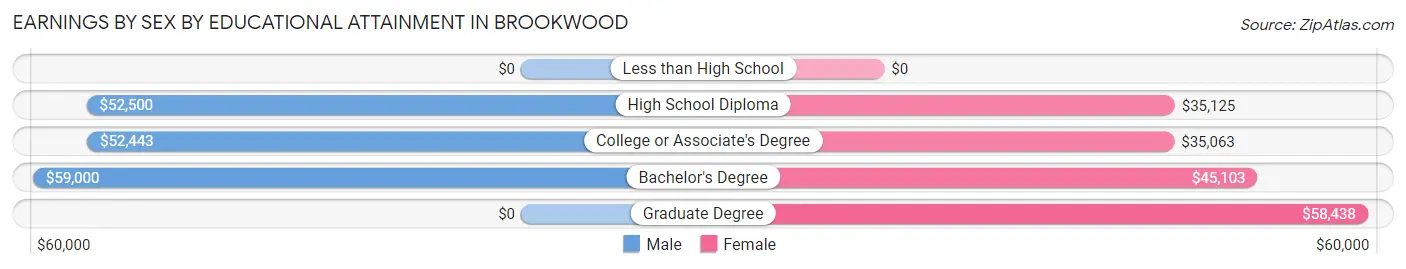
Earnings by Sex by Educational Attainment in Brookwood
Average earnings in Brookwood are $52,196 for men and $41,250 for women, a difference of 21.0%. Men with an educational attainment of bachelor's degree enjoy the highest average annual earnings of $59,000, while those with college or associate's degree education earn the least with $52,443. Women with an educational attainment of graduate degree earn the most with the average annual earnings of $58,438, while those with college or associate's degree education have the smallest earnings of $35,063.
| Educational Attainment | Male Income | Female Income |
| Less than High School | - | - |
| High School Diploma | $52,500 | $35,125 |
| College or Associate's Degree | $52,443 | $35,063 |
| Bachelor's Degree | $59,000 | $45,103 |
| Graduate Degree | - | - |
| Total | $52,196 | $41,250 |
Family Income in Brookwood
Family Income Brackets in Brookwood
According to the Brookwood family income data, there are 169 families falling into the $75,000 to $99,999 income range, which is the most common income bracket and makes up 24.6% of all families.

| Income Bracket | # Families | % Families |
| Less than $10,000 | 22 | 3.2% |
| $10,000 to $14,999 | 0 | 0.0% |
| $15,000 to $24,999 | 5 | 0.7% |
| $25,000 to $34,999 | 24 | 3.5% |
| $35,000 to $49,999 | 72 | 10.5% |
| $50,000 to $74,999 | 148 | 21.5% |
| $75,000 to $99,999 | 169 | 24.6% |
| $100,000 to $149,999 | 137 | 19.9% |
| $150,000 to $199,999 | 86 | 12.5% |
| $200,000+ | 24 | 3.5% |
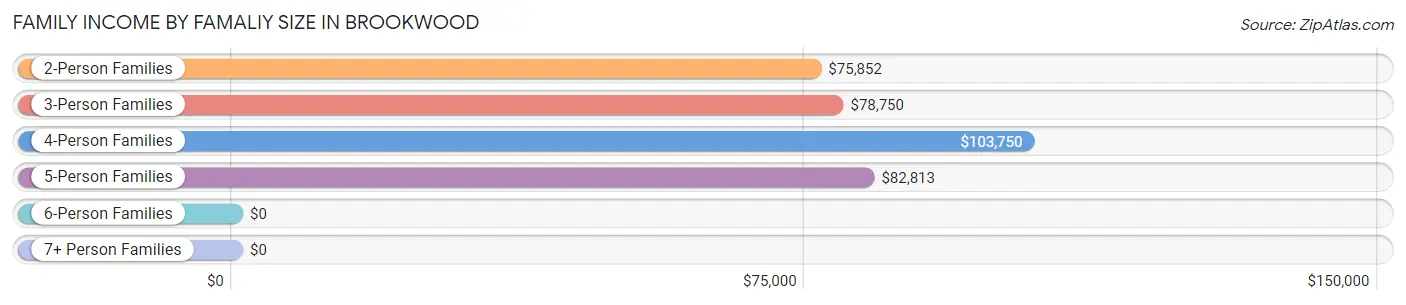
Family Income by Famaliy Size in Brookwood
4-person families (135 | 19.7%) account for the highest median family income in Brookwood with $103,750 per family, while 2-person families (331 | 48.2%) have the highest median income of $37,926 per family member.
| Income Bracket | # Families | Median Income |
| 2-Person Families | 331 (48.2%) | $75,852 |
| 3-Person Families | 171 (24.9%) | $78,750 |
| 4-Person Families | 135 (19.7%) | $103,750 |
| 5-Person Families | 42 (6.1%) | $82,813 |
| 6-Person Families | 7 (1.0%) | $0 |
| 7+ Person Families | 1 (0.2%) | $0 |
| Total | 687 (100.0%) | $82,765 |
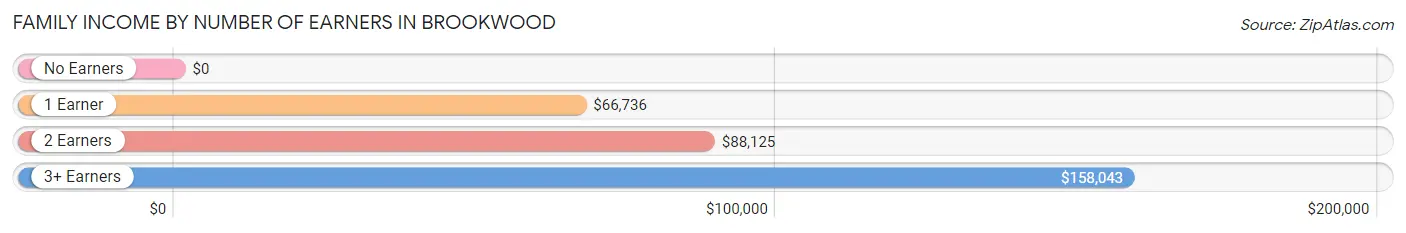
Family Income by Number of Earners in Brookwood
| Number of Earners | # Families | Median Income |
| No Earners | 77 (11.2%) | $0 |
| 1 Earner | 203 (29.5%) | $66,736 |
| 2 Earners | 337 (49.0%) | $88,125 |
| 3+ Earners | 70 (10.2%) | $158,043 |
| Total | 687 (100.0%) | $82,765 |
Household Income in Brookwood
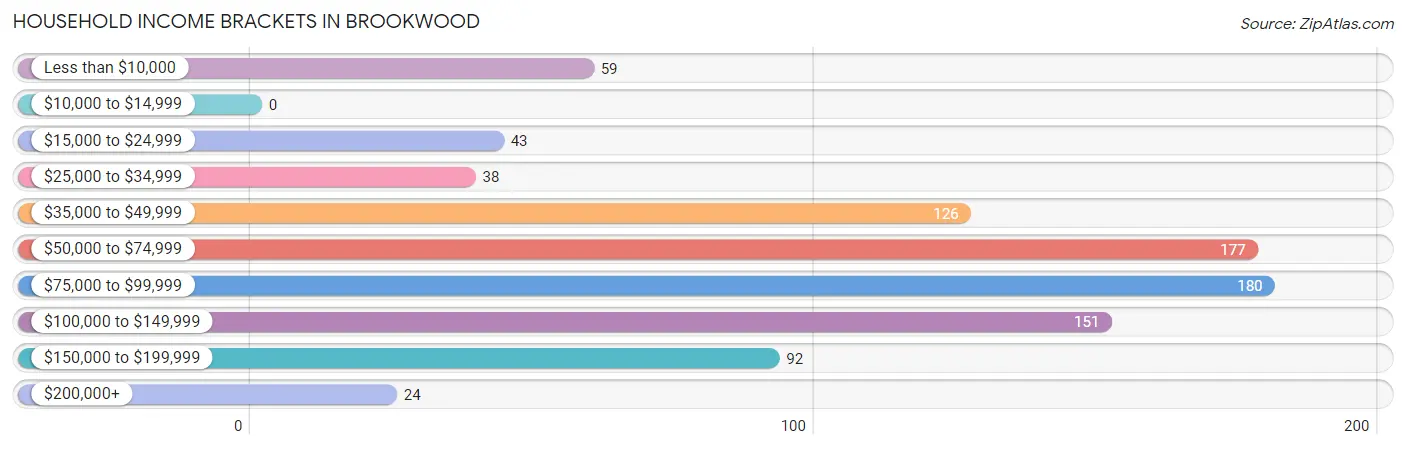
Household Income Brackets in Brookwood
With 180 households falling in the category, the $75,000 to $99,999 income range is the most frequent in Brookwood, accounting for 20.2% of all households.
| Income Bracket | # Households | % Households |
| Less than $10,000 | 59 | 6.6% |
| $10,000 to $14,999 | 0 | 0.0% |
| $15,000 to $24,999 | 43 | 4.8% |
| $25,000 to $34,999 | 38 | 4.3% |
| $35,000 to $49,999 | 126 | 14.2% |
| $50,000 to $74,999 | 177 | 19.9% |
| $75,000 to $99,999 | 180 | 20.2% |
| $100,000 to $149,999 | 151 | 17.0% |
| $150,000 to $199,999 | 92 | 10.3% |
| $200,000+ | 24 | 2.7% |
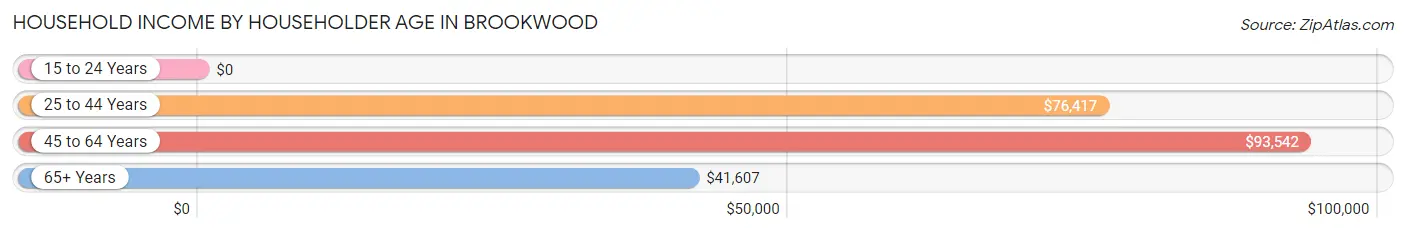
Household Income by Householder Age in Brookwood
The median household income in Brookwood is $75,125, with the highest median household income of $93,542 found in the 45 to 64 years age bracket for the primary householder. A total of 293 households (32.9%) fall into this category. Meanwhile, the 15 to 24 years age bracket for the primary householder has the lowest median household income of $0, with 20 households (2.2%) in this group.
| Income Bracket | # Households | Median Income |
| 15 to 24 Years | 20 (2.2%) | $0 |
| 25 to 44 Years | 412 (46.3%) | $76,417 |
| 45 to 64 Years | 293 (32.9%) | $93,542 |
| 65+ Years | 165 (18.5%) | $41,607 |
| Total | 890 (100.0%) | $75,125 |
Poverty in Brookwood
Income Below Poverty by Sex and Age in Brookwood
With 3.0% poverty level for males and 7.3% for females among the residents of Brookwood, 75 year old and over males and 65 to 74 year old females are the most vulnerable to poverty, with 8 males (32.0%) and 35 females (37.2%) in their respective age groups living below the poverty level.
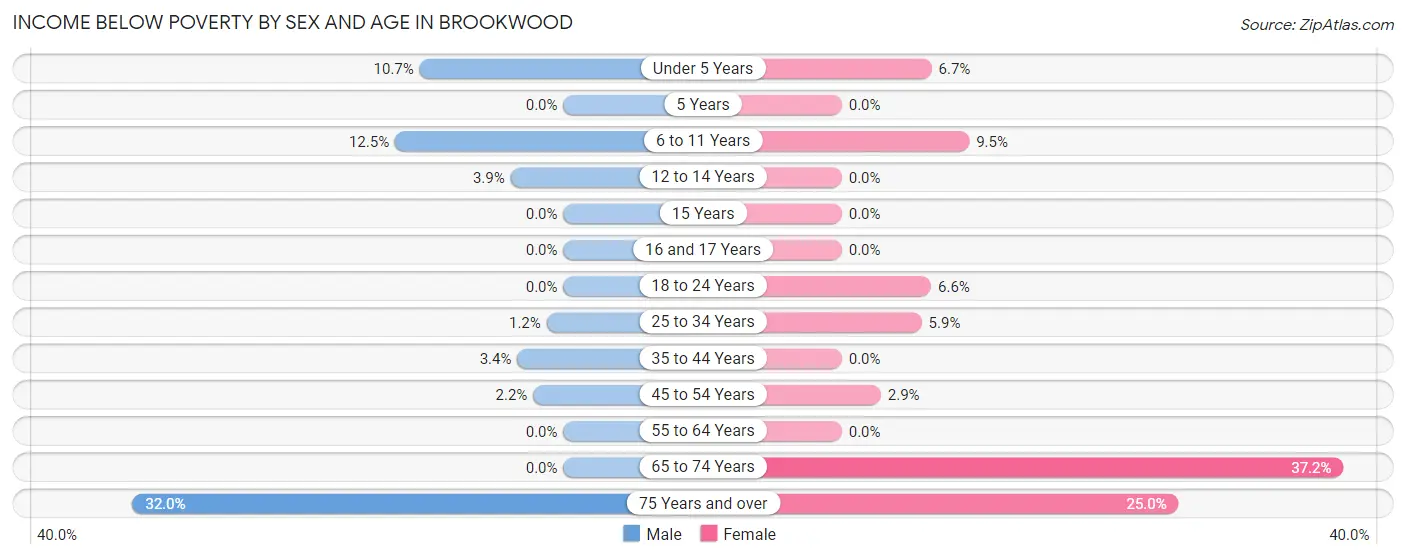
| Age Bracket | Male | Female |
| Under 5 Years | 8 (10.7%) | 2 (6.7%) |
| 5 Years | 0 (0.0%) | 0 (0.0%) |
| 6 to 11 Years | 5 (12.5%) | 7 (9.5%) |
| 12 to 14 Years | 2 (3.9%) | 0 (0.0%) |
| 15 Years | 0 (0.0%) | 0 (0.0%) |
| 16 and 17 Years | 0 (0.0%) | 0 (0.0%) |
| 18 to 24 Years | 0 (0.0%) | 12 (6.6%) |
| 25 to 34 Years | 3 (1.2%) | 14 (5.9%) |
| 35 to 44 Years | 5 (3.4%) | 0 (0.0%) |
| 45 to 54 Years | 3 (2.2%) | 4 (2.9%) |
| 55 to 64 Years | 0 (0.0%) | 0 (0.0%) |
| 65 to 74 Years | 0 (0.0%) | 35 (37.2%) |
| 75 Years and over | 8 (32.0%) | 19 (25.0%) |
| Total | 34 (3.0%) | 93 (7.3%) |
Income Above Poverty by Sex and Age in Brookwood
According to the poverty statistics in Brookwood, males aged 5 years and females aged 5 years are the age groups that are most secure financially, with 100.0% of males and 100.0% of females in these age groups living above the poverty line.
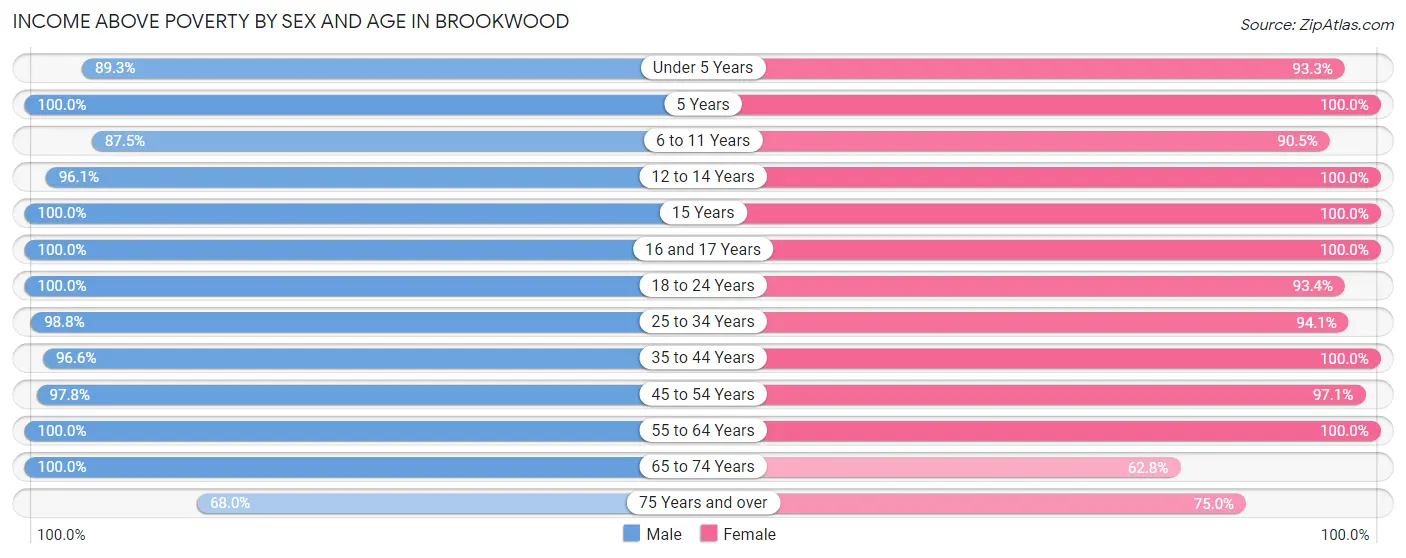
| Age Bracket | Male | Female |
| Under 5 Years | 67 (89.3%) | 28 (93.3%) |
| 5 Years | 14 (100.0%) | 27 (100.0%) |
| 6 to 11 Years | 35 (87.5%) | 67 (90.5%) |
| 12 to 14 Years | 49 (96.1%) | 48 (100.0%) |
| 15 Years | 5 (100.0%) | 2 (100.0%) |
| 16 and 17 Years | 55 (100.0%) | 7 (100.0%) |
| 18 to 24 Years | 136 (100.0%) | 169 (93.4%) |
| 25 to 34 Years | 238 (98.8%) | 222 (94.1%) |
| 35 to 44 Years | 141 (96.6%) | 184 (100.0%) |
| 45 to 54 Years | 131 (97.8%) | 134 (97.1%) |
| 55 to 64 Years | 155 (100.0%) | 181 (100.0%) |
| 65 to 74 Years | 62 (100.0%) | 59 (62.8%) |
| 75 Years and over | 17 (68.0%) | 57 (75.0%) |
| Total | 1,105 (97.0%) | 1,185 (92.7%) |
Income Below Poverty Among Married-Couple Families in Brookwood
The poverty statistics for married-couple families in Brookwood show that 2.4% or 13 of the total 546 families live below the poverty line. Families with 1 or 2 children have the highest poverty rate of 2.5%, comprising of 5 families. On the other hand, families with 3 or 4 children have the lowest poverty rate of 0.0%, which includes 0 families.
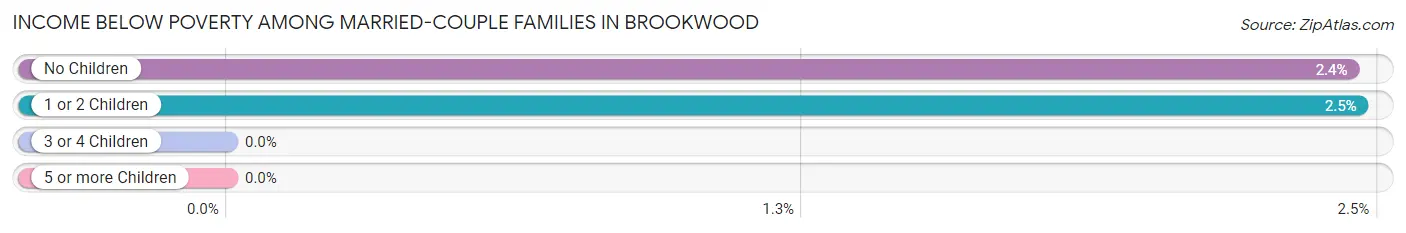
| Children | Above Poverty | Below Poverty |
| No Children | 320 (97.6%) | 8 (2.4%) |
| 1 or 2 Children | 198 (97.5%) | 5 (2.5%) |
| 3 or 4 Children | 14 (100.0%) | 0 (0.0%) |
| 5 or more Children | 1 (100.0%) | 0 (0.0%) |
| Total | 533 (97.6%) | 13 (2.4%) |
Income Below Poverty Among Single-Parent Households in Brookwood
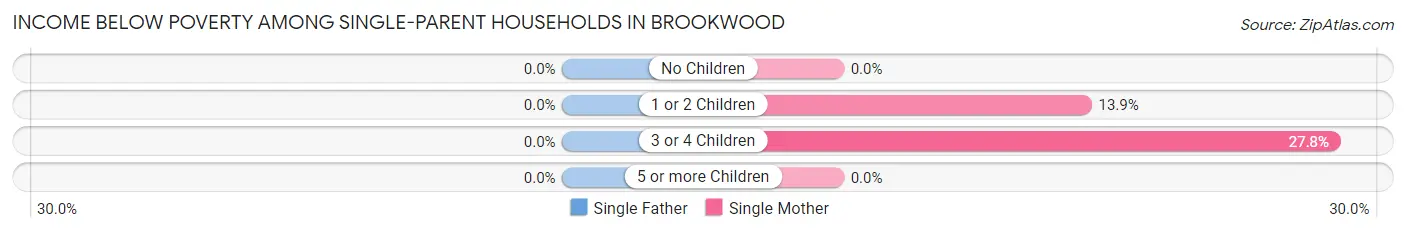
| Children | Single Father | Single Mother |
| No Children | 0 (0.0%) | 0 (0.0%) |
| 1 or 2 Children | 0 (0.0%) | 9 (13.9%) |
| 3 or 4 Children | 0 (0.0%) | 5 (27.8%) |
| 5 or more Children | 0 (0.0%) | 0 (0.0%) |
| Total | 0 (0.0%) | 14 (11.3%) |
Income Below Poverty Among Married-Couple vs Single-Parent Households in Brookwood
The poverty data for Brookwood shows that 13 of the married-couple family households (2.4%) and 14 of the single-parent households (9.9%) are living below the poverty level. Within the married-couple family households, those with 1 or 2 children have the highest poverty rate, with 5 households (2.5%) falling below the poverty line. Among the single-parent households, those with 3 or 4 children have the highest poverty rate, with 5 household (27.8%) living below poverty.
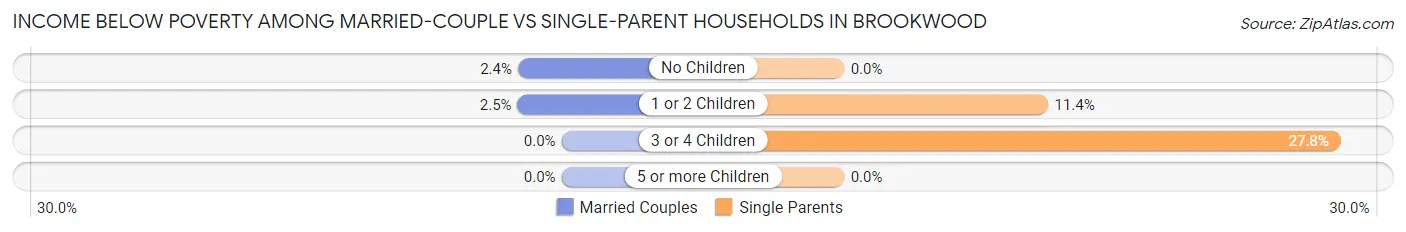
| Children | Married-Couple Families | Single-Parent Households |
| No Children | 8 (2.4%) | 0 (0.0%) |
| 1 or 2 Children | 5 (2.5%) | 9 (11.4%) |
| 3 or 4 Children | 0 (0.0%) | 5 (27.8%) |
| 5 or more Children | 0 (0.0%) | 0 (0.0%) |
| Total | 13 (2.4%) | 14 (9.9%) |
Race in Brookwood
The most populous races in Brookwood are White / Caucasian (2,089 | 86.3%), Black / African American (176 | 7.3%), and Hispanic or Latino (101 | 4.2%).
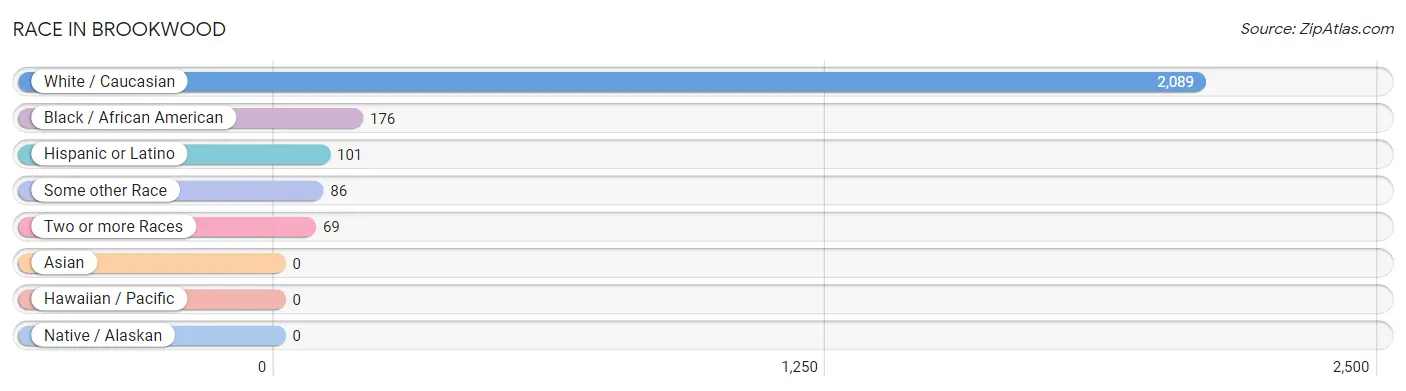
| Race | # Population | % Population |
| Asian | 0 | 0.0% |
| Black / African American | 176 | 7.3% |
| Hawaiian / Pacific | 0 | 0.0% |
| Hispanic or Latino | 101 | 4.2% |
| Native / Alaskan | 0 | 0.0% |
| White / Caucasian | 2,089 | 86.3% |
| Two or more Races | 69 | 2.9% |
| Some other Race | 86 | 3.5% |
| Total | 2,420 | 100.0% |
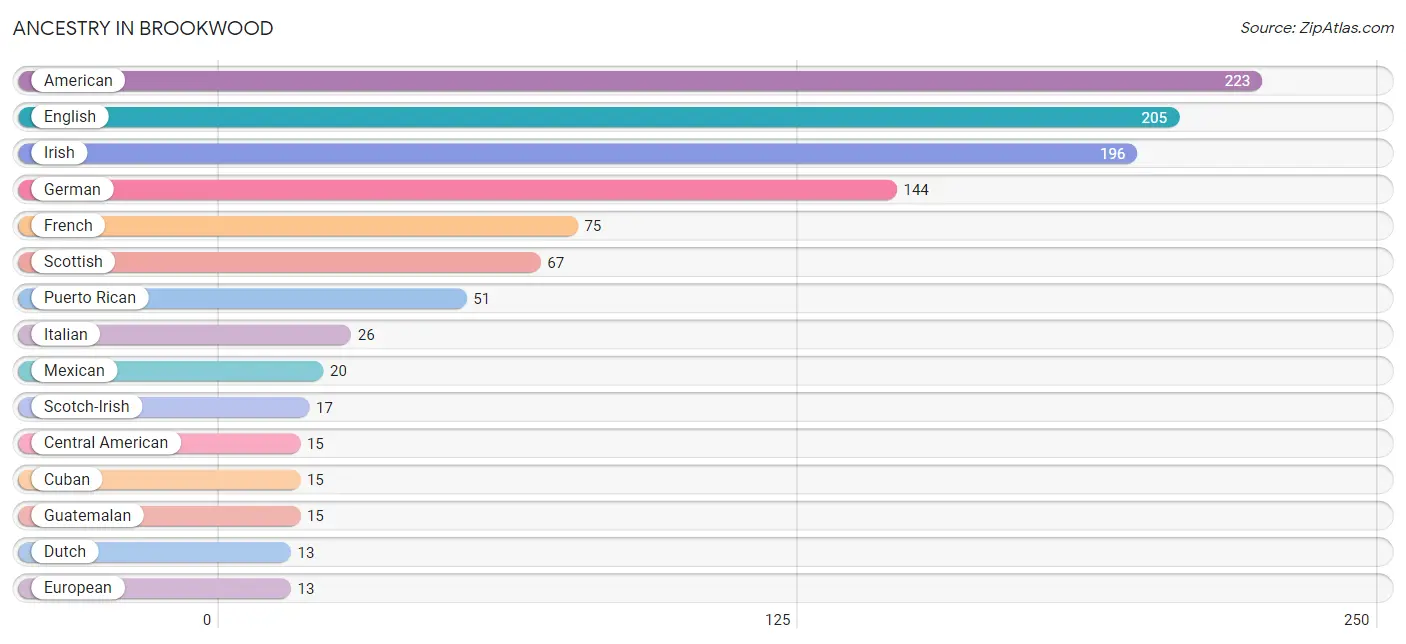
Ancestry in Brookwood
The most populous ancestries reported in Brookwood are American (223 | 9.2%), English (205 | 8.5%), Irish (196 | 8.1%), German (144 | 5.9%), and French (75 | 3.1%), together accounting for 34.8% of all Brookwood residents.
| Ancestry | # Population | % Population |
| African | 3 | 0.1% |
| American | 223 | 9.2% |
| British | 7 | 0.3% |
| Central American | 15 | 0.6% |
| Cherokee | 7 | 0.3% |
| Creek | 5 | 0.2% |
| Cuban | 15 | 0.6% |
| Dutch | 13 | 0.5% |
| English | 205 | 8.5% |
| European | 13 | 0.5% |
| French | 75 | 3.1% |
| German | 144 | 5.9% |
| Greek | 12 | 0.5% |
| Guatemalan | 15 | 0.6% |
| Iranian | 6 | 0.3% |
| Irish | 196 | 8.1% |
| Italian | 26 | 1.1% |
| Mexican | 20 | 0.8% |
| Pakistani | 6 | 0.3% |
| Polish | 3 | 0.1% |
| Puerto Rican | 51 | 2.1% |
| Scotch-Irish | 17 | 0.7% |
| Scottish | 67 | 2.8% |
| Subsaharan African | 3 | 0.1% |
| Welsh | 10 | 0.4% | View All 25 Rows |
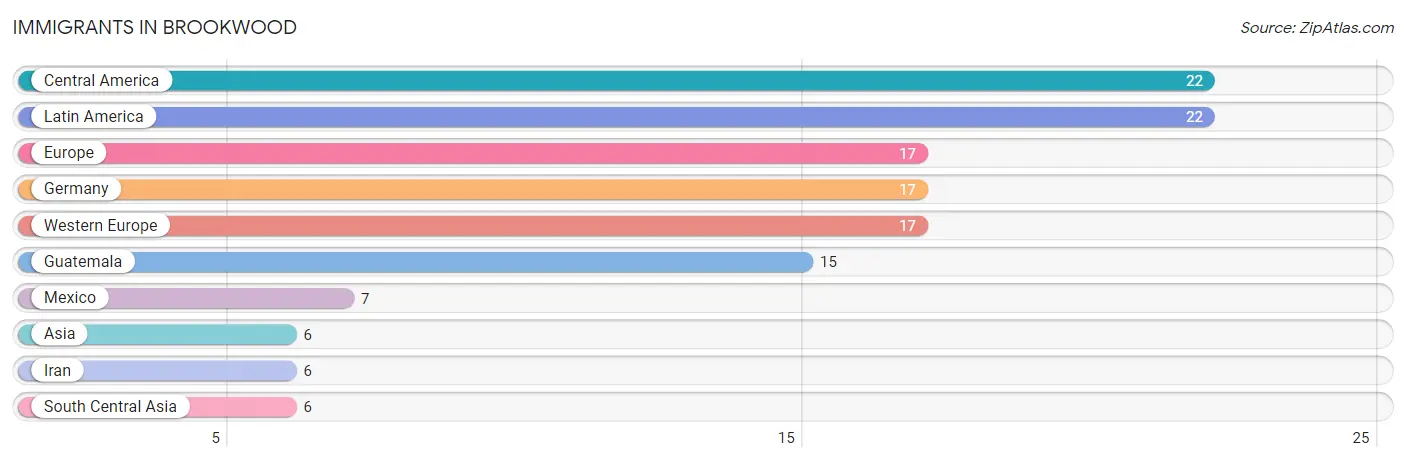
Immigrants in Brookwood
The most numerous immigrant groups reported in Brookwood came from Central America (22 | 0.9%), Latin America (22 | 0.9%), Europe (17 | 0.7%), Germany (17 | 0.7%), and Western Europe (17 | 0.7%), together accounting for 3.9% of all Brookwood residents.
| Immigration Origin | # Population | % Population |
| Asia | 6 | 0.3% |
| Central America | 22 | 0.9% |
| Europe | 17 | 0.7% |
| Germany | 17 | 0.7% |
| Guatemala | 15 | 0.6% |
| Iran | 6 | 0.3% |
| Latin America | 22 | 0.9% |
| Mexico | 7 | 0.3% |
| South Central Asia | 6 | 0.3% |
| Western Europe | 17 | 0.7% | View All 10 Rows |
Sex and Age in Brookwood
Sex and Age in Brookwood
The most populous age groups in Brookwood are 15 to 19 Years (135 | 11.8%) for men and 20 to 24 Years (132 | 10.3%) for women.
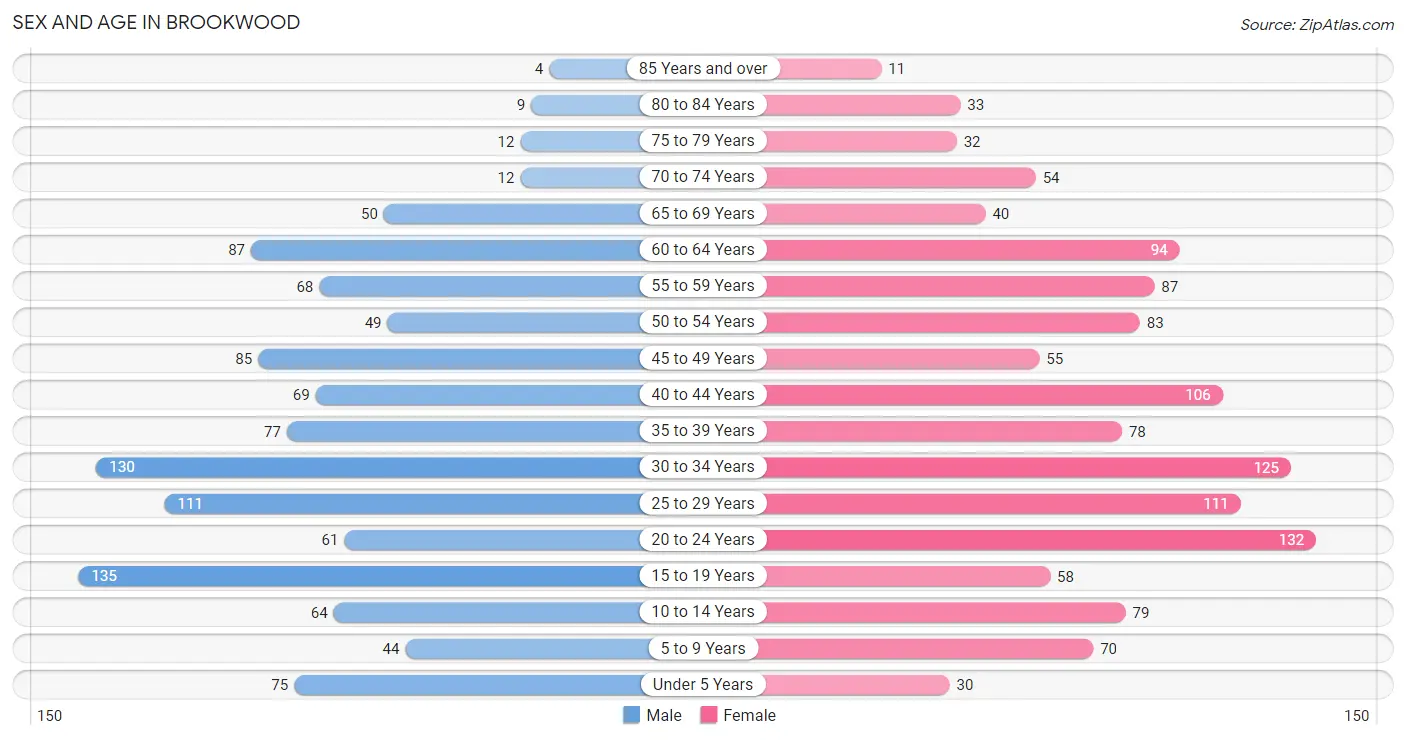
| Age Bracket | Male | Female |
| Under 5 Years | 75 (6.6%) | 30 (2.4%) |
| 5 to 9 Years | 44 (3.8%) | 70 (5.5%) |
| 10 to 14 Years | 64 (5.6%) | 79 (6.2%) |
| 15 to 19 Years | 135 (11.8%) | 58 (4.5%) |
| 20 to 24 Years | 61 (5.3%) | 132 (10.3%) |
| 25 to 29 Years | 111 (9.7%) | 111 (8.7%) |
| 30 to 34 Years | 130 (11.4%) | 125 (9.8%) |
| 35 to 39 Years | 77 (6.7%) | 78 (6.1%) |
| 40 to 44 Years | 69 (6.0%) | 106 (8.3%) |
| 45 to 49 Years | 85 (7.4%) | 55 (4.3%) |
| 50 to 54 Years | 49 (4.3%) | 83 (6.5%) |
| 55 to 59 Years | 68 (5.9%) | 87 (6.8%) |
| 60 to 64 Years | 87 (7.6%) | 94 (7.4%) |
| 65 to 69 Years | 50 (4.4%) | 40 (3.1%) |
| 70 to 74 Years | 12 (1.1%) | 54 (4.2%) |
| 75 to 79 Years | 12 (1.1%) | 32 (2.5%) |
| 80 to 84 Years | 9 (0.8%) | 33 (2.6%) |
| 85 Years and over | 4 (0.4%) | 11 (0.9%) |
| Total | 1,142 (100.0%) | 1,278 (100.0%) |
Families and Households in Brookwood
Median Family Size in Brookwood
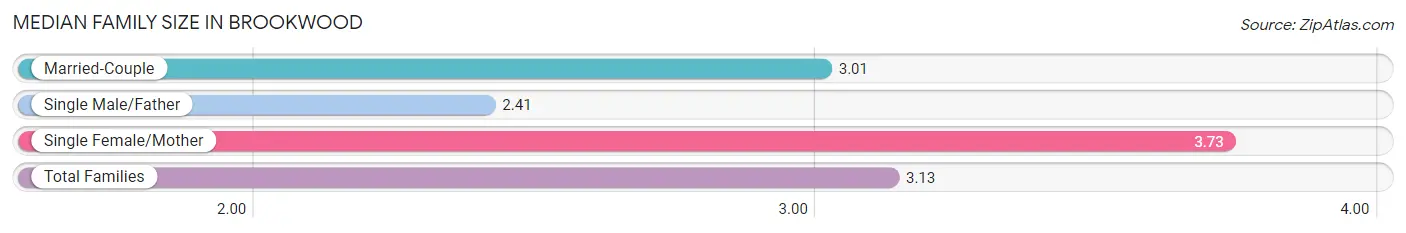
The median family size in Brookwood is 3.13 persons per family, with single female/mother families (124 | 18.0%) accounting for the largest median family size of 3.73 persons per family. On the other hand, single male/father families (17 | 2.5%) represent the smallest median family size with 2.41 persons per family.
| Family Type | # Families | Family Size |
| Married-Couple | 546 (79.5%) | 3.01 |
| Single Male/Father | 17 (2.5%) | 2.41 |
| Single Female/Mother | 124 (18.0%) | 3.73 |
| Total Families | 687 (100.0%) | 3.13 |
Median Household Size in Brookwood
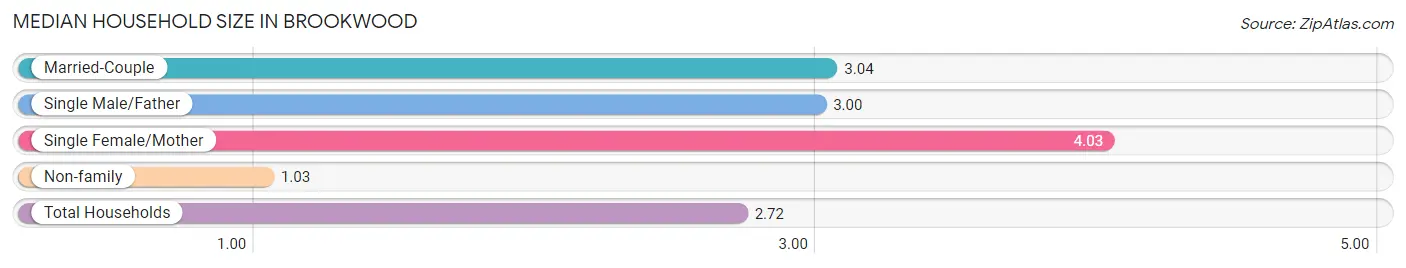
The median household size in Brookwood is 2.72 persons per household, with single female/mother households (124 | 13.9%) accounting for the largest median household size of 4.03 persons per household. non-family households (203 | 22.8%) represent the smallest median household size with 1.03 persons per household.
| Household Type | # Households | Household Size |
| Married-Couple | 546 (61.4%) | 3.04 |
| Single Male/Father | 17 (1.9%) | 3.00 |
| Single Female/Mother | 124 (13.9%) | 4.03 |
| Non-family | 203 (22.8%) | 1.03 |
| Total Households | 890 (100.0%) | 2.72 |
Household Size by Marriage Status in Brookwood
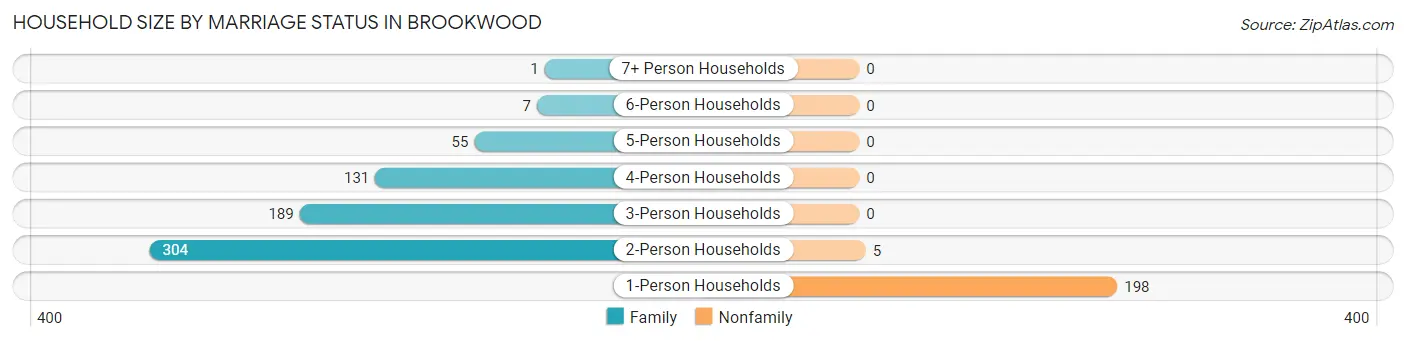
Out of a total of 890 households in Brookwood, 687 (77.2%) are family households, while 203 (22.8%) are nonfamily households. The most numerous type of family households are 2-person households, comprising 304, and the most common type of nonfamily households are 1-person households, comprising 198.
| Household Size | Family Households | Nonfamily Households |
| 1-Person Households | - | 198 (22.3%) |
| 2-Person Households | 304 (34.2%) | 5 (0.6%) |
| 3-Person Households | 189 (21.2%) | 0 (0.0%) |
| 4-Person Households | 131 (14.7%) | 0 (0.0%) |
| 5-Person Households | 55 (6.2%) | 0 (0.0%) |
| 6-Person Households | 7 (0.8%) | 0 (0.0%) |
| 7+ Person Households | 1 (0.1%) | 0 (0.0%) |
| Total | 687 (77.2%) | 203 (22.8%) |
Female Fertility in Brookwood
Fertility by Age in Brookwood
Average fertility rate in Brookwood is 140.0 births per 1,000 women. Women in the age bracket of 20 to 34 years have the highest fertility rate with 223.0 births per 1,000 women. Women in the age bracket of 20 to 34 years acount for 87.2% of all women with births.
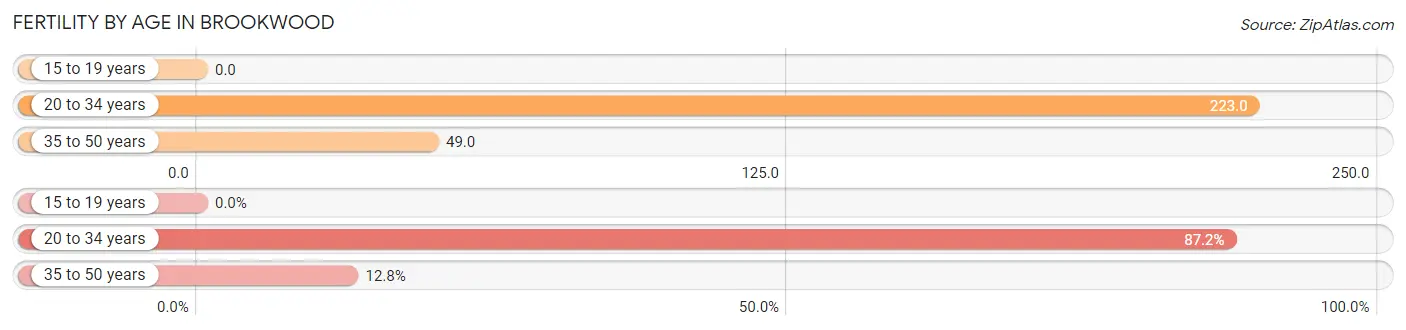
| Age Bracket | Women with Births | Births / 1,000 Women |
| 15 to 19 years | 0 (0.0%) | 0.0 |
| 20 to 34 years | 82 (87.2%) | 223.0 |
| 35 to 50 years | 12 (12.8%) | 49.0 |
| Total | 94 (100.0%) | 140.0 |
Fertility by Age by Marriage Status in Brookwood
48.9% of women with births (94) in Brookwood are married. The highest percentage of unmarried women with births falls into 20 to 34 years age bracket with 58.5% of them unmarried at the time of birth, while the lowest percentage of unmarried women with births belong to 35 to 50 years age bracket with 0.0% of them unmarried.
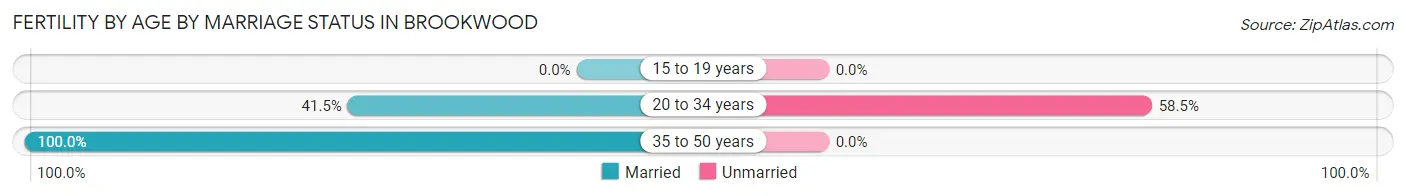
| Age Bracket | Married | Unmarried |
| 15 to 19 years | 0 (0.0%) | 0 (0.0%) |
| 20 to 34 years | 34 (41.5%) | 48 (58.5%) |
| 35 to 50 years | 12 (100.0%) | 0 (0.0%) |
| Total | 46 (48.9%) | 48 (51.1%) |
Fertility by Education in Brookwood
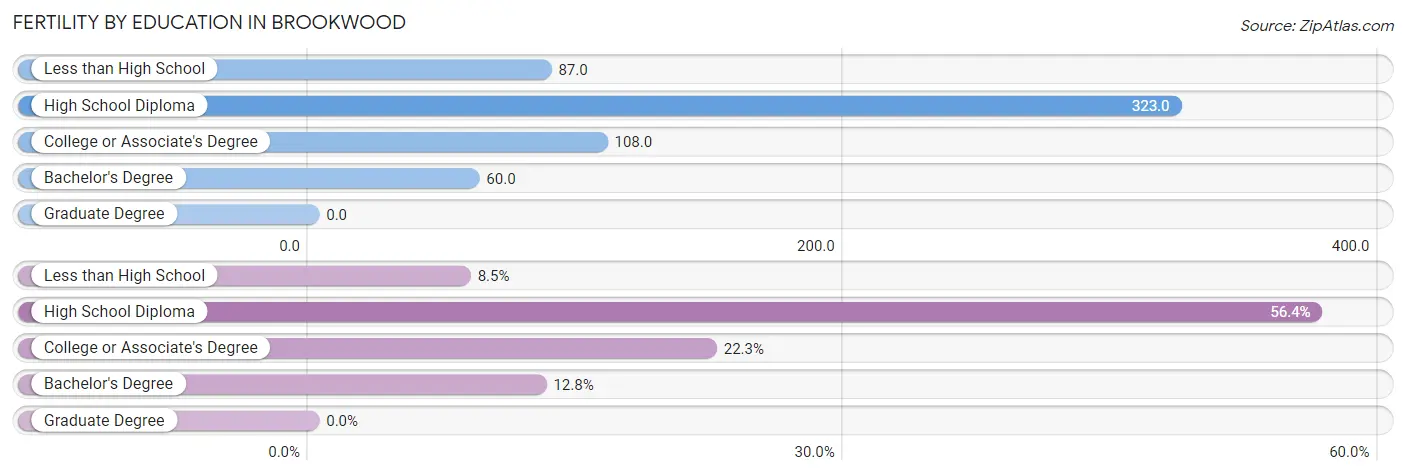
| Educational Attainment | Women with Births | Births / 1,000 Women |
| Less than High School | 8 (8.5%) | 87.0 |
| High School Diploma | 53 (56.4%) | 323.0 |
| College or Associate's Degree | 21 (22.3%) | 108.0 |
| Bachelor's Degree | 12 (12.8%) | 60.0 |
| Graduate Degree | 0 (0.0%) | 0.0 |
| Total | 94 (100.0%) | 140.0 |
Fertility by Education by Marriage Status in Brookwood
51.1% of women with births in Brookwood are unmarried. Women with the educational attainment of less than high school are most likely to be married with 100.0% of them married at childbirth, while women with the educational attainment of high school diploma are least likely to be married with 83.0% of them unmarried at childbirth.
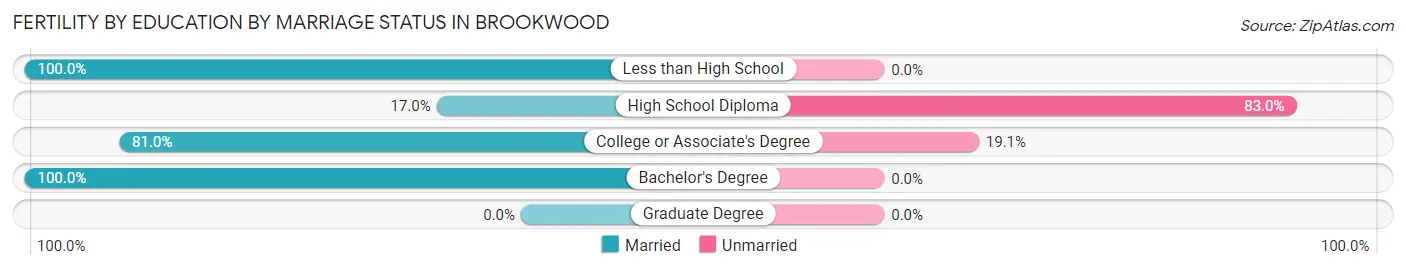
| Educational Attainment | Married | Unmarried |
| Less than High School | 8 (100.0%) | 0 (0.0%) |
| High School Diploma | 9 (17.0%) | 44 (83.0%) |
| College or Associate's Degree | 17 (80.9%) | 4 (19.1%) |
| Bachelor's Degree | 12 (100.0%) | 0 (0.0%) |
| Graduate Degree | 0 (0.0%) | 0 (0.0%) |
| Total | 46 (48.9%) | 48 (51.1%) |
Employment Characteristics in Brookwood
Employment by Class of Employer in Brookwood
Among the 1,348 employed individuals in Brookwood, private company employees (948 | 70.3%), local government employees (149 | 11.1%), and state government employees (64 | 4.8%) make up the most common classes of employment.
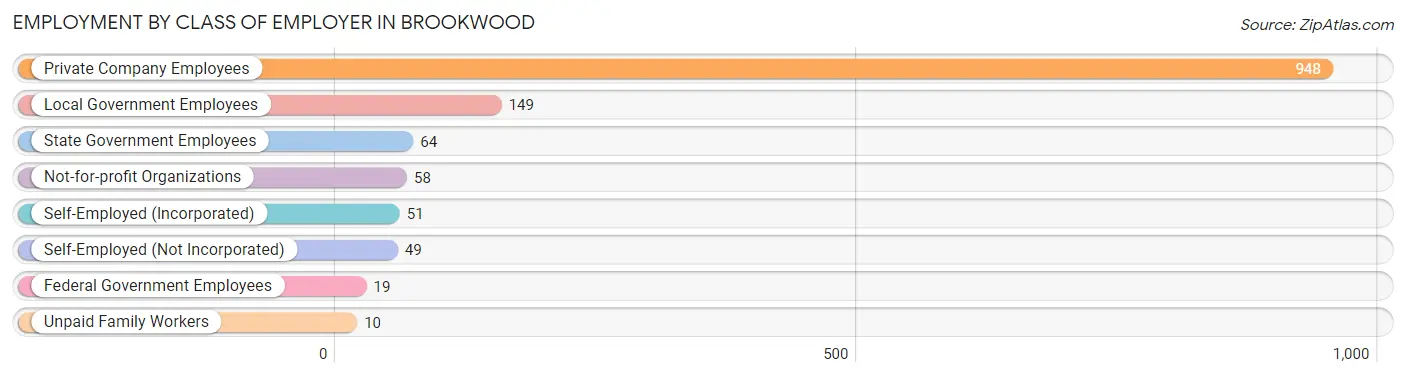
| Employer Class | # Employees | % Employees |
| Private Company Employees | 948 | 70.3% |
| Self-Employed (Incorporated) | 51 | 3.8% |
| Self-Employed (Not Incorporated) | 49 | 3.6% |
| Not-for-profit Organizations | 58 | 4.3% |
| Local Government Employees | 149 | 11.1% |
| State Government Employees | 64 | 4.8% |
| Federal Government Employees | 19 | 1.4% |
| Unpaid Family Workers | 10 | 0.7% |
| Total | 1,348 | 100.0% |
Employment Status by Age in Brookwood
According to the labor force statistics for Brookwood, out of the total population over 16 years of age (2,051), 67.5% or 1,384 individuals are in the labor force, with 1.5% or 21 of them unemployed. The age group with the highest labor force participation rate is 35 to 44 years, with 93.3% or 308 individuals in the labor force. Within the labor force, the 16 to 19 years age range has the highest percentage of unemployed individuals, with 10.4% or 7 of them being unemployed.
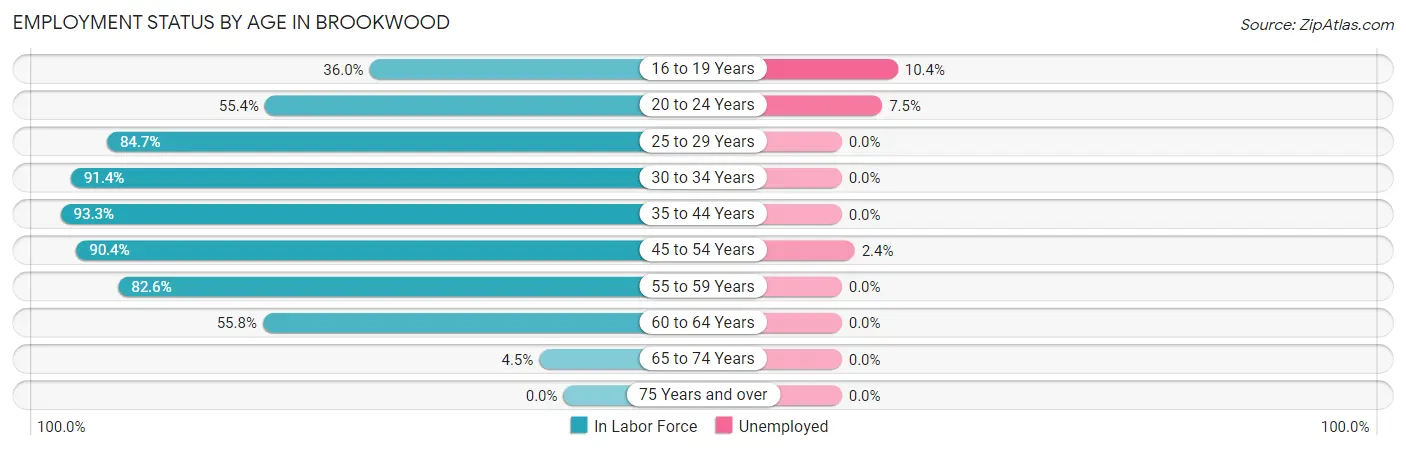
| Age Bracket | In Labor Force | Unemployed |
| 16 to 19 Years | 67 (36.0%) | 7 (10.4%) |
| 20 to 24 Years | 107 (55.4%) | 8 (7.5%) |
| 25 to 29 Years | 188 (84.7%) | 0 (0.0%) |
| 30 to 34 Years | 233 (91.4%) | 0 (0.0%) |
| 35 to 44 Years | 308 (93.3%) | 0 (0.0%) |
| 45 to 54 Years | 246 (90.4%) | 6 (2.4%) |
| 55 to 59 Years | 128 (82.6%) | 0 (0.0%) |
| 60 to 64 Years | 101 (55.8%) | 0 (0.0%) |
| 65 to 74 Years | 7 (4.5%) | 0 (0.0%) |
| 75 Years and over | 0 (0.0%) | 0 (0.0%) |
| Total | 1,384 (67.5%) | 21 (1.5%) |
Employment Status by Educational Attainment in Brookwood
According to labor force statistics for Brookwood, 85.1% of individuals (1,204) out of the total population between 25 and 64 years of age (1,415) are in the labor force, with 0.5% or 6 of them being unemployed. The group with the highest labor force participation rate are those with the educational attainment of bachelor's degree or higher, with 93.6% or 321 individuals in the labor force. Within the labor force, individuals with bachelor's degree or higher education have the highest percentage of unemployment, with 1.9% or 6 of them being unemployed.
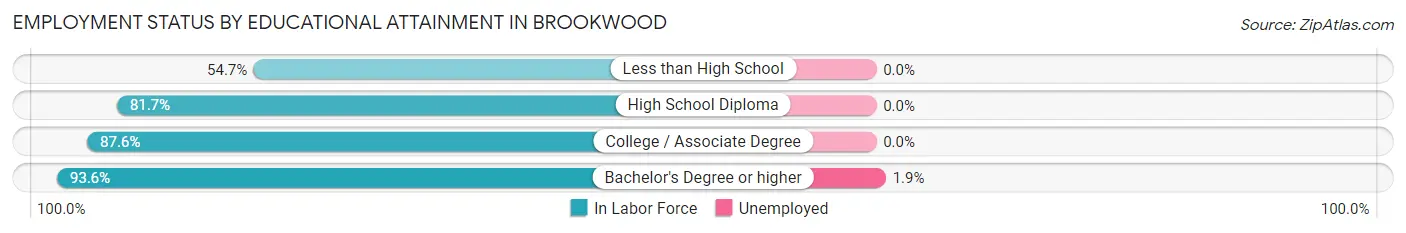
| Educational Attainment | In Labor Force | Unemployed |
| Less than High School | 47 (54.7%) | 0 (0.0%) |
| High School Diploma | 385 (81.7%) | 0 (0.0%) |
| College / Associate Degree | 451 (87.6%) | 0 (0.0%) |
| Bachelor's Degree or higher | 321 (93.6%) | 7 (1.9%) |
| Total | 1,204 (85.1%) | 7 (0.5%) |
Employment Occupations by Sex in Brookwood
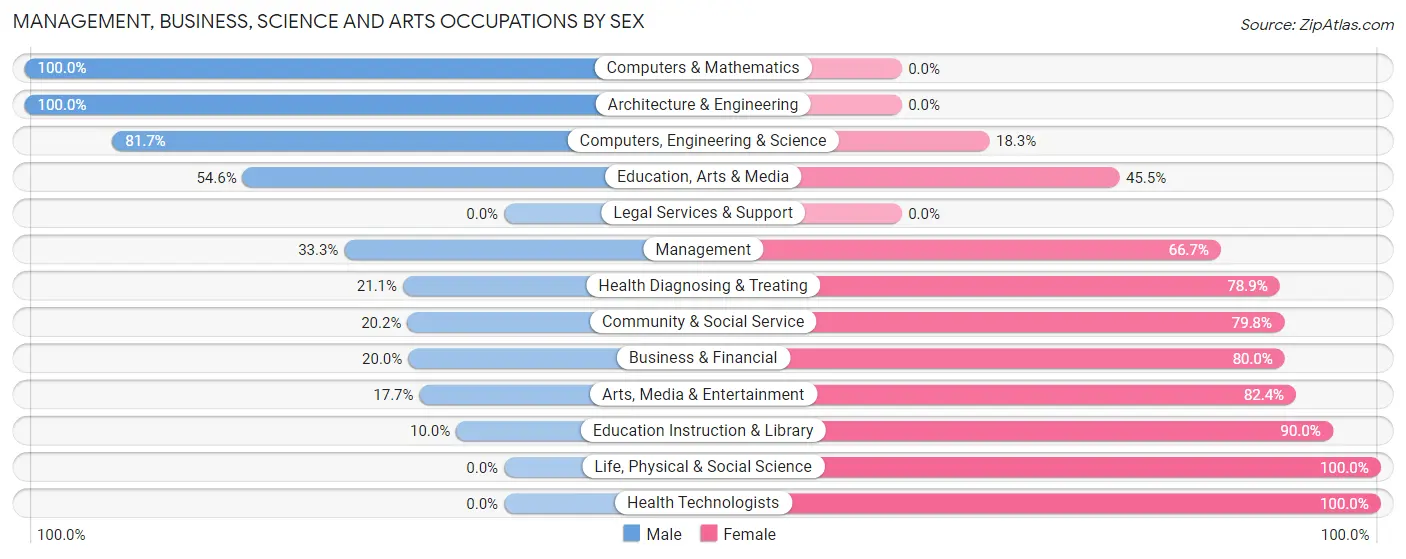
Management, Business, Science and Arts Occupations
The most common Management, Business, Science and Arts occupations in Brookwood are Health Diagnosing & Treating (128 | 9.4%), Community & Social Service (109 | 8.0%), Management (108 | 7.9%), Education Instruction & Library (70 | 5.1%), and Computers, Engineering & Science (60 | 4.4%).
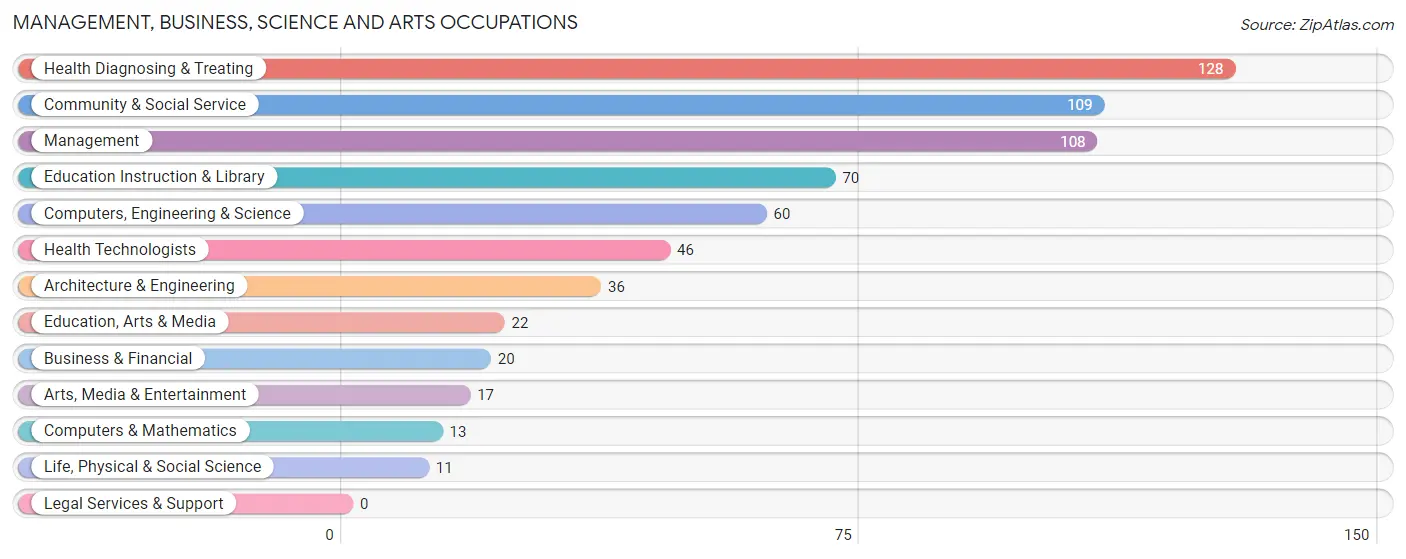
Management, Business, Science and Arts Occupations by Sex
Within the Management, Business, Science and Arts occupations in Brookwood, the most male-oriented occupations are Computers & Mathematics (100.0%), Architecture & Engineering (100.0%), and Computers, Engineering & Science (81.7%), while the most female-oriented occupations are Life, Physical & Social Science (100.0%), Health Technologists (100.0%), and Education Instruction & Library (90.0%).
| Occupation | Male | Female |
| Management | 36 (33.3%) | 72 (66.7%) |
| Business & Financial | 4 (20.0%) | 16 (80.0%) |
| Computers, Engineering & Science | 49 (81.7%) | 11 (18.3%) |
| Computers & Mathematics | 13 (100.0%) | 0 (0.0%) |
| Architecture & Engineering | 36 (100.0%) | 0 (0.0%) |
| Life, Physical & Social Science | 0 (0.0%) | 11 (100.0%) |
| Community & Social Service | 22 (20.2%) | 87 (79.8%) |
| Education, Arts & Media | 12 (54.5%) | 10 (45.5%) |
| Legal Services & Support | 0 (0.0%) | 0 (0.0%) |
| Education Instruction & Library | 7 (10.0%) | 63 (90.0%) |
| Arts, Media & Entertainment | 3 (17.6%) | 14 (82.4%) |
| Health Diagnosing & Treating | 27 (21.1%) | 101 (78.9%) |
| Health Technologists | 0 (0.0%) | 46 (100.0%) |
| Total (Category) | 138 (32.5%) | 287 (67.5%) |
| Total (Overall) | 733 (53.7%) | 631 (46.3%) |
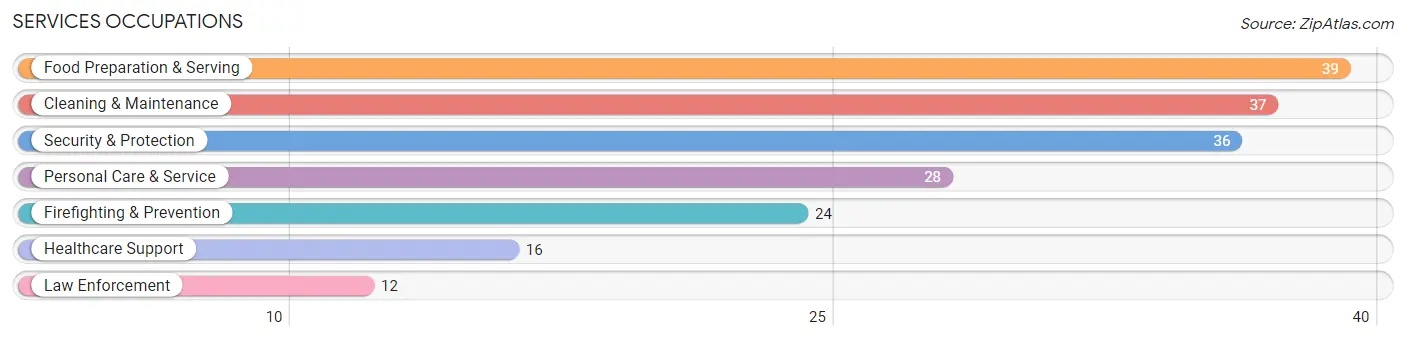
Services Occupations
The most common Services occupations in Brookwood are Food Preparation & Serving (39 | 2.9%), Cleaning & Maintenance (37 | 2.7%), Security & Protection (36 | 2.6%), Personal Care & Service (28 | 2.1%), and Firefighting & Prevention (24 | 1.8%).
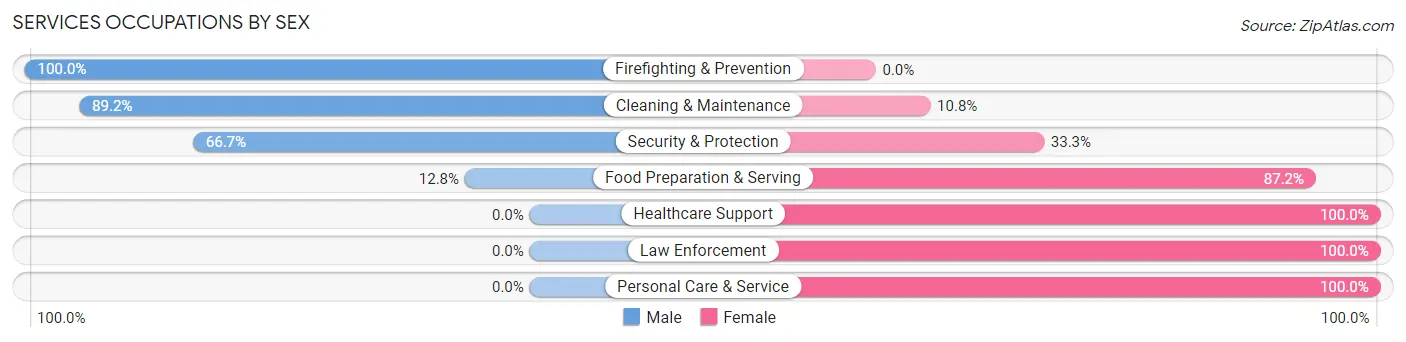
Services Occupations by Sex
Within the Services occupations in Brookwood, the most male-oriented occupations are Firefighting & Prevention (100.0%), Cleaning & Maintenance (89.2%), and Security & Protection (66.7%), while the most female-oriented occupations are Healthcare Support (100.0%), Law Enforcement (100.0%), and Personal Care & Service (100.0%).
| Occupation | Male | Female |
| Healthcare Support | 0 (0.0%) | 16 (100.0%) |
| Security & Protection | 24 (66.7%) | 12 (33.3%) |
| Firefighting & Prevention | 24 (100.0%) | 0 (0.0%) |
| Law Enforcement | 0 (0.0%) | 12 (100.0%) |
| Food Preparation & Serving | 5 (12.8%) | 34 (87.2%) |
| Cleaning & Maintenance | 33 (89.2%) | 4 (10.8%) |
| Personal Care & Service | 0 (0.0%) | 28 (100.0%) |
| Total (Category) | 62 (39.7%) | 94 (60.3%) |
| Total (Overall) | 733 (53.7%) | 631 (46.3%) |
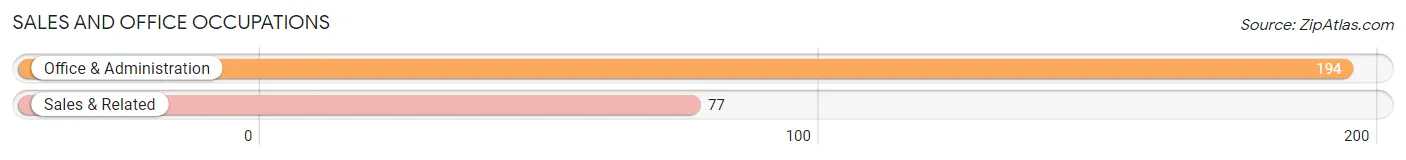
Sales and Office Occupations
The most common Sales and Office occupations in Brookwood are Office & Administration (194 | 14.2%), and Sales & Related (77 | 5.7%).
Sales and Office Occupations by Sex
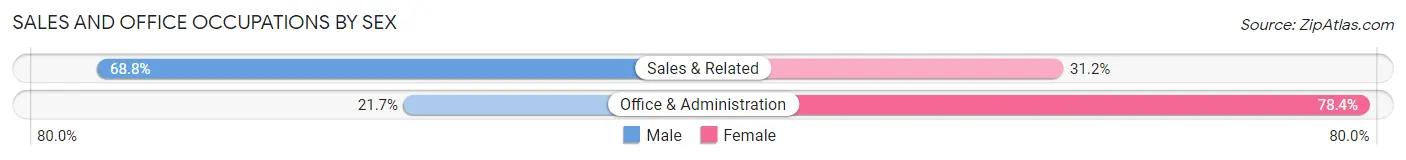
| Occupation | Male | Female |
| Sales & Related | 53 (68.8%) | 24 (31.2%) |
| Office & Administration | 42 (21.6%) | 152 (78.3%) |
| Total (Category) | 95 (35.1%) | 176 (64.9%) |
| Total (Overall) | 733 (53.7%) | 631 (46.3%) |
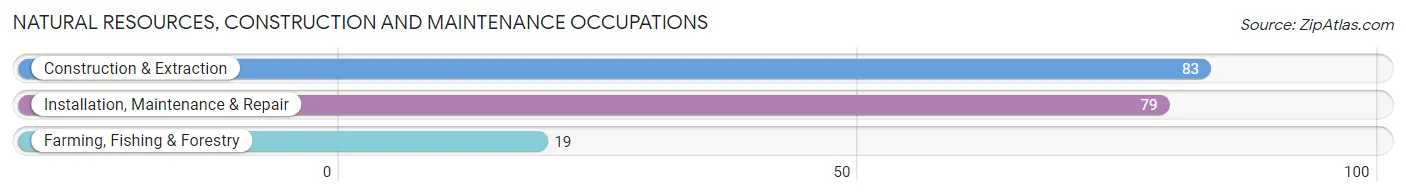
Natural Resources, Construction and Maintenance Occupations
The most common Natural Resources, Construction and Maintenance occupations in Brookwood are Construction & Extraction (83 | 6.1%), Installation, Maintenance & Repair (79 | 5.8%), and Farming, Fishing & Forestry (19 | 1.4%).
Natural Resources, Construction and Maintenance Occupations by Sex
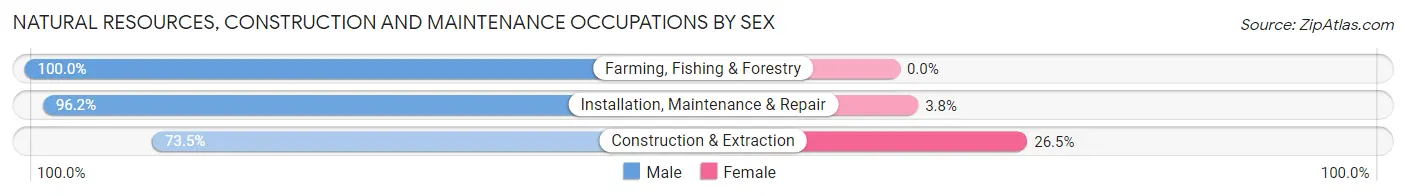
| Occupation | Male | Female |
| Farming, Fishing & Forestry | 19 (100.0%) | 0 (0.0%) |
| Construction & Extraction | 61 (73.5%) | 22 (26.5%) |
| Installation, Maintenance & Repair | 76 (96.2%) | 3 (3.8%) |
| Total (Category) | 156 (86.2%) | 25 (13.8%) |
| Total (Overall) | 733 (53.7%) | 631 (46.3%) |
Production, Transportation and Moving Occupations
The most common Production, Transportation and Moving occupations in Brookwood are Production (178 | 13.1%), Material Moving (131 | 9.6%), and Transportation (22 | 1.6%).
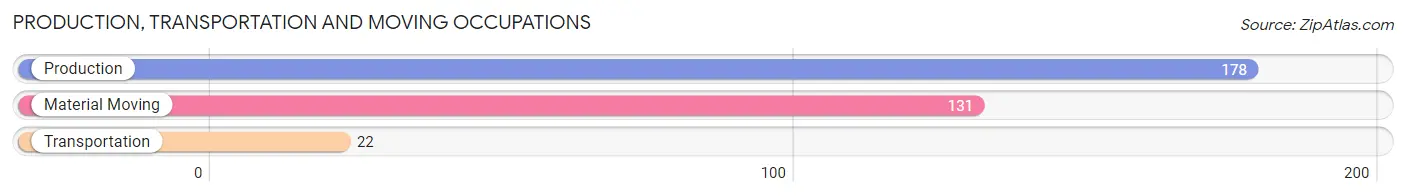
Production, Transportation and Moving Occupations by Sex
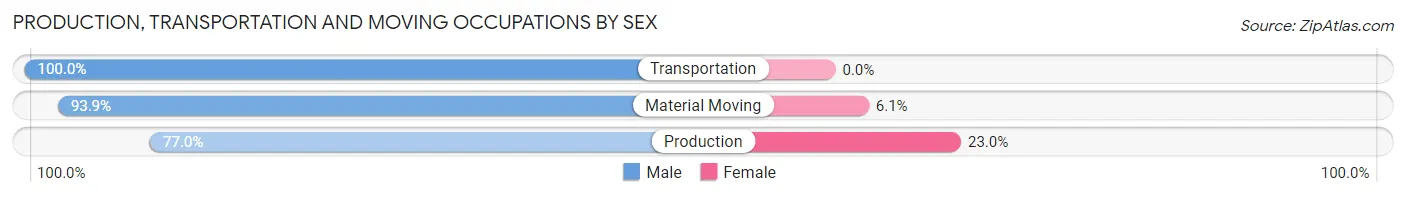
| Occupation | Male | Female |
| Production | 137 (77.0%) | 41 (23.0%) |
| Transportation | 22 (100.0%) | 0 (0.0%) |
| Material Moving | 123 (93.9%) | 8 (6.1%) |
| Total (Category) | 282 (85.2%) | 49 (14.8%) |
| Total (Overall) | 733 (53.7%) | 631 (46.3%) |
Employment Industries by Sex in Brookwood
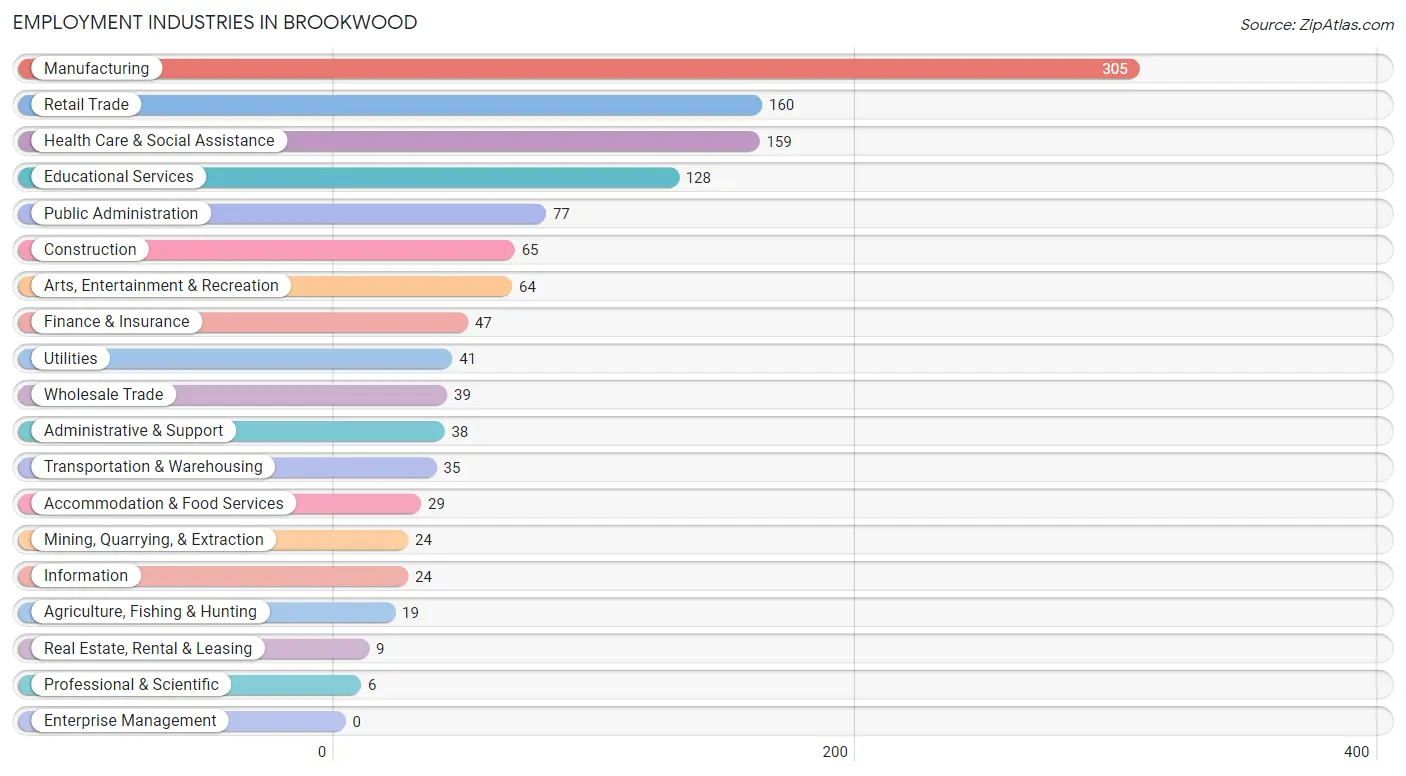
Employment Industries in Brookwood
The major employment industries in Brookwood include Manufacturing (305 | 22.4%), Retail Trade (160 | 11.7%), Health Care & Social Assistance (159 | 11.7%), Educational Services (128 | 9.4%), and Public Administration (77 | 5.7%).
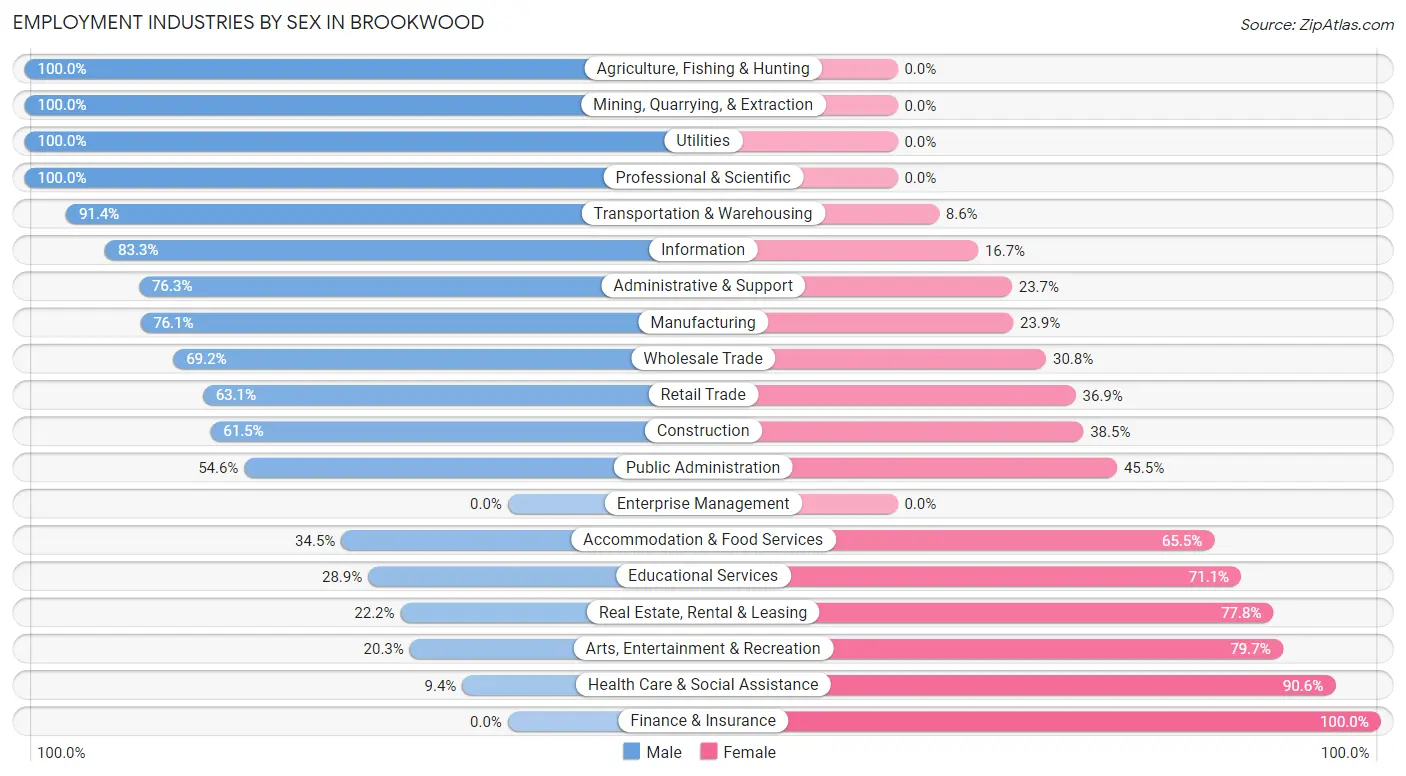
Employment Industries by Sex in Brookwood
The Brookwood industries that see more men than women are Agriculture, Fishing & Hunting (100.0%), Mining, Quarrying, & Extraction (100.0%), and Utilities (100.0%), whereas the industries that tend to have a higher number of women are Finance & Insurance (100.0%), Health Care & Social Assistance (90.6%), and Arts, Entertainment & Recreation (79.7%).
| Industry | Male | Female |
| Agriculture, Fishing & Hunting | 19 (100.0%) | 0 (0.0%) |
| Mining, Quarrying, & Extraction | 24 (100.0%) | 0 (0.0%) |
| Construction | 40 (61.5%) | 25 (38.5%) |
| Manufacturing | 232 (76.1%) | 73 (23.9%) |
| Wholesale Trade | 27 (69.2%) | 12 (30.8%) |
| Retail Trade | 101 (63.1%) | 59 (36.9%) |
| Transportation & Warehousing | 32 (91.4%) | 3 (8.6%) |
| Utilities | 41 (100.0%) | 0 (0.0%) |
| Information | 20 (83.3%) | 4 (16.7%) |
| Finance & Insurance | 0 (0.0%) | 47 (100.0%) |
| Real Estate, Rental & Leasing | 2 (22.2%) | 7 (77.8%) |
| Professional & Scientific | 6 (100.0%) | 0 (0.0%) |
| Enterprise Management | 0 (0.0%) | 0 (0.0%) |
| Administrative & Support | 29 (76.3%) | 9 (23.7%) |
| Educational Services | 37 (28.9%) | 91 (71.1%) |
| Health Care & Social Assistance | 15 (9.4%) | 144 (90.6%) |
| Arts, Entertainment & Recreation | 13 (20.3%) | 51 (79.7%) |
| Accommodation & Food Services | 10 (34.5%) | 19 (65.5%) |
| Public Administration | 42 (54.5%) | 35 (45.5%) |
| Total | 733 (53.7%) | 631 (46.3%) |
Education in Brookwood
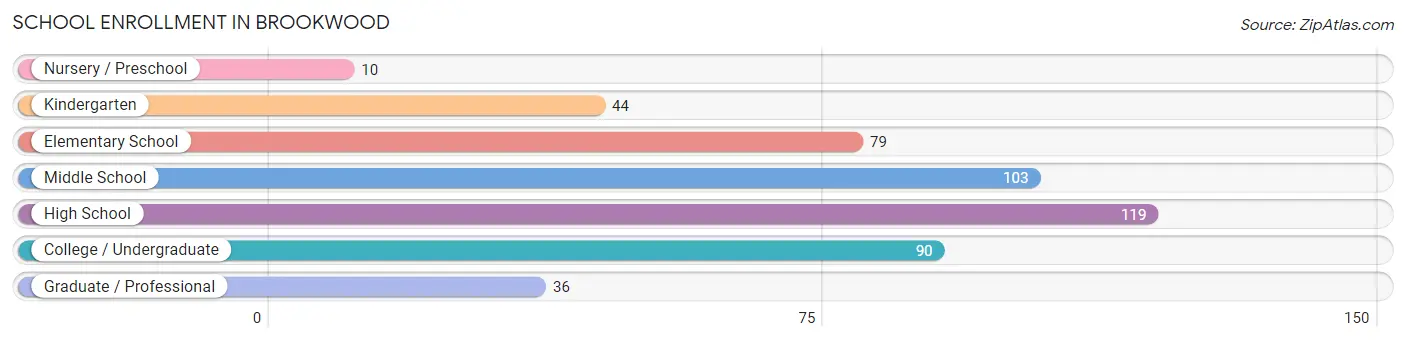
School Enrollment in Brookwood
The most common levels of schooling among the 481 students in Brookwood are high school (119 | 24.7%), middle school (103 | 21.4%), and college / undergraduate (90 | 18.7%).
| School Level | # Students | % Students |
| Nursery / Preschool | 10 | 2.1% |
| Kindergarten | 44 | 9.1% |
| Elementary School | 79 | 16.4% |
| Middle School | 103 | 21.4% |
| High School | 119 | 24.7% |
| College / Undergraduate | 90 | 18.7% |
| Graduate / Professional | 36 | 7.5% |
| Total | 481 | 100.0% |
School Enrollment by Age by Funding Source in Brookwood
Out of a total of 481 students who are enrolled in schools in Brookwood, 58 (12.1%) attend a private institution, while the remaining 423 (87.9%) are enrolled in public schools. The age group of 35 years and over has the highest likelihood of being enrolled in private schools, with 5 (55.6% in the age bracket) enrolled. Conversely, the age group of 15 to 17 year olds has the lowest likelihood of being enrolled in a private school, with 69 (100.0% in the age bracket) attending a public institution.
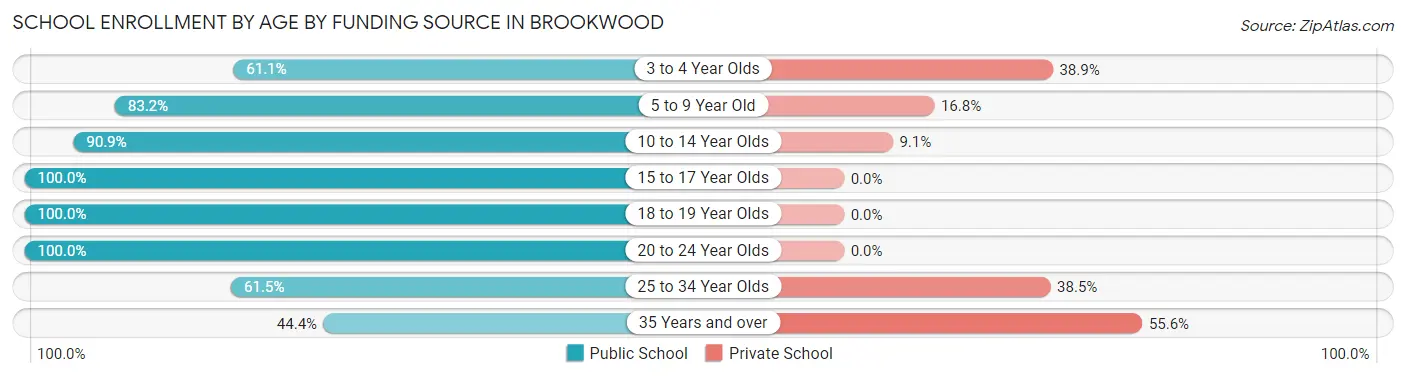
| Age Bracket | Public School | Private School |
| 3 to 4 Year Olds | 11 (61.1%) | 7 (38.9%) |
| 5 to 9 Year Old | 89 (83.2%) | 18 (16.8%) |
| 10 to 14 Year Olds | 130 (90.9%) | 13 (9.1%) |
| 15 to 17 Year Olds | 69 (100.0%) | 0 (0.0%) |
| 18 to 19 Year Olds | 59 (100.0%) | 0 (0.0%) |
| 20 to 24 Year Olds | 37 (100.0%) | 0 (0.0%) |
| 25 to 34 Year Olds | 24 (61.5%) | 15 (38.5%) |
| 35 Years and over | 4 (44.4%) | 5 (55.6%) |
| Total | 423 (87.9%) | 58 (12.1%) |
Educational Attainment by Field of Study in Brookwood
Business (77 | 18.9%), liberal arts & history (58 | 14.2%), arts & humanities (57 | 14.0%), education (53 | 13.0%), and bio, nature & agricultural (34 | 8.4%) are the most common fields of study among 407 individuals in Brookwood who have obtained a bachelor's degree or higher.
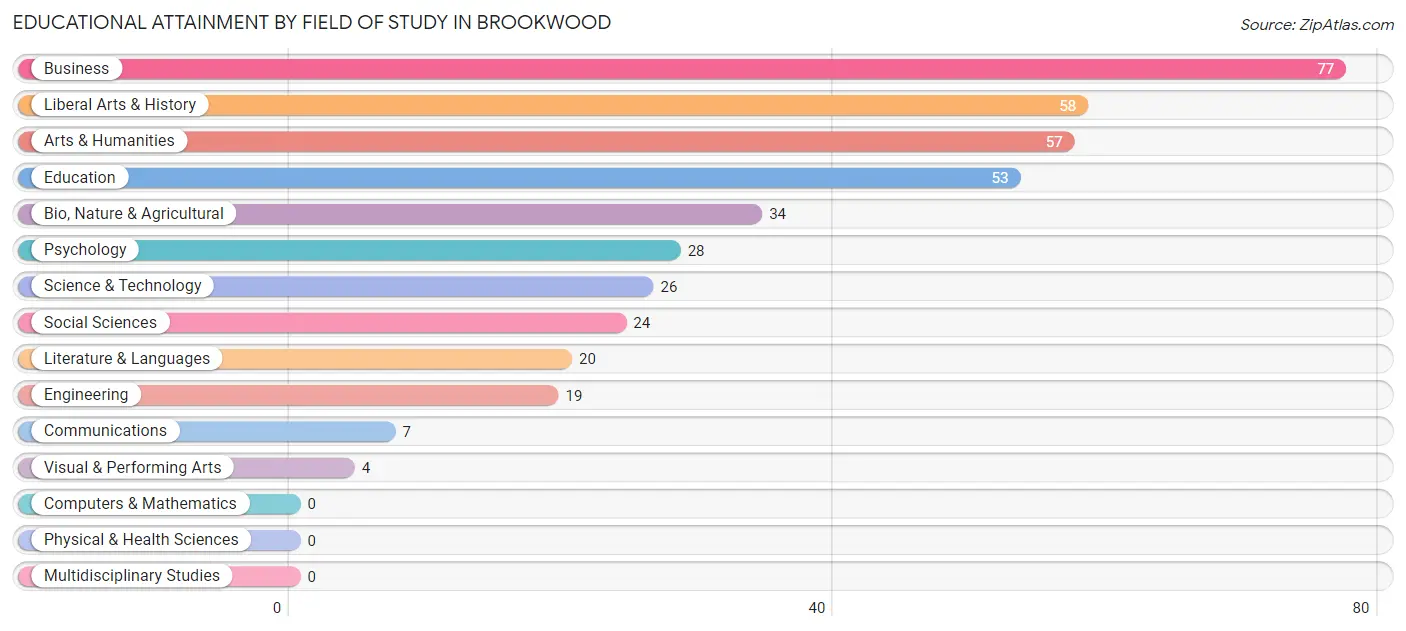
| Field of Study | # Graduates | % Graduates |
| Computers & Mathematics | 0 | 0.0% |
| Bio, Nature & Agricultural | 34 | 8.4% |
| Physical & Health Sciences | 0 | 0.0% |
| Psychology | 28 | 6.9% |
| Social Sciences | 24 | 5.9% |
| Engineering | 19 | 4.7% |
| Multidisciplinary Studies | 0 | 0.0% |
| Science & Technology | 26 | 6.4% |
| Business | 77 | 18.9% |
| Education | 53 | 13.0% |
| Literature & Languages | 20 | 4.9% |
| Liberal Arts & History | 58 | 14.2% |
| Visual & Performing Arts | 4 | 1.0% |
| Communications | 7 | 1.7% |
| Arts & Humanities | 57 | 14.0% |
| Total | 407 | 100.0% |
Transportation & Commute in Brookwood
Vehicle Availability by Sex in Brookwood
The most prevalent vehicle ownership categories in Brookwood are males with 2 vehicles (247, accounting for 34.4%) and females with 2 vehicles (234, making up 39.2%).
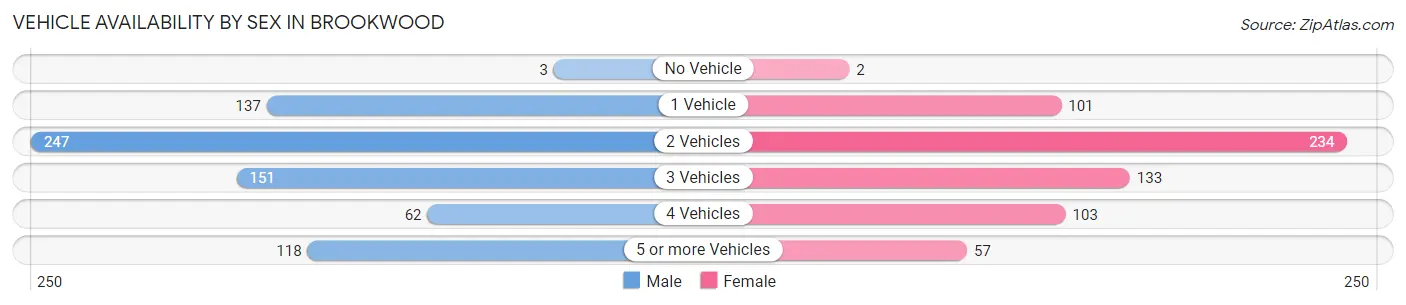
| Vehicles Available | Male | Female |
| No Vehicle | 3 (0.4%) | 2 (0.3%) |
| 1 Vehicle | 137 (19.1%) | 101 (16.0%) |
| 2 Vehicles | 247 (34.4%) | 234 (37.1%) |
| 3 Vehicles | 151 (21.0%) | 133 (21.1%) |
| 4 Vehicles | 62 (8.6%) | 103 (16.4%) |
| 5 or more Vehicles | 118 (16.4%) | 57 (9.0%) |
| Total | 718 (100.0%) | 630 (100.0%) |
Commute Time in Brookwood
The most frequently occuring commute durations in Brookwood are 30 to 34 minutes (312 commuters, 23.8%), 20 to 24 minutes (240 commuters, 18.3%), and 5 to 9 minutes (134 commuters, 10.2%).
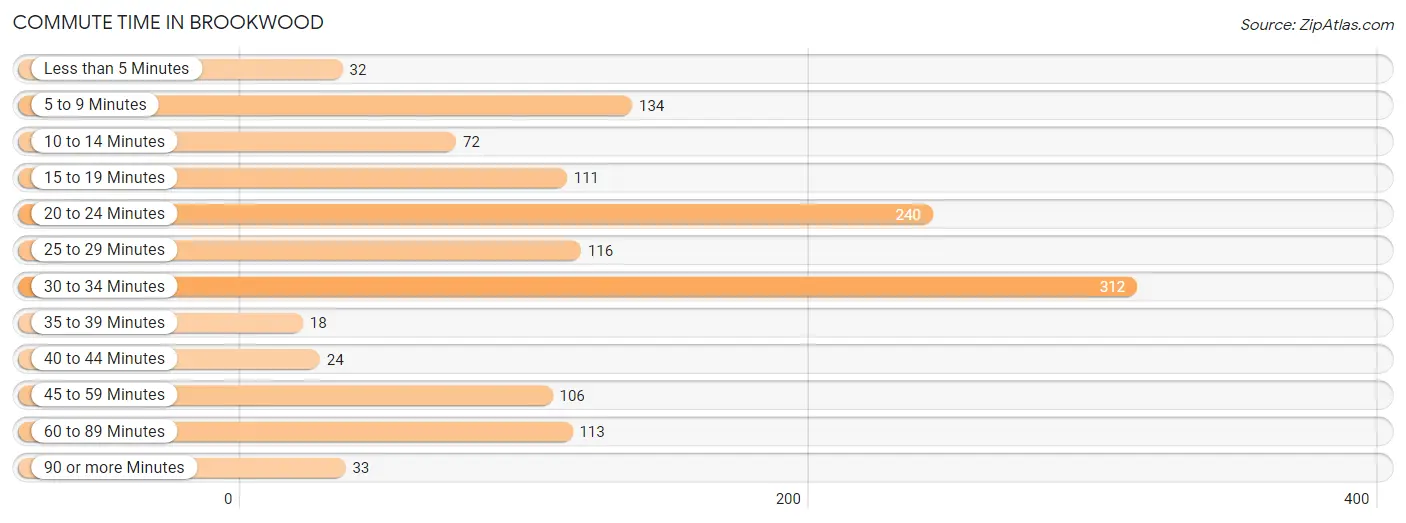
| Commute Time | # Commuters | % Commuters |
| Less than 5 Minutes | 32 | 2.4% |
| 5 to 9 Minutes | 134 | 10.2% |
| 10 to 14 Minutes | 72 | 5.5% |
| 15 to 19 Minutes | 111 | 8.5% |
| 20 to 24 Minutes | 240 | 18.3% |
| 25 to 29 Minutes | 116 | 8.8% |
| 30 to 34 Minutes | 312 | 23.8% |
| 35 to 39 Minutes | 18 | 1.4% |
| 40 to 44 Minutes | 24 | 1.8% |
| 45 to 59 Minutes | 106 | 8.1% |
| 60 to 89 Minutes | 113 | 8.6% |
| 90 or more Minutes | 33 | 2.5% |
Commute Time by Sex in Brookwood
The most common commute times in Brookwood are 20 to 24 minutes (168 commuters, 24.3%) for males and 30 to 34 minutes (185 commuters, 29.8%) for females.
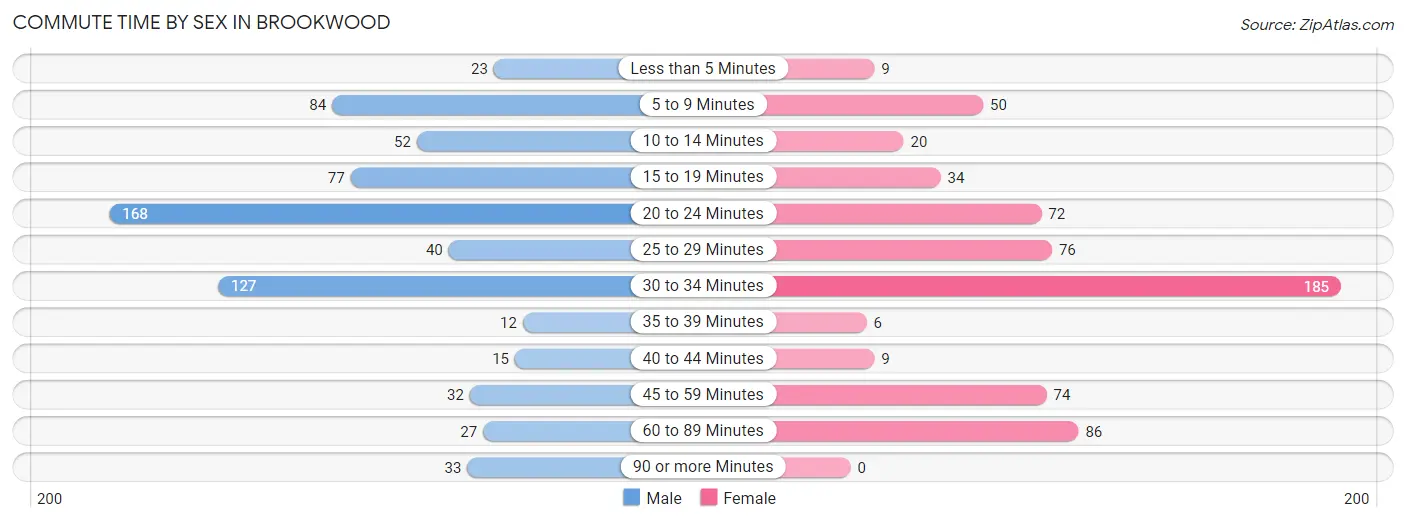
| Commute Time | Male | Female |
| Less than 5 Minutes | 23 (3.3%) | 9 (1.5%) |
| 5 to 9 Minutes | 84 (12.2%) | 50 (8.1%) |
| 10 to 14 Minutes | 52 (7.5%) | 20 (3.2%) |
| 15 to 19 Minutes | 77 (11.2%) | 34 (5.5%) |
| 20 to 24 Minutes | 168 (24.3%) | 72 (11.6%) |
| 25 to 29 Minutes | 40 (5.8%) | 76 (12.2%) |
| 30 to 34 Minutes | 127 (18.4%) | 185 (29.8%) |
| 35 to 39 Minutes | 12 (1.7%) | 6 (1.0%) |
| 40 to 44 Minutes | 15 (2.2%) | 9 (1.5%) |
| 45 to 59 Minutes | 32 (4.6%) | 74 (11.9%) |
| 60 to 89 Minutes | 27 (3.9%) | 86 (13.9%) |
| 90 or more Minutes | 33 (4.8%) | 0 (0.0%) |
Time of Departure to Work by Sex in Brookwood
The most frequent times of departure to work in Brookwood are 4:00 PM to 11:59 PM (180, 26.1%) for males and 7:30 AM to 7:59 AM (125, 20.1%) for females.
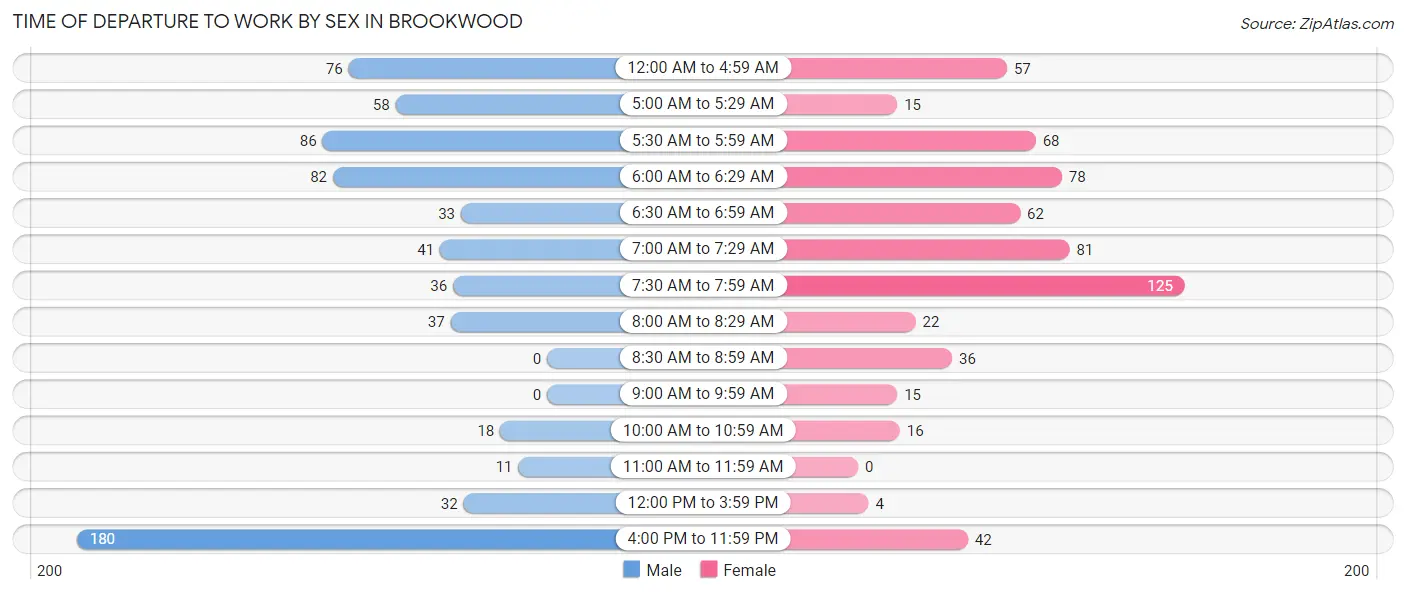
| Time of Departure | Male | Female |
| 12:00 AM to 4:59 AM | 76 (11.0%) | 57 (9.2%) |
| 5:00 AM to 5:29 AM | 58 (8.4%) | 15 (2.4%) |
| 5:30 AM to 5:59 AM | 86 (12.5%) | 68 (11.0%) |
| 6:00 AM to 6:29 AM | 82 (11.9%) | 78 (12.6%) |
| 6:30 AM to 6:59 AM | 33 (4.8%) | 62 (10.0%) |
| 7:00 AM to 7:29 AM | 41 (5.9%) | 81 (13.0%) |
| 7:30 AM to 7:59 AM | 36 (5.2%) | 125 (20.1%) |
| 8:00 AM to 8:29 AM | 37 (5.4%) | 22 (3.5%) |
| 8:30 AM to 8:59 AM | 0 (0.0%) | 36 (5.8%) |
| 9:00 AM to 9:59 AM | 0 (0.0%) | 15 (2.4%) |
| 10:00 AM to 10:59 AM | 18 (2.6%) | 16 (2.6%) |
| 11:00 AM to 11:59 AM | 11 (1.6%) | 0 (0.0%) |
| 12:00 PM to 3:59 PM | 32 (4.6%) | 4 (0.6%) |
| 4:00 PM to 11:59 PM | 180 (26.1%) | 42 (6.8%) |
| Total | 690 (100.0%) | 621 (100.0%) |
Housing Occupancy in Brookwood
Occupancy by Ownership in Brookwood
Of the total 890 dwellings in Brookwood, owner-occupied units account for 760 (85.4%), while renter-occupied units make up 130 (14.6%).
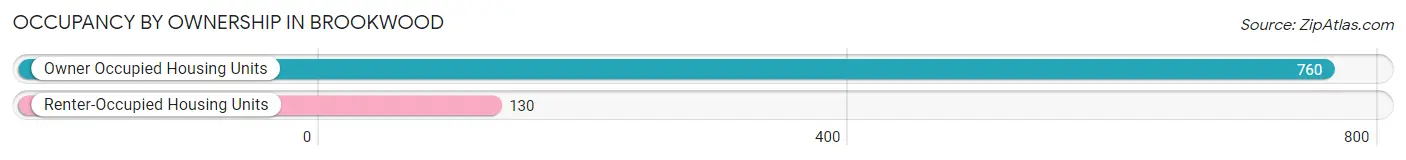
| Occupancy | # Housing Units | % Housing Units |
| Owner Occupied Housing Units | 760 | 85.4% |
| Renter-Occupied Housing Units | 130 | 14.6% |
| Total Occupied Housing Units | 890 | 100.0% |
Occupancy by Household Size in Brookwood
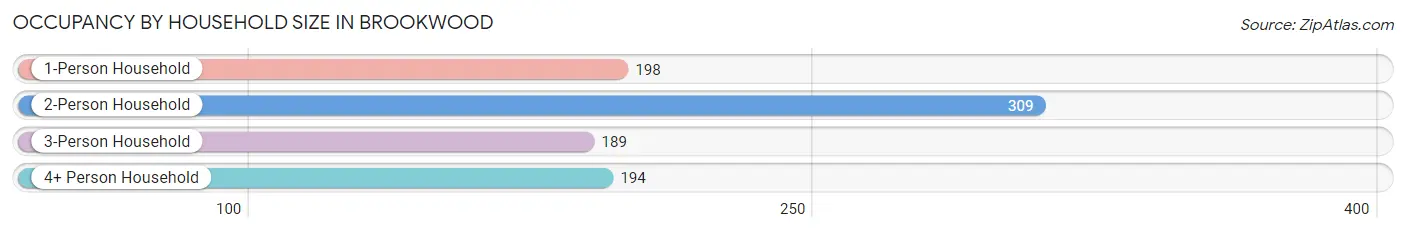
| Household Size | # Housing Units | % Housing Units |
| 1-Person Household | 198 | 22.3% |
| 2-Person Household | 309 | 34.7% |
| 3-Person Household | 189 | 21.2% |
| 4+ Person Household | 194 | 21.8% |
| Total Housing Units | 890 | 100.0% |
Occupancy by Ownership by Household Size in Brookwood
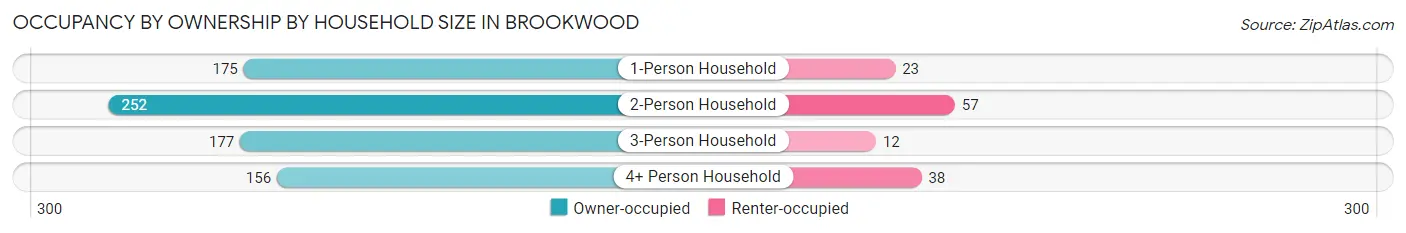
| Household Size | Owner-occupied | Renter-occupied |
| 1-Person Household | 175 (88.4%) | 23 (11.6%) |
| 2-Person Household | 252 (81.6%) | 57 (18.4%) |
| 3-Person Household | 177 (93.6%) | 12 (6.4%) |
| 4+ Person Household | 156 (80.4%) | 38 (19.6%) |
| Total Housing Units | 760 (85.4%) | 130 (14.6%) |
Occupancy by Educational Attainment in Brookwood
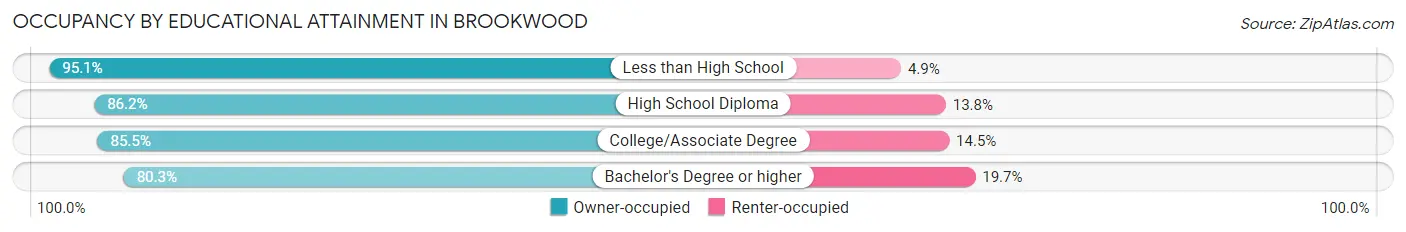
| Household Size | Owner-occupied | Renter-occupied |
| Less than High School | 58 (95.1%) | 3 (4.9%) |
| High School Diploma | 287 (86.2%) | 46 (13.8%) |
| College/Associate Degree | 272 (85.5%) | 46 (14.5%) |
| Bachelor's Degree or higher | 143 (80.3%) | 35 (19.7%) |
Occupancy by Age of Householder in Brookwood
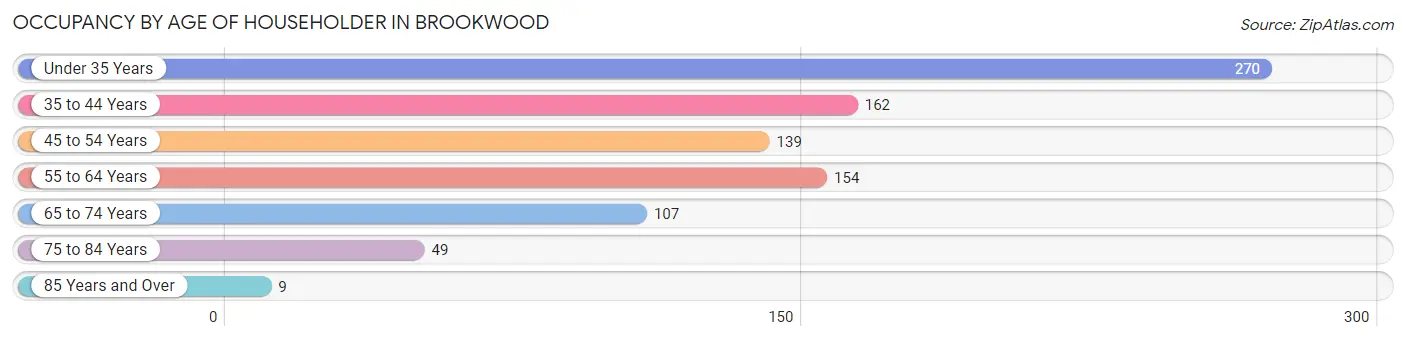
| Age Bracket | # Households | % Households |
| Under 35 Years | 270 | 30.3% |
| 35 to 44 Years | 162 | 18.2% |
| 45 to 54 Years | 139 | 15.6% |
| 55 to 64 Years | 154 | 17.3% |
| 65 to 74 Years | 107 | 12.0% |
| 75 to 84 Years | 49 | 5.5% |
| 85 Years and Over | 9 | 1.0% |
| Total | 890 | 100.0% |
Housing Finances in Brookwood
Median Income by Occupancy in Brookwood
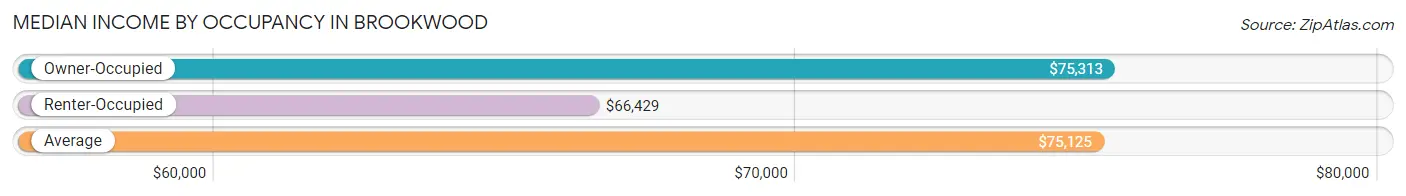
| Occupancy Type | # Households | Median Income |
| Owner-Occupied | 760 (85.4%) | $75,313 |
| Renter-Occupied | 130 (14.6%) | $66,429 |
| Average | 890 (100.0%) | $75,125 |
Occupancy by Householder Income Bracket in Brookwood
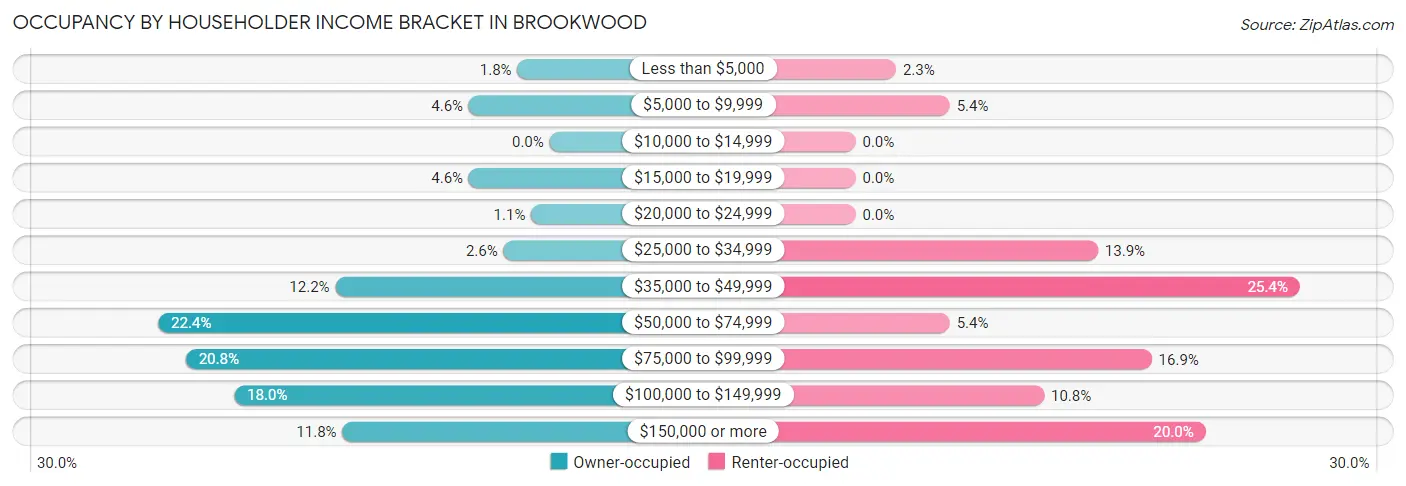
| Income Bracket | Owner-occupied | Renter-occupied |
| Less than $5,000 | 14 (1.8%) | 3 (2.3%) |
| $5,000 to $9,999 | 35 (4.6%) | 7 (5.4%) |
| $10,000 to $14,999 | 0 (0.0%) | 0 (0.0%) |
| $15,000 to $19,999 | 35 (4.6%) | 0 (0.0%) |
| $20,000 to $24,999 | 8 (1.1%) | 0 (0.0%) |
| $25,000 to $34,999 | 20 (2.6%) | 18 (13.9%) |
| $35,000 to $49,999 | 93 (12.2%) | 33 (25.4%) |
| $50,000 to $74,999 | 170 (22.4%) | 7 (5.4%) |
| $75,000 to $99,999 | 158 (20.8%) | 22 (16.9%) |
| $100,000 to $149,999 | 137 (18.0%) | 14 (10.8%) |
| $150,000 or more | 90 (11.8%) | 26 (20.0%) |
| Total | 760 (100.0%) | 130 (100.0%) |
Monthly Housing Cost Tiers in Brookwood
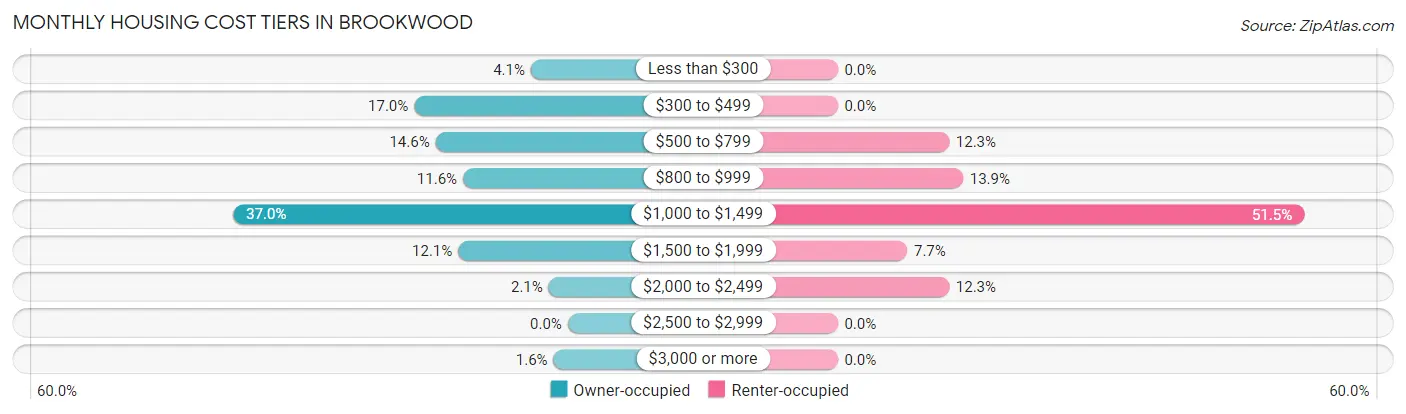
| Monthly Cost | Owner-occupied | Renter-occupied |
| Less than $300 | 31 (4.1%) | 0 (0.0%) |
| $300 to $499 | 129 (17.0%) | 0 (0.0%) |
| $500 to $799 | 111 (14.6%) | 16 (12.3%) |
| $800 to $999 | 88 (11.6%) | 18 (13.9%) |
| $1,000 to $1,499 | 281 (37.0%) | 67 (51.5%) |
| $1,500 to $1,999 | 92 (12.1%) | 10 (7.7%) |
| $2,000 to $2,499 | 16 (2.1%) | 16 (12.3%) |
| $2,500 to $2,999 | 0 (0.0%) | 0 (0.0%) |
| $3,000 or more | 12 (1.6%) | 0 (0.0%) |
| Total | 760 (100.0%) | 130 (100.0%) |
Physical Housing Characteristics in Brookwood
Housing Structures in Brookwood
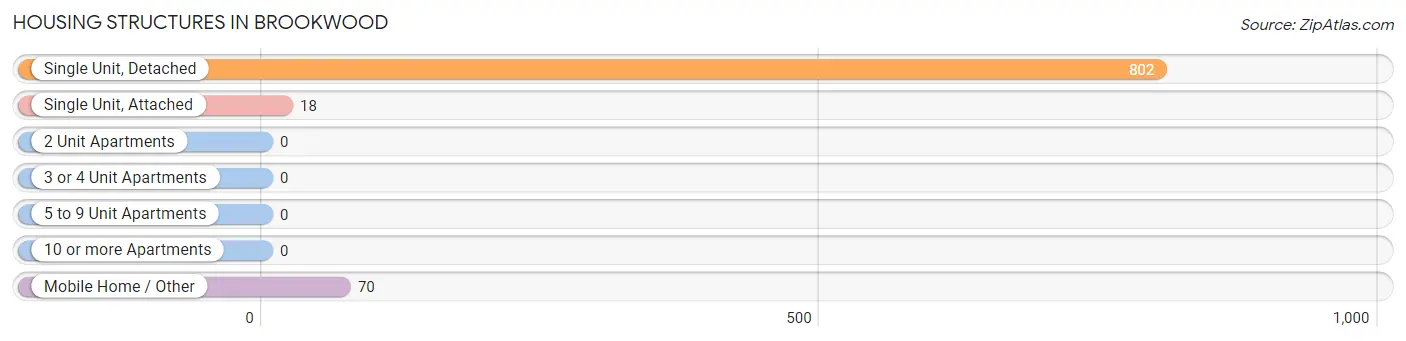
| Structure Type | # Housing Units | % Housing Units |
| Single Unit, Detached | 802 | 90.1% |
| Single Unit, Attached | 18 | 2.0% |
| 2 Unit Apartments | 0 | 0.0% |
| 3 or 4 Unit Apartments | 0 | 0.0% |
| 5 to 9 Unit Apartments | 0 | 0.0% |
| 10 or more Apartments | 0 | 0.0% |
| Mobile Home / Other | 70 | 7.9% |
| Total | 890 | 100.0% |
Housing Structures by Occupancy in Brookwood
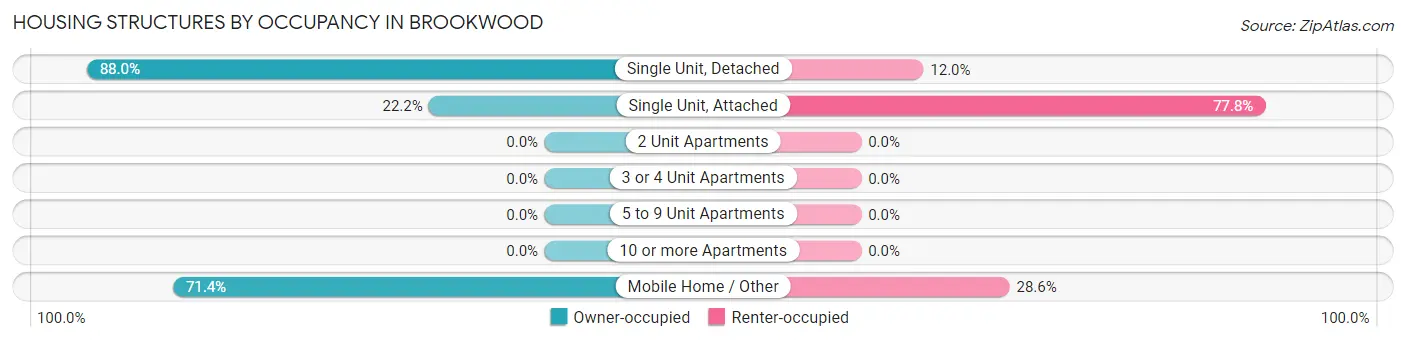
| Structure Type | Owner-occupied | Renter-occupied |
| Single Unit, Detached | 706 (88.0%) | 96 (12.0%) |
| Single Unit, Attached | 4 (22.2%) | 14 (77.8%) |
| 2 Unit Apartments | 0 (0.0%) | 0 (0.0%) |
| 3 or 4 Unit Apartments | 0 (0.0%) | 0 (0.0%) |
| 5 to 9 Unit Apartments | 0 (0.0%) | 0 (0.0%) |
| 10 or more Apartments | 0 (0.0%) | 0 (0.0%) |
| Mobile Home / Other | 50 (71.4%) | 20 (28.6%) |
| Total | 760 (85.4%) | 130 (14.6%) |
Housing Structures by Number of Rooms in Brookwood
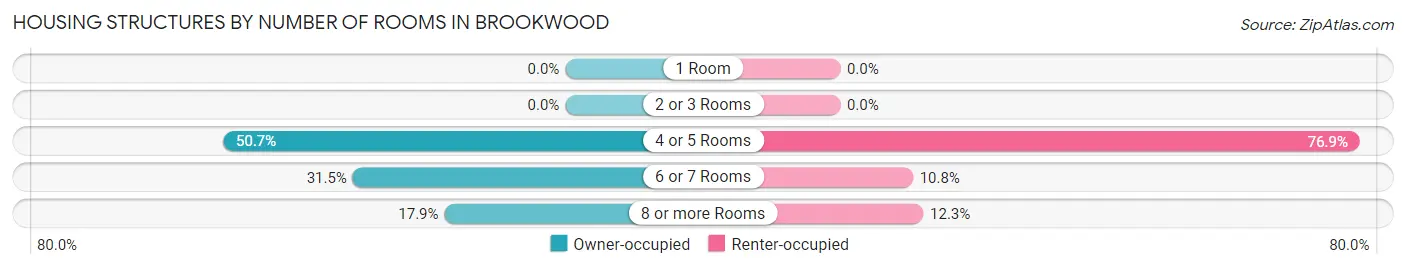
| Number of Rooms | Owner-occupied | Renter-occupied |
| 1 Room | 0 (0.0%) | 0 (0.0%) |
| 2 or 3 Rooms | 0 (0.0%) | 0 (0.0%) |
| 4 or 5 Rooms | 385 (50.7%) | 100 (76.9%) |
| 6 or 7 Rooms | 239 (31.5%) | 14 (10.8%) |
| 8 or more Rooms | 136 (17.9%) | 16 (12.3%) |
| Total | 760 (100.0%) | 130 (100.0%) |
Housing Structure by Heating Type in Brookwood
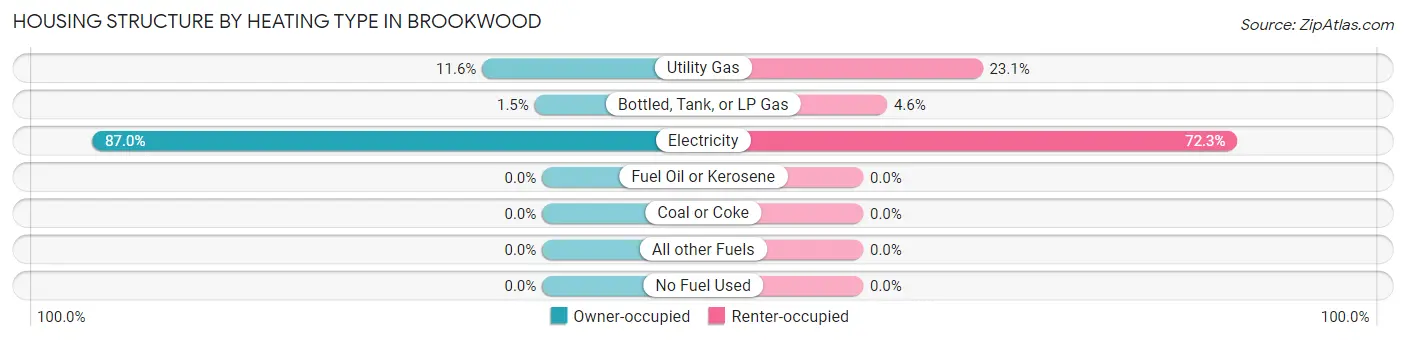
| Heating Type | Owner-occupied | Renter-occupied |
| Utility Gas | 88 (11.6%) | 30 (23.1%) |
| Bottled, Tank, or LP Gas | 11 (1.5%) | 6 (4.6%) |
| Electricity | 661 (87.0%) | 94 (72.3%) |
| Fuel Oil or Kerosene | 0 (0.0%) | 0 (0.0%) |
| Coal or Coke | 0 (0.0%) | 0 (0.0%) |
| All other Fuels | 0 (0.0%) | 0 (0.0%) |
| No Fuel Used | 0 (0.0%) | 0 (0.0%) |
| Total | 760 (100.0%) | 130 (100.0%) |
Household Vehicle Usage in Brookwood
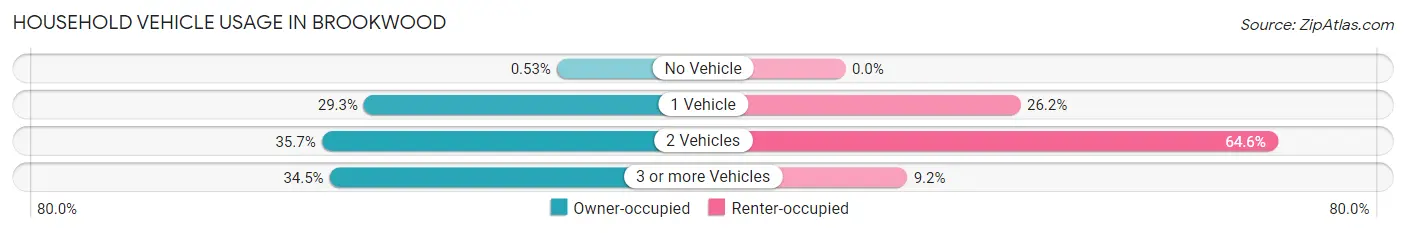
| Vehicles per Household | Owner-occupied | Renter-occupied |
| No Vehicle | 4 (0.5%) | 0 (0.0%) |
| 1 Vehicle | 223 (29.3%) | 34 (26.2%) |
| 2 Vehicles | 271 (35.7%) | 84 (64.6%) |
| 3 or more Vehicles | 262 (34.5%) | 12 (9.2%) |
| Total | 760 (100.0%) | 130 (100.0%) |
Real Estate & Mortgages in Brookwood
Real Estate and Mortgage Overview in Brookwood
| Characteristic | Without Mortgage | With Mortgage |
| Housing Units | 228 | 532 |
| Median Property Value | $207,200 | $165,000 |
| Median Household Income | $69,333 | $84 |
| Monthly Housing Costs | $446 | $12 |
| Real Estate Taxes | $378 | $99 |
Property Value by Mortgage Status in Brookwood
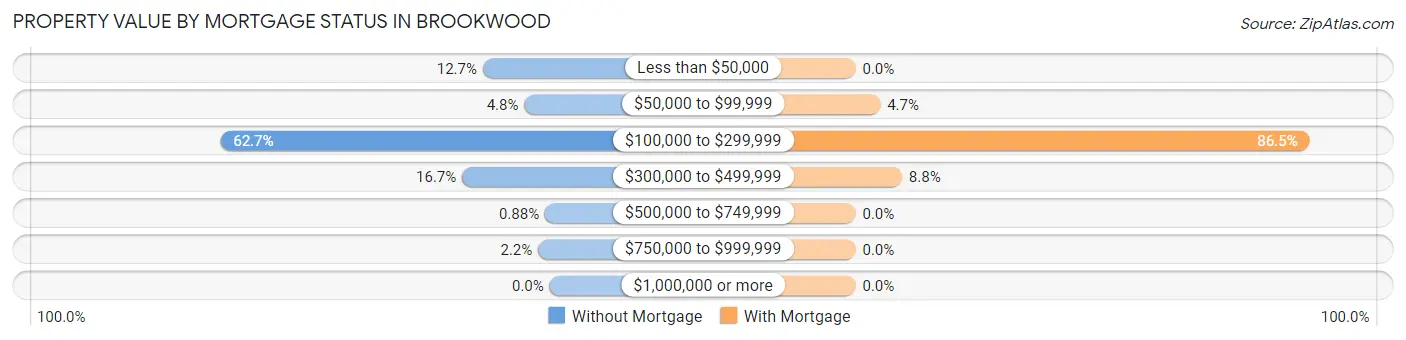
| Property Value | Without Mortgage | With Mortgage |
| Less than $50,000 | 29 (12.7%) | 0 (0.0%) |
| $50,000 to $99,999 | 11 (4.8%) | 25 (4.7%) |
| $100,000 to $299,999 | 143 (62.7%) | 460 (86.5%) |
| $300,000 to $499,999 | 38 (16.7%) | 47 (8.8%) |
| $500,000 to $749,999 | 2 (0.9%) | 0 (0.0%) |
| $750,000 to $999,999 | 5 (2.2%) | 0 (0.0%) |
| $1,000,000 or more | 0 (0.0%) | 0 (0.0%) |
| Total | 228 (100.0%) | 532 (100.0%) |
Household Income by Mortgage Status in Brookwood
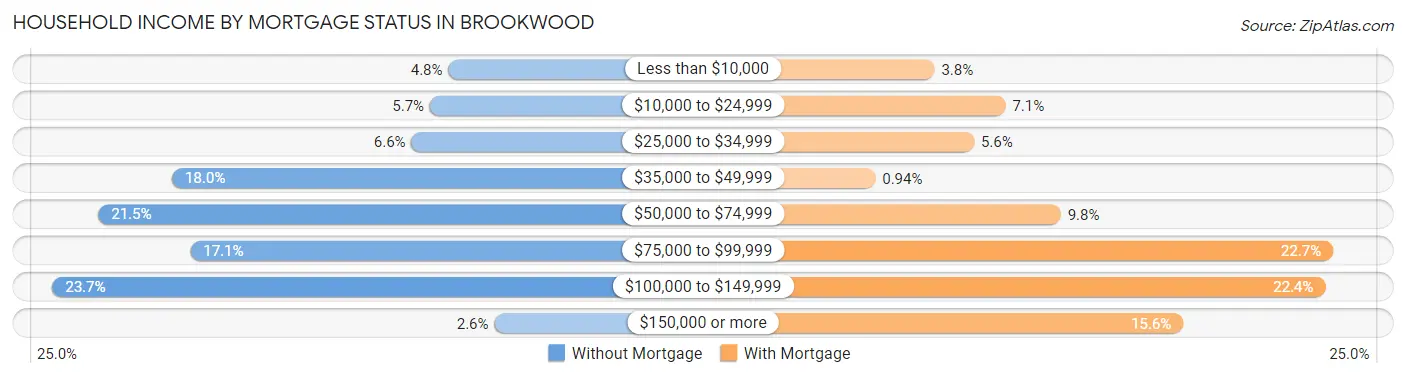
| Household Income | Without Mortgage | With Mortgage |
| Less than $10,000 | 11 (4.8%) | 20 (3.8%) |
| $10,000 to $24,999 | 13 (5.7%) | 38 (7.1%) |
| $25,000 to $34,999 | 15 (6.6%) | 30 (5.6%) |
| $35,000 to $49,999 | 41 (18.0%) | 5 (0.9%) |
| $50,000 to $74,999 | 49 (21.5%) | 52 (9.8%) |
| $75,000 to $99,999 | 39 (17.1%) | 121 (22.7%) |
| $100,000 to $149,999 | 54 (23.7%) | 119 (22.4%) |
| $150,000 or more | 6 (2.6%) | 83 (15.6%) |
| Total | 228 (100.0%) | 532 (100.0%) |
Property Value to Household Income Ratio in Brookwood
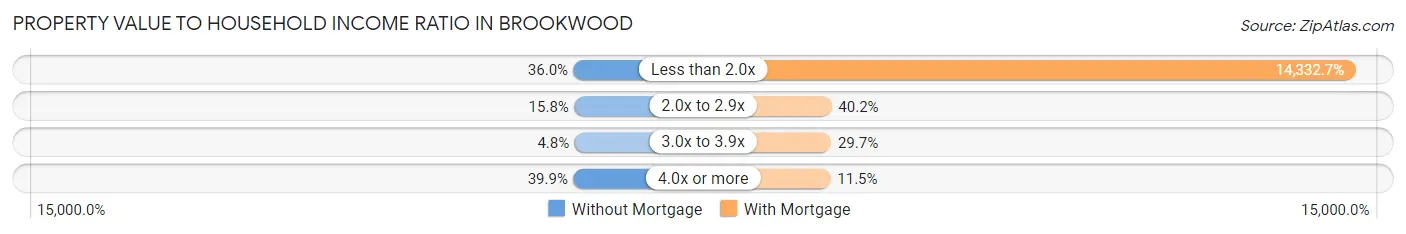
| Value-to-Income Ratio | Without Mortgage | With Mortgage |
| Less than 2.0x | 82 (36.0%) | 76,250 (14,332.7%) |
| 2.0x to 2.9x | 36 (15.8%) | 214 (40.2%) |
| 3.0x to 3.9x | 11 (4.8%) | 158 (29.7%) |
| 4.0x or more | 91 (39.9%) | 61 (11.5%) |
| Total | 228 (100.0%) | 532 (100.0%) |
Real Estate Taxes by Mortgage Status in Brookwood
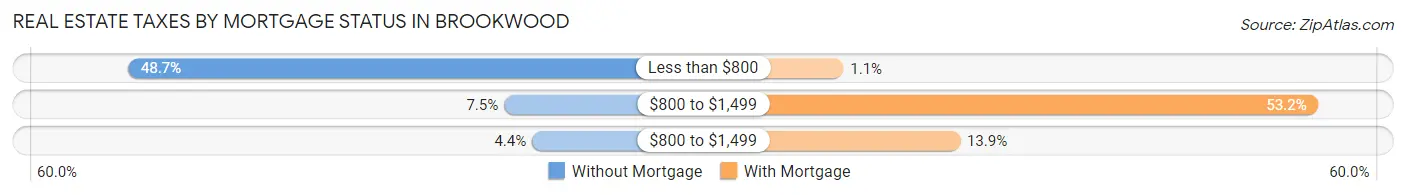
| Property Taxes | Without Mortgage | With Mortgage |
| Less than $800 | 111 (48.7%) | 6 (1.1%) |
| $800 to $1,499 | 17 (7.5%) | 283 (53.2%) |
| $800 to $1,499 | 10 (4.4%) | 74 (13.9%) |
| Total | 228 (100.0%) | 532 (100.0%) |
Health & Disability in Brookwood
Health Insurance Coverage by Age in Brookwood
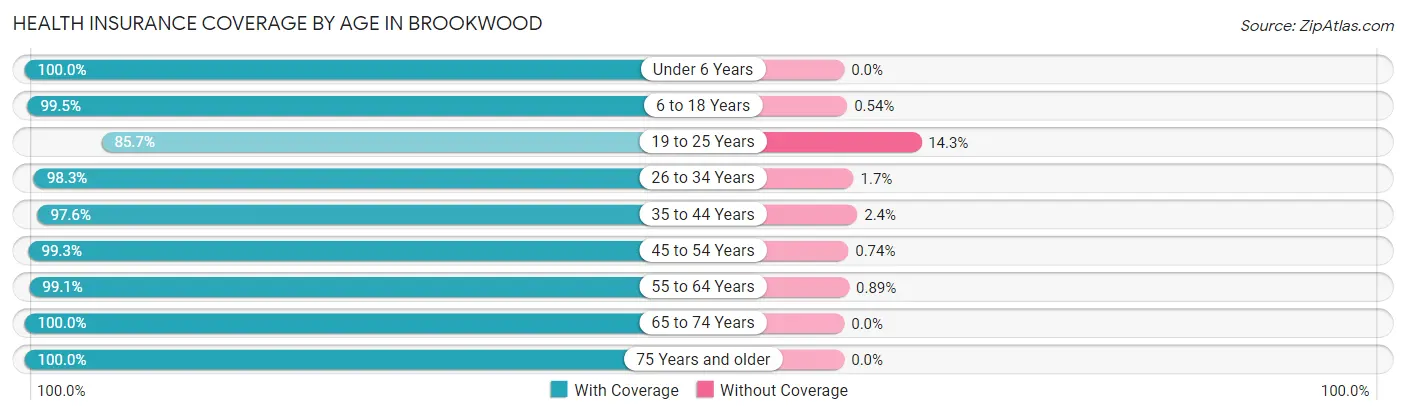
| Age Bracket | With Coverage | Without Coverage |
| Under 6 Years | 146 (100.0%) | 0 (0.0%) |
| 6 to 18 Years | 365 (99.5%) | 2 (0.5%) |
| 19 to 25 Years | 215 (85.7%) | 36 (14.3%) |
| 26 to 34 Years | 453 (98.3%) | 8 (1.7%) |
| 35 to 44 Years | 322 (97.6%) | 8 (2.4%) |
| 45 to 54 Years | 270 (99.3%) | 2 (0.7%) |
| 55 to 64 Years | 333 (99.1%) | 3 (0.9%) |
| 65 to 74 Years | 156 (100.0%) | 0 (0.0%) |
| 75 Years and older | 101 (100.0%) | 0 (0.0%) |
| Total | 2,361 (97.6%) | 59 (2.4%) |
Health Insurance Coverage by Citizenship Status in Brookwood
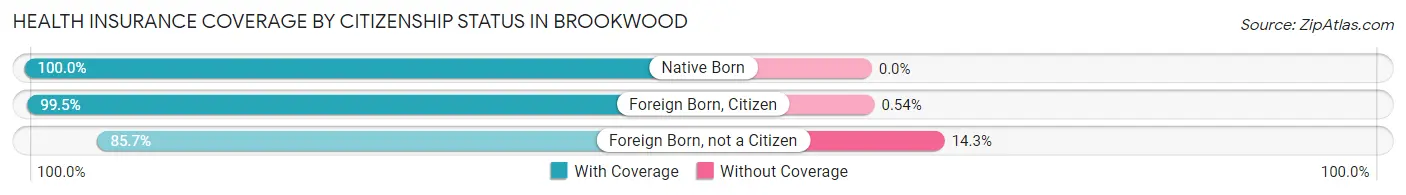
| Citizenship Status | With Coverage | Without Coverage |
| Native Born | 146 (100.0%) | 0 (0.0%) |
| Foreign Born, Citizen | 365 (99.5%) | 2 (0.5%) |
| Foreign Born, not a Citizen | 215 (85.7%) | 36 (14.3%) |
Health Insurance Coverage by Household Income in Brookwood
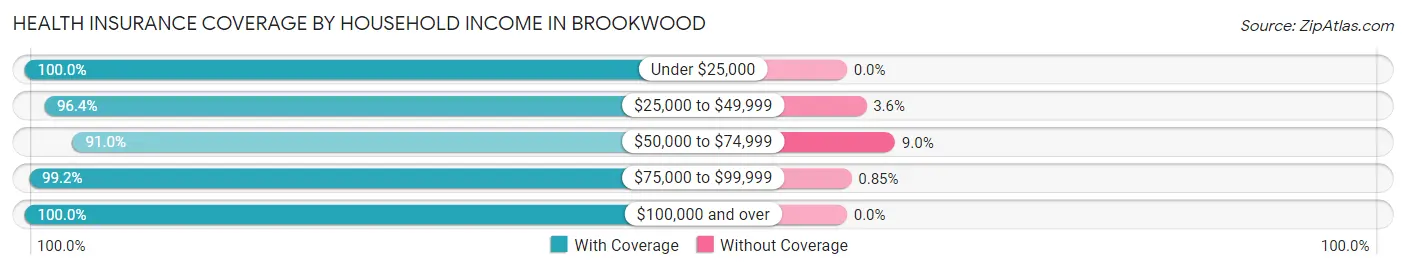
| Household Income | With Coverage | Without Coverage |
| Under $25,000 | 138 (100.0%) | 0 (0.0%) |
| $25,000 to $49,999 | 318 (96.4%) | 12 (3.6%) |
| $50,000 to $74,999 | 424 (91.0%) | 42 (9.0%) |
| $75,000 to $99,999 | 582 (99.2%) | 5 (0.9%) |
| $100,000 and over | 899 (100.0%) | 0 (0.0%) |
Public vs Private Health Insurance Coverage by Age in Brookwood
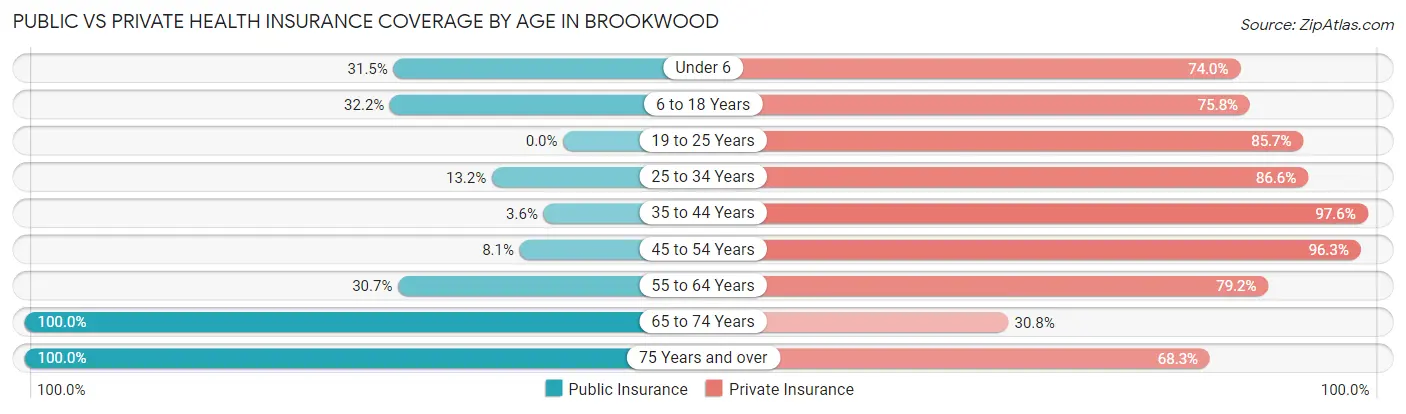
| Age Bracket | Public Insurance | Private Insurance |
| Under 6 | 46 (31.5%) | 108 (74.0%) |
| 6 to 18 Years | 118 (32.2%) | 278 (75.7%) |
| 19 to 25 Years | 0 (0.0%) | 215 (85.7%) |
| 25 to 34 Years | 61 (13.2%) | 399 (86.6%) |
| 35 to 44 Years | 12 (3.6%) | 322 (97.6%) |
| 45 to 54 Years | 22 (8.1%) | 262 (96.3%) |
| 55 to 64 Years | 103 (30.6%) | 266 (79.2%) |
| 65 to 74 Years | 156 (100.0%) | 48 (30.8%) |
| 75 Years and over | 101 (100.0%) | 69 (68.3%) |
| Total | 619 (25.6%) | 1,967 (81.3%) |
Disability Status by Sex by Age in Brookwood
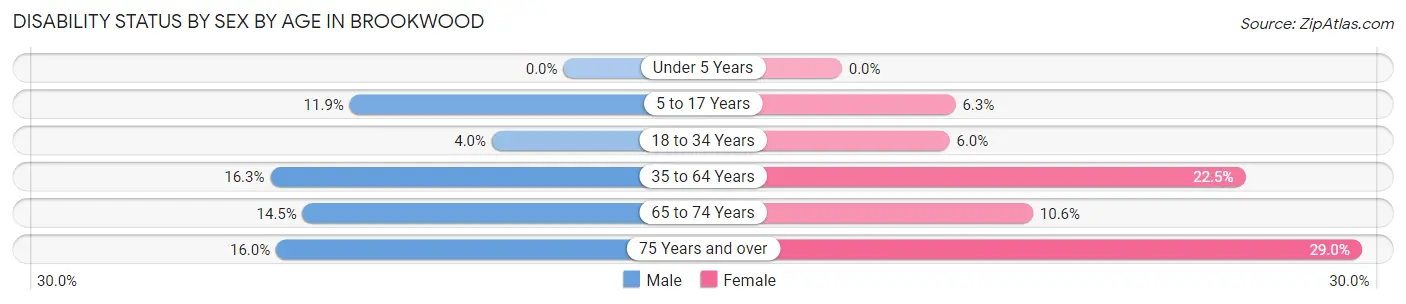
| Age Bracket | Male | Female |
| Under 5 Years | 0 (0.0%) | 0 (0.0%) |
| 5 to 17 Years | 20 (11.9%) | 10 (6.3%) |
| 18 to 34 Years | 15 (4.0%) | 25 (6.0%) |
| 35 to 64 Years | 71 (16.3%) | 113 (22.5%) |
| 65 to 74 Years | 9 (14.5%) | 10 (10.6%) |
| 75 Years and over | 4 (16.0%) | 22 (28.9%) |
Disability Class by Sex by Age in Brookwood
Disability Class: Hearing Difficulty
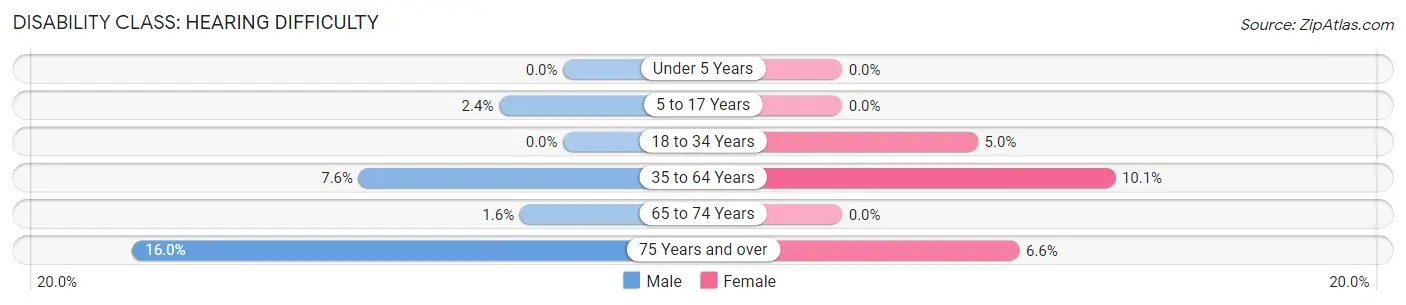
| Age Bracket | Male | Female |
| Under 5 Years | 0 (0.0%) | 0 (0.0%) |
| 5 to 17 Years | 4 (2.4%) | 0 (0.0%) |
| 18 to 34 Years | 0 (0.0%) | 21 (5.0%) |
| 35 to 64 Years | 33 (7.6%) | 51 (10.1%) |
| 65 to 74 Years | 1 (1.6%) | 0 (0.0%) |
| 75 Years and over | 4 (16.0%) | 5 (6.6%) |
Disability Class: Vision Difficulty
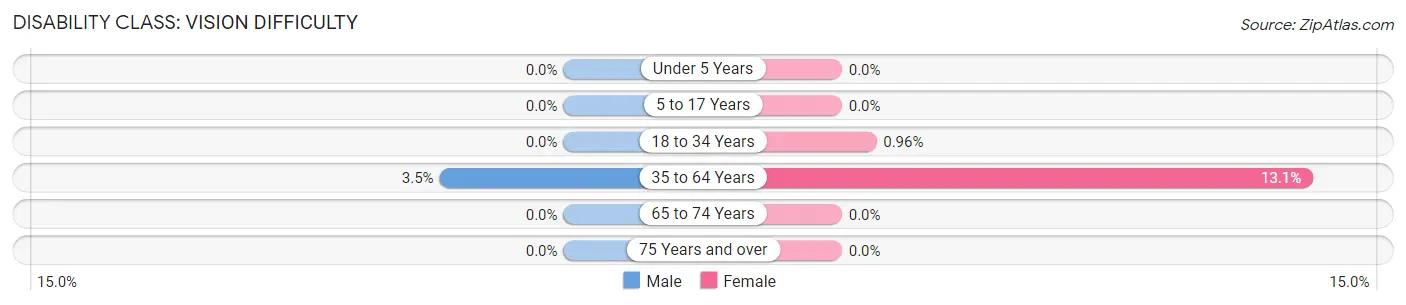
| Age Bracket | Male | Female |
| Under 5 Years | 0 (0.0%) | 0 (0.0%) |
| 5 to 17 Years | 0 (0.0%) | 0 (0.0%) |
| 18 to 34 Years | 0 (0.0%) | 4 (1.0%) |
| 35 to 64 Years | 15 (3.5%) | 66 (13.1%) |
| 65 to 74 Years | 0 (0.0%) | 0 (0.0%) |
| 75 Years and over | 0 (0.0%) | 0 (0.0%) |
Disability Class: Cognitive Difficulty
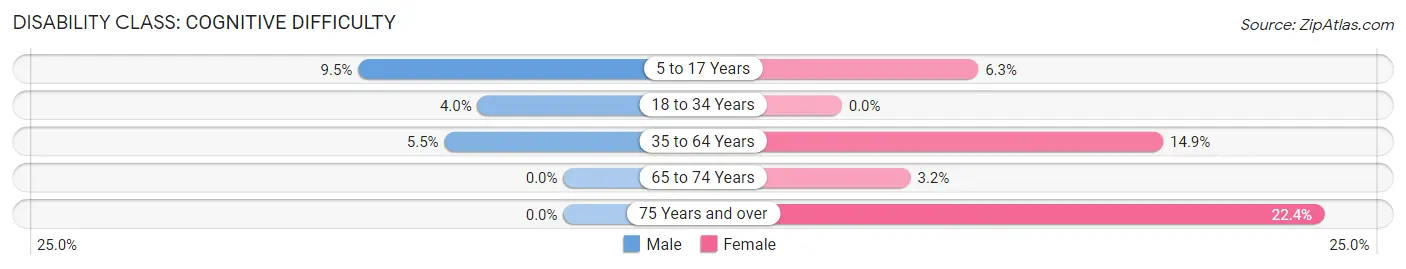
| Age Bracket | Male | Female |
| 5 to 17 Years | 16 (9.5%) | 10 (6.3%) |
| 18 to 34 Years | 15 (4.0%) | 0 (0.0%) |
| 35 to 64 Years | 24 (5.5%) | 75 (14.9%) |
| 65 to 74 Years | 0 (0.0%) | 3 (3.2%) |
| 75 Years and over | 0 (0.0%) | 17 (22.4%) |
Disability Class: Ambulatory Difficulty
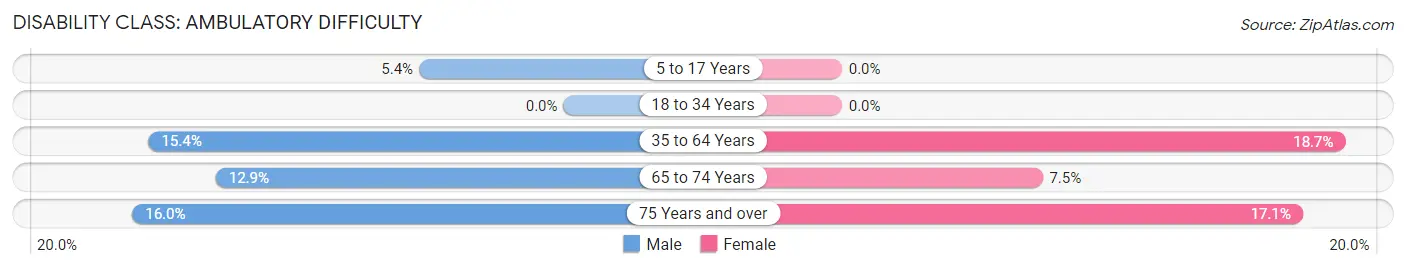
| Age Bracket | Male | Female |
| 5 to 17 Years | 9 (5.4%) | 0 (0.0%) |
| 18 to 34 Years | 0 (0.0%) | 0 (0.0%) |
| 35 to 64 Years | 67 (15.4%) | 94 (18.7%) |
| 65 to 74 Years | 8 (12.9%) | 7 (7.4%) |
| 75 Years and over | 4 (16.0%) | 13 (17.1%) |
Disability Class: Self-Care Difficulty
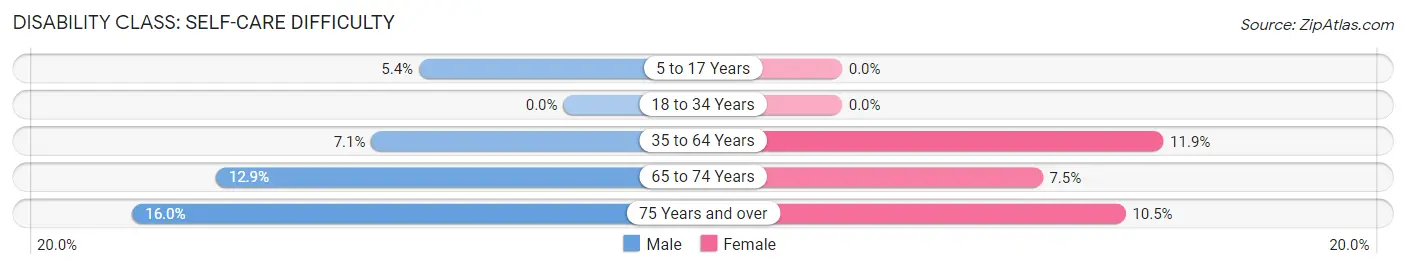
| Age Bracket | Male | Female |
| 5 to 17 Years | 9 (5.4%) | 0 (0.0%) |
| 18 to 34 Years | 0 (0.0%) | 0 (0.0%) |
| 35 to 64 Years | 31 (7.1%) | 60 (11.9%) |
| 65 to 74 Years | 8 (12.9%) | 7 (7.4%) |
| 75 Years and over | 4 (16.0%) | 8 (10.5%) |
Technology Access in Brookwood
Computing Device Access in Brookwood
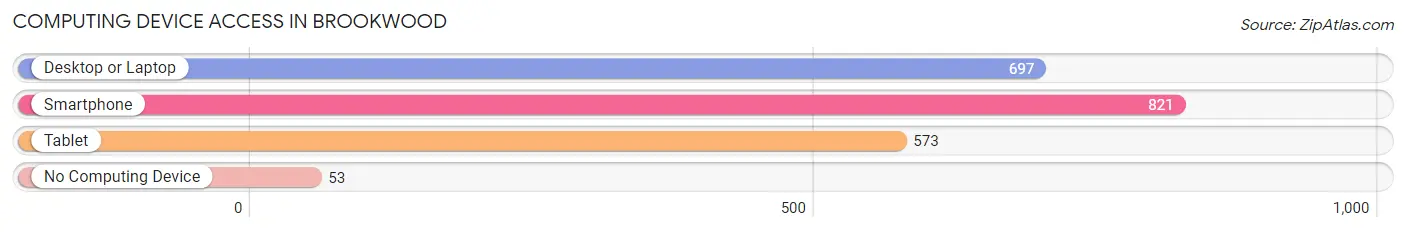
| Device Type | # Households | % Households |
| Desktop or Laptop | 697 | 78.3% |
| Smartphone | 821 | 92.2% |
| Tablet | 573 | 64.4% |
| No Computing Device | 53 | 6.0% |
| Total | 890 | 100.0% |
Internet Access in Brookwood
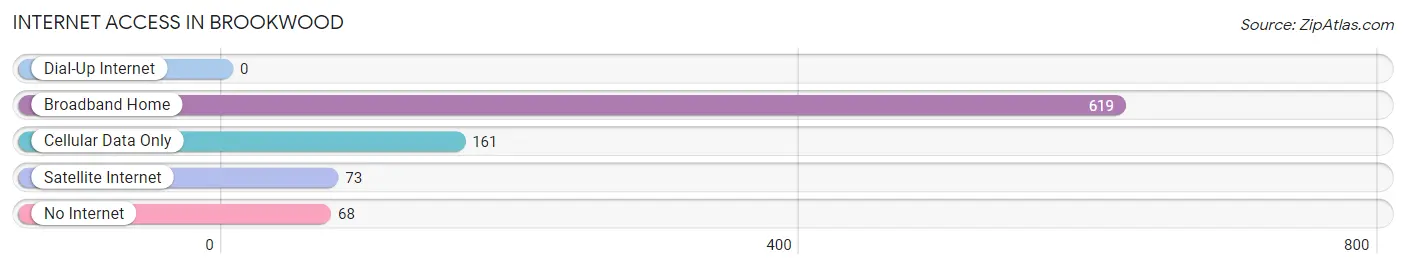
| Internet Type | # Households | % Households |
| Dial-Up Internet | 0 | 0.0% |
| Broadband Home | 619 | 69.6% |
| Cellular Data Only | 161 | 18.1% |
| Satellite Internet | 73 | 8.2% |
| No Internet | 68 | 7.6% |
| Total | 890 | 100.0% |
Brookwood Summary
Introduction
Brookwood is a small town located in Tuscaloosa County, Alabama. It is situated in the foothills of the Appalachian Mountains and is part of the Birmingham-Hoover Metropolitan Statistical Area. The town has a population of approximately 1,500 people and is known for its rural charm and friendly atmosphere.
History
The area that is now Brookwood was first settled in the early 1800s by settlers from North Carolina and Virginia. The town was originally known as “Bucktown” and was later renamed Brookwood in 1887. The town was incorporated in 1901 and has remained a small, rural community ever since.
Geography
Brookwood is located in the foothills of the Appalachian Mountains in Tuscaloosa County, Alabama. The town is situated at an elevation of 830 feet and is approximately 20 miles west of Tuscaloosa. The town is surrounded by rolling hills and is home to several creeks and streams. The town is also located near the Black Warrior River, which provides a source of recreation for the residents of Brookwood.
Economy
The economy of Brookwood is largely based on agriculture and forestry. The town is home to several farms and timber companies, which provide employment for many of the town’s residents. The town also has a few small businesses, including a grocery store, a hardware store, and a few restaurants.
Demographics
As of the 2010 census, the population of Brookwood was 1,500. The racial makeup of the town was 95.2% White, 2.7% African American, 0.2% Native American, 0.2% Asian, 0.2% from other races, and 1.7% from two or more races. The median household income was $31,250 and the median family income was $37,500.
Conclusion
Brookwood is a small town located in Tuscaloosa County, Alabama. The town has a population of approximately 1,500 people and is known for its rural charm and friendly atmosphere. The economy of Brookwood is largely based on agriculture and forestry, and the town is home to several farms and timber companies. The racial makeup of the town is predominantly White, with a small percentage of African American, Native American, and Asian residents.
Common Questions
What is Per Capita Income in Brookwood?
Per Capita income in Brookwood is $32,634.
What is the Median Family Income in Brookwood?
Median Family Income in Brookwood is $82,765.
What is the Median Household income in Brookwood?
Median Household Income in Brookwood is $75,125.
What is Income or Wage Gap in Brookwood?
Income or Wage Gap in Brookwood is 19.6%.
Women in Brookwood earn 80.4 cents for every dollar earned by a man.
What is Inequality or Gini Index in Brookwood?
Inequality or Gini Index in Brookwood is 0.35.
What is the Total Population of Brookwood?
Total Population of Brookwood is 2,420.
What is the Total Male Population of Brookwood?
Total Male Population of Brookwood is 1,142.
What is the Total Female Population of Brookwood?
Total Female Population of Brookwood is 1,278.
What is the Ratio of Males per 100 Females in Brookwood?
There are 89.36 Males per 100 Females in Brookwood.
What is the Ratio of Females per 100 Males in Brookwood?
There are 111.91 Females per 100 Males in Brookwood.
What is the Median Population Age in Brookwood?
Median Population Age in Brookwood is 34.7 Years.
What is the Average Family Size in Brookwood
Average Family Size in Brookwood is 3.1 People.
What is the Average Household Size in Brookwood
Average Household Size in Brookwood is 2.7 People.
How Large is the Labor Force in Brookwood?
There are 1,384 People in the Labor Forcein in Brookwood.
What is the Percentage of People in the Labor Force in Brookwood?
67.5% of People are in the Labor Force in Brookwood.
What is the Unemployment Rate in Brookwood?
Unemployment Rate in Brookwood is 1.5%.