New Union, AL Map & Demographics
New Union Map
New Union Overview
$24,090
PER CAPITA INCOME
$88,083
AVG FAMILY INCOME
$51,346
AVG HOUSEHOLD INCOME
0.38
INEQUALITY / GINI INDEX
811
TOTAL POPULATION
471
MALE POPULATION
340
FEMALE POPULATION
138.53
MALES / 100 FEMALES
72.19
FEMALES / 100 MALES
32.8
MEDIAN AGE
3.3
AVG FAMILY SIZE
2.6
AVG HOUSEHOLD SIZE
360
LABOR FORCE [ PEOPLE ]
65.8%
PERCENT IN LABOR FORCE
Income in New Union
Income Overview in New Union
Per Capita Income in New Union is $24,090, while median incomes of families and households are $88,083 and $51,346 respectively.
| Characteristic | Number | Measure |
| Per Capita Income | 811 | $24,090 |
| Median Family Income | 218 | $88,083 |
| Mean Family Income | 218 | $81,108 |
| Median Household Income | 306 | $51,346 |
| Mean Household Income | 306 | $62,808 |
| Income Deficit | 218 | $0 |
| Wage / Income Gap (%) | 811 | 0.00% |
| Wage / Income Gap ($) | 811 | 100.00¢ per $1 |
| Gini / Inequality Index | 811 | 0.38 |
Earnings by Sex in New Union
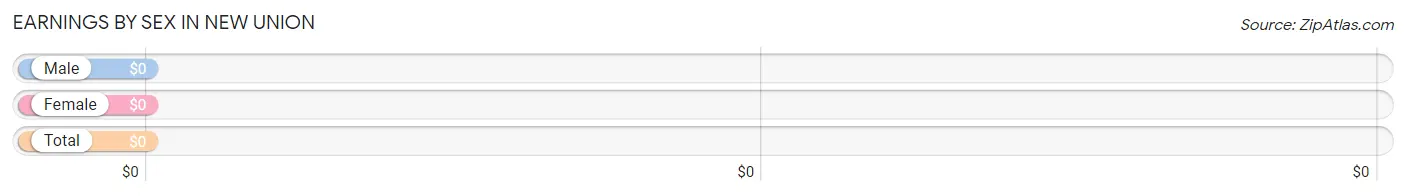
| Sex | Number | Average Earnings |
| Male | 143 (39.7%) | $0 |
| Female | 217 (60.3%) | $0 |
| Total | 360 (100.0%) | $0 |
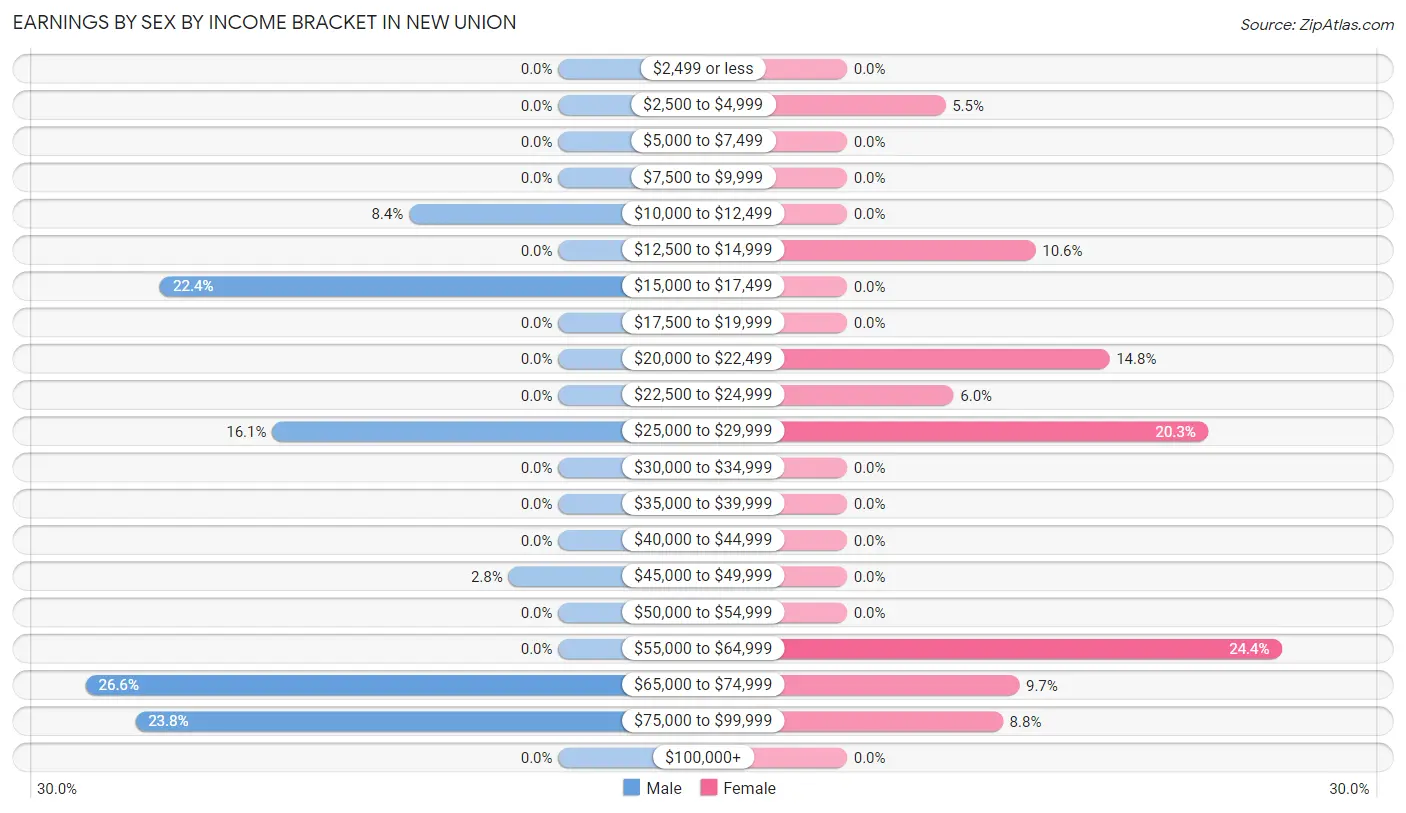
Earnings by Sex by Income Bracket in New Union
The most common earnings brackets in New Union are $65,000 to $74,999 for men (38 | 26.6%) and $55,000 to $64,999 for women (53 | 24.4%).
| Income | Male | Female |
| $2,499 or less | 0 (0.0%) | 0 (0.0%) |
| $2,500 to $4,999 | 0 (0.0%) | 12 (5.5%) |
| $5,000 to $7,499 | 0 (0.0%) | 0 (0.0%) |
| $7,500 to $9,999 | 0 (0.0%) | 0 (0.0%) |
| $10,000 to $12,499 | 12 (8.4%) | 0 (0.0%) |
| $12,500 to $14,999 | 0 (0.0%) | 23 (10.6%) |
| $15,000 to $17,499 | 32 (22.4%) | 0 (0.0%) |
| $17,500 to $19,999 | 0 (0.0%) | 0 (0.0%) |
| $20,000 to $22,499 | 0 (0.0%) | 32 (14.7%) |
| $22,500 to $24,999 | 0 (0.0%) | 13 (6.0%) |
| $25,000 to $29,999 | 23 (16.1%) | 44 (20.3%) |
| $30,000 to $34,999 | 0 (0.0%) | 0 (0.0%) |
| $35,000 to $39,999 | 0 (0.0%) | 0 (0.0%) |
| $40,000 to $44,999 | 0 (0.0%) | 0 (0.0%) |
| $45,000 to $49,999 | 4 (2.8%) | 0 (0.0%) |
| $50,000 to $54,999 | 0 (0.0%) | 0 (0.0%) |
| $55,000 to $64,999 | 0 (0.0%) | 53 (24.4%) |
| $65,000 to $74,999 | 38 (26.6%) | 21 (9.7%) |
| $75,000 to $99,999 | 34 (23.8%) | 19 (8.8%) |
| $100,000+ | 0 (0.0%) | 0 (0.0%) |
| Total | 143 (100.0%) | 217 (100.0%) |
Earnings by Sex by Educational Attainment in New Union
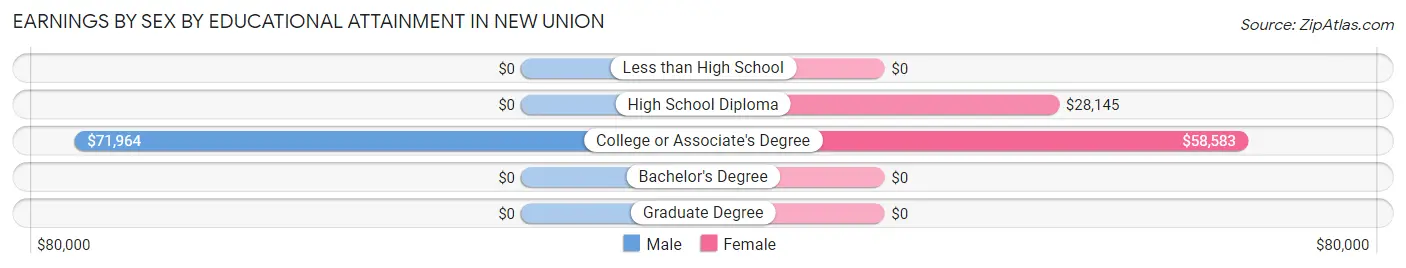
| Educational Attainment | Male Income | Female Income |
| Less than High School | - | - |
| High School Diploma | - | - |
| College or Associate's Degree | $71,964 | $58,583 |
| Bachelor's Degree | - | - |
| Graduate Degree | - | - |
| Total | $67,426 | $0 |
Family Income in New Union
Family Income Brackets in New Union
According to the New Union family income data, there are 74 families falling into the $75,000 to $99,999 income range, which is the most common income bracket and makes up 33.9% of all families.
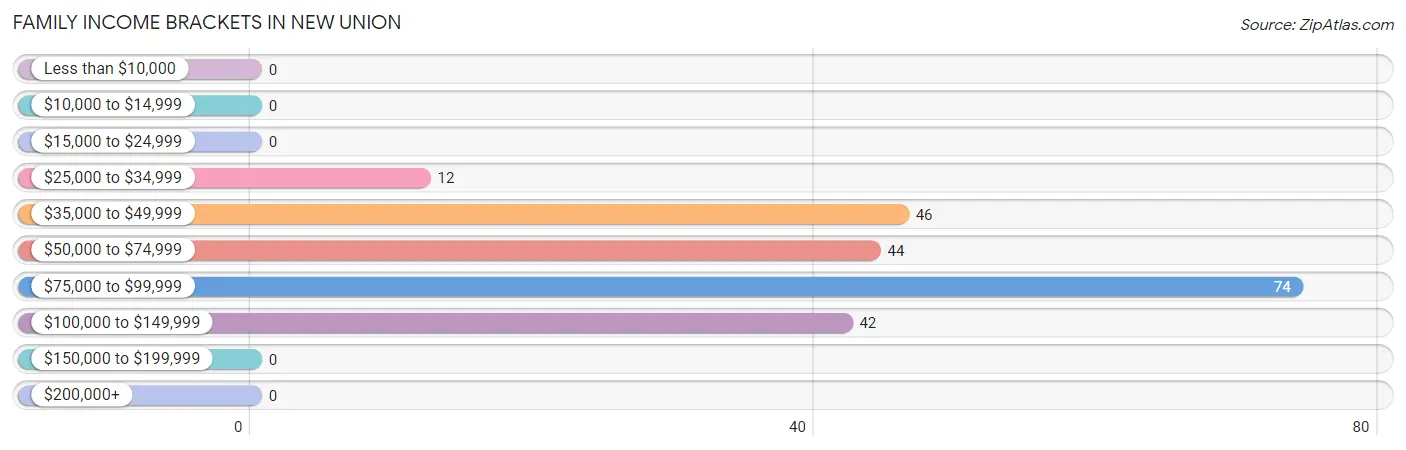
| Income Bracket | # Families | % Families |
| Less than $10,000 | 0 | 0.0% |
| $10,000 to $14,999 | 0 | 0.0% |
| $15,000 to $24,999 | 0 | 0.0% |
| $25,000 to $34,999 | 12 | 5.5% |
| $35,000 to $49,999 | 46 | 21.1% |
| $50,000 to $74,999 | 44 | 20.2% |
| $75,000 to $99,999 | 74 | 33.9% |
| $100,000 to $149,999 | 42 | 19.3% |
| $150,000 to $199,999 | 0 | 0.0% |
| $200,000+ | 0 | 0.0% |
Family Income by Famaliy Size in New Union
4-person families (76 | 34.9%) account for the highest median family income in New Union with $91,974 per family, while 2-person families (109 | 50.0%) have the highest median income of $25,818 per family member.
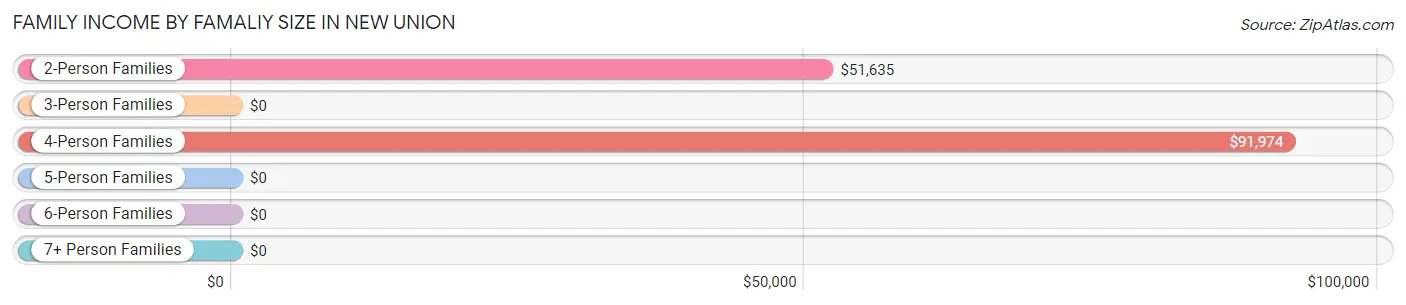
| Income Bracket | # Families | Median Income |
| 2-Person Families | 109 (50.0%) | $51,635 |
| 3-Person Families | 33 (15.1%) | $0 |
| 4-Person Families | 76 (34.9%) | $91,974 |
| 5-Person Families | 0 (0.0%) | $0 |
| 6-Person Families | 0 (0.0%) | $0 |
| 7+ Person Families | 0 (0.0%) | $0 |
| Total | 218 (100.0%) | $88,083 |
Family Income by Number of Earners in New Union
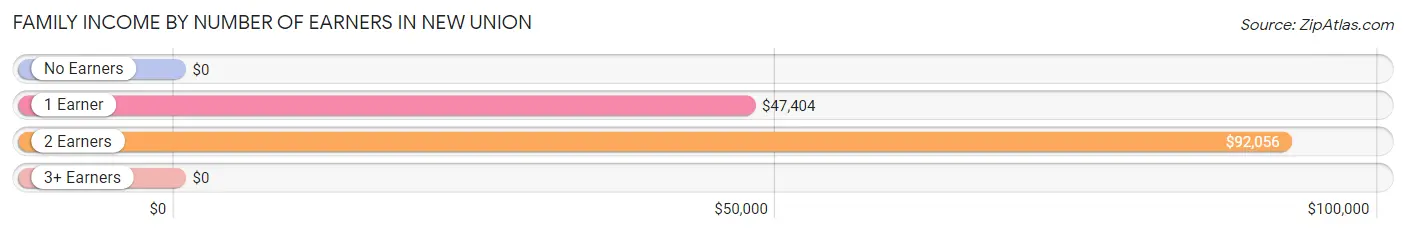
| Number of Earners | # Families | Median Income |
| No Earners | 6 (2.8%) | $0 |
| 1 Earner | 91 (41.7%) | $47,404 |
| 2 Earners | 121 (55.5%) | $92,056 |
| 3+ Earners | 0 (0.0%) | $0 |
| Total | 218 (100.0%) | $88,083 |
Household Income in New Union
Household Income Brackets in New Union
With 74 households falling in the category, the $75,000 to $99,999 income range is the most frequent in New Union, accounting for 24.2% of all households.
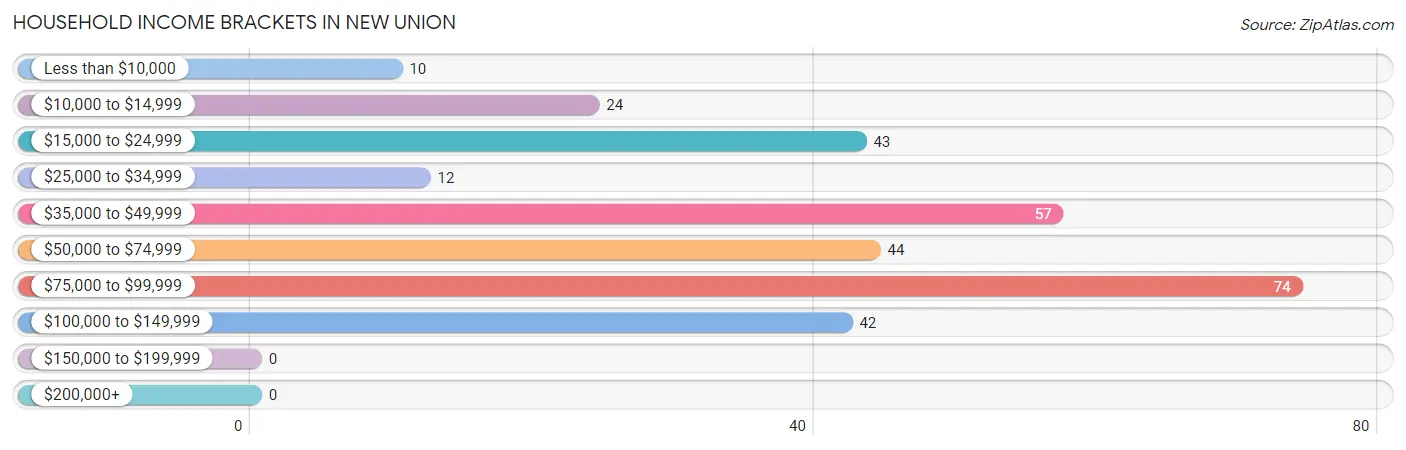
| Income Bracket | # Households | % Households |
| Less than $10,000 | 10 | 3.3% |
| $10,000 to $14,999 | 24 | 7.8% |
| $15,000 to $24,999 | 43 | 14.1% |
| $25,000 to $34,999 | 12 | 3.9% |
| $35,000 to $49,999 | 57 | 18.6% |
| $50,000 to $74,999 | 44 | 14.4% |
| $75,000 to $99,999 | 74 | 24.2% |
| $100,000 to $149,999 | 42 | 13.7% |
| $150,000 to $199,999 | 0 | 0.0% |
| $200,000+ | 0 | 0.0% |
Household Income by Householder Age in New Union
The median household income in New Union is $51,346, with the highest median household income of $91,458 found in the 45 to 64 years age bracket for the primary householder. A total of 94 households (30.7%) fall into this category.
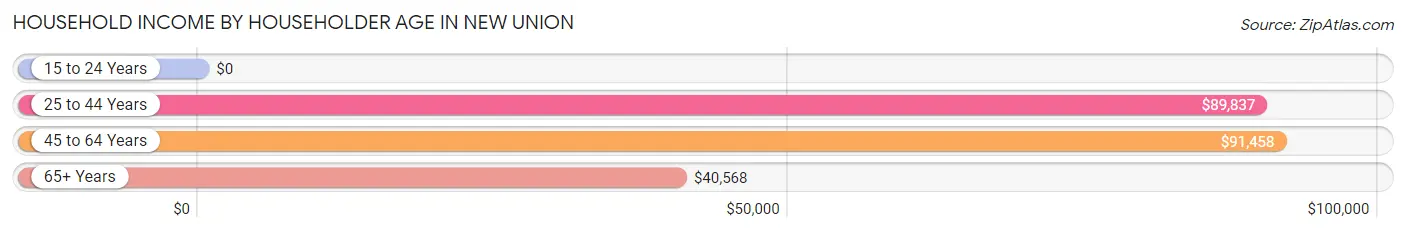
| Income Bracket | # Households | Median Income |
| 15 to 24 Years | 0 (0.0%) | $0 |
| 25 to 44 Years | 67 (21.9%) | $89,837 |
| 45 to 64 Years | 94 (30.7%) | $91,458 |
| 65+ Years | 145 (47.4%) | $40,568 |
| Total | 306 (100.0%) | $51,346 |
Poverty in New Union
Income Below Poverty by Sex and Age in New Union
With 5.5% poverty level for males and 2.4% for females among the residents of New Union, 75 year old and over males and 75 year old and over females are the most vulnerable to poverty, with 10 males (40.0%) and 8 females (53.3%) in their respective age groups living below the poverty level.
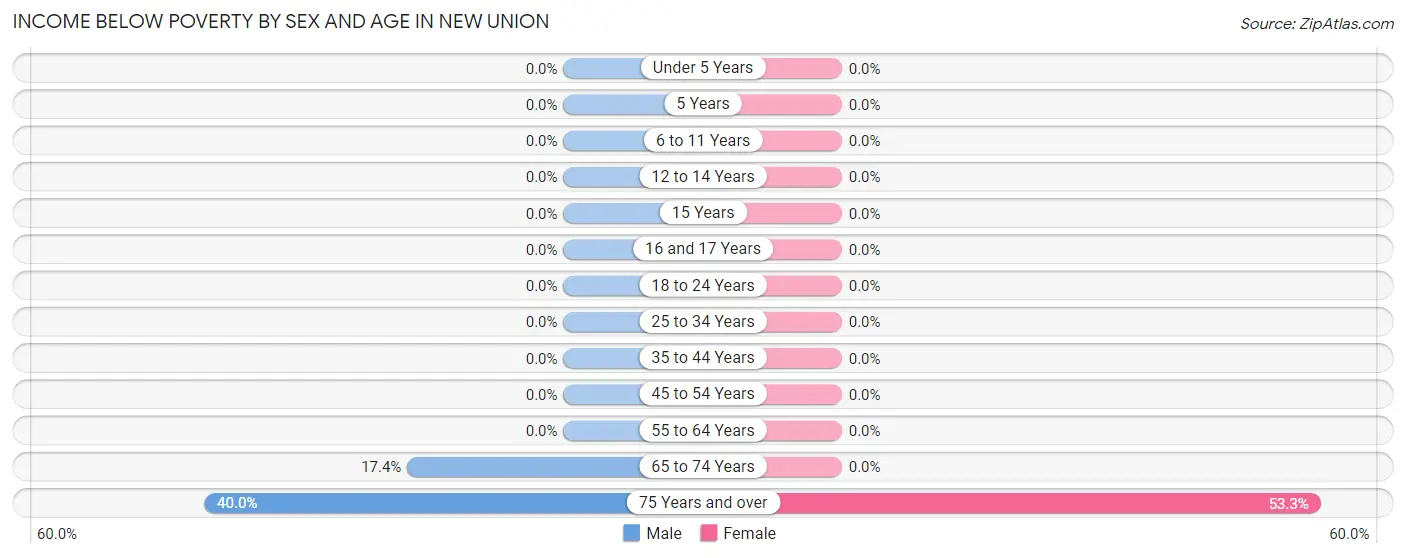
| Age Bracket | Male | Female |
| Under 5 Years | 0 (0.0%) | 0 (0.0%) |
| 5 Years | 0 (0.0%) | 0 (0.0%) |
| 6 to 11 Years | 0 (0.0%) | 0 (0.0%) |
| 12 to 14 Years | 0 (0.0%) | 0 (0.0%) |
| 15 Years | 0 (0.0%) | 0 (0.0%) |
| 16 and 17 Years | 0 (0.0%) | 0 (0.0%) |
| 18 to 24 Years | 0 (0.0%) | 0 (0.0%) |
| 25 to 34 Years | 0 (0.0%) | 0 (0.0%) |
| 35 to 44 Years | 0 (0.0%) | 0 (0.0%) |
| 45 to 54 Years | 0 (0.0%) | 0 (0.0%) |
| 55 to 64 Years | 0 (0.0%) | 0 (0.0%) |
| 65 to 74 Years | 16 (17.4%) | 0 (0.0%) |
| 75 Years and over | 10 (40.0%) | 8 (53.3%) |
| Total | 26 (5.5%) | 8 (2.4%) |
Income Above Poverty by Sex and Age in New Union
According to the poverty statistics in New Union, males aged under 5 years and females aged 5 years are the age groups that are most secure financially, with 100.0% of males and 100.0% of females in these age groups living above the poverty line.
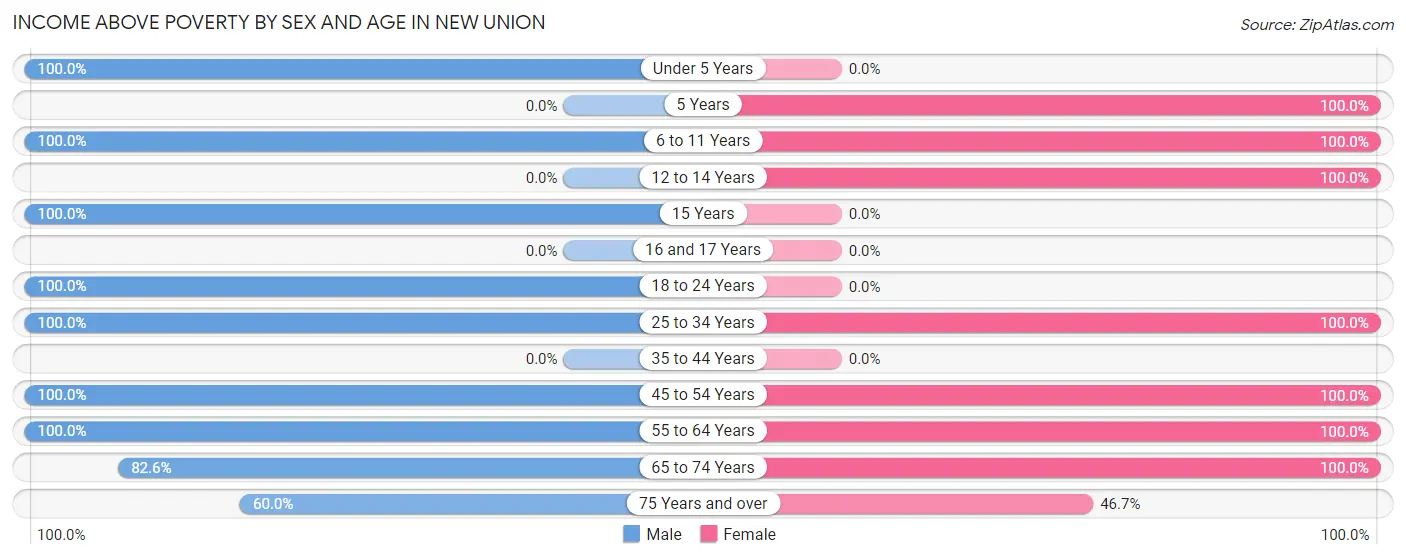
| Age Bracket | Male | Female |
| Under 5 Years | 114 (100.0%) | 0 (0.0%) |
| 5 Years | 0 (0.0%) | 38 (100.0%) |
| 6 to 11 Years | 18 (100.0%) | 27 (100.0%) |
| 12 to 14 Years | 0 (0.0%) | 17 (100.0%) |
| 15 Years | 50 (100.0%) | 0 (0.0%) |
| 16 and 17 Years | 0 (0.0%) | 0 (0.0%) |
| 18 to 24 Years | 32 (100.0%) | 0 (0.0%) |
| 25 to 34 Years | 52 (100.0%) | 66 (100.0%) |
| 35 to 44 Years | 0 (0.0%) | 0 (0.0%) |
| 45 to 54 Years | 29 (100.0%) | 92 (100.0%) |
| 55 to 64 Years | 59 (100.0%) | 41 (100.0%) |
| 65 to 74 Years | 76 (82.6%) | 44 (100.0%) |
| 75 Years and over | 15 (60.0%) | 7 (46.7%) |
| Total | 445 (94.5%) | 332 (97.7%) |
Income Below Poverty Among Married-Couple Families in New Union
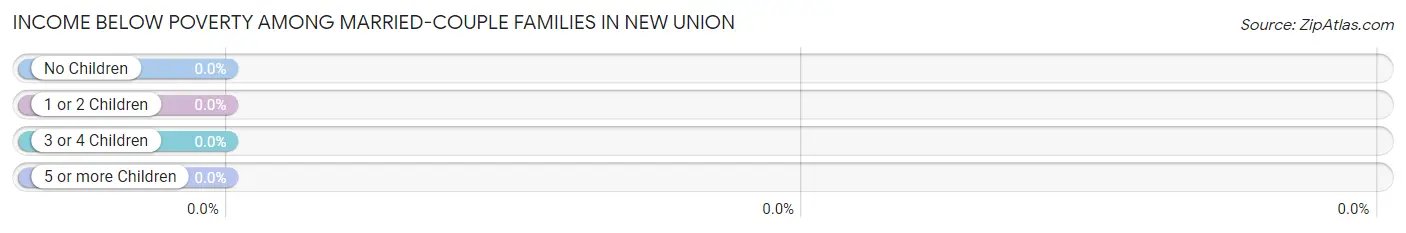
| Children | Above Poverty | Below Poverty |
| No Children | 96 (100.0%) | 0 (0.0%) |
| 1 or 2 Children | 109 (100.0%) | 0 (0.0%) |
| 3 or 4 Children | 0 (0.0%) | 0 (0.0%) |
| 5 or more Children | 0 (0.0%) | 0 (0.0%) |
| Total | 205 (100.0%) | 0 (0.0%) |
Income Below Poverty Among Single-Parent Households in New Union
| Children | Single Father | Single Mother |
| No Children | 0 (0.0%) | 0 (0.0%) |
| 1 or 2 Children | 0 (0.0%) | 0 (0.0%) |
| 3 or 4 Children | 0 (0.0%) | 0 (0.0%) |
| 5 or more Children | 0 (0.0%) | 0 (0.0%) |
| Total | 0 (0.0%) | 0 (0.0%) |
Income Below Poverty Among Married-Couple vs Single-Parent Households in New Union
| Children | Married-Couple Families | Single-Parent Households |
| No Children | 0 (0.0%) | 0 (0.0%) |
| 1 or 2 Children | 0 (0.0%) | 0 (0.0%) |
| 3 or 4 Children | 0 (0.0%) | 0 (0.0%) |
| 5 or more Children | 0 (0.0%) | 0 (0.0%) |
| Total | 0 (0.0%) | 0 (0.0%) |
Race in New Union
The most populous races in New Union are , and White / Caucasian (811 | 100.0%).
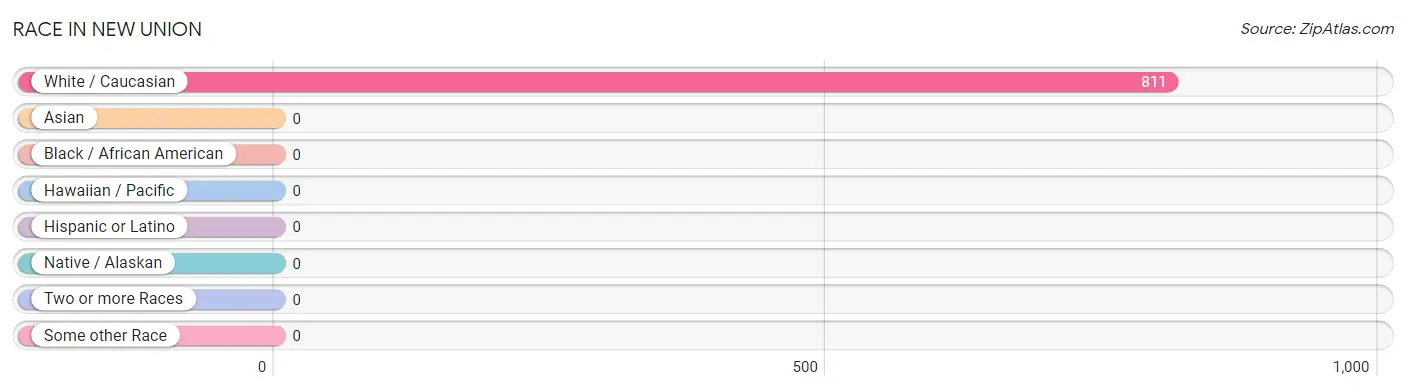
| Race | # Population | % Population |
| Asian | 0 | 0.0% |
| Black / African American | 0 | 0.0% |
| Hawaiian / Pacific | 0 | 0.0% |
| Hispanic or Latino | 0 | 0.0% |
| Native / Alaskan | 0 | 0.0% |
| White / Caucasian | 811 | 100.0% |
| Two or more Races | 0 | 0.0% |
| Some other Race | 0 | 0.0% |
| Total | 811 | 100.0% |
Ancestry in New Union
The most populous ancestries reported in New Union are American (336 | 41.4%), Irish (69 | 8.5%), Scotch-Irish (16 | 2.0%), German (12 | 1.5%), and Polish (12 | 1.5%), together accounting for 54.9% of all New Union residents.
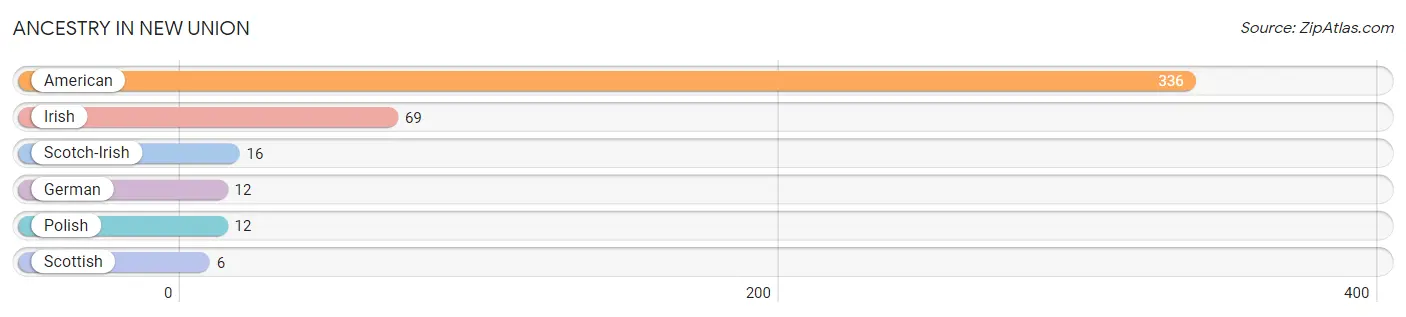
| Ancestry | # Population | % Population |
| American | 336 | 41.4% |
| German | 12 | 1.5% |
| Irish | 69 | 8.5% |
| Polish | 12 | 1.5% |
| Scotch-Irish | 16 | 2.0% |
| Scottish | 6 | 0.7% | View All 6 Rows |
Immigrants in New Union

| Immigration Origin | # Population | % Population | View All 0 Rows |
Sex and Age in New Union
Sex and Age in New Union
The most populous age groups in New Union are Under 5 Years (114 | 24.2%) for men and 50 to 54 Years (71 | 20.9%) for women.
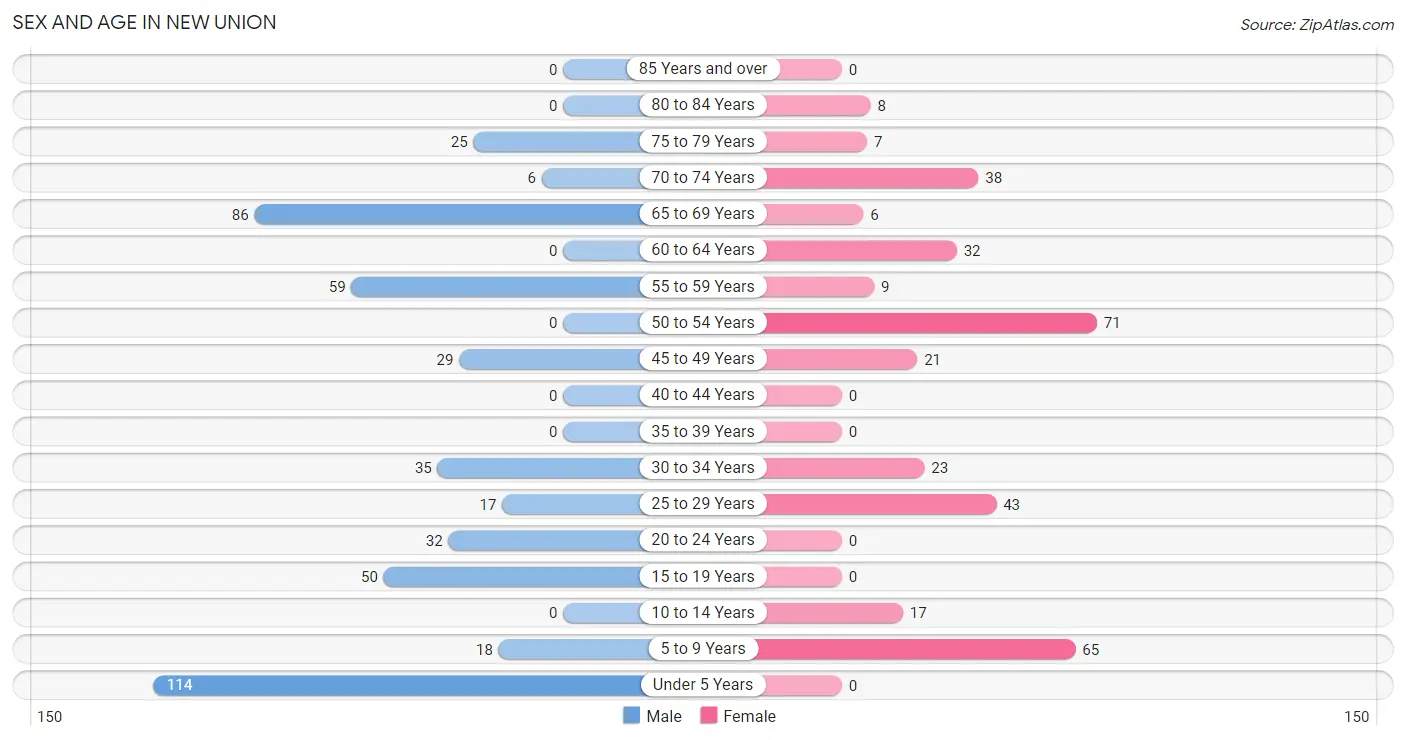
| Age Bracket | Male | Female |
| Under 5 Years | 114 (24.2%) | 0 (0.0%) |
| 5 to 9 Years | 18 (3.8%) | 65 (19.1%) |
| 10 to 14 Years | 0 (0.0%) | 17 (5.0%) |
| 15 to 19 Years | 50 (10.6%) | 0 (0.0%) |
| 20 to 24 Years | 32 (6.8%) | 0 (0.0%) |
| 25 to 29 Years | 17 (3.6%) | 43 (12.7%) |
| 30 to 34 Years | 35 (7.4%) | 23 (6.8%) |
| 35 to 39 Years | 0 (0.0%) | 0 (0.0%) |
| 40 to 44 Years | 0 (0.0%) | 0 (0.0%) |
| 45 to 49 Years | 29 (6.2%) | 21 (6.2%) |
| 50 to 54 Years | 0 (0.0%) | 71 (20.9%) |
| 55 to 59 Years | 59 (12.5%) | 9 (2.6%) |
| 60 to 64 Years | 0 (0.0%) | 32 (9.4%) |
| 65 to 69 Years | 86 (18.3%) | 6 (1.8%) |
| 70 to 74 Years | 6 (1.3%) | 38 (11.2%) |
| 75 to 79 Years | 25 (5.3%) | 7 (2.1%) |
| 80 to 84 Years | 0 (0.0%) | 8 (2.4%) |
| 85 Years and over | 0 (0.0%) | 0 (0.0%) |
| Total | 471 (100.0%) | 340 (100.0%) |
Families and Households in New Union
Median Family Size in New Union
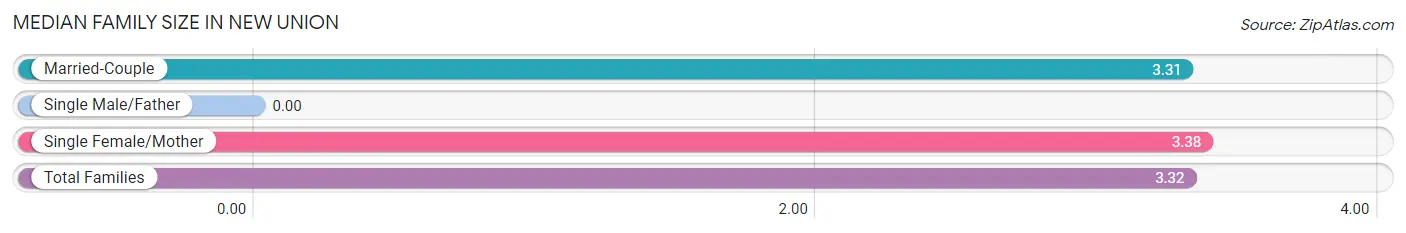
| Family Type | # Families | Family Size |
| Married-Couple | 205 (94.0%) | 3.31 |
| Single Male/Father | 0 (0.0%) | - |
| Single Female/Mother | 13 (6.0%) | 3.38 |
| Total Families | 218 (100.0%) | 3.32 |
Median Household Size in New Union
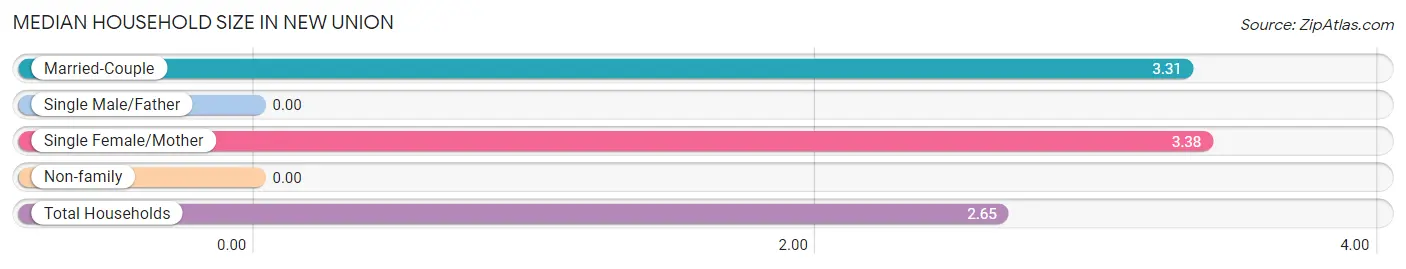
| Household Type | # Households | Household Size |
| Married-Couple | 205 (67.0%) | 3.31 |
| Single Male/Father | 0 (0.0%) | - |
| Single Female/Mother | 13 (4.3%) | 3.38 |
| Non-family | 88 (28.8%) | - |
| Total Households | 306 (100.0%) | 2.65 |
Household Size by Marriage Status in New Union
Out of a total of 306 households in New Union, 218 (71.2%) are family households, while 88 (28.8%) are nonfamily households. The most numerous type of family households are 2-person households, comprising 109, and the most common type of nonfamily households are 1-person households, comprising 88.
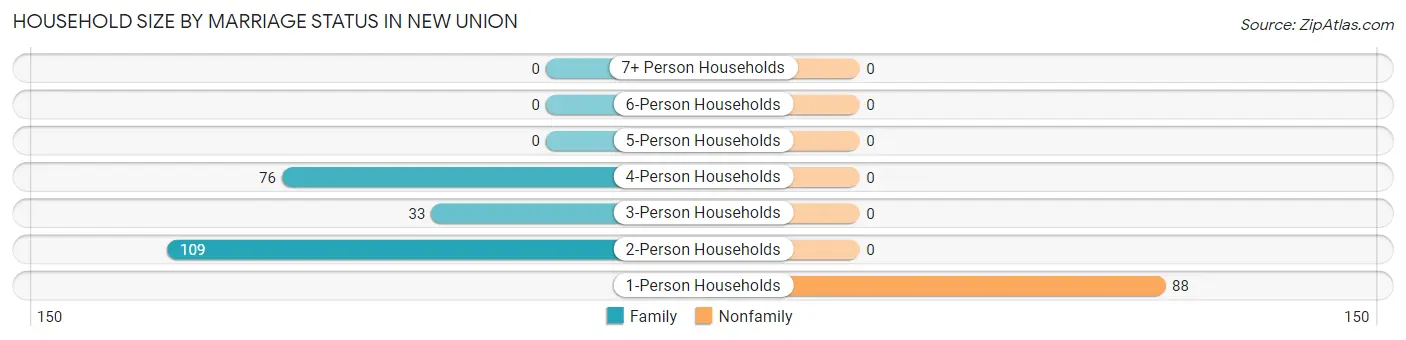
| Household Size | Family Households | Nonfamily Households |
| 1-Person Households | - | 88 (28.8%) |
| 2-Person Households | 109 (35.6%) | 0 (0.0%) |
| 3-Person Households | 33 (10.8%) | 0 (0.0%) |
| 4-Person Households | 76 (24.8%) | 0 (0.0%) |
| 5-Person Households | 0 (0.0%) | 0 (0.0%) |
| 6-Person Households | 0 (0.0%) | 0 (0.0%) |
| 7+ Person Households | 0 (0.0%) | 0 (0.0%) |
| Total | 218 (71.2%) | 88 (28.8%) |
Female Fertility in New Union
Fertility by Age in New Union
Average fertility rate in New Union is 609.0 births per 1,000 women. Women in the age bracket of 20 to 34 years have the highest fertility rate with 803.0 births per 1,000 women. Women in the age bracket of 20 to 34 years acount for 100.0% of all women with births.
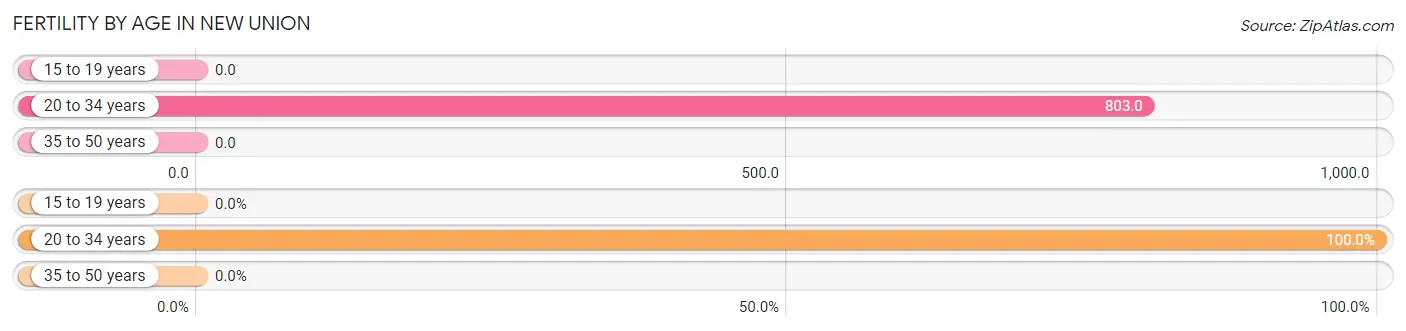
| Age Bracket | Women with Births | Births / 1,000 Women |
| 15 to 19 years | 0 (0.0%) | 0.0 |
| 20 to 34 years | 53 (100.0%) | 803.0 |
| 35 to 50 years | 0 (0.0%) | 0.0 |
| Total | 53 (100.0%) | 609.0 |
Fertility by Age by Marriage Status in New Union
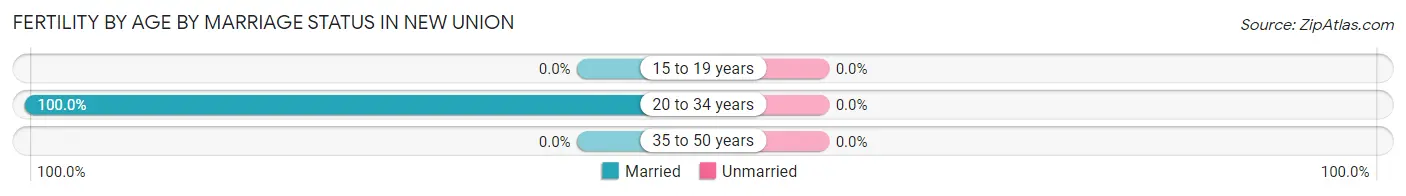
| Age Bracket | Married | Unmarried |
| 15 to 19 years | 0 (0.0%) | 0 (0.0%) |
| 20 to 34 years | 53 (100.0%) | 0 (0.0%) |
| 35 to 50 years | 0 (0.0%) | 0 (0.0%) |
| Total | 53 (100.0%) | 0 (0.0%) |
Fertility by Education in New Union
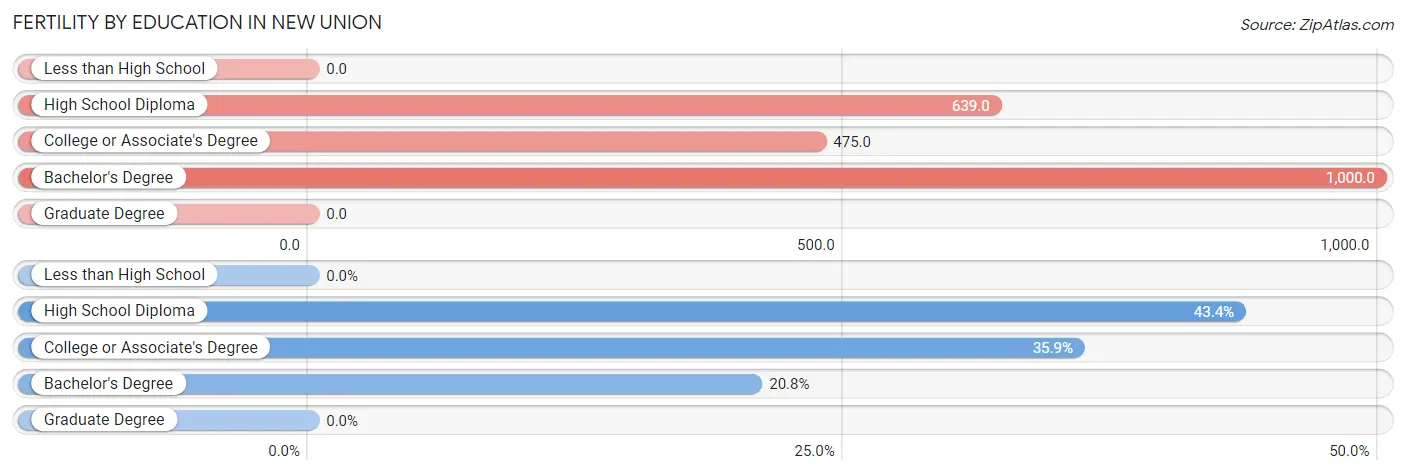
| Educational Attainment | Women with Births | Births / 1,000 Women |
| Less than High School | 0 (0.0%) | 0.0 |
| High School Diploma | 23 (43.4%) | 639.0 |
| College or Associate's Degree | 19 (35.8%) | 475.0 |
| Bachelor's Degree | 11 (20.7%) | 1,000.0 |
| Graduate Degree | 0 (0.0%) | 0.0 |
| Total | 53 (100.0%) | 609.0 |
Fertility by Education by Marriage Status in New Union
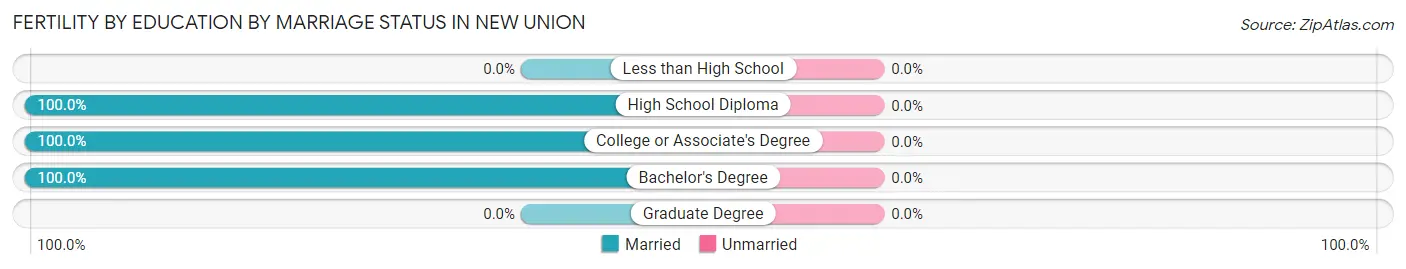
| Educational Attainment | Married | Unmarried |
| Less than High School | 0 (0.0%) | 0 (0.0%) |
| High School Diploma | 23 (100.0%) | 0 (0.0%) |
| College or Associate's Degree | 19 (100.0%) | 0 (0.0%) |
| Bachelor's Degree | 11 (100.0%) | 0 (0.0%) |
| Graduate Degree | 0 (0.0%) | 0 (0.0%) |
| Total | 53 (100.0%) | 0 (0.0%) |
Employment Characteristics in New Union
Employment by Class of Employer in New Union
Among the 360 employed individuals in New Union, private company employees (270 | 75.0%), not-for-profit organizations (55 | 15.3%), and self-employed (not incorporated) (24 | 6.7%) make up the most common classes of employment.
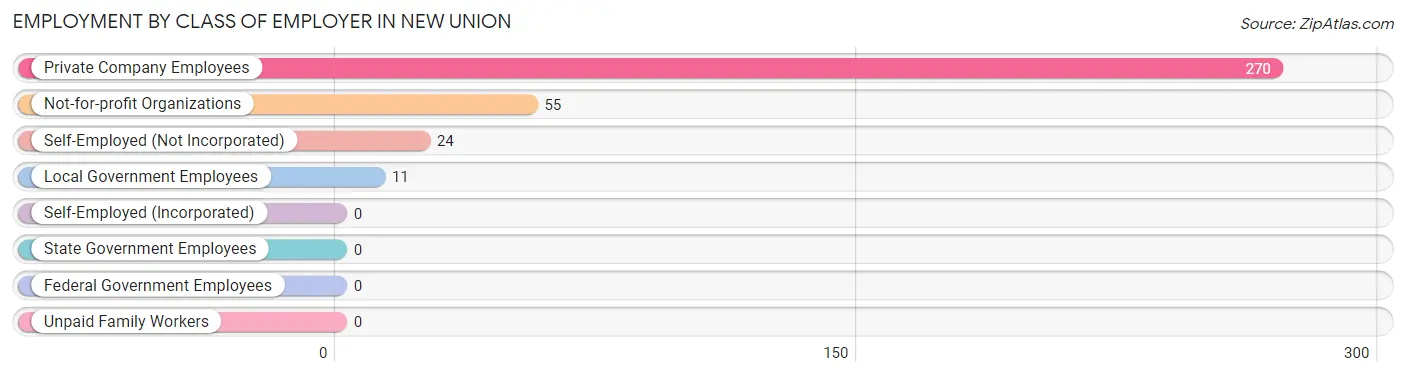
| Employer Class | # Employees | % Employees |
| Private Company Employees | 270 | 75.0% |
| Self-Employed (Incorporated) | 0 | 0.0% |
| Self-Employed (Not Incorporated) | 24 | 6.7% |
| Not-for-profit Organizations | 55 | 15.3% |
| Local Government Employees | 11 | 3.1% |
| State Government Employees | 0 | 0.0% |
| Federal Government Employees | 0 | 0.0% |
| Unpaid Family Workers | 0 | 0.0% |
| Total | 360 | 100.0% |
Employment Status by Age in New Union
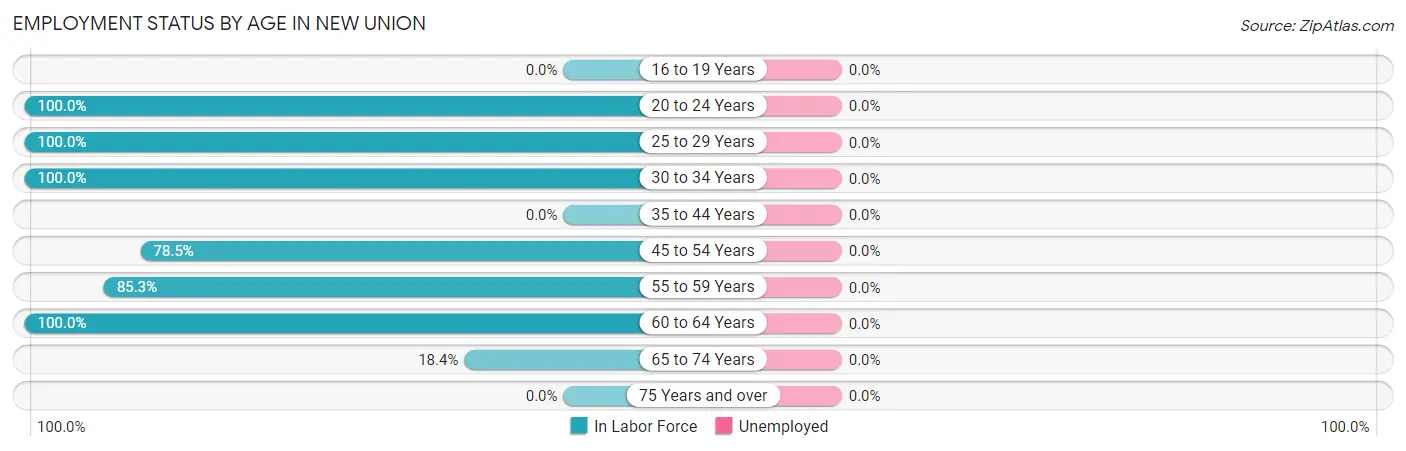
| Age Bracket | In Labor Force | Unemployed |
| 16 to 19 Years | 0 (0.0%) | 0 (0.0%) |
| 20 to 24 Years | 32 (100.0%) | 0 (0.0%) |
| 25 to 29 Years | 60 (100.0%) | 0 (0.0%) |
| 30 to 34 Years | 58 (100.0%) | 0 (0.0%) |
| 35 to 44 Years | 0 (0.0%) | 0 (0.0%) |
| 45 to 54 Years | 95 (78.5%) | 0 (0.0%) |
| 55 to 59 Years | 58 (85.3%) | 0 (0.0%) |
| 60 to 64 Years | 32 (100.0%) | 0 (0.0%) |
| 65 to 74 Years | 25 (18.4%) | 0 (0.0%) |
| 75 Years and over | 0 (0.0%) | 0 (0.0%) |
| Total | 360 (65.8%) | 0 (0.0%) |
Employment Status by Educational Attainment in New Union
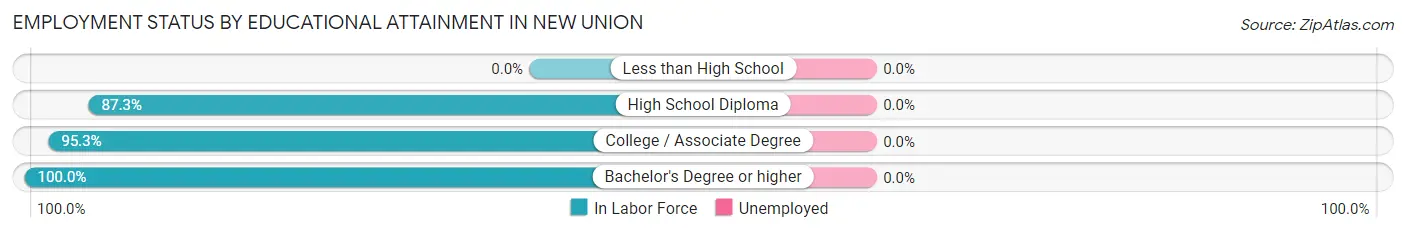
| Educational Attainment | In Labor Force | Unemployed |
| Less than High School | 0 (0.0%) | 0 (0.0%) |
| High School Diploma | 131 (87.3%) | 0 (0.0%) |
| College / Associate Degree | 143 (95.3%) | 0 (0.0%) |
| Bachelor's Degree or higher | 29 (100.0%) | 0 (0.0%) |
| Total | 303 (89.4%) | 0 (0.0%) |
Employment Occupations by Sex in New Union
Management, Business, Science and Arts Occupations
The most common Management, Business, Science and Arts occupations in New Union are Community & Social Service (11 | 3.1%), Education Instruction & Library (11 | 3.1%), and Health Diagnosing & Treating (9 | 2.5%).
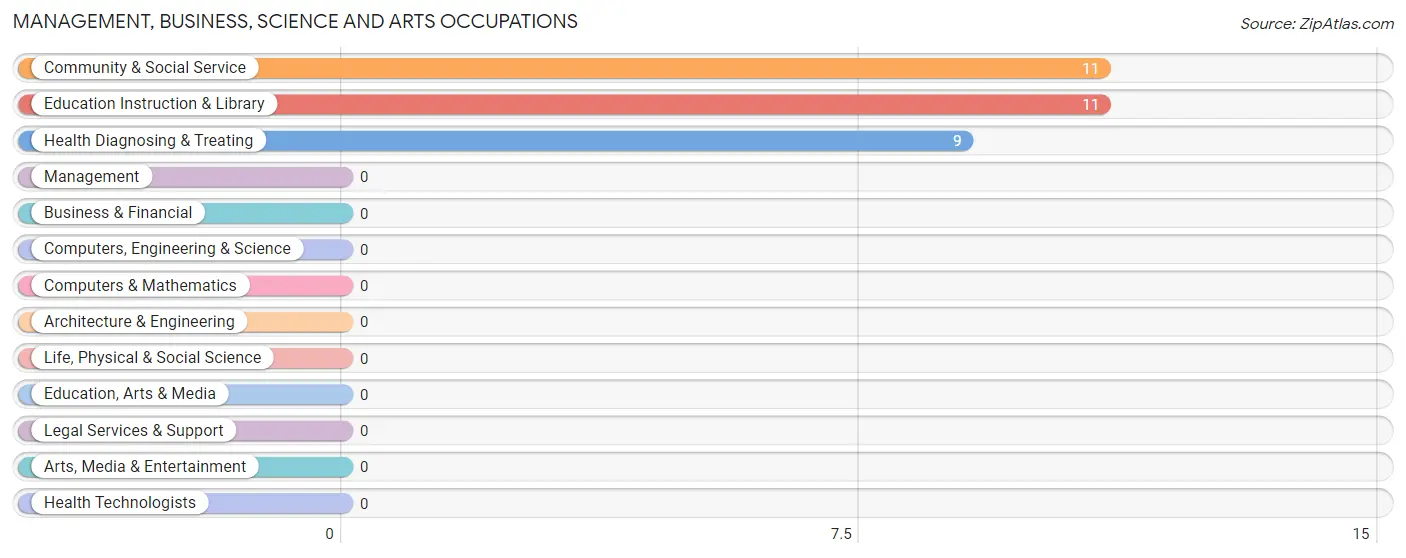
Management, Business, Science and Arts Occupations by Sex
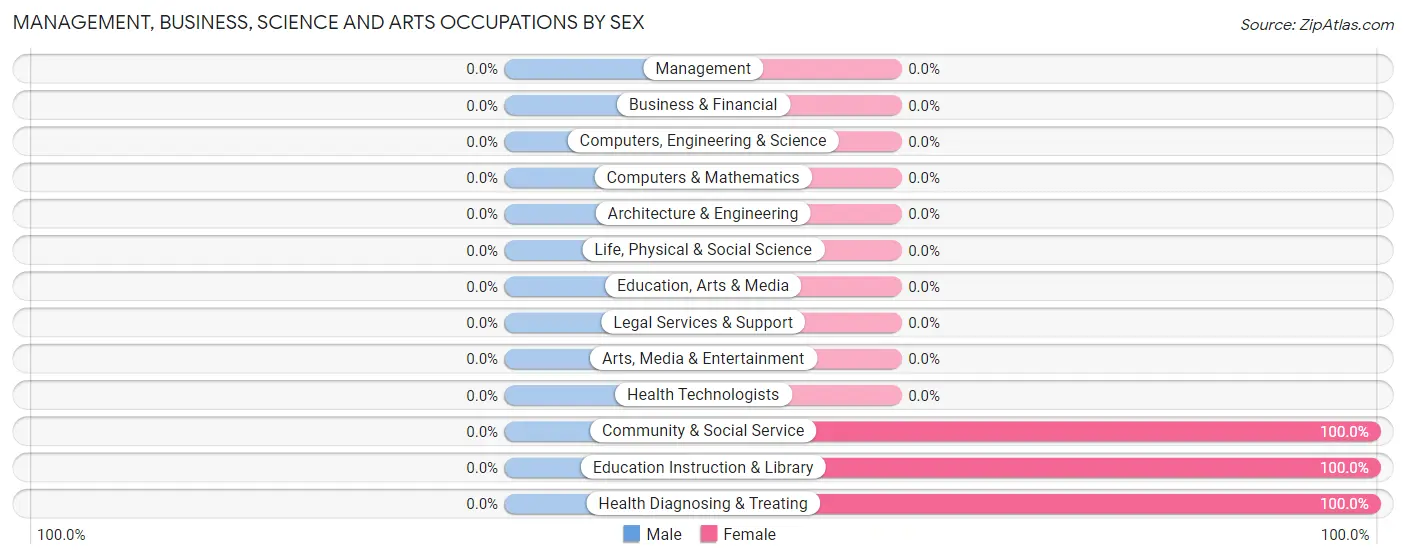
| Occupation | Male | Female |
| Management | 0 (0.0%) | 0 (0.0%) |
| Business & Financial | 0 (0.0%) | 0 (0.0%) |
| Computers, Engineering & Science | 0 (0.0%) | 0 (0.0%) |
| Computers & Mathematics | 0 (0.0%) | 0 (0.0%) |
| Architecture & Engineering | 0 (0.0%) | 0 (0.0%) |
| Life, Physical & Social Science | 0 (0.0%) | 0 (0.0%) |
| Community & Social Service | 0 (0.0%) | 11 (100.0%) |
| Education, Arts & Media | 0 (0.0%) | 0 (0.0%) |
| Legal Services & Support | 0 (0.0%) | 0 (0.0%) |
| Education Instruction & Library | 0 (0.0%) | 11 (100.0%) |
| Arts, Media & Entertainment | 0 (0.0%) | 0 (0.0%) |
| Health Diagnosing & Treating | 0 (0.0%) | 9 (100.0%) |
| Health Technologists | 0 (0.0%) | 0 (0.0%) |
| Total (Category) | 0 (0.0%) | 20 (100.0%) |
| Total (Overall) | 143 (39.7%) | 217 (60.3%) |
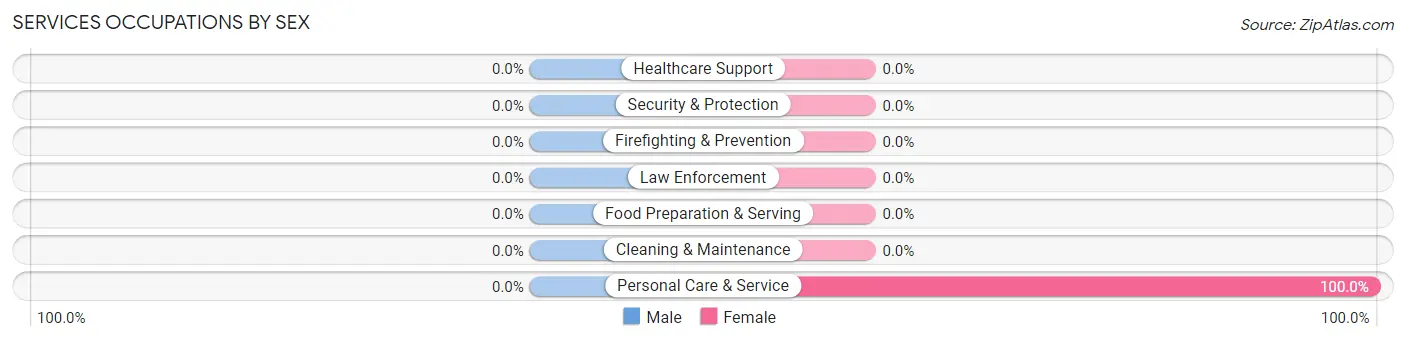
Services Occupations
The most common Services occupations in New Union are , and Personal Care & Service (32 | 8.9%).
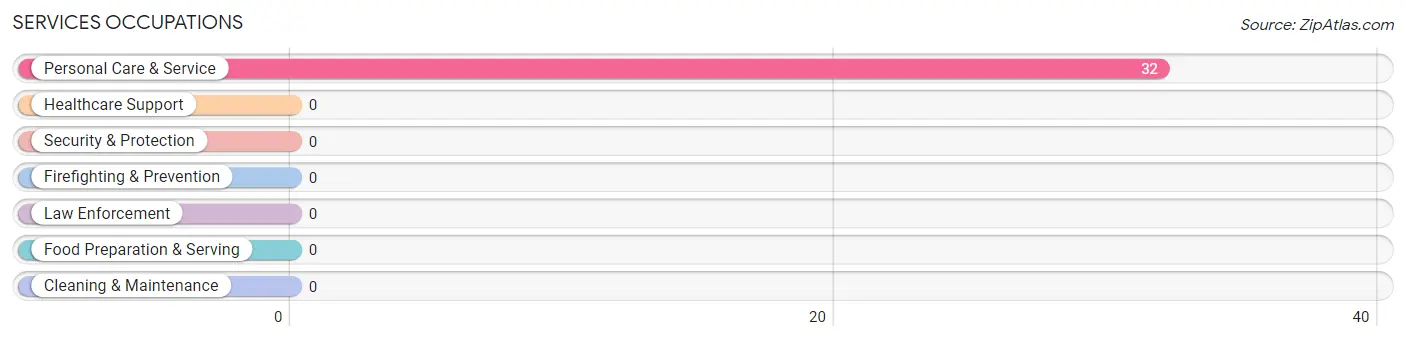
Services Occupations by Sex
| Occupation | Male | Female |
| Healthcare Support | 0 (0.0%) | 0 (0.0%) |
| Security & Protection | 0 (0.0%) | 0 (0.0%) |
| Firefighting & Prevention | 0 (0.0%) | 0 (0.0%) |
| Law Enforcement | 0 (0.0%) | 0 (0.0%) |
| Food Preparation & Serving | 0 (0.0%) | 0 (0.0%) |
| Cleaning & Maintenance | 0 (0.0%) | 0 (0.0%) |
| Personal Care & Service | 0 (0.0%) | 32 (100.0%) |
| Total (Category) | 0 (0.0%) | 32 (100.0%) |
| Total (Overall) | 143 (39.7%) | 217 (60.3%) |
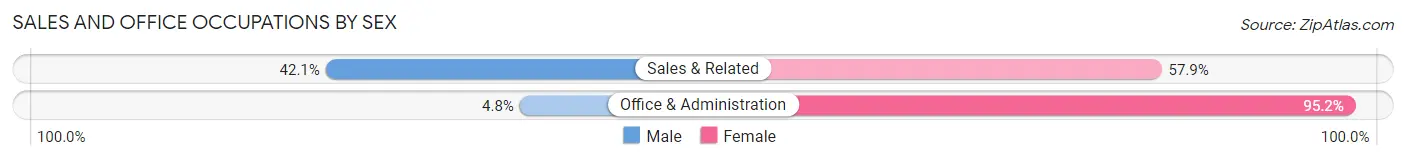
Sales and Office Occupations
The most common Sales and Office occupations in New Union are Office & Administration (125 | 34.7%), and Sales & Related (57 | 15.8%).
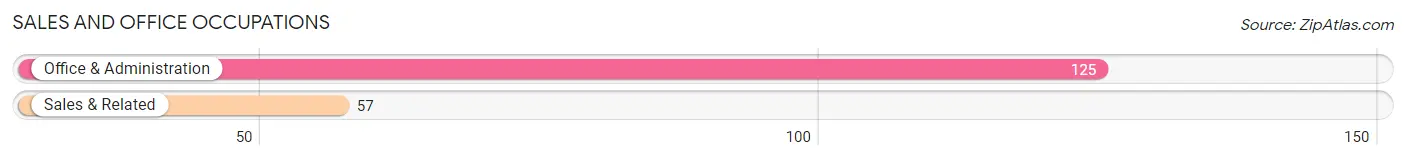
Sales and Office Occupations by Sex
| Occupation | Male | Female |
| Sales & Related | 24 (42.1%) | 33 (57.9%) |
| Office & Administration | 6 (4.8%) | 119 (95.2%) |
| Total (Category) | 30 (16.5%) | 152 (83.5%) |
| Total (Overall) | 143 (39.7%) | 217 (60.3%) |
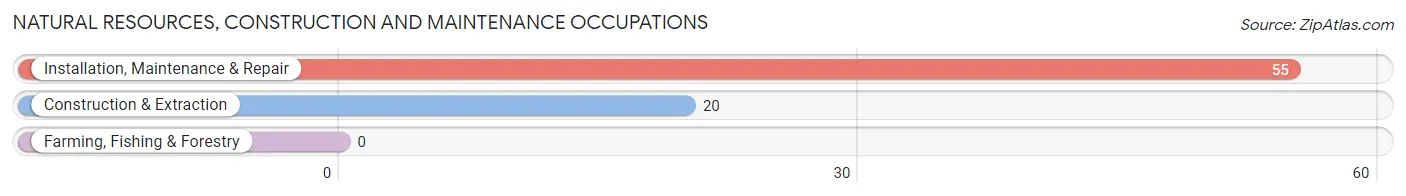
Natural Resources, Construction and Maintenance Occupations
The most common Natural Resources, Construction and Maintenance occupations in New Union are Installation, Maintenance & Repair (55 | 15.3%), and Construction & Extraction (20 | 5.6%).
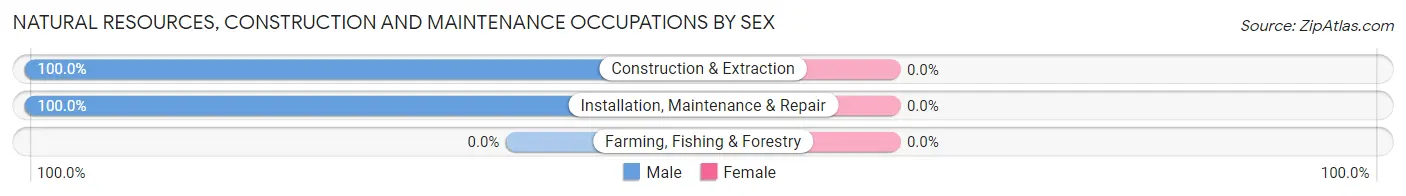
Natural Resources, Construction and Maintenance Occupations by Sex
| Occupation | Male | Female |
| Farming, Fishing & Forestry | 0 (0.0%) | 0 (0.0%) |
| Construction & Extraction | 20 (100.0%) | 0 (0.0%) |
| Installation, Maintenance & Repair | 55 (100.0%) | 0 (0.0%) |
| Total (Category) | 75 (100.0%) | 0 (0.0%) |
| Total (Overall) | 143 (39.7%) | 217 (60.3%) |
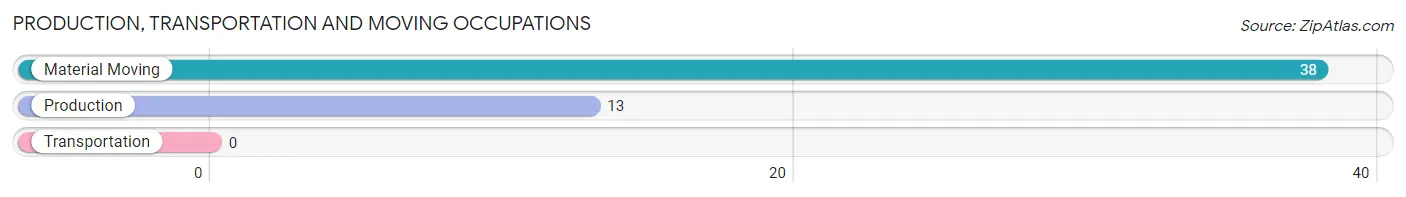
Production, Transportation and Moving Occupations
The most common Production, Transportation and Moving occupations in New Union are Material Moving (38 | 10.6%), and Production (13 | 3.6%).
Production, Transportation and Moving Occupations by Sex
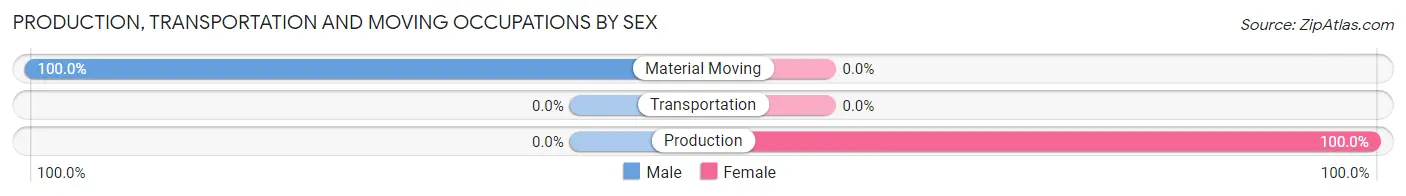
| Occupation | Male | Female |
| Production | 0 (0.0%) | 13 (100.0%) |
| Transportation | 0 (0.0%) | 0 (0.0%) |
| Material Moving | 38 (100.0%) | 0 (0.0%) |
| Total (Category) | 38 (74.5%) | 13 (25.5%) |
| Total (Overall) | 143 (39.7%) | 217 (60.3%) |
Employment Industries by Sex in New Union
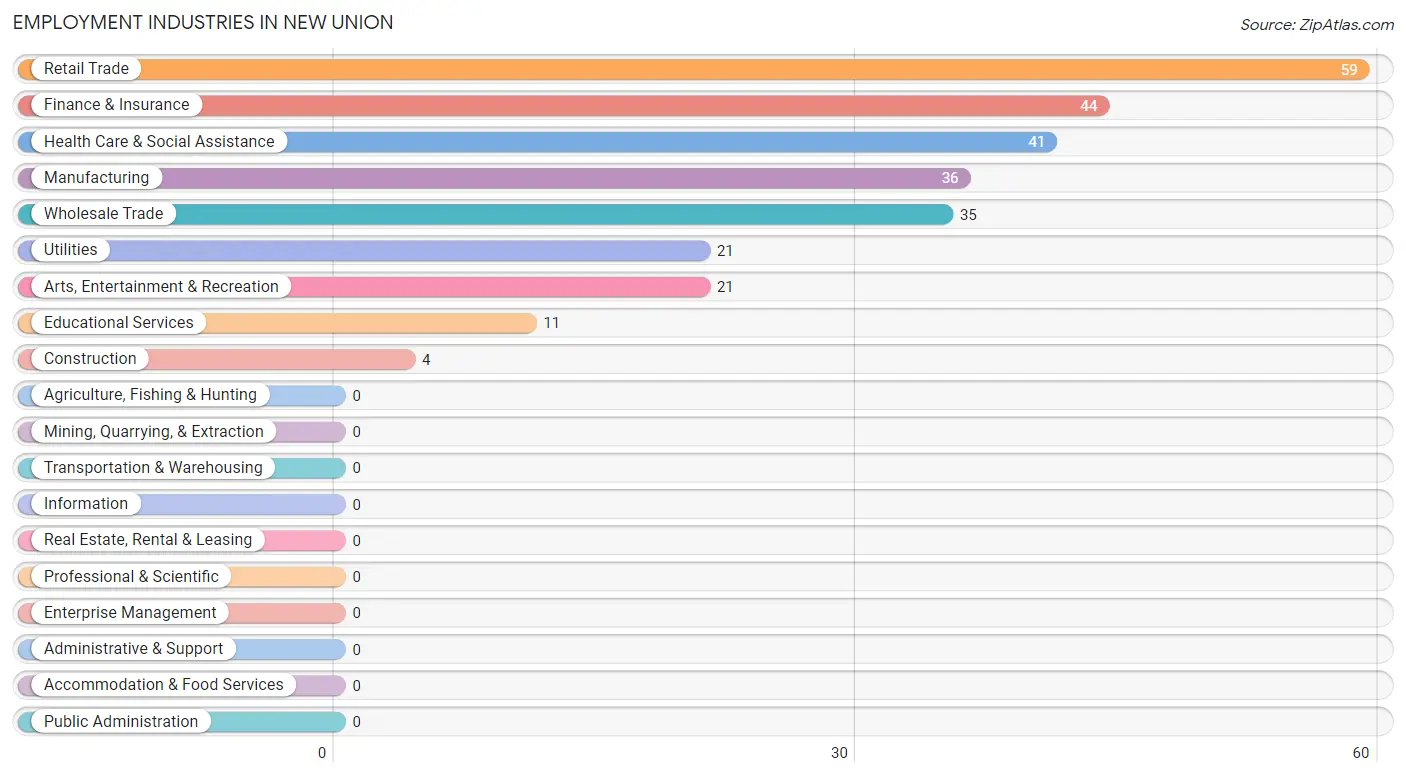
Employment Industries in New Union
The major employment industries in New Union include Retail Trade (59 | 16.4%), Finance & Insurance (44 | 12.2%), Health Care & Social Assistance (41 | 11.4%), Manufacturing (36 | 10.0%), and Wholesale Trade (35 | 9.7%).
Employment Industries by Sex in New Union
The New Union industries that see more men than women are Construction (100.0%), Wholesale Trade (100.0%), and Utilities (100.0%), whereas the industries that tend to have a higher number of women are Finance & Insurance (100.0%), Educational Services (100.0%), and Health Care & Social Assistance (100.0%).
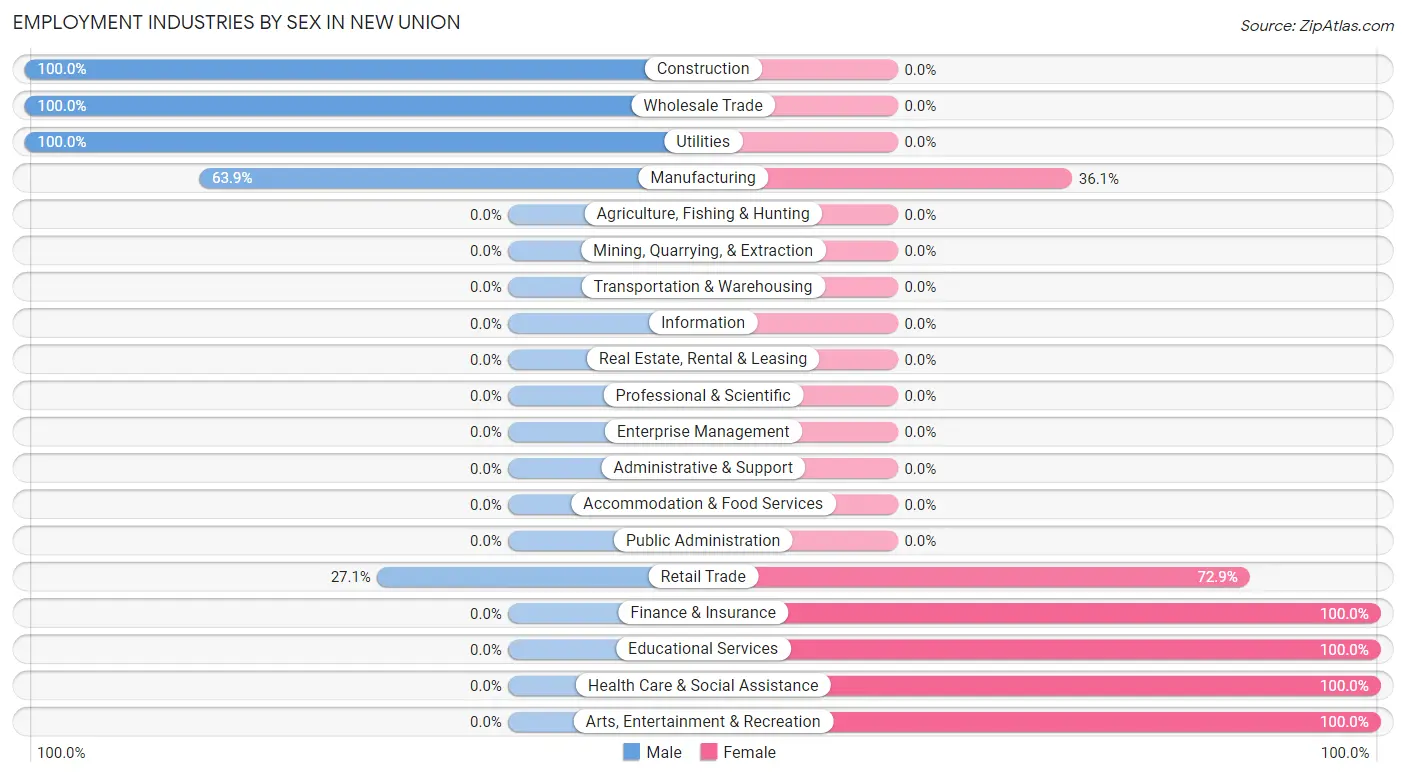
| Industry | Male | Female |
| Agriculture, Fishing & Hunting | 0 (0.0%) | 0 (0.0%) |
| Mining, Quarrying, & Extraction | 0 (0.0%) | 0 (0.0%) |
| Construction | 4 (100.0%) | 0 (0.0%) |
| Manufacturing | 23 (63.9%) | 13 (36.1%) |
| Wholesale Trade | 35 (100.0%) | 0 (0.0%) |
| Retail Trade | 16 (27.1%) | 43 (72.9%) |
| Transportation & Warehousing | 0 (0.0%) | 0 (0.0%) |
| Utilities | 21 (100.0%) | 0 (0.0%) |
| Information | 0 (0.0%) | 0 (0.0%) |
| Finance & Insurance | 0 (0.0%) | 44 (100.0%) |
| Real Estate, Rental & Leasing | 0 (0.0%) | 0 (0.0%) |
| Professional & Scientific | 0 (0.0%) | 0 (0.0%) |
| Enterprise Management | 0 (0.0%) | 0 (0.0%) |
| Administrative & Support | 0 (0.0%) | 0 (0.0%) |
| Educational Services | 0 (0.0%) | 11 (100.0%) |
| Health Care & Social Assistance | 0 (0.0%) | 41 (100.0%) |
| Arts, Entertainment & Recreation | 0 (0.0%) | 21 (100.0%) |
| Accommodation & Food Services | 0 (0.0%) | 0 (0.0%) |
| Public Administration | 0 (0.0%) | 0 (0.0%) |
| Total | 143 (39.7%) | 217 (60.3%) |
Education in New Union
School Enrollment in New Union
The most common levels of schooling among the 142 students in New Union are high school (67 | 47.2%), elementary school (45 | 31.7%), and kindergarten (18 | 12.7%).
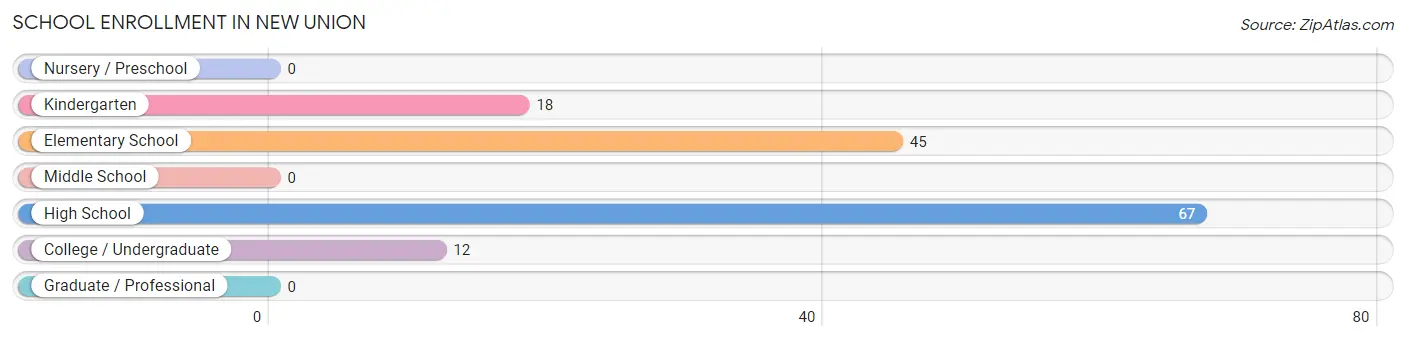
| School Level | # Students | % Students |
| Nursery / Preschool | 0 | 0.0% |
| Kindergarten | 18 | 12.7% |
| Elementary School | 45 | 31.7% |
| Middle School | 0 | 0.0% |
| High School | 67 | 47.2% |
| College / Undergraduate | 12 | 8.5% |
| Graduate / Professional | 0 | 0.0% |
| Total | 142 | 100.0% |
School Enrollment by Age by Funding Source in New Union
Out of a total of 142 students who are enrolled in schools in New Union, 12 (8.5%) attend a private institution, while the remaining 130 (91.5%) are enrolled in public schools. The age group of 35 years and over has the highest likelihood of being enrolled in private schools, with 12 (100.0% in the age bracket) enrolled. Conversely, the age group of 5 to 9 year old has the lowest likelihood of being enrolled in a private school, with 63 (100.0% in the age bracket) attending a public institution.
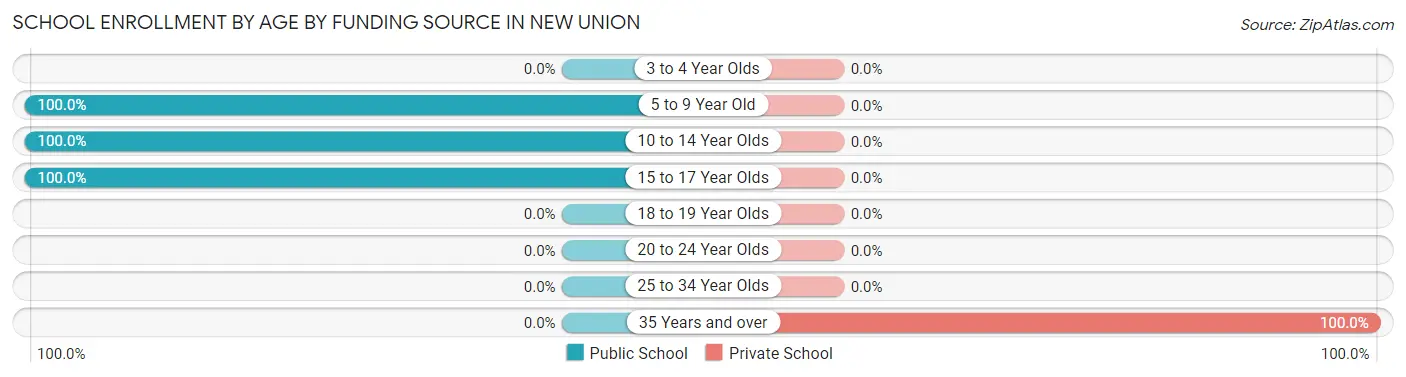
| Age Bracket | Public School | Private School |
| 3 to 4 Year Olds | 0 (0.0%) | 0 (0.0%) |
| 5 to 9 Year Old | 63 (100.0%) | 0 (0.0%) |
| 10 to 14 Year Olds | 17 (100.0%) | 0 (0.0%) |
| 15 to 17 Year Olds | 50 (100.0%) | 0 (0.0%) |
| 18 to 19 Year Olds | 0 (0.0%) | 0 (0.0%) |
| 20 to 24 Year Olds | 0 (0.0%) | 0 (0.0%) |
| 25 to 34 Year Olds | 0 (0.0%) | 0 (0.0%) |
| 35 Years and over | 0 (0.0%) | 12 (100.0%) |
| Total | 130 (91.5%) | 12 (8.5%) |
Educational Attainment by Field of Study in New Union
Bio, nature & agricultural (12 | 41.4%), education (11 | 37.9%), and business (6 | 20.7%) are the most common fields of study among 29 individuals in New Union who have obtained a bachelor's degree or higher.
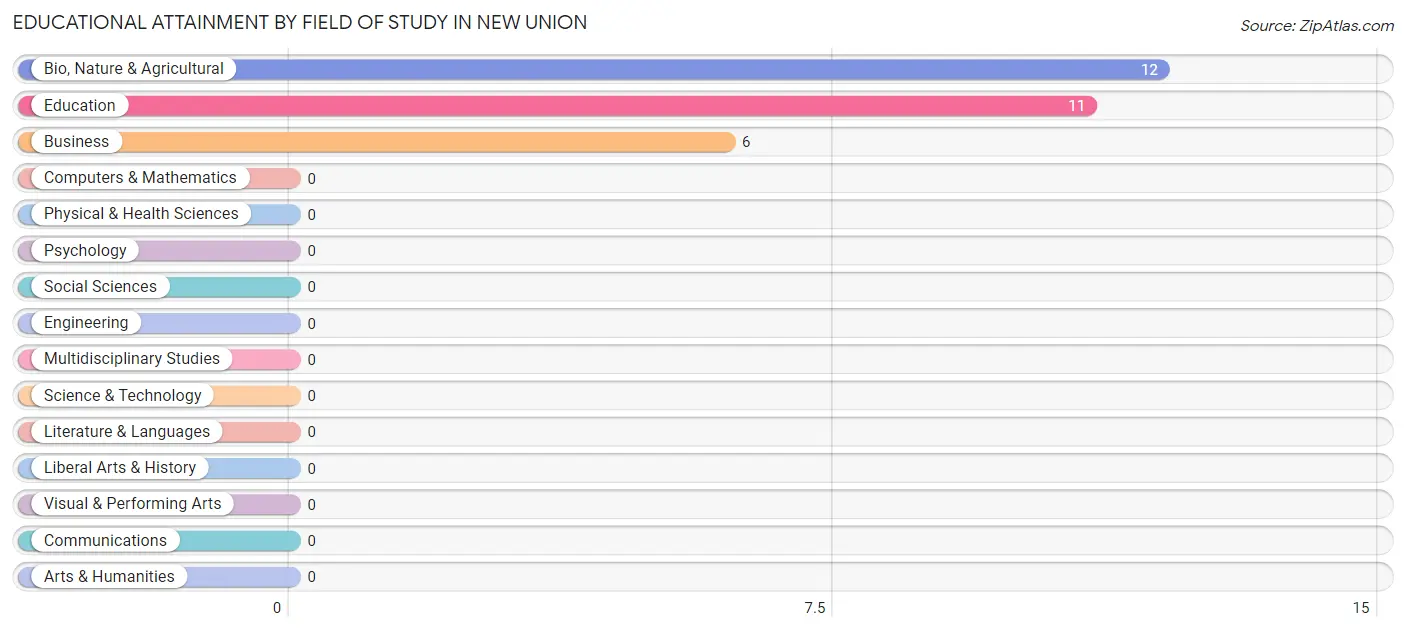
| Field of Study | # Graduates | % Graduates |
| Computers & Mathematics | 0 | 0.0% |
| Bio, Nature & Agricultural | 12 | 41.4% |
| Physical & Health Sciences | 0 | 0.0% |
| Psychology | 0 | 0.0% |
| Social Sciences | 0 | 0.0% |
| Engineering | 0 | 0.0% |
| Multidisciplinary Studies | 0 | 0.0% |
| Science & Technology | 0 | 0.0% |
| Business | 6 | 20.7% |
| Education | 11 | 37.9% |
| Literature & Languages | 0 | 0.0% |
| Liberal Arts & History | 0 | 0.0% |
| Visual & Performing Arts | 0 | 0.0% |
| Communications | 0 | 0.0% |
| Arts & Humanities | 0 | 0.0% |
| Total | 29 | 100.0% |
Transportation & Commute in New Union
Vehicle Availability by Sex in New Union
The most prevalent vehicle ownership categories in New Union are males with 3 vehicles (88, accounting for 61.5%) and females with 3 vehicles (106, making up 40.6%).
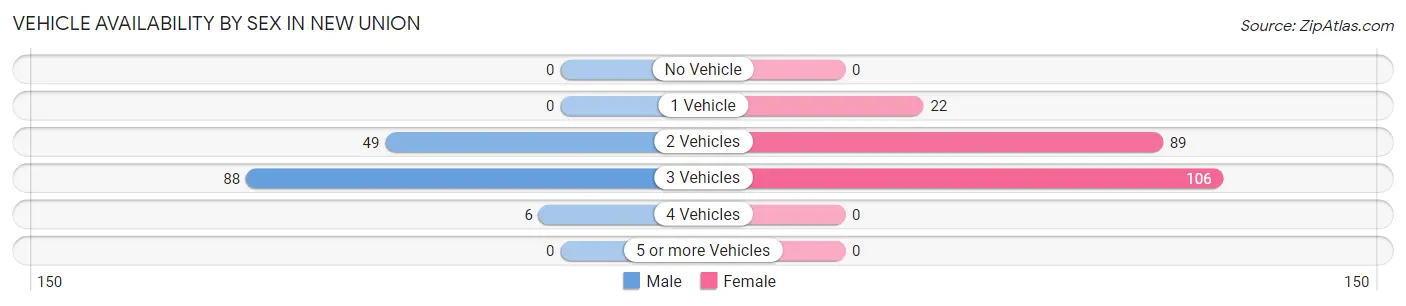
| Vehicles Available | Male | Female |
| No Vehicle | 0 (0.0%) | 0 (0.0%) |
| 1 Vehicle | 0 (0.0%) | 22 (10.1%) |
| 2 Vehicles | 49 (34.3%) | 89 (41.0%) |
| 3 Vehicles | 88 (61.5%) | 106 (48.8%) |
| 4 Vehicles | 6 (4.2%) | 0 (0.0%) |
| 5 or more Vehicles | 0 (0.0%) | 0 (0.0%) |
| Total | 143 (100.0%) | 217 (100.0%) |
Commute Time in New Union
The most frequently occuring commute durations in New Union are 15 to 19 minutes (79 commuters, 21.9%), 10 to 14 minutes (64 commuters, 17.8%), and 45 to 59 minutes (58 commuters, 16.1%).
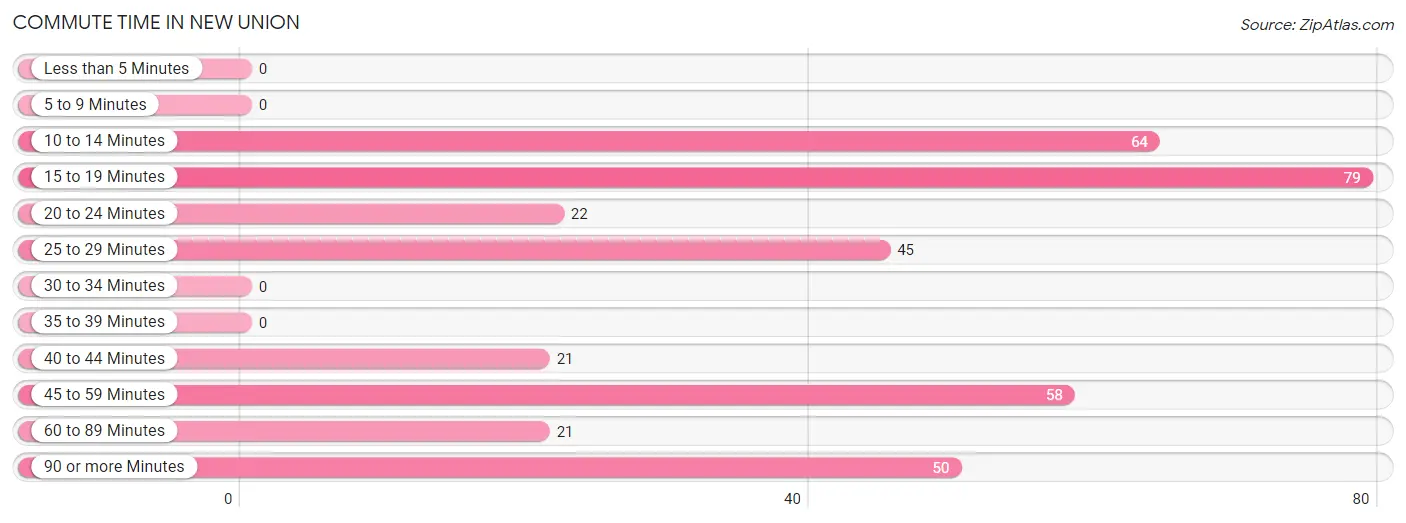
| Commute Time | # Commuters | % Commuters |
| Less than 5 Minutes | 0 | 0.0% |
| 5 to 9 Minutes | 0 | 0.0% |
| 10 to 14 Minutes | 64 | 17.8% |
| 15 to 19 Minutes | 79 | 21.9% |
| 20 to 24 Minutes | 22 | 6.1% |
| 25 to 29 Minutes | 45 | 12.5% |
| 30 to 34 Minutes | 0 | 0.0% |
| 35 to 39 Minutes | 0 | 0.0% |
| 40 to 44 Minutes | 21 | 5.8% |
| 45 to 59 Minutes | 58 | 16.1% |
| 60 to 89 Minutes | 21 | 5.8% |
| 90 or more Minutes | 50 | 13.9% |
Commute Time by Sex in New Union
The most common commute times in New Union are 15 to 19 minutes (48 commuters, 33.6%) for males and 10 to 14 minutes (64 commuters, 29.5%) for females.
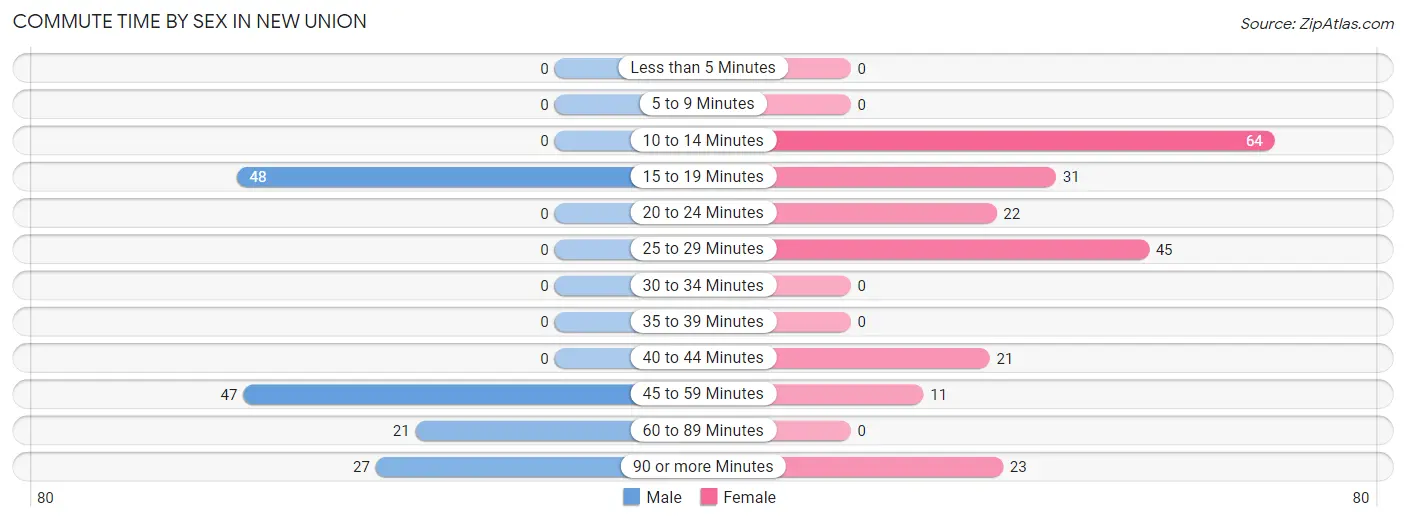
| Commute Time | Male | Female |
| Less than 5 Minutes | 0 (0.0%) | 0 (0.0%) |
| 5 to 9 Minutes | 0 (0.0%) | 0 (0.0%) |
| 10 to 14 Minutes | 0 (0.0%) | 64 (29.5%) |
| 15 to 19 Minutes | 48 (33.6%) | 31 (14.3%) |
| 20 to 24 Minutes | 0 (0.0%) | 22 (10.1%) |
| 25 to 29 Minutes | 0 (0.0%) | 45 (20.7%) |
| 30 to 34 Minutes | 0 (0.0%) | 0 (0.0%) |
| 35 to 39 Minutes | 0 (0.0%) | 0 (0.0%) |
| 40 to 44 Minutes | 0 (0.0%) | 21 (9.7%) |
| 45 to 59 Minutes | 47 (32.9%) | 11 (5.1%) |
| 60 to 89 Minutes | 21 (14.7%) | 0 (0.0%) |
| 90 or more Minutes | 27 (18.9%) | 23 (10.6%) |
Time of Departure to Work by Sex in New Union
The most frequent times of departure to work in New Union are 6:30 AM to 6:59 AM (32, 22.4%) for males and 6:30 AM to 6:59 AM (86, 39.6%) for females.
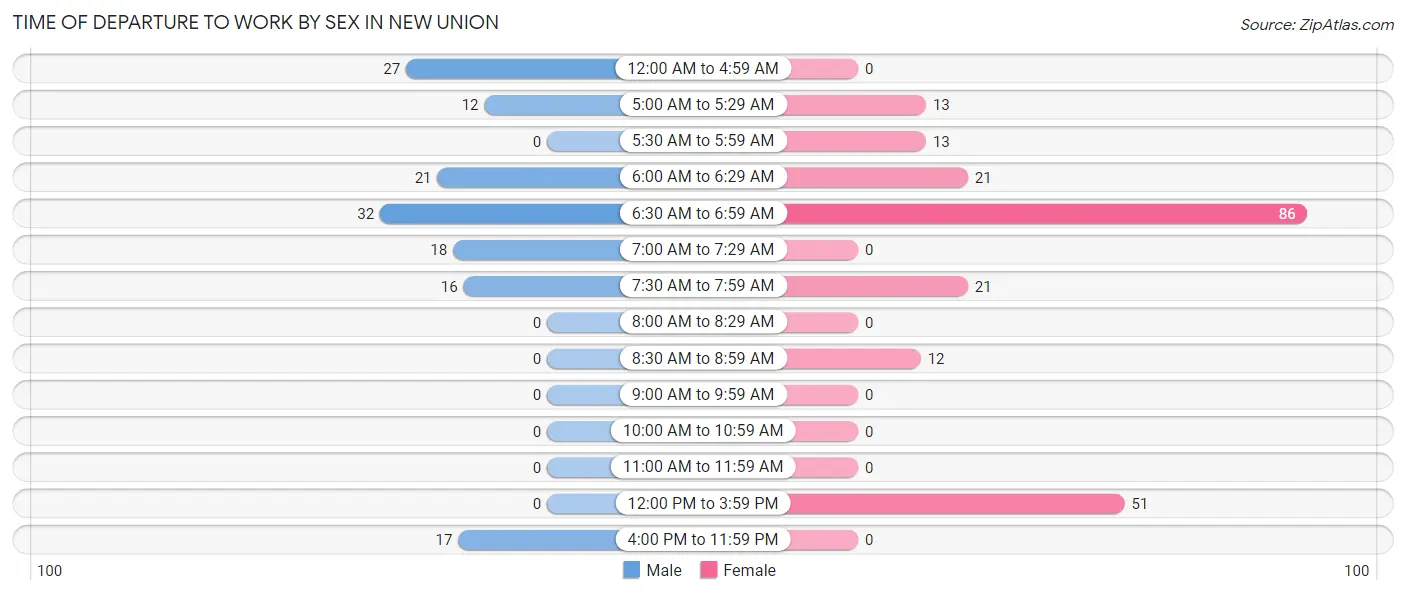
| Time of Departure | Male | Female |
| 12:00 AM to 4:59 AM | 27 (18.9%) | 0 (0.0%) |
| 5:00 AM to 5:29 AM | 12 (8.4%) | 13 (6.0%) |
| 5:30 AM to 5:59 AM | 0 (0.0%) | 13 (6.0%) |
| 6:00 AM to 6:29 AM | 21 (14.7%) | 21 (9.7%) |
| 6:30 AM to 6:59 AM | 32 (22.4%) | 86 (39.6%) |
| 7:00 AM to 7:29 AM | 18 (12.6%) | 0 (0.0%) |
| 7:30 AM to 7:59 AM | 16 (11.2%) | 21 (9.7%) |
| 8:00 AM to 8:29 AM | 0 (0.0%) | 0 (0.0%) |
| 8:30 AM to 8:59 AM | 0 (0.0%) | 12 (5.5%) |
| 9:00 AM to 9:59 AM | 0 (0.0%) | 0 (0.0%) |
| 10:00 AM to 10:59 AM | 0 (0.0%) | 0 (0.0%) |
| 11:00 AM to 11:59 AM | 0 (0.0%) | 0 (0.0%) |
| 12:00 PM to 3:59 PM | 0 (0.0%) | 51 (23.5%) |
| 4:00 PM to 11:59 PM | 17 (11.9%) | 0 (0.0%) |
| Total | 143 (100.0%) | 217 (100.0%) |
Housing Occupancy in New Union
Occupancy by Ownership in New Union
Of the total 306 dwellings in New Union, owner-occupied units account for 273 (89.2%), while renter-occupied units make up 33 (10.8%).
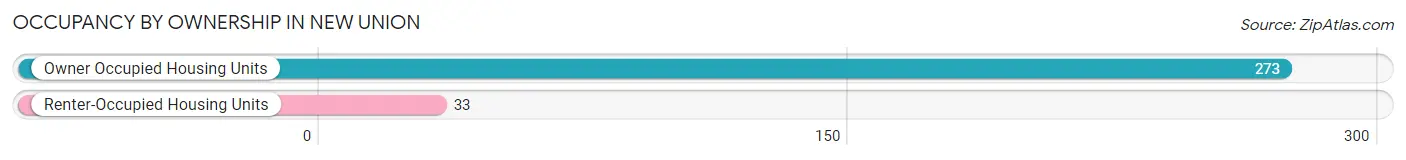
| Occupancy | # Housing Units | % Housing Units |
| Owner Occupied Housing Units | 273 | 89.2% |
| Renter-Occupied Housing Units | 33 | 10.8% |
| Total Occupied Housing Units | 306 | 100.0% |
Occupancy by Household Size in New Union
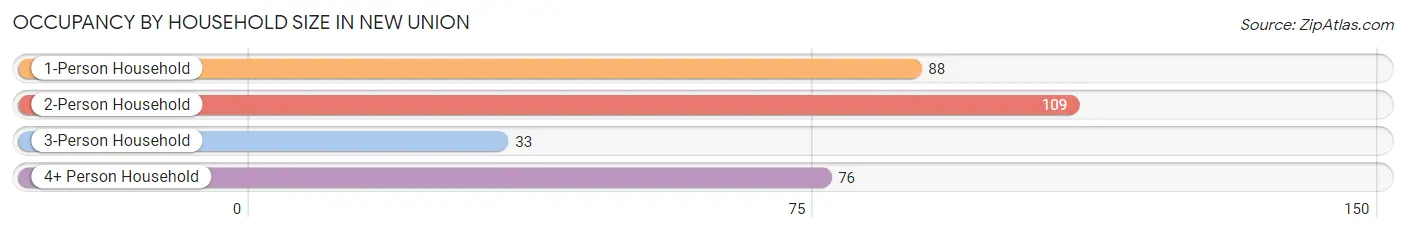
| Household Size | # Housing Units | % Housing Units |
| 1-Person Household | 88 | 28.8% |
| 2-Person Household | 109 | 35.6% |
| 3-Person Household | 33 | 10.8% |
| 4+ Person Household | 76 | 24.8% |
| Total Housing Units | 306 | 100.0% |
Occupancy by Ownership by Household Size in New Union
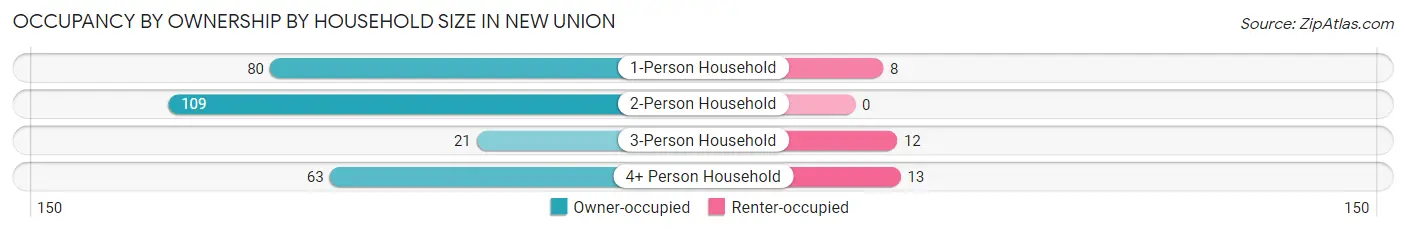
| Household Size | Owner-occupied | Renter-occupied |
| 1-Person Household | 80 (90.9%) | 8 (9.1%) |
| 2-Person Household | 109 (100.0%) | 0 (0.0%) |
| 3-Person Household | 21 (63.6%) | 12 (36.4%) |
| 4+ Person Household | 63 (82.9%) | 13 (17.1%) |
| Total Housing Units | 273 (89.2%) | 33 (10.8%) |
Occupancy by Educational Attainment in New Union
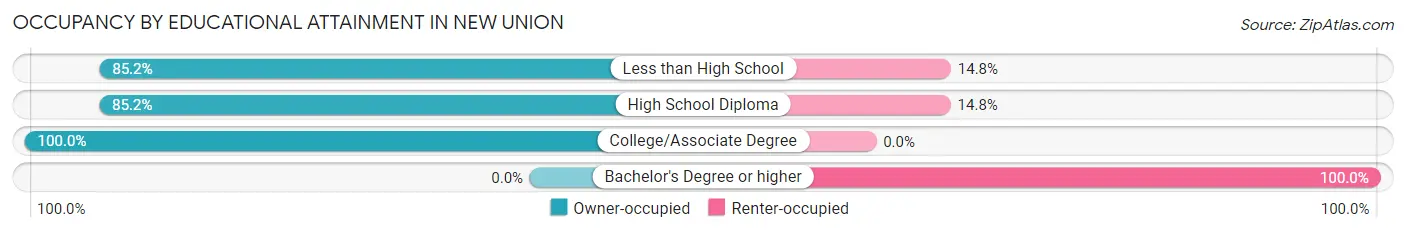
| Household Size | Owner-occupied | Renter-occupied |
| Less than High School | 46 (85.2%) | 8 (14.8%) |
| High School Diploma | 75 (85.2%) | 13 (14.8%) |
| College/Associate Degree | 152 (100.0%) | 0 (0.0%) |
| Bachelor's Degree or higher | 0 (0.0%) | 12 (100.0%) |
Occupancy by Age of Householder in New Union
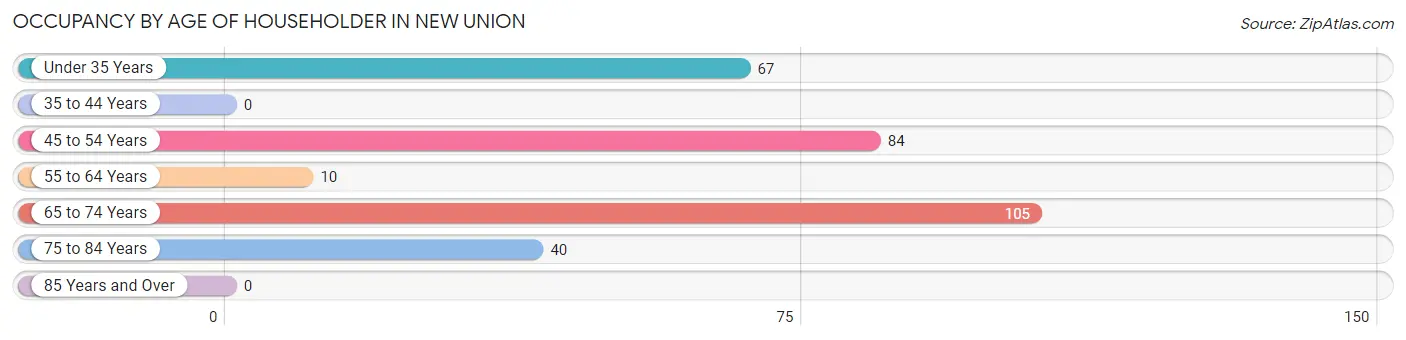
| Age Bracket | # Households | % Households |
| Under 35 Years | 67 | 21.9% |
| 35 to 44 Years | 0 | 0.0% |
| 45 to 54 Years | 84 | 27.5% |
| 55 to 64 Years | 10 | 3.3% |
| 65 to 74 Years | 105 | 34.3% |
| 75 to 84 Years | 40 | 13.1% |
| 85 Years and Over | 0 | 0.0% |
| Total | 306 | 100.0% |
Housing Finances in New Union
Median Income by Occupancy in New Union
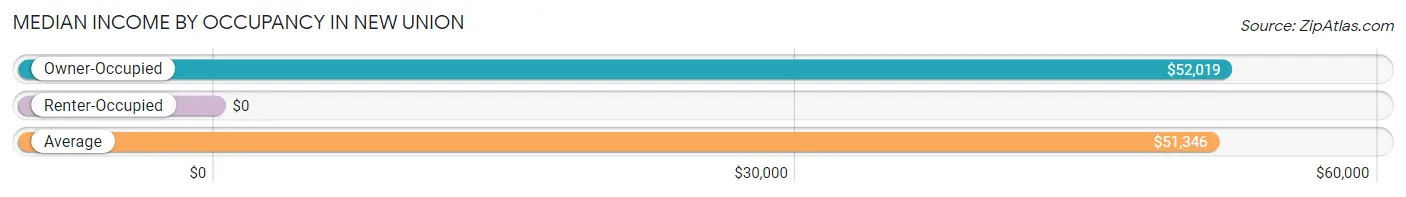
| Occupancy Type | # Households | Median Income |
| Owner-Occupied | 273 (89.2%) | $52,019 |
| Renter-Occupied | 33 (10.8%) | $0 |
| Average | 306 (100.0%) | $51,346 |
Occupancy by Householder Income Bracket in New Union
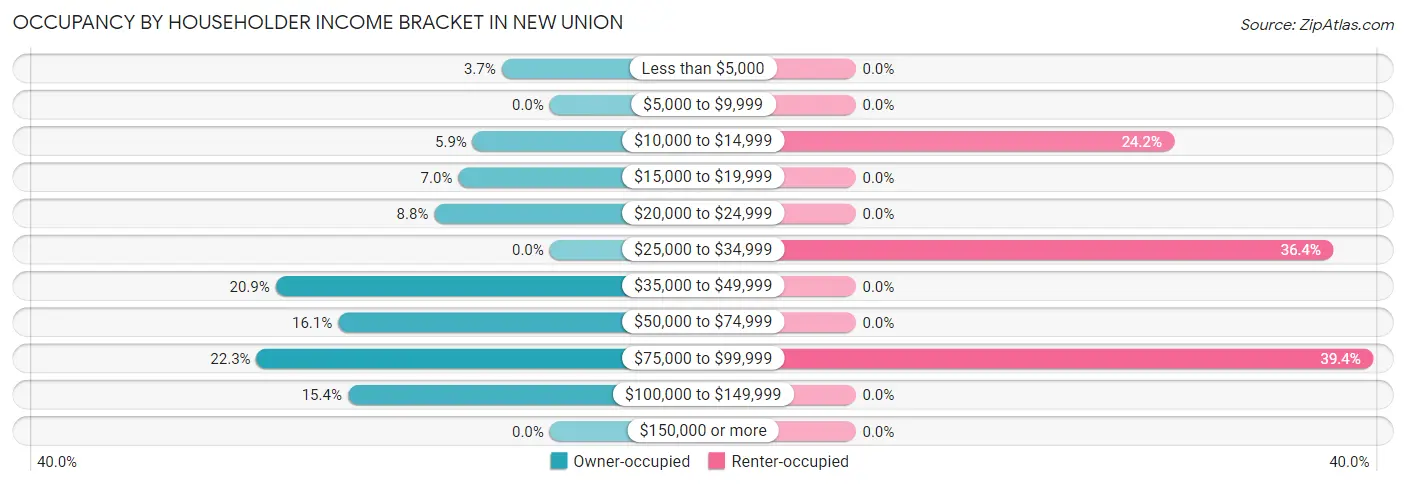
| Income Bracket | Owner-occupied | Renter-occupied |
| Less than $5,000 | 10 (3.7%) | 0 (0.0%) |
| $5,000 to $9,999 | 0 (0.0%) | 0 (0.0%) |
| $10,000 to $14,999 | 16 (5.9%) | 8 (24.2%) |
| $15,000 to $19,999 | 19 (7.0%) | 0 (0.0%) |
| $20,000 to $24,999 | 24 (8.8%) | 0 (0.0%) |
| $25,000 to $34,999 | 0 (0.0%) | 12 (36.4%) |
| $35,000 to $49,999 | 57 (20.9%) | 0 (0.0%) |
| $50,000 to $74,999 | 44 (16.1%) | 0 (0.0%) |
| $75,000 to $99,999 | 61 (22.3%) | 13 (39.4%) |
| $100,000 to $149,999 | 42 (15.4%) | 0 (0.0%) |
| $150,000 or more | 0 (0.0%) | 0 (0.0%) |
| Total | 273 (100.0%) | 33 (100.0%) |
Monthly Housing Cost Tiers in New Union
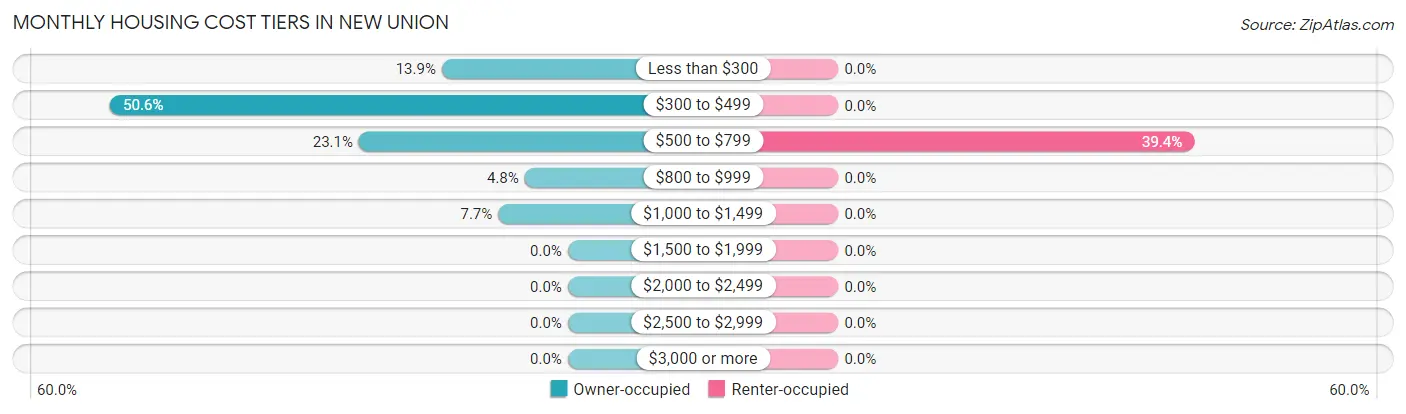
| Monthly Cost | Owner-occupied | Renter-occupied |
| Less than $300 | 38 (13.9%) | 0 (0.0%) |
| $300 to $499 | 138 (50.5%) | 0 (0.0%) |
| $500 to $799 | 63 (23.1%) | 13 (39.4%) |
| $800 to $999 | 13 (4.8%) | 0 (0.0%) |
| $1,000 to $1,499 | 21 (7.7%) | 0 (0.0%) |
| $1,500 to $1,999 | 0 (0.0%) | 0 (0.0%) |
| $2,000 to $2,499 | 0 (0.0%) | 0 (0.0%) |
| $2,500 to $2,999 | 0 (0.0%) | 0 (0.0%) |
| $3,000 or more | 0 (0.0%) | 0 (0.0%) |
| Total | 273 (100.0%) | 33 (100.0%) |
Physical Housing Characteristics in New Union
Housing Structures in New Union
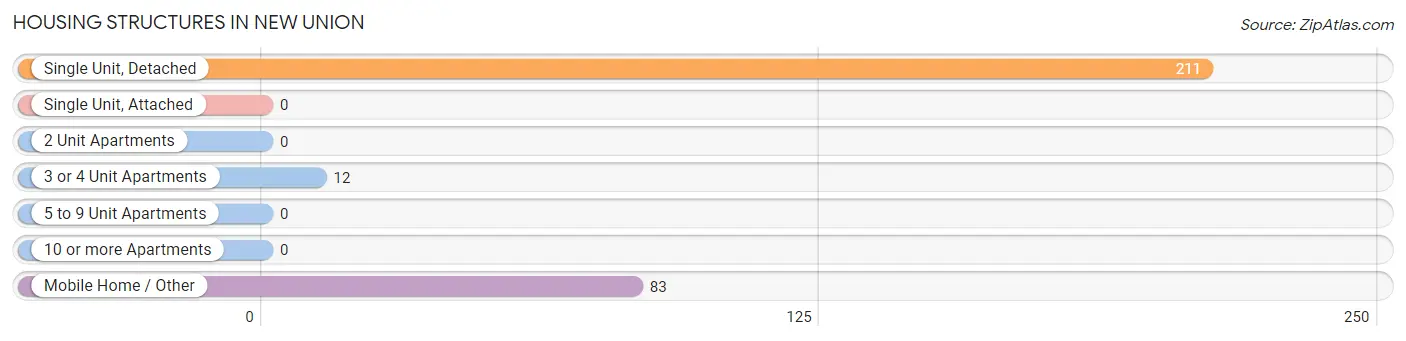
| Structure Type | # Housing Units | % Housing Units |
| Single Unit, Detached | 211 | 69.0% |
| Single Unit, Attached | 0 | 0.0% |
| 2 Unit Apartments | 0 | 0.0% |
| 3 or 4 Unit Apartments | 12 | 3.9% |
| 5 to 9 Unit Apartments | 0 | 0.0% |
| 10 or more Apartments | 0 | 0.0% |
| Mobile Home / Other | 83 | 27.1% |
| Total | 306 | 100.0% |
Housing Structures by Occupancy in New Union
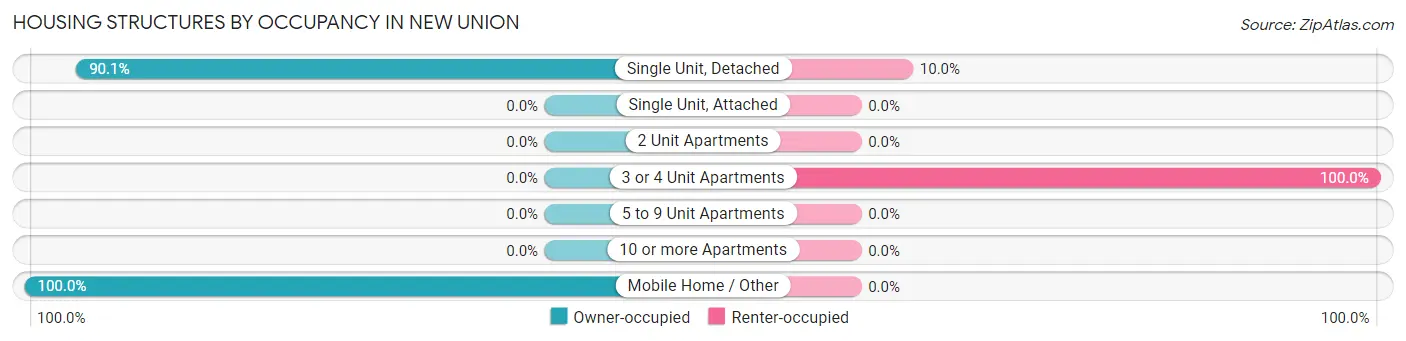
| Structure Type | Owner-occupied | Renter-occupied |
| Single Unit, Detached | 190 (90.0%) | 21 (10.0%) |
| Single Unit, Attached | 0 (0.0%) | 0 (0.0%) |
| 2 Unit Apartments | 0 (0.0%) | 0 (0.0%) |
| 3 or 4 Unit Apartments | 0 (0.0%) | 12 (100.0%) |
| 5 to 9 Unit Apartments | 0 (0.0%) | 0 (0.0%) |
| 10 or more Apartments | 0 (0.0%) | 0 (0.0%) |
| Mobile Home / Other | 83 (100.0%) | 0 (0.0%) |
| Total | 273 (89.2%) | 33 (10.8%) |
Housing Structures by Number of Rooms in New Union
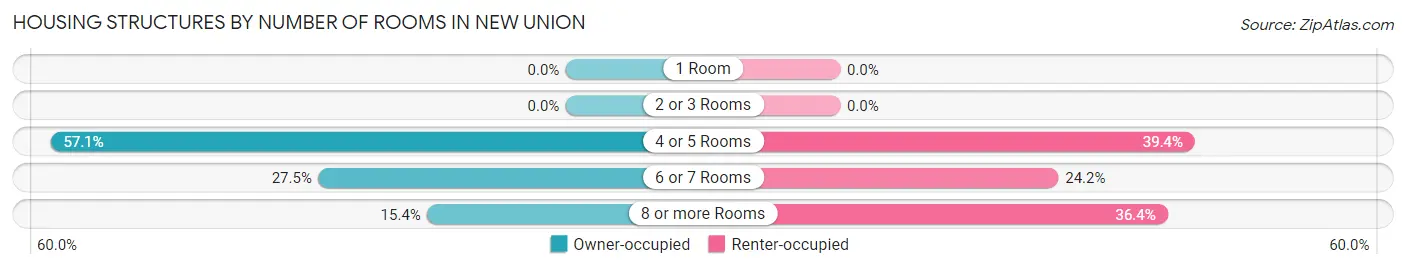
| Number of Rooms | Owner-occupied | Renter-occupied |
| 1 Room | 0 (0.0%) | 0 (0.0%) |
| 2 or 3 Rooms | 0 (0.0%) | 0 (0.0%) |
| 4 or 5 Rooms | 156 (57.1%) | 13 (39.4%) |
| 6 or 7 Rooms | 75 (27.5%) | 8 (24.2%) |
| 8 or more Rooms | 42 (15.4%) | 12 (36.4%) |
| Total | 273 (100.0%) | 33 (100.0%) |
Housing Structure by Heating Type in New Union
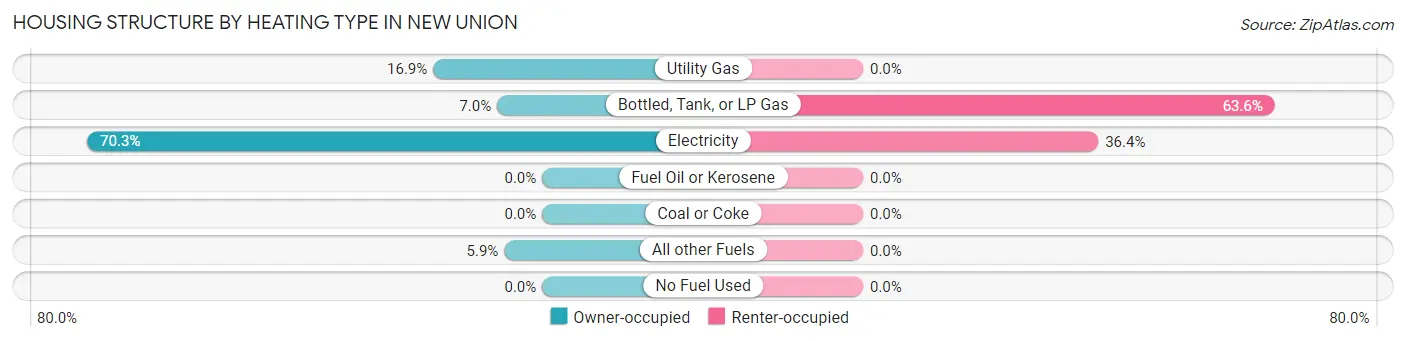
| Heating Type | Owner-occupied | Renter-occupied |
| Utility Gas | 46 (16.9%) | 0 (0.0%) |
| Bottled, Tank, or LP Gas | 19 (7.0%) | 21 (63.6%) |
| Electricity | 192 (70.3%) | 12 (36.4%) |
| Fuel Oil or Kerosene | 0 (0.0%) | 0 (0.0%) |
| Coal or Coke | 0 (0.0%) | 0 (0.0%) |
| All other Fuels | 16 (5.9%) | 0 (0.0%) |
| No Fuel Used | 0 (0.0%) | 0 (0.0%) |
| Total | 273 (100.0%) | 33 (100.0%) |
Household Vehicle Usage in New Union
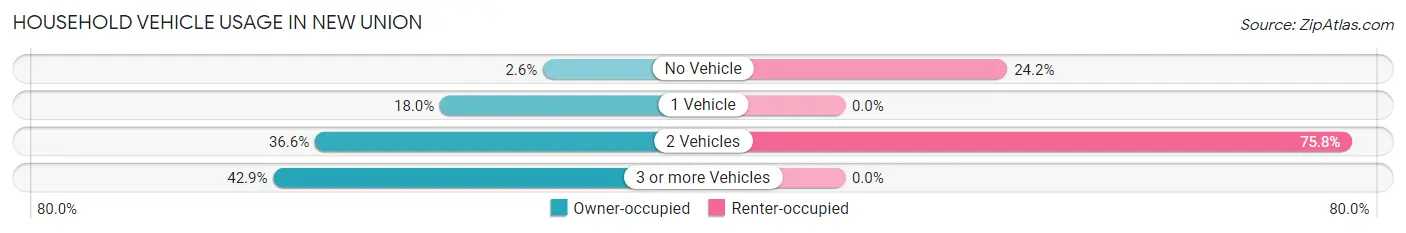
| Vehicles per Household | Owner-occupied | Renter-occupied |
| No Vehicle | 7 (2.6%) | 8 (24.2%) |
| 1 Vehicle | 49 (17.9%) | 0 (0.0%) |
| 2 Vehicles | 100 (36.6%) | 25 (75.8%) |
| 3 or more Vehicles | 117 (42.9%) | 0 (0.0%) |
| Total | 273 (100.0%) | 33 (100.0%) |
Real Estate & Mortgages in New Union
Real Estate and Mortgage Overview in New Union
| Characteristic | Without Mortgage | With Mortgage |
| Housing Units | 184 | 89 |
| Median Property Value | - | - |
| Median Household Income | $45,294 | $0 |
| Monthly Housing Costs | $418 | $0 |
| Real Estate Taxes | $488 | $0 |
Property Value by Mortgage Status in New Union
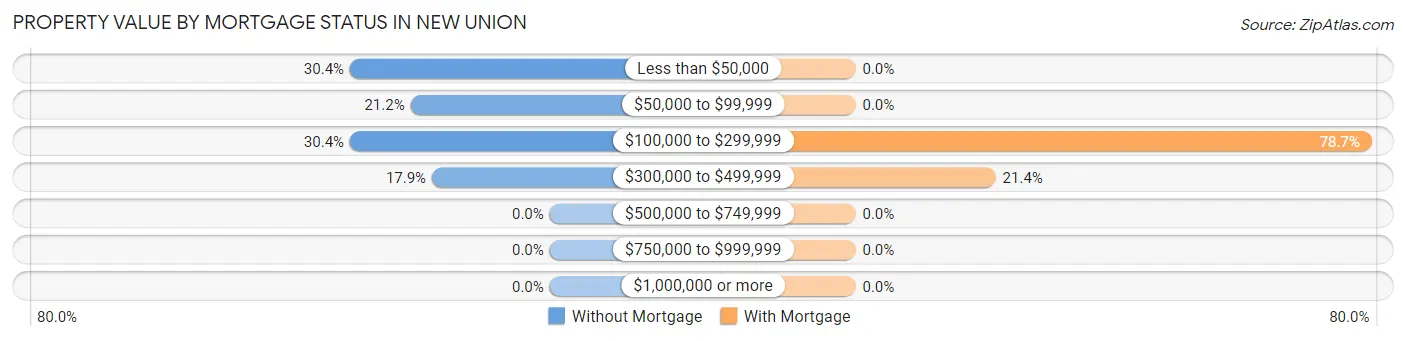
| Property Value | Without Mortgage | With Mortgage |
| Less than $50,000 | 56 (30.4%) | 0 (0.0%) |
| $50,000 to $99,999 | 39 (21.2%) | 0 (0.0%) |
| $100,000 to $299,999 | 56 (30.4%) | 70 (78.6%) |
| $300,000 to $499,999 | 33 (17.9%) | 19 (21.3%) |
| $500,000 to $749,999 | 0 (0.0%) | 0 (0.0%) |
| $750,000 to $999,999 | 0 (0.0%) | 0 (0.0%) |
| $1,000,000 or more | 0 (0.0%) | 0 (0.0%) |
| Total | 184 (100.0%) | 89 (100.0%) |
Household Income by Mortgage Status in New Union
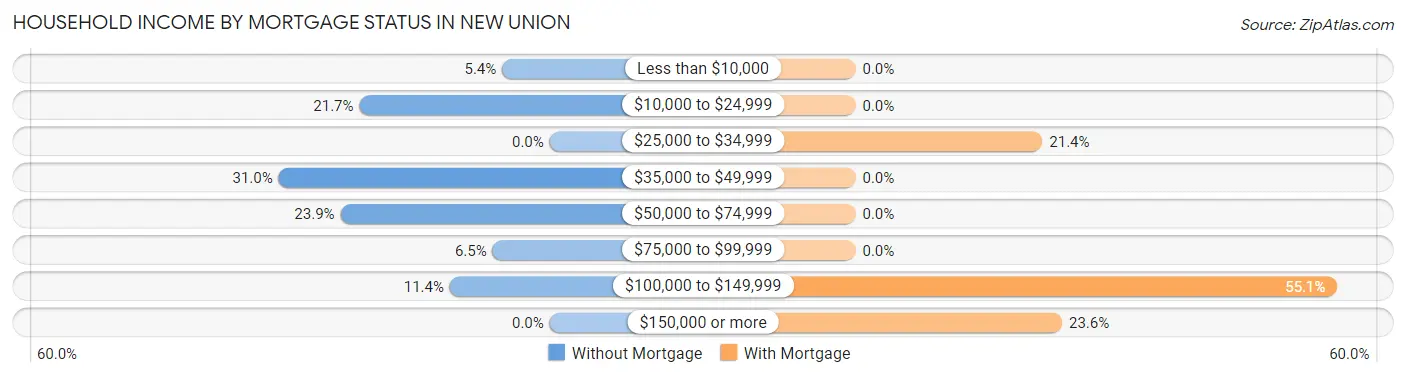
| Household Income | Without Mortgage | With Mortgage |
| Less than $10,000 | 10 (5.4%) | 0 (0.0%) |
| $10,000 to $24,999 | 40 (21.7%) | 0 (0.0%) |
| $25,000 to $34,999 | 0 (0.0%) | 19 (21.3%) |
| $35,000 to $49,999 | 57 (31.0%) | 0 (0.0%) |
| $50,000 to $74,999 | 44 (23.9%) | 0 (0.0%) |
| $75,000 to $99,999 | 12 (6.5%) | 0 (0.0%) |
| $100,000 to $149,999 | 21 (11.4%) | 49 (55.1%) |
| $150,000 or more | 0 (0.0%) | 21 (23.6%) |
| Total | 184 (100.0%) | 89 (100.0%) |
Property Value to Household Income Ratio in New Union
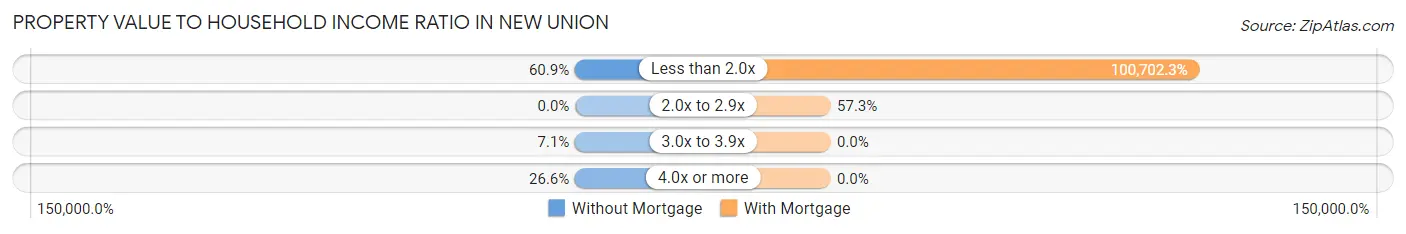
| Value-to-Income Ratio | Without Mortgage | With Mortgage |
| Less than 2.0x | 112 (60.9%) | 89,625 (100,702.3%) |
| 2.0x to 2.9x | 0 (0.0%) | 51 (57.3%) |
| 3.0x to 3.9x | 13 (7.1%) | 0 (0.0%) |
| 4.0x or more | 49 (26.6%) | 0 (0.0%) |
| Total | 184 (100.0%) | 89 (100.0%) |
Real Estate Taxes by Mortgage Status in New Union
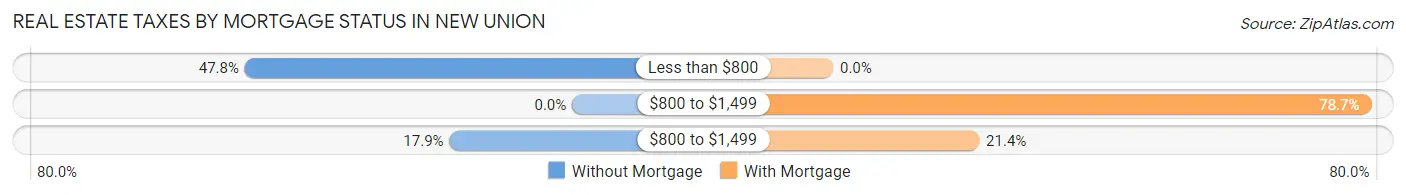
| Property Taxes | Without Mortgage | With Mortgage |
| Less than $800 | 88 (47.8%) | 0 (0.0%) |
| $800 to $1,499 | 0 (0.0%) | 70 (78.6%) |
| $800 to $1,499 | 33 (17.9%) | 19 (21.3%) |
| Total | 184 (100.0%) | 89 (100.0%) |
Health & Disability in New Union
Health Insurance Coverage by Age in New Union
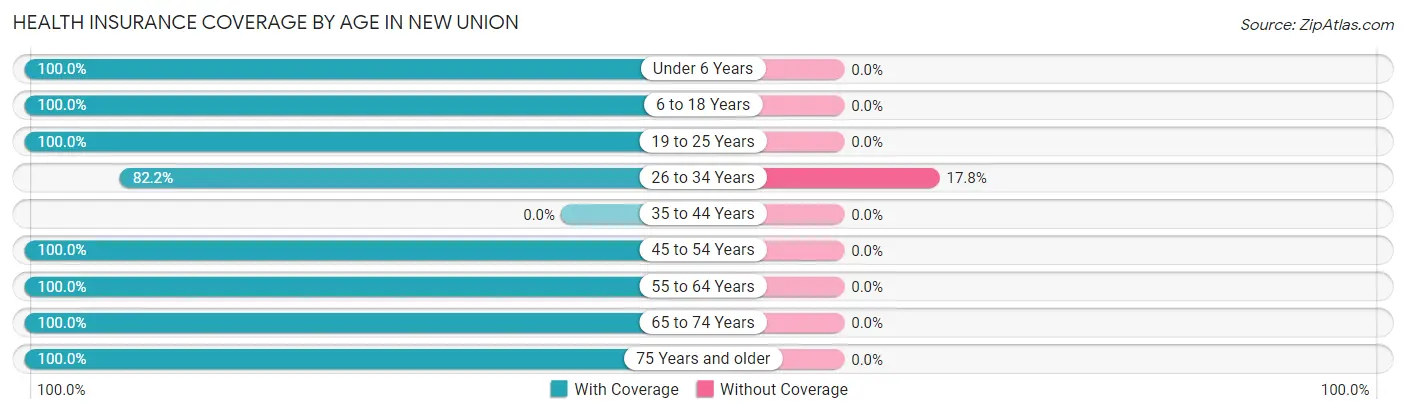
| Age Bracket | With Coverage | Without Coverage |
| Under 6 Years | 152 (100.0%) | 0 (0.0%) |
| 6 to 18 Years | 112 (100.0%) | 0 (0.0%) |
| 19 to 25 Years | 43 (100.0%) | 0 (0.0%) |
| 26 to 34 Years | 88 (82.2%) | 19 (17.8%) |
| 35 to 44 Years | 0 (0.0%) | 0 (0.0%) |
| 45 to 54 Years | 121 (100.0%) | 0 (0.0%) |
| 55 to 64 Years | 100 (100.0%) | 0 (0.0%) |
| 65 to 74 Years | 136 (100.0%) | 0 (0.0%) |
| 75 Years and older | 40 (100.0%) | 0 (0.0%) |
| Total | 792 (97.7%) | 19 (2.3%) |
Health Insurance Coverage by Citizenship Status in New Union
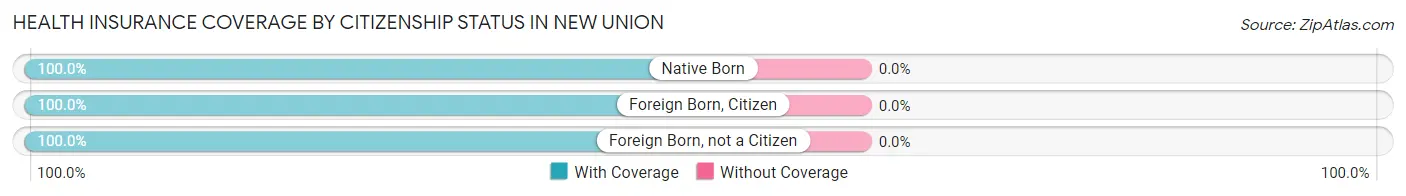
| Citizenship Status | With Coverage | Without Coverage |
| Native Born | 152 (100.0%) | 0 (0.0%) |
| Foreign Born, Citizen | 112 (100.0%) | 0 (0.0%) |
| Foreign Born, not a Citizen | 43 (100.0%) | 0 (0.0%) |
Health Insurance Coverage by Household Income in New Union
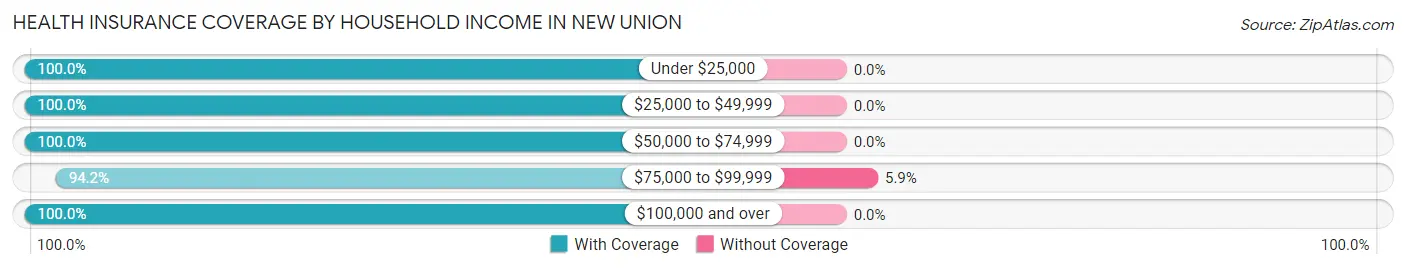
| Household Income | With Coverage | Without Coverage |
| Under $25,000 | 77 (100.0%) | 0 (0.0%) |
| $25,000 to $49,999 | 140 (100.0%) | 0 (0.0%) |
| $50,000 to $74,999 | 103 (100.0%) | 0 (0.0%) |
| $75,000 to $99,999 | 306 (94.2%) | 19 (5.9%) |
| $100,000 and over | 166 (100.0%) | 0 (0.0%) |
Public vs Private Health Insurance Coverage by Age in New Union
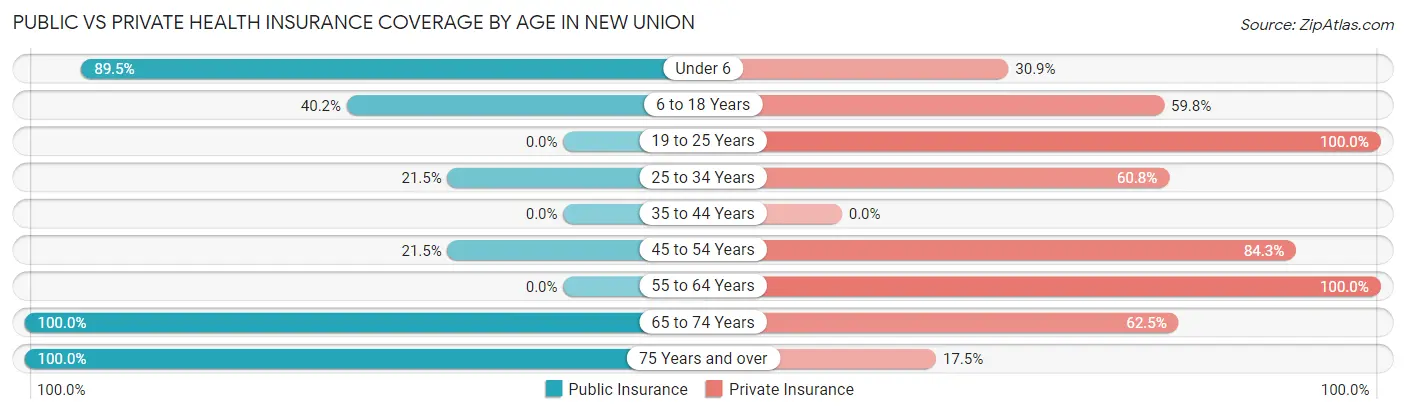
| Age Bracket | Public Insurance | Private Insurance |
| Under 6 | 136 (89.5%) | 47 (30.9%) |
| 6 to 18 Years | 45 (40.2%) | 67 (59.8%) |
| 19 to 25 Years | 0 (0.0%) | 43 (100.0%) |
| 25 to 34 Years | 23 (21.5%) | 65 (60.8%) |
| 35 to 44 Years | 0 (0.0%) | 0 (0.0%) |
| 45 to 54 Years | 26 (21.5%) | 102 (84.3%) |
| 55 to 64 Years | 0 (0.0%) | 100 (100.0%) |
| 65 to 74 Years | 136 (100.0%) | 85 (62.5%) |
| 75 Years and over | 40 (100.0%) | 7 (17.5%) |
| Total | 406 (50.1%) | 516 (63.6%) |
Disability Status by Sex by Age in New Union
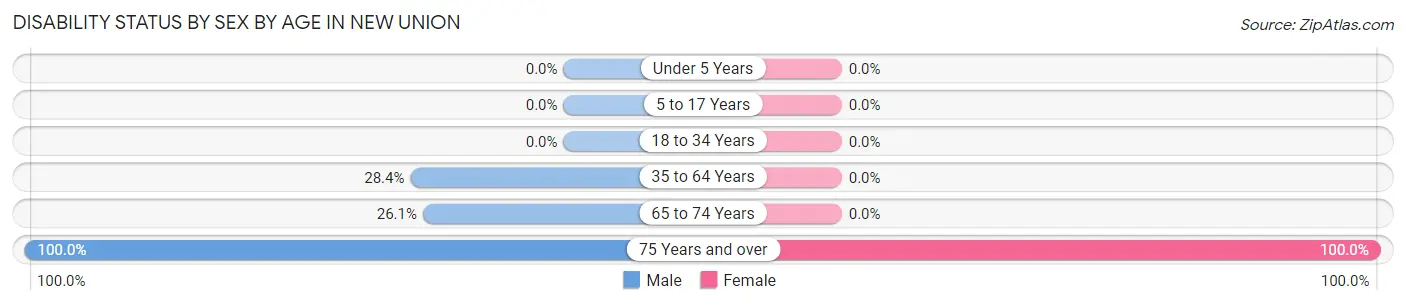
| Age Bracket | Male | Female |
| Under 5 Years | 0 (0.0%) | 0 (0.0%) |
| 5 to 17 Years | 0 (0.0%) | 0 (0.0%) |
| 18 to 34 Years | 0 (0.0%) | 0 (0.0%) |
| 35 to 64 Years | 25 (28.4%) | 0 (0.0%) |
| 65 to 74 Years | 24 (26.1%) | 0 (0.0%) |
| 75 Years and over | 25 (100.0%) | 15 (100.0%) |
Disability Class by Sex by Age in New Union
Disability Class: Hearing Difficulty
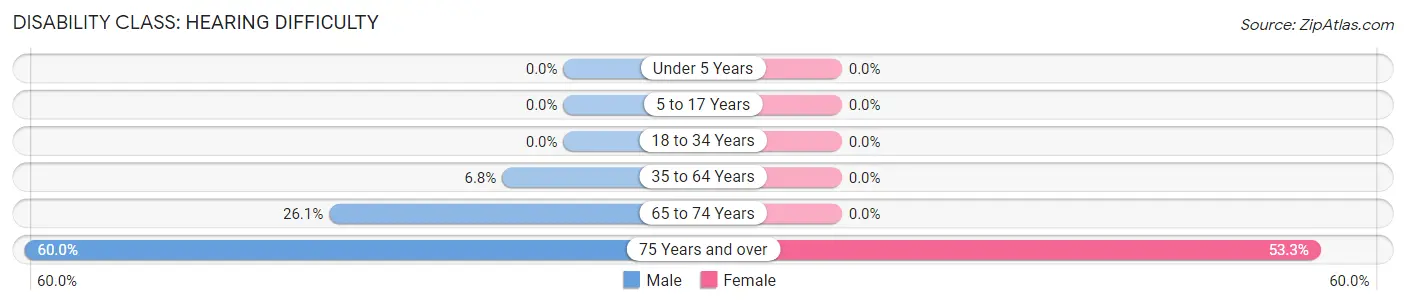
| Age Bracket | Male | Female |
| Under 5 Years | 0 (0.0%) | 0 (0.0%) |
| 5 to 17 Years | 0 (0.0%) | 0 (0.0%) |
| 18 to 34 Years | 0 (0.0%) | 0 (0.0%) |
| 35 to 64 Years | 6 (6.8%) | 0 (0.0%) |
| 65 to 74 Years | 24 (26.1%) | 0 (0.0%) |
| 75 Years and over | 15 (60.0%) | 8 (53.3%) |
Disability Class: Vision Difficulty
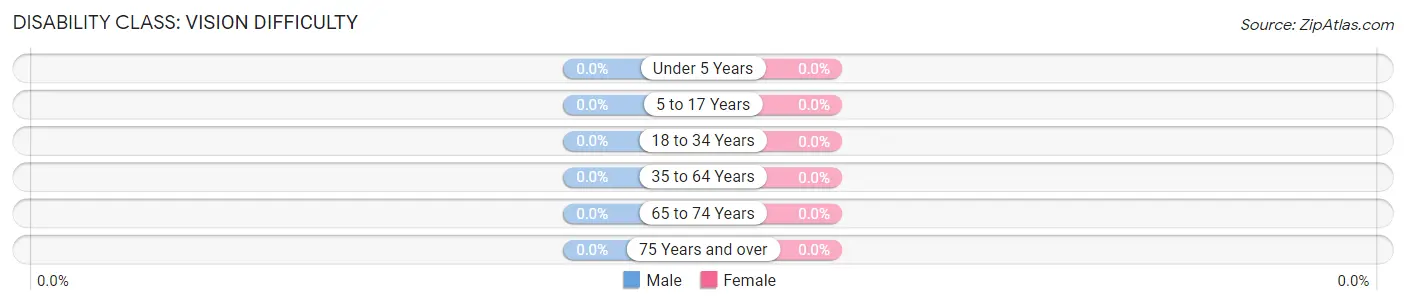
| Age Bracket | Male | Female |
| Under 5 Years | 0 (0.0%) | 0 (0.0%) |
| 5 to 17 Years | 0 (0.0%) | 0 (0.0%) |
| 18 to 34 Years | 0 (0.0%) | 0 (0.0%) |
| 35 to 64 Years | 0 (0.0%) | 0 (0.0%) |
| 65 to 74 Years | 0 (0.0%) | 0 (0.0%) |
| 75 Years and over | 0 (0.0%) | 0 (0.0%) |
Disability Class: Cognitive Difficulty
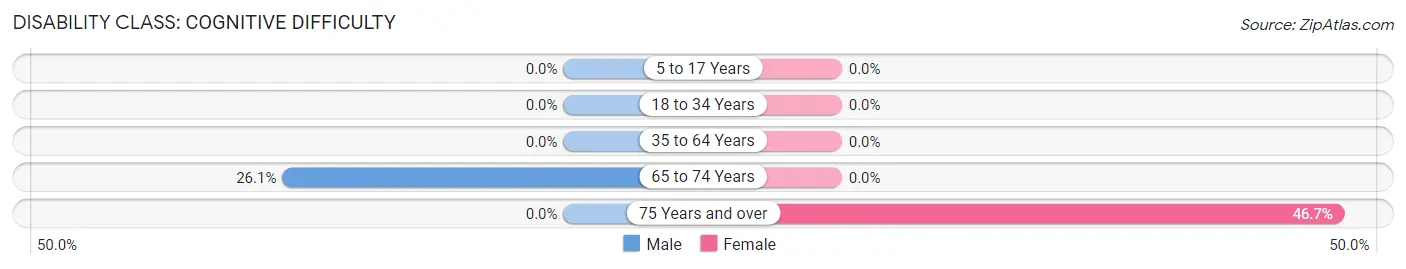
| Age Bracket | Male | Female |
| 5 to 17 Years | 0 (0.0%) | 0 (0.0%) |
| 18 to 34 Years | 0 (0.0%) | 0 (0.0%) |
| 35 to 64 Years | 0 (0.0%) | 0 (0.0%) |
| 65 to 74 Years | 24 (26.1%) | 0 (0.0%) |
| 75 Years and over | 0 (0.0%) | 7 (46.7%) |
Disability Class: Ambulatory Difficulty
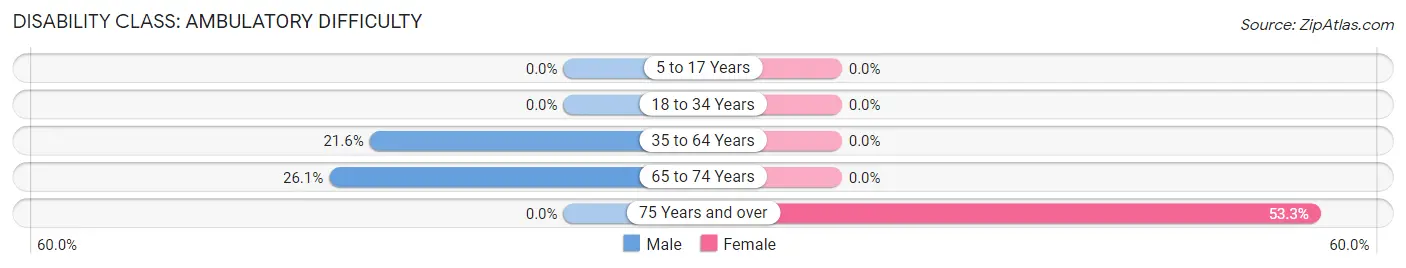
| Age Bracket | Male | Female |
| 5 to 17 Years | 0 (0.0%) | 0 (0.0%) |
| 18 to 34 Years | 0 (0.0%) | 0 (0.0%) |
| 35 to 64 Years | 19 (21.6%) | 0 (0.0%) |
| 65 to 74 Years | 24 (26.1%) | 0 (0.0%) |
| 75 Years and over | 0 (0.0%) | 8 (53.3%) |
Disability Class: Self-Care Difficulty
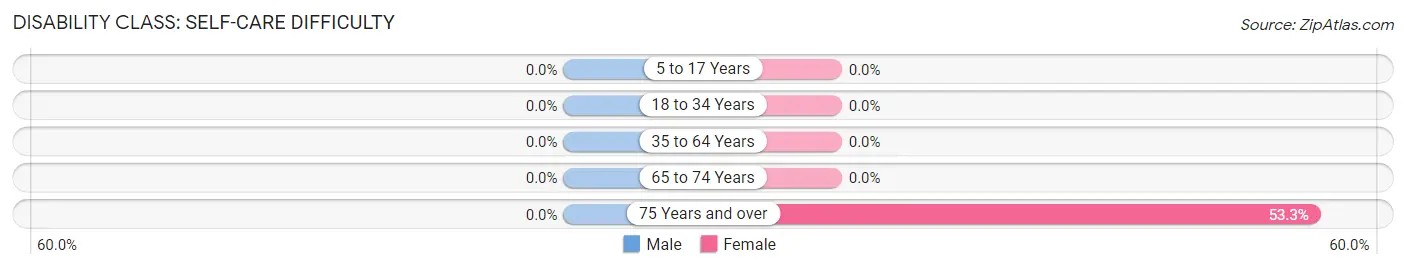
| Age Bracket | Male | Female |
| 5 to 17 Years | 0 (0.0%) | 0 (0.0%) |
| 18 to 34 Years | 0 (0.0%) | 0 (0.0%) |
| 35 to 64 Years | 0 (0.0%) | 0 (0.0%) |
| 65 to 74 Years | 0 (0.0%) | 0 (0.0%) |
| 75 Years and over | 0 (0.0%) | 8 (53.3%) |
Technology Access in New Union
Computing Device Access in New Union
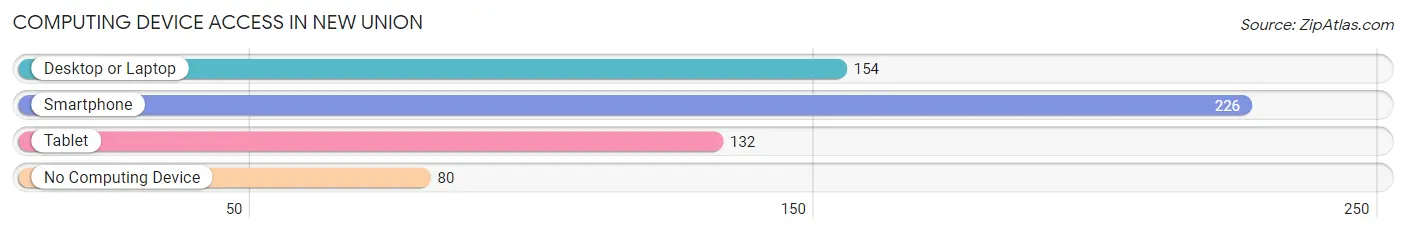
| Device Type | # Households | % Households |
| Desktop or Laptop | 154 | 50.3% |
| Smartphone | 226 | 73.9% |
| Tablet | 132 | 43.1% |
| No Computing Device | 80 | 26.1% |
| Total | 306 | 100.0% |
Internet Access in New Union
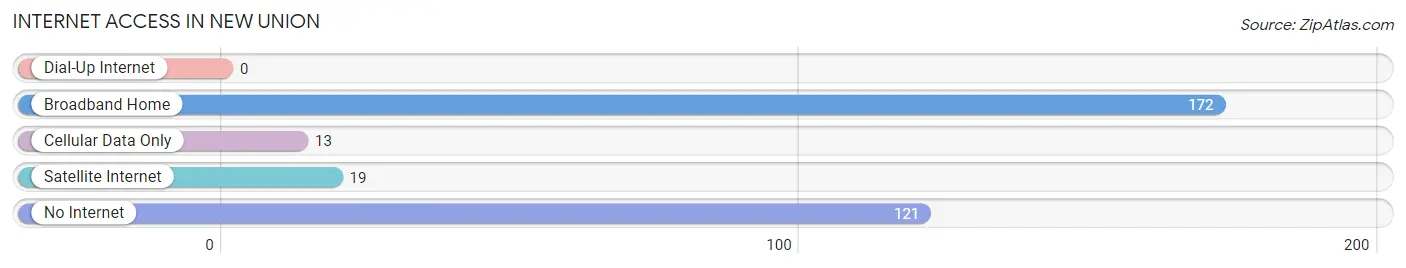
| Internet Type | # Households | % Households |
| Dial-Up Internet | 0 | 0.0% |
| Broadband Home | 172 | 56.2% |
| Cellular Data Only | 13 | 4.3% |
| Satellite Internet | 19 | 6.2% |
| No Internet | 121 | 39.5% |
| Total | 306 | 100.0% |
New Union Summary
Union is a small town located in the northwest corner of Alabama, in the foothills of the Appalachian Mountains. It is part of the Jackson County area and is situated along the banks of the Coosa River. The town was founded in 1836 and was named after the Union Church, which was built in the area in 1835. The town was originally a farming community, but has since grown to include a variety of businesses and industries.
Geography
Union is located in the northwest corner of Alabama, in the foothills of the Appalachian Mountains. It is situated along the banks of the Coosa River, which is a major tributary of the Alabama River. The town is located approximately 30 miles north of Birmingham and is part of the Jackson County area. The town is surrounded by the cities of Scottsboro, Stevenson, and Bridgeport. The terrain of the area is mostly hilly, with some flat areas near the river. The climate is humid subtropical, with hot summers and mild winters.
Economy
Union has a diverse economy, with a variety of businesses and industries. The town is home to several manufacturing companies, including a paper mill, a furniture factory, and a plastics plant. The town also has a number of retail stores, restaurants, and other businesses. The town is also home to a number of farms, which produce a variety of crops, including corn, soybeans, and cotton.
Demographics
As of the 2010 census, the population of Union was 1,845. The racial makeup of the town was 95.3% White, 2.2% African American, 0.3% Native American, 0.2% Asian, 0.1% Pacific Islander, 0.7% from other races, and 1.2% from two or more races. Hispanic or Latino of any race were 1.7% of the population. The median household income was $30,938, and the median family income was $37,813. The per capita income was $17,845.
Conclusion
Union is a small town located in the northwest corner of Alabama, in the foothills of the Appalachian Mountains. It is part of the Jackson County area and is situated along the banks of the Coosa River. The town was founded in 1836 and was named after the Union Church, which was built in the area in 1835. The town has a diverse economy, with a variety of businesses and industries, and a population of 1,845 as of the 2010 census. The town is home to several manufacturing companies, retail stores, restaurants, and farms, and has a median household income of $30,938.
Common Questions
What is Per Capita Income in New Union?
Per Capita income in New Union is $24,090.
What is the Median Family Income in New Union?
Median Family Income in New Union is $88,083.
What is the Median Household income in New Union?
Median Household Income in New Union is $51,346.
What is Inequality or Gini Index in New Union?
Inequality or Gini Index in New Union is 0.38.
What is the Total Population of New Union?
Total Population of New Union is 811.
What is the Total Male Population of New Union?
Total Male Population of New Union is 471.
What is the Total Female Population of New Union?
Total Female Population of New Union is 340.
What is the Ratio of Males per 100 Females in New Union?
There are 138.53 Males per 100 Females in New Union.
What is the Ratio of Females per 100 Males in New Union?
There are 72.19 Females per 100 Males in New Union.
What is the Median Population Age in New Union?
Median Population Age in New Union is 32.8 Years.
What is the Average Family Size in New Union
Average Family Size in New Union is 3.3 People.
What is the Average Household Size in New Union
Average Household Size in New Union is 2.6 People.
How Large is the Labor Force in New Union?
There are 360 People in the Labor Forcein in New Union.
What is the Percentage of People in the Labor Force in New Union?
65.8% of People are in the Labor Force in New Union.