Norwegian vs Immigrants from Moldova 3 or more Vehicles in Household
COMPARE
Norwegian
Immigrants from Moldova
3 or more Vehicles in Household
3 or more Vehicles in Household Comparison
Norwegians
Immigrants from Moldova
23.9%
3 OR MORE VEHICLES IN HOUSEHOLD
100.0/ 100
METRIC RATING
18th/ 347
METRIC RANK
19.1%
3 OR MORE VEHICLES IN HOUSEHOLD
23.6/ 100
METRIC RATING
195th/ 347
METRIC RANK
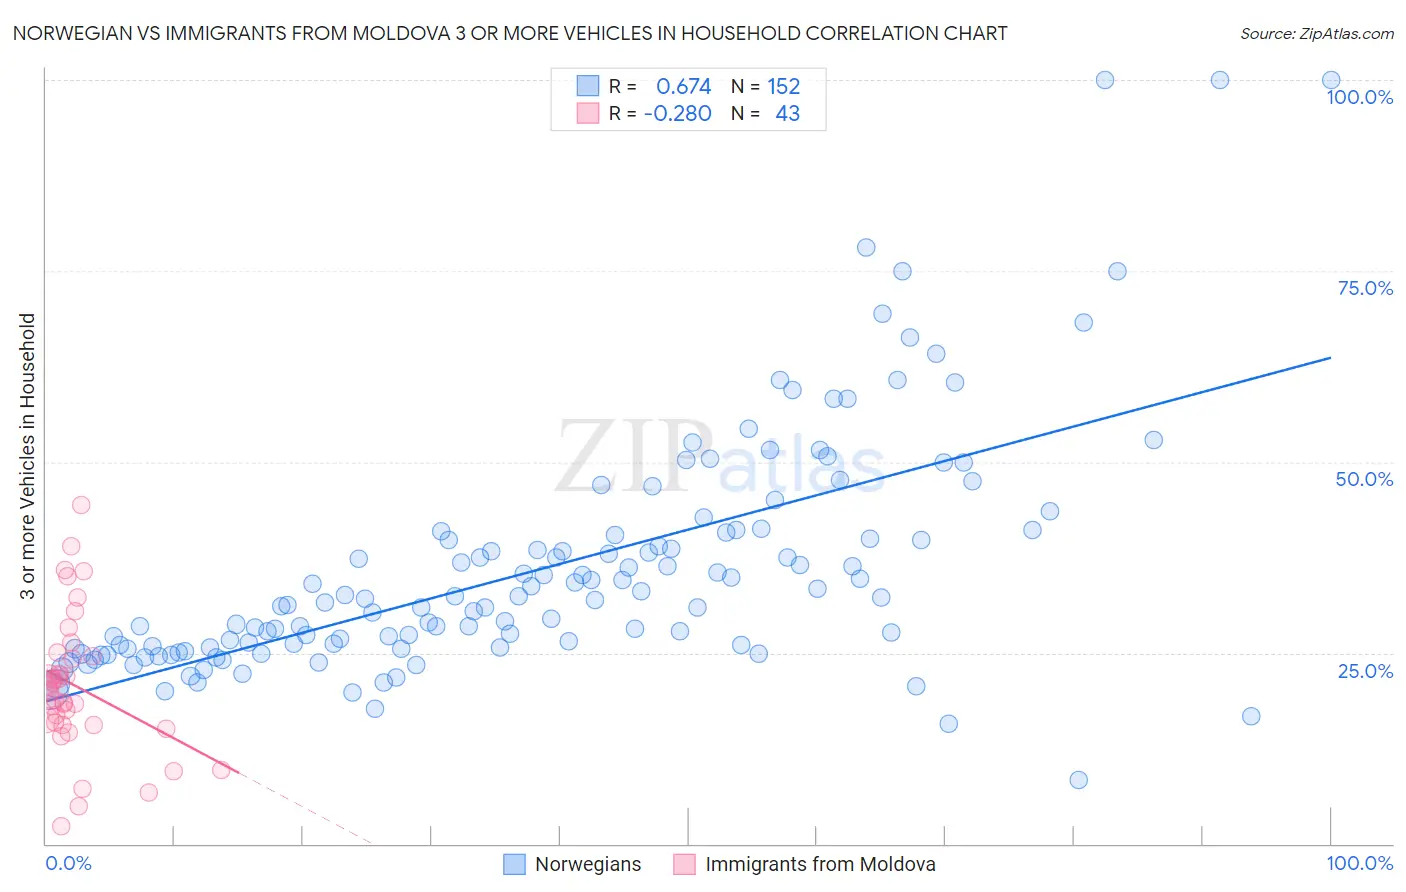
Norwegian vs Immigrants from Moldova 3 or more Vehicles in Household Correlation Chart
The statistical analysis conducted on geographies consisting of 532,701,273 people shows a significant positive correlation between the proportion of Norwegians and percentage of households with 3 or more vehicles available in the United States with a correlation coefficient (R) of 0.674 and weighted average of 23.9%. Similarly, the statistical analysis conducted on geographies consisting of 124,372,944 people shows a weak negative correlation between the proportion of Immigrants from Moldova and percentage of households with 3 or more vehicles available in the United States with a correlation coefficient (R) of -0.280 and weighted average of 19.1%, a difference of 25.2%.
3 or more Vehicles in Household Correlation Summary
| Measurement | Norwegian | Immigrants from Moldova |
| Minimum | 8.3% | 2.4% |
| Maximum | 100.0% | 44.3% |
| Range | 91.7% | 41.9% |
| Mean | 36.1% | 20.7% |
| Median | 32.0% | 20.2% |
| Interquartile 25% (IQ1) | 25.7% | 15.5% |
| Interquartile 75% (IQ3) | 40.6% | 24.5% |
| Interquartile Range (IQR) | 14.8% | 8.9% |
| Standard Deviation (Sample) | 15.8% | 9.0% |
| Standard Deviation (Population) | 15.7% | 8.9% |
Similar Demographics by 3 or more Vehicles in Household
Demographics Similar to Norwegians by 3 or more Vehicles in Household
In terms of 3 or more vehicles in household, the demographic groups most similar to Norwegians are Chinese (23.9%, a difference of 0.030%), Paiute (23.8%, a difference of 0.33%), Immigrants from Vietnam (23.8%, a difference of 0.45%), Immigrants from Philippines (23.8%, a difference of 0.51%), and Korean (24.1%, a difference of 0.79%).
| Demographics | Rating | Rank | 3 or more Vehicles in Household |
| Shoshone | 100.0 /100 | #11 | Exceptional 24.9% |
| Danes | 100.0 /100 | #12 | Exceptional 24.7% |
| Mexicans | 100.0 /100 | #13 | Exceptional 24.7% |
| Immigrants | Mexico | 100.0 /100 | #14 | Exceptional 24.6% |
| Hawaiians | 100.0 /100 | #15 | Exceptional 24.3% |
| Basques | 100.0 /100 | #16 | Exceptional 24.3% |
| Koreans | 100.0 /100 | #17 | Exceptional 24.1% |
| Norwegians | 100.0 /100 | #18 | Exceptional 23.9% |
| Chinese | 100.0 /100 | #19 | Exceptional 23.9% |
| Paiute | 100.0 /100 | #20 | Exceptional 23.8% |
| Immigrants | Vietnam | 100.0 /100 | #21 | Exceptional 23.8% |
| Immigrants | Philippines | 100.0 /100 | #22 | Exceptional 23.8% |
| Scandinavians | 100.0 /100 | #23 | Exceptional 23.6% |
| Sri Lankans | 100.0 /100 | #24 | Exceptional 23.6% |
| Immigrants | Central America | 100.0 /100 | #25 | Exceptional 23.4% |
Demographics Similar to Immigrants from Moldova by 3 or more Vehicles in Household
In terms of 3 or more vehicles in household, the demographic groups most similar to Immigrants from Moldova are Serbian (19.1%, a difference of 0.040%), Tsimshian (19.1%, a difference of 0.080%), Kenyan (19.1%, a difference of 0.11%), Central American Indian (19.0%, a difference of 0.15%), and South American Indian (19.1%, a difference of 0.18%).
| Demographics | Rating | Rank | 3 or more Vehicles in Household |
| Immigrants | Kuwait | 26.1 /100 | #188 | Fair 19.1% |
| Indians (Asian) | 26.0 /100 | #189 | Fair 19.1% |
| Immigrants | Zimbabwe | 25.5 /100 | #190 | Fair 19.1% |
| South American Indians | 25.4 /100 | #191 | Fair 19.1% |
| Kenyans | 24.7 /100 | #192 | Fair 19.1% |
| Tsimshian | 24.4 /100 | #193 | Fair 19.1% |
| Serbians | 24.0 /100 | #194 | Fair 19.1% |
| Immigrants | Moldova | 23.6 /100 | #195 | Fair 19.1% |
| Central American Indians | 22.2 /100 | #196 | Fair 19.0% |
| Immigrants | Japan | 22.0 /100 | #197 | Fair 19.0% |
| Egyptians | 19.5 /100 | #198 | Poor 19.0% |
| Immigrants | Norway | 19.0 /100 | #199 | Poor 19.0% |
| Argentineans | 18.2 /100 | #200 | Poor 18.9% |
| Arabs | 17.7 /100 | #201 | Poor 18.9% |
| Immigrants | Austria | 15.4 /100 | #202 | Poor 18.9% |