Kenyan GED/Equivalency
COMPARE
Kenyan
Select to Compare
GED/Equivalency
Kenyan GED/Equivalency
86.3%
GED/EQUIVALENCY
76.6/ 100
METRIC RATING
153rd/ 347
METRIC RANK
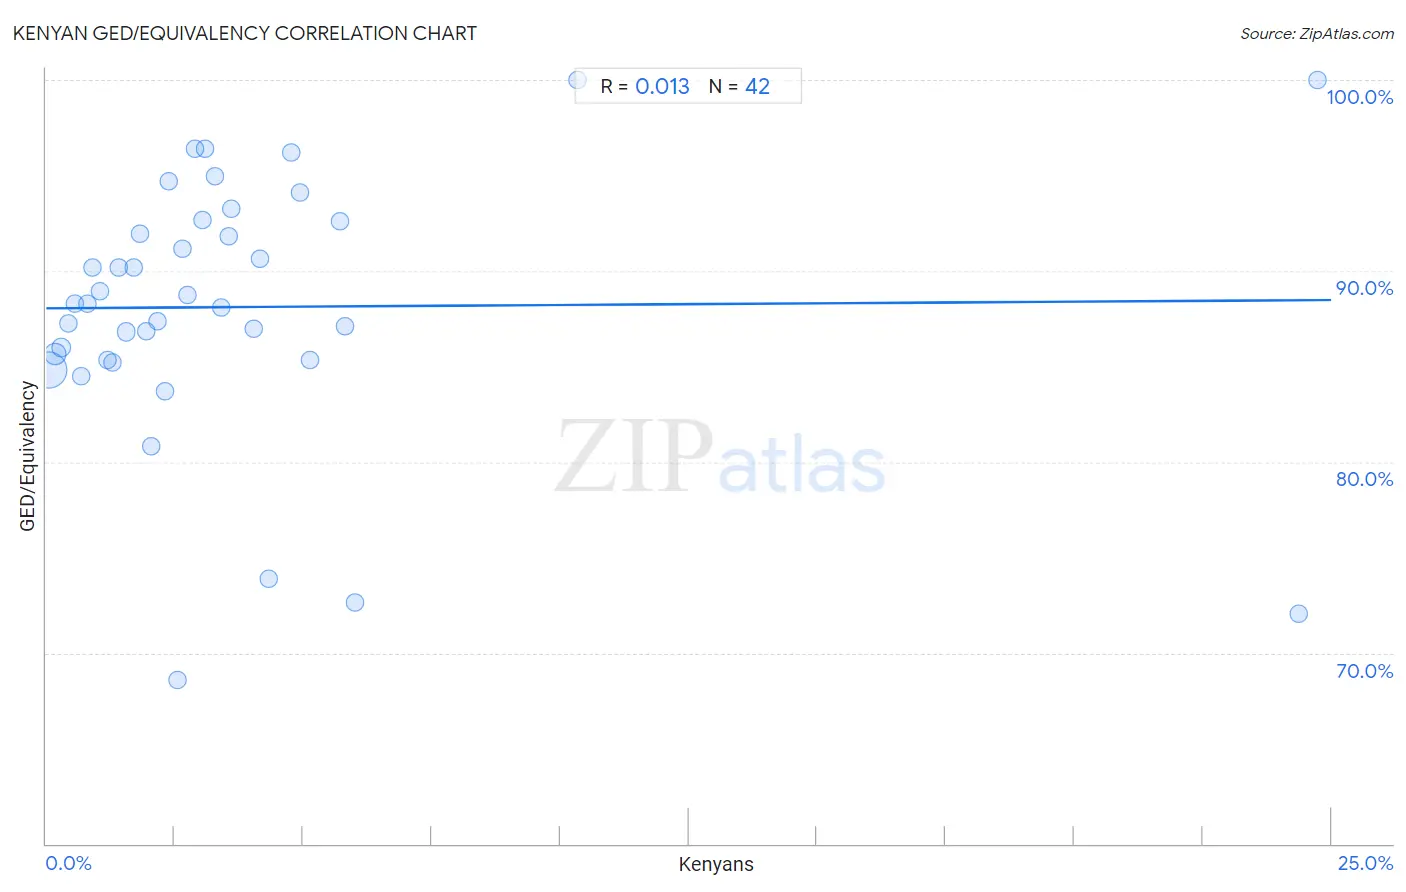
Kenyan GED/Equivalency Correlation Chart
The statistical analysis conducted on geographies consisting of 168,244,481 people shows no correlation between the proportion of Kenyans and percentage of population with at least ged/equivalency education in the United States with a correlation coefficient (R) of 0.013 and weighted average of 86.3%. On average, for every 1% (one percent) increase in Kenyans within a typical geography, there is an increase of 0.018% in percentage of population with at least ged/equivalency education.
It is essential to understand that the correlation between the percentage of Kenyans and percentage of population with at least ged/equivalency education does not imply a direct cause-and-effect relationship. It remains uncertain whether the presence of Kenyans influences an upward or downward trend in the level of percentage of population with at least ged/equivalency education within an area, or if Kenyans simply ended up residing in those areas with higher or lower levels of percentage of population with at least ged/equivalency education due to other factors.
Demographics Similar to Kenyans by GED/Equivalency
In terms of ged/equivalency, the demographic groups most similar to Kenyans are Armenian (86.3%, a difference of 0.0%), Brazilian (86.3%, a difference of 0.020%), Immigrants from Bosnia and Herzegovina (86.3%, a difference of 0.040%), Iraqi (86.2%, a difference of 0.040%), and Immigrants from Western Asia (86.3%, a difference of 0.070%).
| Demographics | Rating | Rank | GED/Equivalency |
| Basques | 79.5 /100 | #146 | Good 86.4% |
| Immigrants from Northern Africa | 79.3 /100 | #147 | Good 86.3% |
| Immigrants from Poland | 79.3 /100 | #148 | Good 86.3% |
| Menominee | 79.3 /100 | #149 | Good 86.3% |
| Immigrants from Western Asia | 78.8 /100 | #150 | Good 86.3% |
| Immigrants from Bosnia and Herzegovina | 77.9 /100 | #151 | Good 86.3% |
| Brazilians | 77.2 /100 | #152 | Good 86.3% |
| Kenyans | 76.6 /100 | #153 | Good 86.3% |
| Armenians | 76.4 /100 | #154 | Good 86.3% |
| Iraqis | 75.2 /100 | #155 | Good 86.2% |
| Immigrants from Nepal | 73.3 /100 | #156 | Good 86.2% |
| Whites/Caucasians | 72.2 /100 | #157 | Good 86.2% |
| German Russians | 72.1 /100 | #158 | Good 86.2% |
| Immigrants from Kenya | 71.8 /100 | #159 | Good 86.2% |
| Immigrants from Morocco | 69.5 /100 | #160 | Good 86.1% |
Kenyan GED/Equivalency Correlation Summary
| Measurement | Kenyan Data | GED/Equivalency Data |
| Minimum | 0.039% | 68.6% |
| Maximum | 24.7% | 100.0% |
| Range | 24.7% | 31.4% |
| Mean | 3.8% | 88.1% |
| Median | 2.6% | 88.3% |
| Interquartile 25% (IQ1) | 1.3% | 85.3% |
| Interquartile 75% (IQ3) | 4.2% | 92.6% |
| Interquartile Range (IQR) | 2.9% | 7.3% |
| Standard Deviation (Sample) | 5.1% | 6.9% |
| Standard Deviation (Population) | 5.0% | 6.8% |
Correlation Details
| Kenyan Percentile | Sample Size | GED/Equivalency |
[ 0.0% - 0.5% ] 0.039% | 126,538,541 | 84.8% |
[ 0.0% - 0.5% ] 0.17% | 21,807,122 | 85.6% |
[ 0.0% - 0.5% ] 0.30% | 8,432,744 | 86.0% |
[ 0.0% - 0.5% ] 0.43% | 4,726,962 | 87.2% |
[ 0.5% - 1.0% ] 0.55% | 2,142,529 | 88.3% |
[ 0.5% - 1.0% ] 0.67% | 1,169,136 | 84.5% |
[ 0.5% - 1.0% ] 0.80% | 975,254 | 88.3% |
[ 0.5% - 1.0% ] 0.90% | 446,933 | 90.2% |
[ 1.0% - 1.5% ] 1.05% | 433,161 | 88.9% |
[ 1.0% - 1.5% ] 1.19% | 330,826 | 85.3% |
[ 1.0% - 1.5% ] 1.30% | 231,594 | 85.2% |
[ 1.0% - 1.5% ] 1.41% | 210,333 | 90.2% |
[ 1.5% - 2.0% ] 1.56% | 192,252 | 86.8% |
[ 1.5% - 2.0% ] 1.69% | 100,838 | 90.2% |
[ 1.5% - 2.0% ] 1.82% | 30,100 | 92.0% |
[ 1.5% - 2.0% ] 1.95% | 131,069 | 86.8% |
[ 2.0% - 2.5% ] 2.05% | 69,612 | 80.8% |
[ 2.0% - 2.5% ] 2.17% | 85,059 | 87.4% |
[ 2.0% - 2.5% ] 2.31% | 63,729 | 83.7% |
[ 2.0% - 2.5% ] 2.38% | 6,863 | 94.7% |
[ 2.5% - 3.0% ] 2.56% | 586 | 68.6% |
[ 2.5% - 3.0% ] 2.65% | 32,186 | 91.2% |
[ 2.5% - 3.0% ] 2.75% | 8,230 | 88.8% |
[ 2.5% - 3.0% ] 2.90% | 3,966 | 96.4% |
[ 3.0% - 3.5% ] 3.03% | 14,756 | 92.6% |
[ 3.0% - 3.5% ] 3.10% | 8,580 | 96.4% |
[ 3.0% - 3.5% ] 3.29% | 2,034 | 94.9% |
[ 3.0% - 3.5% ] 3.40% | 2,764 | 88.1% |
[ 3.5% - 4.0% ] 3.56% | 2,473 | 91.8% |
[ 3.5% - 4.0% ] 3.59% | 3,785 | 93.3% |
[ 4.0% - 4.5% ] 4.03% | 4,488 | 87.0% |
[ 4.0% - 4.5% ] 4.15% | 9,822 | 90.7% |
[ 4.0% - 4.5% ] 4.32% | 2,474 | 73.9% |
[ 4.5% - 5.0% ] 4.77% | 9,332 | 96.2% |
[ 4.5% - 5.0% ] 4.94% | 324 | 94.1% |
[ 5.0% - 5.5% ] 5.13% | 4,995 | 85.3% |
[ 5.5% - 6.0% ] 5.71% | 4,728 | 92.6% |
[ 5.5% - 6.0% ] 5.82% | 3,214 | 87.1% |
[ 6.0% - 6.5% ] 6.01% | 183 | 72.6% |
[ 10.0% - 10.5% ] 10.33% | 368 | 100.0% |
[ 24.0% - 24.5% ] 24.37% | 439 | 72.1% |
[ 24.5% - 25.0% ] 24.74% | 97 | 100.0% |