Kenyan vs Delaware 3 or more Vehicles in Household
COMPARE
Kenyan
Delaware
3 or more Vehicles in Household
3 or more Vehicles in Household Comparison
Kenyans
Delaware
19.1%
3 OR MORE VEHICLES IN HOUSEHOLD
24.7/ 100
METRIC RATING
192nd/ 347
METRIC RANK
21.5%
3 OR MORE VEHICLES IN HOUSEHOLD
99.6/ 100
METRIC RATING
86th/ 347
METRIC RANK
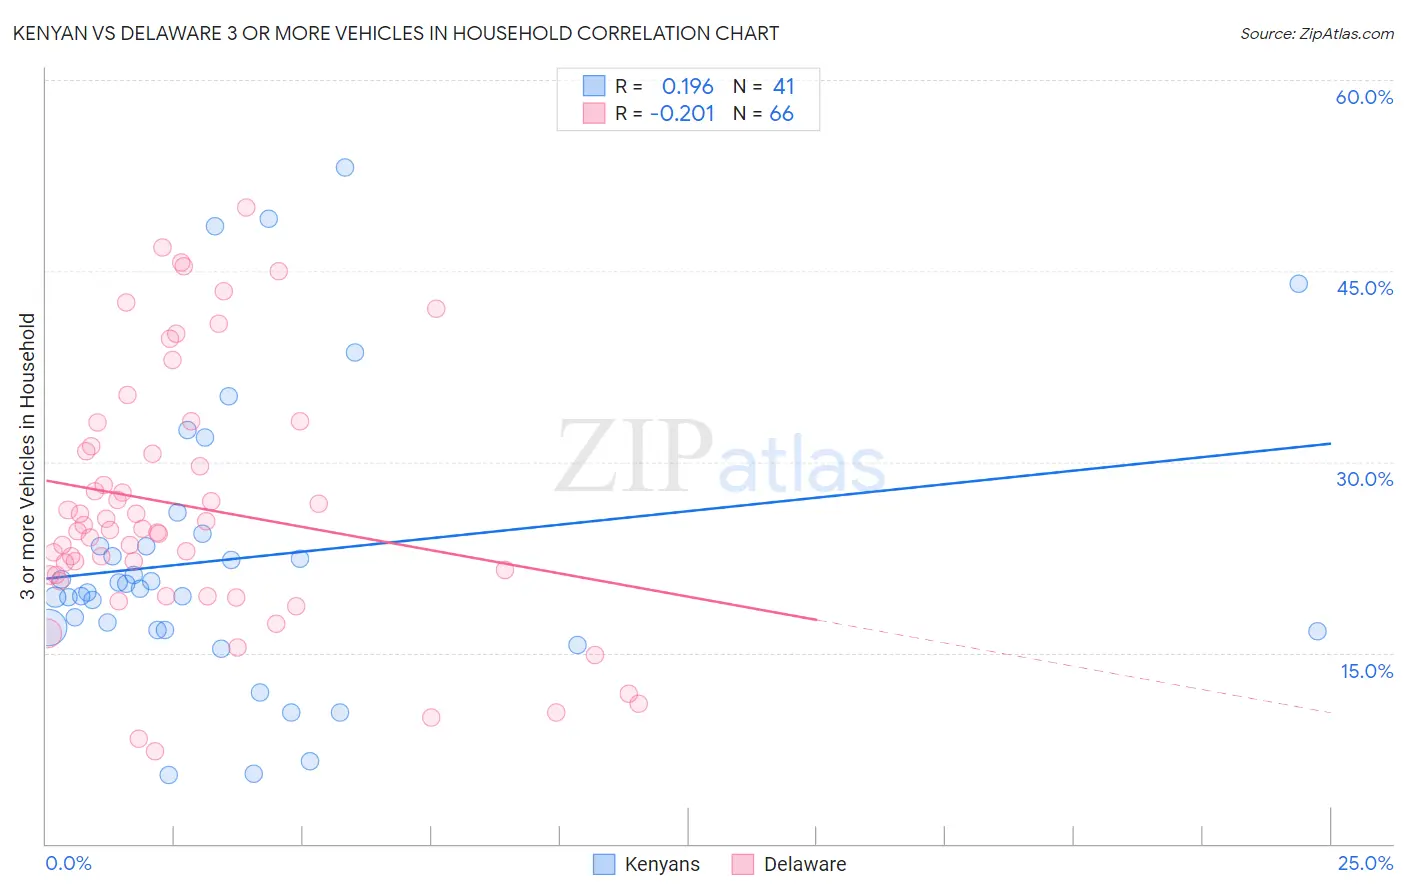
Kenyan vs Delaware 3 or more Vehicles in Household Correlation Chart
The statistical analysis conducted on geographies consisting of 168,140,381 people shows a poor positive correlation between the proportion of Kenyans and percentage of households with 3 or more vehicles available in the United States with a correlation coefficient (R) of 0.196 and weighted average of 19.1%. Similarly, the statistical analysis conducted on geographies consisting of 96,224,171 people shows a weak negative correlation between the proportion of Delaware and percentage of households with 3 or more vehicles available in the United States with a correlation coefficient (R) of -0.201 and weighted average of 21.5%, a difference of 12.6%.
3 or more Vehicles in Household Correlation Summary
| Measurement | Kenyan | Delaware |
| Minimum | 5.4% | 7.2% |
| Maximum | 53.1% | 50.0% |
| Range | 47.7% | 42.8% |
| Mean | 22.5% | 26.5% |
| Median | 20.1% | 24.7% |
| Interquartile 25% (IQ1) | 16.8% | 21.1% |
| Interquartile 75% (IQ3) | 23.9% | 31.3% |
| Interquartile Range (IQR) | 7.1% | 10.1% |
| Standard Deviation (Sample) | 11.2% | 10.0% |
| Standard Deviation (Population) | 11.1% | 9.9% |
Similar Demographics by 3 or more Vehicles in Household
Demographics Similar to Kenyans by 3 or more Vehicles in Household
In terms of 3 or more vehicles in household, the demographic groups most similar to Kenyans are Tsimshian (19.1%, a difference of 0.030%), South American Indian (19.1%, a difference of 0.060%), Immigrants from Zimbabwe (19.1%, a difference of 0.080%), Serbian (19.1%, a difference of 0.080%), and Immigrants from Moldova (19.1%, a difference of 0.11%).
| Demographics | Rating | Rank | 3 or more Vehicles in Household |
| Immigrants | Sri Lanka | 30.7 /100 | #185 | Fair 19.2% |
| Immigrants | Sweden | 29.0 /100 | #186 | Fair 19.2% |
| Immigrants | Hong Kong | 28.3 /100 | #187 | Fair 19.2% |
| Immigrants | Kuwait | 26.1 /100 | #188 | Fair 19.1% |
| Indians (Asian) | 26.0 /100 | #189 | Fair 19.1% |
| Immigrants | Zimbabwe | 25.5 /100 | #190 | Fair 19.1% |
| South American Indians | 25.4 /100 | #191 | Fair 19.1% |
| Kenyans | 24.7 /100 | #192 | Fair 19.1% |
| Tsimshian | 24.4 /100 | #193 | Fair 19.1% |
| Serbians | 24.0 /100 | #194 | Fair 19.1% |
| Immigrants | Moldova | 23.6 /100 | #195 | Fair 19.1% |
| Central American Indians | 22.2 /100 | #196 | Fair 19.0% |
| Immigrants | Japan | 22.0 /100 | #197 | Fair 19.0% |
| Egyptians | 19.5 /100 | #198 | Poor 19.0% |
| Immigrants | Norway | 19.0 /100 | #199 | Poor 19.0% |
Demographics Similar to Delaware by 3 or more Vehicles in Household
In terms of 3 or more vehicles in household, the demographic groups most similar to Delaware are Laotian (21.5%, a difference of 0.080%), Icelander (21.5%, a difference of 0.090%), Immigrants from the Azores (21.5%, a difference of 0.12%), Chippewa (21.5%, a difference of 0.14%), and Immigrants from El Salvador (21.5%, a difference of 0.17%).
| Demographics | Rating | Rank | 3 or more Vehicles in Household |
| Assyrians/Chaldeans/Syriacs | 99.8 /100 | #79 | Exceptional 21.7% |
| Afghans | 99.7 /100 | #80 | Exceptional 21.7% |
| Celtics | 99.7 /100 | #81 | Exceptional 21.7% |
| Immigrants | El Salvador | 99.6 /100 | #82 | Exceptional 21.5% |
| Chippewa | 99.6 /100 | #83 | Exceptional 21.5% |
| Icelanders | 99.6 /100 | #84 | Exceptional 21.5% |
| Laotians | 99.6 /100 | #85 | Exceptional 21.5% |
| Delaware | 99.6 /100 | #86 | Exceptional 21.5% |
| Immigrants | Azores | 99.5 /100 | #87 | Exceptional 21.5% |
| French | 99.4 /100 | #88 | Exceptional 21.4% |
| Marshallese | 99.2 /100 | #89 | Exceptional 21.3% |
| Immigrants | Afghanistan | 99.1 /100 | #90 | Exceptional 21.2% |
| Belgians | 98.9 /100 | #91 | Exceptional 21.2% |
| Apache | 98.9 /100 | #92 | Exceptional 21.2% |
| Immigrants | Indonesia | 98.8 /100 | #93 | Exceptional 21.1% |