Kenyan 2 or more Vehicles in Household
COMPARE
Kenyan
Select to Compare
2 or more Vehicles in Household
Kenyan 2 or more Vehicles in Household
55.5%
2+ VEHICLES AVAILABLE
58.1/ 100
METRIC RATING
167th/ 347
METRIC RANK
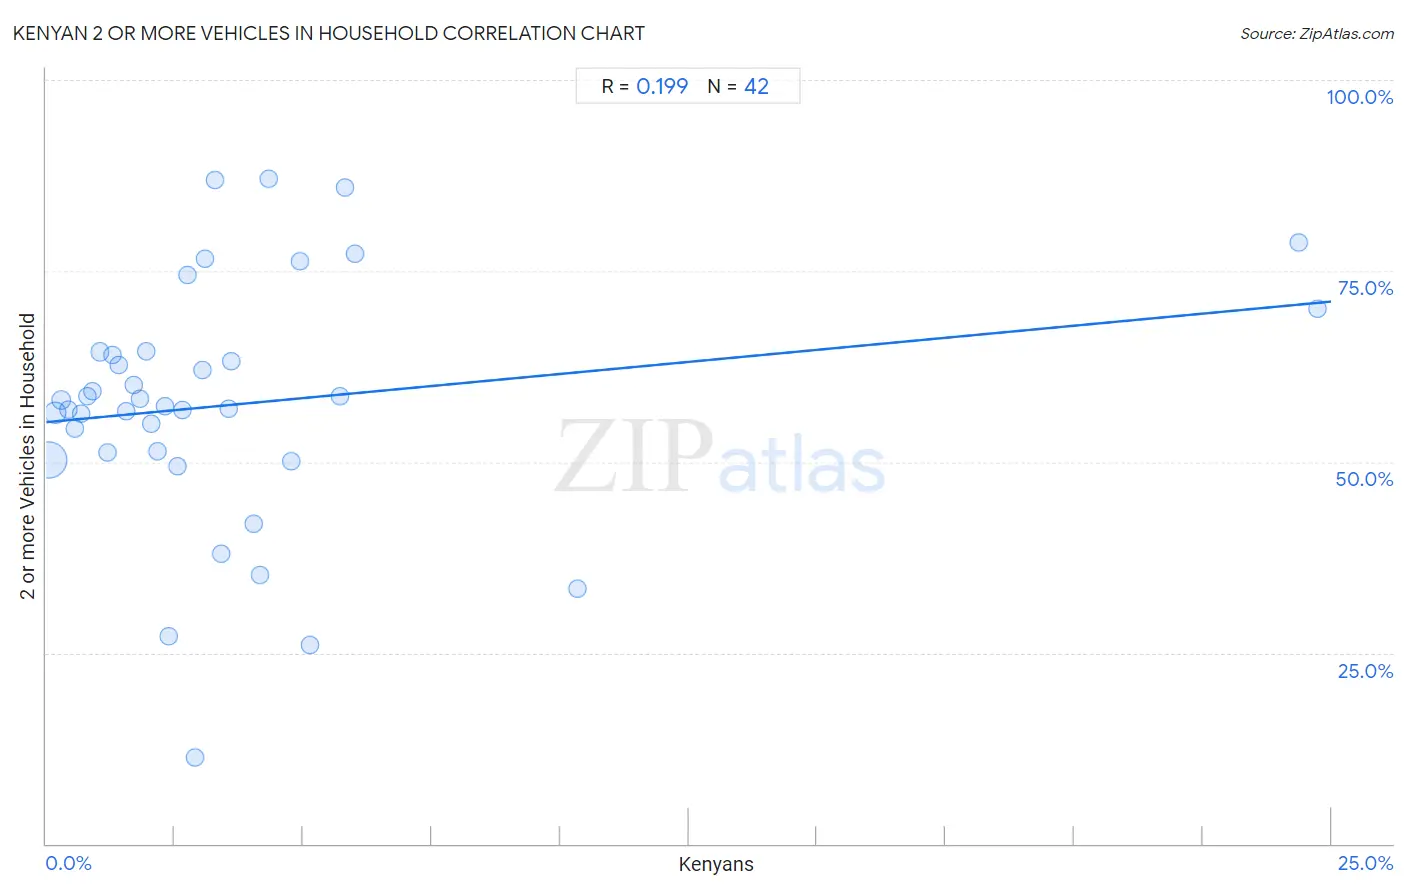
Kenyan 2 or more Vehicles in Household Correlation Chart
The statistical analysis conducted on geographies consisting of 168,179,955 people shows a poor positive correlation between the proportion of Kenyans and percentage of households with 2 or more vehicles available in the United States with a correlation coefficient (R) of 0.199 and weighted average of 55.5%. On average, for every 1% (one percent) increase in Kenyans within a typical geography, there is an increase of 0.63% in percentage of households with 2 or more vehicles available.
It is essential to understand that the correlation between the percentage of Kenyans and percentage of households with 2 or more vehicles available does not imply a direct cause-and-effect relationship. It remains uncertain whether the presence of Kenyans influences an upward or downward trend in the level of percentage of households with 2 or more vehicles available within an area, or if Kenyans simply ended up residing in those areas with higher or lower levels of percentage of households with 2 or more vehicles available due to other factors.
Demographics Similar to Kenyans by 2 or more Vehicles in Household
In terms of 2 or more vehicles in household, the demographic groups most similar to Kenyans are Immigrants from Sri Lanka (55.5%, a difference of 0.010%), Immigrants from El Salvador (55.6%, a difference of 0.050%), French American Indian (55.5%, a difference of 0.060%), Dutch West Indian (55.6%, a difference of 0.070%), and Immigrants from Austria (55.5%, a difference of 0.070%).
| Demographics | Rating | Rank | 2 or more Vehicles in Household |
| Crow | 67.0 /100 | #160 | Good 55.7% |
| Colville | 61.1 /100 | #161 | Good 55.6% |
| German Russians | 60.9 /100 | #162 | Good 55.6% |
| Immigrants from Zimbabwe | 60.2 /100 | #163 | Good 55.6% |
| Dutch West Indians | 59.8 /100 | #164 | Average 55.6% |
| Immigrants from El Salvador | 59.4 /100 | #165 | Average 55.6% |
| Immigrants from Sri Lanka | 58.3 /100 | #166 | Average 55.5% |
| Kenyans | 58.1 /100 | #167 | Average 55.5% |
| French American Indians | 56.7 /100 | #168 | Average 55.5% |
| Immigrants from Austria | 56.3 /100 | #169 | Average 55.5% |
| Romanians | 55.8 /100 | #170 | Average 55.5% |
| Immigrants from Costa Rica | 54.4 /100 | #171 | Average 55.4% |
| Immigrants from Nicaragua | 51.6 /100 | #172 | Average 55.4% |
| Immigrants from Western Europe | 51.4 /100 | #173 | Average 55.4% |
| Navajo | 50.0 /100 | #174 | Average 55.3% |
Kenyan 2 or more Vehicles in Household Correlation Summary
| Measurement | Kenyan Data | 2 or more Vehicles in Household Data |
| Minimum | 0.039% | 11.3% |
| Maximum | 24.7% | 87.1% |
| Range | 24.7% | 75.8% |
| Mean | 3.8% | 57.6% |
| Median | 2.6% | 57.7% |
| Interquartile 25% (IQ1) | 1.3% | 51.2% |
| Interquartile 75% (IQ3) | 4.2% | 64.4% |
| Interquartile Range (IQR) | 2.9% | 13.2% |
| Standard Deviation (Sample) | 5.1% | 16.2% |
| Standard Deviation (Population) | 5.0% | 16.0% |
Correlation Details
| Kenyan Percentile | Sample Size | 2 or more Vehicles in Household |
[ 0.0% - 0.5% ] 0.039% | 126,516,967 | 50.3% |
[ 0.0% - 0.5% ] 0.17% | 21,805,144 | 56.5% |
[ 0.0% - 0.5% ] 0.30% | 8,420,263 | 58.2% |
[ 0.0% - 0.5% ] 0.43% | 4,720,606 | 56.8% |
[ 0.5% - 1.0% ] 0.55% | 2,139,651 | 54.4% |
[ 0.5% - 1.0% ] 0.67% | 1,166,959 | 56.3% |
[ 0.5% - 1.0% ] 0.80% | 964,807 | 58.5% |
[ 0.5% - 1.0% ] 0.90% | 443,919 | 59.3% |
[ 1.0% - 1.5% ] 1.05% | 433,161 | 64.4% |
[ 1.0% - 1.5% ] 1.19% | 327,740 | 51.2% |
[ 1.0% - 1.5% ] 1.30% | 231,594 | 64.0% |
[ 1.0% - 1.5% ] 1.41% | 210,333 | 62.6% |
[ 1.5% - 2.0% ] 1.56% | 192,252 | 56.6% |
[ 1.5% - 2.0% ] 1.69% | 100,838 | 60.1% |
[ 1.5% - 2.0% ] 1.82% | 30,100 | 58.3% |
[ 1.5% - 2.0% ] 1.95% | 131,069 | 64.6% |
[ 2.0% - 2.5% ] 2.05% | 69,612 | 54.9% |
[ 2.0% - 2.5% ] 2.17% | 85,059 | 51.4% |
[ 2.0% - 2.5% ] 2.31% | 63,729 | 57.3% |
[ 2.0% - 2.5% ] 2.38% | 6,863 | 27.1% |
[ 2.5% - 3.0% ] 2.56% | 586 | 49.4% |
[ 2.5% - 3.0% ] 2.65% | 32,186 | 56.8% |
[ 2.5% - 3.0% ] 2.75% | 8,230 | 74.5% |
[ 2.5% - 3.0% ] 2.90% | 3,966 | 11.3% |
[ 3.0% - 3.5% ] 3.03% | 14,756 | 62.1% |
[ 3.0% - 3.5% ] 3.10% | 8,389 | 76.6% |
[ 3.0% - 3.5% ] 3.29% | 2,034 | 87.0% |
[ 3.0% - 3.5% ] 3.40% | 2,764 | 38.0% |
[ 3.5% - 4.0% ] 3.56% | 2,473 | 57.0% |
[ 3.5% - 4.0% ] 3.59% | 3,785 | 63.2% |
[ 4.0% - 4.5% ] 4.03% | 4,144 | 41.9% |
[ 4.0% - 4.5% ] 4.15% | 9,822 | 35.1% |
[ 4.0% - 4.5% ] 4.32% | 2,474 | 87.1% |
[ 4.5% - 5.0% ] 4.77% | 9,332 | 50.1% |
[ 4.5% - 5.0% ] 4.94% | 324 | 76.3% |
[ 5.0% - 5.5% ] 5.13% | 4,995 | 26.0% |
[ 5.5% - 6.0% ] 5.71% | 4,728 | 58.5% |
[ 5.5% - 6.0% ] 5.82% | 3,214 | 85.9% |
[ 6.0% - 6.5% ] 6.01% | 183 | 77.3% |
[ 10.0% - 10.5% ] 10.33% | 368 | 33.3% |
[ 24.0% - 24.5% ] 24.37% | 439 | 78.8% |
[ 24.5% - 25.0% ] 24.74% | 97 | 70.0% |