Kenyan vs Immigrants from Guatemala 3 or more Vehicles in Household
COMPARE
Kenyan
Immigrants from Guatemala
3 or more Vehicles in Household
3 or more Vehicles in Household Comparison
Kenyans
Immigrants from Guatemala
19.1%
3 OR MORE VEHICLES IN HOUSEHOLD
24.7/ 100
METRIC RATING
192nd/ 347
METRIC RANK
19.7%
3 OR MORE VEHICLES IN HOUSEHOLD
65.6/ 100
METRIC RATING
161st/ 347
METRIC RANK
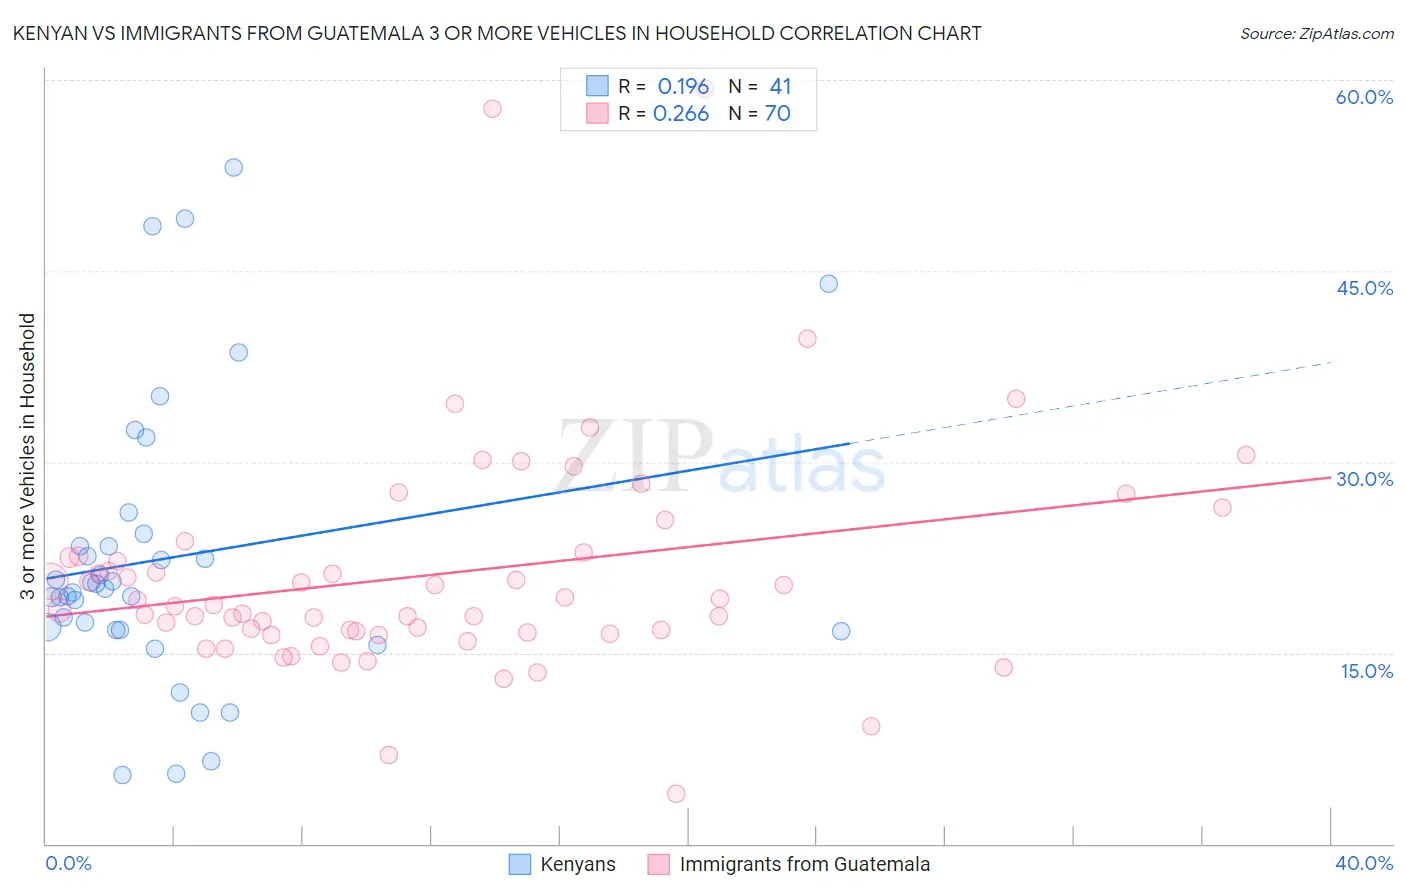
Kenyan vs Immigrants from Guatemala 3 or more Vehicles in Household Correlation Chart
The statistical analysis conducted on geographies consisting of 168,140,381 people shows a poor positive correlation between the proportion of Kenyans and percentage of households with 3 or more vehicles available in the United States with a correlation coefficient (R) of 0.196 and weighted average of 19.1%. Similarly, the statistical analysis conducted on geographies consisting of 377,138,976 people shows a weak positive correlation between the proportion of Immigrants from Guatemala and percentage of households with 3 or more vehicles available in the United States with a correlation coefficient (R) of 0.266 and weighted average of 19.7%, a difference of 3.4%.
3 or more Vehicles in Household Correlation Summary
| Measurement | Kenyan | Immigrants from Guatemala |
| Minimum | 5.4% | 3.9% |
| Maximum | 53.1% | 59.3% |
| Range | 47.7% | 55.5% |
| Mean | 22.5% | 21.1% |
| Median | 20.1% | 18.7% |
| Interquartile 25% (IQ1) | 16.8% | 16.6% |
| Interquartile 75% (IQ3) | 23.9% | 22.6% |
| Interquartile Range (IQR) | 7.1% | 6.0% |
| Standard Deviation (Sample) | 11.2% | 9.0% |
| Standard Deviation (Population) | 11.1% | 9.0% |
Similar Demographics by 3 or more Vehicles in Household
Demographics Similar to Kenyans by 3 or more Vehicles in Household
In terms of 3 or more vehicles in household, the demographic groups most similar to Kenyans are Tsimshian (19.1%, a difference of 0.030%), South American Indian (19.1%, a difference of 0.060%), Immigrants from Zimbabwe (19.1%, a difference of 0.080%), Serbian (19.1%, a difference of 0.080%), and Immigrants from Moldova (19.1%, a difference of 0.11%).
| Demographics | Rating | Rank | 3 or more Vehicles in Household |
| Immigrants | Sri Lanka | 30.7 /100 | #185 | Fair 19.2% |
| Immigrants | Sweden | 29.0 /100 | #186 | Fair 19.2% |
| Immigrants | Hong Kong | 28.3 /100 | #187 | Fair 19.2% |
| Immigrants | Kuwait | 26.1 /100 | #188 | Fair 19.1% |
| Indians (Asian) | 26.0 /100 | #189 | Fair 19.1% |
| Immigrants | Zimbabwe | 25.5 /100 | #190 | Fair 19.1% |
| South American Indians | 25.4 /100 | #191 | Fair 19.1% |
| Kenyans | 24.7 /100 | #192 | Fair 19.1% |
| Tsimshian | 24.4 /100 | #193 | Fair 19.1% |
| Serbians | 24.0 /100 | #194 | Fair 19.1% |
| Immigrants | Moldova | 23.6 /100 | #195 | Fair 19.1% |
| Central American Indians | 22.2 /100 | #196 | Fair 19.0% |
| Immigrants | Japan | 22.0 /100 | #197 | Fair 19.0% |
| Egyptians | 19.5 /100 | #198 | Poor 19.0% |
| Immigrants | Norway | 19.0 /100 | #199 | Poor 19.0% |
Demographics Similar to Immigrants from Guatemala by 3 or more Vehicles in Household
In terms of 3 or more vehicles in household, the demographic groups most similar to Immigrants from Guatemala are Immigrants from Lebanon (19.8%, a difference of 0.16%), Estonian (19.7%, a difference of 0.19%), Chilean (19.7%, a difference of 0.21%), Immigrants from Pakistan (19.8%, a difference of 0.22%), and Yugoslavian (19.7%, a difference of 0.22%).
| Demographics | Rating | Rank | 3 or more Vehicles in Household |
| Immigrants | Jordan | 75.0 /100 | #154 | Good 19.9% |
| Tlingit-Haida | 73.4 /100 | #155 | Good 19.9% |
| Thais | 71.1 /100 | #156 | Good 19.8% |
| Hungarians | 70.5 /100 | #157 | Good 19.8% |
| Armenians | 68.8 /100 | #158 | Good 19.8% |
| Immigrants | Pakistan | 68.2 /100 | #159 | Good 19.8% |
| Immigrants | Lebanon | 67.6 /100 | #160 | Good 19.8% |
| Immigrants | Guatemala | 65.6 /100 | #161 | Good 19.7% |
| Estonians | 63.2 /100 | #162 | Good 19.7% |
| Chileans | 63.0 /100 | #163 | Good 19.7% |
| Yugoslavians | 62.9 /100 | #164 | Good 19.7% |
| Immigrants | Costa Rica | 61.9 /100 | #165 | Good 19.7% |
| Immigrants | Cameroon | 60.9 /100 | #166 | Good 19.7% |
| Ukrainians | 58.9 /100 | #167 | Average 19.6% |
| Peruvians | 58.8 /100 | #168 | Average 19.6% |