Immigrants from Uganda vs Immigrants from Armenia 3 or more Vehicles in Household
COMPARE
Immigrants from Uganda
Immigrants from Armenia
3 or more Vehicles in Household
3 or more Vehicles in Household Comparison
Immigrants from Uganda
Immigrants from Armenia
18.4%
3 OR MORE VEHICLES IN HOUSEHOLD
4.6/ 100
METRIC RATING
232nd/ 347
METRIC RANK
18.6%
3 OR MORE VEHICLES IN HOUSEHOLD
8.6/ 100
METRIC RATING
219th/ 347
METRIC RANK
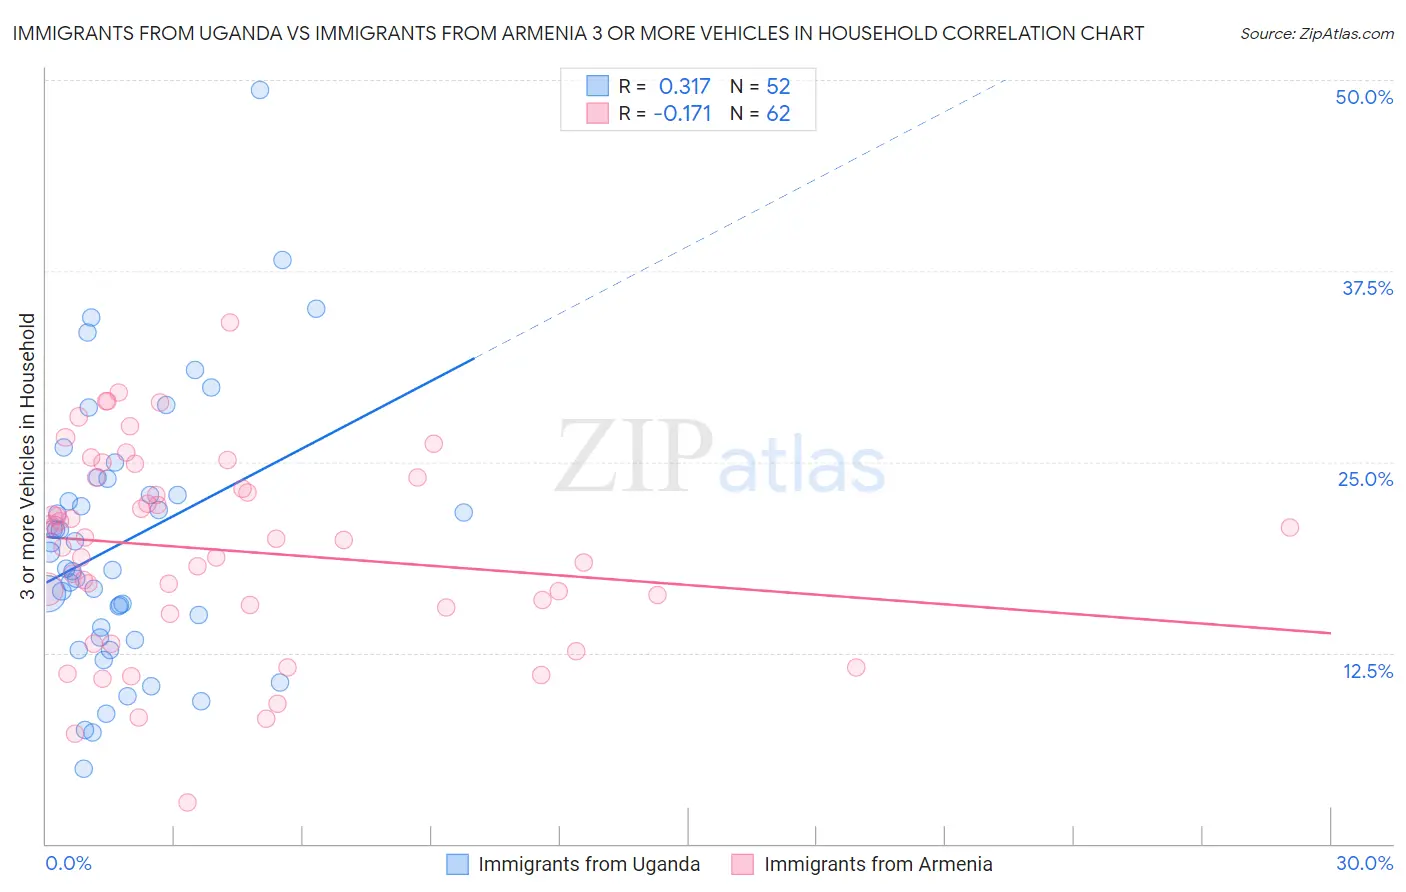
Immigrants from Uganda vs Immigrants from Armenia 3 or more Vehicles in Household Correlation Chart
The statistical analysis conducted on geographies consisting of 125,972,253 people shows a mild positive correlation between the proportion of Immigrants from Uganda and percentage of households with 3 or more vehicles available in the United States with a correlation coefficient (R) of 0.317 and weighted average of 18.4%. Similarly, the statistical analysis conducted on geographies consisting of 97,705,679 people shows a poor negative correlation between the proportion of Immigrants from Armenia and percentage of households with 3 or more vehicles available in the United States with a correlation coefficient (R) of -0.171 and weighted average of 18.6%, a difference of 1.3%.
3 or more Vehicles in Household Correlation Summary
| Measurement | Immigrants from Uganda | Immigrants from Armenia |
| Minimum | 4.9% | 2.7% |
| Maximum | 49.4% | 34.1% |
| Range | 44.5% | 31.5% |
| Mean | 19.8% | 19.2% |
| Median | 18.5% | 19.9% |
| Interquartile 25% (IQ1) | 13.8% | 15.5% |
| Interquartile 75% (IQ3) | 23.3% | 23.9% |
| Interquartile Range (IQR) | 9.5% | 8.5% |
| Standard Deviation (Sample) | 8.7% | 6.5% |
| Standard Deviation (Population) | 8.6% | 6.4% |
Demographics Similar to Immigrants from Uganda and Immigrants from Armenia by 3 or more Vehicles in Household
In terms of 3 or more vehicles in household, the demographic groups most similar to Immigrants from Uganda are Honduran (18.4%, a difference of 0.020%), Immigrants from Belgium (18.4%, a difference of 0.060%), Immigrants from North Macedonia (18.4%, a difference of 0.080%), Immigrants from Western Asia (18.4%, a difference of 0.090%), and Immigrants from Switzerland (18.4%, a difference of 0.14%). Similarly, the demographic groups most similar to Immigrants from Armenia are Immigrants from Portugal (18.6%, a difference of 0.080%), Nigerian (18.6%, a difference of 0.20%), Immigrants from Poland (18.6%, a difference of 0.29%), Belizean (18.6%, a difference of 0.34%), and Immigrants from Italy (18.7%, a difference of 0.38%).
| Demographics | Rating | Rank | 3 or more Vehicles in Household |
| Eastern Europeans | 10.6 /100 | #215 | Poor 18.7% |
| Immigrants | Nigeria | 10.3 /100 | #216 | Poor 18.7% |
| Immigrants | Italy | 10.2 /100 | #217 | Poor 18.7% |
| Immigrants | Portugal | 8.9 /100 | #218 | Tragic 18.6% |
| Immigrants | Armenia | 8.6 /100 | #219 | Tragic 18.6% |
| Nigerians | 7.9 /100 | #220 | Tragic 18.6% |
| Immigrants | Poland | 7.5 /100 | #221 | Tragic 18.6% |
| Belizeans | 7.3 /100 | #222 | Tragic 18.6% |
| Immigrants | Czechoslovakia | 5.9 /100 | #223 | Tragic 18.5% |
| Immigrants | Argentina | 5.6 /100 | #224 | Tragic 18.5% |
| Immigrants | Lithuania | 5.6 /100 | #225 | Tragic 18.5% |
| Immigrants | Hungary | 5.5 /100 | #226 | Tragic 18.5% |
| Immigrants | Singapore | 5.4 /100 | #227 | Tragic 18.4% |
| Turks | 5.4 /100 | #228 | Tragic 18.4% |
| Immigrants | Switzerland | 5.0 /100 | #229 | Tragic 18.4% |
| Immigrants | Western Asia | 4.8 /100 | #230 | Tragic 18.4% |
| Immigrants | Belgium | 4.8 /100 | #231 | Tragic 18.4% |
| Immigrants | Uganda | 4.6 /100 | #232 | Tragic 18.4% |
| Hondurans | 4.6 /100 | #233 | Tragic 18.4% |
| Immigrants | North Macedonia | 4.4 /100 | #234 | Tragic 18.4% |
| Sierra Leoneans | 3.9 /100 | #235 | Tragic 18.3% |