Immigrants from Uganda vs Mexican American Indian 3 or more Vehicles in Household
COMPARE
Immigrants from Uganda
Mexican American Indian
3 or more Vehicles in Household
3 or more Vehicles in Household Comparison
Immigrants from Uganda
Mexican American Indians
18.4%
3 OR MORE VEHICLES IN HOUSEHOLD
4.6/ 100
METRIC RATING
232nd/ 347
METRIC RANK
23.3%
3 OR MORE VEHICLES IN HOUSEHOLD
100.0/ 100
METRIC RATING
26th/ 347
METRIC RANK
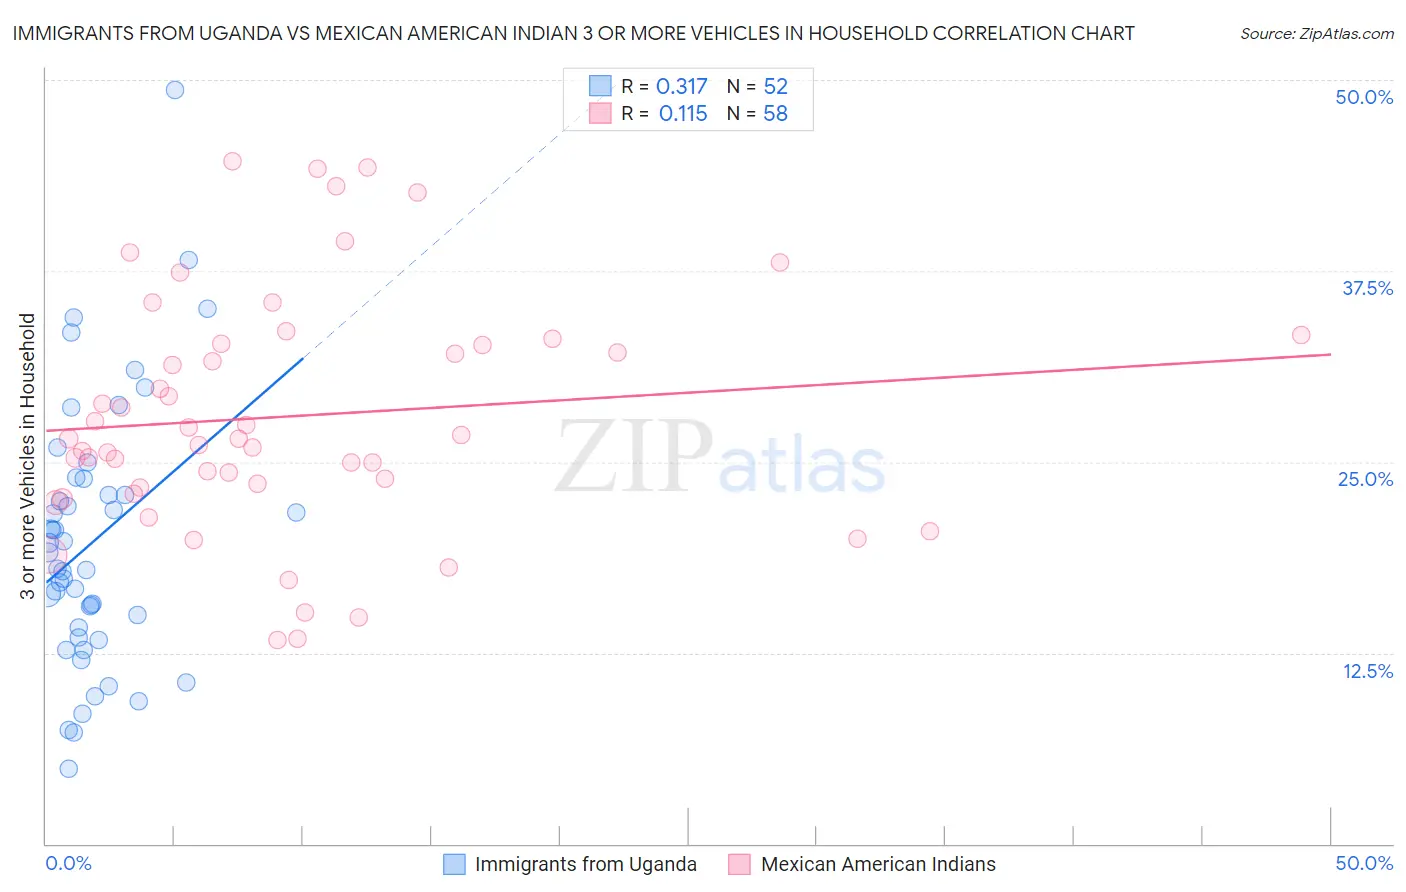
Immigrants from Uganda vs Mexican American Indian 3 or more Vehicles in Household Correlation Chart
The statistical analysis conducted on geographies consisting of 125,972,253 people shows a mild positive correlation between the proportion of Immigrants from Uganda and percentage of households with 3 or more vehicles available in the United States with a correlation coefficient (R) of 0.317 and weighted average of 18.4%. Similarly, the statistical analysis conducted on geographies consisting of 317,474,201 people shows a poor positive correlation between the proportion of Mexican American Indians and percentage of households with 3 or more vehicles available in the United States with a correlation coefficient (R) of 0.115 and weighted average of 23.3%, a difference of 26.5%.
3 or more Vehicles in Household Correlation Summary
| Measurement | Immigrants from Uganda | Mexican American Indian |
| Minimum | 4.9% | 13.3% |
| Maximum | 49.4% | 44.7% |
| Range | 44.5% | 31.4% |
| Mean | 19.8% | 28.0% |
| Median | 18.5% | 26.5% |
| Interquartile 25% (IQ1) | 13.8% | 23.3% |
| Interquartile 75% (IQ3) | 23.3% | 32.7% |
| Interquartile Range (IQR) | 9.5% | 9.4% |
| Standard Deviation (Sample) | 8.7% | 7.9% |
| Standard Deviation (Population) | 8.6% | 7.8% |
Similar Demographics by 3 or more Vehicles in Household
Demographics Similar to Immigrants from Uganda by 3 or more Vehicles in Household
In terms of 3 or more vehicles in household, the demographic groups most similar to Immigrants from Uganda are Honduran (18.4%, a difference of 0.020%), Immigrants from Belgium (18.4%, a difference of 0.060%), Immigrants from North Macedonia (18.4%, a difference of 0.080%), Immigrants from Western Asia (18.4%, a difference of 0.090%), and Immigrants from Switzerland (18.4%, a difference of 0.14%).
| Demographics | Rating | Rank | 3 or more Vehicles in Household |
| Immigrants | Lithuania | 5.6 /100 | #225 | Tragic 18.5% |
| Immigrants | Hungary | 5.5 /100 | #226 | Tragic 18.5% |
| Immigrants | Singapore | 5.4 /100 | #227 | Tragic 18.4% |
| Turks | 5.4 /100 | #228 | Tragic 18.4% |
| Immigrants | Switzerland | 5.0 /100 | #229 | Tragic 18.4% |
| Immigrants | Western Asia | 4.8 /100 | #230 | Tragic 18.4% |
| Immigrants | Belgium | 4.8 /100 | #231 | Tragic 18.4% |
| Immigrants | Uganda | 4.6 /100 | #232 | Tragic 18.4% |
| Hondurans | 4.6 /100 | #233 | Tragic 18.4% |
| Immigrants | North Macedonia | 4.4 /100 | #234 | Tragic 18.4% |
| Sierra Leoneans | 3.9 /100 | #235 | Tragic 18.3% |
| Immigrants | Malaysia | 3.6 /100 | #236 | Tragic 18.3% |
| Indonesians | 3.5 /100 | #237 | Tragic 18.3% |
| Immigrants | Honduras | 3.1 /100 | #238 | Tragic 18.2% |
| Immigrants | Middle Africa | 3.1 /100 | #239 | Tragic 18.2% |
Demographics Similar to Mexican American Indians by 3 or more Vehicles in Household
In terms of 3 or more vehicles in household, the demographic groups most similar to Mexican American Indians are Guamanian/Chamorro (23.2%, a difference of 0.13%), Lumbee (23.1%, a difference of 0.47%), Spanish (23.1%, a difference of 0.54%), Immigrants from South Eastern Asia (23.1%, a difference of 0.71%), and Immigrants from Central America (23.4%, a difference of 0.77%).
| Demographics | Rating | Rank | 3 or more Vehicles in Household |
| Chinese | 100.0 /100 | #19 | Exceptional 23.9% |
| Paiute | 100.0 /100 | #20 | Exceptional 23.8% |
| Immigrants | Vietnam | 100.0 /100 | #21 | Exceptional 23.8% |
| Immigrants | Philippines | 100.0 /100 | #22 | Exceptional 23.8% |
| Scandinavians | 100.0 /100 | #23 | Exceptional 23.6% |
| Sri Lankans | 100.0 /100 | #24 | Exceptional 23.6% |
| Immigrants | Central America | 100.0 /100 | #25 | Exceptional 23.4% |
| Mexican American Indians | 100.0 /100 | #26 | Exceptional 23.3% |
| Guamanians/Chamorros | 100.0 /100 | #27 | Exceptional 23.2% |
| Lumbee | 100.0 /100 | #28 | Exceptional 23.1% |
| Spanish | 100.0 /100 | #29 | Exceptional 23.1% |
| Immigrants | South Eastern Asia | 100.0 /100 | #30 | Exceptional 23.1% |
| English | 100.0 /100 | #31 | Exceptional 23.1% |
| Pueblo | 100.0 /100 | #32 | Exceptional 23.0% |
| Spanish Americans | 100.0 /100 | #33 | Exceptional 23.0% |