Immigrants from Uganda vs U.S. Virgin Islander 3 or more Vehicles in Household
COMPARE
Immigrants from Uganda
U.S. Virgin Islander
3 or more Vehicles in Household
3 or more Vehicles in Household Comparison
Immigrants from Uganda
U.S. Virgin Islanders
18.4%
3 OR MORE VEHICLES IN HOUSEHOLD
4.6/ 100
METRIC RATING
232nd/ 347
METRIC RANK
15.4%
3 OR MORE VEHICLES IN HOUSEHOLD
0.0/ 100
METRIC RATING
316th/ 347
METRIC RANK
Immigrants from Uganda vs U.S. Virgin Islander 3 or more Vehicles in Household Correlation Chart
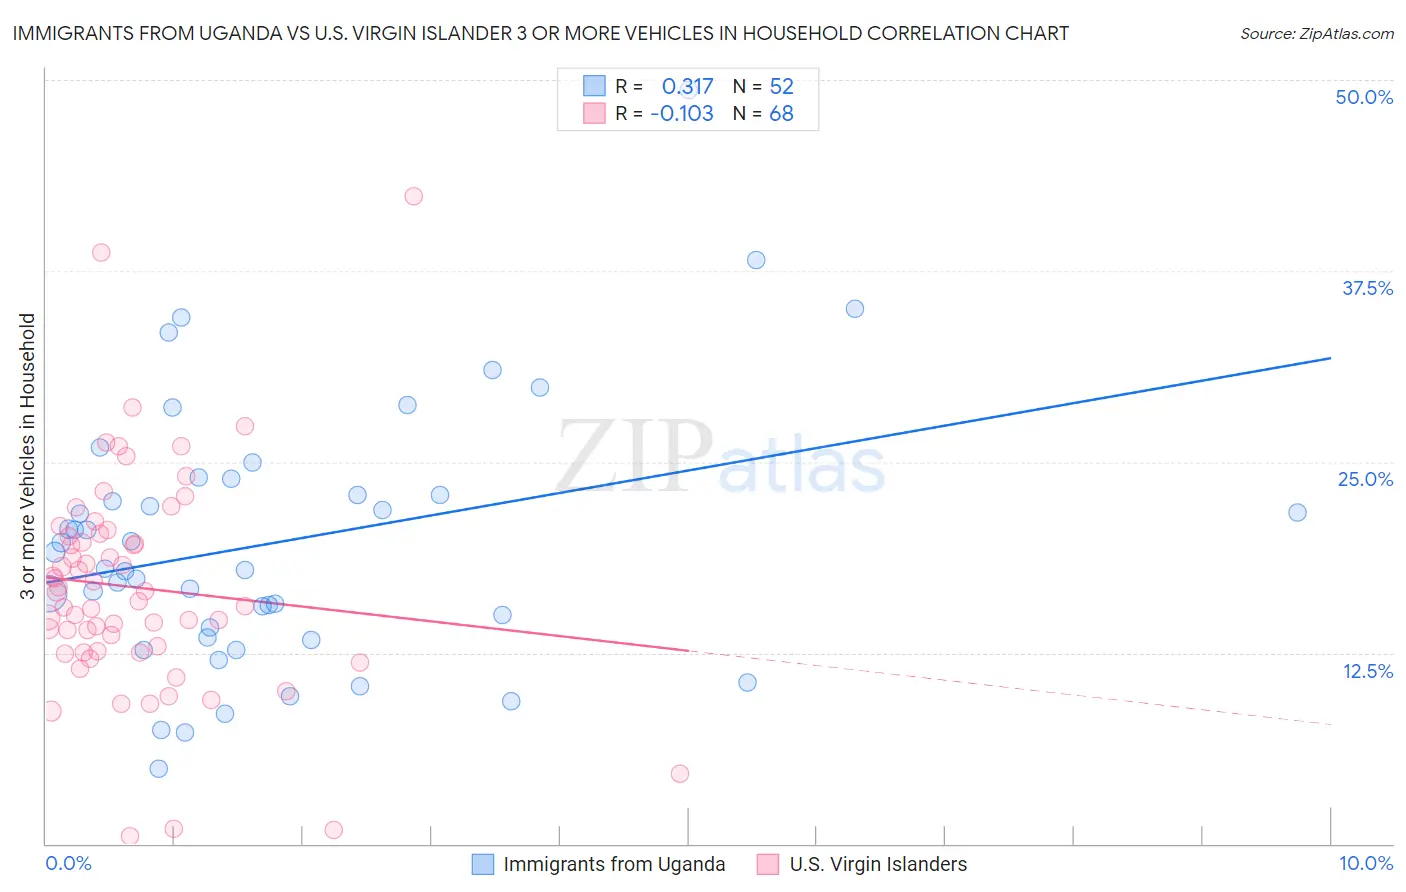
The statistical analysis conducted on geographies consisting of 125,972,253 people shows a mild positive correlation between the proportion of Immigrants from Uganda and percentage of households with 3 or more vehicles available in the United States with a correlation coefficient (R) of 0.317 and weighted average of 18.4%. Similarly, the statistical analysis conducted on geographies consisting of 87,505,701 people shows a poor negative correlation between the proportion of U.S. Virgin Islanders and percentage of households with 3 or more vehicles available in the United States with a correlation coefficient (R) of -0.103 and weighted average of 15.4%, a difference of 19.5%.
3 or more Vehicles in Household Correlation Summary
| Measurement | Immigrants from Uganda | U.S. Virgin Islander |
| Minimum | 4.9% | 0.49% |
| Maximum | 49.4% | 42.4% |
| Range | 44.5% | 41.9% |
| Mean | 19.8% | 16.8% |
| Median | 18.5% | 16.2% |
| Interquartile 25% (IQ1) | 13.8% | 12.6% |
| Interquartile 75% (IQ3) | 23.3% | 20.2% |
| Interquartile Range (IQR) | 9.5% | 7.6% |
| Standard Deviation (Sample) | 8.7% | 7.3% |
| Standard Deviation (Population) | 8.6% | 7.2% |
Similar Demographics by 3 or more Vehicles in Household
Demographics Similar to Immigrants from Uganda by 3 or more Vehicles in Household
In terms of 3 or more vehicles in household, the demographic groups most similar to Immigrants from Uganda are Honduran (18.4%, a difference of 0.020%), Immigrants from Belgium (18.4%, a difference of 0.060%), Immigrants from North Macedonia (18.4%, a difference of 0.080%), Immigrants from Western Asia (18.4%, a difference of 0.090%), and Immigrants from Switzerland (18.4%, a difference of 0.14%).
| Demographics | Rating | Rank | 3 or more Vehicles in Household |
| Immigrants | Lithuania | 5.6 /100 | #225 | Tragic 18.5% |
| Immigrants | Hungary | 5.5 /100 | #226 | Tragic 18.5% |
| Immigrants | Singapore | 5.4 /100 | #227 | Tragic 18.4% |
| Turks | 5.4 /100 | #228 | Tragic 18.4% |
| Immigrants | Switzerland | 5.0 /100 | #229 | Tragic 18.4% |
| Immigrants | Western Asia | 4.8 /100 | #230 | Tragic 18.4% |
| Immigrants | Belgium | 4.8 /100 | #231 | Tragic 18.4% |
| Immigrants | Uganda | 4.6 /100 | #232 | Tragic 18.4% |
| Hondurans | 4.6 /100 | #233 | Tragic 18.4% |
| Immigrants | North Macedonia | 4.4 /100 | #234 | Tragic 18.4% |
| Sierra Leoneans | 3.9 /100 | #235 | Tragic 18.3% |
| Immigrants | Malaysia | 3.6 /100 | #236 | Tragic 18.3% |
| Indonesians | 3.5 /100 | #237 | Tragic 18.3% |
| Immigrants | Honduras | 3.1 /100 | #238 | Tragic 18.2% |
| Immigrants | Middle Africa | 3.1 /100 | #239 | Tragic 18.2% |
Demographics Similar to U.S. Virgin Islanders by 3 or more Vehicles in Household
In terms of 3 or more vehicles in household, the demographic groups most similar to U.S. Virgin Islanders are Haitian (15.5%, a difference of 0.52%), Immigrants from Belarus (15.5%, a difference of 0.84%), Jamaican (15.2%, a difference of 1.2%), Immigrants from Haiti (15.2%, a difference of 1.4%), and Immigrants from Israel (15.6%, a difference of 1.5%).
| Demographics | Rating | Rank | 3 or more Vehicles in Household |
| Immigrants | Somalia | 0.0 /100 | #309 | Tragic 15.9% |
| Moroccans | 0.0 /100 | #310 | Tragic 15.9% |
| Albanians | 0.0 /100 | #311 | Tragic 15.8% |
| Puerto Ricans | 0.0 /100 | #312 | Tragic 15.6% |
| Immigrants | Israel | 0.0 /100 | #313 | Tragic 15.6% |
| Immigrants | Belarus | 0.0 /100 | #314 | Tragic 15.5% |
| Haitians | 0.0 /100 | #315 | Tragic 15.5% |
| U.S. Virgin Islanders | 0.0 /100 | #316 | Tragic 15.4% |
| Jamaicans | 0.0 /100 | #317 | Tragic 15.2% |
| Immigrants | Haiti | 0.0 /100 | #318 | Tragic 15.2% |
| Cape Verdeans | 0.0 /100 | #319 | Tragic 15.0% |
| Yup'ik | 0.0 /100 | #320 | Tragic 14.8% |
| Immigrants | Jamaica | 0.0 /100 | #321 | Tragic 14.7% |
| Immigrants | West Indies | 0.0 /100 | #322 | Tragic 14.6% |
| Immigrants | Caribbean | 0.0 /100 | #323 | Tragic 14.6% |